
Submitted:
01 July 2024
Posted:
02 July 2024
You are already at the latest version
Abstract
In Kenya, reports of Rift Valley fever (RVF), one of the worst climate-sensitive zoonosis, have been common. Despite the fact that several empirical studies have demonstrated that Machine learning techniques perform better than time series models in forecasting time series data, there is little evidence of their use in predicting disease outbreaks in Africa. Recently, the literature has mentioned a number of other uses of machine learning to support intelligent decision-making in the healthcare industry and public health but there is limited knowledge on the use of the XGBoost model in the prediction of disease outbreaks. Among the Kenyan provinces, Rift valley fever cases were more pronounced in Rift valley (26.80%) and Eastern (20.60%) regions. The study explored the relationship be-tween RVF incidence and various climatic factors, such as humidity, clay content, elevation, slope, and rainfall. The strongest correlation, a meager 0.02903 for rainfall, was found in the correlation matrix, which showed weak linear relationships between various climatic factors and RVF cases. These climate variables were used to train the XGBoost model, which showed remark-able performance with an AUC of 0.8908, accuracy of 99.74%, precision of 99.75%, and recall of 99.99%. Rainfall was found to be the most important predictor in the feature importance analysis. These findings are consistent with other research showing how important weather conditions are to RVF outbreaks. According to the study's findings, the use of sophisticated machine learning models that take a variety of climatic factors into account can greatly improve RVF outbreak prediction and control.
Keywords:
machine learning models
; XGBoost
; precision
; climatic factors
; AUC/ROC curves
1. Introduction
Rift Valley fever Virus (RVFV) is the cause of Rift Valley Fever (RVF) disease in farmed animals in all Sub-Saharan African countries and the Arabian Peninsula acc cording to [1]. RVF virus belongs to the genus Phlebovirus in the order Bunyavirales as documented in a study by [2]. The virus was first identified in 1931 during an investigation into an endemic among sheep on a farm in the Rift valley province of Kenya according to [3]. The disease is especially noticeable in East and Central Africa’s dry and semi-arid regions, where pastoral people predominate [4] and its outbreak results into great losses which leads to heavy economic losses and public health burdens among the communities.
In a study by [5], it was noted that humans also become infected after coming into contact with body fluids, or tissues, either directly or indirectly and the disease can cause a minor flu-like illness. [6] Found that RVF outbreaks have been reported outside Africa with the first occurrence in south western Saudi Arabia and Yemen making an emphasis that the disease has the potential to spread to the other parts of the world.
Several studies have shown that some factors which favor occurrence and re - emergence of RVF are the climatic factors including rainfall, humidity, temperature, soil and topography. A study by [7] found out that rainfall is one of the most significant climate predictor of RVF disease. The most severe and noticeable incidences of RVF outbreaks have always been accompanied by above normal rainfall which results to flooding, [8]. Since 2015, the disease has been listed as one priority emerging infectious diseases by the World Health Organization (WHO) with one of the major concerns being its increasing geographical expansion over the decades, [9].
A greater understanding of employing algorithms to either predict the outbreak or the increased risk of various diseases has emerged as a result of advancements in machine learning technology and artificial intelligence [10]. Most works on rift valley fever have focused on the epidemiology and the spatial temporal analysis of the disease with little consideration on climatic conditions and historical outbreaks. The outbreak of RVF can be correlated with conditions like rainfall, slope, humidity conditions of an area and time. In attempts to restrict the outbreak of RVF and to solve the problem of RVF outbreaks in Kenya, we explore the climatic characteristics.
This study has used climatic characteristics (rainfall, elevation, slope, clay content, and humidity) to forecast RVF outbreaks in Kenya. There is enough evidence that these climate factors affect the population dynamics and habitat which favor the RVF mosquito vectors. Rainfall is an essential part of the life cycle of the mosquito vectors that spread RVF. The principal vectors of RVF virus, Aedes mosquitoes, thrive in low-lying regions that flood because of heavy rainfall [11]. Elevation influences the microclimate of a region, affecting temperature, humidity, and vegetation cover, which in turn impact mosquito distribution and activity [12].
Higher elevations generally have cooler temperatures and different vegetation types compared to lowland areas. Mosquito species vary in their altitude preferences and survival rates. Aedes mosquitoes, for example, might be less prevalent at higher elevations due to cooler temperatures, which can limit their breeding and activity [13]. Conversely, certain Culex species may thrive in these cooler, more vegetated areas. Understanding elevation helps in predicting which areas are more susceptible to outbreaks based on the habitat preferences of the mosquito vectors [14].
Based on a prospective prediction of RVF by [8], most studies of RVF have been descriptive majorly using a combination of satellite measurements and the derived normalized difference vegetation index (NVDI) data lacking statistical validation and prediction, hence there is need for advanced tools which include climate data to generate classification and prediction models.
2. Materials and Methods
The study focuses on predicting Rift Valley fever (RVF) outbreaks in Kenya using an Artificial intelligence based machine learning model, XGBoost, using climatic variables. Several key steps used in the methodogy include: data collection, data preprocessing, exploratory data analysis, feature selection, hyper parameter tuning, model training, prediction, and evaluation. Each step is designed to ensure the robustness and accuracy of the predictive model. A flow chart by [15] was employed in this study. The R statistical software of version 4.4.1 was used because it offers a powerful environment for statistical computing and graphics. Several R packages were used to ensure smooth processing, analysis and modelling of data.

Table 1.
The core R-packages used.
| Package | Function |
| dplyr and tidyr | Data manipulation and cleaning. These packages offer a range of functions to handle missing data, transform variables, and prepare the dataset for analysis. |
| ggplot2 | Data visualization. This package is essential for creating detailed and informative plots during the exploratory data analysis phase. |
| caret | Feature selection and model training. The caret package provides a unified interface to numerous machine learning algorithms and tools for feature selection, cross-validation, and hyper parameter tuning. |
| xgboost | Building and training the XGBoost model. This package is specifically designed for implementing the XGBoost algorithm, which is known for its speed and performance in predictive modelling. |
| e1071 | Additional model tuning and performance evaluation metrics. This package includes functions for hyper parameter tuning and various evaluation metrics necessary for assessing model performance. |
Source: R Core Team (2023), CRAN packages.
2.1. Study Area
The data encompasses 30 years of monthly Rift Valley Fever (RVF) outbreaks in Kenya from 1981 to 2010 the distribution pattern is mapped in Figure 1 based on the cumulative number of RVF case up to 2010 along provinces.
The workflow for this study is shown on Figure 2 with an efficient way for data preprocessing, analysis, and model training.
2.2. Data Collection
The data consists of 30 years (1981-2010) of monthly RVF outbreaks in Kenya with variables such as year, month, rainfall, elevation, slope, clay content, and humidity. The raw data was provided by the International Livestock Research Institute – Kenya.
2.3. Data Cleaning
Data cleaning was carried out in R software version 4.4.1. Missing values for the rainfall data were detected during cleaning and were replaced using the mean of the complete samples. For climatic data pre-processing, missing values were omitted using “na.omit()” function in R software. To clearly understand the patterns and trend of the data, data visualization techniques such as Rshiny dashboard and graphs were used.
2.4. Exploratory Data Analysis (EDA)
Exploratory data analysis (EDA) was performed to gain insights into the dataset and understand the relationships between different variables. Visualization techniques such as bar plot, mapping, and correlation matrices were used to explore the data [16]. Correlation analysis examines the relationship between climatic variables and RVF cases to understand the strength and direction of these relationships.
Identifying significant correlations helps in selecting the most relevant features for the model and presenting results on the correlation matrix as shown in Table 3. Temporal trends analysis of RVF cases was also done to identify cases across provinces. This EDA analysis helps in understanding the timing and frequency of RVF outbreaks, which is crucial for accurate prediction.
3.3. Formatting of Mathematical Components
Consider the mathematical notation below,
Whereby,
is the standard deviation of variable X
is the standard deviation of variable Y
is the covariance of variable X and Y
2.5. Feature Selection
Feature selection involves identifying the most relevant climatic variables that contribute significantly to the prediction of RVF outbreaks. Feature importance scores from preliminary XGBoost models were used to rank the climatic variables based on their contribution to the model’s performance. This ranking helps in understanding which variables are most influential in predicting RVF outbreaks.
2.6. Hyper Parameter Tuning
Hyper parameter tuning was performed to optimize the performance of the XGBoost model. Techniques used was a grid search to find the best combination of hyper parameters [17]. This method is exhaustive and ensures that the optimal parameters are found within the defined search space. By using the previous evaluations to inform the search process, the estimates make it more efficient in identifying the best hyper parameters.
2.7. Model Training
The XGBoost model was trained using the selected features and optimized hyperparameters. The training process involves splitting the dataset into training and validation sets, and iteratively updating the model parameters to minimize the loss function. The train-validation split divides the dataset into training and validation sets to evaluate the model’s performance on unseen data.
In this study the 80/20 proportion was used by the XGBoost algorithm to train the model on the training set, with regularization techniques to prevent over fitting [18]. XGBoost is chosen for its robustness, efficiency, and ability to handle large datasets with complex interactions.
2.8. Prediction
The trained XGBoost model was used to predict RVF outbreaks on the validation set. The model’s predictions were compared with the actual RVF cases [11] to evaluate its performance. Prediction generation involved the model generating predictions for the validation set based on the learned patterns from the training set. The predicted RVF cases were compared with the actual cases to determine the model’s performance in correctly identifying outbreaks.
2.9. Evaluation
The performance of the XGBoost model was evaluated using metrics such as accuracy, sensitivity, specificity, precision, recall, area under the curve (AUC) and the receiver operating characteristic curve (ROC).
Out of all the examples which predicted as positive, how many are really positive?
Out of all the positive samples, how many are predicted as positive?
Out of all the people that do not have the disease, how many got negative results?
Accuracy measures the proportion of correctly predicted RVF cases to the total number of cases. This metric provides an overall assessment of the model’s performance.
Sensitivity (Recall) measures the proportion of actual RVF cases that were correctly identified by the model. High sensitivity indicates that the model is effective in identifying true positives.
Specificity measures the proportion of non-RVF cases that were correctly identified by the model. High specificity indicates that the model is effective in identifying true negatives.
Precision measures the proportion of predicted RVF cases that were actual RVF cases. High precision indicates that the model has a low false positive rate.
ROC measures the area under the ROC curve, representing the trade-off between sensitivity and specificity.
A high ROC value indicates that the model performs well in distinguishing between RVF and non-RVF cases.
3. Results
3.1. Exploratory Data Analysis (EDA)
3.1.1. Prevalence of RVF across Provinces
Figure 3 illustrates the distribution of Rift Valley fever (RVF) cases across various provinces in Kenya, presented as percentages. The Rift Valley province exhibits the highest percentage of RVF cases at 26.80%, indicating it as the most affected region. This is followed by the Eastern province with 20.60% and the North-eastern province with 18.90%, suggesting significant RVF activity in these areas as well. Central province accounts for 14.50% of the cases, while the Coast province has 10.60%.
Nairobi, the capital city, shows a lower percentage of 8.50%, reflecting relatively lesser RVF impact compared to the other regions mentioned. Notably, both Nyanza and Western provinces report no RVF cases, indicating the absence or minimal presence of the disease in these areas.
3.1.2. Visualization Dashboard
Visualization dashboard (in the supplementary material) exhibits the district, year on which the outbreak occurred. By selecting the filters on the left-side panel, viewers can compare RVF outbreaks by province, variables, plot type etc.
The following dashboard gives an interactive visualization of RVF outbreak and the independent variables
3.1.3. Correlation across Variables
Table 4 presents the correlation matrix of various climatic factors and their relationship with Rift Valley fever (RVF) cases. The table shows the Pearson correlation coefficients between each pair of variables: rainfall, elevation, slope, and clay, humidity, and RVF cases. The correlations are generally low, suggesting weak linear relationships among the variables. Rainfall has a very weak positive correlation with RVF cases (0.02903), indicating a slight association. Elevation shows a very weak positive correlation with RVF cases (0.01063), and similarly, slope (0.01503) and humidity (0.01407) exhibit minimal positive correlations with RVF cases.
The clay content in soil has the weakest correlation with RVF cases (0.00301). Additionally, the inter-variable correlations show that elevation is moderately correlated with clay content (0.52932) and slope (0.39360), while other inter-variable correlations are relatively low. This analysis indicates that while these climatic factors are included in the model, their direct linear relationships with RVF case occurrence are not strong, emphasizing the complexity of predicting RVF outbreaks based on these variables alone.
Further Figure 4(a) indicates the correlation coefficients between various climatic factors and Rift Valley fever (RVF) cases, along with their statistical significance. Clay content shows a near-zero correlation (0.003), suggesting no significant impact. Elevation has a very weak negative correlation (-0.0106), yet is highly significant (p < 0.001), implying even small elevation changes might influence RVF cases. Humidity (0.014), rainfall (0.029), and slope (-0.015) also show weak correlations, but their high significance (p < 0.001) suggests they do contribute to RVF occurrences in a non-linear or complex manner.
3.2.3. Further Selection Using Hyperparameter Tuning
Table 6 outlines the optimal hyper parameters used for the XGBoost model in predicting Rift Valley fever (RVF) cases. The learning rate is set at 0.1, balancing model accuracy and training speed. The model employs 100 estimators, with a maximum depth of 3, preventing over fitting while capturing essential patterns. The number of jobs is 0.5, indicating parallel processing to enhance efficiency.
All five features are included, ensuring comprehensive data utilization. The early stopping iteration is 44, indicating the point at which model performance stops improving [19]. A 5-fold cross-validation (Nfold) is used to ensure robust model evaluation. The minimum child weight is set at 5, regulating the model complexity, and gamma is 0.1, controlling the split creation based on node impurity.
The regularization parameter, lambda, is set to 1, preventing over fitting by adding a penalty for higher model complexity. These parameters collectively ensure a balanced, efficient, and accurate model for RVF prediction.
| XGBoost | Hyper parameter tuning |
| Learning rate | 0.1 |
| N_estimators used | 100 |
| Max_depth | 3 |
| N_jobs | 0.5 |
| Features | 5 |
| Nitterc (stop iteration) | 44 |
| Nfold | 5 |
| Min_child_weight | 5 |
| Gamma | 0.1 |
| Reg_lambda | 1 |
3.2.4. Decision Tree for the Model
Figure 6 illustrates an XGBoost decision tree used for predicting Rift Valley fever (RVF) cases based on various climatic features. The tree begins with the root node, which splits based on rainfall levels (< 59.0094109), indicating the importance of rainfall in the initial decision-making process. The subsequent nodes further split based on other features like slope, elevation, humidity, and clay content, each contributing to the model’s predictions.
Based on the Figure 6 XGBost tree, the following is observed, the Root Node (Rainfall < 59.0094109): The primary split at the root node highlights that rainfall is the most significant factor influencing the initial decision [20]. High gain (0.8613) and cover (17245.65) indicate its substantial contribution to the model’s performance.
The Secondary Splits is at Slope (< 89.9539795), following the primary split, the model examines the slope, which indicates the topographical influence on RVF case distribution. Rainfall (< 59.0743065) a further split based on a different threshold of rainfall emphasizes its ongoing importance. Elevation, Humidity, Clay, these features appear in subsequent nodes, indicating their roles in refining the model’s predictions. For instance, elevation has a notable gain (1.01904297) in one of the splits.
Leaf Nodes shows that the terminal nodes (leaf nodes) represent the predicted values. Each leaf node’s value indicates the predicted influence on RVF cases, with associated cover and gain metrics showing how much data is captured by that path and the feature’s importance.
Gain and Cover, shows that high gain values in nodes like elevation (1.01904297) and humidity (0.712402344) suggest these features significantly improve the model’s accuracy when included in the decision path. Cover values indicate the proportion of observations processed by each node, with higher cover reflecting broader data capture.
Interaction of Features shows that the tree demonstrates complex interactions between climatic features [21].
3.2.5. Further Evaluation Metrics and Ensemble Predictions
Table 7 presents the evaluation metrics for the XGBoost model used to predict Rift Valley fever (RVF) cases, showcasing the model’s exceptional performance. The accuracy score of 0.9974 indicates that 99.74% of the predictions are correct, demonstrating the model’s high reliability in distinguishing between RVF and non-RVF instances.
With a precision score of 0.9975, the model effectively minimizes false positives, ensuring that almost all predicted RVF cases are accurate [11]. The recall score of 0.9999 reflects the model’s near-perfect ability to identify actual RVF cases, capturing 99.99% of true positives and minimizing false negatives.
The Area under the Curve (AUC) of the Receiver Operating Characteristic (ROC) curve measures the model’s ability to distinguish between positive and negative classes. An AUC score of 0.8908 indicates that the model has a high ability to discriminate between RVF and non-RVF cases [22]. Although not as close to perfect as the other metrics, an AUC of 0.8908 is still indicative of a strong model performance, capturing a significant portion of the true positive rate relative to the false positive rate which is as shown in Figure 7.
3.3. Prediction of the RVf Cases from the Actual Data
Based on Figure 8, the model has predicted well from the beginning until year 1997 to 2000 where there was high deflection of cases, as well as the year 2015 to 2019. Alghough there is a decrease in accuracy, it still maintains good model accuracy over a longer period, highlighting the potential of using xgboost in predicting RVF cases.
4. Discussion
The analysis of Rift Valley fever (RVF) case distribution across Kenyan provinces reveals significant geographical variability, with the Rift Valley, Eastern, and North-eastern provinces being the most affected. This distribution emphasizes the need for targeted public health interventions in these high-prevalence areas.
The geographical distribution of Rift Valley fever (RVF) cases in Kenya demonstrates substantial variation across different provinces, with the Rift Valley, Eastern, and North-eastern regions experiencing the highest incidence. This pattern highlights the need for localized public health interventions. The Rift Valley province, with the highest percentage of cases, suggests that specific environmental and socioeconomic factors prevalent in this region may be conducive to RVF transmission [21]. These factors could include agricultural practices, livestock density, and water management systems, which create favourable conditions for mosquito breeding and subsequent RVF transmission.
The correlation matrix of climatic factors (rainfall, elevation, slope, clay content, and humidity) and their relationship with RVF cases suggests weak linear relationships. For example, rainfall shows a very weak positive correlation with RVF cases, while elevation, slope, clay, and humidity also exhibit minimal correlations. This implies that predicting RVF outbreaks based on individual climatic factors alone is complex and may not provide a clear predictive capability according to [19]. However, these findings underscore the importance of considering multiple factors simultaneously to understand the disease’s dynamics better.
4.1. The Role of Climatic Factors in RVF Transmission
The climatic predictors, particularly temperature and rainfall are major determinants of RVF transmissions. Heavy rainfall and flooding is associated with breeding grounds for mosquitoes which are the primary vectors of RVF. According to a study by [11], the RVF outbreaks in East Africa are very closely associated with periods of above-normal rainfall and flooding, which leads to increased mosquito populations.
These results aligns with our concluded study whereby the XGBoost analysis cleared showed that rainfall was the most important variable in RVF predictions. Topography and elevation also both affect RVF transmission. Lower temperatures at higher altitudes may have an effect on the life cycles of mosquitoes and the dynamics of RVF transmission. Furthermore, the presence and activity of mosquito vectors can be influenced by the interaction of elevation with other variables such as soil moisture content and clay content.
4.2. XGBoost Model in Predicting RVF
The XGBoost model’s exceptional performance in predicting RVF cases demonstrates its robustness and reliability. The model achieves a high accuracy of 99.74%, precision of 99.75%, and recall of 99.99%, indicating its effectiveness in correctly identifying RVF cases and minimizing false negatives. The slightly lower AUC of 0.8908 still represents a strong ability to discriminate between RVF and non-RVF cases.
The feature importance analysis within the XGBoost model reveals that rainfall is the most critical factor, followed by elevation, slope, clay content, and humidity. These findings align with existing studies that emphasize the significant role of climatic conditions in RVF outbreaks. For example, [23] found out that remote sensing data on rainfall and vegetation indices could effectively predict RVF outbreaks several months in advance.
4.3. Implications of the XGBoost Model
The successful adoption of the XGBoost model in predicting RVF cases has important implications for public health intervention and strategies. Integration of several climatic conditions is very critical in providing early warnings of the RVF outbreaks hence allowing timely preparation of targeted interventions. This capability is crucial in regions like the Rift Valley, Eastern, and North-eastern provinces, where RVF incidence is high.
The model’s ability to handle complex interactions among climatic factors underscores the importance of using advanced machine learning techniques in epidemiological studies. Traditional statistical methods may not capture the nonlinear relationships between variables as effectively as machine learning models like XGBoost. Therefore, employing such models can enhance our understanding of disease dynamics and improve predictive accuracy.
4.4. Relevance to Public Health Strategies
The findings from this study align with the broader literature on RVF and its association with climatic factors. For instance, studies by [24] and [25] have demonstrated the critical role of environmental conditions in RVF transmission. These studies support the idea that integrating climatic data into predictive models can enhance the effectiveness of surveillance systems. Moreover, the high predictive accuracy of the XGBoost model suggests that similar approaches could be applied to other vector-borne diseases influenced by climatic factors, such as malaria and dengue fever. This cross-disease applicability highlights the potential for machine learning models to transform public health strategies and improve disease control efforts globally.
5. Conclusion
The XGBoost model’s high performance in predicting RVF cases underscores its potential as a valuable tool for public health authorities. By accurately integrating multiple climatic factors, the model can provide early warnings of potential RVF outbreaks, enabling timely and effective intervention measures. This study highlights the importance of using advanced machine learning techniques to enhance disease prediction and control strategies, particularly for vector-borne diseases influenced by climatic conditions.
6. Recommendations
In summary, the integration of advanced machine learning techniques like XGBoost into public health surveillance systems represents a significant step forward in predicting and controlling vector-borne diseases such as RVF. By leveraging the power of these models, public health authorities can improve their response to outbreaks, ultimately reducing the disease burden and enhancing population health.
7. Limitations and Future Directions
Though the XGBoost model has a lot of potential, there are some drawbacks to take into account. Due to its reliance on climatic data, the model might not adequately account for other variables influencing the spread of RVF, such as socioeconomic circumstances, the movements of livestock, and human behavior. These variables should be included in future studies in order to improve the accuracy and comprehensiveness of the model. It is also necessary to test the model’s generalizability to other regions outside of Kenya. Geographically specific models are required because different regions may have distinct environmental and socioeconomic factors that affect the spread of RVF. Cooperation between nations and areas may make it easier to create predictive models that are more reliable and applicable to all situations.
Supplementary Materials
The following supporting information for the RVF dashboard as described in Figure 4 can be downloaded at; https://www.kaggle.com/code/damarisfelistusmulwa/rvf-dashboard-codes/edit, RVF DASHBOARD CODES | Kaggle.
Author Contributions
Conceptualization, Damaris Mulwa, Benedicto Kazuzuru and Benard Bett. Methodology, Gerald Misinzo, Damaris Mulwa.; software, Damaris Mulwa.; validation, Damaris Mulwa, Benard Bett and Benedicto Kazuzuru.; formal analysis, Damaris Mulwa; investigation, Damaris Mulwa.; resources, Benard Bett.; data curation, Damaris Mulwa.; writing—original draft preparation, Damaris Mulwa.; writing—review and editing Damaris Mulwa, Benard Bett and Benedicto Kazuzuru.; visualization, Damaris Mulwa.; supervision, Benard Bett, Gerald Misinzo and Benedicto Kazuzuru.;
Funding
This research was funded by the Partnership in Applied Sciences, Engineering and Technology, PASET and received additional support from USAID; Operational research to improve policies and practices on the use of Rift Valley fever vaccines in East Africa, Contract Number 720FDA19IO00102.
Data Availability Statement
All the data used in this study is available at https://www.kaggle.com/datasets/damarisfelistusmulwa/rift-valley-fever-data-from-1981-to-2010-kenya.
Acknowledgments
The authors extend their appreciation to their universities for supporting their research work.
Conflicts of Interest
The authors declare no conflicts of interest. The funders had no role in the design of the study; in the collection, analyses, or interpretation of data; in the writing of the manuscript; or in the decision to publish the results”.
References
- N. N. Gaudreault, S. V. Indran, V. Balaraman, W. C. Wilson, and J. A. Richt, “Molecular aspects of Rift Valley fever virus and the emergence of reassortants,” Virus Genes, vol. 55, no. 1, pp. 1–11, Feb. 2019. [CrossRef]
- B. Faburay, A. D. LaBeaud, D. S. McVey, W. C. Wilson, and J. A. Richt, “Current Status of Rift Valley Fever Vaccine Development,” Vaccines, vol. 5, no. 3, Art. no. 3, Sep. 2017. [CrossRef]
- A. Endale et al., “Sero-prevalence of West Nile virus and Rift Valley fever virus infections among cattle under extensive production system in South Omo area, southern Ethiopia,” Trop. Anim. Health Prod., vol. 53, no. 1, p. 92, Jan. 2021. [CrossRef]
- G. O. Muga, W. Onyango-Ouma, R. Sang, and H. Affognon, “Sociocultural and Economic Dimensions of Rift Valley Fever,” Am. J. Trop. Med. Hyg., vol. 92, no. 4, pp. 730–738, Apr. 2015. [CrossRef]
- H. N. Cartwright et al., “Genetic diversity of collaborative cross mice enables identification of novel rift valley fever virus encephalitis model,” PLOS Pathog., vol. 18, no. 7, p. e1010649, Jul. 2022. [CrossRef]
- S. Leta, T. J. Beyene, E. M. De Clercq, K. Amenu, M. U. G. Kraemer, and C. W. Revie, “Global risk mapping for major diseases transmitted by Aedes aegypti and Aedes albopictus,” Int. J. Infect. Dis., vol. 67, pp. 25–35, Feb. 2018. [CrossRef]
- V. Martin et al., “The impact of climate change on the epidemiology and control of Rift Valley fever”.
- A. Anyamba et al., “Prediction of a Rift Valley fever outbreak,” Proc. Natl. Acad. Sci., vol. 106, no. 3, pp. 955–959, Jan. 2009. [CrossRef]
- D. Tumusiime, A. M. Nijhof, M. H. Groschup, J. Lutwama, K. Roesel, and B. Bett, “Participatory survey of risk factors and pathways for Rift Valley fever in pastoral and agropastoral communities of Uganda,” Prev. Vet. Med., vol. 221, p. 106071, Dec. 2023. [CrossRef]
- “Machine learning applications for COVID-19 outbreak management | Neural Computing and Applications.” Accessed: Jun. 30, 2024. [Online]. Available: https://link.springer.com/article/10. 1007.
- K. N. Gerken, B. A. Ndenga, K. O. Owuor, C. A. Winter, K. Seetah, and A. D. LaBeaud, “Leveraging livestock movements to urban slaughterhouses for wide-spread Rift Valley fever virus surveillance in Western Kenya,” One Health, vol. 15, p. 100457, Dec. 2022. [CrossRef]
- M. C. Wimberly et al., “Land cover affects microclimate and temperature suitability for arbovirus transmission in an urban landscape,” PLoS Negl. Trop. Dis., vol. 14, no. 9, p. e0008614, Sep. 2020. [CrossRef]
- M. Asindu, A. Abdulai, B. Bett, K. Roesel, and E. Ouma, “Choice heuristics and livestock farmers’ preference heterogeneity for Rift Valley fever vaccines in Uganda,” J. Behav. Exp. Econ., vol. 111, p. 102226, Aug. 2024. [CrossRef]
- M. F. Sallam, C. Fizer, A. N. Pilant, and P.-Y. Whung, “Systematic Review: Land Cover, Meteorological, and Socioeconomic Determinants of Aedes Mosquito Habitat for Risk Mapping,” Int. J. Environ. Res. Public. Health, vol. 14, no. 10, Art. no. 10, Oct. 2017. [CrossRef]
- T. Zhang, F. Rabhi, X. Chen, H. Paik, and C. R. MacIntyre, “A machine learning-based universal outbreak risk prediction tool,” Comput. Biol. Med., vol. 169, p. 107876, Feb. 2024. [CrossRef]
- V. Punyapornwithaya, K. Klaharn, O. Arjkumpa, and C. Sansamur, “Exploring the predictive capability of machine learning models in identifying foot and mouth disease outbreak occurrences in cattle farms in an endemic setting of Thailand,” Prev. Vet. Med., vol. 207, p. 105706, Oct. 2022. [CrossRef]
- S. Karanth, J. Patel, A. Shirmohammadi, and A. K. Pradhan, “Machine learning to predict foodborne salmonellosis outbreaks based on genome characteristics and meteorological trends,” Curr. Res. Food Sci., vol. 6, p. 100525, Jan. 2023. [CrossRef]
- Y. Zheng, A. Gracia, and L. Hu, “Predicting Foodborne Disease Outbreaks with Food Safety Certifications: Econometric and Machine Learning Analyses,” J. Food Prot., vol. 86, no. 9, p. 100136, Sep. 2023. [CrossRef]
- Z. Farooq et al., “Artificial intelligence to predict West Nile virus outbreaks with eco-climatic drivers,” Lancet Reg. Health – Eur., vol. 17, Jun. 2022. [CrossRef]
- I. Akomea-Frimpong et al., “A systematic review of artificial intelligence in managing climate risks of PPP infrastructure projects,” Eng. Constr. Archit. Manag., vol. ahead-of-print, no. ahead-of-print, Jan. 2023. [CrossRef]
- E. Omosa, B. Bett, and B. Kiage, “Climate change and Rift Valley fever disease outbreak: implications for the food environment of pastoralists,” Lancet Planet. Health, vol. 6, p. S17, Oct. 2022. [CrossRef]
- R. Sankhe, “Solar Energy Prediction and Forecasting,” 2023.
- V. Martin, L. D. Simone, J. Lubroth, P. Ceccato, and V. Chevalier, “Perspectives on using remotely-sensed imagery in predictive veterinary epidemiology and global early warning systems,” Geospatial Health, vol. 2, no. 1, Art. no. 1, Nov. 2007. [CrossRef]
- B. Tinto, J. Quellec, C. Cêtre-Sossah, A. Dicko, S. Salinas, and Y. Simonin, “Rift Valley fever in West Africa: A zoonotic disease with multiple socio-economic consequences,” One Health, vol. 17, p. 100583, Dec. 2023. [CrossRef]
- A. Bowmer, J. Ssembatya, M. Okot, R. Bagyenyi, S. V. Rubanga, and G. Kalema-Zikusoka, “Determining the acceptability of a novel One Health vaccine for Rift Valley Fever prior to phase II/III clinical trials in Uganda,” One Health, vol. 16, p. 100470, Jun. 2023. [CrossRef]
Figure 1.
RVF cases in Kenya from year 1981 to 2010.
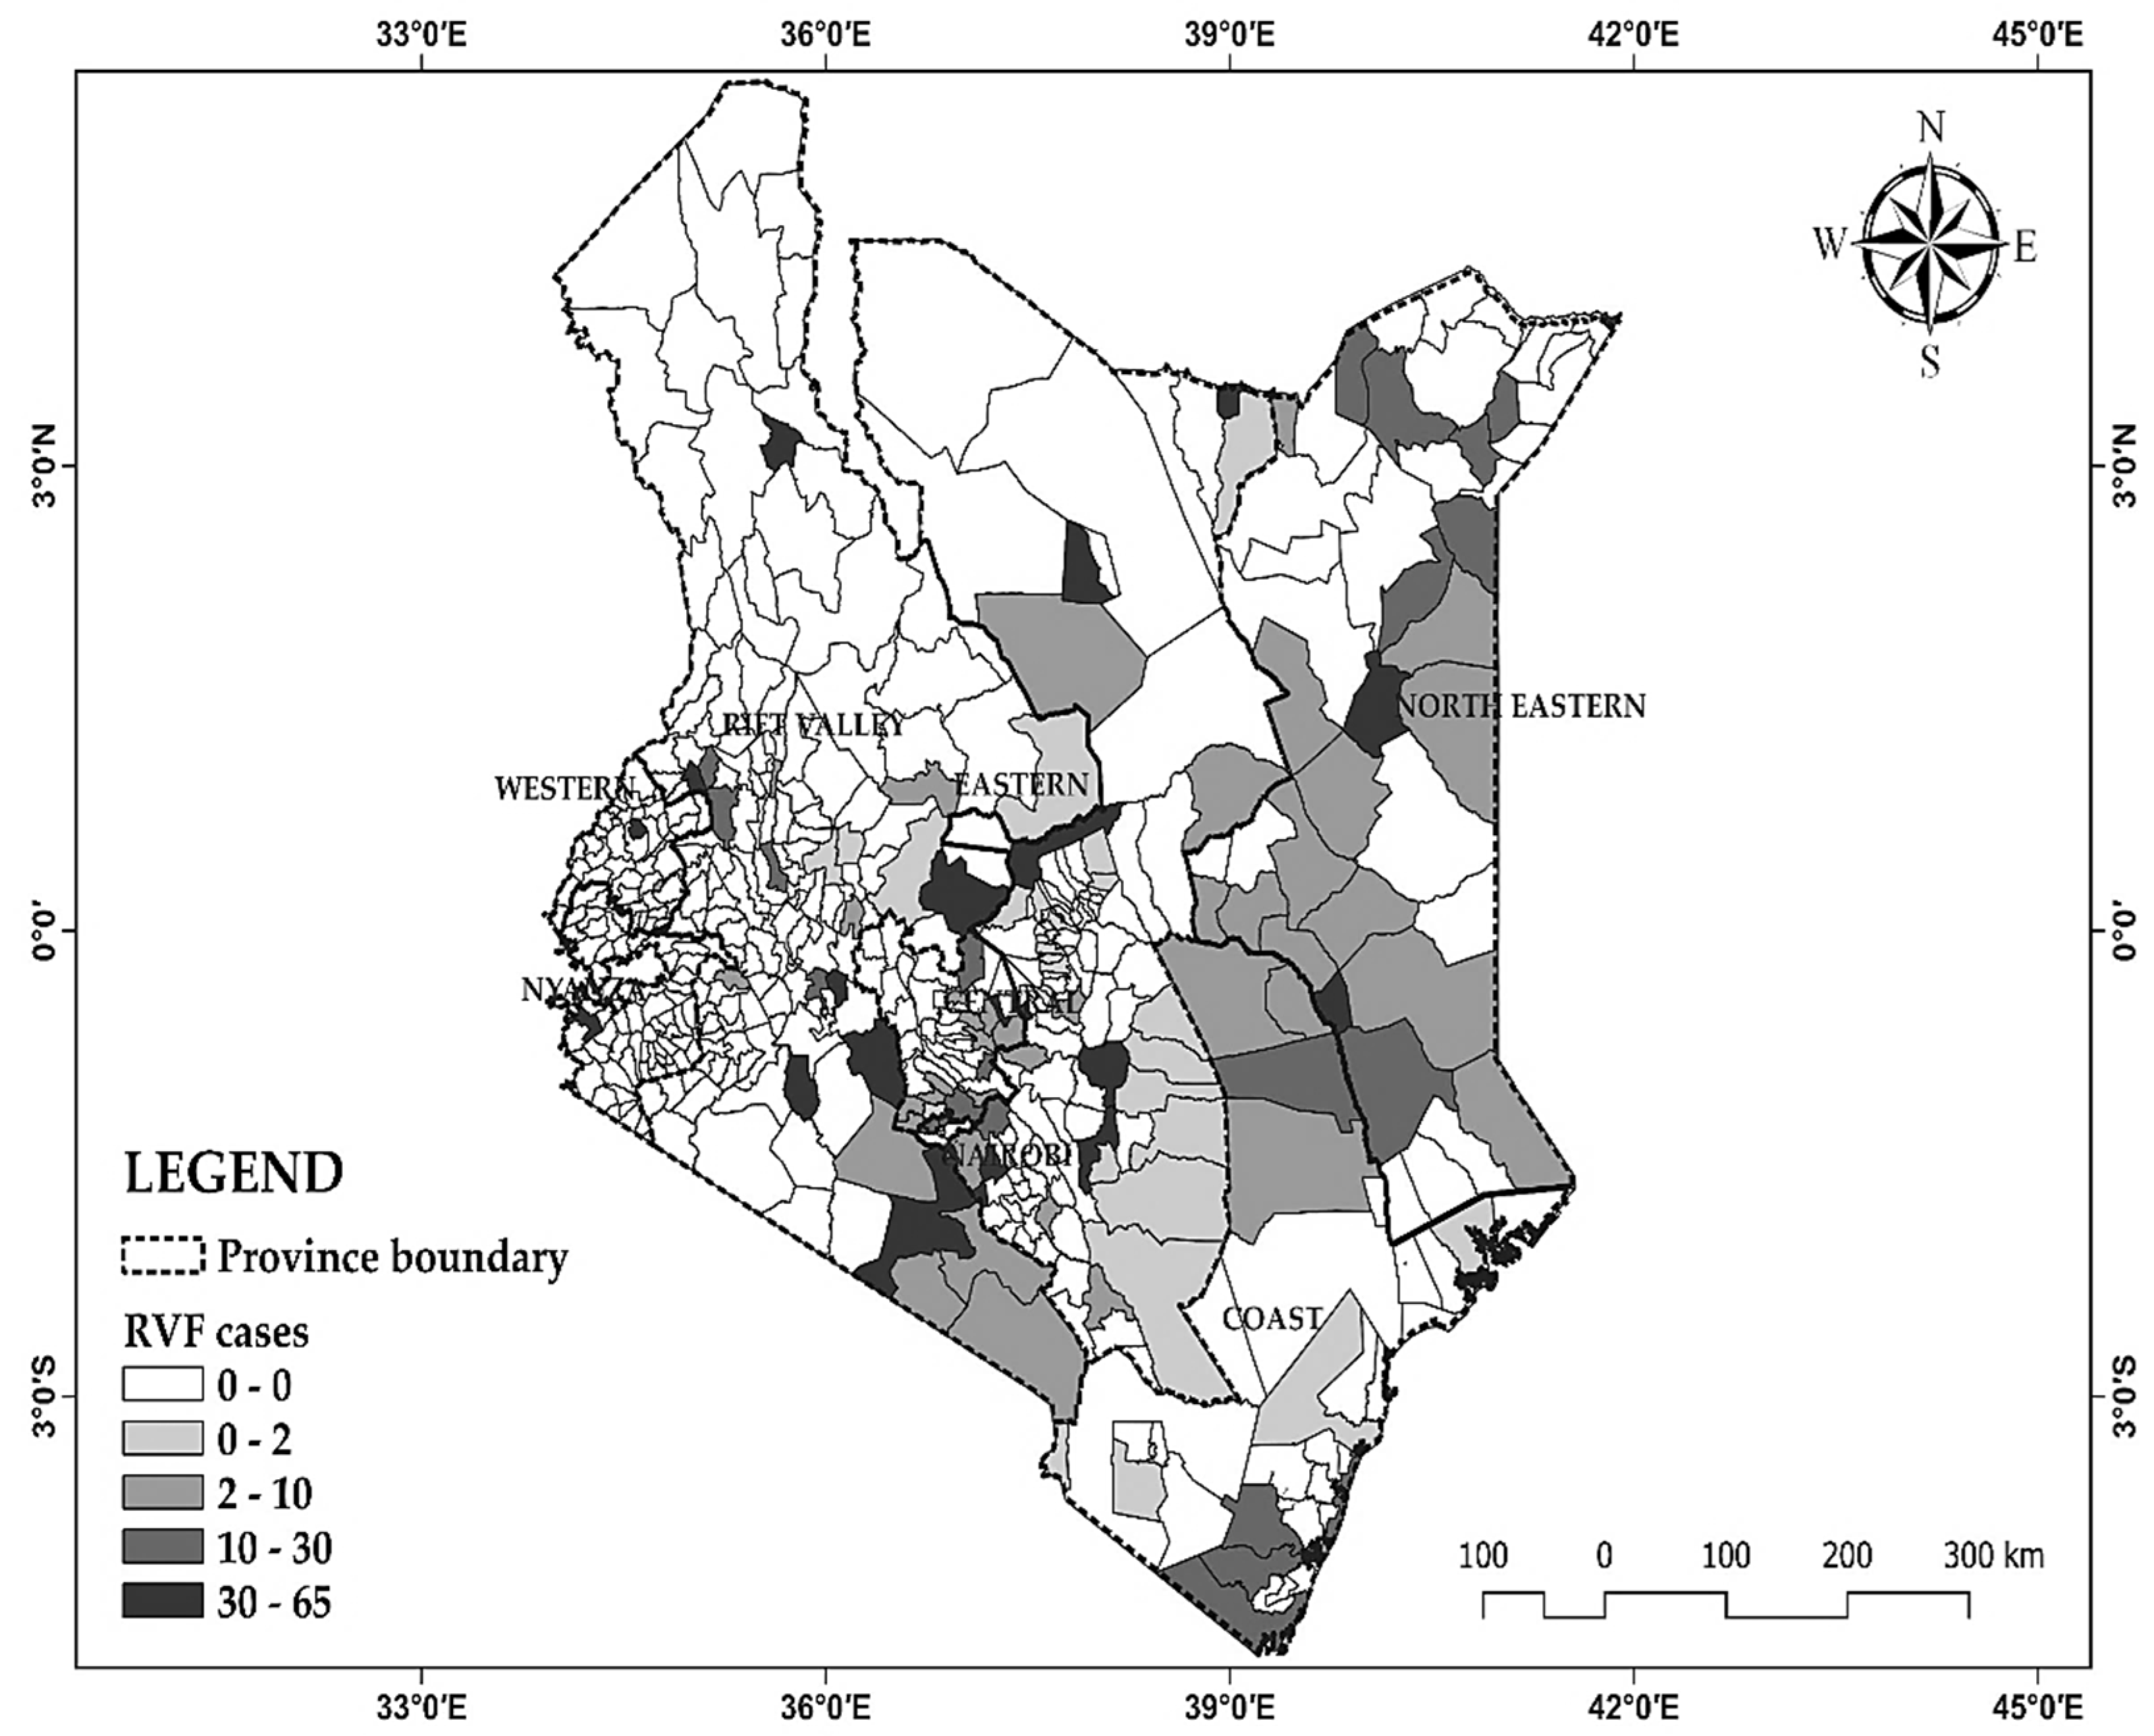
Figure 2.
Flowchart for XGboost modelling of RVF cases and evaluation. (Source: Damaris).
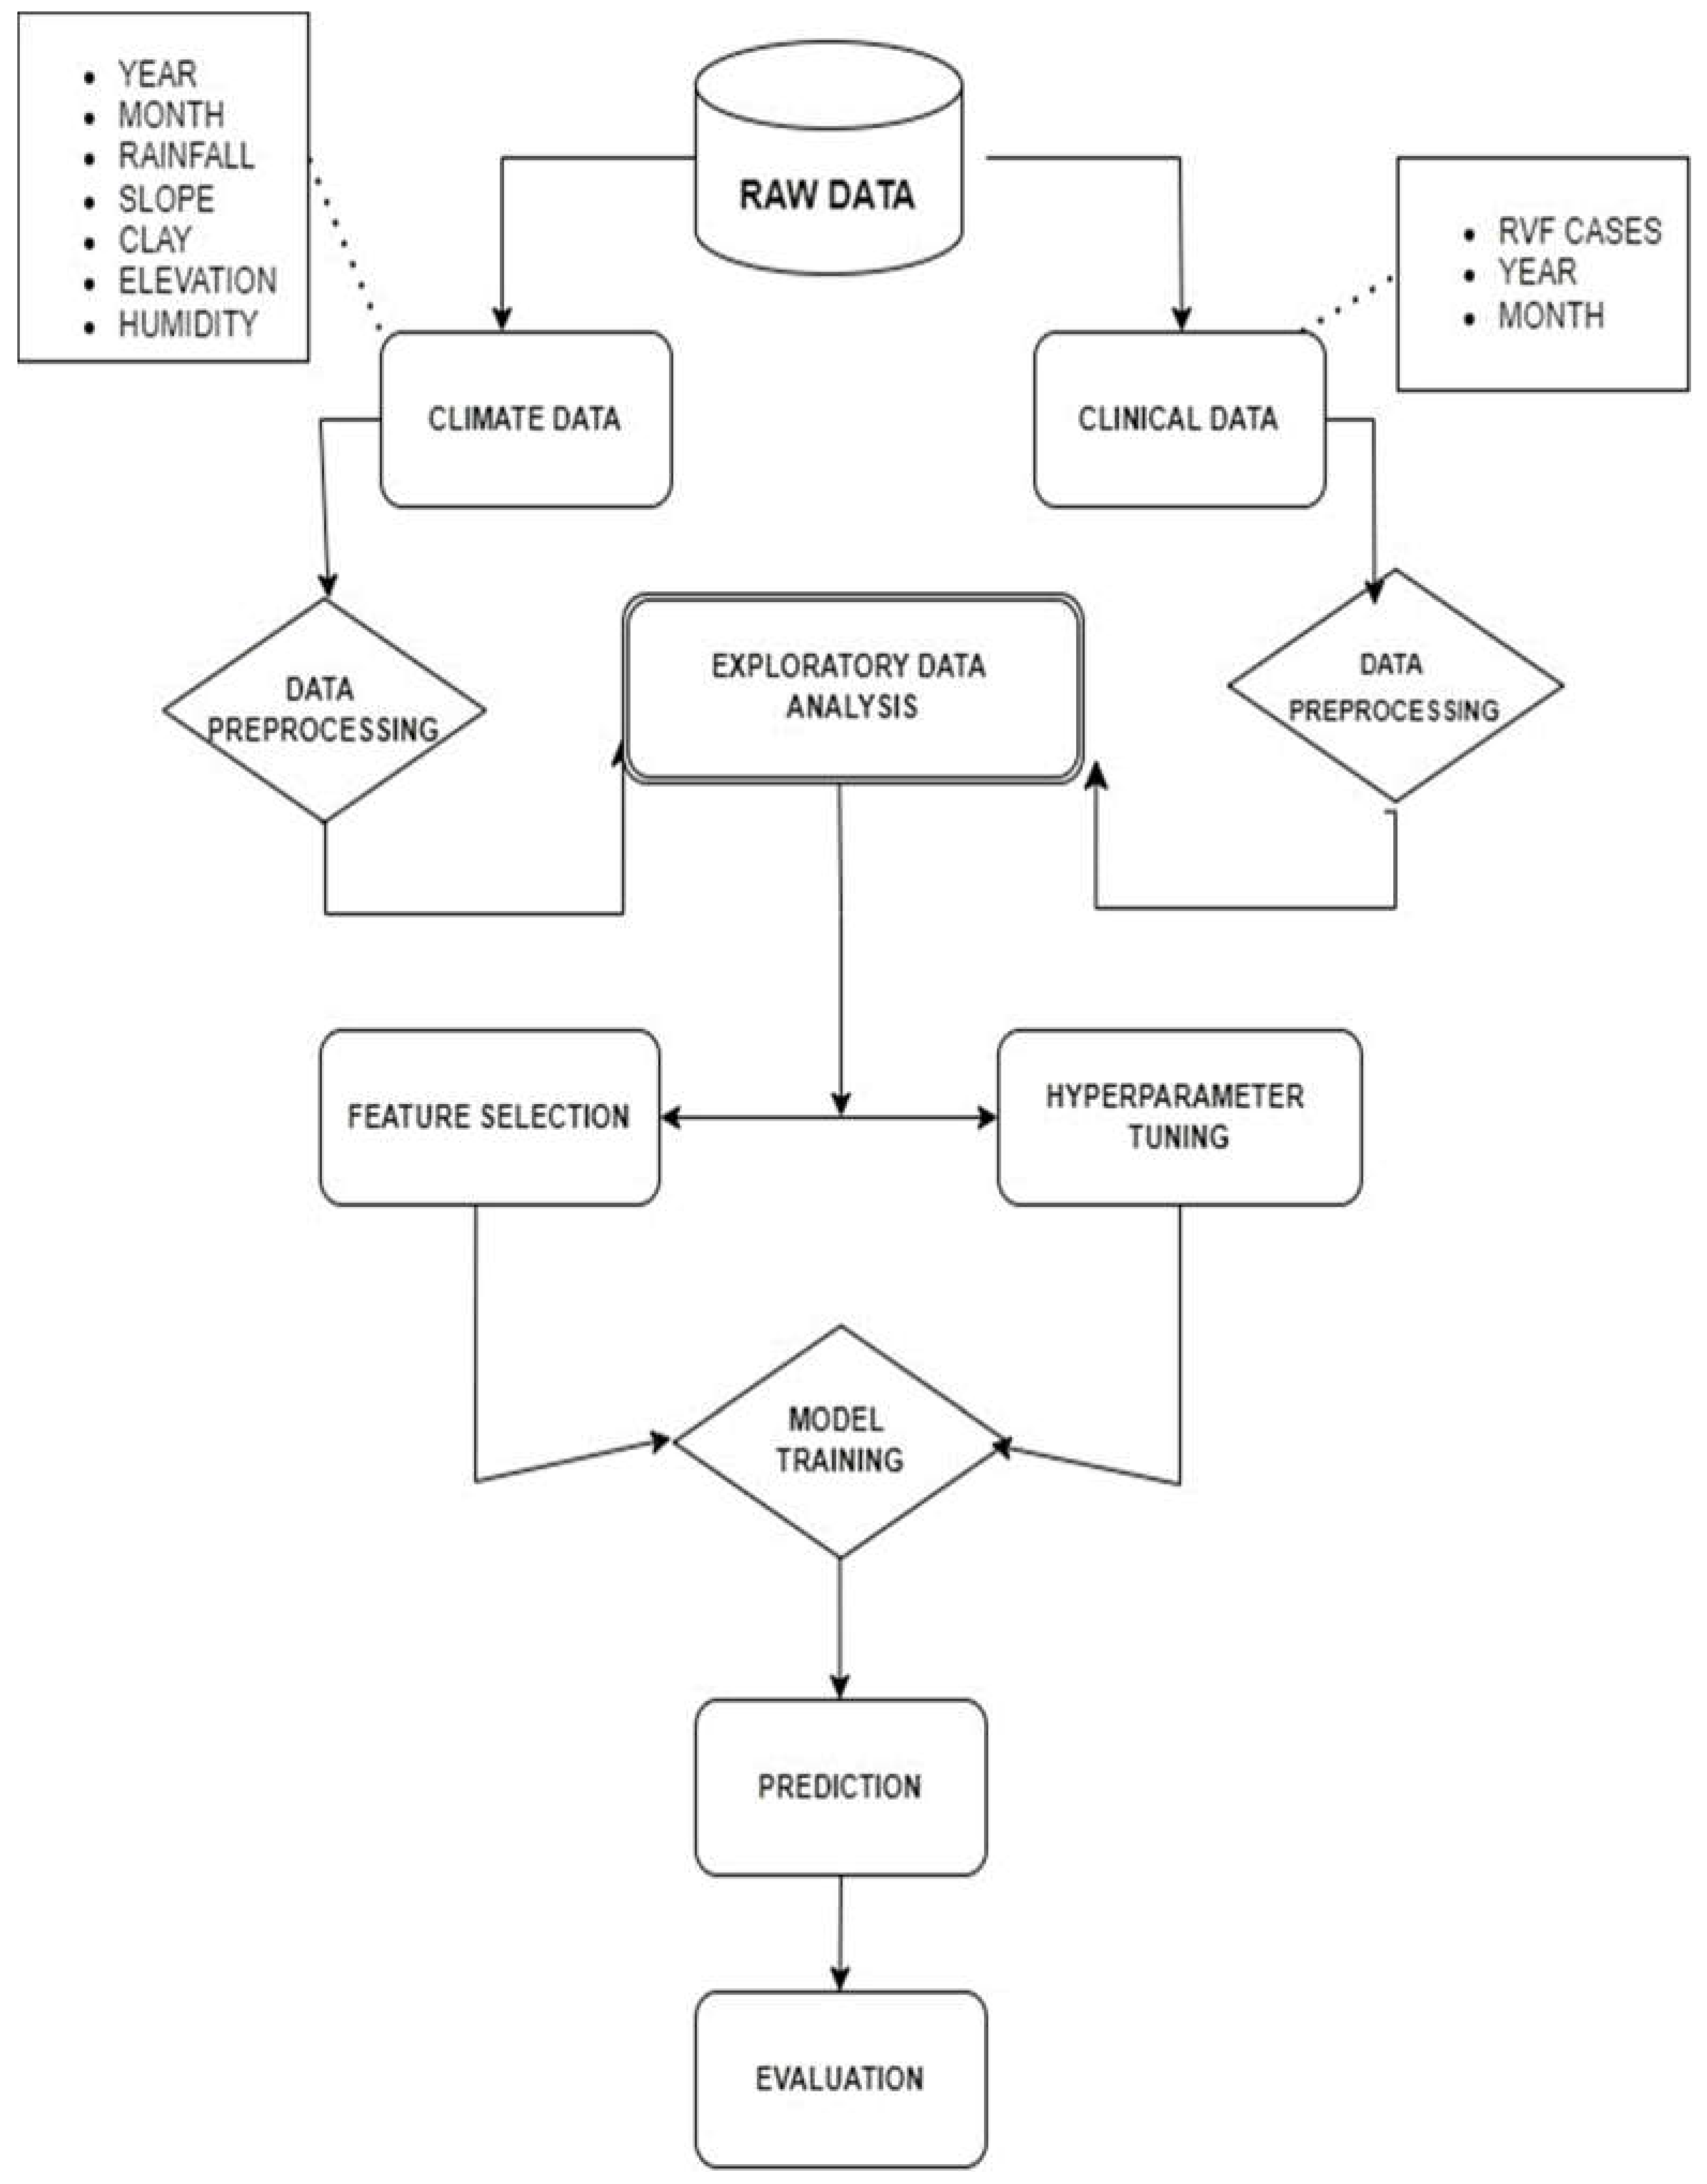
Figure 3.
RVF Prevalence across Province up to 2010.
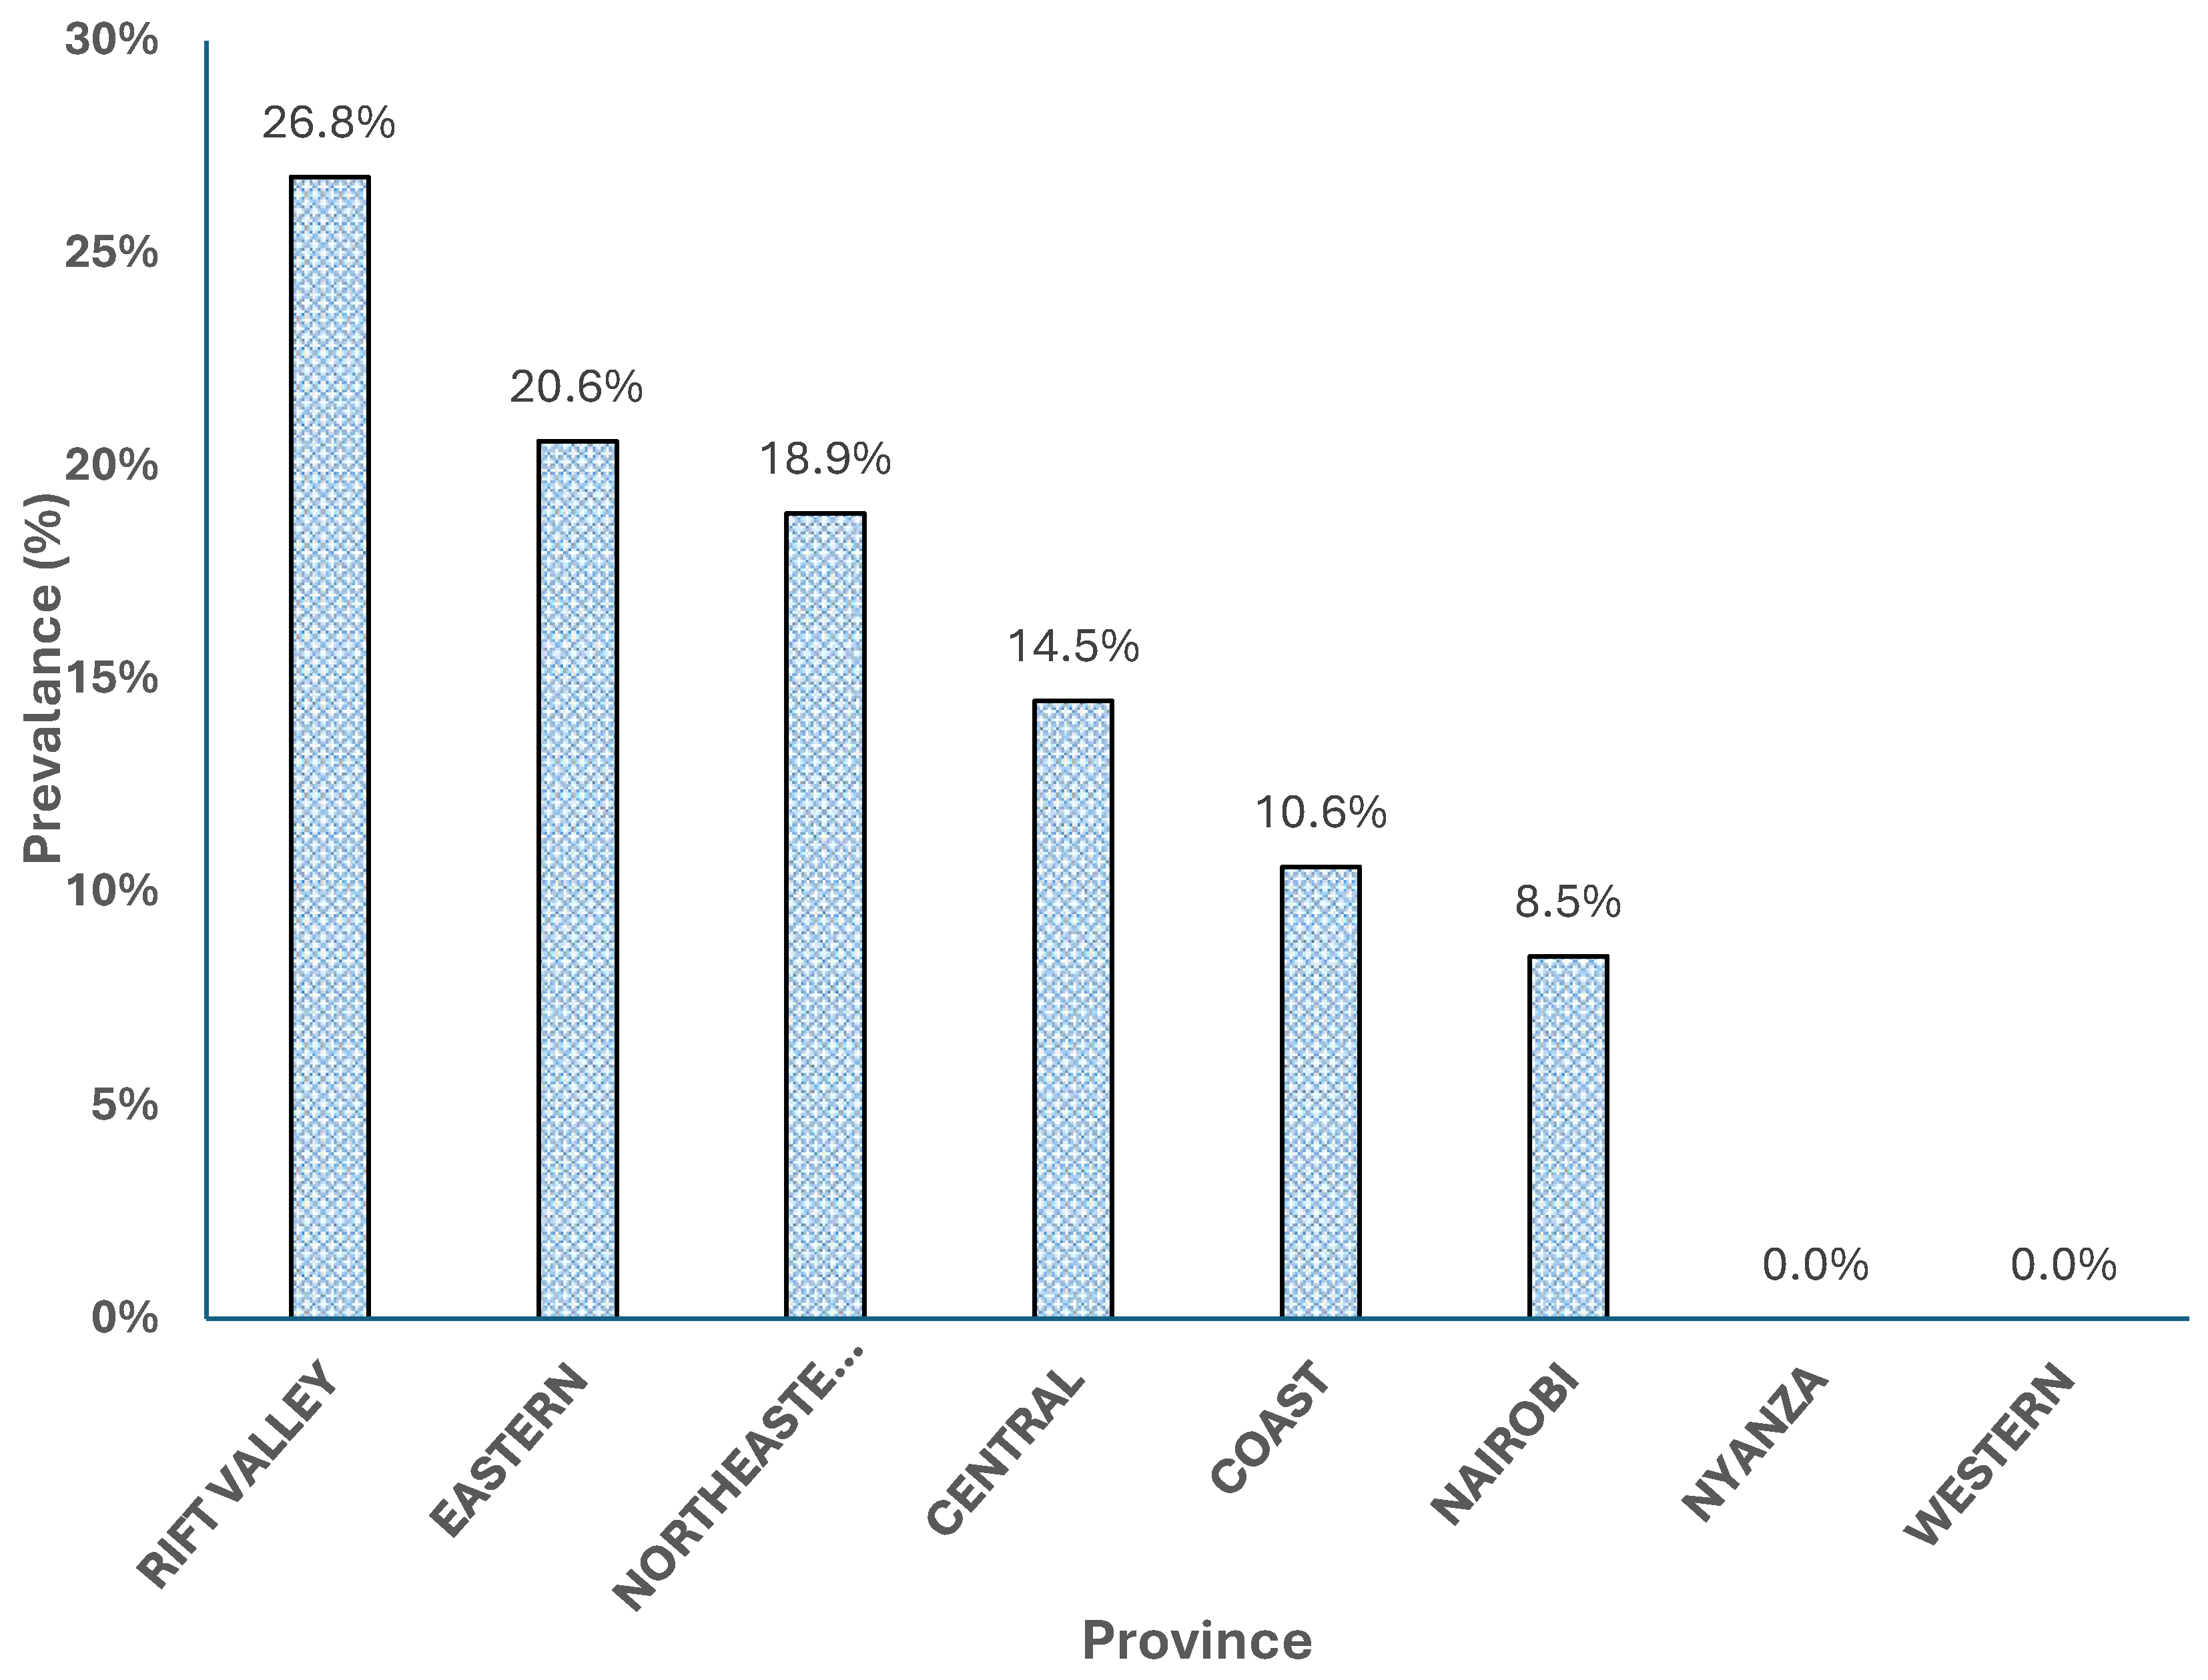
Figure 4.
RVF outbreak interactive dashboard.
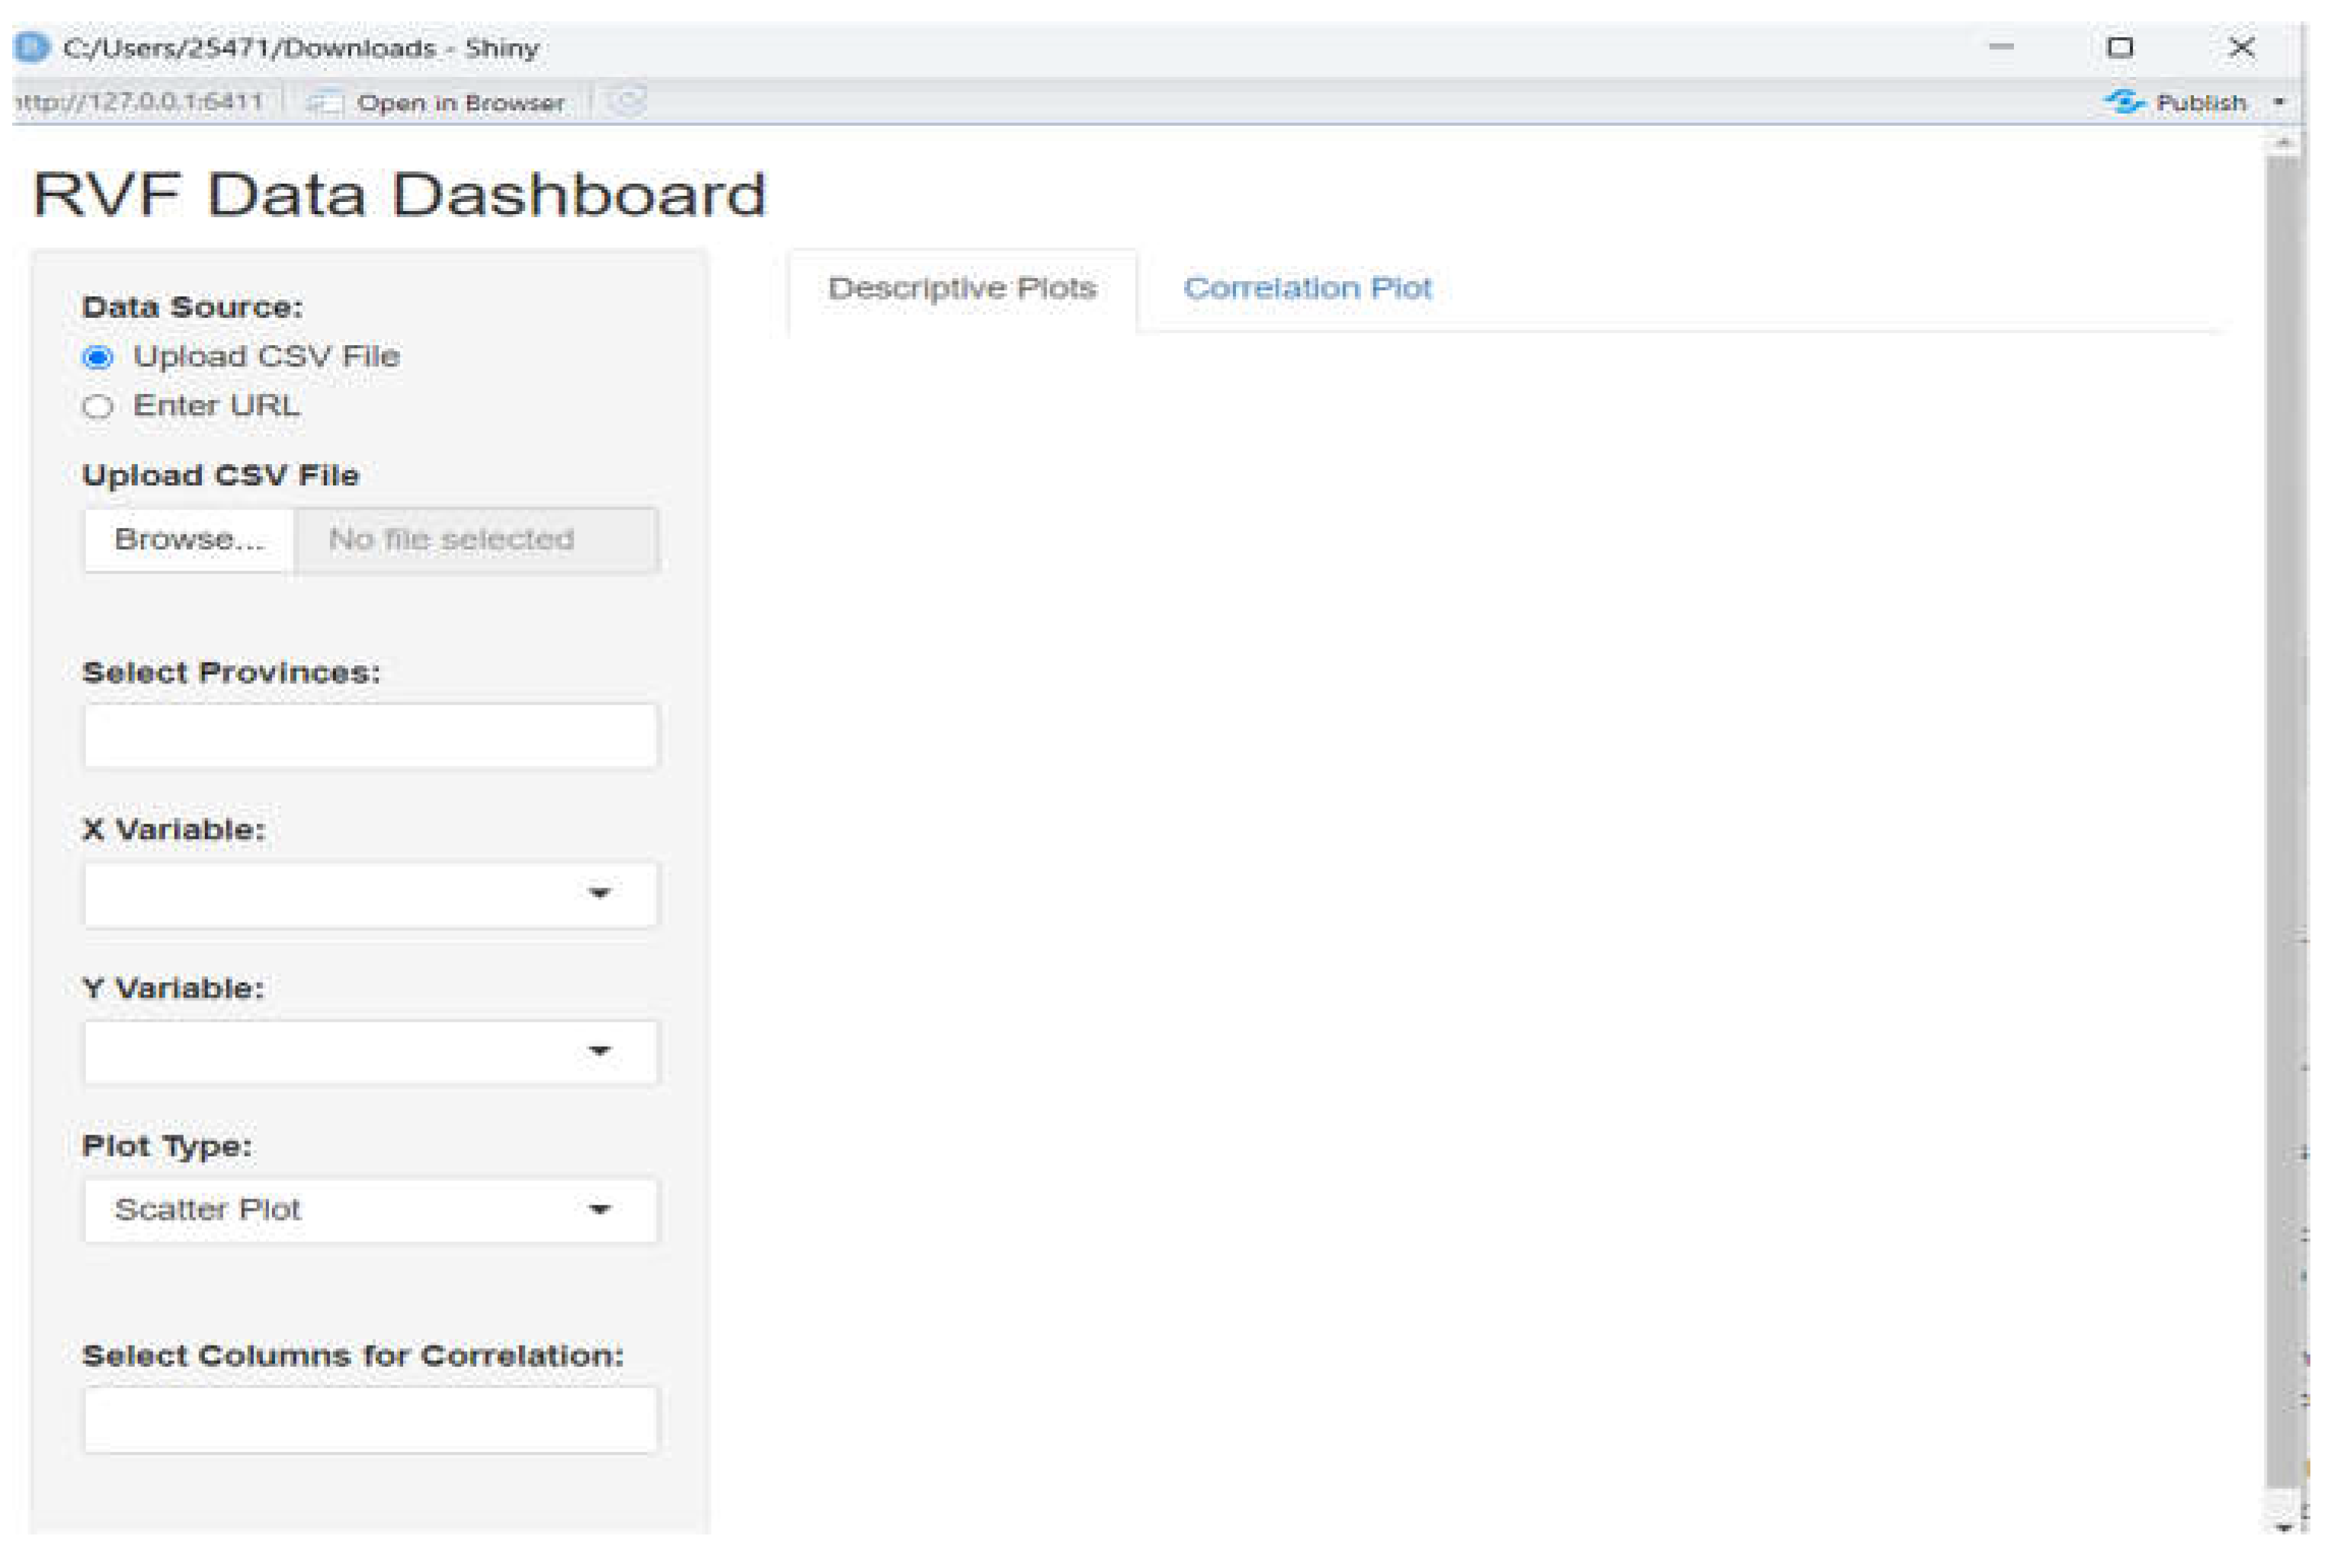
Figure 5.
a) Bar plot showing correlation coefficients of RVF and all variable with significance at 0.05. 5(b) Bivariate correlation across all variables.
Figure 5.
a) Bar plot showing correlation coefficients of RVF and all variable with significance at 0.05. 5(b) Bivariate correlation across all variables.
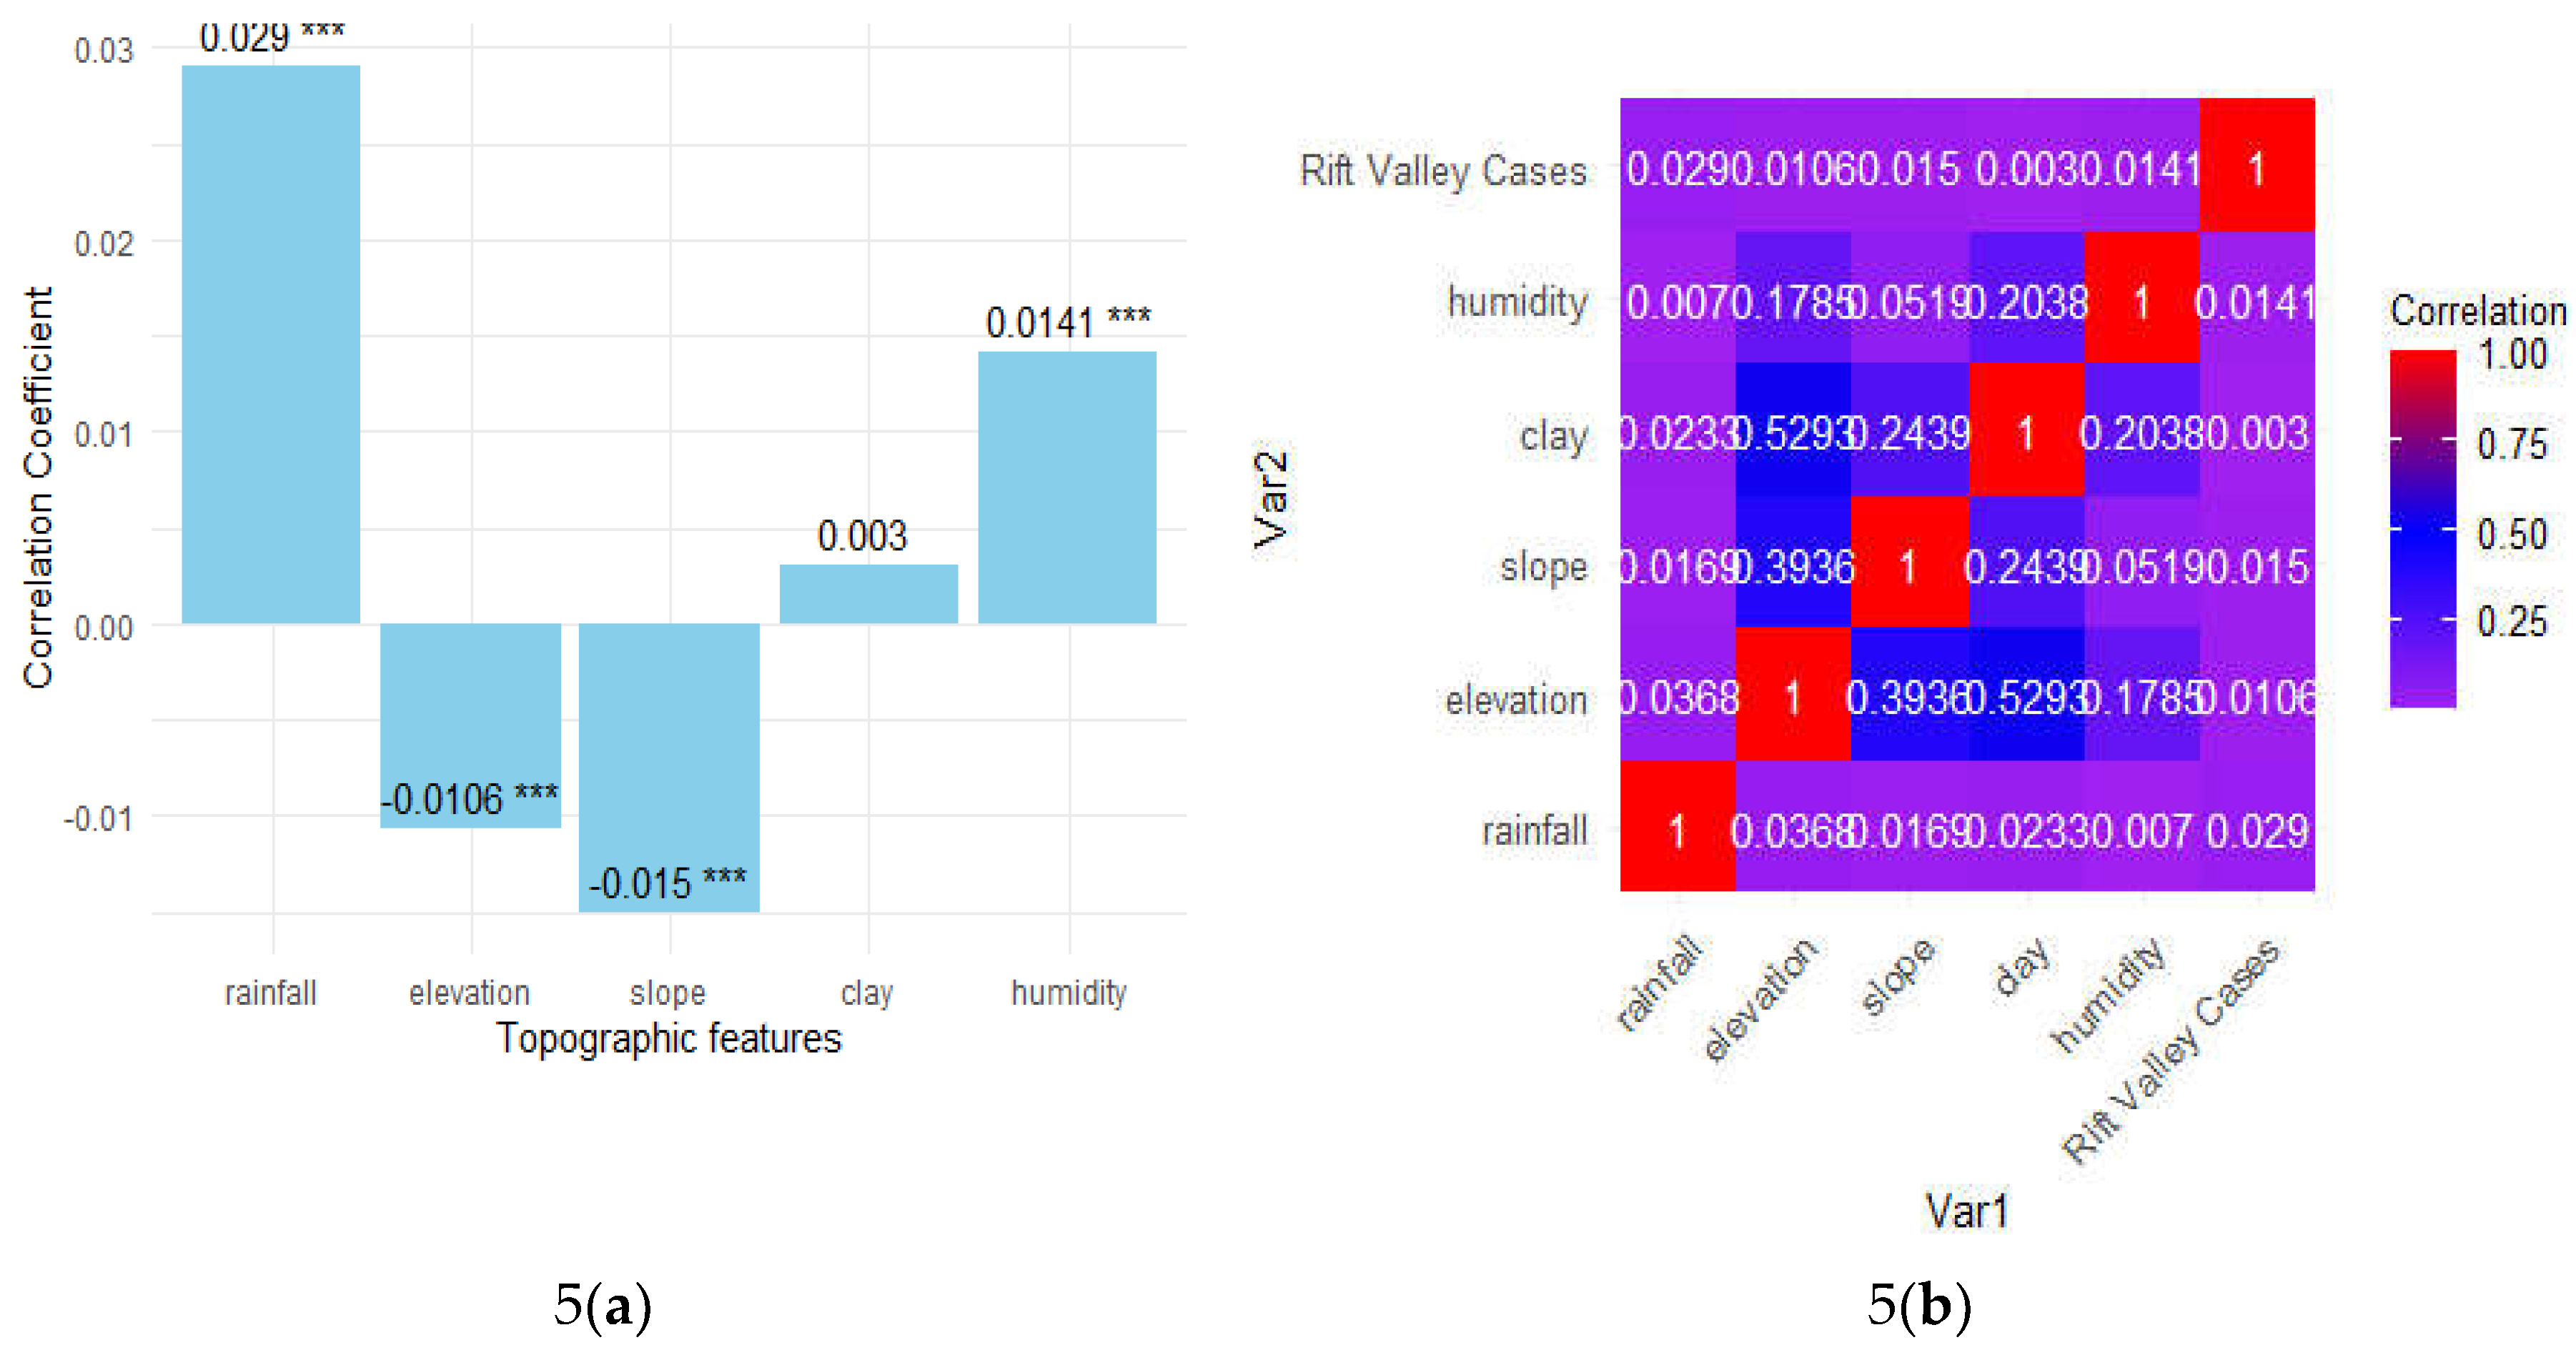
Figure 6.
Feature importance after model computing.
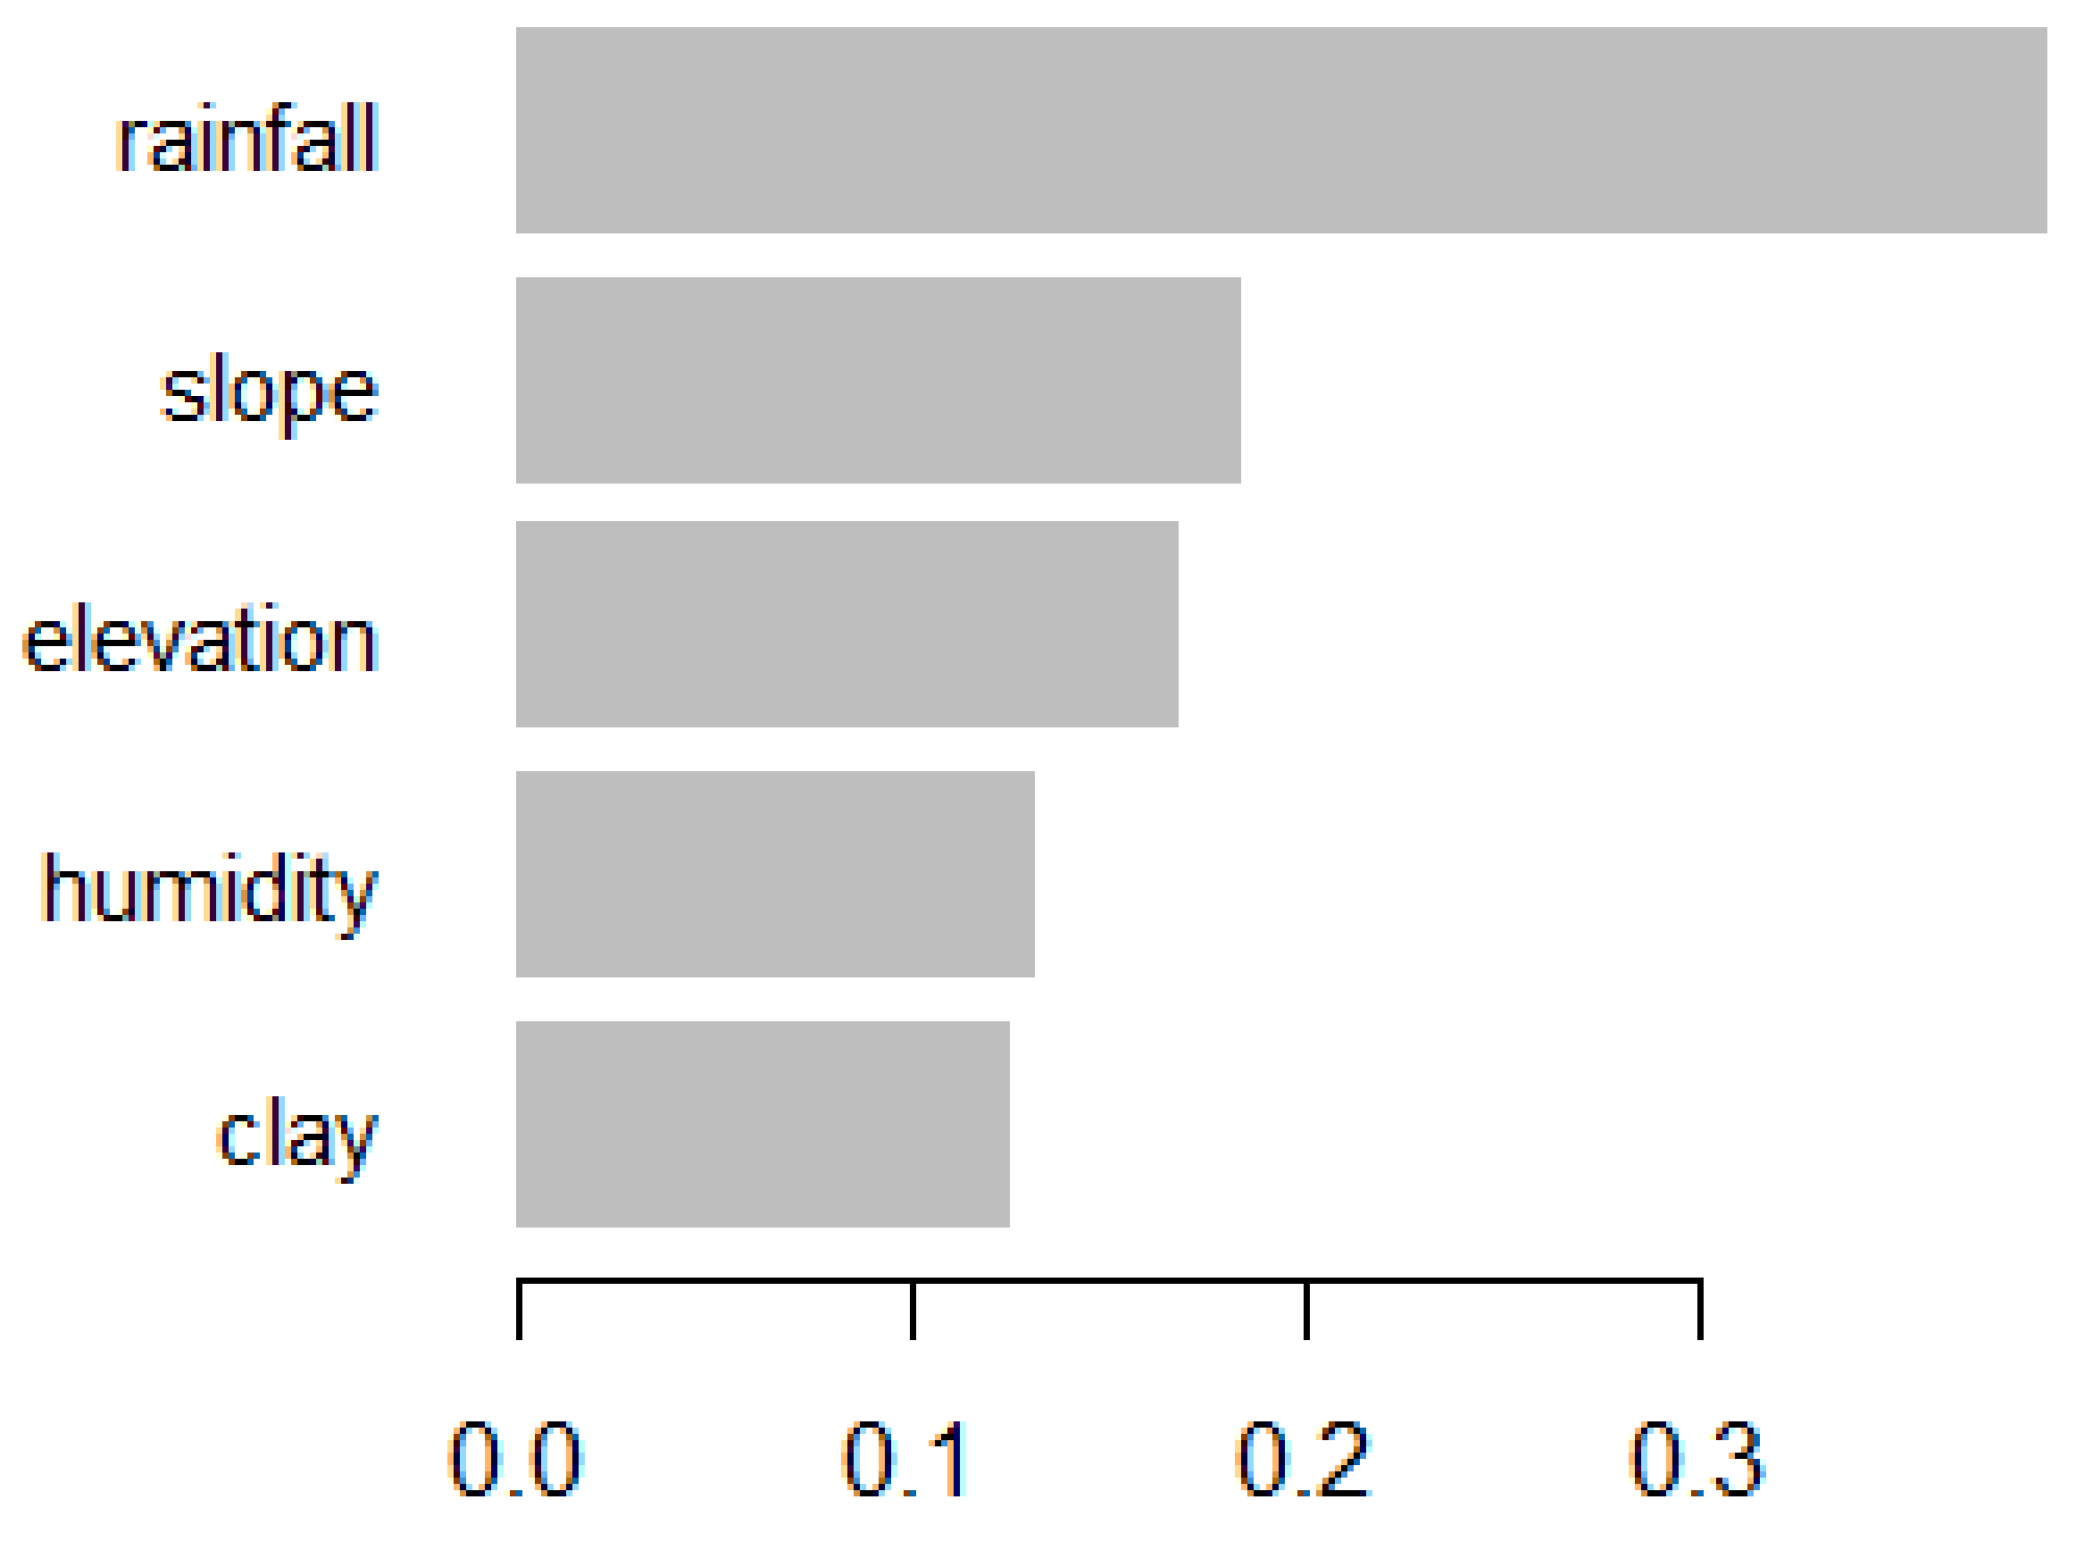
Figure 7.
Decision tree for XGboost prediction.
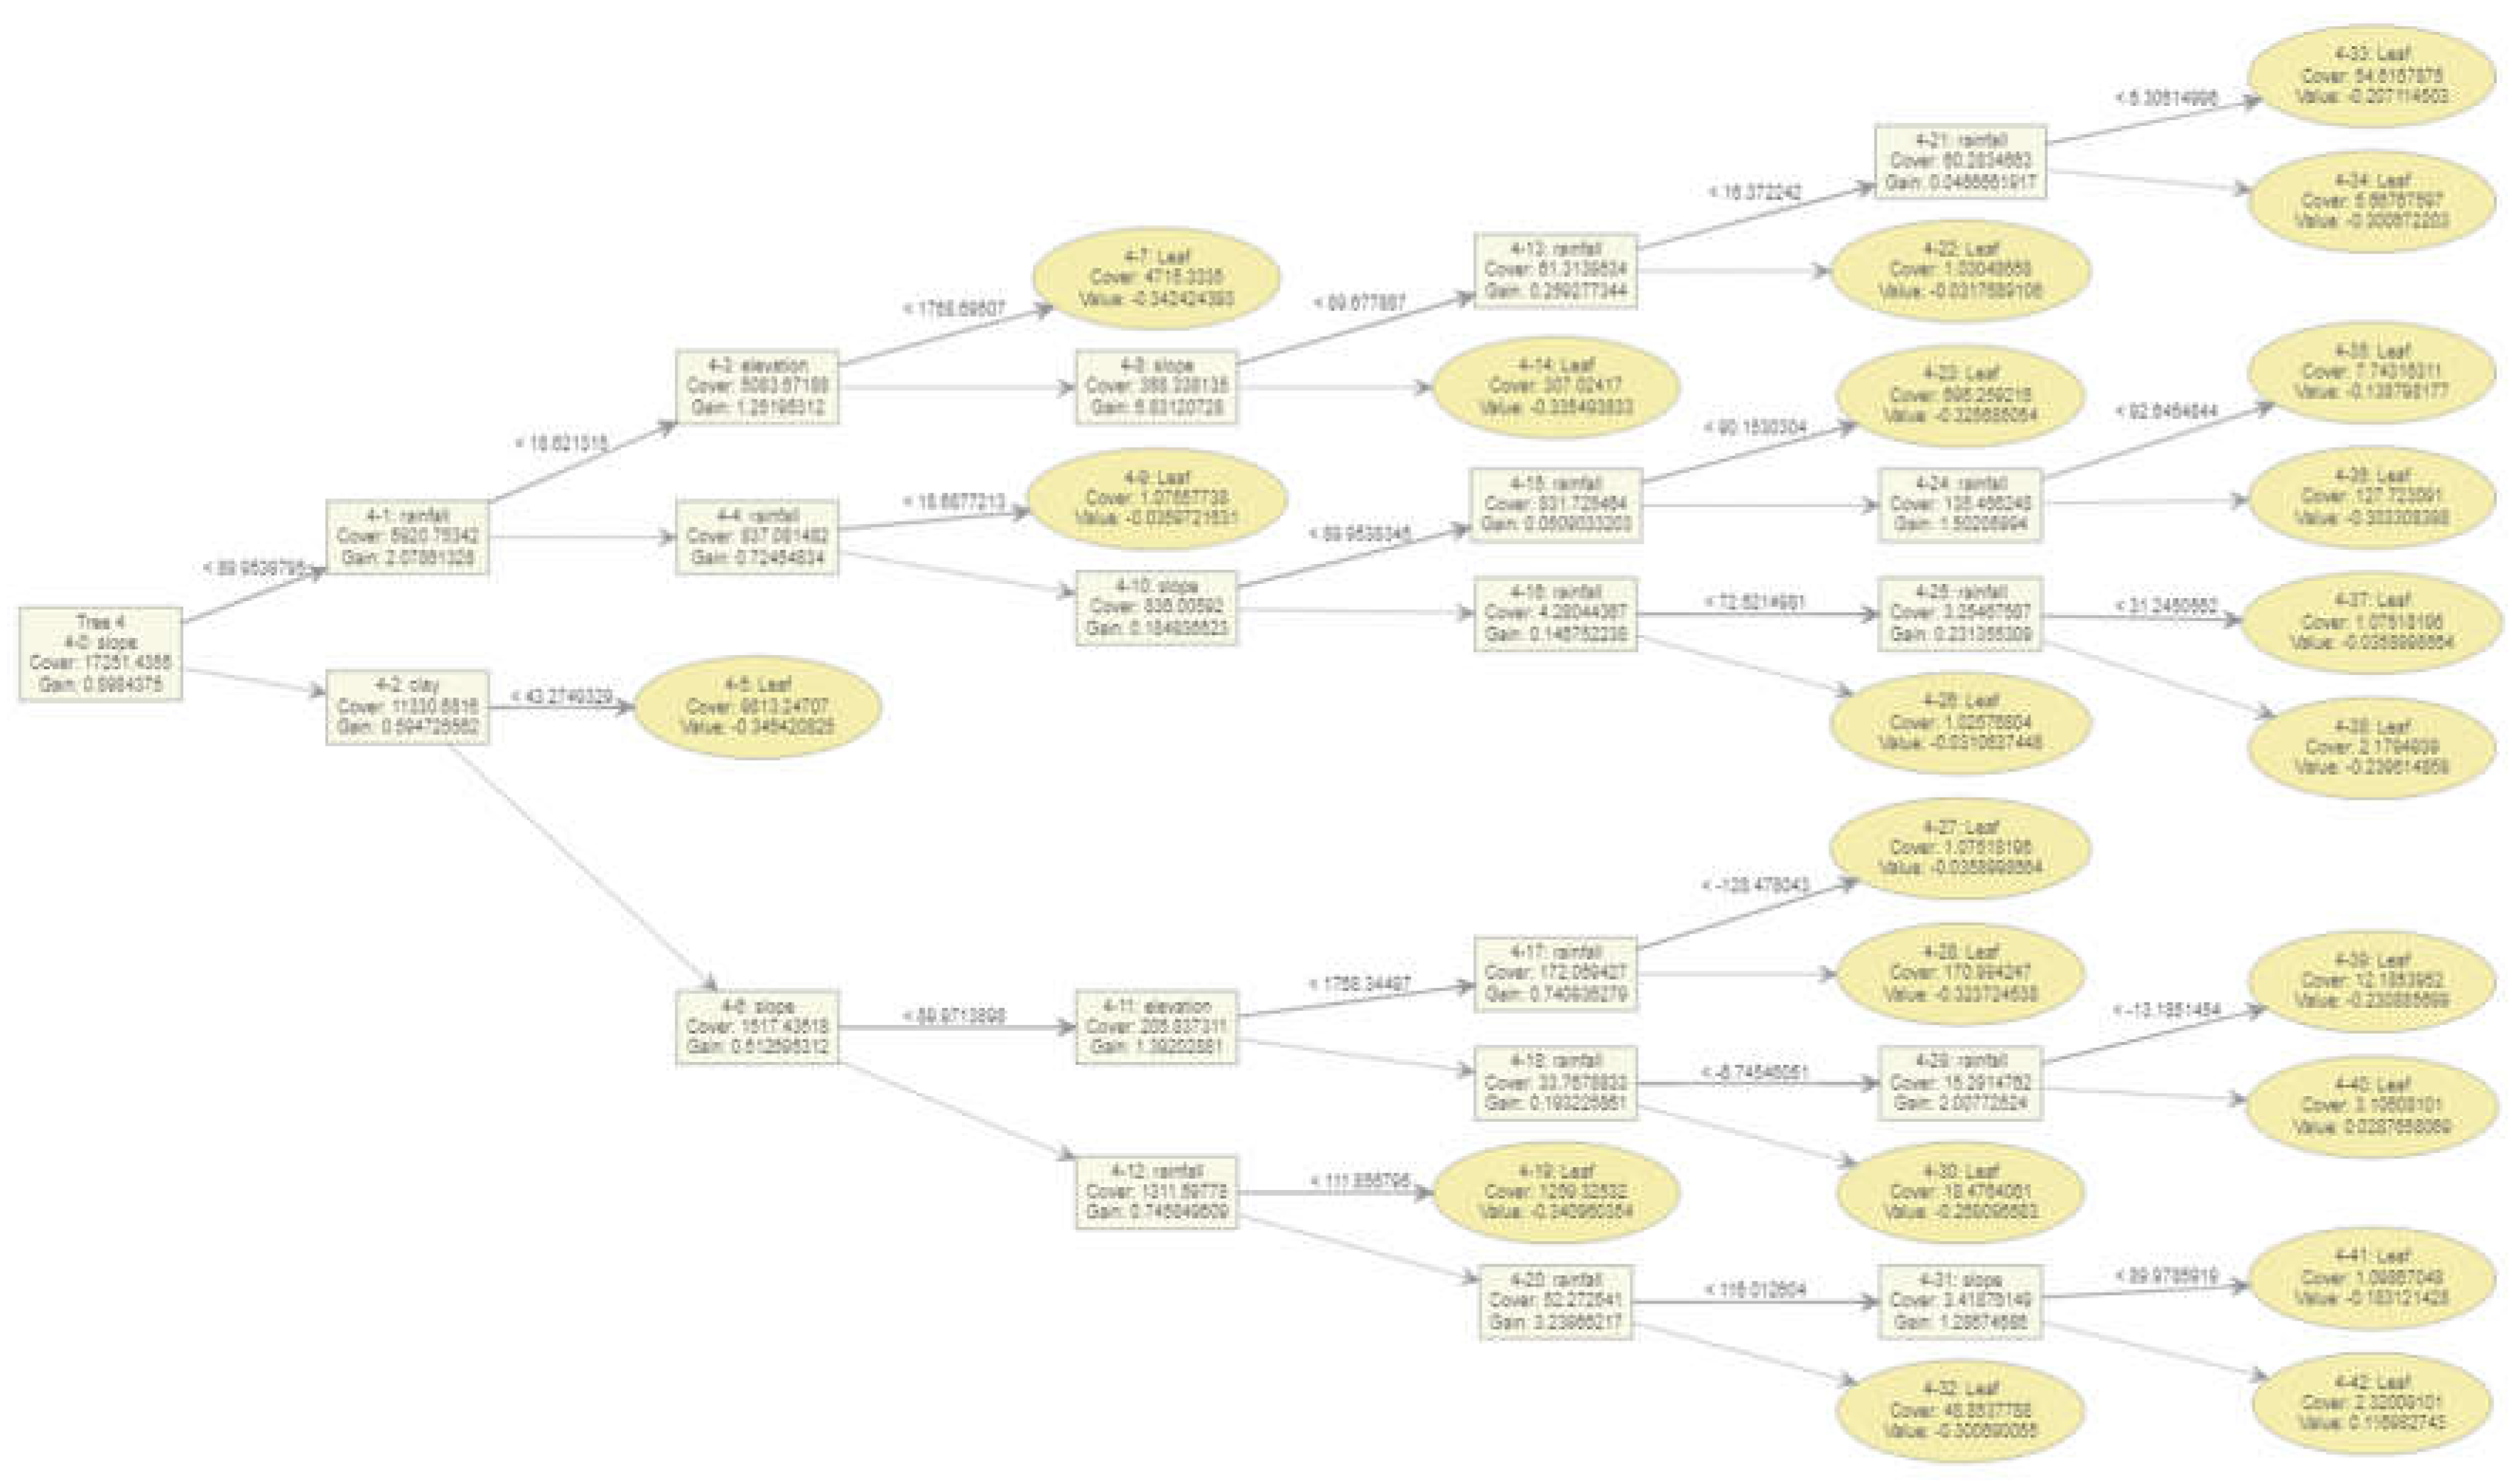
Figure 7.
the AUC-ROC Plot for the xgboost model.
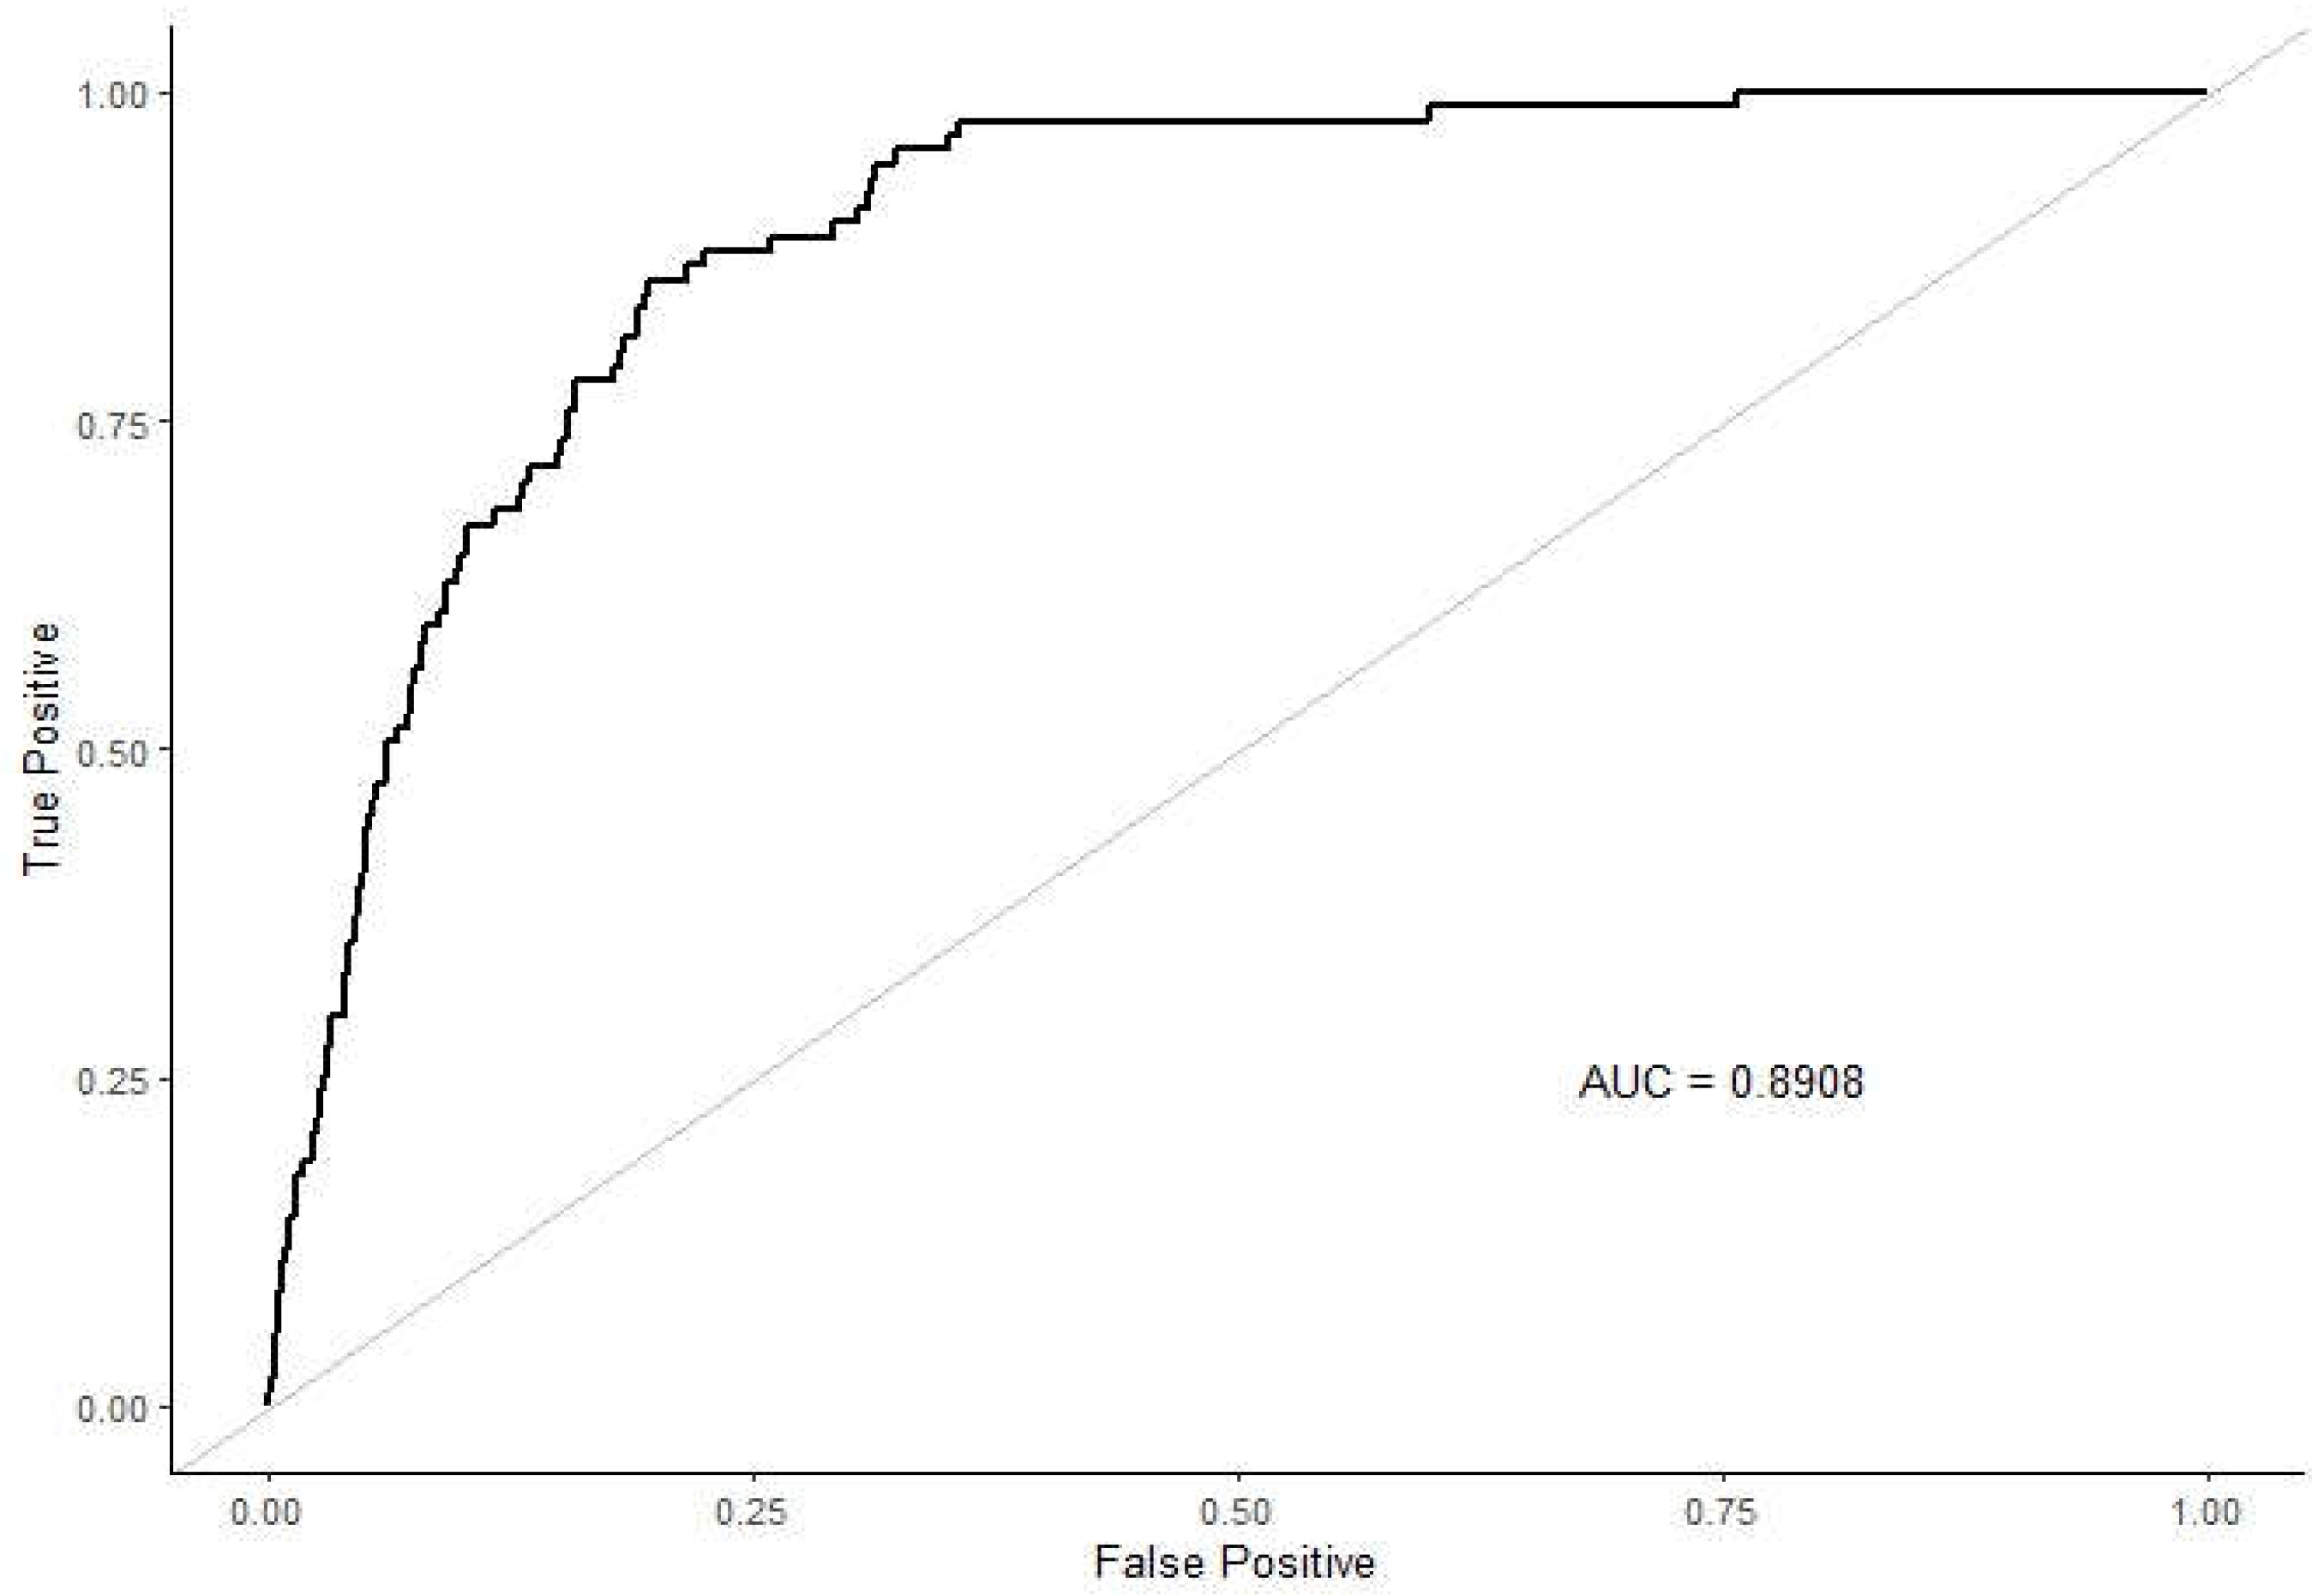
Figure 8.
the predicted vs actual RVF cases by XGboost.
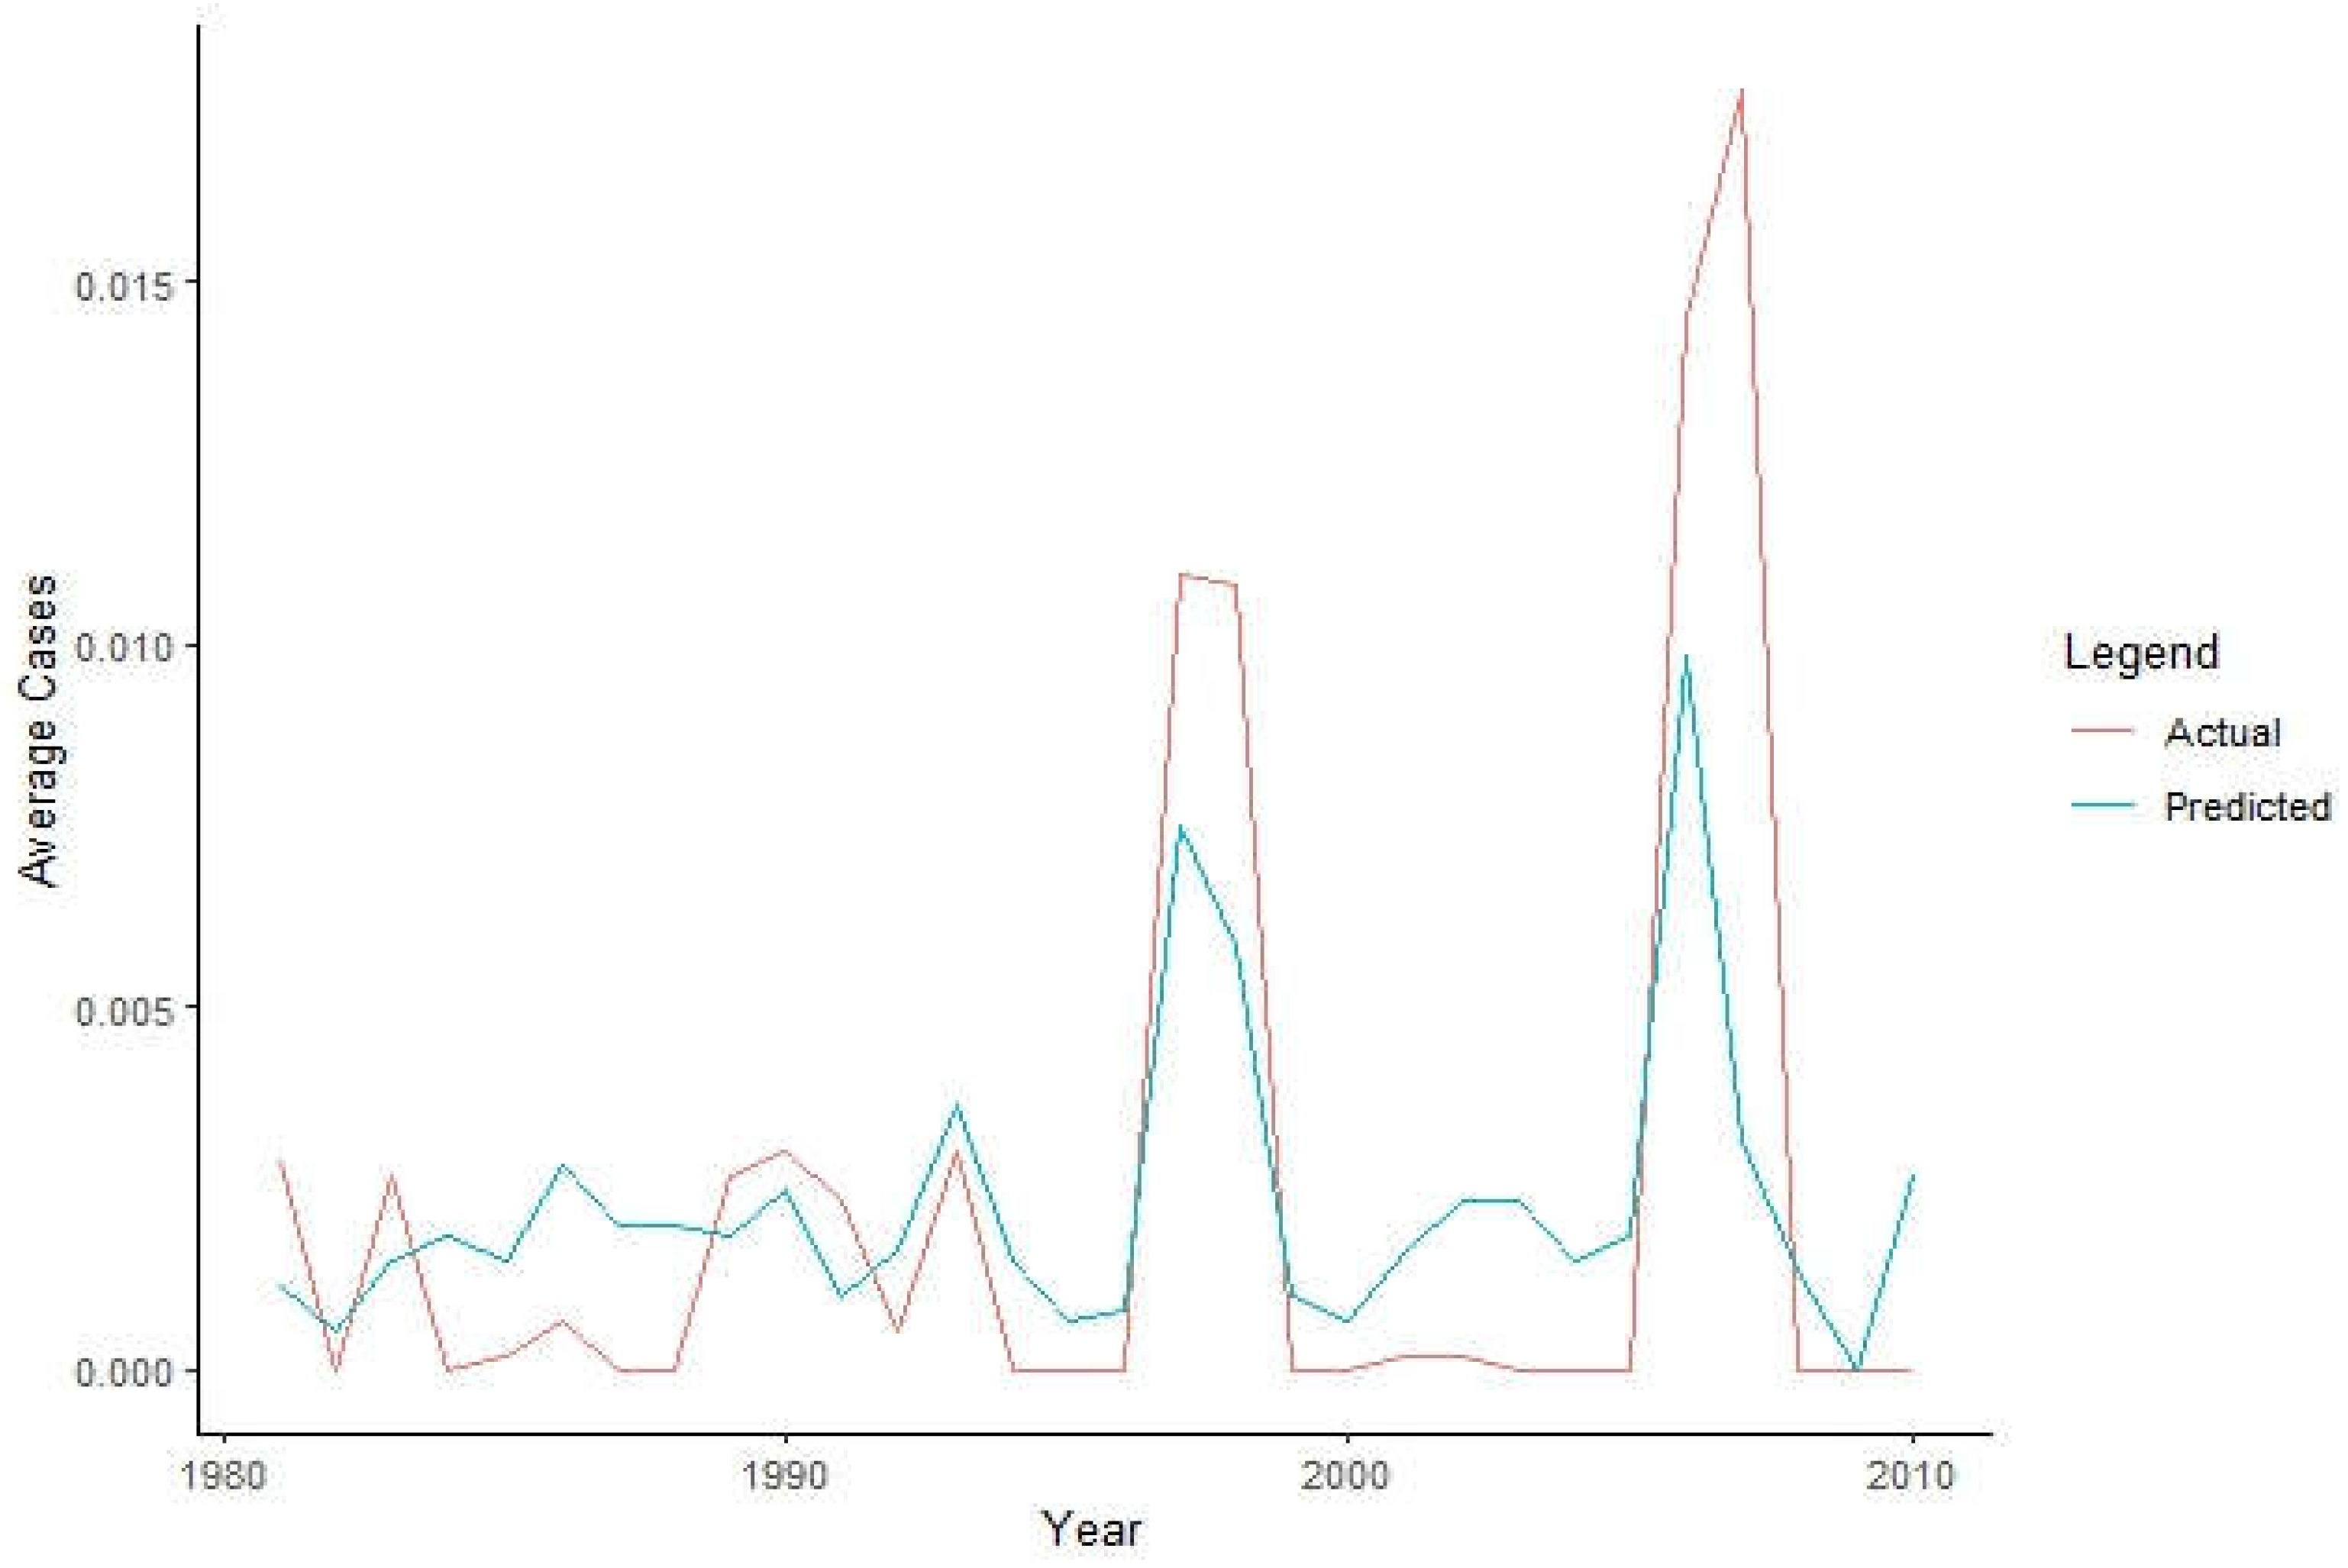
Table 3.
Example of correlation matrix for 2 variables with (2x2) matrix.
| X | Y | |||||||||||
| X | 1 | A1 | ||||||||||
| Y | A1 | 1 | ||||||||||
| divid | province | district | division | Year | month | rainfall | elevation | slope | clay | humidity | Rift Valley Cases | |
| <dbl> | <chr> | <chr> | <chr> | <dbl> | <chr> | <dbl> | <dbl> | <dbl> | <dbl> | <dbl> | <dbl> | |
| 30402 | COAST | MOMBASA | KISAUNI | 1981 | November | -0.42498 | 19.2501 | 89.9114 | 25.49474 | 74 | 1 | |
| 30402 | COAST | MOMBASA | KISAUNI | 1981 | August | 2.004479 | 19.2501 | 89.9114 | 25.49474 | 74 | 1 | |
| 40415 | EASTERN | MAKUENI | KIBWEZI | 1981 | September | -0.36554 | 795.179 | 89.95998 | 28.94722 | 60.01293 | 1 | |
| 40415 | EASTERN | MAKUENI | KIBWEZI | 1981 | August | 0.162332 | 795.179 | 89.95998 | 28.94722 | 60.01293 | 1 | |
| 40410 | EASTERN | MAKUENI | WOTE | 1981 | October | 0.186819 | 1106.94 | 89.96423 | 29.74337 | 60.76267 | 1 | |
| 30607 | COAST | TANA RIVER | KIPINI | 1981 | November | -1.18525 | 7.46866 | 86.8385 | 28.83464 | 71.42221 | 0 | |
| 30607 | COAST | TANA RIVER | KIPINI | 1981 | May | -0.87476 | 7.46866 | 86.8385 | 28.83464 | 71.42221 | 0 | |
| 30607 | COAST | TANA RIVER | KIPINI | 1981 | April | -0.64792 | 7.46866 | 86.8385 | 28.83464 | 71.42221 | 0 | |
Source: R-data frame view.
Table 4.
Correlation matrix of variables used.
| Rainfall | elevation | slope | clay | humidity | Rift Valley Cases | |
| Rainfall | 1.00000 | 0.03676 | 0.01690 | 0.02328 | 0.00701 | 0.02903 |
| elevation | 0.03676 | 1.00000 | 0.39360 | 0.52932 | 0.17852 | 0.01063 |
| slope | 0.01690 | 0.39360 | 1.00000 | 0.24390 | 0.05195 | 0.01503 |
| clay | 0.02328 | 0.52932 | 0.24390 | 1.00000 | 0.20376 | 0.00301 |
| humidity | 0.00701 | 0.17852 | 0.05195 | 0.20376 | 1.00000 | 0.01407 |
| Rift Valley Cases | 0.02903 | 0.01063 | 0.01503 | 0.00301 | 0.01407 | 1.00000 |
Table 5.
feature importance for climatic data.
| Feature | Gain | Cover | Frequency |
|---|---|---|---|
| rainfall | 0.38974 | 0.34284 | 0.47834 |
| elevation | 0.16892 | 0.15889 | 0.15443 |
| slope | 0.16229 | 0.23917 | 0.12524 |
| clay | 0.14086 | 0.16121 | 0.11817 |
| humidity | 0.13819 | 0.09789 | 0.12382 |
Table 7.
Evaluation metric for the XGboost model.
| EVALUATION METRIC | SCORE |
| Accuracy | 0.9974 |
| Precision | 0.9975 |
| Recall | 0.9999 |
| AUC | 0.8908 |
Disclaimer/Publisher’s Note: The statements, opinions and data contained in all publications are solely those of the individual author(s) and contributor(s) and not of MDPI and/or the editor(s). MDPI and/or the editor(s) disclaim responsibility for any injury to people or property resulting from any ideas, methods, instructions or products referred to in the content. |
© 2024 by the authors. Licensee MDPI, Basel, Switzerland. This article is an open access article distributed under the terms and conditions of the Creative Commons Attribution (CC BY) license (http://creativecommons.org/licenses/by/4.0/).
Copyright: This open access article is published under a Creative Commons CC BY 4.0 license, which permit the free download, distribution, and reuse, provided that the author and preprint are cited in any reuse.


