2. Materials and Methods
2.1. Study Population and Design
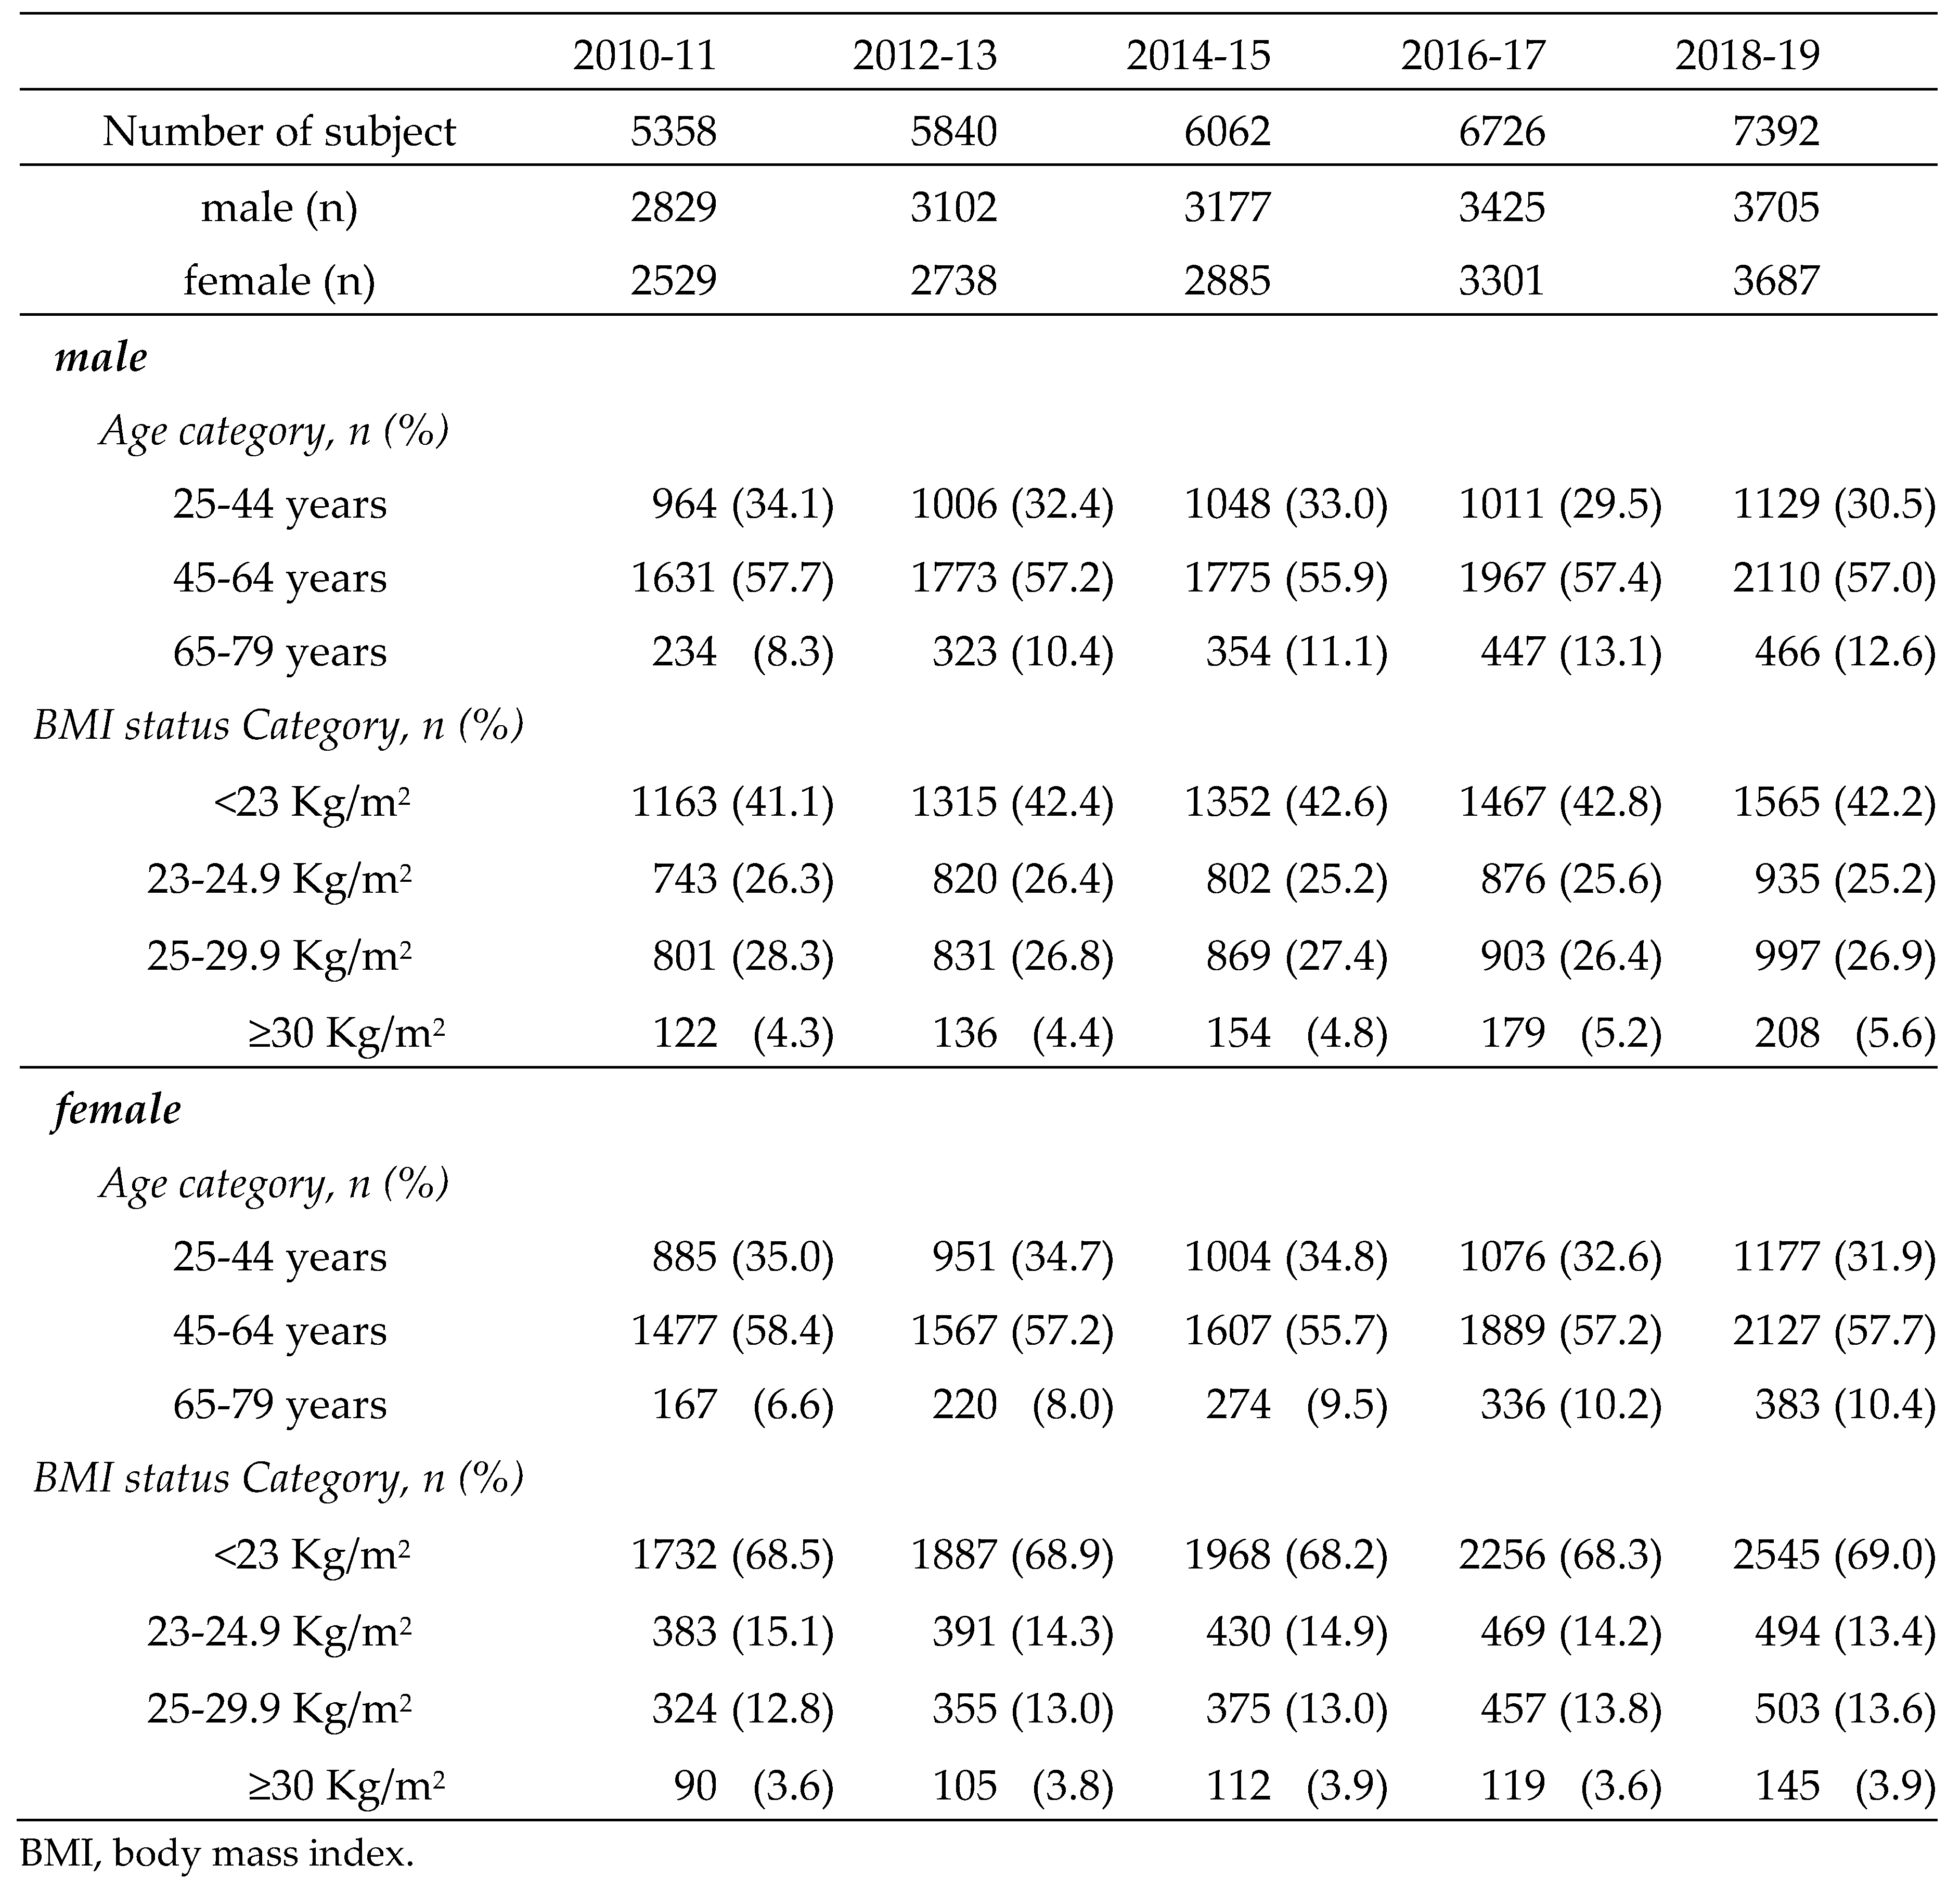
Japanese individuals aged 25-79 years who underwent physical examinations, physiological examinations, abdominal ultrasonography (US), and blood screening examinations at the Sasaki Foundation Shonan Health Screening Center in the Kanto region during the fiscal years (FYs) 2010-2019 (April to March of the following year) were included in this study. Participants were included if they met the following criteria: (1) available BMI data, (2) available fasting blood glucose or glycated hemoglobin (HbA1c) data, and (3) known alcohol intake. Of the 48,225 examinees, 31,378 (16,238 males and 15,140 females) met the inclusion criteria. The characteristics of the subjects are shown in
Table 1. The study protocol was approved by the Human Ethics Review Committee of the Sasaki Foundation (Tokyo, Japan) (certification no. 19728). Informed consent was obtained on an opt-out basis.
MASLD was diagnosed according to the NAFLD Nomenclature Consensus Group criteria [
1]. High waist circumference (HWC) was defined as ≥ 85 cm for males and ≥ 90 cm for females, according to the Japanese metabolic syndrome diagnostic criteria [
4]. Age was classified into three categories according to the criteria of the Ministry of Health, Labour and Welfare: 25-44 years as mature age, 45-64 years as middle age, and ≥ 65 years as old age. BMI was classified into the following categories according to the recommendation of the Western Pacific Region of the World Health Organization criteria that pertain to obesity: < 23.0 kg/m
2 as normal, ≥ 23.0 kg/m
2 as overweight, 23-24.9 kg/m
2 as pre-obese (pre-Ob), 25-29.9 kg/m
2 as obese-I (Ob-I), and ≥ 30 kg/m
2 as obese-II (Ob-II).
All lifestyle-related diseases (LRDs; hypertension, glucose metabolism disorders [GMDs], and dyslipidemia) diagnoses were defined according to the International Consensus Group criteria for metabolic dysfunction [
1] and were defined as those who were currently being treated with medications or met the following criteria: hypertension, defined as systolic blood pressure > 130 mmHg and/or diastolic blood pressure > 85 mmHg; GMDs, defined as fasting plasma glucose (FPG) > 100 mg/dL or HbA1c > 5.7%; type 2 diabetes mellitus (DM) (T2DM), defined as FPG > 126 mg/dL or HbA1c > 6.5%; prediabetes, defined as a FPG ≥ 100 mg/dL and < 126 mg/dL or HbA1c ≥ 5.7% and < 6.5% [
5]; and dyslipidemia, defined as triglyceride levels of ≥ 150 mg/dL or a high-density lipoprotein cholesterol level of < 40 mg/dL for males and < 50 mg/dL for females.
2.2. Physical Examinations and Serum Biochemistry Analyses
Body weight and height were obtained for both sets of participants, and BMI was calculated. Skilled nurses measured waist circumference at the navel level while the participants were in a standing position. Venous blood samples were obtained from all participants from 8-10 AM following a 12-h overnight fast.
2.3. Protocol for Abdominal US and Definition of Fatty Liver
All participants underwent abdominal US to assess steatotic livers. The liver parenchyma of all patients was examined using a conventional convex array transducer. The presence of steatotic change was defined as increased echogenicity of the liver parenchyma compared with the renal parenchyma (bright liver and liver-kidney contrast), deep US attenuation in the right lobe of the liver (deep attenuation), and/or poor visualization of the hepatic vein (vascular blurring); the first two were considered definitive criteria, while the latter two were considered necessary. The US systems used were the Aloka SSDα5, Aloka Pro Soundα7, Aloka Pro Soundα7, and Aloka ARIETTA E50 (Hitachi Aloka Medical, Tokyo, Japan) with 3.5 MHz convex array transducers. Experienced sonographers trained by gastroenterologists performed all examinations. The technical parameters were adjusted for each subject using a standard US protocol. A board-certified gastroenterologist from the Japanese Society of Gastroenterology reviewed the images and diagnosed steatotic liver without referring to any other personal data of the participant.
2.4. Dietary Data Source
We used dietary data from the National Health and Nutritional Survey (NHNS) of Japan conducted by the National Institute of Health and Nutrition [
6] The NHNS is a cross-sectional household interview and examination survey conducted annually since 1945 by local health centers under the supervision of the Ministry of Health, Labour and Welfare of Japan [
7]. Details of the survey design have been described elsewhere [
8]. This survey is conducted annually throughout Japan in November.
The number of households participating in the survey between 2010 and 2019 ranged from 2,836 (2019) to 12,750 (2012), with a response rate of approximately 50%. A total of 118,840 individuals participated in the survey between 2010 and 2019. This study used information from 98,403 individuals (4,927-26,726/year; average 9,840/year) aged ≥ 20 years in the NHNS survey to match the age distribution of the study population. Specifically, the number of people in each age group in the NHNS was converted to the number in the study population and the mean dietary nutrient level for each year was recalculated.
2.5. Statistical Analysis
Trend analyses of the prevalence of MASLD, LRDs, obesity, HWC, dietary nutrient intake, and MASLD were performed using Spearman’s rank correlation, and comparisons between MASLD and non-MASLD were performed by the Chi-square and student’s t-test with Stat Flex, version 7 (Artec, Osaka, Japan). A p value < 0.05 was considered statistically significant.
In addition, scatter plots were generated for the correlation of dietary nutrient intake and GMDs using Microsoft Excel, version 2403 (Microsoft Corporation, Redmond, WA, USA). The coefficients of determination (R2) were calculated, and the coefficients were interpreted according to Schober et al. [
9].
4. Discussion
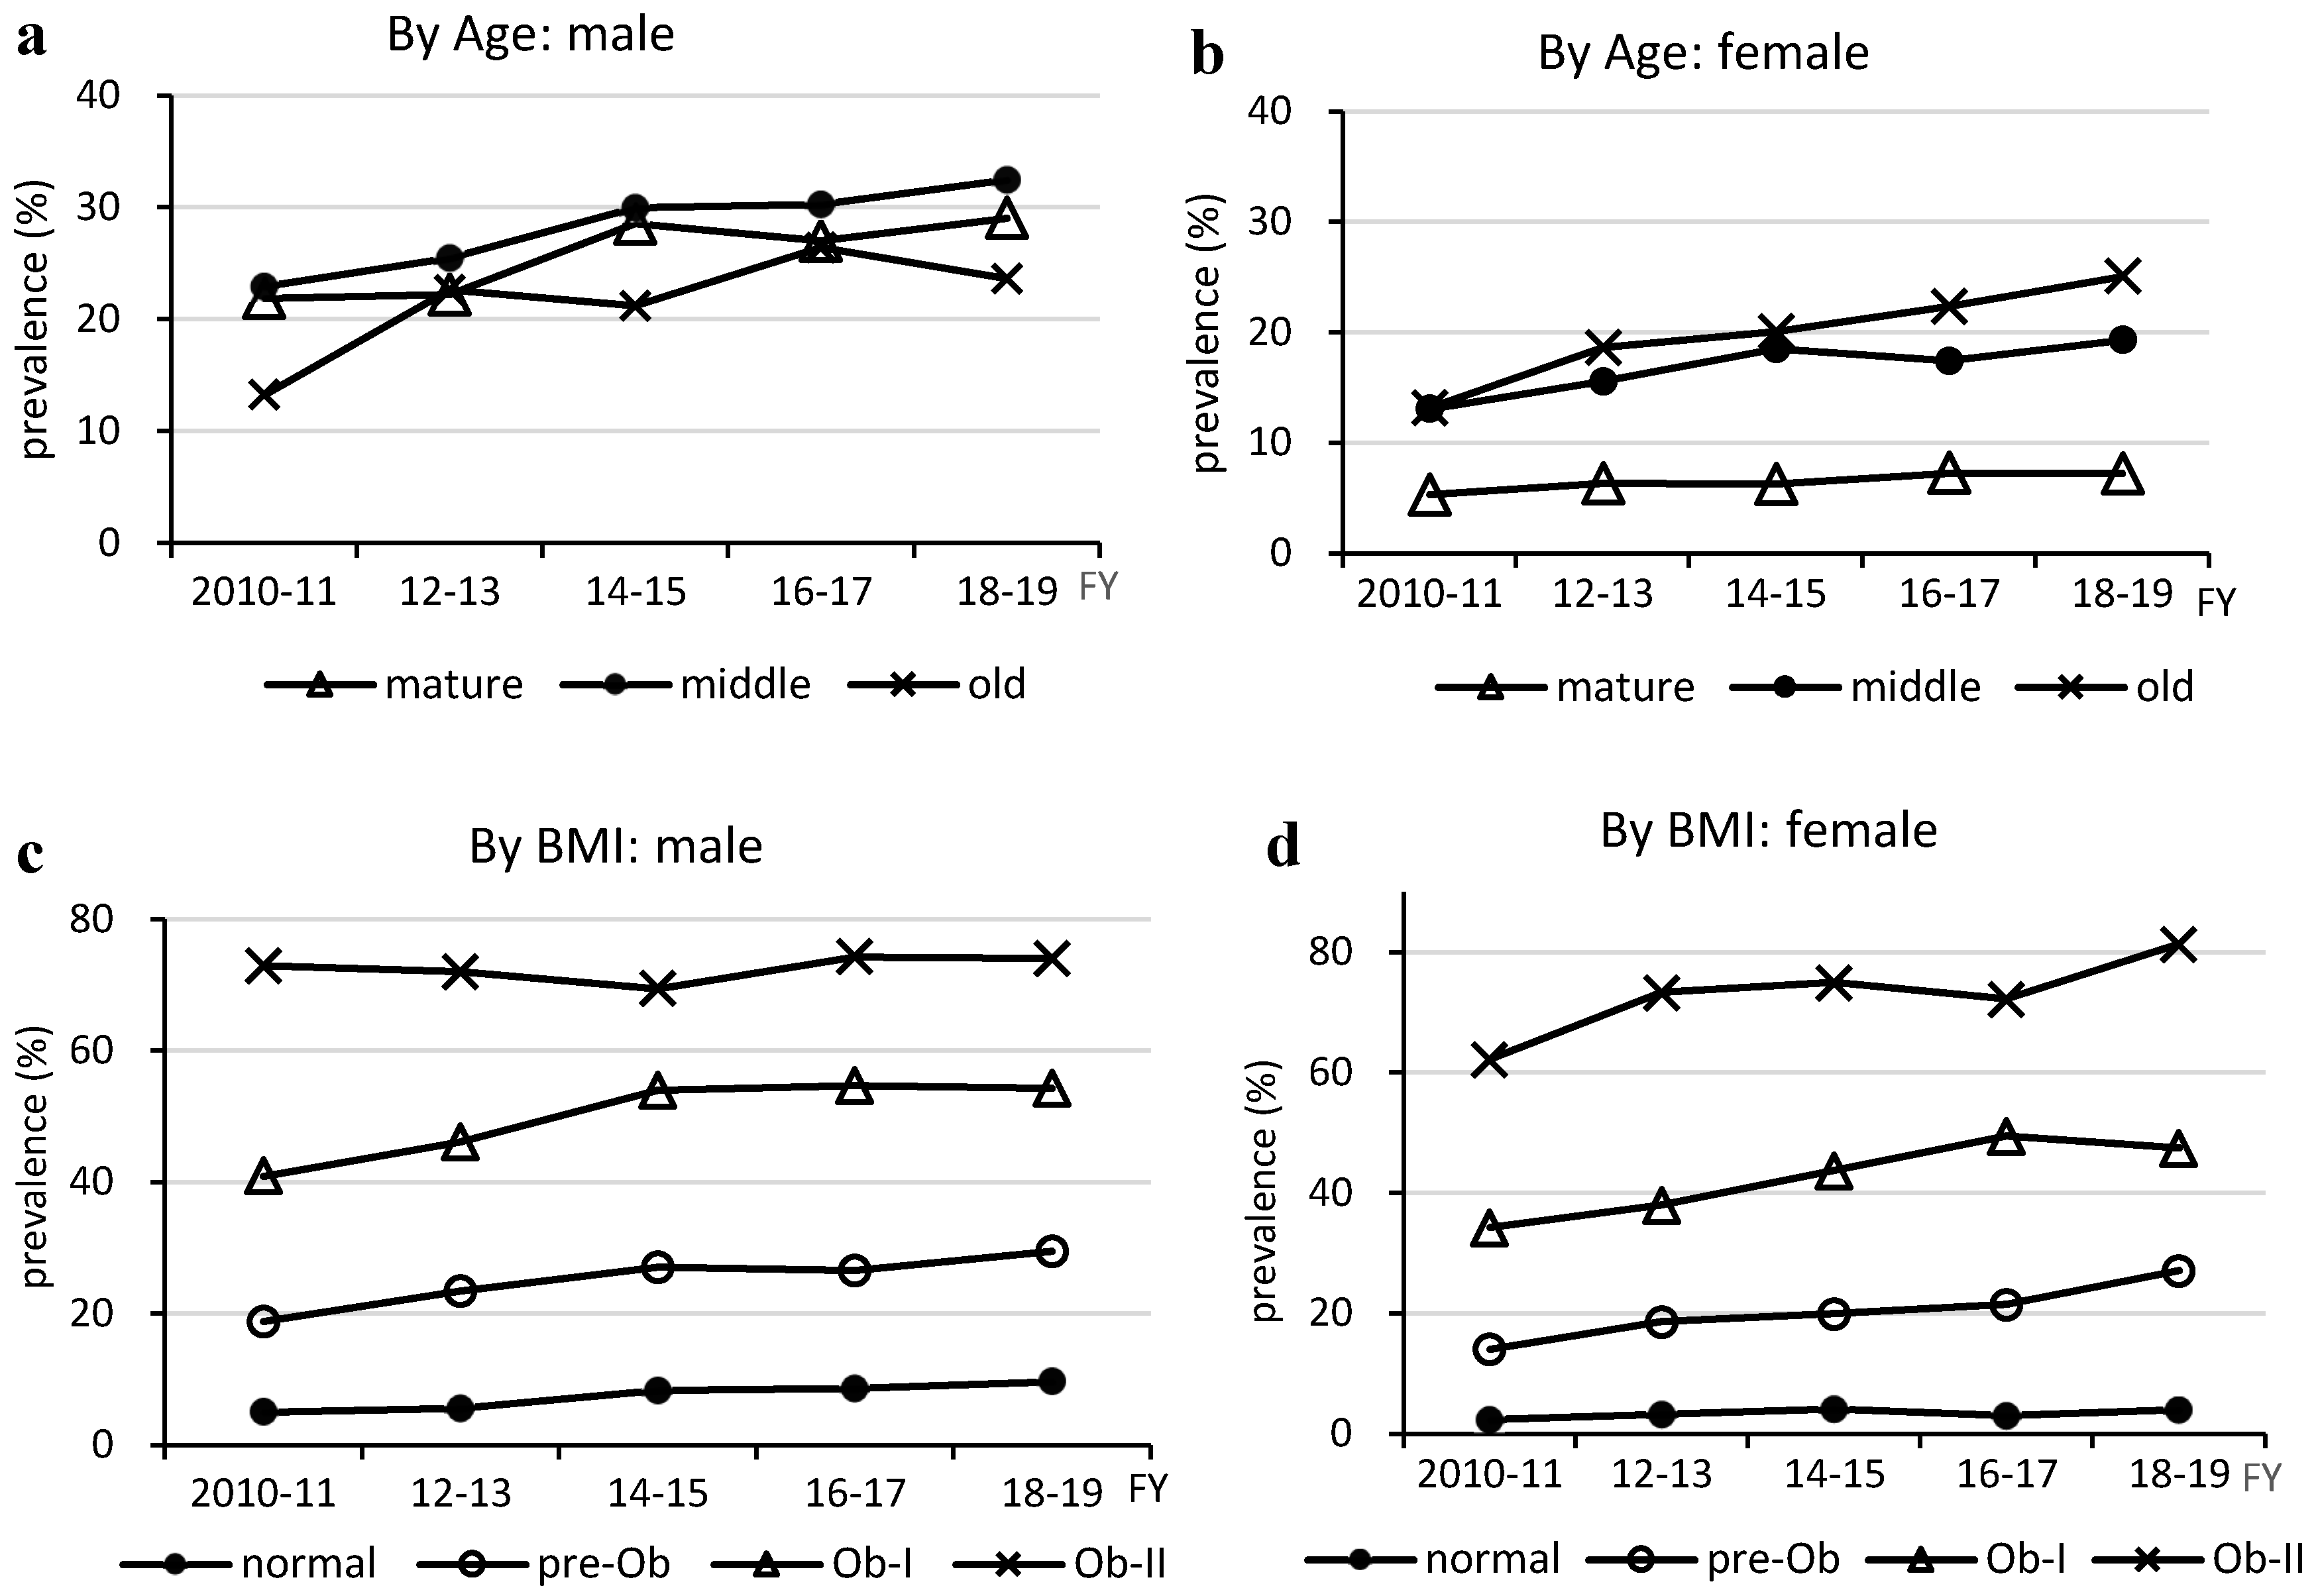
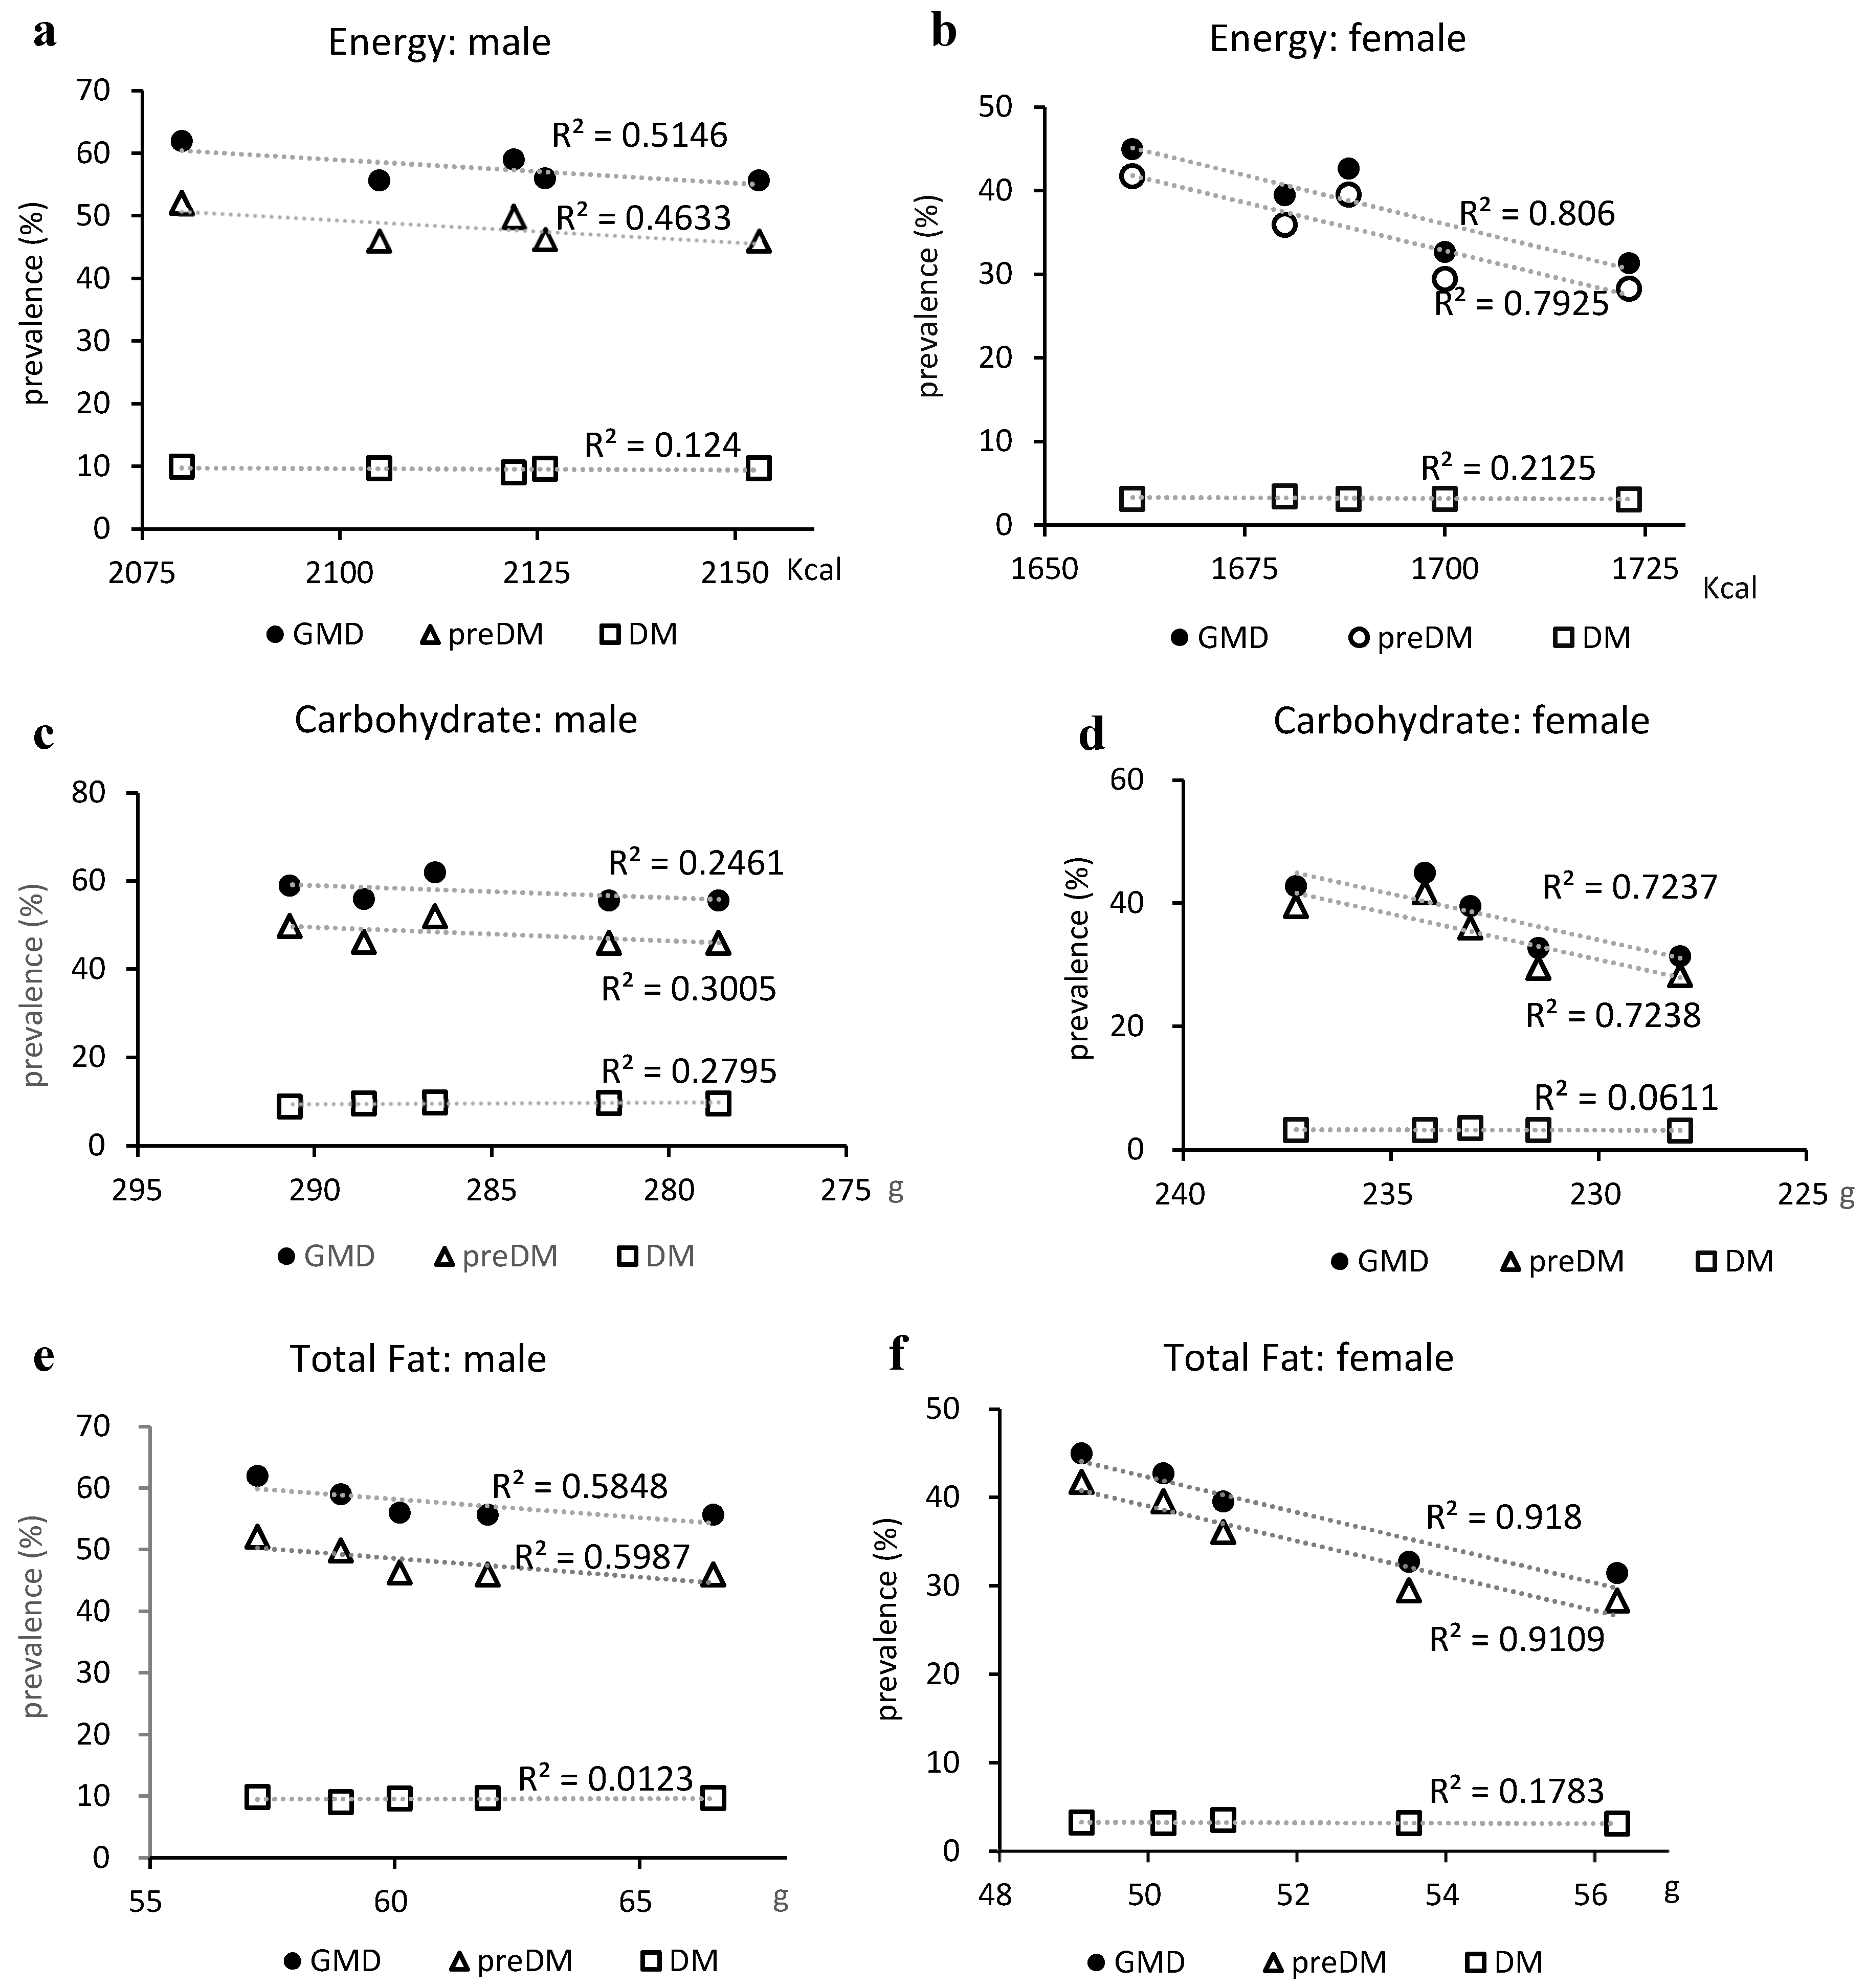
This study revealed the following points. First, the prevalence of MASLD increased in almost all age and BMI groups of both sexes before the COVID-19 pandemic, which was associated with an increase in the prevalence of steatotic liver. Second, both males and females with MASLD-related LRDs exhibited a reduced prevalence of prediabetes. This was inversely correlated with the total fat and various fatty acid (FA) intakes in the national data. Third, MASLD was more prevalent in males than in individuals without MASLD, and individuals with MASLD were older and exhibited a higher prevalence of overweight HWC and LRDs than individuals without MASLD.
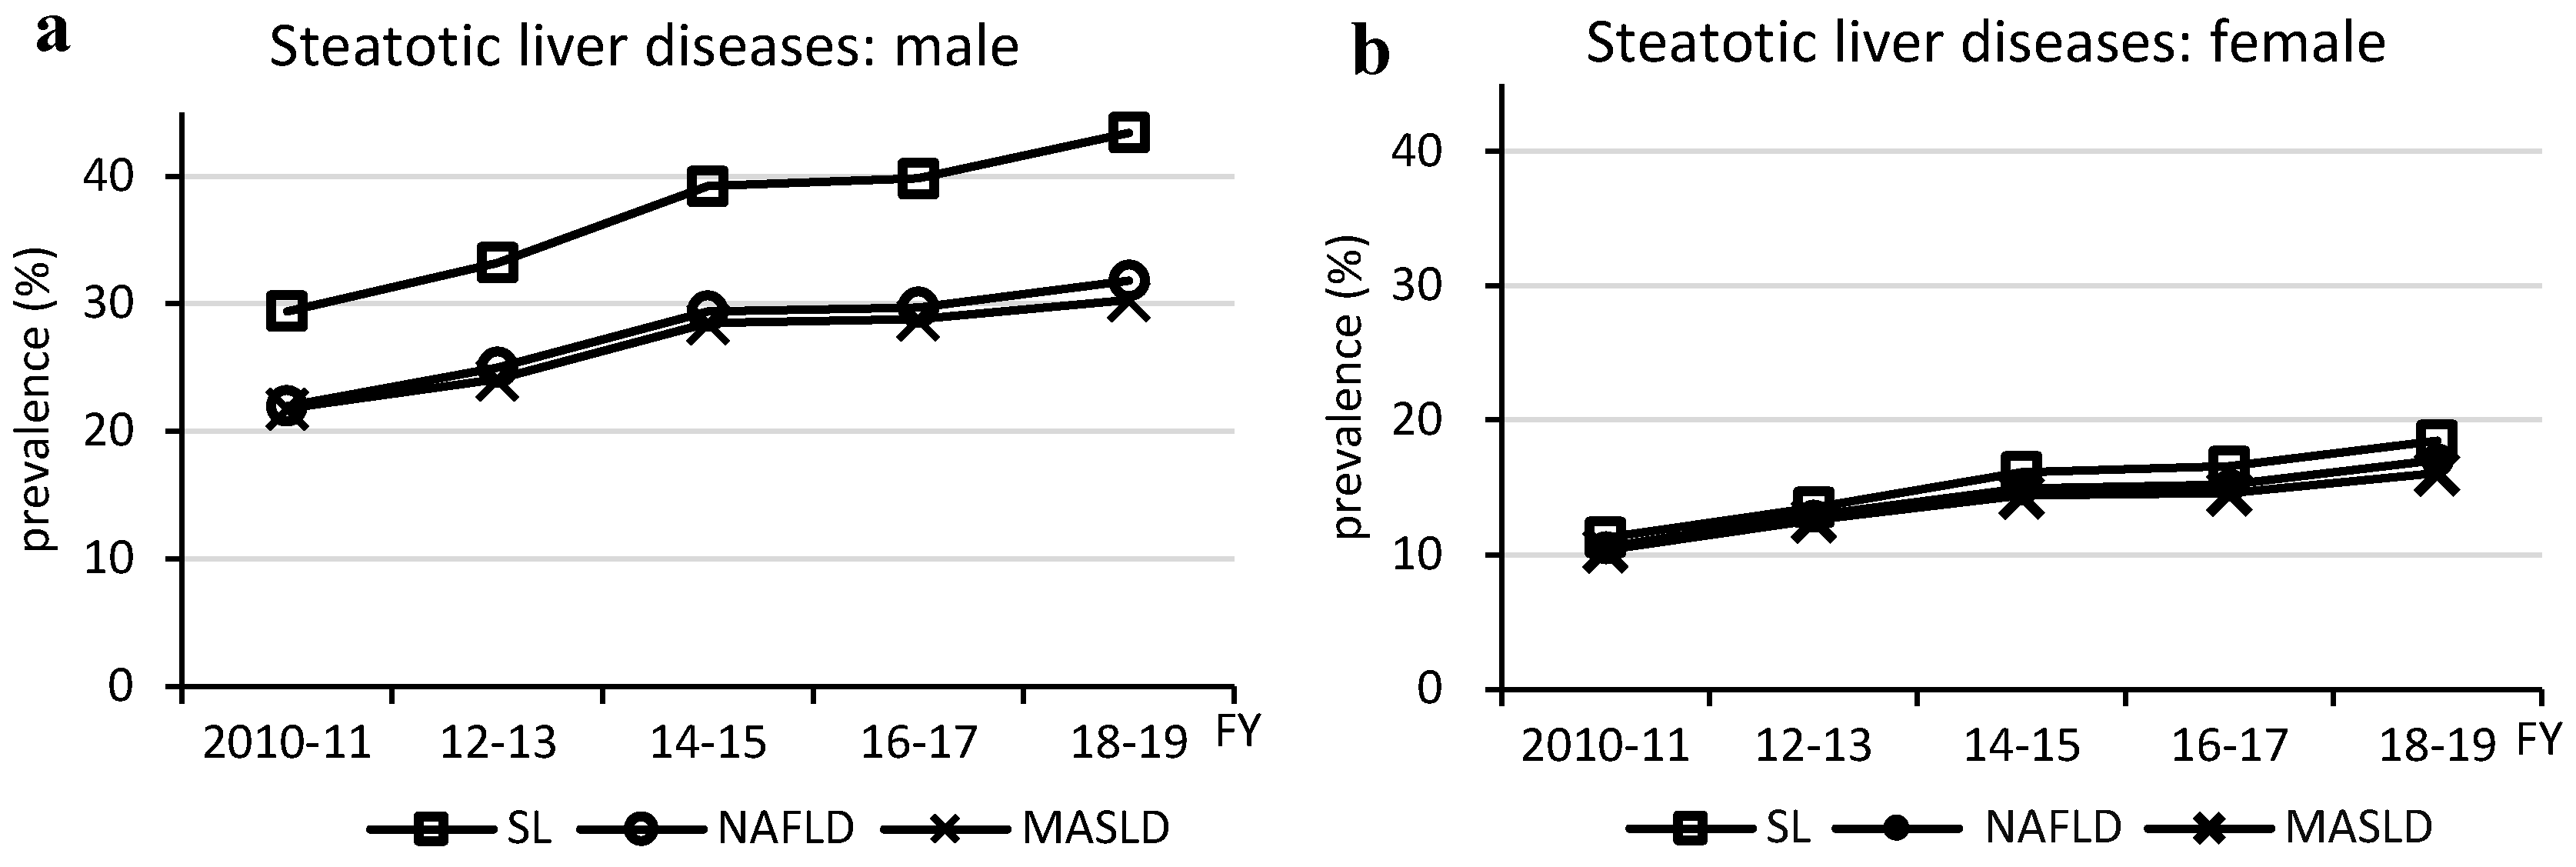
The prevalence of MASLD increased in almost all age and BMI groups as the prevalence of steatotic liver increased. In other words, MASLD is composed of multiple physical and metabolic factors, but no factors other than steatotic liver were found to be associated with the increased prevalence of MASLD. The MASLD prevalence trend was similar to that of NAFLD and steatotic liver, and as 96% of MASLD cases were NAFLD, the increase in the prevalence of MASLD was likely due to an increase in the prevalence of steatotic liver resulting from imbalanced fat intake, as previously reported [
10]. In this study, we also referred to national data on exercise habits; however, there was no statistical change in the percentage of habitual exercisers from 2010 to 2019. Therefore, dietary nutrition seemed to play a major role in the increase in the prevalence of steatotic liver and MASLD in both males and females, with little impact of exercise habits.
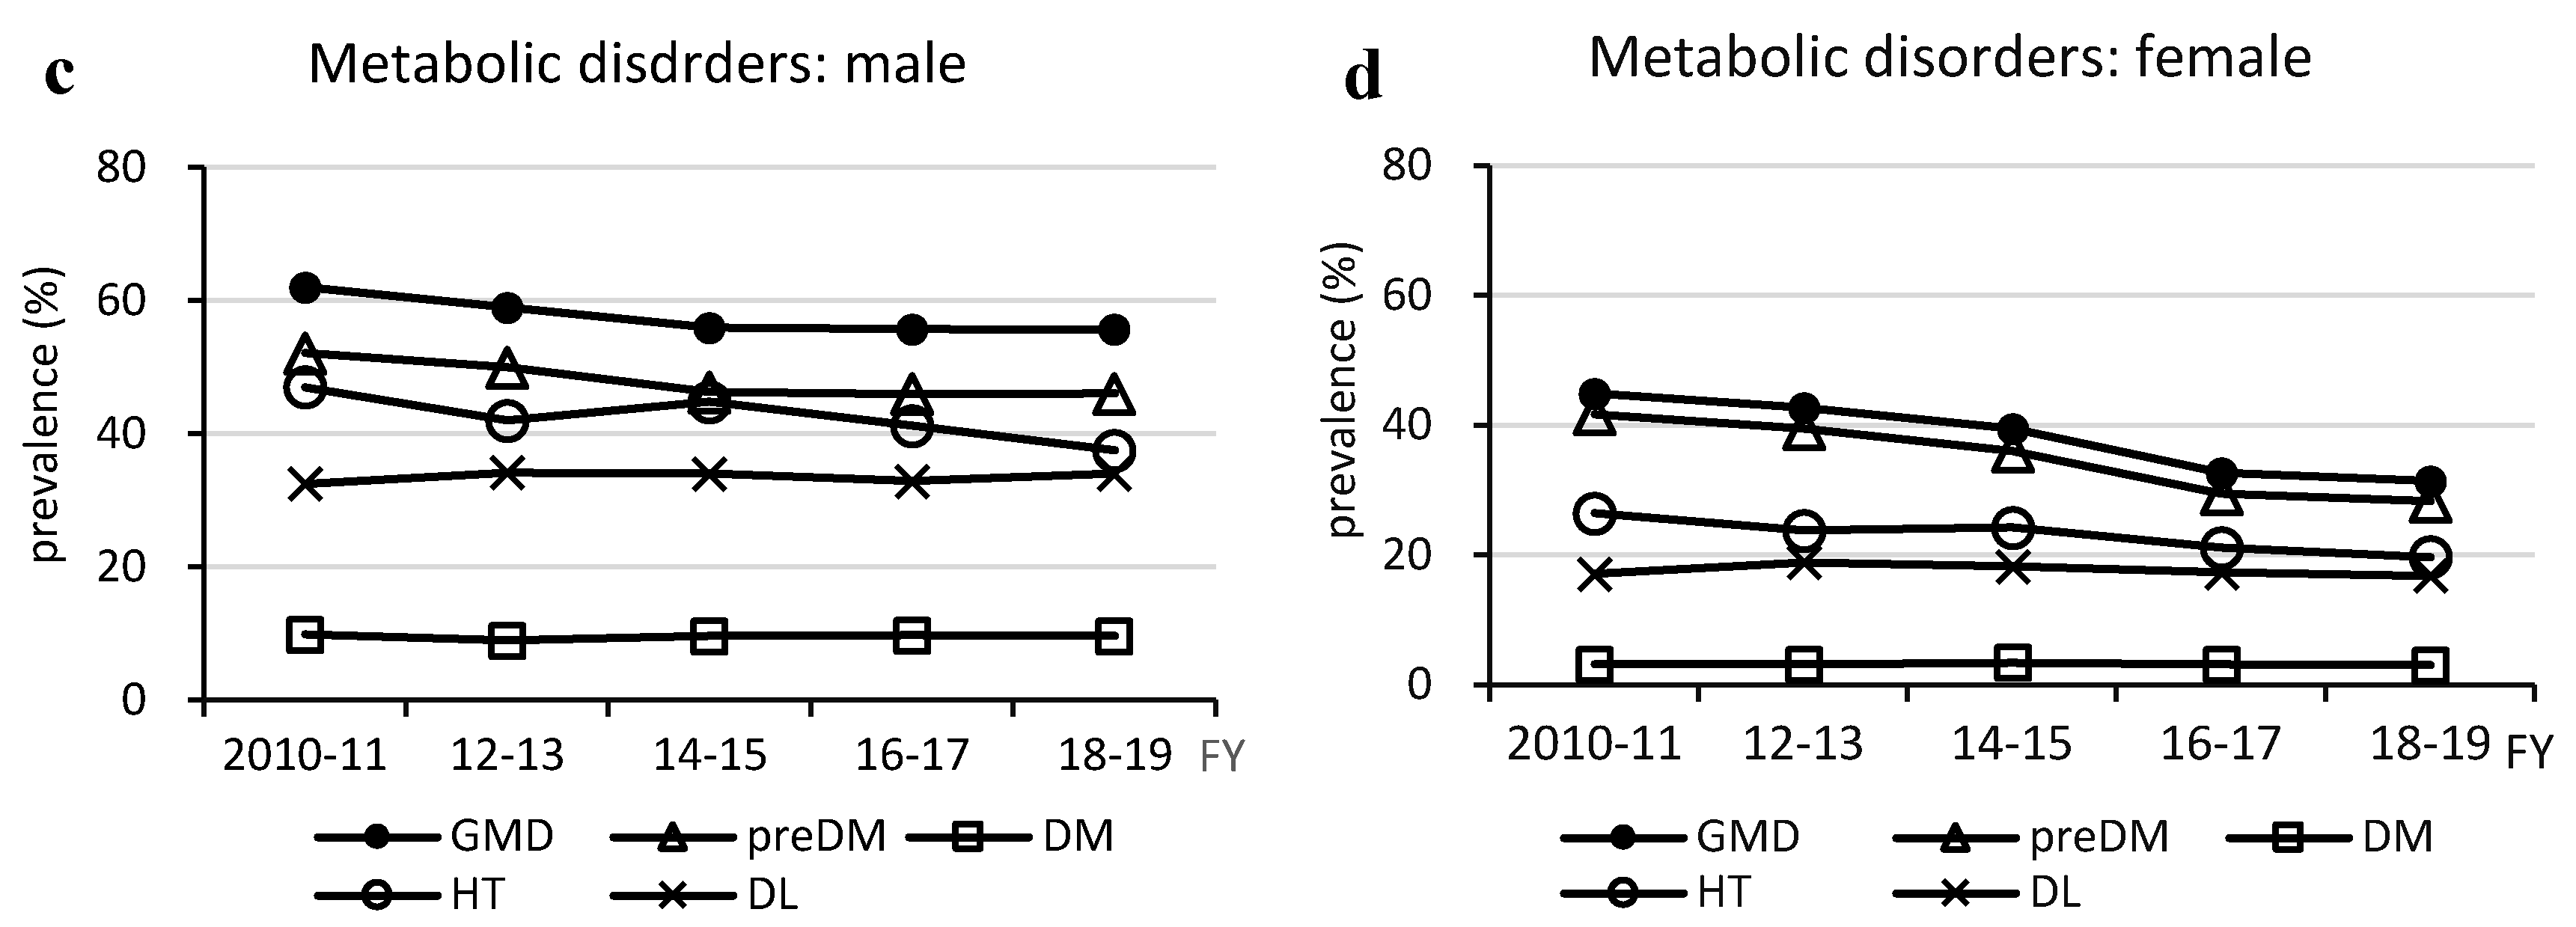
It is noteworthy that the prevalence of GMDs decreased despite an increase in the prevalence of MASLD in both males and females. The decrease in the prevalence of GMDs was due to a decrease in the prevalence of prediabetes in both sexes, whereas the prevalence of T2DM remained unchanged. However, the prevalence of DM in Japan slightly increased in males and decreased in females, from 12.6% to 13.8% in males and from 7.8% to 7.7% in females, in the 2009 and 2019 national surveys, respectively, as noted by Goto et al. [
11]. In addition, the World Bank Report [
12] showed that the prevalence of DM in Japan decreased from 7.7% in 2011 to 6.6% in 2021. Although our data were limited to one region and the majority (55.9-58.4%) of the total population throughout the study period was middle-aged, which differs from the age structure of the Japanese general population, we do not consider this result unique in terms of a decrease in the prevalence of prediabetes or GMDs. Liver steatosis and glucose intolerance are closely linked and are mutually promoting factors. Therefore, the increase in the prevalence of steatotic liver and decrease in the prevalence of GMDs are anomalous, and we focused on dietary changes in the Japanese population as the cause.
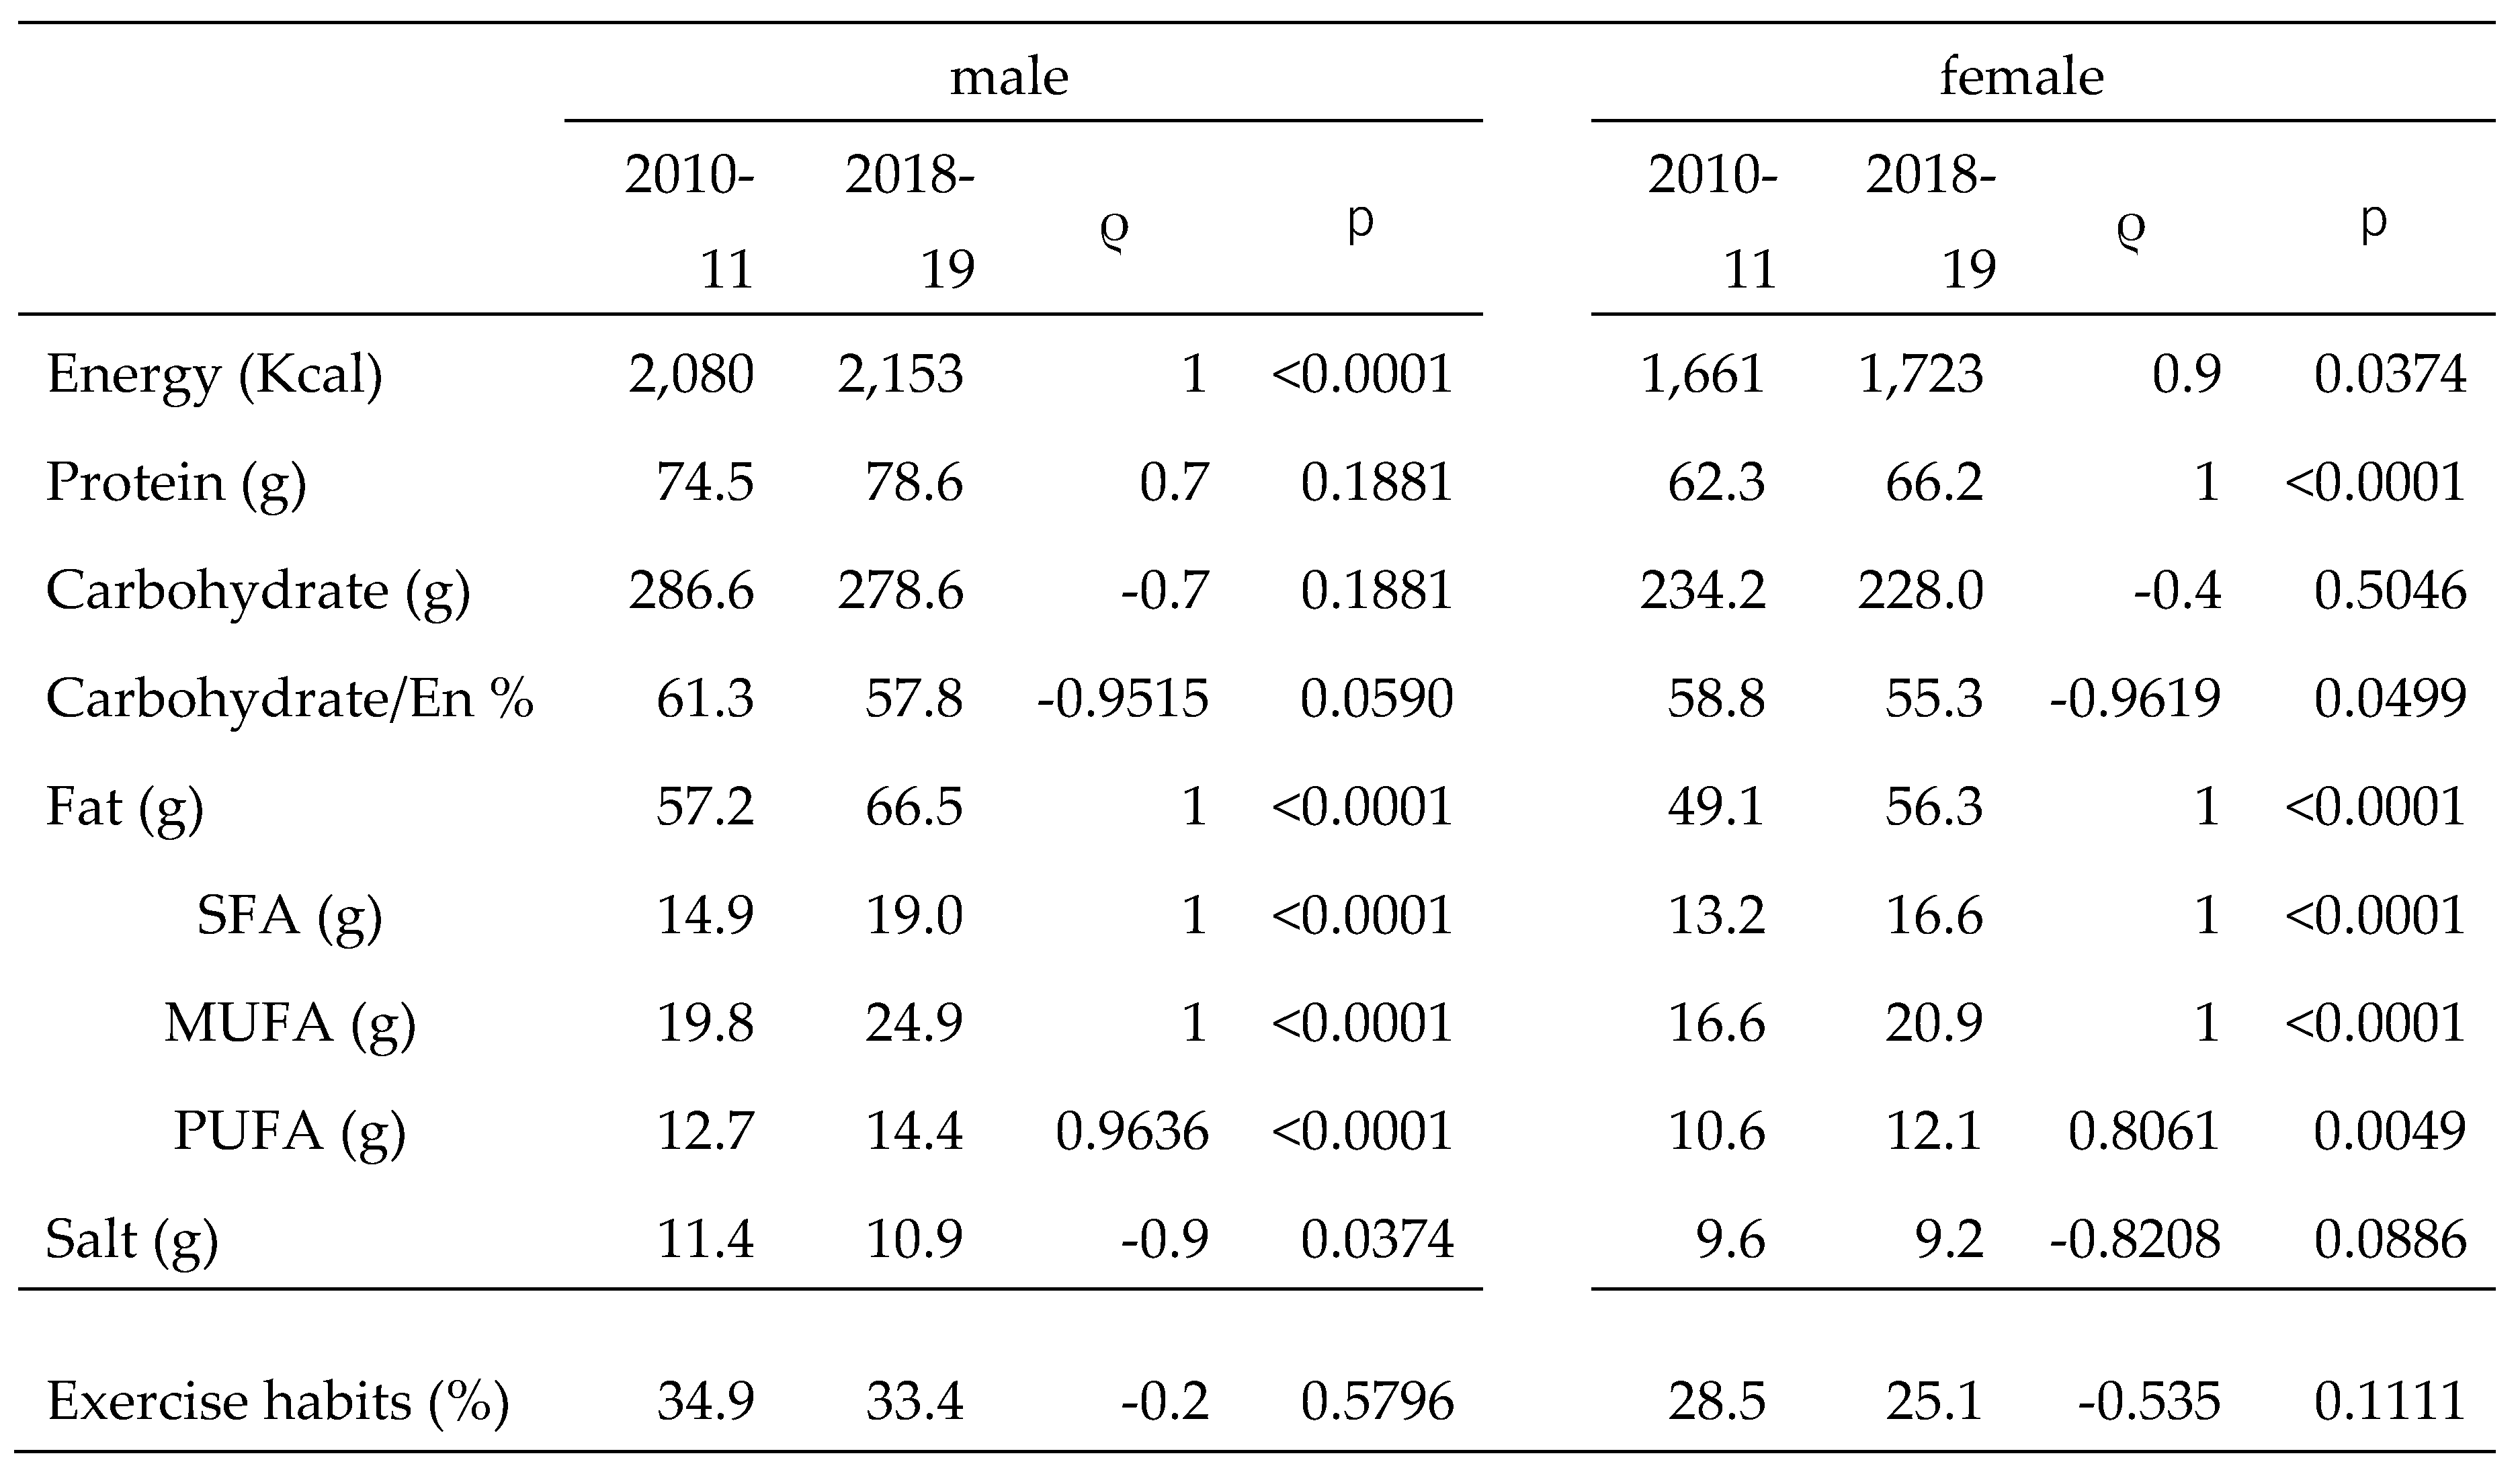
National data showed a slight increase in EN intake over the past decade for both males and females, but a decreasing trend in CHO intake and the CHO/EN ratio. According to the guidelines of Hauner et al. [
13], there is insufficient evidence of an association between T2DM risk and CHO intake and no association with intake ratio, and in a dose-response meta-analysis by Hosseini et al. [
14], a CHO/EN ratio of 45-65% was not associated with T2DM risk. However, it is unknown whether prediabetes, and the possibility that this change contributed to the decrease in the prevalence of prediabetes in this study, can be ruled out.
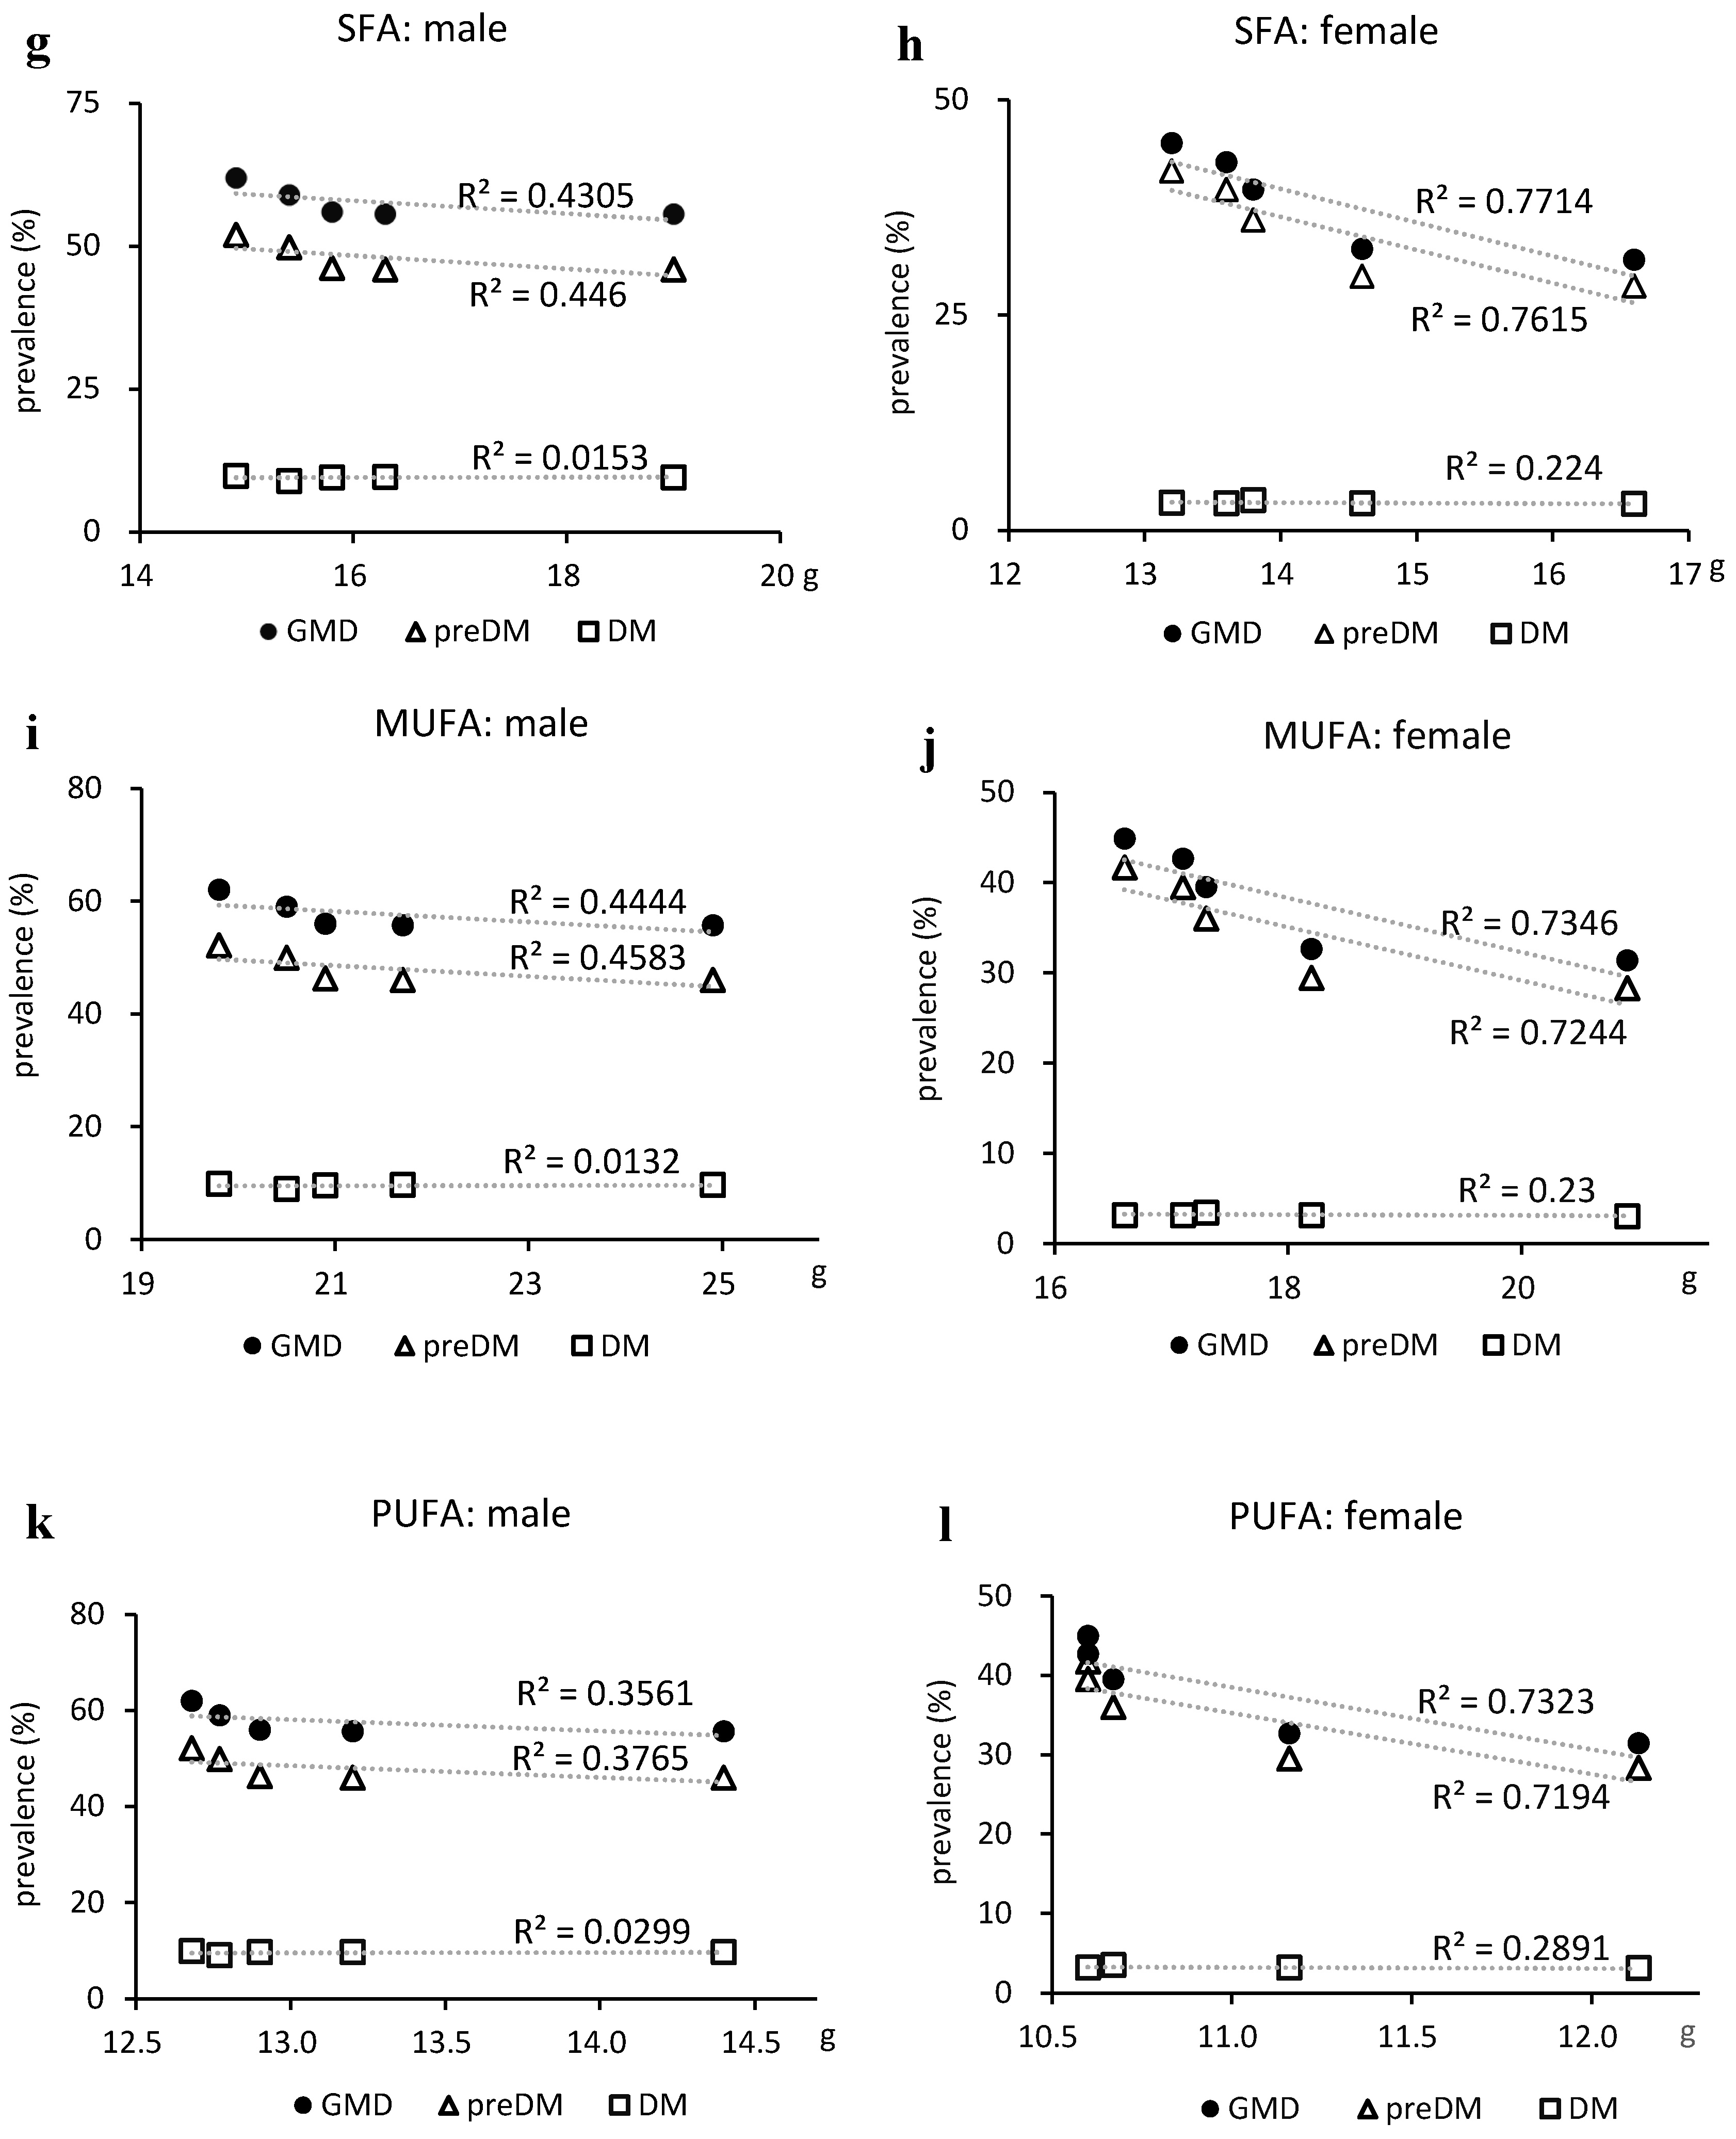
On the other hand, dietary fat is increasing, and high-fat diets have been reported to induce insulin resistance and T2DM [
15,
16]. Furthermore, SFA induces insulin resistance [
17]. Conversely, high fat does not contribute to the risk of T2DM [
18,
19] and an inverse association between total lipids and T2DM or prediabetes has recently been reported [
20,
21]. In addition, certain FAs have been reported to improve or suppress GMDs [
19,
22,
23,
24]. In a multiple-treatment meta-regression, Imamura et al. [
25] demonstrated that the conversion of CHO to SFA lowered fasting insulin levels, the conversion to MUFA lowered HbA1c and homeostasis model assessment of insulin resistance, and the conversion to PUFA improved these outcomes, in addition to FPG and C-peptide.
In a dose-response meta-analysis, Neuenschwander et al. [
18] reported a dose-dependent effect of vegetable fat, SFA, and n-6 FA on T2DM risk reduction. In the NHNS, SFA, MUFA, and PUFA intakes in Japan showed an increasing trend, and this change may have been responsible for the reduction in the prevalence of prediabetes in this study. Lipids are also closely related to the development of steatotic liver, and it has been reported that SFA directly induces hepatic steatosis [
26,
27], whereas MUFA and n-6 FA are both reported to act in an inhibitory manner [
28,
29]. Therefore, it may be possible to control both hepatic steatosis and abnormal glucose metabolism by maintaining an appropriate balance between the intake of these lipids and EN.
Hypertension decreased and salt intake was weakly correlated with hypertension in males and moderately correlated in females. Although several causes of hypertension exist, salt intake is extremely important. Salt intake decreased more slowly in females, but was correlated with a decrease in the prevalence of hypertension in females. This may be largely due to the lower absolute salt intake in females.
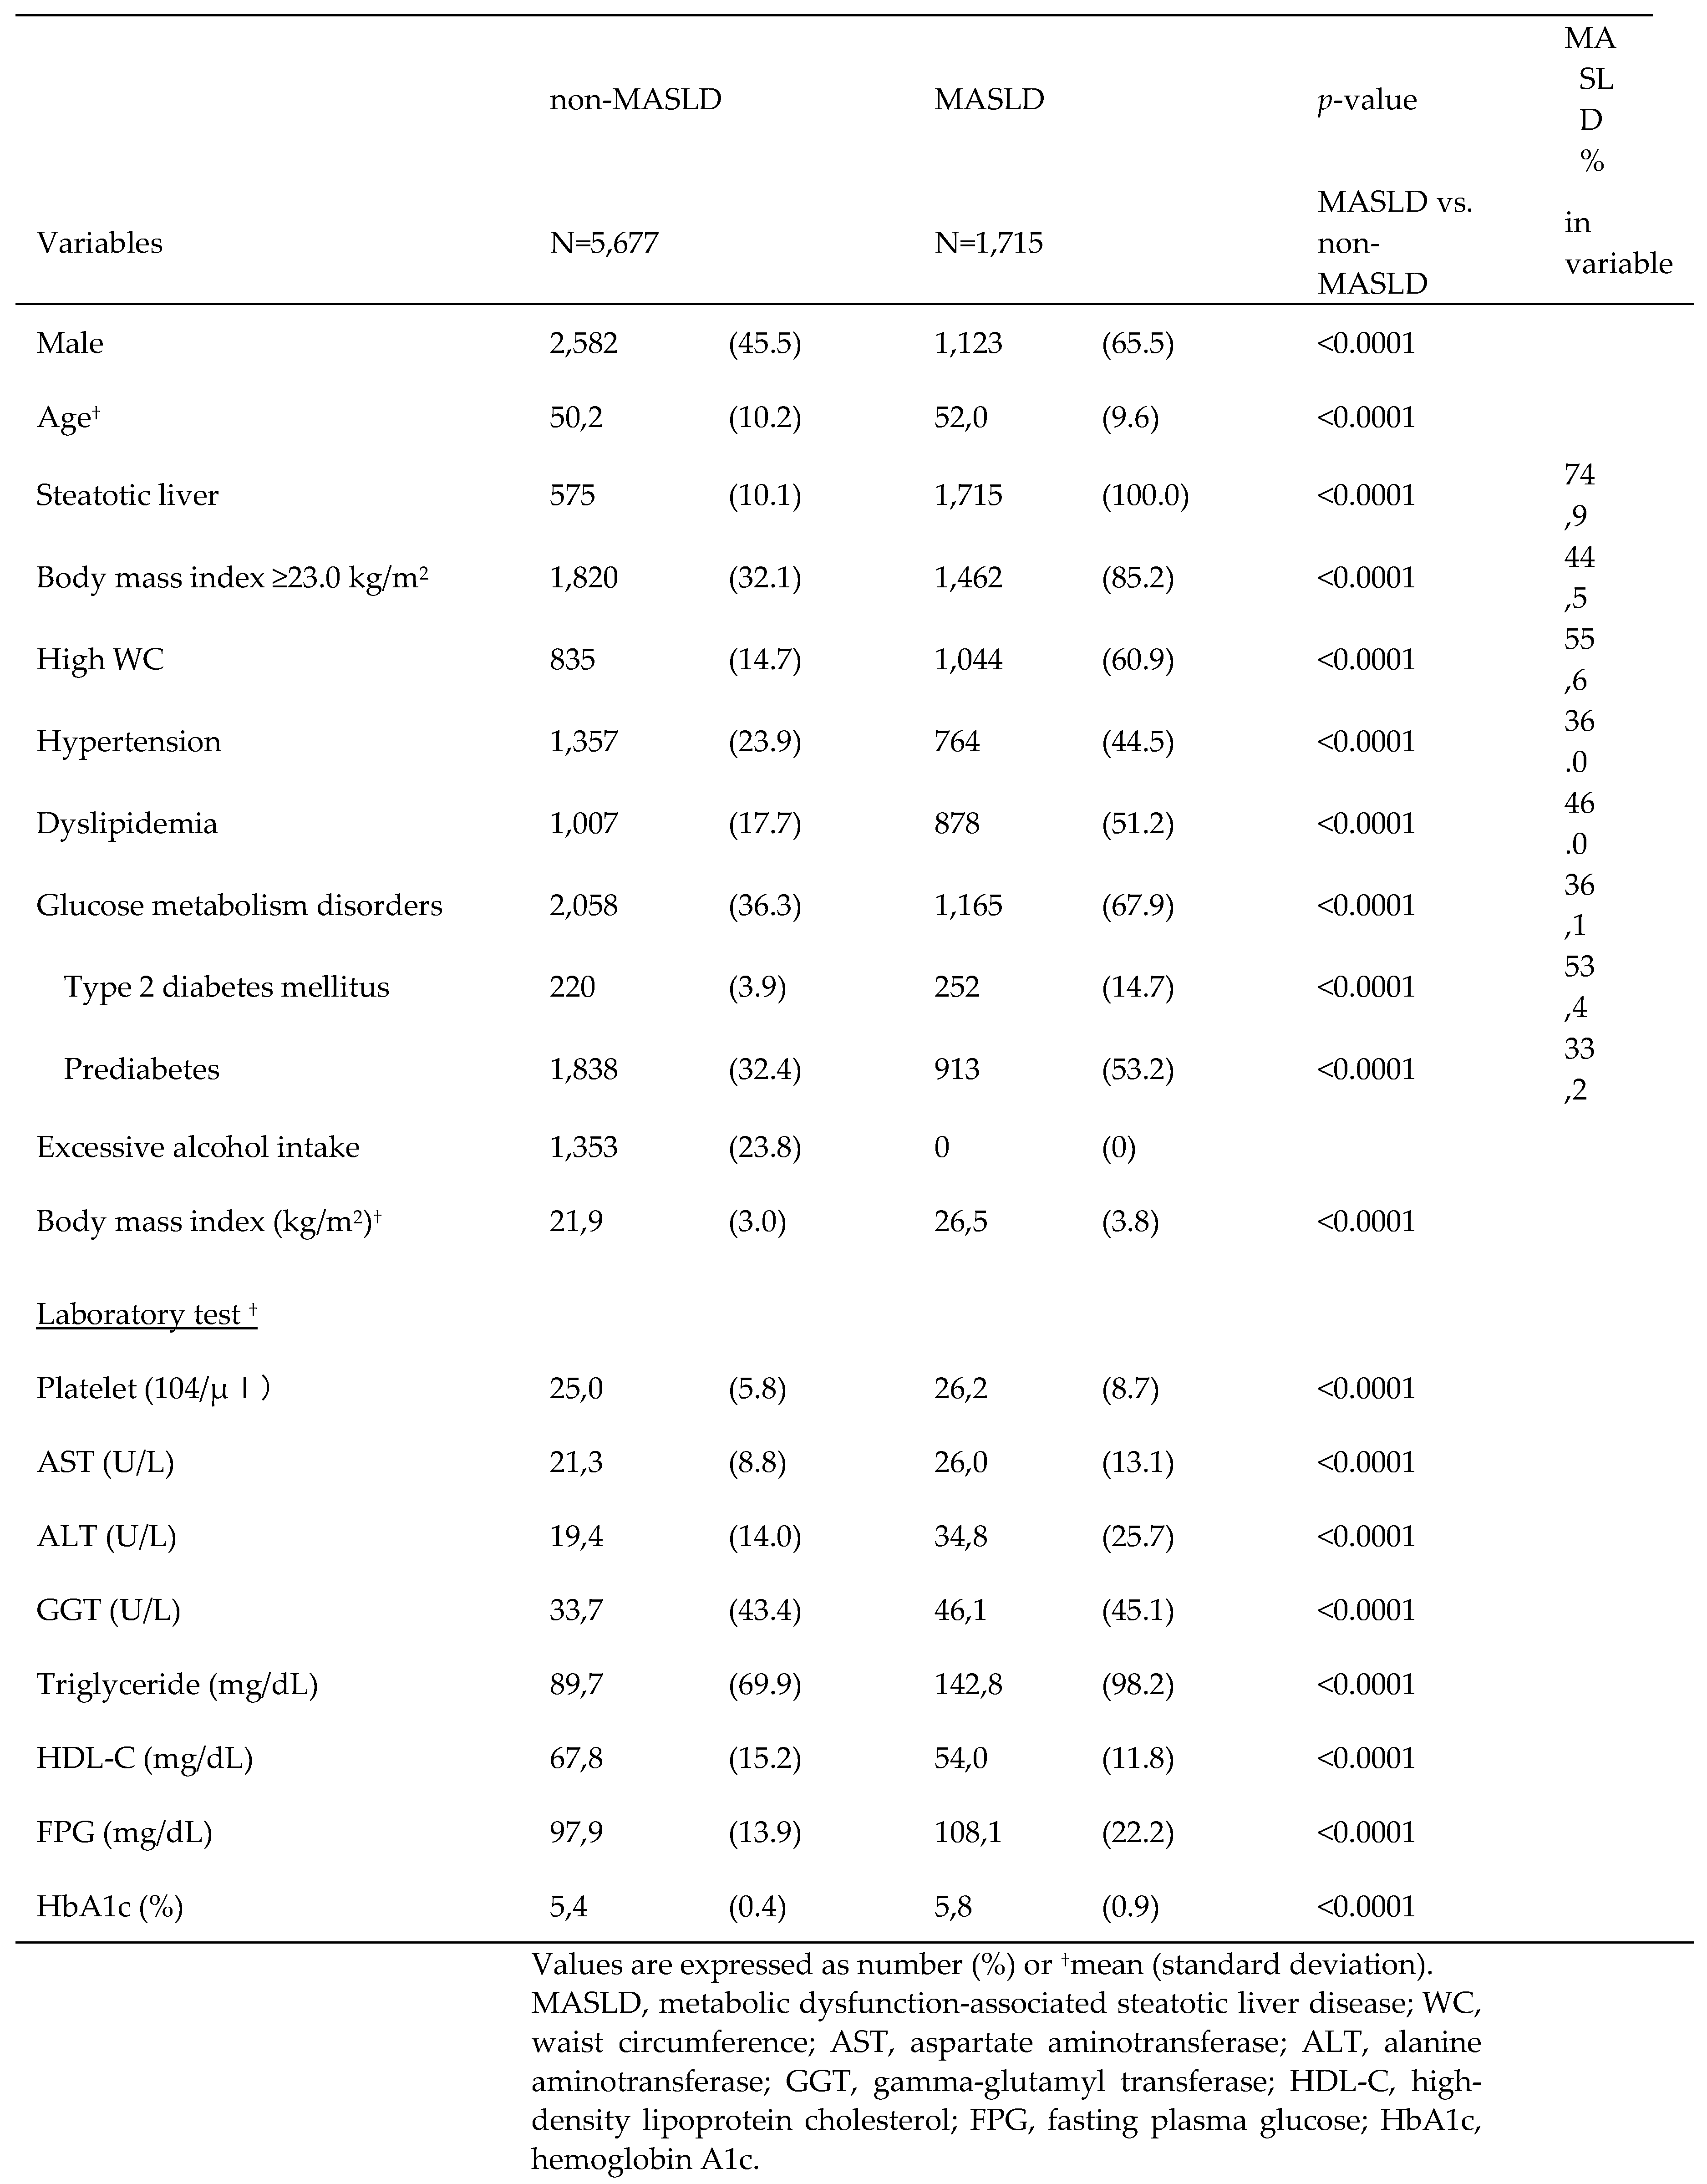
Individuals with MASLD had a significantly higher frequency of overweight, HWC, hypertension, and T2DM than individuals without MASLD. MASLD and NAFLD are almost identical [
30] and their clinical backgrounds are similar. In a recent large Japanese study by Fujii et al. [
31], the rates of hypertension and dyslipidemia in patients with NAFLD were slightly lower than those in our results. This may be due to the fact that the diagnostic criteria for LRDs in this study were based on the International Consensus Group criteria, as well as regional characteristics. Regarding laboratory values, MASLD deviated more from the reference values than non-MASLD, which is consistent with the previous report [
31] and may be owing to a higher prevalence of LRDs. The large number of LRD holders in the MASLD demonstrates the importance of the fact that the MASLD was created for the purpose of proactively capturing at-risk individuals.
The limitations of this study included the following. First, the results were from a specific region of Japan, and the nutritional data were from national data and not from the participants themselves. This was a retrospective study and no nutritional surveys were conducted; therefore, data were not available. However, this is a typical medium-sized Japanese city, 60 km from the capital, with an average annual income that is approximately equal to the Japanese average, although slightly lower than the Japanese average for primary industry workers. Furthermore, the patient population was comprised of ordinary people. Thus, as the nutrition data were averages for Japan, the correlations were not expected to diverge significantly. However, future research should be conducted over a wider area, including participants’ nutritional and physical activity status.
The second limitation was the diagnosis of LRDs. In this study, we diagnosed abnormal blood pressure as hypertension; abnormal lipid metabolism as dyslipidemia, based on the International Consensus Group criteria [
1]; and abnormal glucose metabolism as T2DM and prediabetes combined, based on the American Diabetes Association criteria [
5]. However, these are slightly different from the Japanese diagnostic criteria. Therefore, it is necessary to discuss the criteria that should be adopted when studying MASLD in Japan.
Figure 1.
Changes in prevalence of steatotic liver diseases. FY, fiscal year; MASLD, metabolic dysfunction-associated steatotic liver disease; NAFLD, non-alcoholic fatty liver disease; SL, steatotic liver; SLD, steatotic liver disease
Figure 1.
Changes in prevalence of steatotic liver diseases. FY, fiscal year; MASLD, metabolic dysfunction-associated steatotic liver disease; NAFLD, non-alcoholic fatty liver disease; SL, steatotic liver; SLD, steatotic liver disease
Figure 2.
Changes in prevalence of MASLD by age and BMI. MASLD, metabolic dysfunction-associated steatotic liver disease; BMI, body mass index; FY, fiscal year.
Figure 2.
Changes in prevalence of MASLD by age and BMI. MASLD, metabolic dysfunction-associated steatotic liver disease; BMI, body mass index; FY, fiscal year.
Figure 3.
Changes in prevalence of metabolic dysfunction-associated steatotic liver disease -related physical and metabolic disorders. Physical Disorders (a and b). Metabolic Disorders (c and d). DL, dyslipidemia; DM, type 2 diabetes; FY, fiscal year; GMD, glucose metabolism disorder; HT, hypertension; HWC, high waist circumference; preDM, prediabetes; SL, steatotic liver.
Figure 4.
Relationship between glucose metabolism disorders and nutrient intake. (a, b) Total energy intake, (c, d) total carbohydrate intake, (e, f) total fat intake, (g, h) saturated fatty acid intake, (i, j) monounsaturated fatty acid intake, and (k, l) polyunsaturated fatty acids (sum of n-3 and n-6 polyunsaturated fatty acid). DM, type 2 diabetes; GMD, glucose metabolism disorder; MUFA, monounsaturated fatty acids; preDM, prediabetes; PUFA, polyunsaturated fatty acids; SFA, saturated fatty acids.
Figure 5.
Relationship between hypertension and salt intake. Salt intake was significantly reduced in males (from 11.4 g to 10.9 g, p=0.037) but weakly correlated with the prevalence of hypertension (R2 = 0.342). However, there was a moderate correlation with a reduced prevalence of hypertension in females (R2 = 0.483), where the reduction in salt intake was not significant (from 9.6 g to 9.2 g, p=0.089).
Table 1.
Characteristcs of the subjects.
Table 1.
Characteristcs of the subjects.
Table 2.
Trend of dietary nutrients and exercise habits (2010-2019).
Table 2.
Trend of dietary nutrients and exercise habits (2010-2019).
Table 3.
Comparison of MASLD and non-MASLD.
Table 3.
Comparison of MASLD and non-MASLD.

