Submitted:
01 July 2024
Posted:
02 July 2024
You are already at the latest version
Abstract
Keywords:
1. Introduction
2. Materials and Methods
2.1. Plant Materials
2.2. Genomic DNA Isolation
2.3. Microsatellite Markers
2.4. Analysis of Molecular Data
3. Results
3.1. Genetic Diversity
3.2. Accessions Genetic Structure
3.3. Genetic Relationships and PCoA Analysis
3.4. Analysis of Molecular Variance (AMOVA)
4. Discussion
5. Conclusion
Acknowledgments
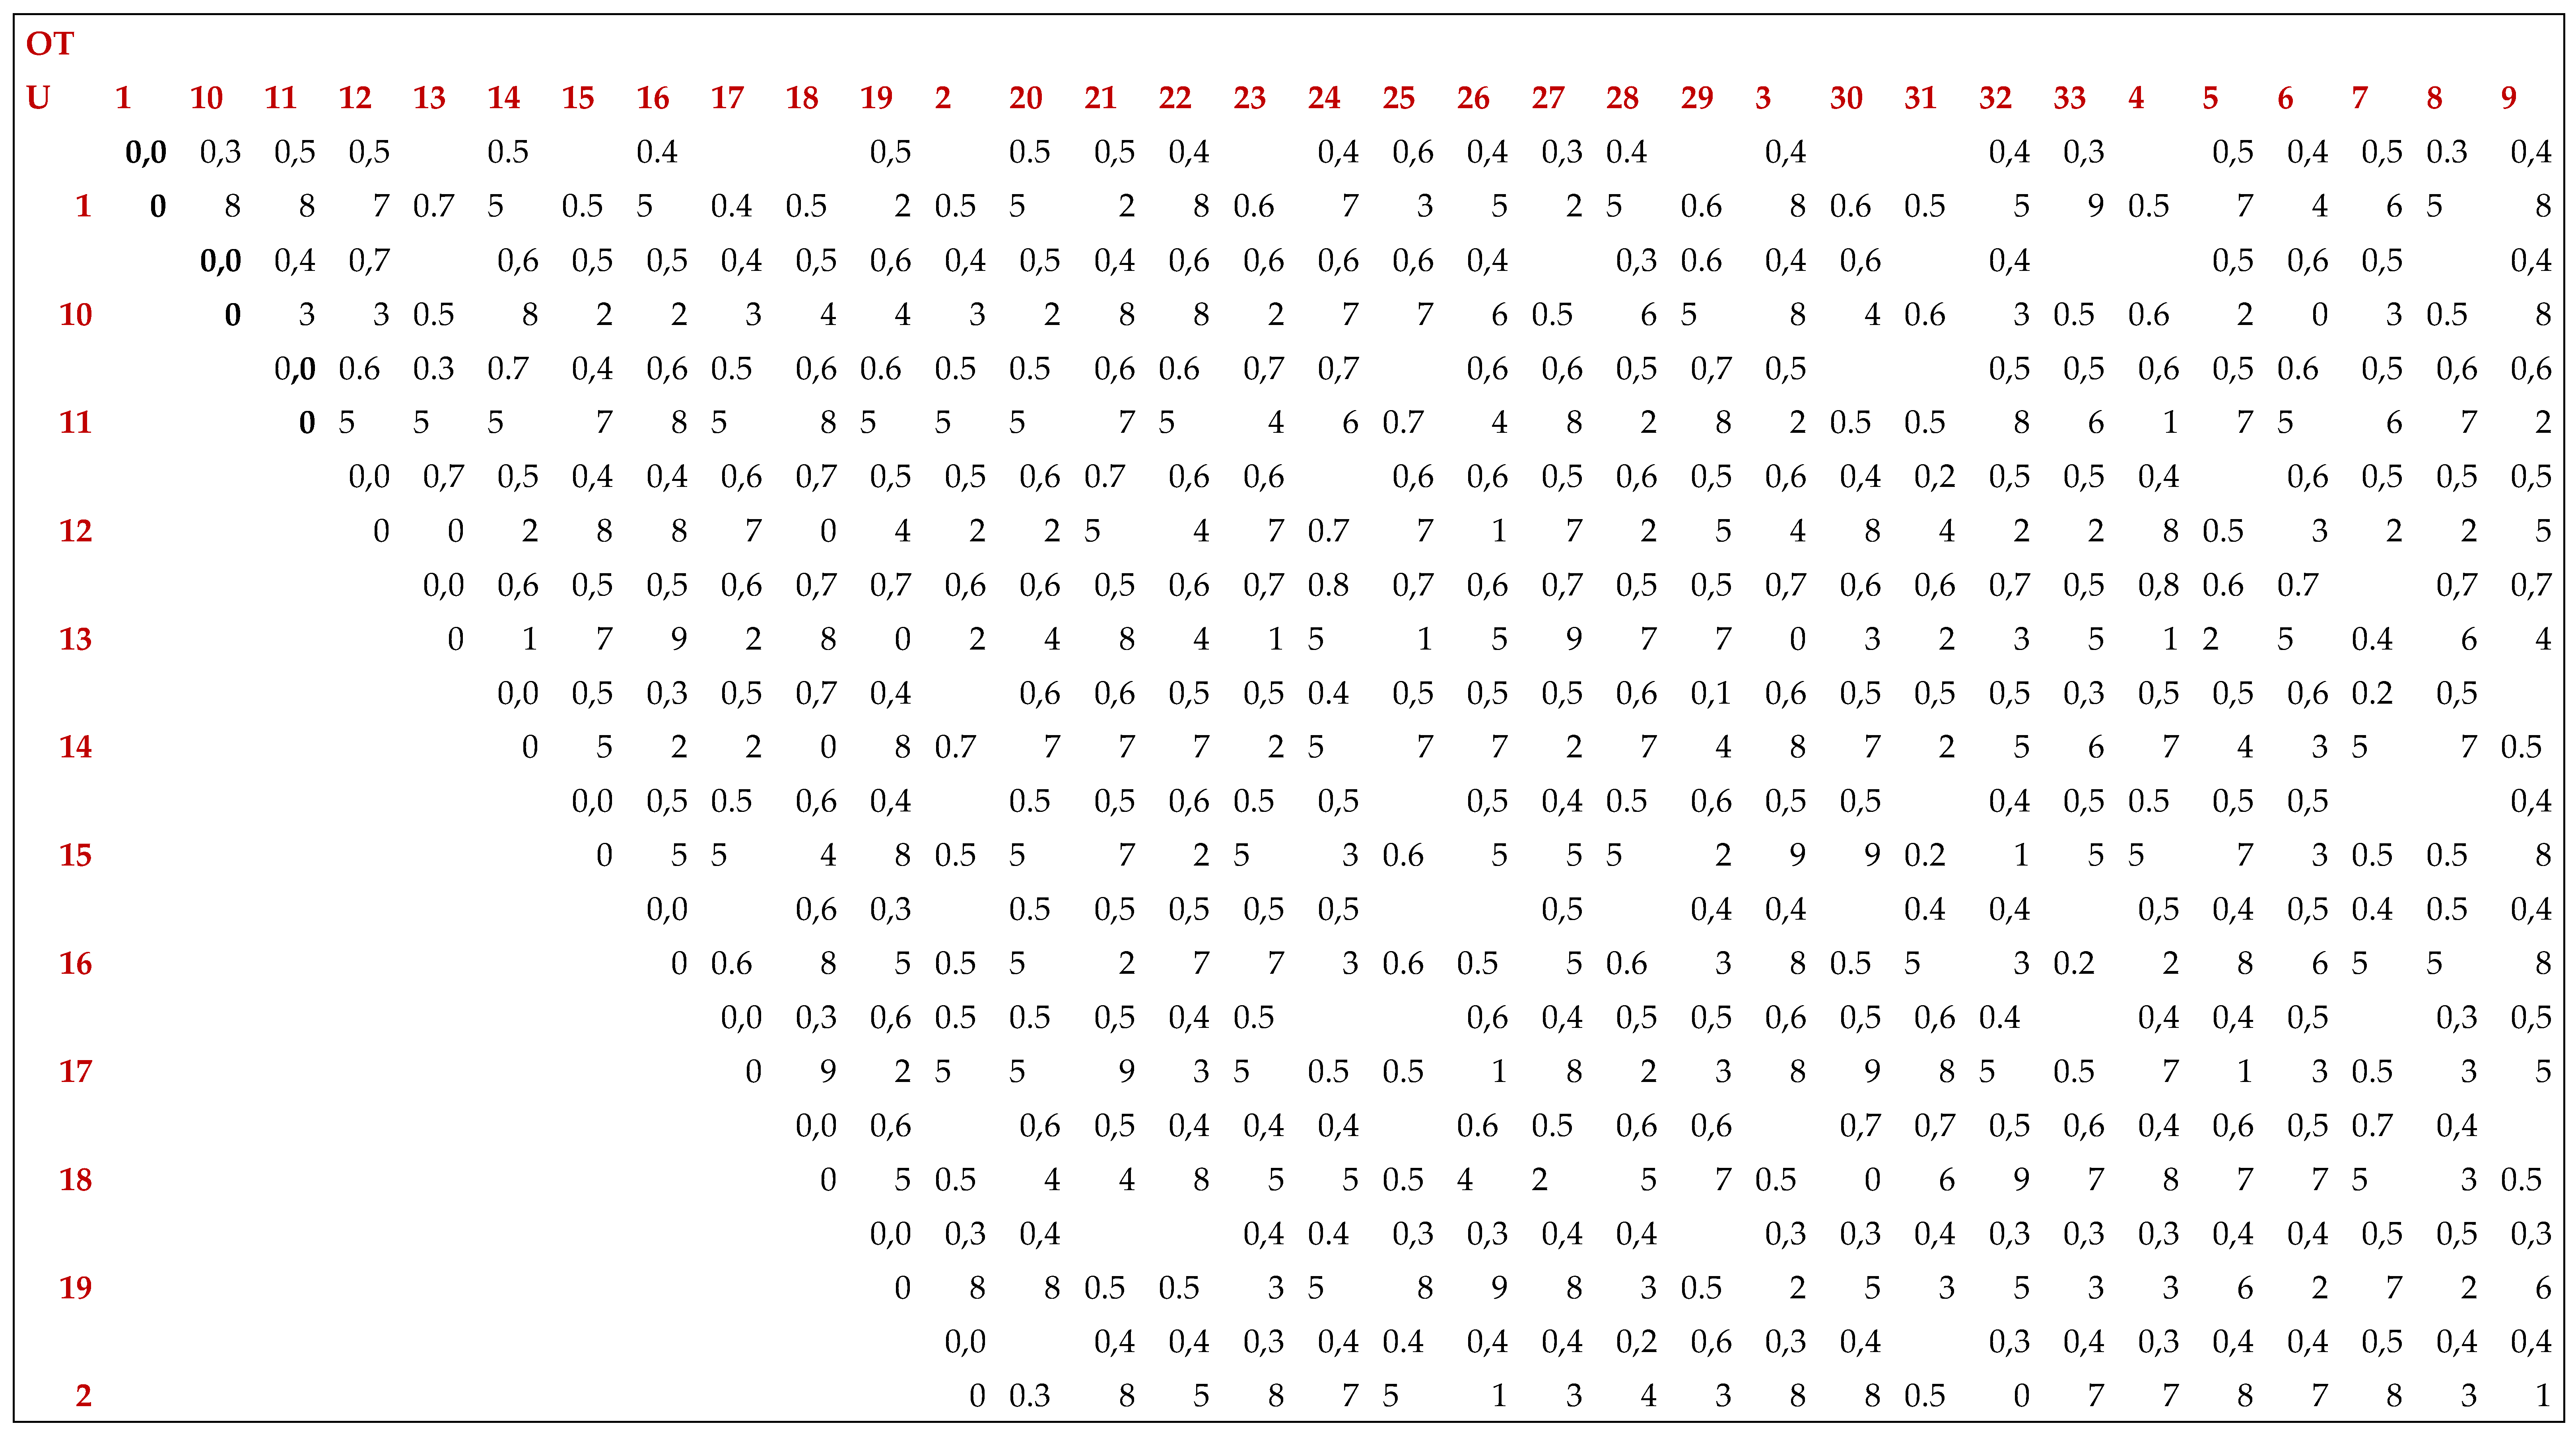
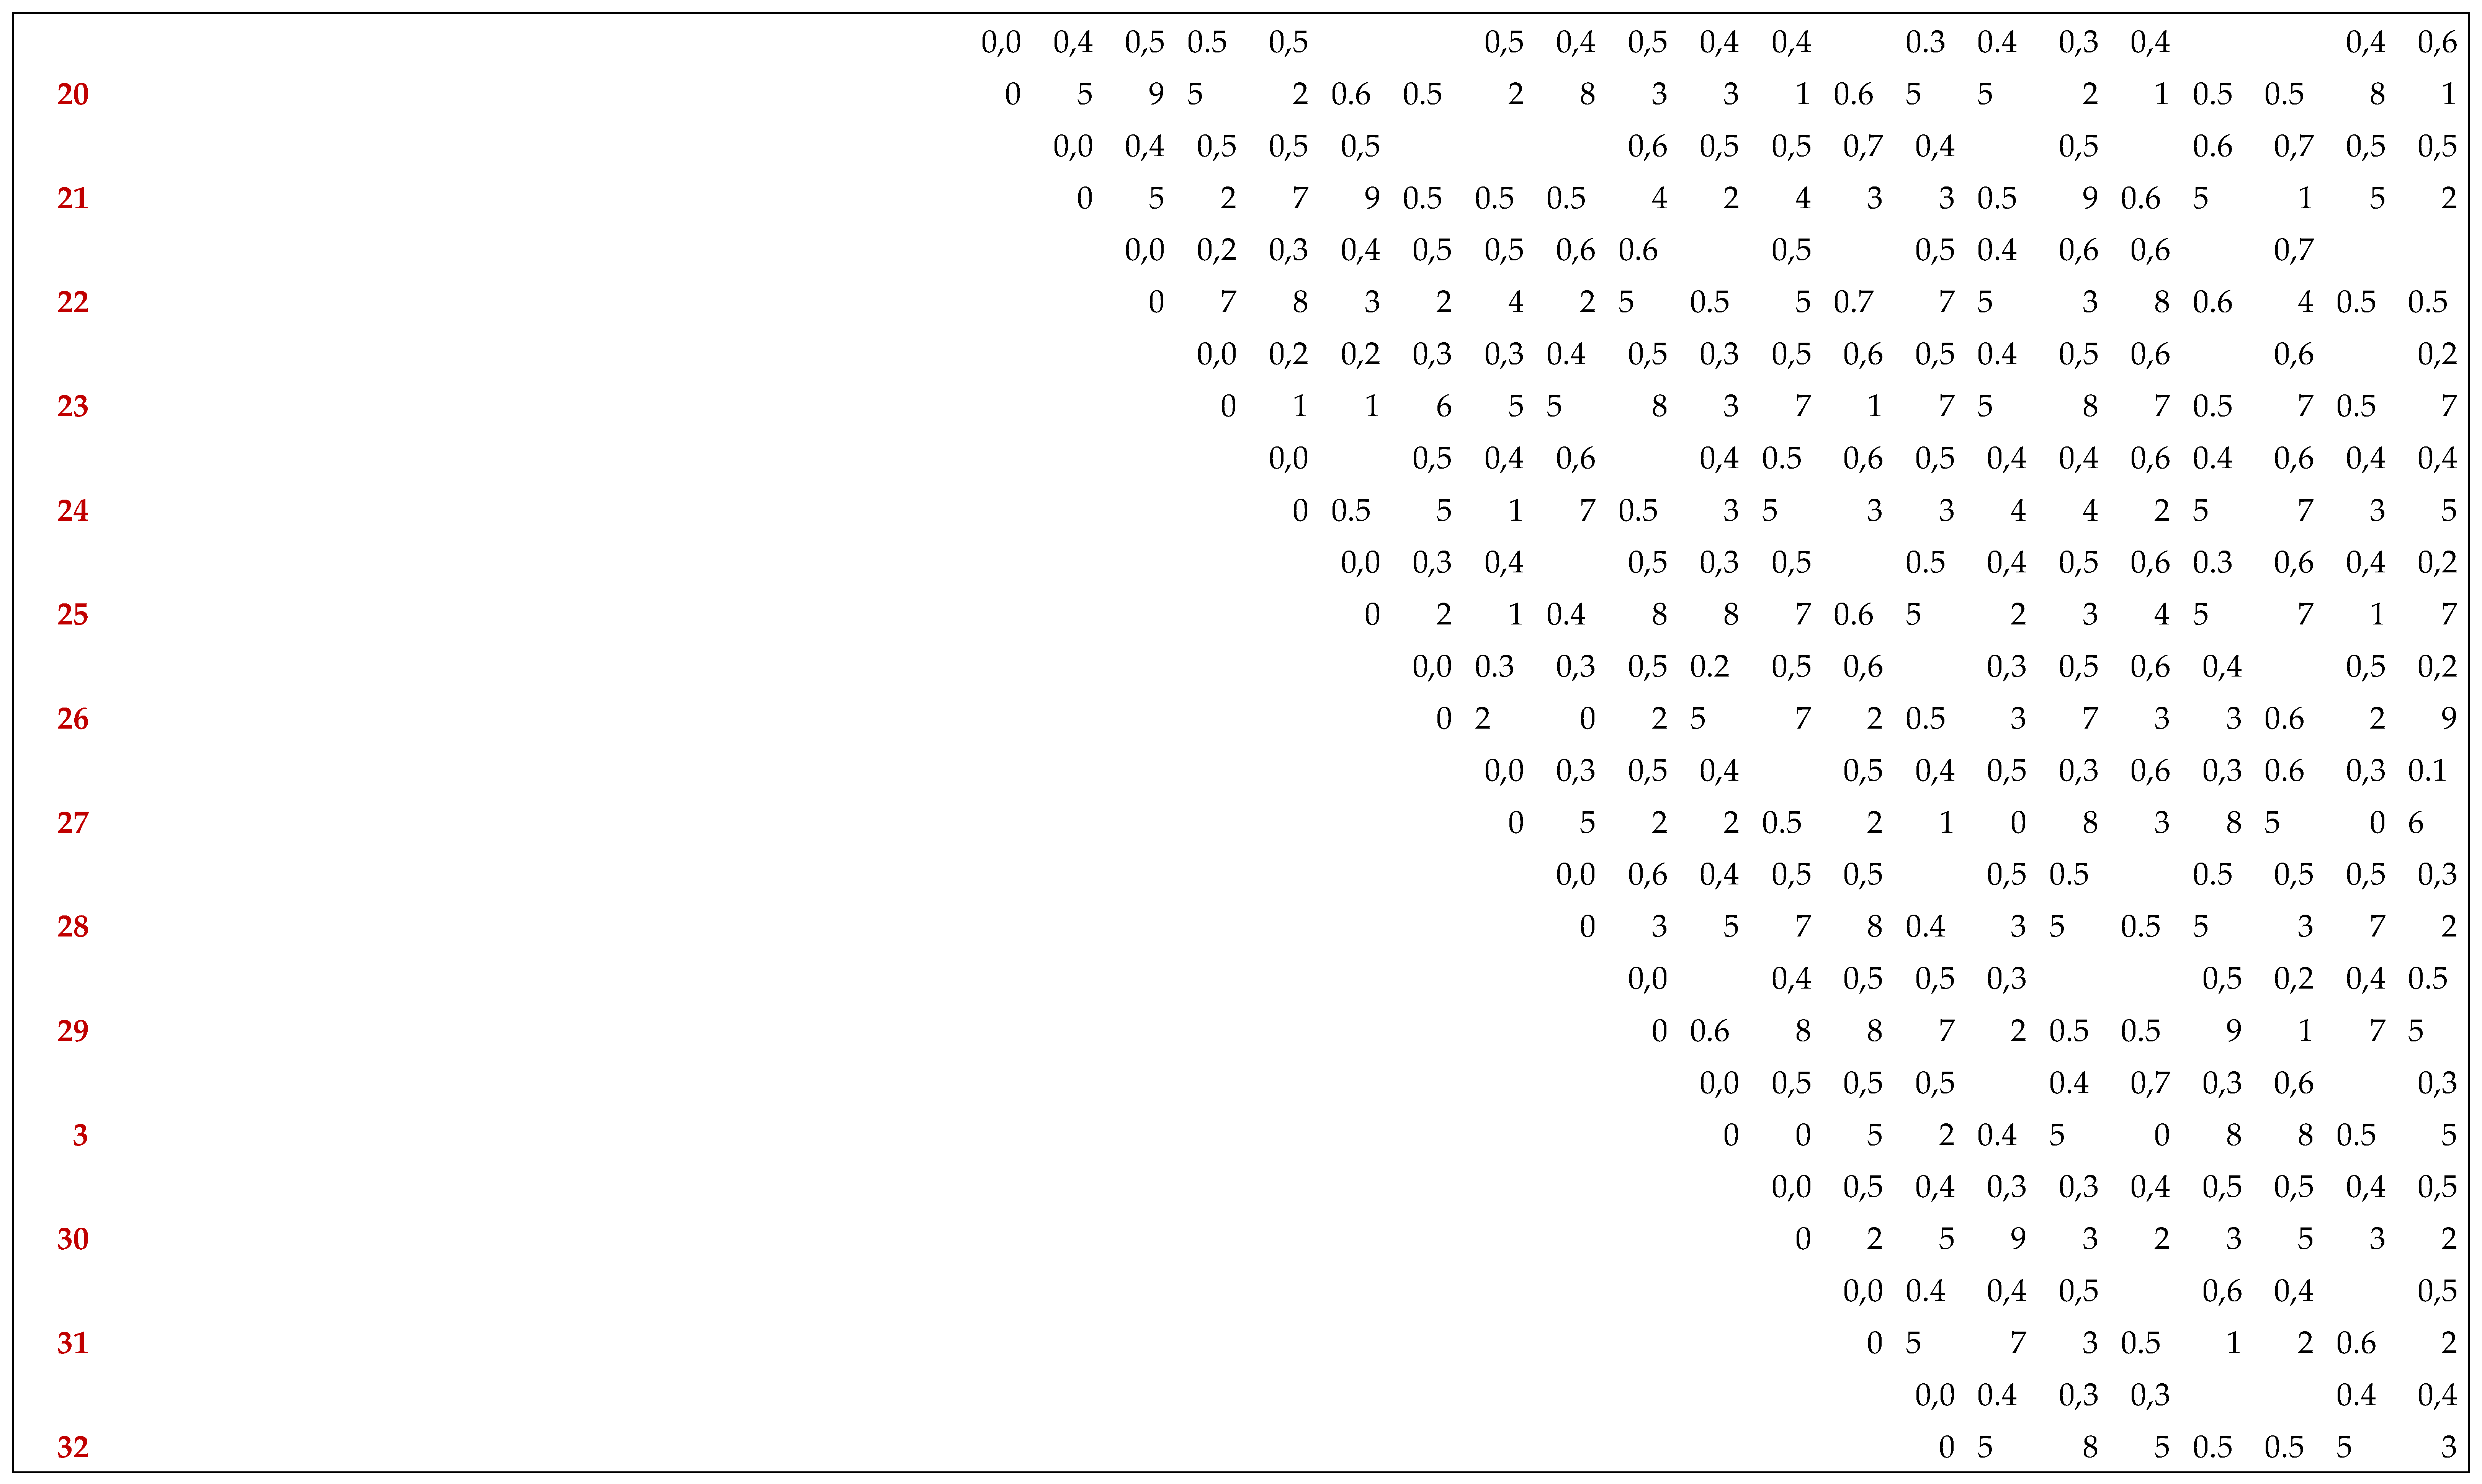
Appendix A. Dissimilarity Matrix


References
- Alemayehu F, Parlevliet JE. Variation between and within Ethiopian barley landraces.Euphytica ,1997 ;94:183-189.
- Babaei N,Abdullah N. A. P., Saleh G, Abdullah T. L. Isolation and characterization of microsatellite markers and analysis of genetic variability in Curculigo latifolia Dryand. Mol Biol Rep,2012 ; 39:9869–9877. [CrossRef]
- Backes, G. M., Orabi, J., Wolday, A., Yahyaoui, A., & Jahoor, A. High genetic diversity revealed in barley(Hordeum vulgare) collected from small-scale farmer’s fields in Eritrea. Genetic Resources and Crop Evolution,2009 ;56(1),85-97. https://doi.org/10.1007/s10722-008-9347-5.
- Becker J and Heun M .Barley microsatellites: allele variation and mapping Plant Molecular Biology,1995 ;27:835-845.
- Bellucci E, Bitocchi E, Rau D, Nanni L, Ferradini N, et al. Population Structure of Barley Landrace Populations and Gene-Flow with Modern Varieties,2013 ; PLoS ONE 8(12): e83891. [CrossRef]
- Benmohammed A.La production de l’orge et possibilités dedéveloppement en Algérie. ITGC, Alger. Céréaliculture,2004 ; 41, 34-38.
- Botstein, D., White, R.L., Skolnick, M., and Davis, R.W. Construction of a genetic linkage map in man using restriction fragment length polymorphisms. Am. J. Hum. Genet,1980 ; 32: 314- 331.
- De Vicente C.F.A., Guzmán J., Engels V., Ramanatha R.,2005. Genetic characterization and its use in decision making for the conservation of crop germplasm. the role of biotechnology -Villa Gualino, Turin, Italy – 5-7.
- Edwards, S. Tuvesson, M. Morgante, A. Massari, E. Maestri, N. Marmiroli, T. Sjakste, M. Ganal, W. Powell and R. Waugh. A simple sequence repeat-based linkage map of barley .Genetics,2000 ; 156:1997-2005.
- Excoffier L, Smouse PE and Quattro J .Analysis of molecular variance inferred from metric distances among DNA haplotypes: Application to human mitochondrial DNA restriction data. Genetics,1992 ; 131:479-491.
- Glaszmann, J.; Kilian, B.; Upadhyaya, H.D.; Varshney, R.K.(2010). Accessing genetic diversity for crop improvement. Curr. Opin. Plant Biol. 13 :167–173.
- Hamza S, Ben Hamida W, Rebai A, Harrabi M (2004) SSR-based genetic diversity assessment among Tunisian winter barley and relationship with morphological traits. Euphytica.135:107-118.
- Harlan JR . Our Vanishing Genetic Resources. Science, 1975 ;188:618-621.
- Hearnden PR et al. A genetic map of 1,000 SSR and DArT markers in a wide barley cross. Theoretical and Applied ,2000 ; Genetics 115:383-391.
- Henkrar Fatima, Jamal El-Haddoury, Driss Iraqi, Najib Bendaou, Sripada M. Udupa Allelic variation at high-molecular weight and low-molecular weight glutenin subunit genes in Moroccan bread wheat and durum wheat cultivars. 3 Biotech ,2017 ; 7:287.
- Jaiswal s k, shree p.pandey,s. Sharma1,r. Prasad, l. c.Prasad1,r. p.s. Verma and arun k. joshi.Diversity in Indian barley (Hordeum vulgare) cultivars and identification of genotype-specific fingerprints using microsatellite markers. Indian Academy of Sciences,2010 ;89 : 46–54.
- Jin L, Chakraborty R .Estimation of genetic distance and coefficient of gene diversity from single-probe multilocus DNA fingerprinting Data. Mol Biol Evol,1993 ; 11:120–127.
- Kadri karim, Abdellawi RAWDA , Cheikh-Mhamed Hatem . Genetic diversity in barley genetic diversity in local Tunisian barley based on RAPD and SSR analysis. BioDiCon 2/1 ,2009 ; 27-35.
- Kaplan JK . Conserving the world’s plants. Agr Res ,1998 ; 46:4-9.
- Khaldoun A , Jacques Chery , P. Monneveux . Etude des caracteres d’enracinement et de leur role dans l’adaptation au deficit hydrique chez l’orge (Hordeum vulgare L.). Agronomie,10(5),1999,pp.369-379.
- Khodayari H, Saeidi H, Roofigar AA, Rahiminejad MR, PourkheirandishMand Komatsuda T . Genetic diversity of cultivated barley landraces in Iran measured using microsatellites. Int J Biosci Biochem Bioinform,2012 ; 2:278-290.
- Ladizinsky. G. Economic Botany ,1985 ;39 :191–199.
- Lamara M., Zhang Li Yi., Marchand S., Nicholas A., Tinker F.,Belzile.Comparative analysis of genetic diversity in Canadian barley assessed by SSR,DarT,and pedigree data.2013 ;Genome.Vol.56,N°6:351-358-. [CrossRef]
- Liao M, Wang Y, Rong X, Zhang Z, Li B, Wang L, Chen G . Development of new microsatellite DNA markers from Apostichopus japonicus and their cross-species application in Parastichopus parvimensis and Pathallus mollis. Int J Mol Sci ,2011 ;12:5862–5870.
- Liu, Muse .PowerMarker: an integrated analysis environment for genetic marker analysis”, Bioinformatics,2005 ; 21(9):2128-2129.
- Ledovskoy Y, Abugalieva S and Turuspekov Y . Comparative assessment of the genetic variation in wild and cultivated barley based on SSR markers. Asian Australas J Plant Sci Biotechnol ,2010 ;4:21-26.
- Matus IA, Hayes PM. Genetic diversity in three groups of barley germplasm assessed by simple sequence repeats. Genome ,2002 ;45:1095-1106.
- Malysheva-Otto L. V., Ganal M.W. and Roder M. S. Analysis of molecular diversity, population structure and linkage disequilibrium in a worldwide survey of cultivated barley germplasm (Hordeum vulgare L). BMC Genet.2006 ; 7- 6.
- Mebarek Lamara, Li Yi Zhang, Suzanne Marchand, Nicholas A. Tinker, François.Belzile-Comparative analysis of genetic diversity in Canadian barley assessed by SSR,DarT, and pedigree data.Genome.2013 ;Vol.56,N°6 :351-358. [CrossRef]
- Munoz-Amatrian Mara, Alfonso Cuesta-Marcos, Patrick M. Hayes and Gary J. Muehlbauer. Barley genetic variation: implications for crop improvement.Briefings in functional genomics,2014 ;Vol 13. NO 4. 341^350. [CrossRef]
- Nagl N, Taski-Ajdukovic K, Popovic A, Curcic A, Danojevic D, Kovacev L (2011) Estimation of genetic variation among related sugar beet genotypes by using RAPD. Genetika 43:575–582.
- Papa, R. & Gepts P. Asymmetry of gene flow and differential geographical structure of molecular diversity in wild and domesticated common bean (Phaseolus vulgaris L.) from Mesoamerica. Theor. Appl.Genet., 2003 ;106:239–250.
- Peakall R, Smouse PE. GenAlEx 6.5: genetic analysis in Excel.Population genetic software for teaching and research-an update.Bioinformatics 28:2537–2539,2012. [CrossRef]
- Pejic I, Ajmone-Marsan P, Morgante M, Kozumplick V, Castiglioni P, Taramino G, Motto M. Comparative analysis of genetic similarity among maize inbred lines detected by RFLPs, RAPDs, SSRs and AFLPs. Theor Appl Genet,1998 ;97(8):1248–1255. [CrossRef]
- QUIAN.
- Ramsay L , M. Macaulay, S. degli Ivanissevich, K. MacLean, L. Cardle, J. Fuller, K. J. Ramzi Chaabane ,Mouldi El Felah, Hammadi Ben Salah ,M’Barek Ben Naceur Chedly Abdelly, Dalila Ramla , Ahmad Nada ,Mahmoud Saker. Molecular Characterization of Tunisian Barley (Hordeum Vulgare L.) Genotypes using Microsatellites (SSRs) Markers. Eu ropean Journal of Scientific Research ISSN 1450-216X Vol.36 No.1 :pp.6-15,2009.
- Saghai Maroof M, Biyashev RM, Yang GP, Zhang Q and Allard RW .Extraordinarily polymorphic microsatelliteDNA in barley: species diversity, chromosomal locations, and population dynamics,1994 ;Proc Natl Acad Sci USA91:5466-5470.
- Saisho D, Takeda K . Barley: emergence as a new research material of crop science. Plant Cell,2011 ;Physiol 52:724-727.
- Saitou, N., Nei, M . The neighbor-joining method: a new method for reconstructing phylogenetic trees. Molecular Biology and Evolution,1987 ; 4: 406-425.
- Shi YT, Bian HW, Han N, Pan JW, Tong WX, Zhu MY. Genetic Variation Analysis by RAPD of Some Barley Cultivars in China. Acta Agron Sin, 2004 ;30(3):258–265. (in Chinese).
- Singh Nivedita, Debjani Roy Choudhury, Gunjan Tiwari, Amit Kumar Singh, Sundeep Kumar, Kalyani Srinivasan, R. K. Tyagi, A. D. Sharma, N. K. Singh and Rakesh Singh.Genetic diversity trend in Indian rice varieties: an analysis using SSR markers-BMC,2016 ;Genetics-17:127-1 :13-. [CrossRef]
- Smith, D. N., and Devey, M. E. Occurrence and inheritance of microsatellites in Pinus radia.1994 ; Genome 37 :977–983. [CrossRef]
- Smith JSC, Kresovich S, Hopkins MS, Mitchell SE, Dean RE, Woodman WL, Lee M, Porter K . Genetic diversity among elite sorghum inbred lines assessed with simple sequence repeats. Aust. J. Crop Sci,2000 ; 40:226-232.
- Struss D, Plieske J (1998). The use of microsatellite markers for detection of genetic diversity in barley populations. Theor. Appl. Genet. 97:308-315.
- Udupa SM, Robertson LD, Weigand F, Baum M, Kahl G. Allelic variation at (TAA)n microsatellite loci in a world collection of chickpea (Cicer arietinum L.) Germplasm. Mol Genet Genom,1999 ; 261:354–363. [CrossRef]
- Van de Ven, M.; Powell, W.; Ramsay, G.; Waugh, R. Restriction fragment length polymorphisms as genetic markers in Vicia. Heredity . 1990 ;65 :329–342.
- Varshney RK et al. A high density barley microsatellite consensus map with 775 SSR loci. Theoretical and Applied Genetics ,2007 ;114:1091.C. de Vicente1 , F.A. Guzmán , J. Engels and V. Ramanatha Rao . genetic characterization and its use in decision making for the conservation of crop germplasm. the role of biotechnology -Villa Gualino, Turin, Italy ,2005 ;5-7.
- Xie W. & Nevo E.Wild emmer: genetic resources, gene mapping and transfer for wheat improvement. Euphytica ,2008 ;164 : 603–614.
- Yahiaoui S, Igartua E, Moralejo M, Ramsay L, Molina-Cano JL,Lasa JM, Gracia MP and Casas AM . Patterns of geneticand eco-geographical diversity in Spanish barleys.Theor Appl Genet ,2008 ;116:271-282.


| Accessions | region | locations | Longitude | Latitude | Altitude |
|---|---|---|---|---|---|
| Saida G3 | tlemcen | tlemcen | 1°19’4.82”O | 34°53’18.26”N | 745m |
| Saida G4 | tlemcen | 1°19’4.82”O | 34°53’18.26”N | 745m | |
| Saida R1 | Sid abdli | 1° 7’58.47”O | 35° 3’49.79”N | 465m | |
| Saida | Sidi belabbes Sidi belabbes 0°38’17.72”O 35°12’7.84”N |
Sidi belabbes | 0°38’17.72”O | 35°12’8.01”N | 478m |
| Saida2 | Sidi lahcene | 0°43’29.18”O | 35°12’6.11”N | 515m | |
| Ascad | Sidi belabbes | 0°38’17.72”O | 35°12’7.84”N | 478m | |
| Rihane | Sidi belabbes | 0°38’17.72”O | 35°12’7.84”N | 478m | |
| Faouara | Sidi belabbes | 0°38’17.72”O | 35°12’7.84”N | 478m | |
| Tichedrett | Sidi belabbes | 0°38’17.72”O | 35°12’7.84”N | 478m | |
| Faouara2 | Sidi belabbes | 0°38’17.72”O | 35°12’7.84”N | 478m | |
| Azrir | Adrar | oueled ali | 0° 5’52.95”O | 28°42’51.56”N | 251m |
| Safra | oueled ali | 0° 5’52.95”O | 28°42’51.56”N | 251m | |
| Bourabaa | adrar | 0°11’12.99”O | 27°58’18.55”N | 257m | |
| Salt | oueled ali | 0° 5’52.95”O | 28°42’51.56”N | 251m | |
| Ras el mouch | oueled ali | 0° 5’52.95”O | 28°42’51.56”N | 251m | |
| Chater | kerzaz | 1°26’19.08”O | 29°27’44.71”N | 387m | |
| Bourabaa | kerzaz | 1°26’19.08”O | 29°27’44.71”N | 387m | |
| Chater 2 | adrar | 0°11’12.99”O | 27°58’18.55”N | 257m | |
| Zraa beldi | zaouiet konta | 0°12’3.68”O | 27°13’34.73”N | 204m | |
| Orge ALG ad | oueled ali | 0° 5’52.95”O | 28°42’51.56”N | 251m | |
| Ghir | Bechar | bechar | 2°10’58.22”O | 31°33’28.58”N | 789m |
| Saida | bechar | 2°10’58.22”O | 31°33’28.58”N | 789m | |
| Safra3 | beni abbes | 2°10’1.66”O | 30° 7’56.89”N | 505m | |
| Saida | beni abbes | 2°10’1.66”O | 30° 7’56.89”N | 505m | |
| Safra2 | beni abbes | 2°10’1.66”O | 30° 7’56.89”N | 505m | |
| Zraa byad1 | beni abbes | 2°10’1.66”O | 30° 7’56.89”N | 505m | |
| Zraa byad2 | bechar | 2°10’58.22”O | 31°33’28.58”N | 789m | |
| Rihane | Ain defla | khemiss meliana | 2°12’49.78”E | 36°15’12.70”N | 281m |
| Saida | khemiss meliana | 2°12’49.78”E | 36°15’12.70”N | 281m | |
| Faouara | khemiss meliana | 2°12’49.78”E | 36°15’12.70”N | 281m | |
| Saida | Media | beni slimane | 2°56’15.27”E | 36° 3’12.55”N | 588m |
| Rihane | beni slimane | 2°56’15.27”E | 36° 3’12.55”N | 588m | |
| Tichedrett | beni slimane | 2°56’15.27”E | 36° 3’12.55”N | 588m |
| Name | Chr | Repeat | Size | Primer sequense |
|---|---|---|---|---|
| Bmag0013 | 3H | (CT)21 | 151 | F:AAGGGGAATCAAAATGGGAG R: TCGAATAGGTCTCCGAAGAAA |
| Bmac0067 | 3H | (AC)18 | 171 | F:AACGTACGAGCTCTTTTTCTA R :ATGCCAACTGCTTGTTTAG |
| Bmac0093 | 2H | (AC)24 | 151 | F:CGTTTGGGACGTATCAAT R : GGGAGTCTTGAGCCTACTG |
| Bmac0213 | 1H | (AC)23 | 168 | F : ATGGATGCAAGACCAAAC R : CTATGAGAGGTAGAGCAGCC |
| Bmac0040 | 6H | (AC)20 | 236 | F :AGCCCGATCAGATTTACG R : TTCTCCCTTTGGTCCTTG |
| Bmac0181 | 4H | (AC)20 | 177 | F:ATAGATCACCAAGTGAACCAC R: GGTTATCACTGAGGCAAATAC |
| Bmac0113 | 5H | (AT)7(AC)18 | 187 | F:TCAAAAGCCGGTCTAATGCT R:GTGCAAAGAAAATGCACAGATAG |
| Bmac0134 | 2H | (AC)28 | 148 | F:CCAACTGAGTCGATCTCG R :CTTCGTTGCTTCTCTACCTT |
| Bmac0096 | 5H | (AT)6(AC)16 | 173 | F:GCTATGGCGTACTATGTATGGTTG R :TCACGATGAGGTATGATCAAAGA |
| Bmac0316 | 6H | (AC)19 | 135 | F:ATGGTAGAGGTCCCAACTG R :ATCACTGCTGTGCCTAGC |
| Bmac0018 | 6H | (AC)11 | 138 | F:GTCCTTTACGCATGAACCGT R : ACATACGCCAGACTCGTGTG |
| Bmac0209 | 3H | (AC)13 | 176 | F:CTAGCAACTTCCCAACCGAC R :ATGCCTGTGTGTGGACCAT |
| Bmac0273 | 7H | (AC)2(AG)20 | 186 | F:ACAAAGCTCGTGGTACGT R: AGGGAGTATTTCACCCTTG |
| Bmac0032 | 1H | (AC)7T(CA)15(AT)9 | 215 | F:CCATCAAAGTCCGGCTAG R GTCGGGCCTCATACTGAC |
| Bmac0156 | 6H | (GA)13 | 0.162 | F:AGGAAGTCATTGCGTGAG R:TGATCAAGAATGATAACATGG |
| Bmag0378 | 2H | (AG)14 | 147 | F : CTTTTGTTTCCGTAGCATCTA R ATCCAACTATAGTAGCAAAGCC |
| Bmag0009 | 6H | (AG)13 | 172 | F:AAGTGAAGCAAGCAAACAAACA R :ATCCTTCCATATTTTGATTAGGCA |
| Bmag0120 | 7H | (AG)15 | 230 | F:ATTTCATCCCAAAGGAGAC R GTCACATAGACAGTTGTCTTCC |
| Bmag0206 | 7H | (GT)5(AG)14 | 239 | F:TTTTCCCCTATTATAGTGACG R:TAGAACTGGGTATTTCCTTGA |
| Ebmac0705 | 3H | (AC)16 | 150 | F:GTGGAAAACTGAGTGAAACTC R TTGAGGAGAAGTAATGACGAT |
| Ebmac0806 | 6H | (CA)4(GA)(CA)8,(CA)5 | 168 | F:ACTAAGTCCTTTCACGAGGA R :GTGTGTAGTAGGTGGGTACTTG |
| HVM22 | 6H | (AC)13 | 0.167 | F:TTTTGGGGGATGCCTACATA R TTTCAAATGGTTGGATTGGA |
| HVM65 | 6H | (GA)10 | 0.129 | F:AGACATCCAAAAAATGAACCA R:TGGTAACTTGTCCCCCAAAG |
| HVM14 | 6H | (CA)11 | 0.158 | F:CGATCAAGGACATTTGGGTAAT R :AACTCTTCGGGTTCAACCAATA |
| HVM74 | 6H | (GA)13 | 0.162 | F:AGGAAGTCATTGCGTGAG R:TGATCAAGAATGATAACATGG |
| Hvleu | 5H | (ATTT)4 | 0.166 | F:TTGGAAGTGTACAGCAATGGAG R TGAAAGGCCCCACAAGATAG |
| Ryd2 | 3H |
| Locus. | Ss | NA | MAF | G.div | PIC | Ne | He | Ho | Fst | Nm | HWE |
|---|---|---|---|---|---|---|---|---|---|---|---|
| bmac0213 | 33 | 5 | 0.48 | 0.68 | 0.64 | 3,39 | 0,70 | 0.00 | 0,88 | 0,034 | *** |
| bma0181 | 33 | 3 | 0.61 | 0.55 | 0.49 | 2,24 | 0,55 | 0.00 | 0,91 | 0,026 | *** |
| bmac0040 | 33 | 3 | 0.84 | 0.28 | 0.26 | 1,38 | 0,27 | 0.00 | 0,95 | 0,012 | *** |
| bmac0093 | 33 | 5 | 0.60 | 0.59 | 0.55 | 2,43 | 0,59 | 0.00 | 0,90 | 0,028 | *** |
| bmac0018 | 33 | 6 | 0.48 | 0.64 | 0.59 | 2,81 | 0,64 | 0.00 | 0,89 | 0,030 | *** |
| bmac0156 | 33 | 3 | 0.90 | 0.19 | 0.18 | 1,23 | 0,19 | 0.00 | 0,97 | 0,008 | *** |
| bmac0032 | 33 | 1 | 1.00 | 0.00 | 0.00 | 1,00 | 0,00 | 0,00 | 1,00 | 0,000 | - |
| bmac0067 | 33 | 6 | 0.35 | 0.76 | 0.73 | 4,2 | 0,76 | 0.00 | 0,87 | 0,037 | *** |
| bmac0113 | 33 | 5 | 0.36 | 0.70 | 0.64 | 3,33 | 0,70 | 0.00 | 0,88 | 0,033 | *** |
| bmac0273 | 33 | 3 | 0.90 | 0.18 | 0.17 | 1,22 | 0,18 | 0.00 | 0,96 | 0,008 | *** |
| bmac0134 | 33 | 7 | 0.37 | 0.75 | 0.71 | 3,98 | 0,75 | 0.00 | 0,87 | 0,036 | *** |
| bmac0096 | 33 | 4 | 0.63 | 0.56 | 0.52 | 2,29 | 0,56 | 0.00 | 0,90 | 0,026 | *** |
| bmac0209 | 33 | 4 | 0.53 | 0.57 | 0.49 | 2,39 | 0,57 | 0.00 | 0,90 | 0,027 | *** |
| bmac0316 | 33 | 4 | 0.47 | 0.60 | 0.52 | 2,51 | 0,60 | 0.00 | 0,89 | 0,028 | *** |
| ebmac0806 | 33 | 8 | 0.21 | 0.84 | 0.83 | 6,43 | 0,84 | 0.00 | 0,85 | 0,041 | *** |
| ebmac0705 | 33 | 3 | 0.50 | 0.57 | 0.48 | 2,35 | 0,57 | 0.00 | 0,90 | 0,027 | *** |
| bmag0378 | 33 | 2 | 0.97 | 0.06 | 0.06 | 1,06 | 0,06 | 0.00 | 0,99 | 0,003 | *** |
| bmag0206 | 33 | 4 | 0.48 | 0.64 | 0.57 | 2,79 | 0,64 | 0.00 | 0,89 | 0,030 | *** |
| bmag0013 | 33 | 3 | 0.54 | 0.57 | 0.49 | 2,24 | 0,55 | 0,00 | 0,91 | 0,026 | *** |
| bmag0009 | 33 | 8 | 0.24 | 0.84 | 0.82 | 5,95 | 0,83 | 0.00 | 0,86 | 0,040 | *** |
| bmag0120 | 33 | 3 | 0.42 | 0.66 | 0.58 | 2,90 | 0,66 | 0.00 | 0,89 | 0,031 | *** |
| hvm65 | 33 | 1 | 1.00 | 0.00 | 0.00 | 1,00 | 0,00 | 0.00 | 1,00 | 0,000 | - |
| hvm22 | 33 | 1 | 1.00 | 0.00 | 0.00 | 1,00 | 0,00 | 0.00 | 1,00 | 0,000 | - |
| hvm74 | 33 | 4 | 0.58 | 0.58 | 0.52 | 2,37 | 0,58 | 0.00 | 0,90 | 0,027 | *** |
| hvm14 | 33 | 6 | 0.31 | 0.78 | 0.75 | 4,5 | 0,79 | 0.00 | 0,87 | 0,037 | *** |
| hvleu | 33 | 6 | 0.33 | 0.78 | 0.74 | 4,45 | 0,78 | 0.00 | 0,87 | 0,037 | *** |
| ryd2 | 33 | 2 | 0.90 | 0.17 | 0.16 | 1,21 | 0,17 | 0.00 | 0,97 | 0,008 | *** |
| Mean | 4.2 | 0.59 | 0.50 | 0.46 | 2,69 | 0,50 | 0,92 | 0,024 | |||
| SE | 0,381 | 0,28 | 0,05 | 0,009 | 0,003 |
| Accessions | Na | Ne | He | Fst | NPA | ||
|---|---|---|---|---|---|---|---|
| Freq.˂5 | Freq.≥5 | Total | |||||
| saltad | 6 | 3,09 | 0,68 | 0,83 | 4 | 17 | 21 |
| Raselmoch1oa | 5 | 3,74 | 0,73 | 0,81 | 5 | 12 | 17 |
| azrirad | 6 | 3,74 | 0,73 | 0,81 | 10 | 11 | 21 |
| safraBA | 5 | 3,25 | 0,69 | 0,82 | 12 | 6 | 18 |
| Chir B | 6 | 4,51 | 0,78 | 0,80 | 8 | 15 | 23 |
| safra AD | 5 | 3,25 | 0,69 | 0,82 | 6 | 11 | 17 |
| obyad ba1 | 6 | 2,75 | 0,64 | 0,84 | 0 | 17 | 17 |
| bourabaa Ba | 6 | 3,79 | 0,74 | 0,81 | 14 | 8 | 22 |
| chater ad | 7 | 4,09 | 0,76 | 0,81 | 10 | 8 | 18 |
| chaterker | 6 | 3,70 | 0,73 | 0,81 | 17 | 11 | 28 |
| saida SBA | 4 | 3,20 | 0,69 | 0,83 | 7 | 15 | 22 |
| faouara SBA | 6 | 3,31 | 0,70 | 0,82 | 0 | 10 | 10 |
| saidaG3 | 6 | 3,70 | 0,73 | 0,81 | 19 | 6 | 25 |
| SaidaSL | 7 | 2,51 | 0,60 | 0,85 | 12 | 10 | 22 |
| rihane SBA | 6 | 3,89 | 0,74 | 0,81 | 22 | 6 | 28 |
| saida G4 | 6 | 3,27 | 0,69 | 0,82 | 12 | 10 | 22 |
| rihane Md. | 6 | 4,43 | 0,77 | 0,80 | 17 | 6 | 23 |
| saida r1 | 7 | 3,84 | 0,74 | 0,81 | 0 | 21 | 21 |
| FaouaraSBA | 5 | 3,57 | 0,72 | 0,82 | 12 | 16 | 28 |
| Saida BA | 6 | 4,30 | 0,77 | 0,81 | 6 | 10 | 16 |
| AscadSBA | 5 | 3,63 | 0,73 | 0,82 | 12 | 10 | 22 |
| bourabaaAD. | 7 | 4,30 | 0,77 | 0,81 | 4 | 15 | 19 |
| Faouara SBA1 | 6 | 4,30 | 0,77 | 0,81 | 8 | 21 | 29 |
| RaselmouchAD | 6 | 4,04 | 0,75 | 0,81 | 5 | 19 | 24 |
| obyadBA2 | 6 | 4,45 | 0,78 | 0,80 | 5 | 17 | 22 |
| RihaneAdf | 7 | 4,12 | 0,76 | 0,81 | 5 | 16 | 21 |
| SafraAd. | 5 | 3,76 | 0,73 | 0,81 | 14 | 15 | 29 |
| SaidaMd | 6 | 4,30 | 0,77 | 0,81 | 6 | 11 | 17 |
| SaidaAdf | 7 | 3,21 | 0,69 | 0,83 | 5 | 16 | 21 |
| TichedrettMd | 4 | 3,79 | 0,74 | 0,81 | 19 | 9 | 28 |
| oBeldiAd | 5 | 3,41 | 0,71 | 0,82 | 0 | 10 | 10 |
| TichedrettSBA | 5 | 3,89 | 0,74 | 0,81 | 11 | 6 | 17 |
| SaidaB | 5 | 2,77 | 0,64 | 0,84 | 5 | 10 | 15 |
| Mean | 3.69 | 0.72 | 0.82 | ||||
| Source | degrees of freedom(Df) | Sum of squares (SS) | Means of squares (MS) | Est. Var. | % | Stat | value | prob |
|---|---|---|---|---|---|---|---|---|
| Among populations | 5 | 87,737 | 17,547 | 0,206 | 3% | |||
| Among individuals within populations | 27 | 415,657 | 15,395 | 7,697 | 97% | 0,026 | 0,138 | |
| Total | 65 | 503,394 | 7,903 | 100% |
Disclaimer/Publisher’s Note: The statements, opinions and data contained in all publications are solely those of the individual author(s) and contributor(s) and not of MDPI and/or the editor(s). MDPI and/or the editor(s) disclaim responsibility for any injury to people or property resulting from any ideas, methods, instructions or products referred to in the content. |
© 2024 by the authors. Licensee MDPI, Basel, Switzerland. This article is an open access article distributed under the terms and conditions of the Creative Commons Attribution (CC BY) license (http://creativecommons.org/licenses/by/4.0/).


