Submitted:
01 July 2024
Posted:
02 July 2024
You are already at the latest version
Abstract

Keywords:
1. Introduction
2. Extending τeq(T) to above Tg

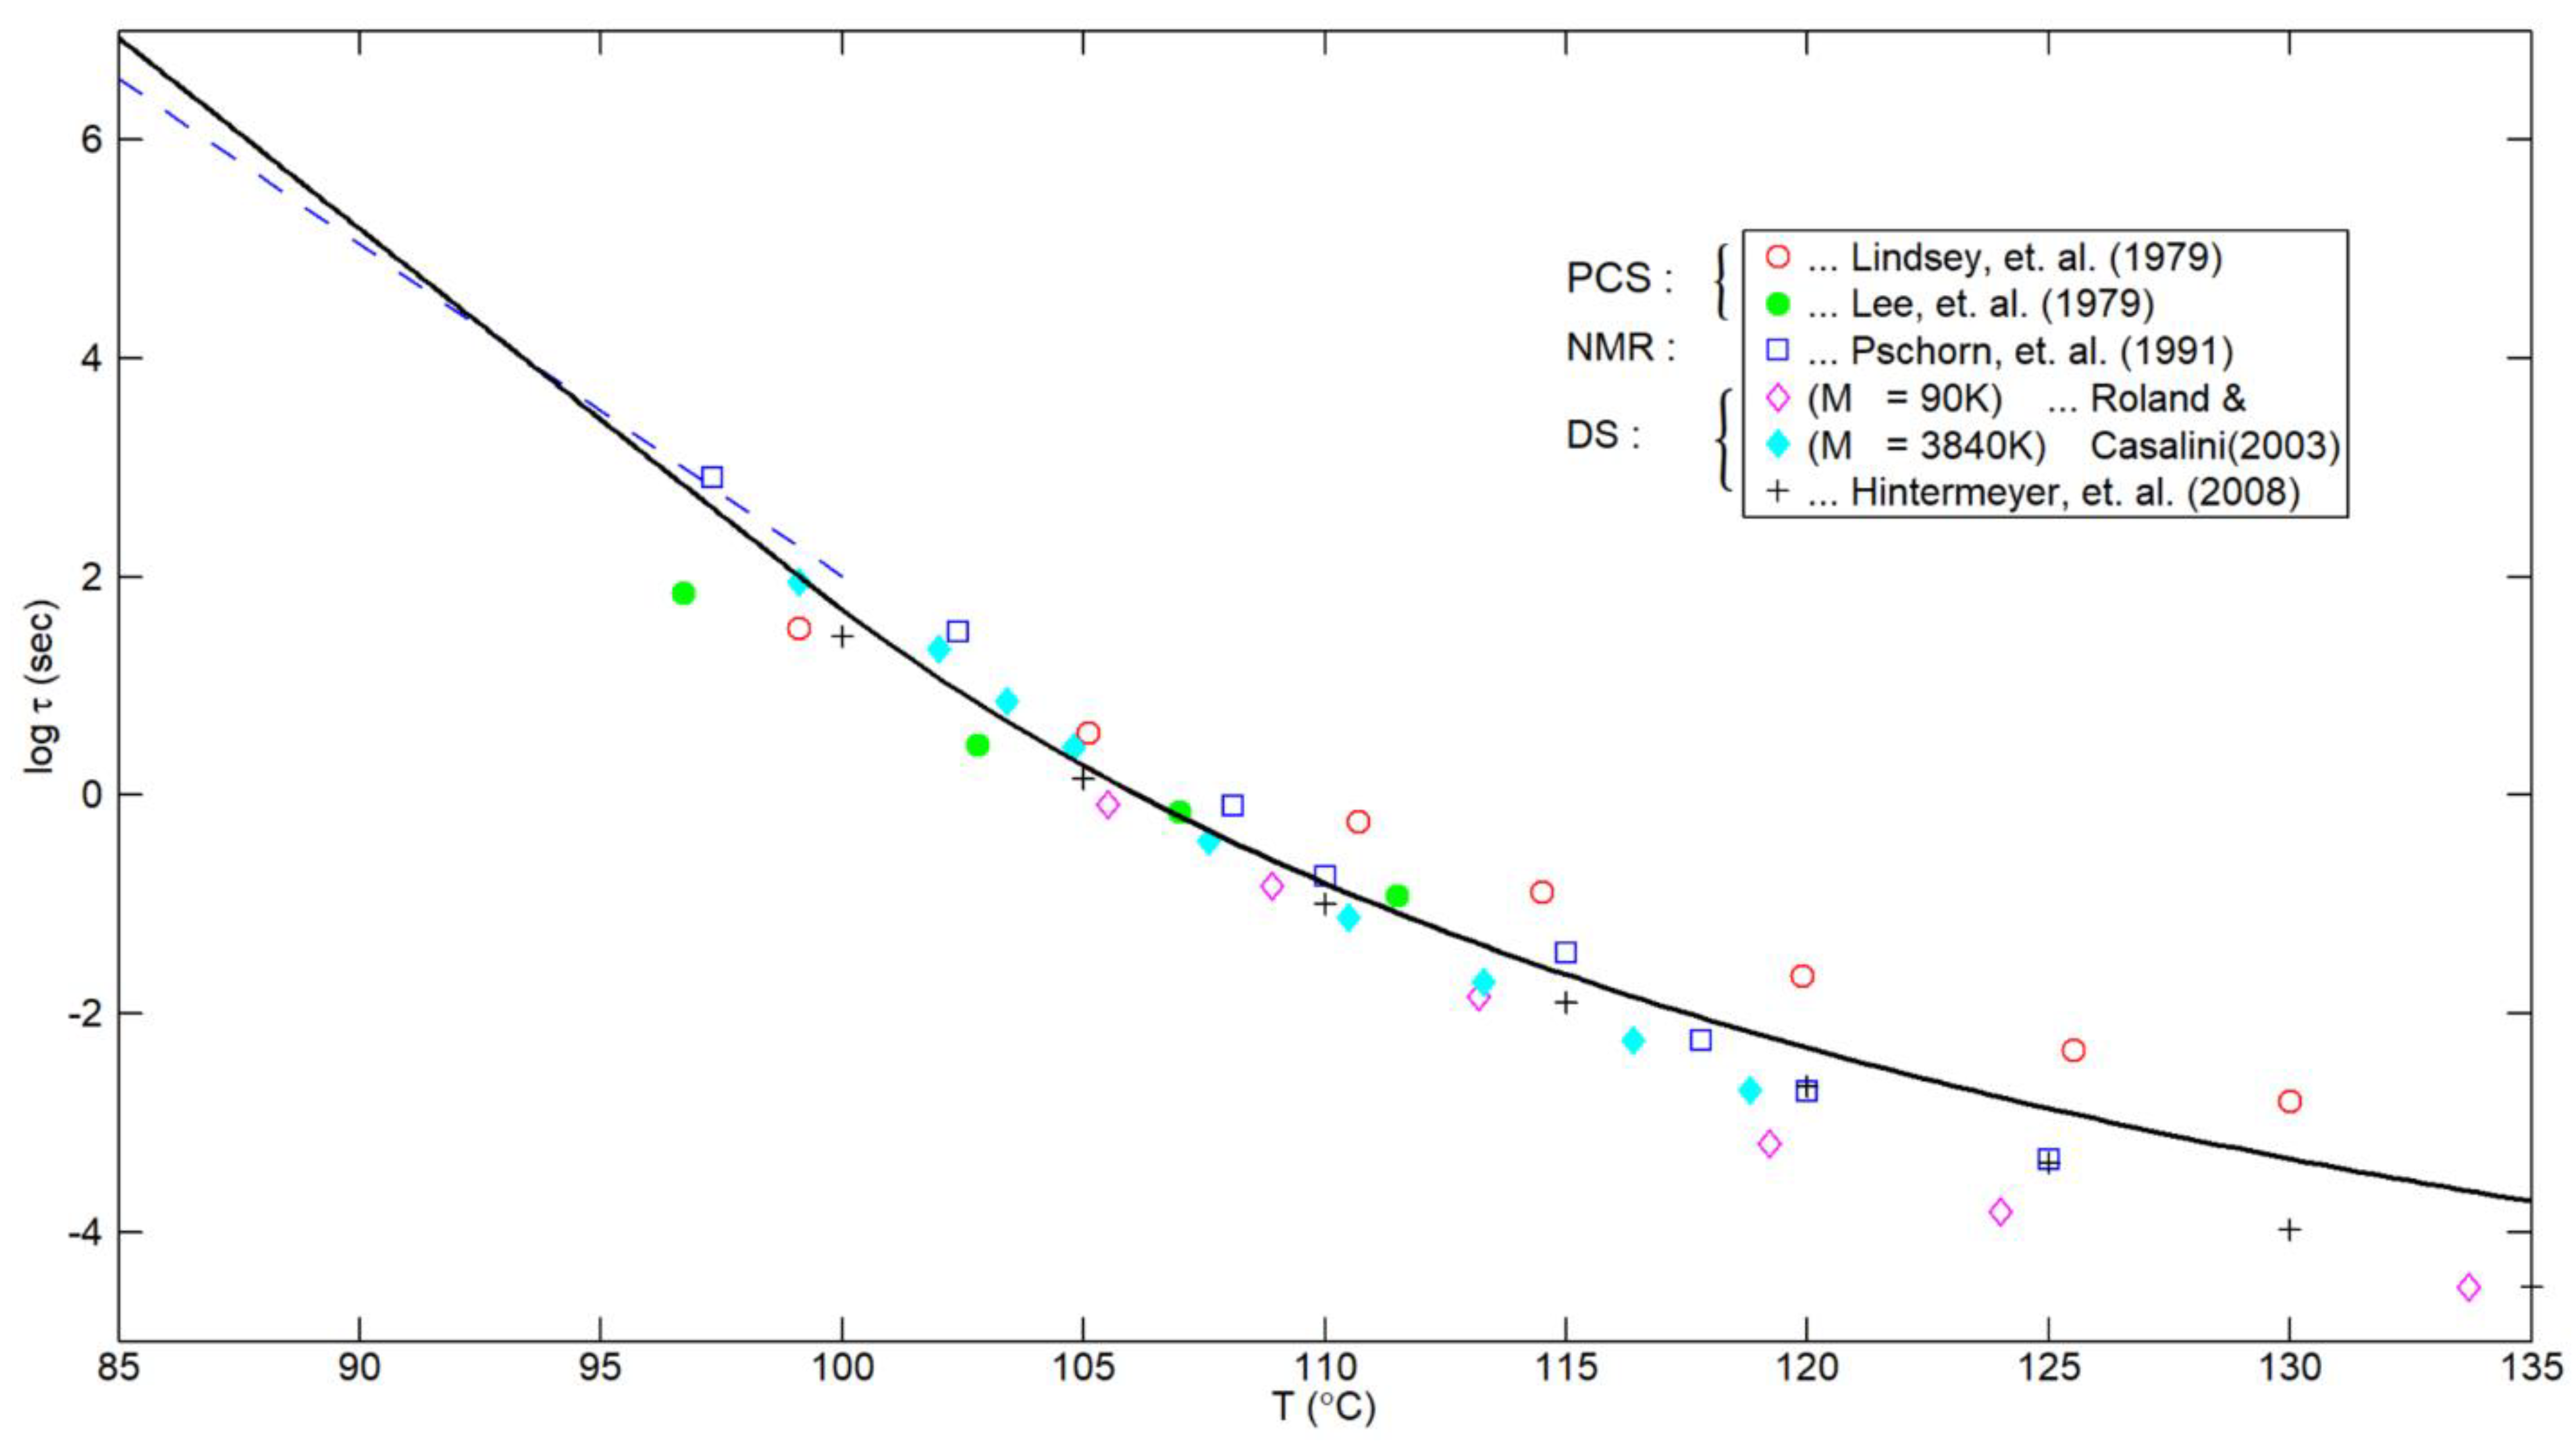
3. Comparison with Experimental Results for the Segmental-Relaxation Time
4. Behavior at Higher Temperatures
5. An Unanticipated Corroboration
6. Conclusions
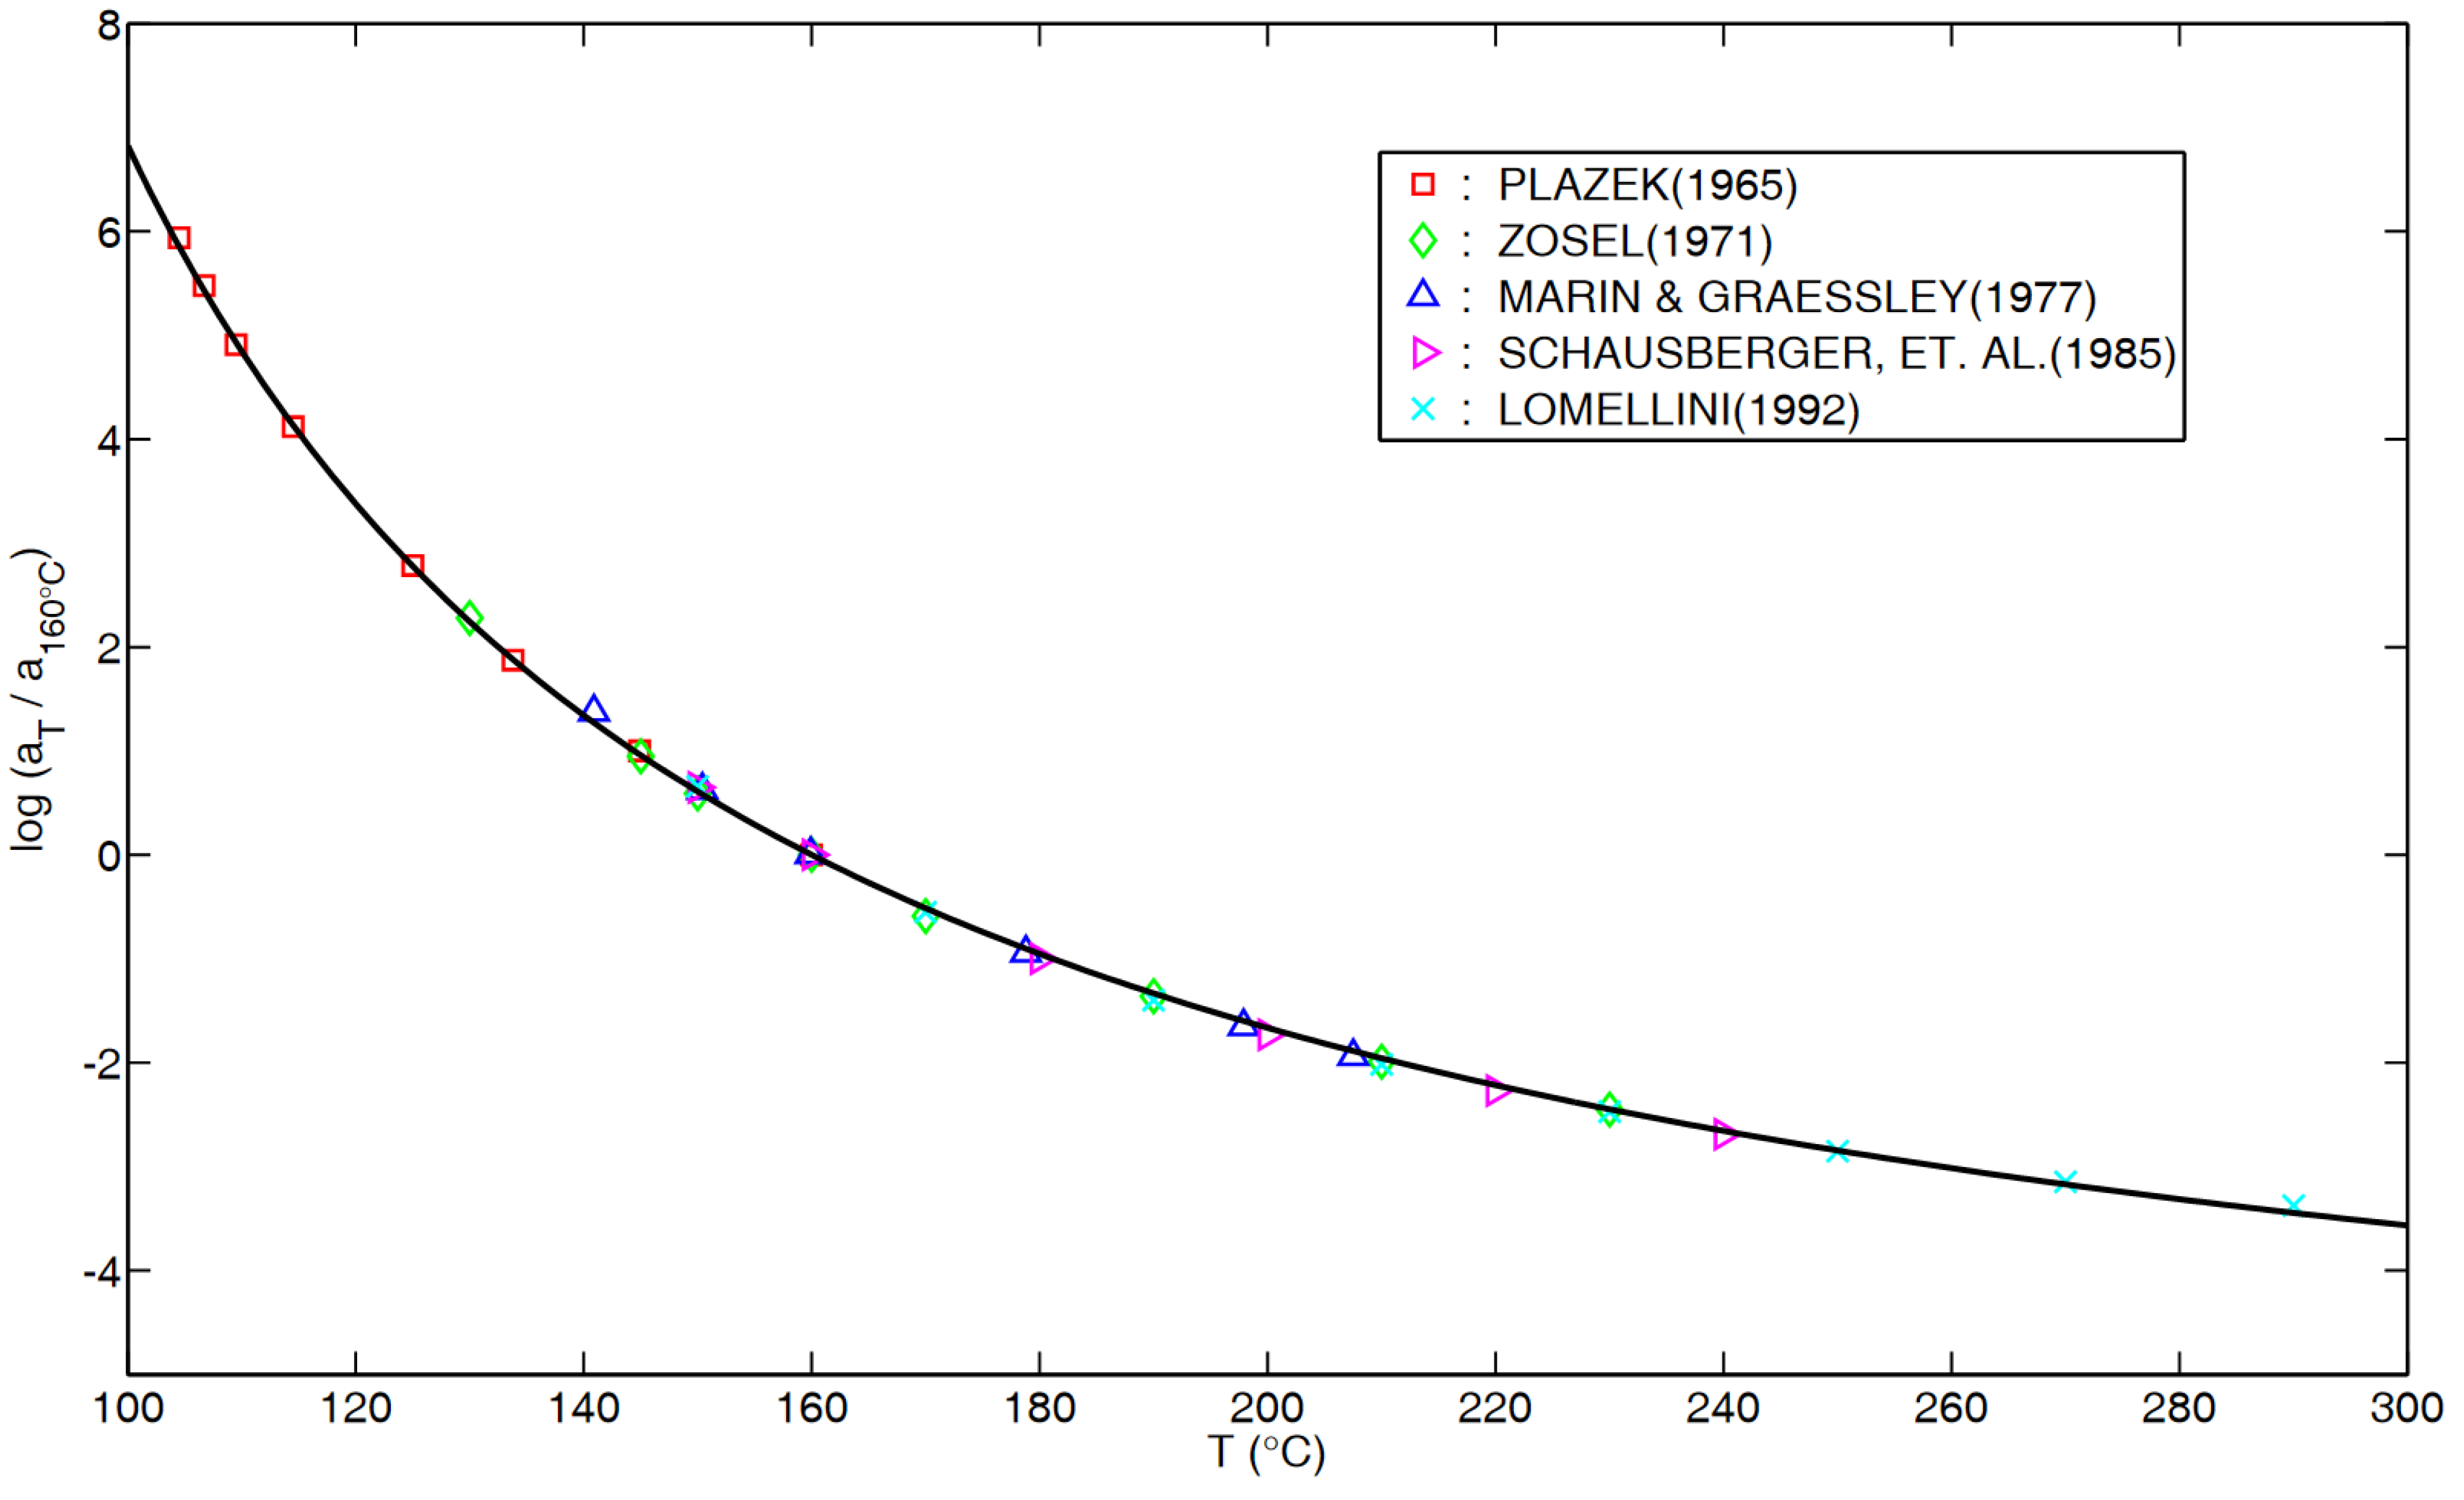
Appendix A: for PS in “Flow Regime”
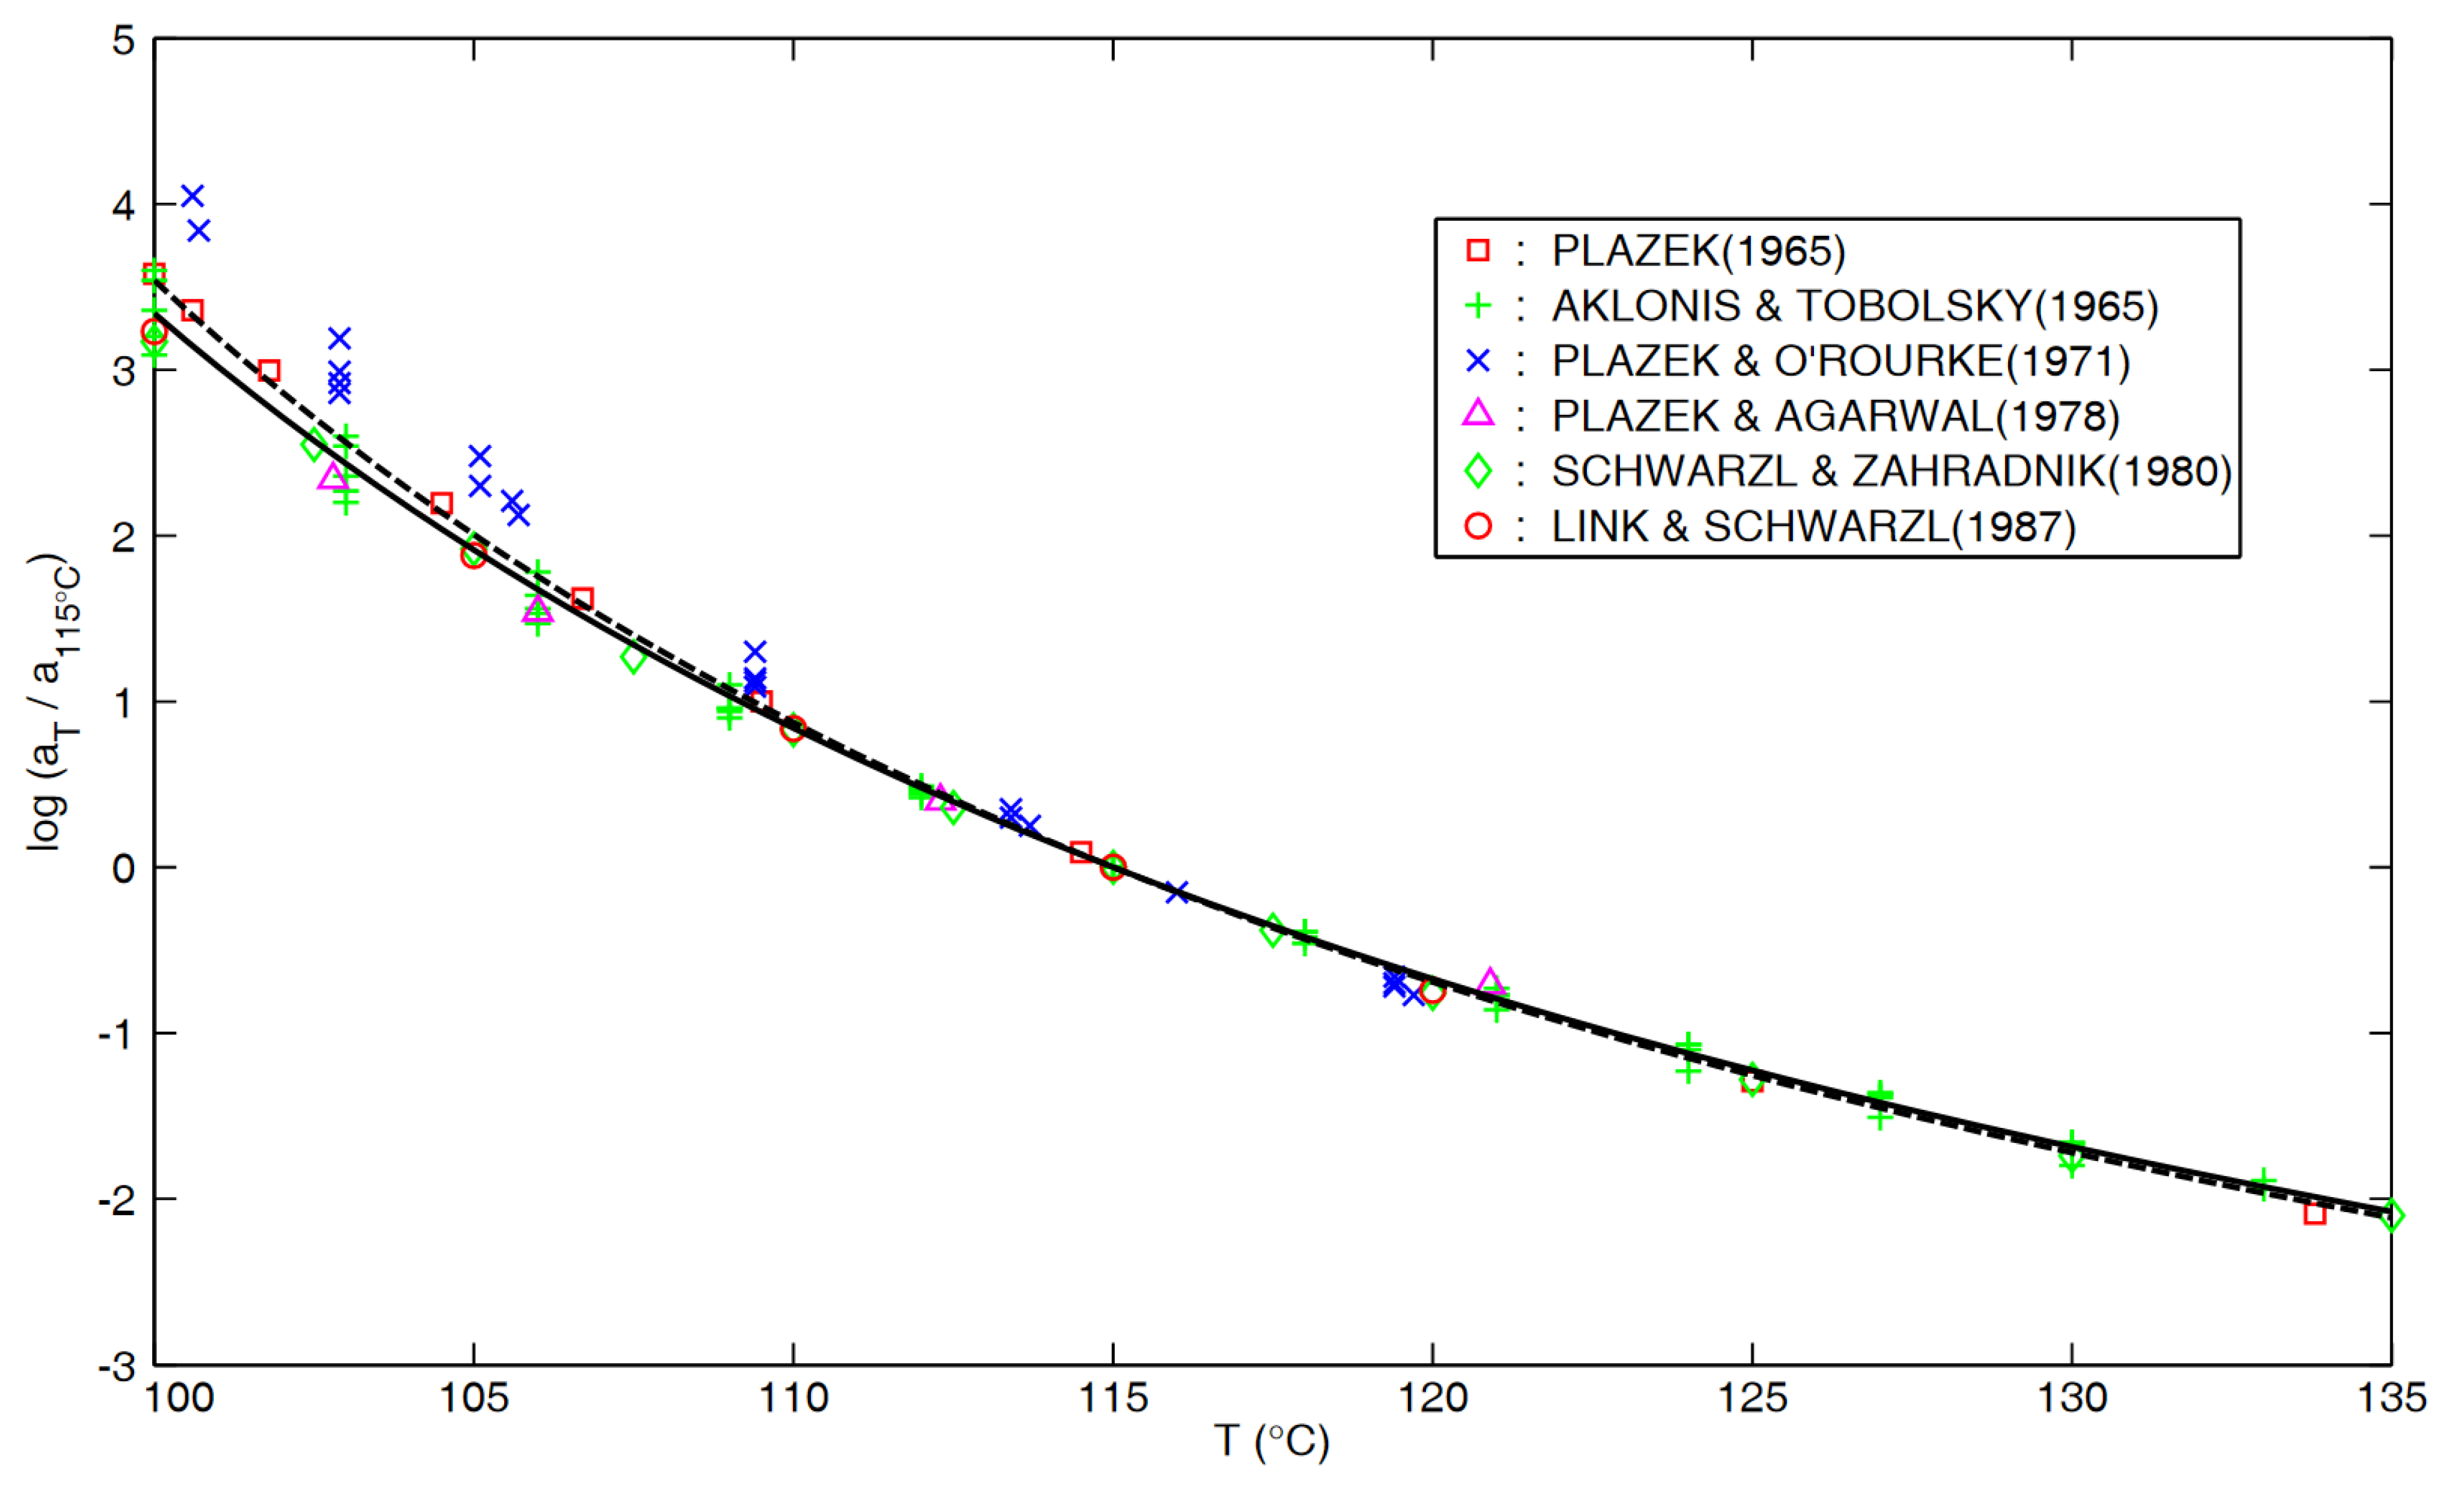
Appendix B: aT for PS in “Glass-Rubber Transition”
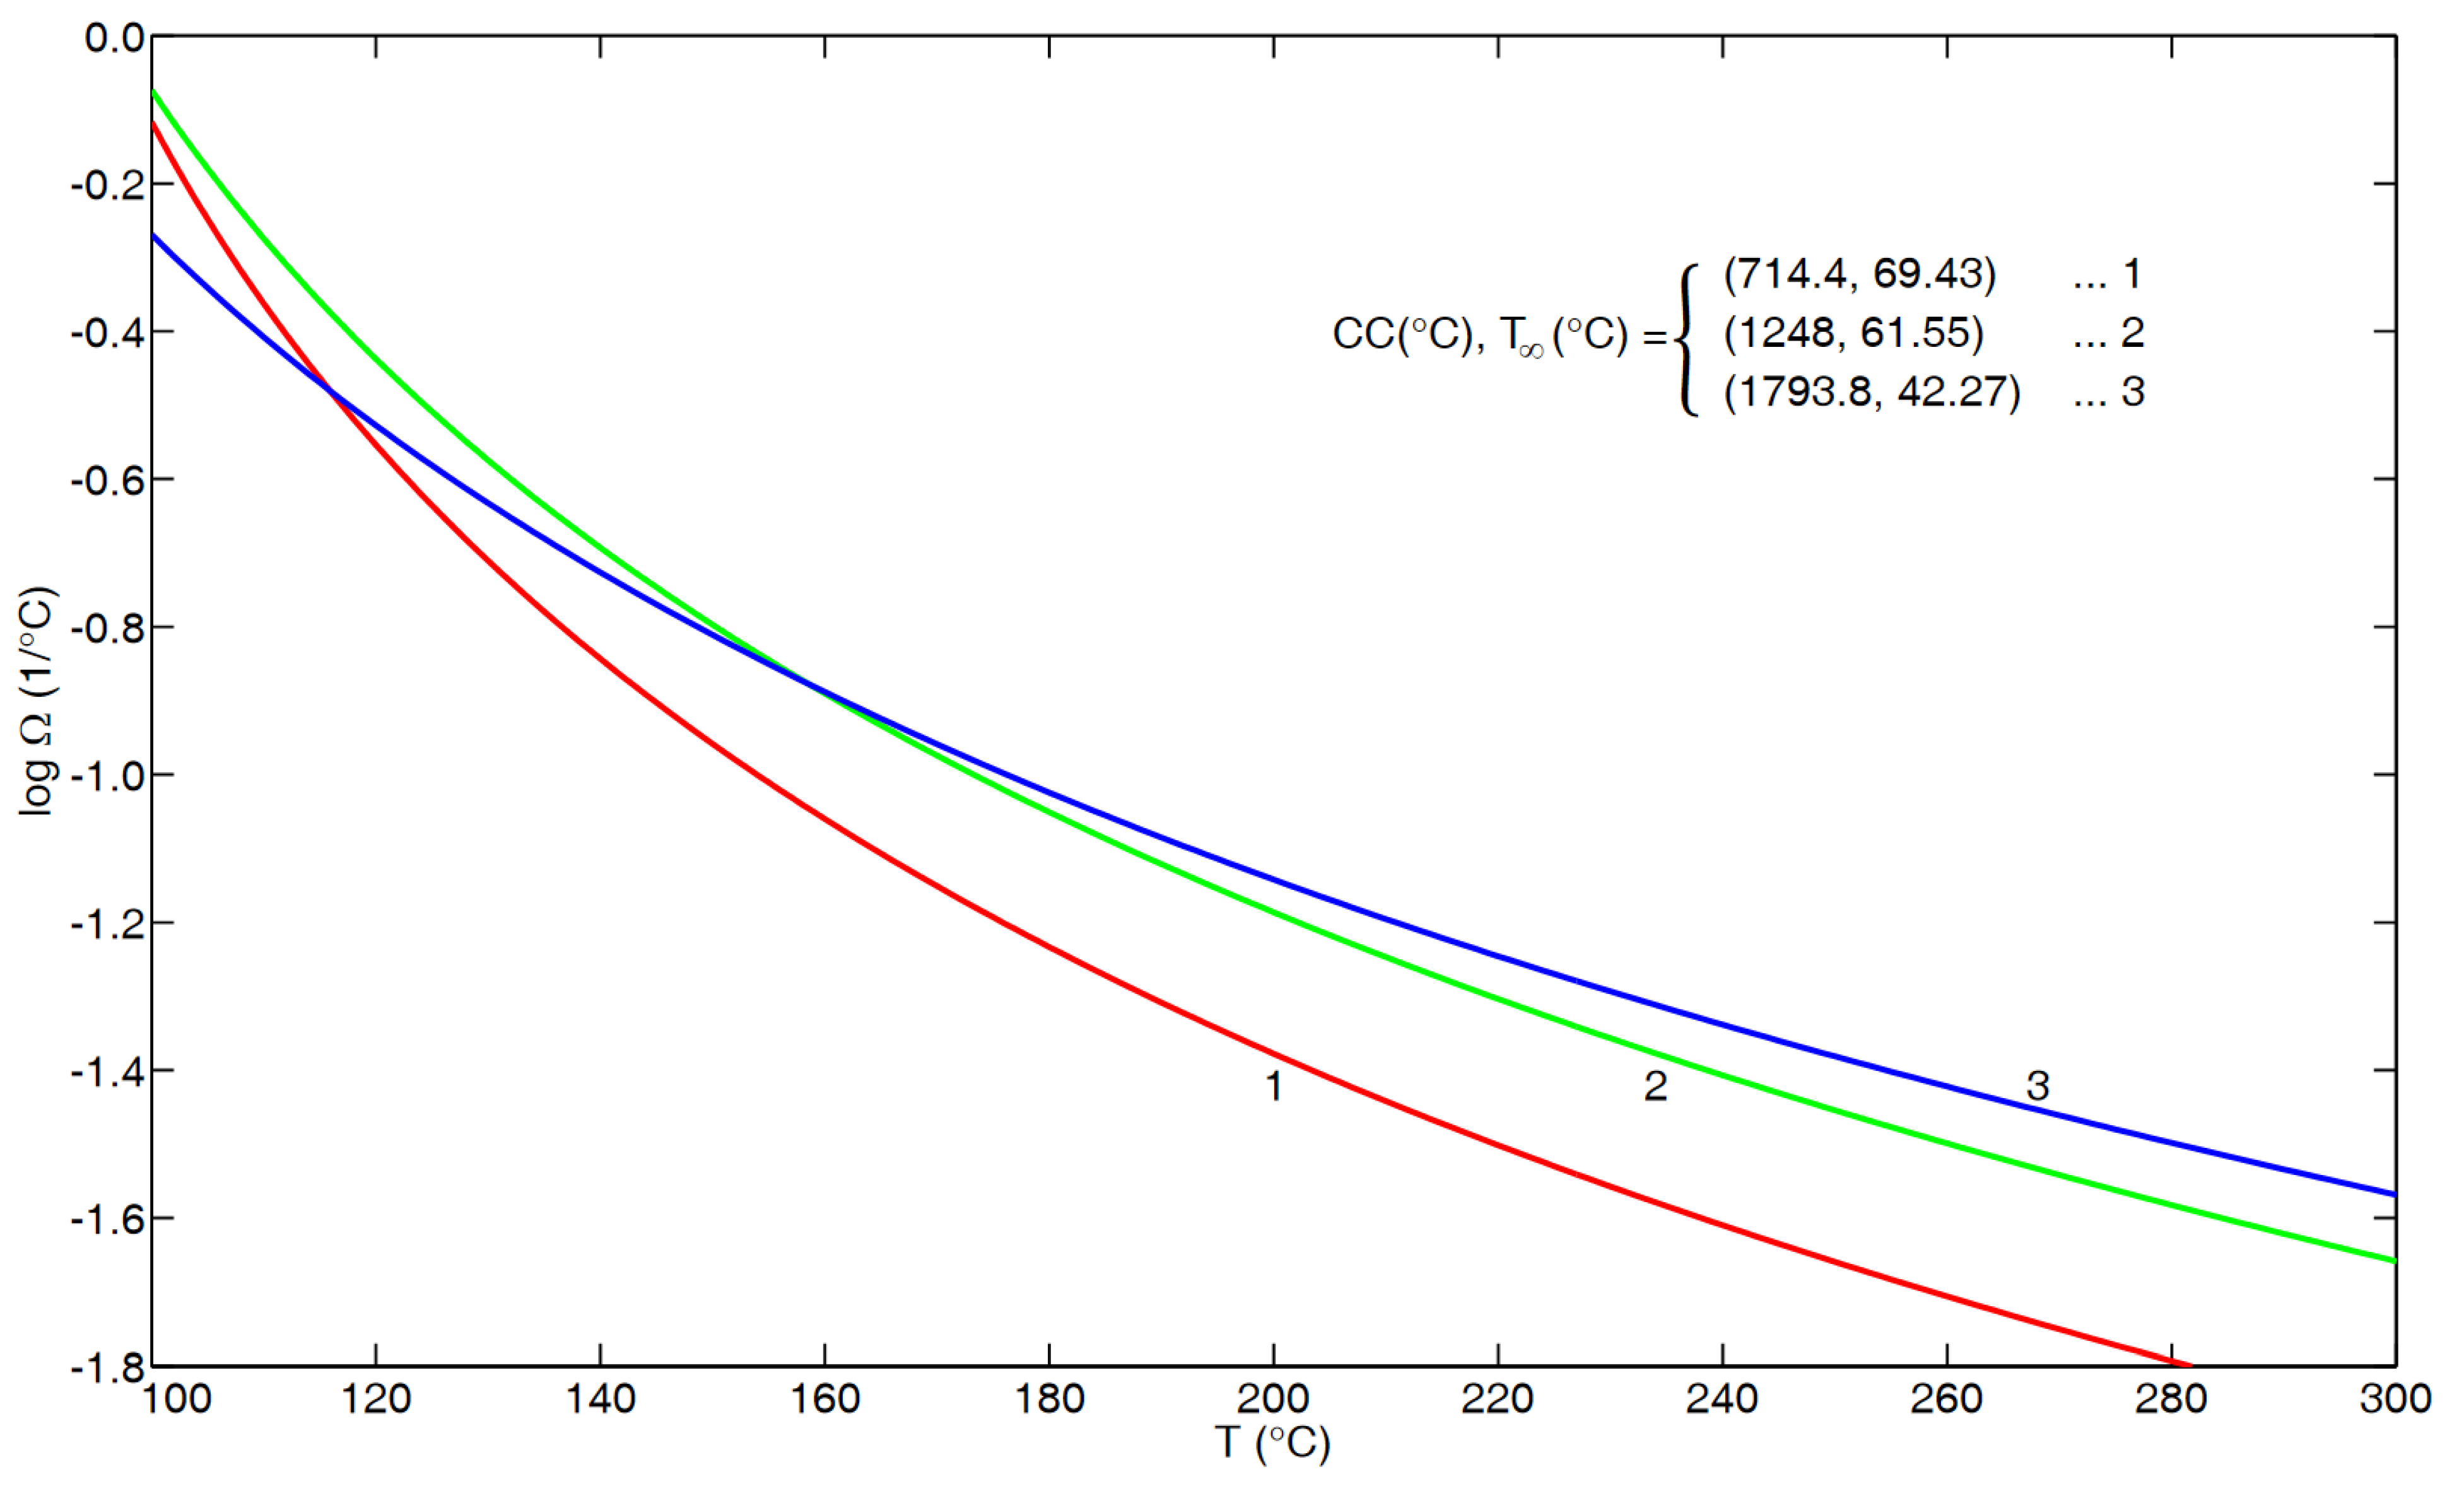
Appendix C: Further Considerations
Appendix D: Calculating Ω(1/ºC) at Moderate Mw
| Mw | Tg(ºK) | m | Ω(1/ºC) |
| 311 | 126.3 | 107.1 | 1.95 |
| 311 | 126.3 | 116.1 | 2.12 |
| 860 | 133.6 | 100.9 | 1.74 |
| 1600 | 138.2 | 108.0 | 1.80 |
| 1600 | 138.2 | 110.0 | 1.83 |
| 2490 | 139.9 | 110.0 | 1.81 |
| 3510 | 141.5 | 111.0 | 1.81 |
| 4560 | 142.4 | 111.4 | 1.80 |
| 5940 | 143.0 | 113.2 | 1.82 |
| 11.0K | 144.0 | 115.1 | 1.84 |
| 21.6K | 144.2 | 113.6 | 1.81 |
| 41.4K | 144.5 | 114.1 | 1.82 |
| 128K | 144.4 | 116.1 | 1.85 |
| 232K | 144.6 | 115.0 | 1.83 |
| Mw | Tg(ºK) | m | Ω(1/ºC) |
| 106 | 114.7 | 81.6 | 1.64 |
| 162 | 138.9 | 76.8 | 1.27 |
| 370 | 231.9 | 78.0 | 0.77 |
| 690 | 261.4 | 72.1 | 0.64 |
| 1350 | 314.2 | 97.0 | 0.71 |
| 3250 | 347.0 | 107.5 | 0.71 |
| 8900 | 356.9 | 105.4 | 0.68 |
| 19.1K | 367.9 | 116.2 | 0.73 |
| 33.5K | 369.0 | 119.6 | 0.75 |
| 96.0K | 372.6 | 120.9 | 0.75 |
| 243K | 373.3 | 122.6 | 0.76 |
| 546K | 372.0 | 122.0 | 0.76 |
| Mw | Tg(ºK) | m | Ω(1/ºC) |
| 355 | 140.9 | 70.0 | 1.14 |
| 466 | 161.2 | 71.1 | 1.02 |
| 575 | 162.1 | 73.0 | 1.04 |
| 777 | 165.3 | 78.0 | 1.09 |
| 1450 | 170.7 | 81.1 | 1.09 |
| 2020 | 173.6 | 83.0 | 1.10 |
| 2760 | 174.5 | 88.0 | 1.16 |
| 4600 | 174.0 | 90.9 | 1.20 |
| 19.9K | 175.3 | 90.0 | 1.18 |
| 35.3K | 174.5 | 90.9 | 1.20 |
| 87.0K | 174.4 | 90.5 | 1.19 |
References
- Hieber, C.A. Modelling the Density Relaxation of Polystyrene. Rheol Acta 2022, 61, 523–538. [Google Scholar] [CrossRef]
- O’Connell, P.A.; McKenna, G.B. Arrhenius-type Temperature Dependence of the Segmental Relaxation Below Tg. J. Chem Phys 1999, 110, 11054–11060. [Google Scholar] [CrossRef]
- Zhao, J.; McKenna, G.E. Temperature Divergence of the Dynamics of a Poly (vinyl acetate) Glass: Dielectric vs. Mechanical Behaviors. J. Chem Phys 2012, 136, 154901. [Google Scholar] [CrossRef]
- Roland, C.M.; Casalini, R. Temperature Dependence of Local Segmental Motion in Polystyrene and its Variation with Molecular Weight. J. Chem Phys 2003, 119, 1838–1842. [Google Scholar] [CrossRef]
- He, Y.; Lutz, T.R.; Ediger, M.D.; Ayyagari, C.; Bedrov, D.; Smith, G.D. NMR Experiments and Molecular Simulations of the Segmental Dynamics of Polystyrene. Macromolecules 2004, 37(13), 5032–5039. [Google Scholar] [CrossRef]
- Vogel, H. Das Temperatur-Abhangigklitsgersetz der Viskosität von Flüssigkeiten. Phys Z 1921, 22, 645–646. [Google Scholar]
- Fulcher, G.S. Analysis of Recent Measurements of the Viscosity of Glasses. J Am Ceram Soc 1925, 8(6), 339–355. [Google Scholar] [CrossRef]
- Tammann, G.; Hesse, W. Die Abhängegkeit der Viskosität von der Temperatur bei Unterkühlten Flüssigkeiten. Z Anorg Allg Chem 1926, 156, 245–257. [Google Scholar] [CrossRef]
- Plazek, D.J. Temperature Dependence of the Viscoelastic Behavior of Polystyrene. J. Phys Chem 1965, 69(10), 3480–3487. [Google Scholar] [CrossRef]
- Zosel, J. Der Einfluss von Molekulargewicht und Molekulargewichtsverteilung auf die Viskoelastischen Eigenschaften von Polystyrolschmelzen. Rheol Acta 1971, 10(2), 215–224. [Google Scholar] [CrossRef]
- Marin, G.; Graessley, W. Viscoelastic Properties of High Molecular Weight Polymers in the Molten State; 1: Study of Narrow Molecular Weight Distribution Samples. Rheol Acta 1977, 16(5), 527–533. [Google Scholar] [CrossRef]
- Schausberger, A.; Schindlauer, G.; Janeschitz-Kriegl, H. Linear Elastico-Viscous Properties of Molten Standard Polystyrenes; I: Presentation of Complex Moduli; Role of Short Range Structural Parameters. Rheol Acta 1985, 24(3), 220–227. [Google Scholar] [CrossRef]
- Lomellini, P. Williams-Landel-Ferry Versus Arrhenius Behavior: Polystyrene Melt Viscoelasticity Revised. Polymer 1992, 33(23), 4983–4989. [Google Scholar] [CrossRef]
- Aklonis, J.J.; Tobolsky, A.V. Stress Relaxation and Creep Master Curves for Several Monodisperse Polystyrenes. J. Appl Phys 1965, 36(11), 3483–3486. [Google Scholar] [CrossRef]
- Plazek, D.J.; O’Rourke, V.J. Viscoelastic Behavior of Low Molecular Weight Polystyrene. J. Polym Sci, part A2 1971, 9, 209–243. [Google Scholar] [CrossRef]
- Plazek, D.J.; Agarwal, P. Comparison of Similar Narrow Molecular Weight Polystyrenes. J. Appl Polym Sci 1978, 22(8), 2127–2135. [Google Scholar] [CrossRef]
- Schwarzl, F.R.; Zahradnik, F. The Time Temperature Position of the Glass-Rubber Transition of Amorphous Polymers and the Free Volume. Rheol Acta 1980, 19(2), 137–152. [Google Scholar] [CrossRef]
- Link, G.; Schwarzl, F.R. Shear Creep and Recovery of a Technical Polystyrene. Rheol Acta 1987, 26(4), 375–384. [Google Scholar] [CrossRef]
- Angell, C.A. Relaxation in Liquids, Polymers and Plastic Crystals – Strong/Fragile Patterns and Problems. J. Non-Cryst Solids 1991, 131-133, 13–31. [Google Scholar] [CrossRef]
- Lindsey, C.P.; Patterson, G.D.; Stevens, J. Photon Correlation Spectroscopy of Polystyrene Near the Glass-Rubber Relaxation. J. Polym Sci (Polym Phys Ed) 1979, 17, 1547–1555. [Google Scholar] [CrossRef]
- Lee, H.; Jamieson, A.M.; Simha, R. Photon Correlation Spectroscopy of Polystyrene in the Glass Transition Region. Macromolecules 1979, 12(2), 329–332. [Google Scholar] [CrossRef]
- Pschorn, U.; Rössler, E.; Sillescu, H.; Kaufmann, S.; Schaefer, D.; Spiese, H.W. Local and Cooperative Motions at the Glass Transition of Polystyrene: Information from One- and Two-Dimensional NMR as Compared with Other Techniques. Macromolecules 1991, 24(2), 398–402. [Google Scholar] [CrossRef]
- Hintermeyer, J.; Herrmann, A.; Kahlau, R.; Goiceanu, C.; Rössler, E.A. Molecular Weight Dependence of Glassy Dynamics in Linear Polymers Revisited. Macromolecules 2008, 41(23), 9335–9344. [Google Scholar] [CrossRef]
- Patterson, G.D.; Carroll, P.J.; Stevens, J.R. Photon Correlation Spectroscopy of Polystyrene as a Function of Temperature and Pressure. J. Polym Sci (Phys) 1983, 21(4), 605–611. [Google Scholar] [CrossRef]
- Boyd, R.H.; Smith, G.D. Polymer Dynamics and Relaxation; Cambridge University Press: New York, NY, USA, 2007. [Google Scholar]
- Ferry, J.D. Viscoelastic Properties of Polymers, 3rd Ed ed; Wiley: New York, NY, USA, 1980. [Google Scholar]
- Williams, M.L.; Landel, R.F.; Ferry, J.D. The Temperature Dependence of Relaxation Mechanisms in Amorphous Polymers and Other Glass-Forming Liquids. J. Am Chem Soc 1955, 77, 3701–3707. [Google Scholar] [CrossRef]
- Ngai, K.L. Relaxation and Diffusion in Complex Systems; Springer: New York, NY, USA, 2011. [Google Scholar]
- Nelder, J.A.; Mead, R. A Simplex Method for Function Minimization. Comput J 1965, 7(4), 308–313. [Google Scholar] [CrossRef]
- McKenna, G.B.; Hadziioannou, G.; Lutz, P.; Hild, G.; Strazielle, C.; Straupe, C.; Rempp, P.; Kovacs, A.J. Dilute Solution Characterization of Cyclic Polystyrene Molecules and Their Zero-Shear Viscosity in the Melt. Macromolecules 1987, 20(3), 498–512. [Google Scholar] [CrossRef]
- Ngai, K.L. Physical Properties of Polymers, 3rd ed.; Mark, J., Ngai, K., Graessley, W., Mandelkern, L., Samulski, E., Koenig, J., Wignall, G., Eds.; Cambridge University Press: Cambridge, UK, 2004; pp. 72–152. [Google Scholar]
Disclaimer/Publisher’s Note: The statements, opinions and data contained in all publications are solely those of the individual author(s) and contributor(s) and not of MDPI and/or the editor(s). MDPI and/or the editor(s) disclaim responsibility for any injury to people or property resulting from any ideas, methods, instructions or products referred to in the content. |
© 2024 by the authors. Licensee MDPI, Basel, Switzerland. This article is an open access article distributed under the terms and conditions of the Creative Commons Attribution (CC BY) license (http://creativecommons.org/licenses/by/4.0/).


