Submitted:
02 July 2024
Posted:
02 July 2024
You are already at the latest version
Abstract
Keywords:
1. Introduction
2. Materials and Methods
2.1. Materials
2.2. Electrospun Solutions, Electrospinning, and Fiber Preparation
| Solutions | EC (% w/v) | TTE (mL) | TTE (% m/v) | EC/TTE (w/w) |
|---|---|---|---|---|
| EC | 10 | 0 | 0 | 100/0 |
| EC/TTE0.5 | 9.1 | 0.5 | 8.82 | 53.1/46.9 |
| EC/TTE1.0 | 8.3 | 1.0 | 17.6 | 36.2/63.8 |
| EC/TTE1.5 | 7.7 | 1.5 | 26.4 | 27.4/72.6 |
2.3. Characterization
2.4. Antimicrobial Assay with the Tea Tree Essential Oil and Fibers
2.5. Anti-Adhesive Assay with Bacteria
2.6. Platelet Adhesion Assay
2.7. Whole Blood Coagulation Assay
2.7. Statistical Analysis
3. Results and Discussion
3.1. Solution Properties
| Solutions | Conductivity (μS/cm) | Surface tension (mN/m) | Viscosity (mm²/s) | Size (nm) 1 | WCA (°) 1 |
|---|---|---|---|---|---|
| EC | 1.12±0.12a | 32.6±0.4a | 9.8±0.2a | 478±219a | 120±2a |
| EC/TTE0.5 | 1.07±0.10a | 28.1±0.2b | 8.3±0.1b | 393±120b | 97±4b |
| EC/TTE1.0 | 0.63±0.08b | 28.2±0.2b | 8.2±0.2b | 252±51b | 95±5b |
| EC/TTE1.5 | 0.74±0.07b | 30.1±0.2c | 6.9±0.1c | 278±59b | 69±1c |
3.2. Fiber Characterization
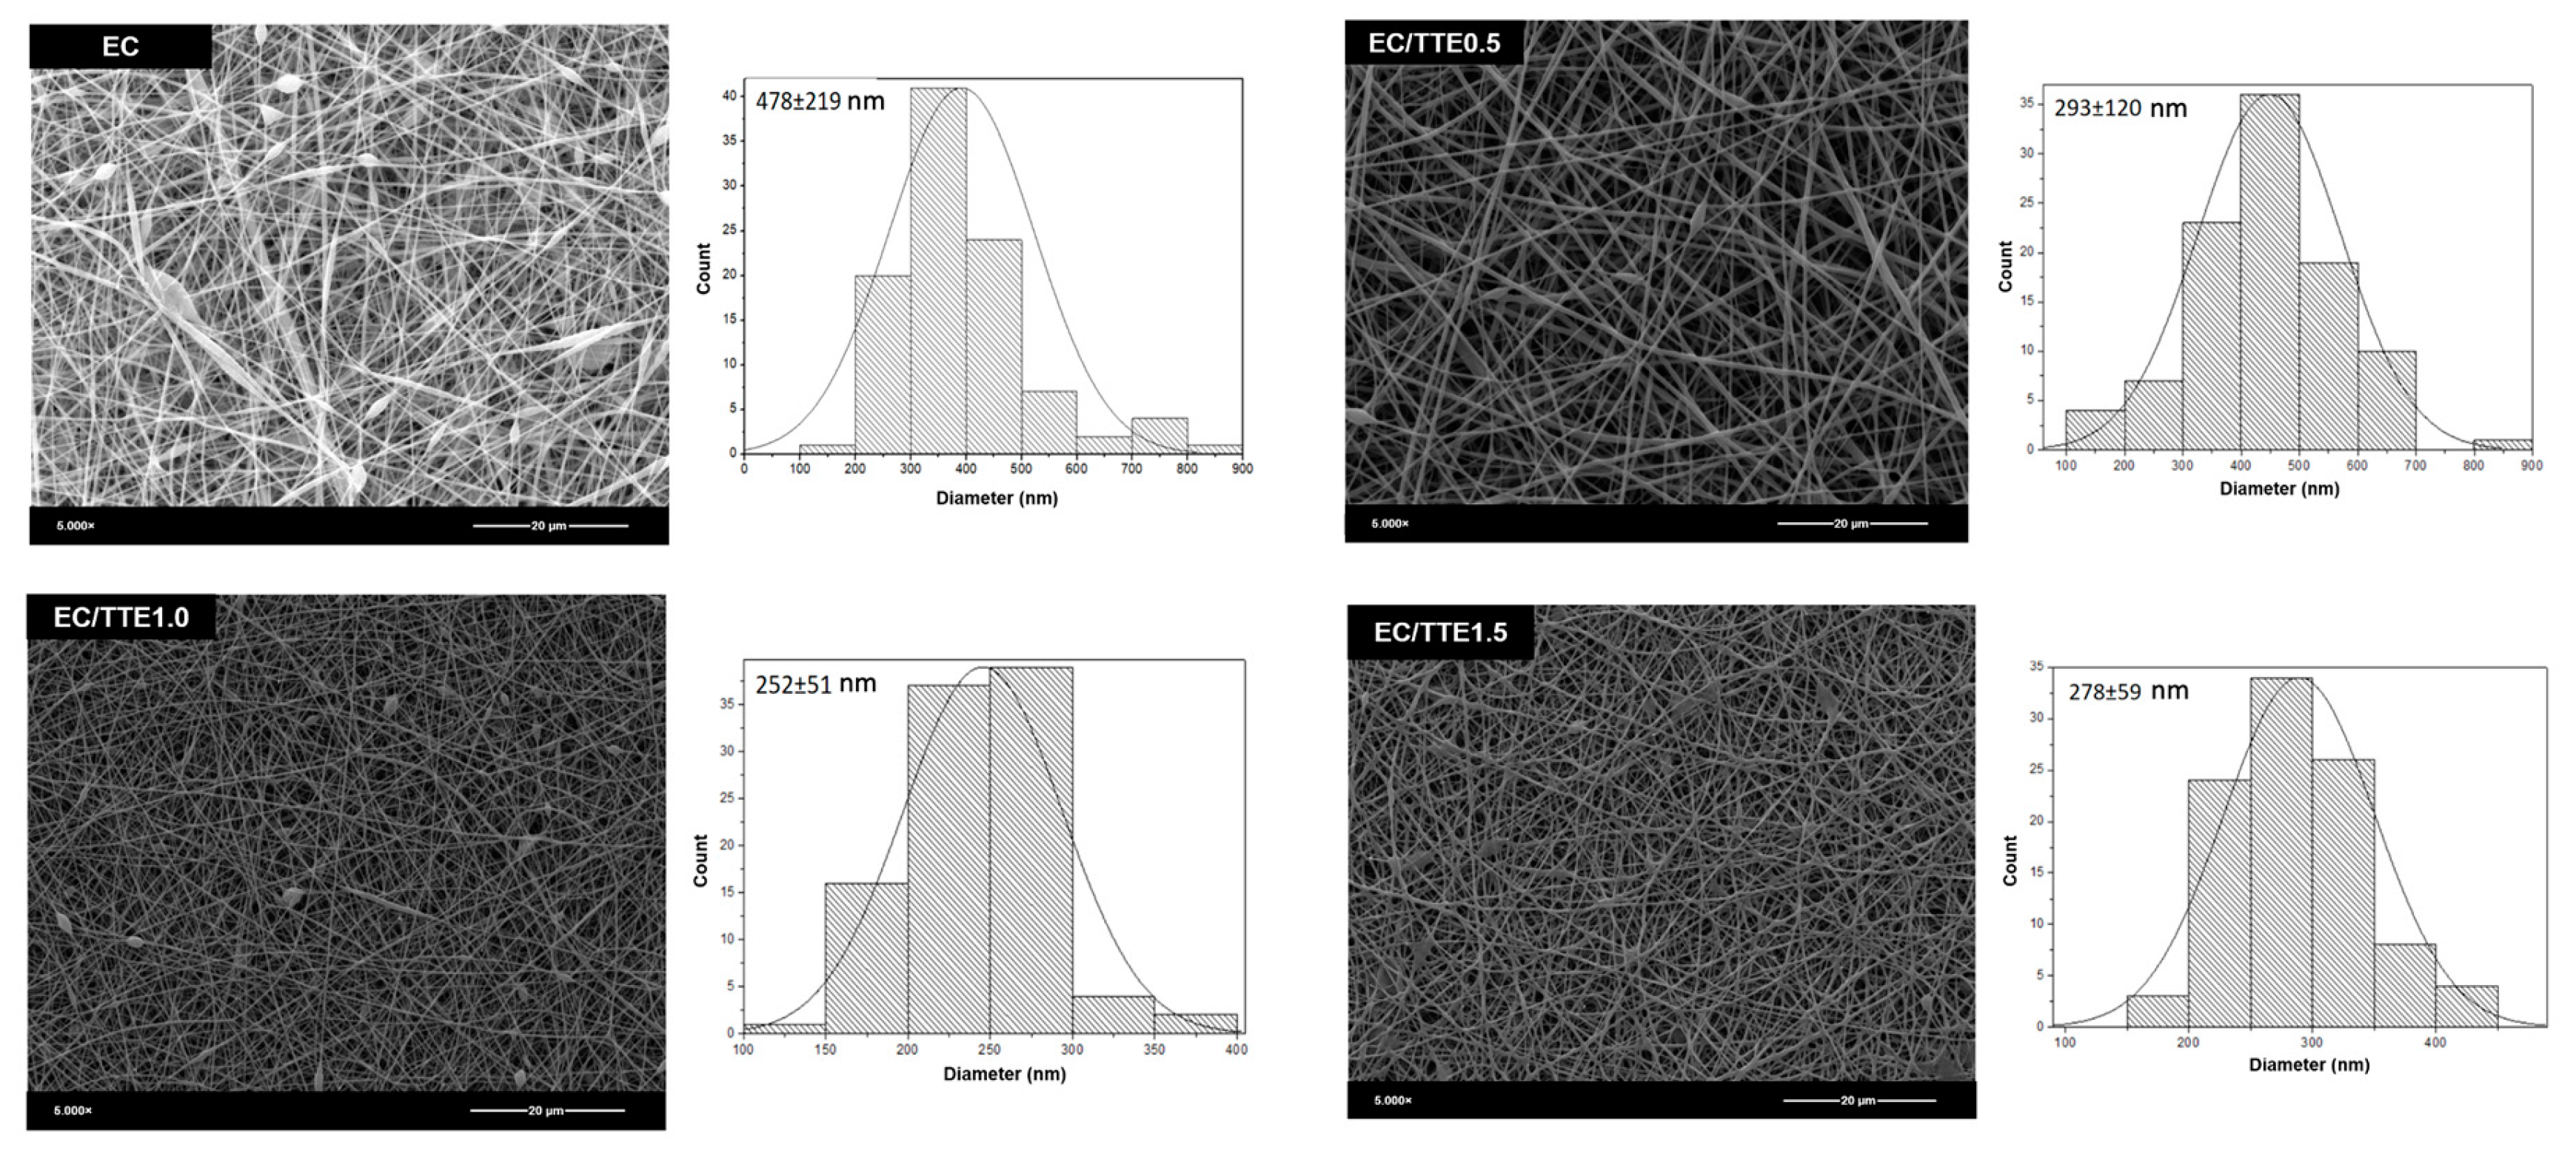
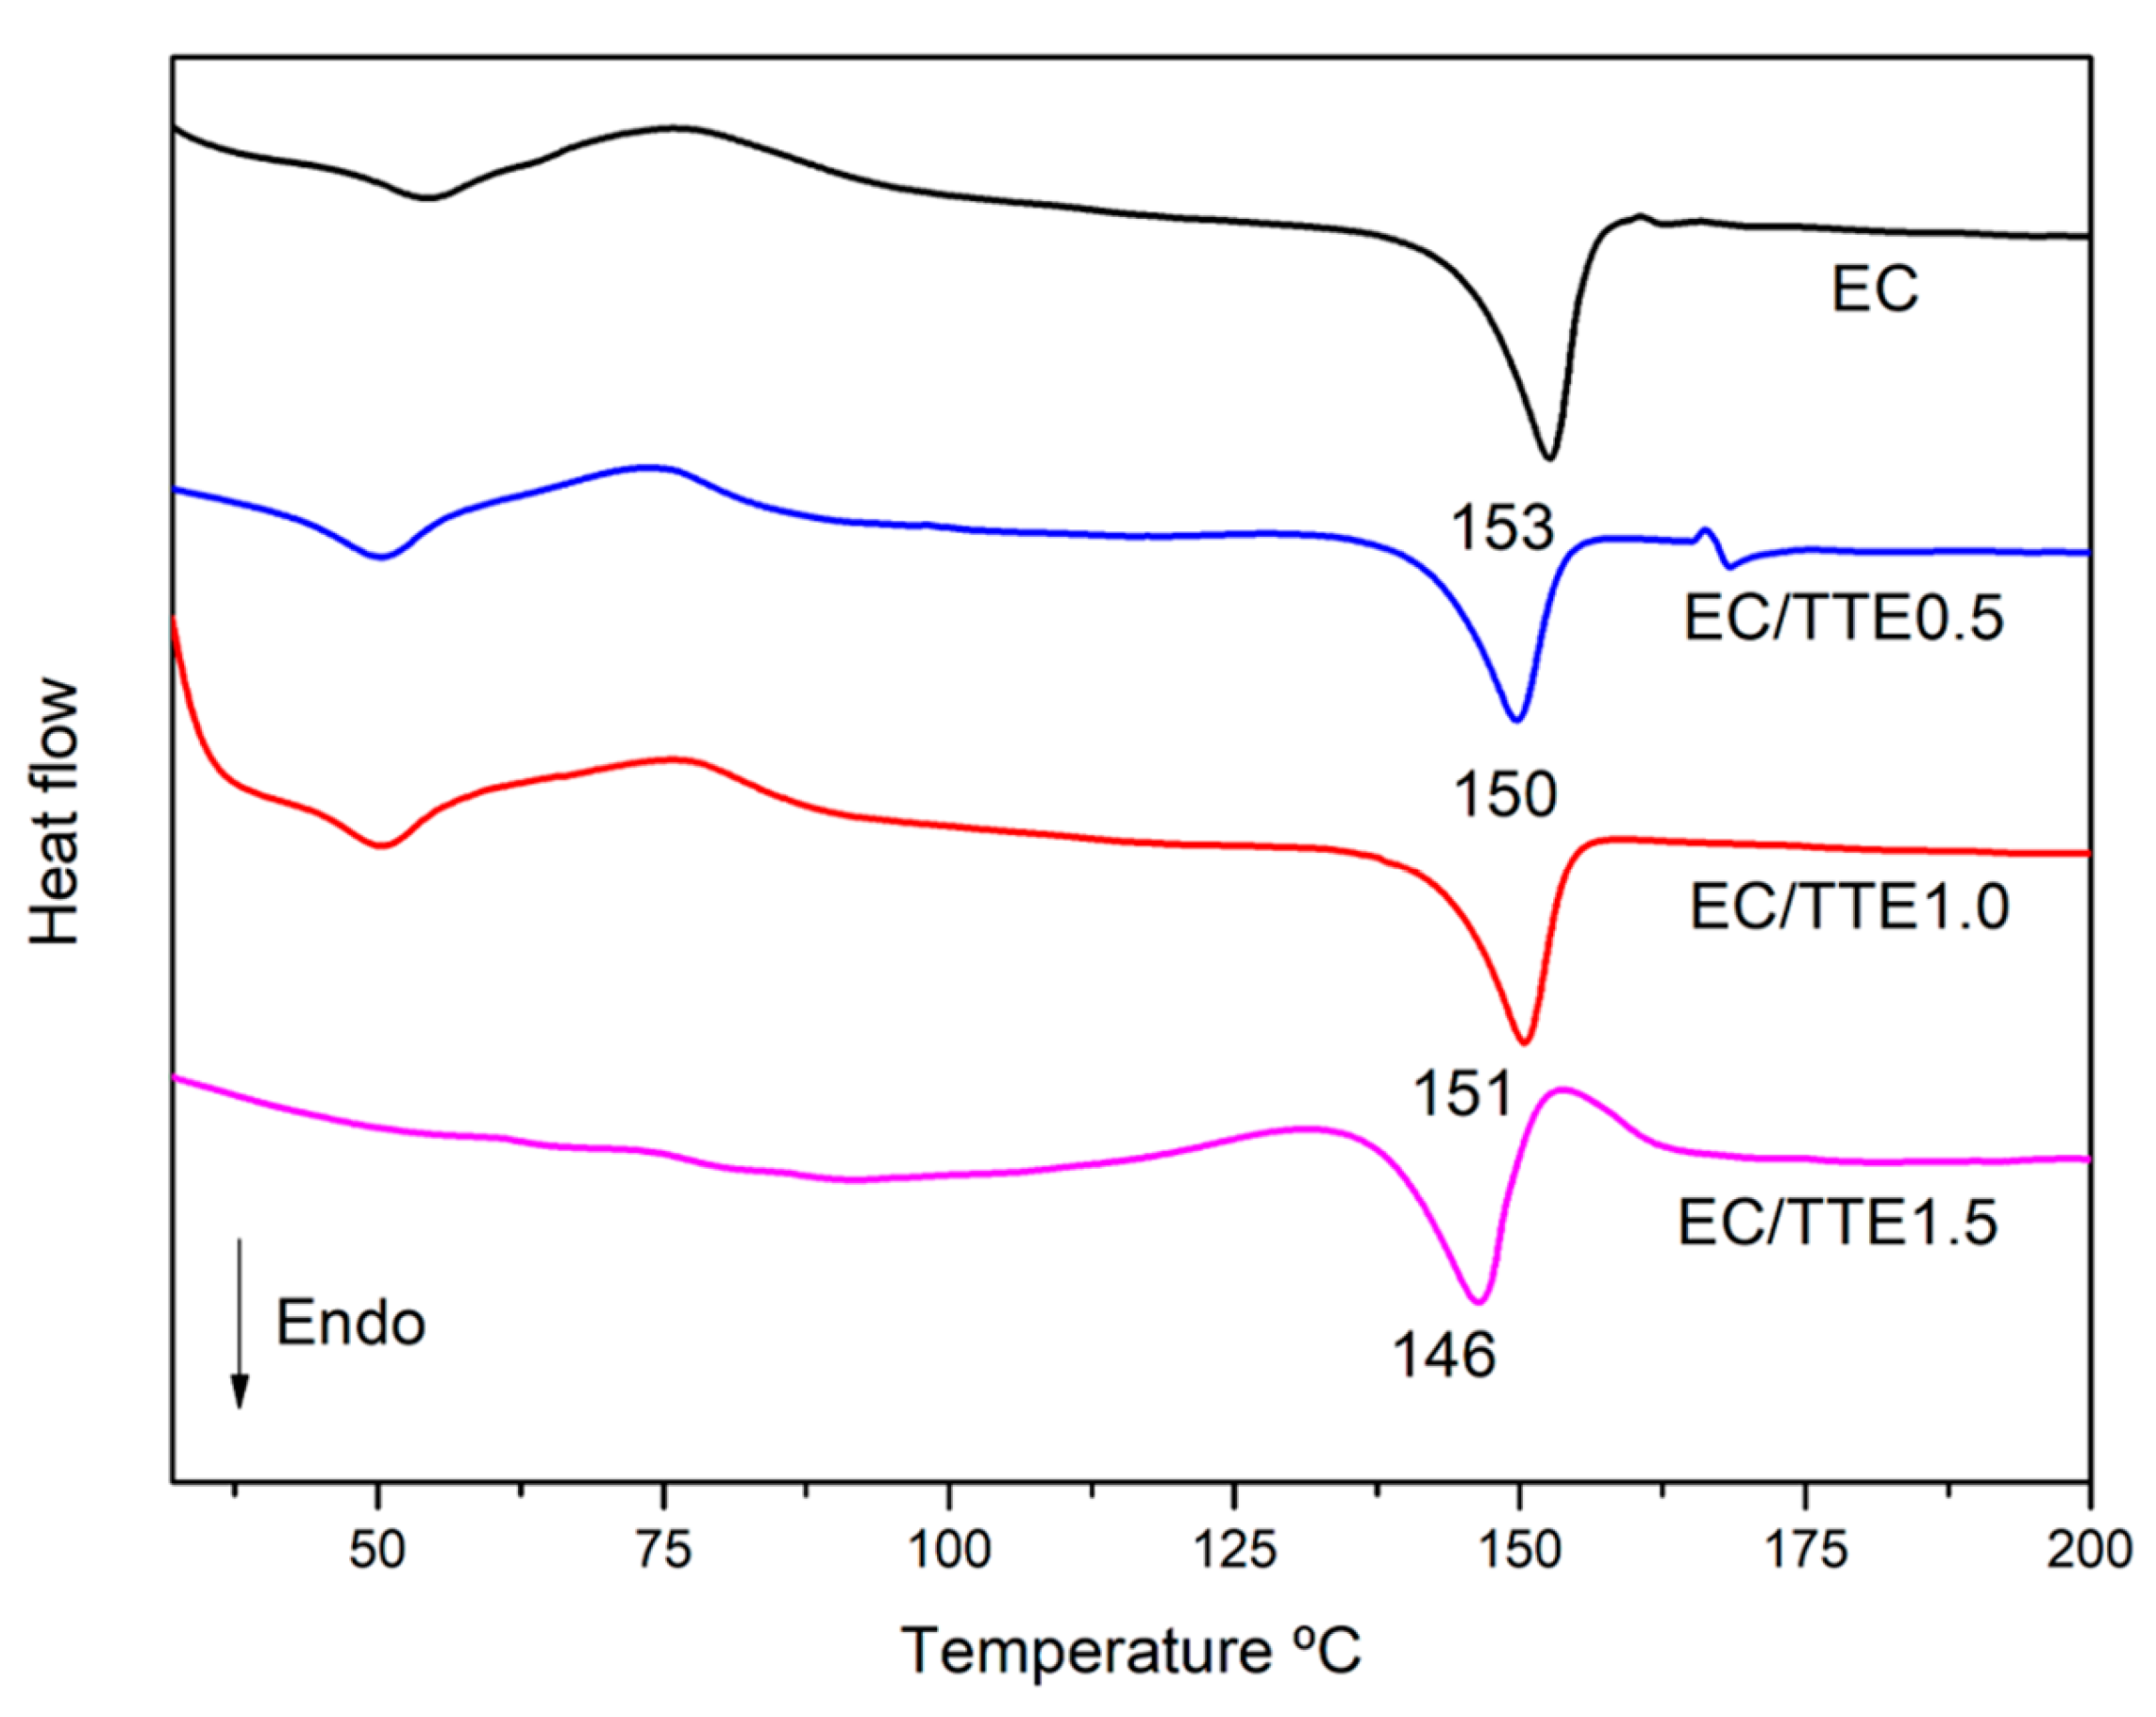
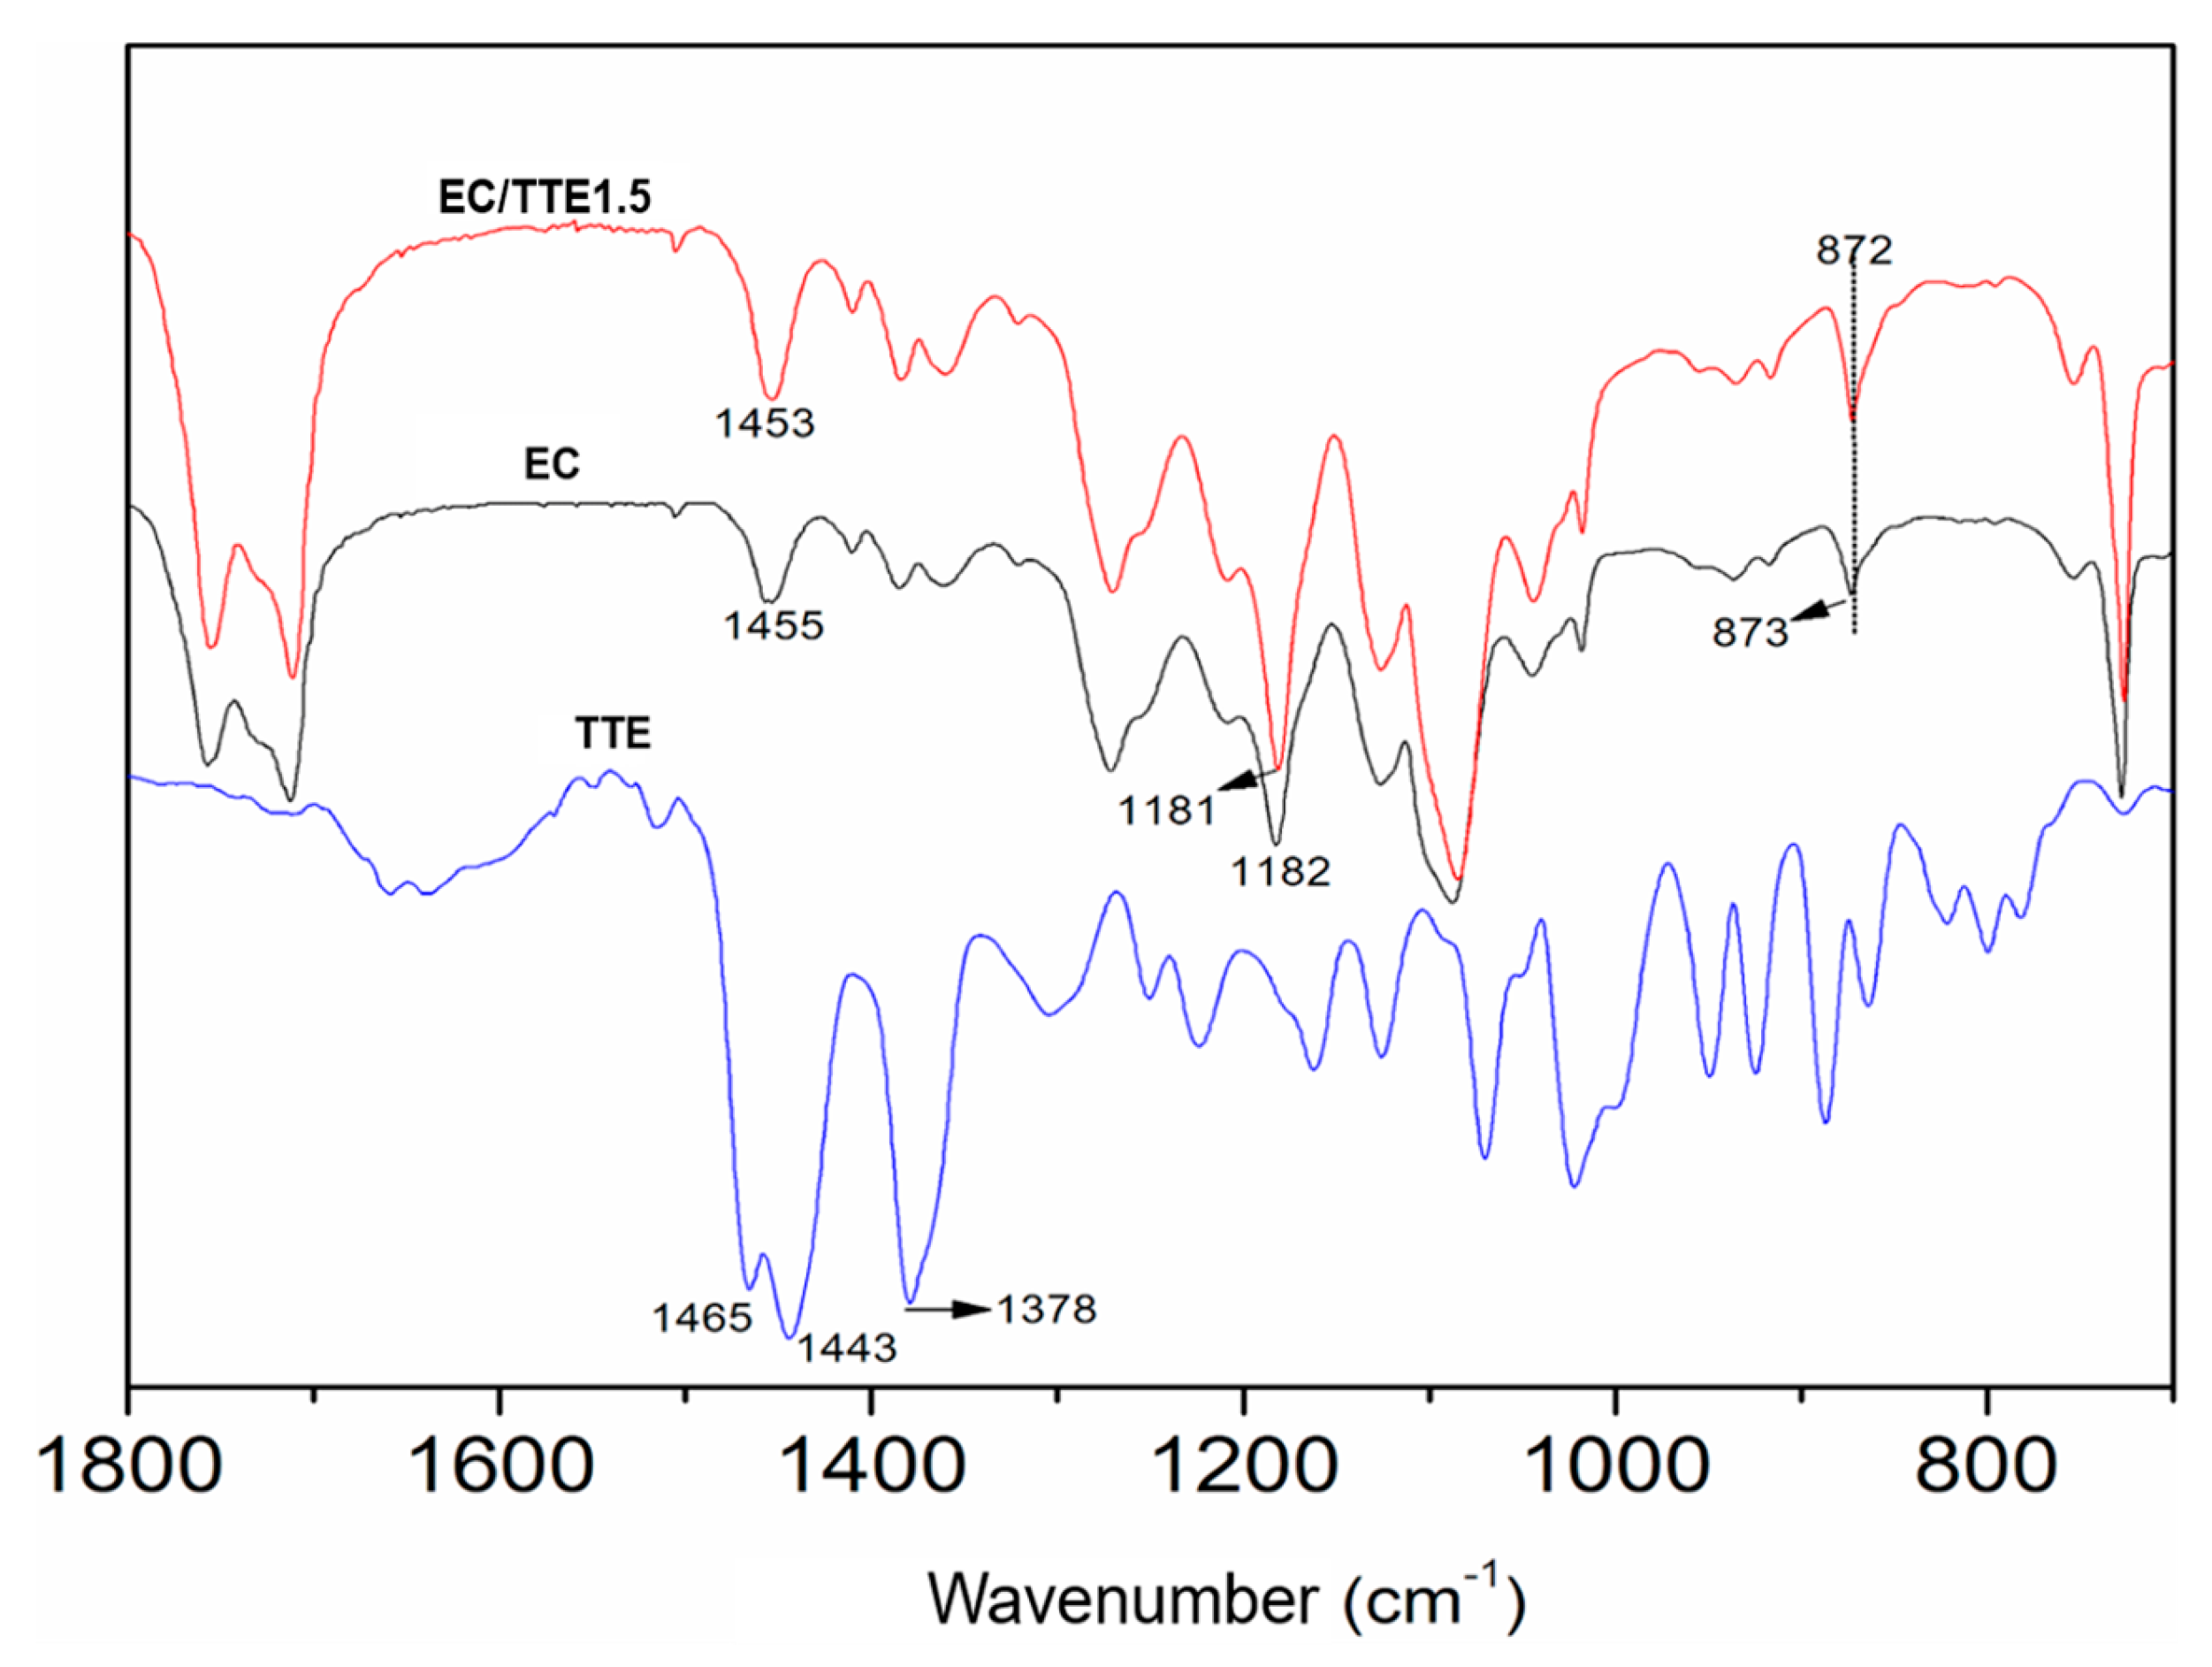
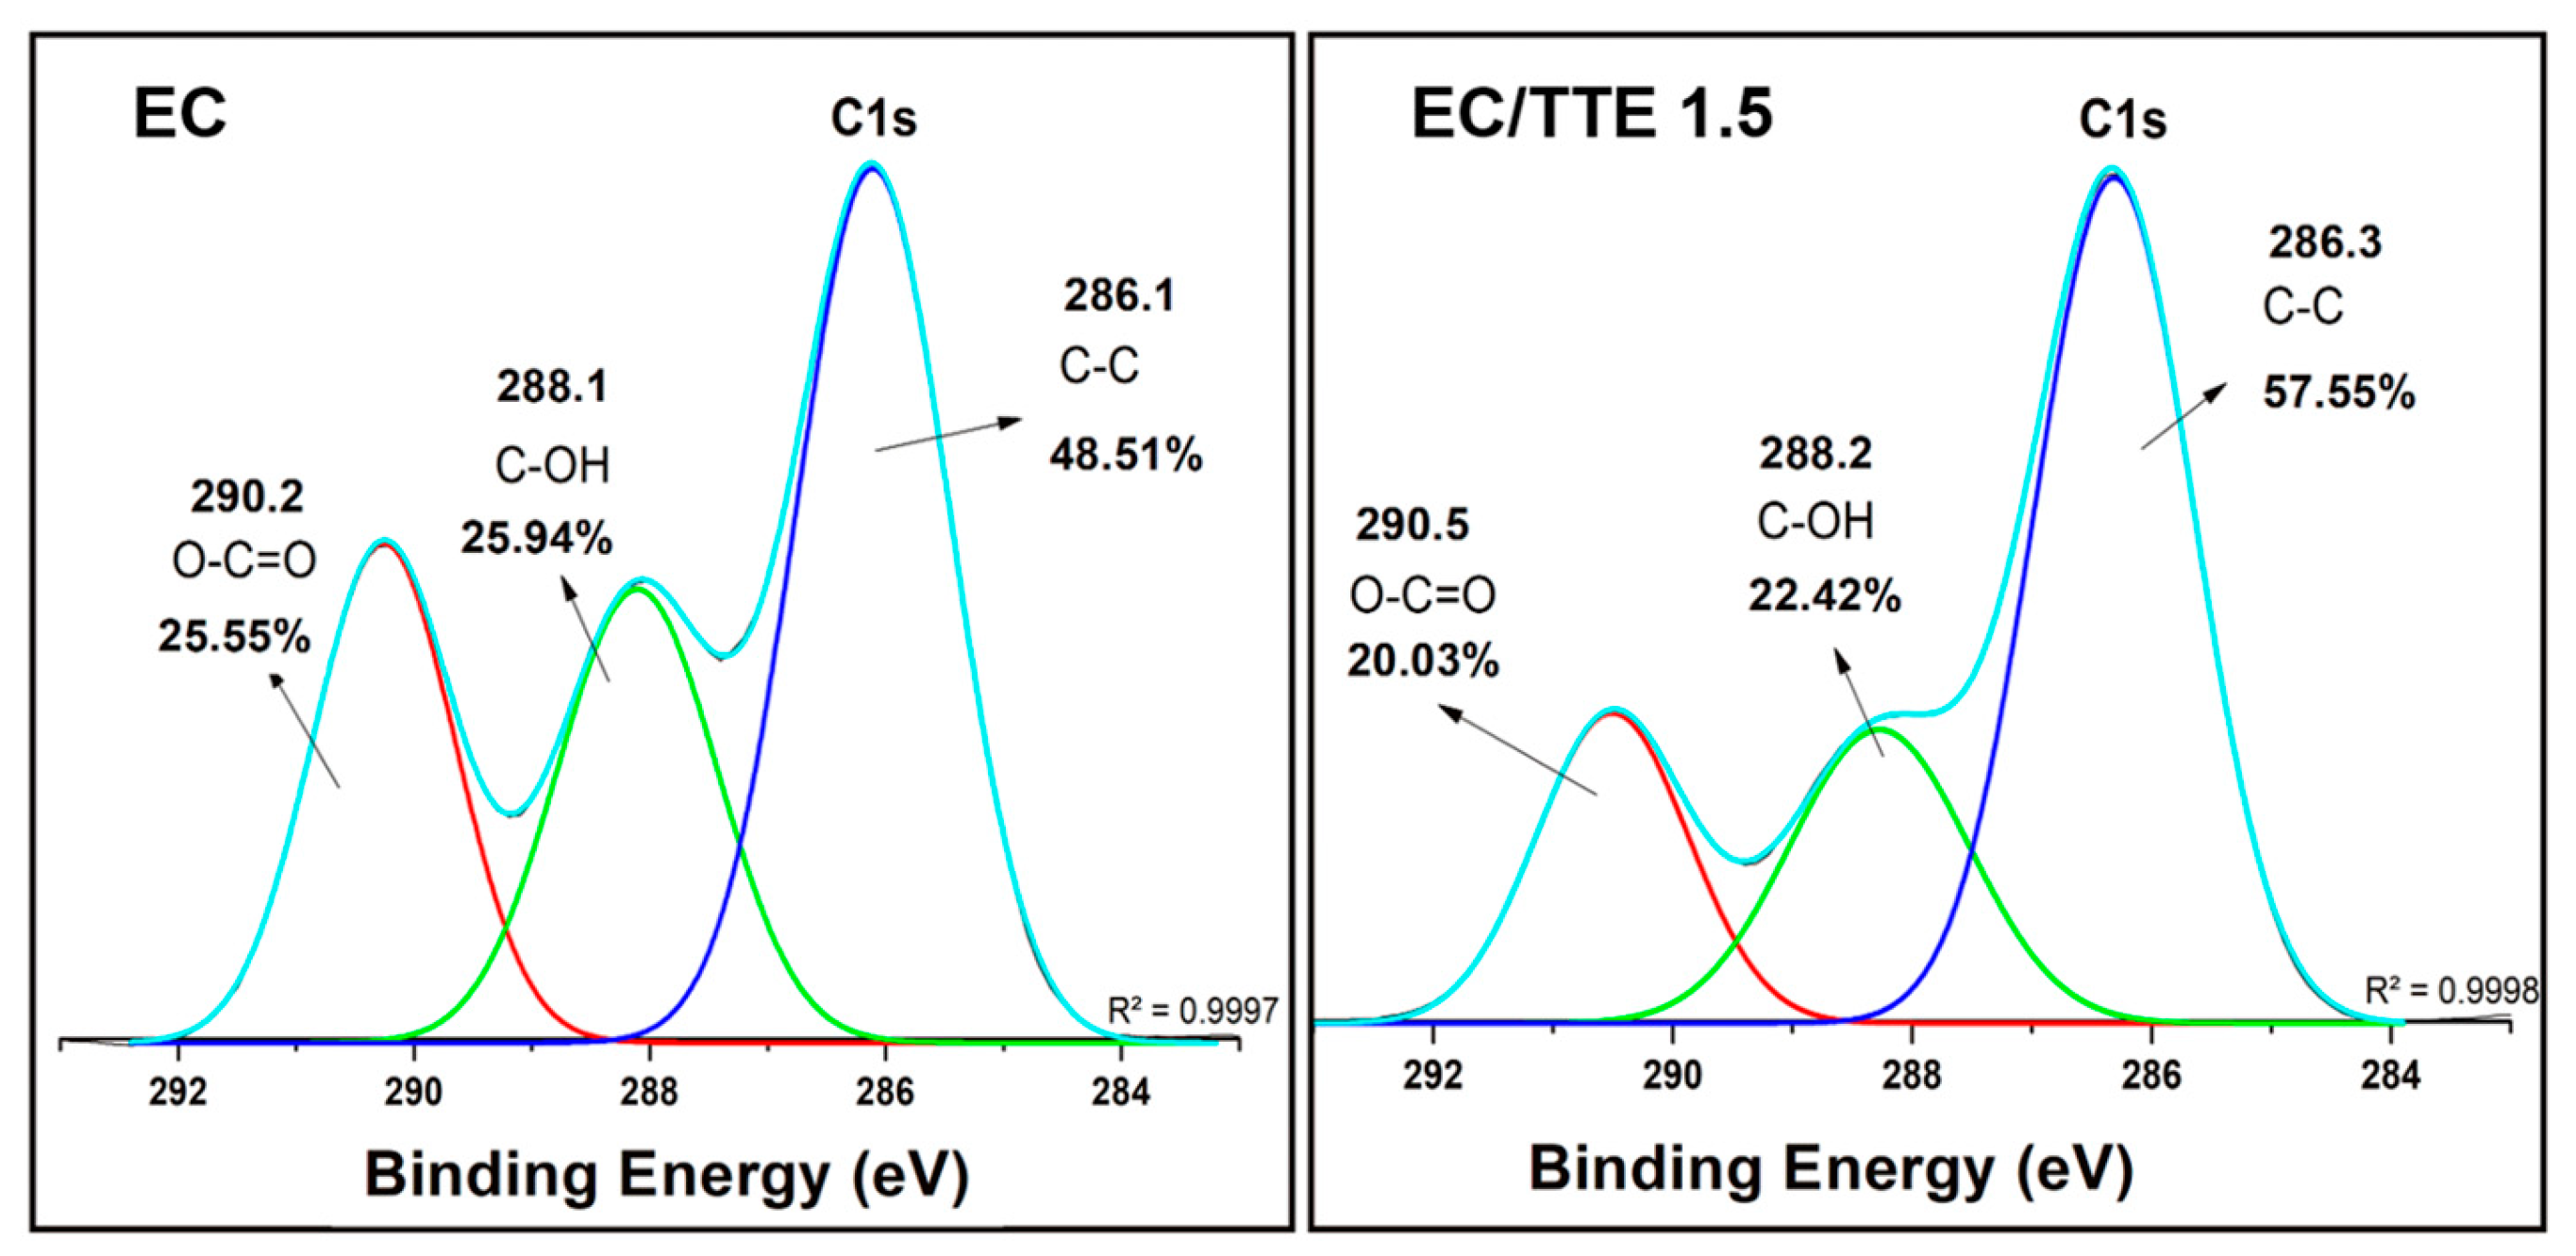
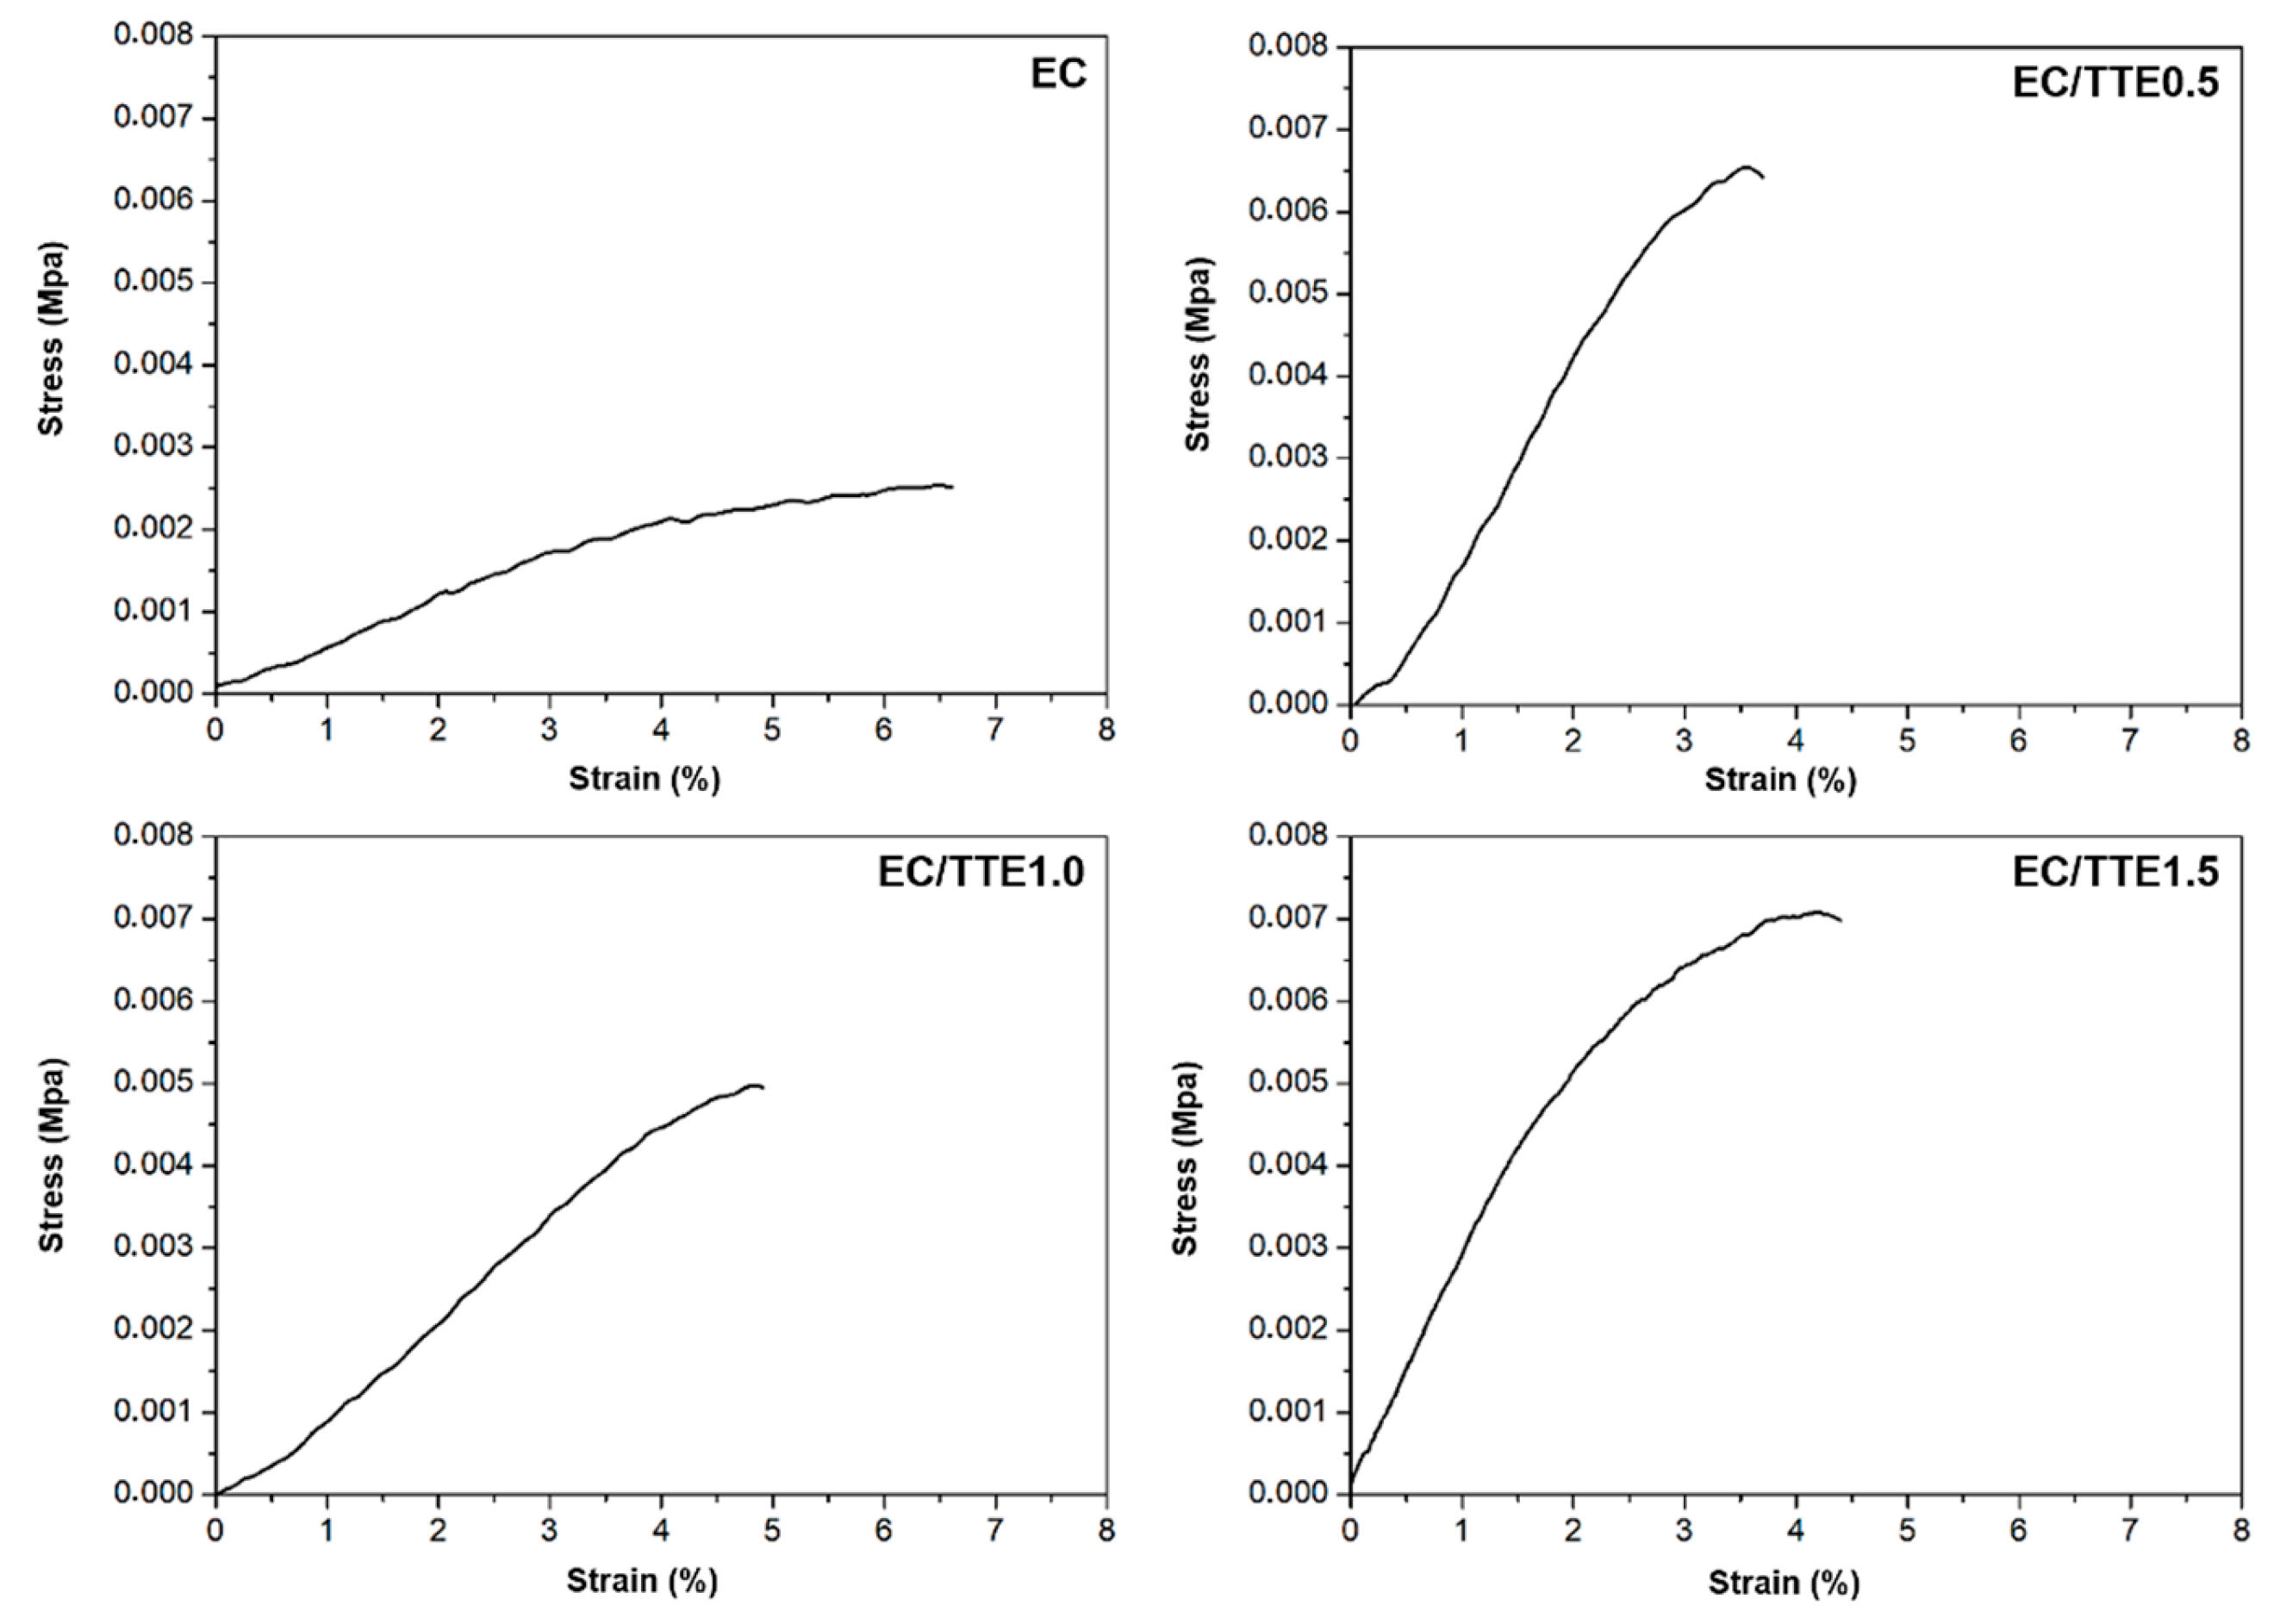
3.2. Antimicrobial Activity of the Tea Tree Essential Oil
| Bacteria | MIC/MBC (mg/mL) |
|---|---|
| P. aeruginosa | 7.5/7.5 |
| S. aureus | 7.5/7.5 |
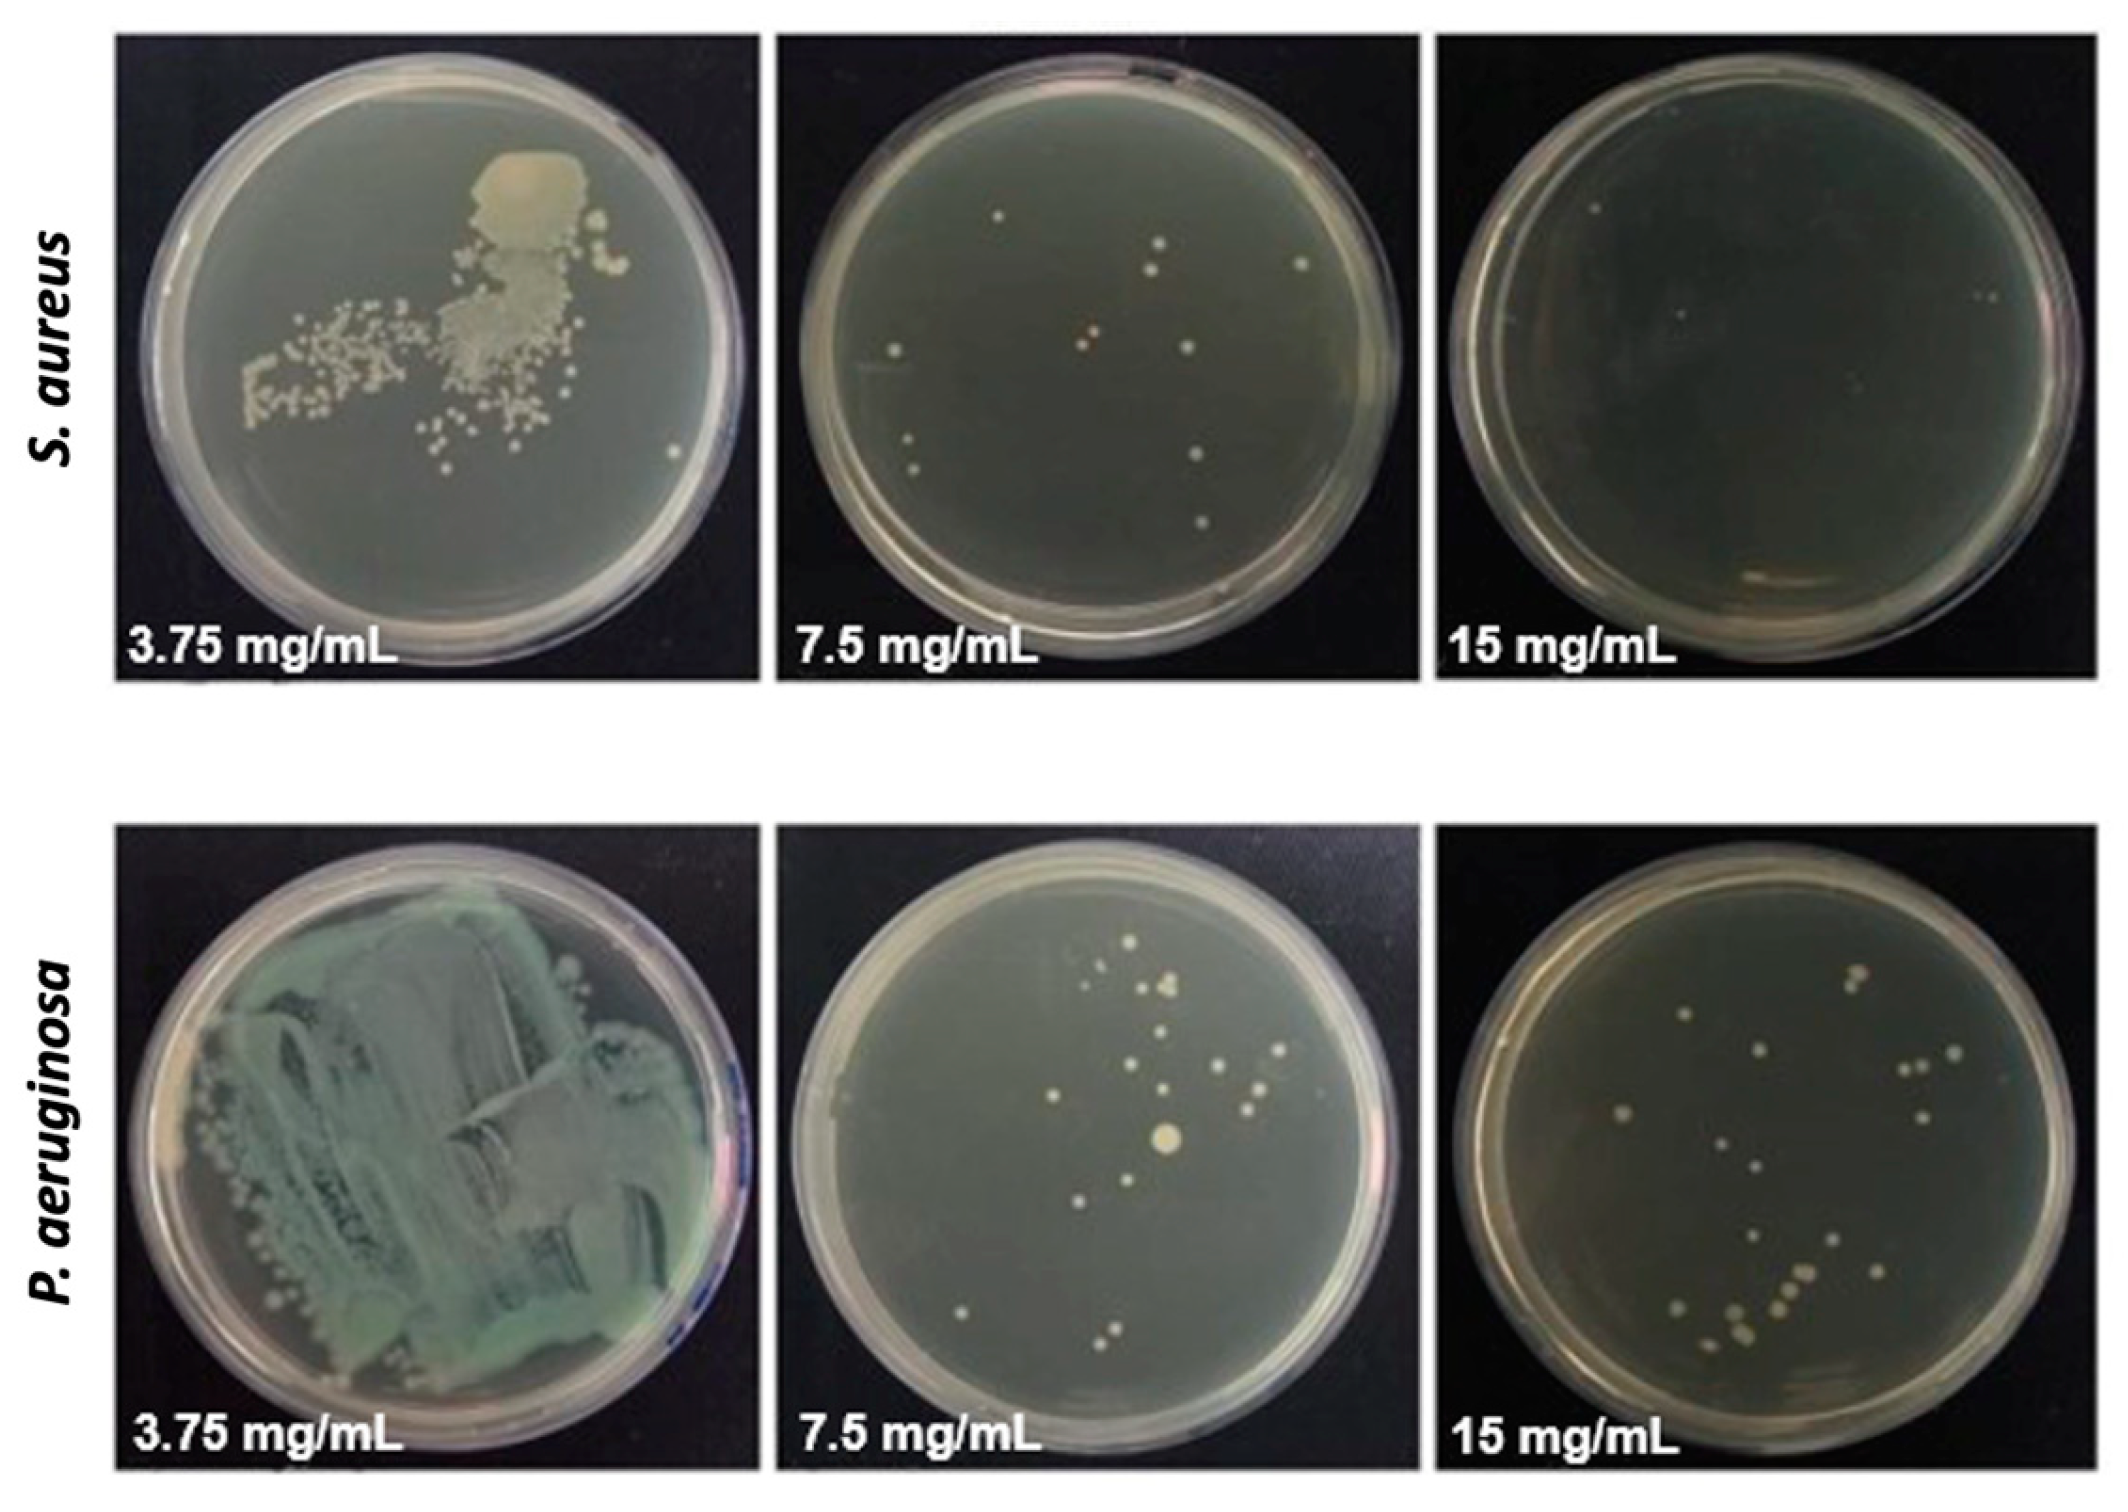
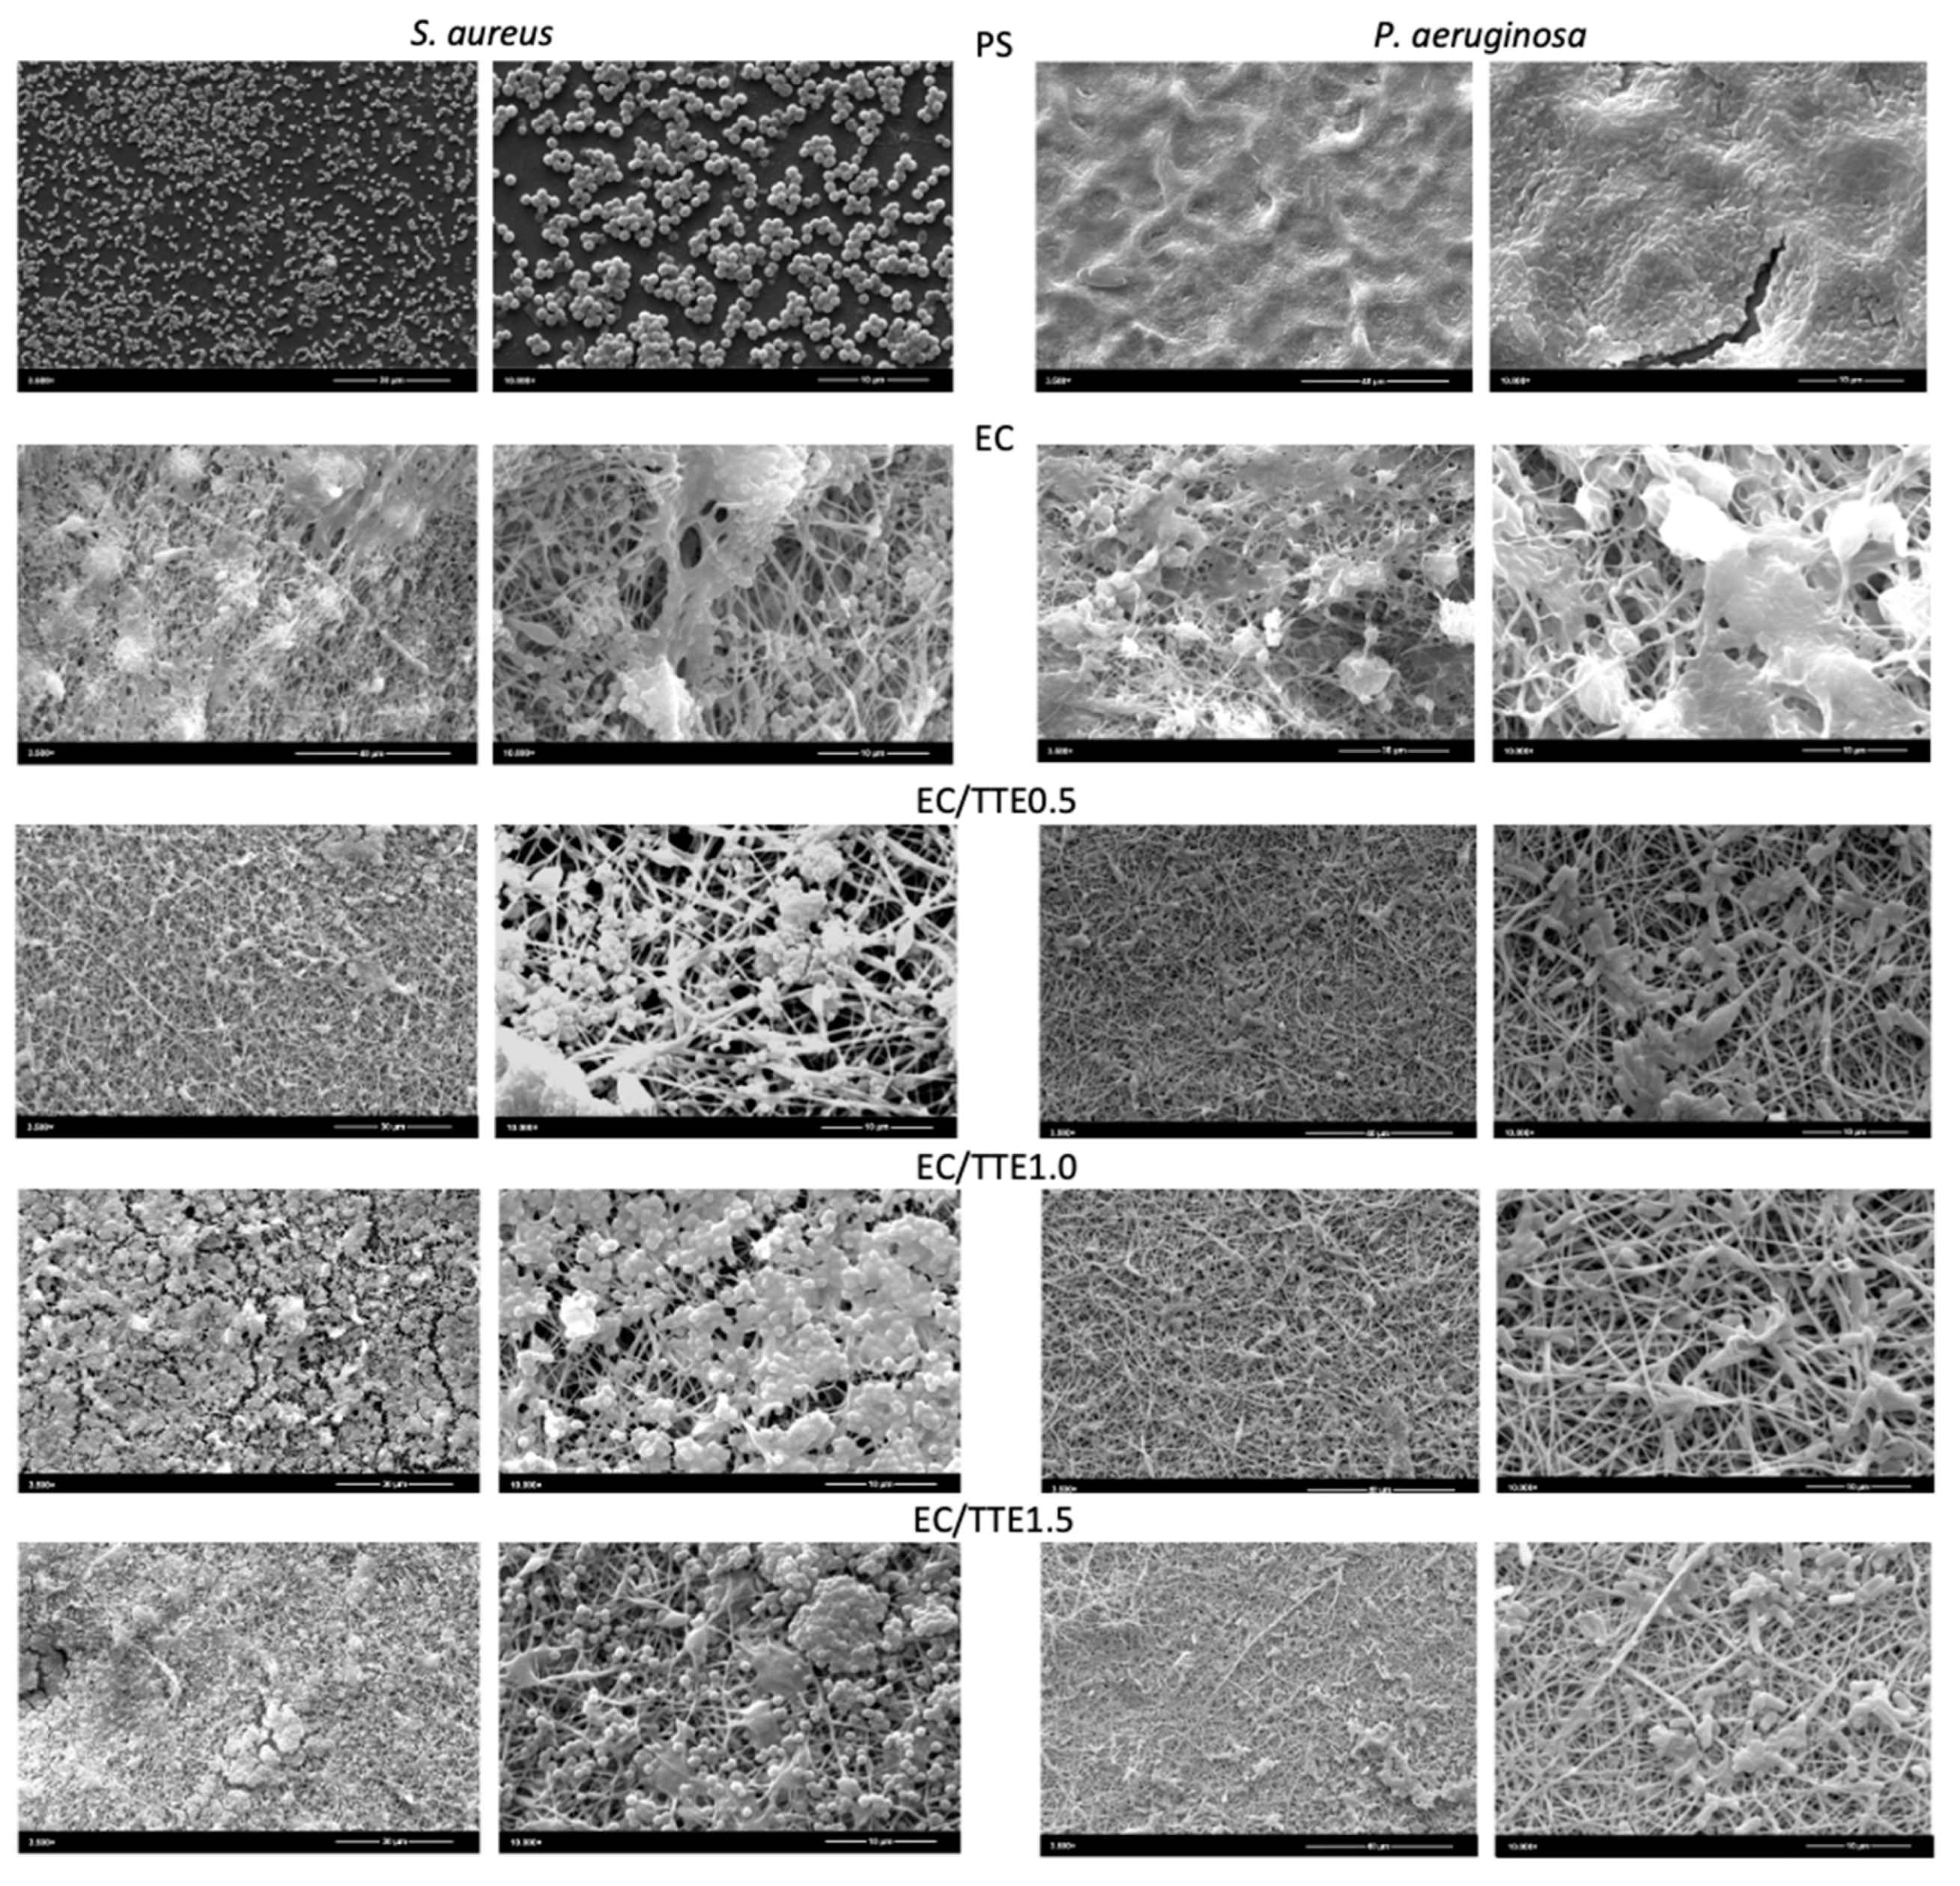
3.3. Antiadhesive and Antimicrobial Activity of the Fibers
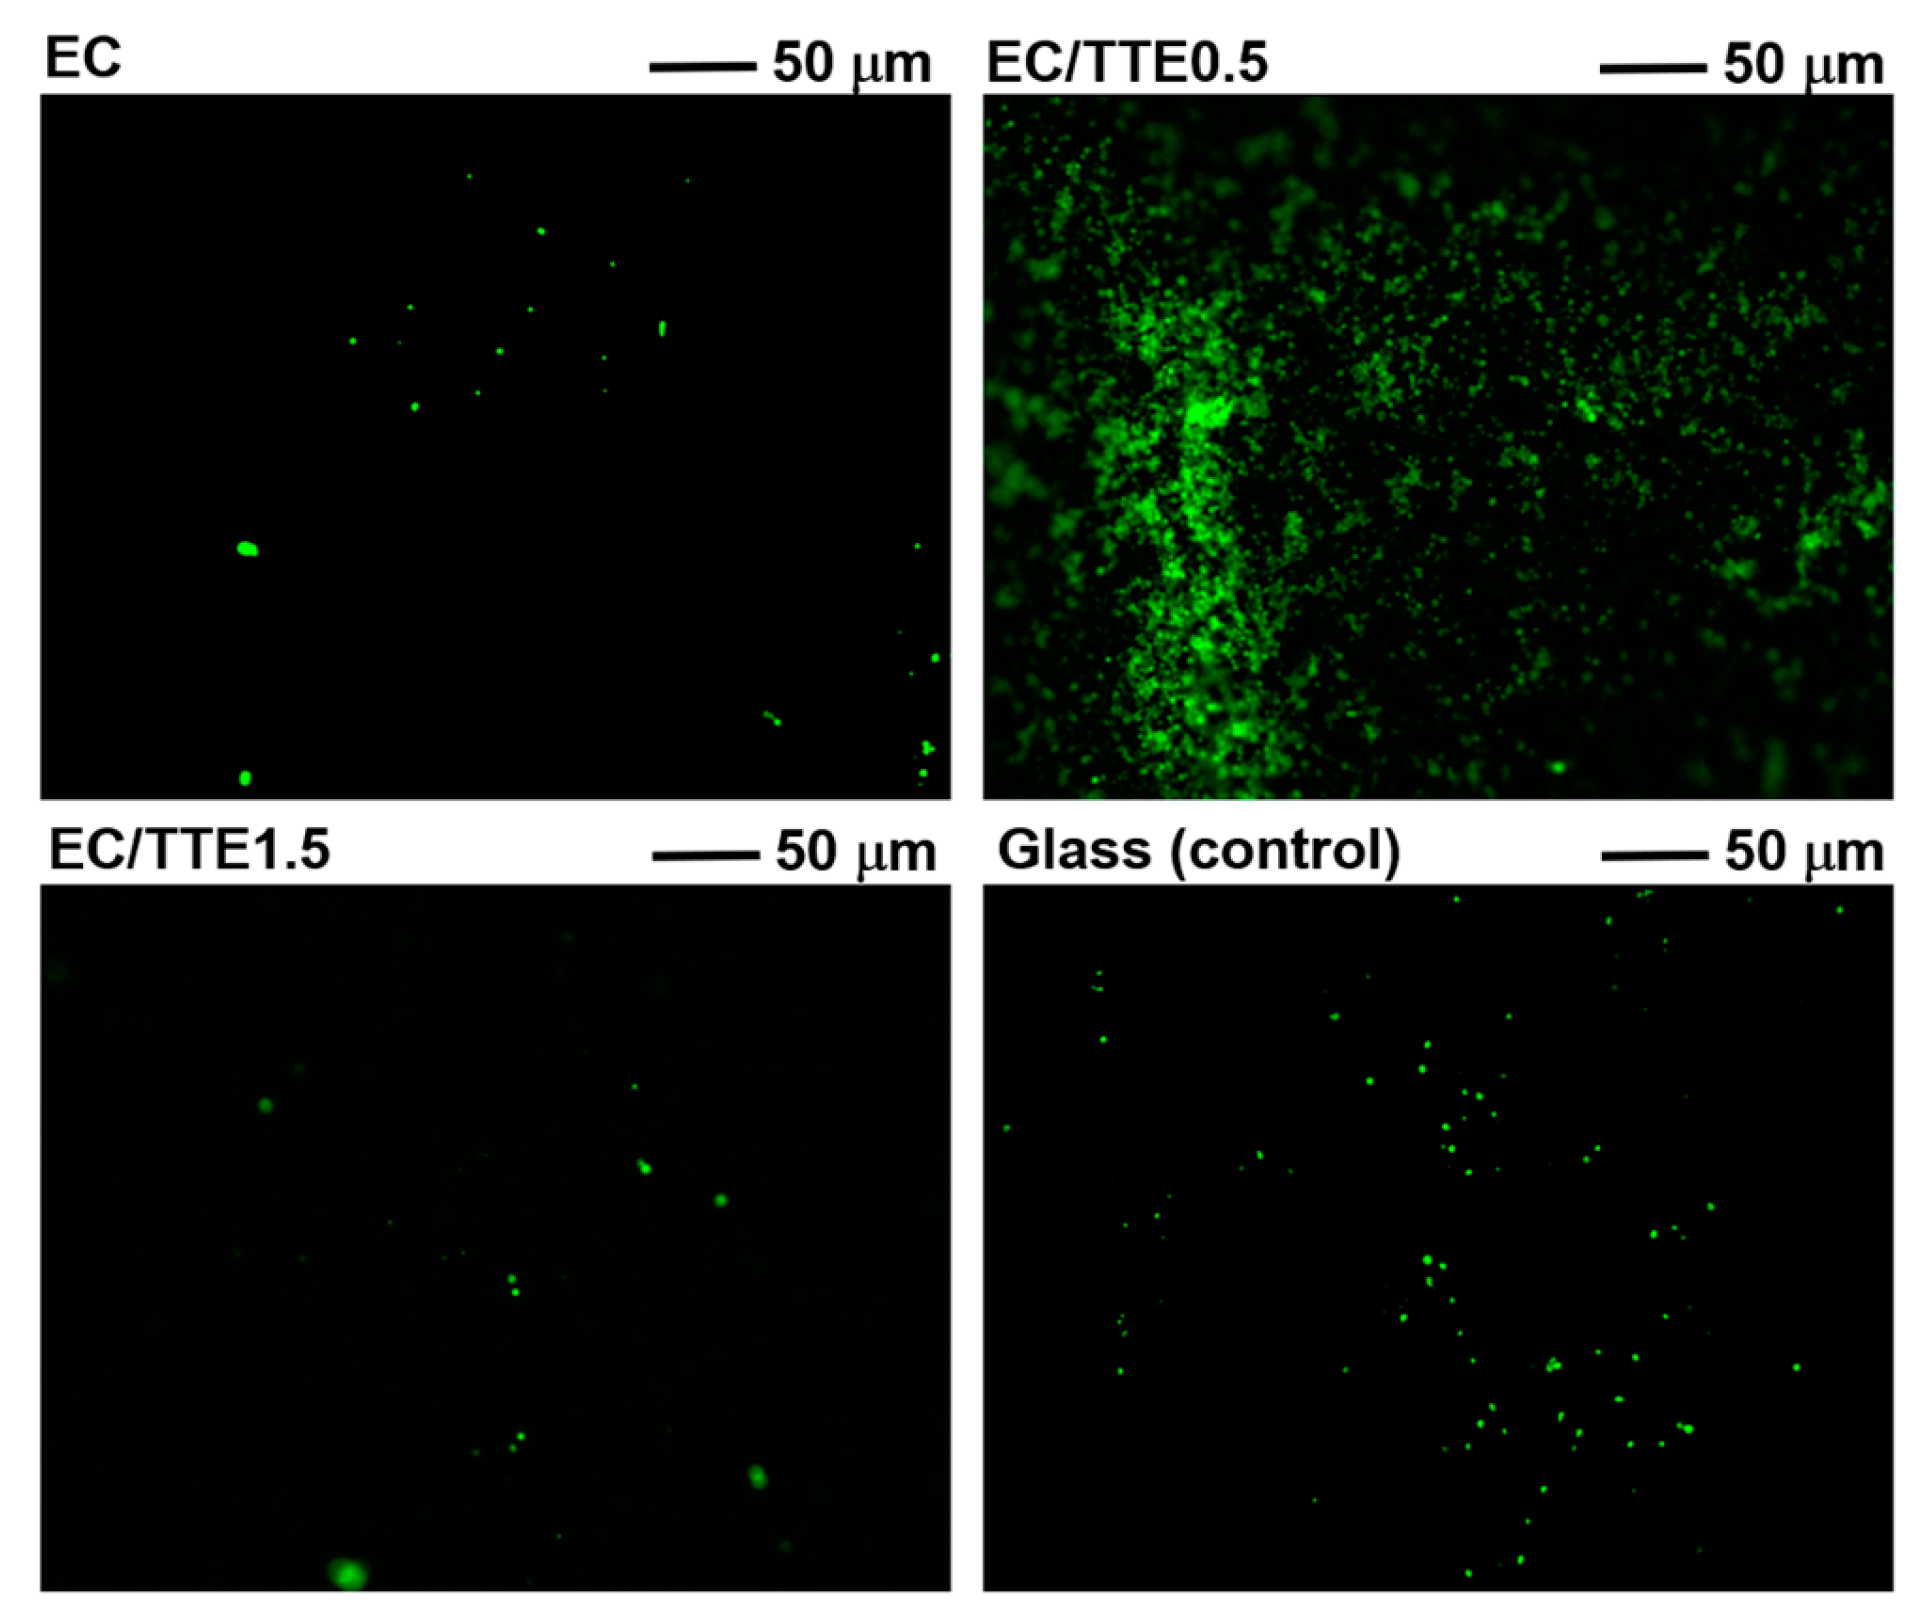
3.4. Blood Coagulation
4. Conclusions
Supplementary Materials
Author Contributions
Funding
Institutional Review Board Statement
Informed Consent Statement
Data Availability Statement
Acknowledgments
Conflicts of Interest
References
- Butnariu, M.; Sarac, I. Essential Oils from Plants. JBBS 2018, 1, 35–43. [Google Scholar] [CrossRef]
- Siddiqui, T.; Khan, M.U.; Sharma, V.; Gupta, K. Terpenoids in Essential Oils: Chemistry, Classification, and Potential Impact on Human Health and Industry. Phytomedicine Plus 2024, 4, 100549. [Google Scholar] [CrossRef]
- Abers, M.; Schroeder, S.; Goelz, L.; Sulser, A.; St. Rose, T.; Puchalski, K.; Langland, J. Antimicrobial Activity of the Volatile Substances from Essential Oils. BMC Complement Med Ther 2021, 21, 124. [Google Scholar] [CrossRef] [PubMed]
- Miguel, M.G. Antioxidant and Anti-Inflammatory Activities of Essential Oils: A Short Review. Molecules 2010, 15, 9252–9287. [Google Scholar] [CrossRef]
- Graßmanna, J.; Hippelia, S.; Dornischa, K.; Rohnerta, U.; Beuscherb, N.; Elstnera, E. Antioxidant Properties of Essential Oils. Arzneimittelforschung 2011, 50, 135–139. [Google Scholar] [CrossRef]
- Durczyńska, Z.; Żukowska, G. Properties and Applications of Essential Oils: A Review. J. Ecol. Eng. 2024, 25, 333–340. [Google Scholar] [CrossRef] [PubMed]
- Kashyap, R. Exploring the Molecular Mechanisms and Therapeutic Potentials of Essential Oils: A Systems Biology Approach. Future Integr Med 2024, 000, 000–000. [Google Scholar] [CrossRef]
- Galgano, M.; Capozza, P.; Pellegrini, F.; Cordisco, M.; Sposato, A.; Sblano, S.; Camero, M.; Lanave, G.; Fracchiolla, G.; Corrente, M.; et al. Antimicrobial Activity of Essential Oils Evaluated In Vitro against Escherichia Coli and Staphylococcus Aureus. Antibiotics 2022, 11, 979. [Google Scholar] [CrossRef] [PubMed]
- Chin, K.B.; Cordell, B. The Effect of Tea Tree Oil ( Melaleuca Alternifolia ) on Wound Healing Using a Dressing Model. The Journal of Alternative and Complementary Medicine 2013, 19, 942–945. [Google Scholar] [CrossRef]
- Carson, C.F.; Riley, T.V. Antimicrobial Activity of the Essential Oil of Melaleuca Alternifolia. Lett Appl Microbiol 1993, 16, 49–55. [Google Scholar] [CrossRef]
- Lee, J.Y.; Lee, J.; Ko, S.W.; Son, B.C.; Lee, J.H.; Kim, C.S.; Park, C.H. Fabrication of Antibacterial Nanofibrous Membrane Infused with Essential Oil Extracted from Tea Tree for Packaging Applications. Polymers (Basel) 2020, 12, 125. [Google Scholar] [CrossRef] [PubMed]
- Carson, C.F.; Hammer, K.A.; Riley, T.V. Melaleuca Alternifolia (Tea Tree) Oil: A Review of Antimicrobial and Other Medicinal Properties. Clin Microbiol Rev 2006, 19, 50–62. [Google Scholar] [CrossRef] [PubMed]
- Labib, R.M.; Ayoub, I.M.; Michel, H.E.; Mehanny, M.; Kamil, V.; Hany, M.; Magdy, M.; Moataz, A.; Maged, B.; Mohamed, A. Appraisal on the Wound Healing Potential of Melaleuca Alternifolia and Rosmarinus Officinalis L. Essential Oil-Loaded Chitosan Topical Preparations. PLoS ONE 2019, 14, e0219561. [Google Scholar] [CrossRef] [PubMed]
- Cox, S.D.; Mann, C.M.; Markham, J.L. Interactions between Components of the Essential Oil of Melaleuca Alternifolia. J Appl Microbiol 2001, 91, 492–497. [Google Scholar] [CrossRef] [PubMed]
- Brophy, J.J.; Davies, N.W.; Southwell, I.A.; Stiff, I.A.; Williams, L.R. Gas Chromatographic Quality Control for Oil of Melaleuca Terpinen-4-Ol Type (Australian Tea Tree). J. Agric. Food Chem. 1989, 37, 1330–1335. [Google Scholar] [CrossRef]
- Oliveira, A.C.M.; Fontana, A.; Negrini, T.C.; Nogueira, M.N.M.; Bedran, T.B.L.; Andrade, C.R.; Spolidorio, L.C.; Spolidorio, D.M.P. Emprego Do Óleo de Melaleuca Alternifolia Cheel (Myrtaceae) Na Odontologia: Perspectivas Quanto à Utilização Como Antimicrobiano Alternativo Às Doenças Infecciosas de Origem Bucal. Rev. bras. plantas med. 2011, 13, 492–499. [Google Scholar] [CrossRef]
- Crawford, G.H.; Sciacca, J.R.; James, W.D. Tea Tree Oil: Cutaneous Effects of the Extracted Oil of Melaleuca Alternifolia. Dermatitis (Am. J. Contact Dermat.) 2004, 15, 59. [Google Scholar] [CrossRef] [PubMed]
- Pazyar, N.; Yaghoobi, R.; Bagherani, N.; Kazerouni, A. A Review of Applications of Tea Tree Oil in Dermatology. Int J Dermatology 2013, 52, 784–790. [Google Scholar] [CrossRef] [PubMed]
- Khanna, M. Allergic Contact Dermatitis to Tea Tree Oil with Erythema Multiforme–like ID Reaction. American Journal of Contact Dermatitis 2000, 11, 238–242. [Google Scholar] [CrossRef] [PubMed]
- Tarach, I.; Olewnik-Kruszkowska, E.; Richert, A.; Gierszewska, M.; Rudawska, A. Influence of Tea Tree Essential Oil and Poly(Ethylene Glycol) on Antibacterial and Physicochemical Properties of Polylactide-Based Films. Materials 2020, 13, 4953. [Google Scholar] [CrossRef]
- Zhu, L.; Machmudah, S.; Wahyudiono; Kanda, H.; Goto, M. Reduced-Pressure Process for Fabricating Tea Tree Oil—Polyvinylpyrrolidone Electrospun Fibers. Polymers 2022, 14, 743. [Google Scholar] [CrossRef] [PubMed]
- Maheshwari, S.; Chang, H.-C. Assembly of Multi-Stranded Nanofiber Threads through AC Electrospinning. Advanced Materials 2009, 21, 349–354. [Google Scholar] [CrossRef]
- Bhardwaj, N.; Kundu, S.C. Electrospinning: A Fascinating Fiber Fabrication Technique. Biotechnology Advances 2010, 28, 325–347. [Google Scholar] [CrossRef] [PubMed]
- Leung, V.; Ko, F. Biomedical Applications of Nanofibers. Polymers for Advanced Technologies 2011, 22, 350–365. [Google Scholar] [CrossRef]
- Silva, A.B. da Preparo e caracterização de fibras adsorventes de íons Cu (II) à base de Eudragit® L100 via processo de eletrofiação.
- Atlas Of Small Animal Wound Management And Reconstructive Surgery.
- Mani, M.P.; Mohd Faudzi, A.A.; Ramakrishna, S.; Ismail, A.F.; Jaganathan, S.K.; Tucker, N.; Rathanasamy, R. Sustainable Electrospun Materials with Enhanced Blood Compatibility for Wound Healing Applications—A Mini Review. Current Opinion in Biomedical Engineering 2023, 27, 100457. [Google Scholar] [CrossRef]
- Jiao, J.; Peng, C.; Li, C.; Qi, Z.; Zhan, J.; Pan, S. Dual Bio-Active Factors with Adhesion Function Modified Electrospun Fibrous Scaffold for Skin Wound and Infections Therapeutics. Sci Rep 2021, 11, 457. [Google Scholar] [CrossRef] [PubMed]
- Simas, S.M. O tratamento de feridas cutâneas em cães e gatos. 2010.
- Rothwell, S.W.; Fudge, J.M.; Chen, W.-K.; Reid, T.J.; Krishnamurti, C. Addition of a Propyl Gallate-Based Procoagulant to a Fibrin Bandage Improves Hemostatic Performance in a Swine Arterial Bleeding Model. Thrombosis Research 2002, 108, 335–340. [Google Scholar] [CrossRef]
- Rahmawati, S.I.; Izzati, F.N.; Hapsari, Y.; Septiana, E.; Rachman, F.; Bustanussalam; Simanjuntak, P. Endophytic Microbes and Antioxidant Activities of Secondary Metabolites from Mangroves Avicennia Marina and Xylocarpus Granatum. IOP Conf. Ser.: Earth Environ. Sci. 2019, 278, 012065. [Google Scholar] [CrossRef]
- Li, D.; Wang, Y.; Xia, Y. Electrospinning Nanofibers as Uniaxially Aligned Arrays and Layer-by-Layer Stacked Films. Advanced Materials 2004, 16, 361–366. [Google Scholar] [CrossRef]
- Facchi, D.P.; Souza, P.R.; Almeida, V.C.; Bonafé, E.G.; Martins, A.F. Optimizing the Ecovio® and Ecovio®/Zein Solution Parameters to Achieve Electrospinnability and Provide Thin Fibers. Journal of Molecular Liquids 2021, 321, 114476. [Google Scholar] [CrossRef]
- Facchi, D.P.; Lima, A.C.; de Oliveira, J.H.; Lazarin-Bidóia, D.; Nakamura, C.V.; Canesin, E.A.; Bonafé, E.G.; Monteiro, J.P.; Visentainer, J.V.; Muniz, E.C.; et al. Polyelectrolyte Complexes Based on Alginate/Tanfloc: Optimization, Characterization and Medical Application. International Journal of Biological Macromolecules 2017, 103, 129–138. [Google Scholar] [CrossRef] [PubMed]
- Vaccioli, K. Estudo da blenda PBAT/PLA com cargas. Mestrado em Engenharia Metalúrgica e de Materiais, Universidade de São Paulo: São Paulo, 2016.
- Sperling, L.H. Polymeric Multicomponent Materials: An Introduction; Wiley: New York, 1997; ISBN 978-0-471-04138-2. [Google Scholar]
- Plath, A.M.S.; Facchi, S.P.; Souza, P.R.; Sabino, R.M.; Corradini, E.; Muniz, E.C.; Popat, K.C.; Filho, L.C.; Kipper, M.J.; Martins, A.F. Zein Supports Scaffolding Capacity toward Mammalian Cells and Bactericidal and Antiadhesive Properties on Poly(ε-Caprolactone)/Zein Electrospun Fibers. Materials Today Chemistry 2021, 20, 100465. [Google Scholar] [CrossRef]
- Romero, R.; Chubb, L.; Travers, J.K.; Gonzales, T.R.; Ehrhart, N.P.; Kipper, M.J. Coating Cortical Bone Allografts with Periosteum-Mimetic Scaffolds Made of Chitosan, Trimethyl Chitosan, and Heparin. Carbohydr Polym 2015, 122, 144–151. [Google Scholar] [CrossRef] [PubMed]
- Balouiri, M.; Sadiki, M.; Ibnsouda, S.K. Methods for in Vitro Evaluating Antimicrobial Activity: A Review. J Pharm Anal 2016, 6, 71–79. [Google Scholar] [CrossRef]
- Da Silva, A.B.; Facchi, S.P.; Bezerra, F.M.; Lis, M.J.; Monteiro, J.P.; Bonafé, Elton.G.; Rubira, A.F.; Martins, A.F. Antimicrobial Composites Based on Methacrylic Acid–Methyl Methacrylate Electrospun Fibers Stabilized with Copper(II). Molecules 2024, 29, 2835. [Google Scholar] [CrossRef]
- Tedesco, L.; Bufalo, A.C.; Wietzikoski, E.C.; Velasquez, P.A.G.; Ciesca, G.M. Avaliação antibacteriana do extrato de melaleuca (Melaleuca alternifolia) frente à cepa de Staphylococcus aureus. Arq. ciências saúde UNIPAR 2014, 89–94. [Google Scholar] [CrossRef]
- Controle Interno Da Qualidade Para Testes de Sensibilidade a Antimicrobianos.Pdf — Agência Nacional de Vigilância Sanitária - Anvisa Available online:. Available online: https://www.gov.br/anvisa/pt-br/centraisdeconteudo/publicacoes/servicosdesaude/publicacoes/controle-interno-da-qualidade-para-testes-de-sensibilidade-a-antimicrobianos.pdf/view (accessed on 13 June 2024).
- da Cruz, J.A.; da Silva, A.B.; Ramin, B.B.S.; Souza, P.R.; Popat, K.C.; Zola, R.S.; Kipper, M.J.; Martins, A.F. Poly(Vinyl Alcohol)/Cationic Tannin Blend Films with Antioxidant and Antimicrobial Activities. Mater Sci Eng C Mater Biol Appl 2020, 107, 110357. [Google Scholar] [CrossRef] [PubMed]
- Madruga, L.Y.C.; Popat, K.C.; Balaban, R.C.; Kipper, M.J. Enhanced Blood Coagulation and Antibacterial Activities of Carboxymethyl-Kappa-Carrageenan-Containing Nanofibers. Carbohydr Polym 2021, 273, 118541. [Google Scholar] [CrossRef] [PubMed]
- Pavezi, K.J.P.; Rocha, A.; Bonafé, E.G.; Martins, A.F. Electrospinning-Electrospraying of Poly(Acid Lactic) Solutions in Binary Chloroform/Formic Acid and Chloroform/Acetic Acid Mixtures. Journal of Molecular Liquids 2020, 320, 114448. [Google Scholar] [CrossRef]
- Sibiryakov, N. Dependence of the Surfactant Solutions Surface Tension on the Concentration and on the Temperature. J. Phys.: Conf. Ser. 2021, 1867, 012026. [Google Scholar] [CrossRef]
- Oliveira, G.A.G. de Efeito da superfície hidrofílica na osseointegração de implantes em sítios com defeitos ósseos circunferenciais: estudo experimental em cães.
- Segundo, J. de D.P. de M. Influência Da Adição de Surfactantes Em Fibras Altamente Alinhadas de Poli (Caprolactona) Obtidas Por Eletrofiação.
- Vidal, P.; Martinez, M.; Hernandez, C.; Adhikari, A.R.; Mao, Y.; Materon, L.; Lozano, K. Development of Chromatic Biosensor for Quick Bacterial Detection Based on Polyvinyl Butyrate-Polydiacetylene Nonwoven Fiber Composites. European Polymer Journal 2019, 121, 109284. [Google Scholar] [CrossRef]
- Alves, A.C. de S.B. Estudo da influência do óleo essencial de alecrim nas propriedades de poli-(3- hidroxibutirato)/polietilenoglicol. Available online: https://repositorio.ufpe.br/handle/123456789/31889 (accessed on 13 June 2024).
- Biblioteca Digital de Tese e Dissertação: Desenvolvimento e Caracterização de Microemulsões Contendo o Óleo Essencial de Melaleuca Alternifolia Available online:. Available online: http://tede.bc.uepb.edu.br/jspui/handle/tede/3164 (accessed on 13 June 2024).
- Oliveira, A.C.M.; Fontana, A.; Negrini, T.C.; Nogueira, M.N.M.; Bedran, T.B.L.; Andrade, C.R.; Spolidorio, L.C.; Spolidorio, D.M.P. Emprego do óleo de Melaleuca alternifolia Cheel (Myrtaceae) na odontologia: perspectivas quanto à utilização como antimicrobiano alternativo às doenças infecciosas de origem bucal. Rev. bras. plantas med. 2011, 13, 492–499. [Google Scholar] [CrossRef]
- Loughlin, R.; Gilmore, B.F.; McCarron, P.A.; Tunney, M.M. Comparison of the Cidal Activity of Tea Tree Oil and Terpinen-4-Ol against Clinical Bacterial Skin Isolates and Human Fibroblast Cells. Lett Appl Microbiol 2008, 46, 428–433. [Google Scholar] [CrossRef] [PubMed]
- Banes-Marshall, L.; Cawley, P.; Phillips, C.A. In Vitro Activity of Melaleuca Alternifolia (Tea Tree) Oil against Bacterial and Candida Spp. Isolates from Clinical Specimens. Br J Biomed Sci 2001, 58, 139–145. [Google Scholar] [PubMed]
- Costa, M.C.V.V. Citotoxicidade, propriedades antioxidantes e avaliação da atividade antimicrobiana do extrato de Syzygium cumini (L.) Skeels após irradiação gama Available online:. Available online: https://repositorio.ufpe.br/handle/123456789/28485 (accessed on 12 June 2024).
- Costa, A.R. de M. Blendas de Poli (B-Hidroxibutirato) e Poli (Butileno-Adipatotereftalato) e seus compósitos com babaçu: efeito da composição e das condições de processamento. doctoralThesis, Brasil, 2019.
- Stover, C.K.; Pham, X.Q.; Erwin, A.L.; Mizoguchi, S.D.; Warrener, P.; Hickey, M.J.; Brinkman, F.S.L.; Hufnagle, W.O.; Kowalik, D.J.; Lagrou, M.; et al. Complete Genome Sequence of Pseudomonas Aeruginosa PAO1, an Opportunistic Pathogen. Nature 2000, 406, 959–964. [Google Scholar] [CrossRef]
- O’Loughlin, C.T.; Miller, L.C.; Siryaporn, A.; Drescher, K.; Semmelhack, M.F.; Bassler, B.L. A Quorum-Sensing Inhibitor Blocks Pseudomonas Aeruginosa Virulence and Biofilm Formation. Proc Natl Acad Sci U S A 2013, 110, 17981–17986. [Google Scholar] [CrossRef]
Disclaimer/Publisher’s Note: The statements, opinions and data contained in all publications are solely those of the individual author(s) and contributor(s) and not of MDPI and/or the editor(s). MDPI and/or the editor(s) disclaim responsibility for any injury to people or property resulting from any ideas, methods, instructions or products referred to in the content. |
© 2024 by the authors. Licensee MDPI, Basel, Switzerland. This article is an open access article distributed under the terms and conditions of the Creative Commons Attribution (CC BY) license (http://creativecommons.org/licenses/by/4.0/).


