1. Introduction
With the advancement of power electronics technology, pulse-width modulation (PWM)-controlled converters have become widely utilized for applications requiring high precision and efficiency such as communication and industrial equipment control [
1,
2,
3]. A substantial amount of research is devoted to the mathematical modeling of PWM. Practical issues regarding the applicability of individual methods and implementations of approaches to PWM simulation are especially acute.
The principles for control of a linear resonant drive with PWM are the main focus of [
4]. Three methods are tested to convert force to PWM, two of which show linear correlation (>0.7) with the original data. The correlation between PWM commands and the generated acceleration was found highly linear across all three methods with a minimum coefficient of 0.85.
The effects of (low) switching frequency and delays (associated with digital control implementation) on PWM powered DC servos are examined in [
5]. A modeling procedure and analytical formulas are presented to quantify deviations from standard (idealized) fixed-gain models.
Another area of PWM application for radio communication problems is considered in [
6]. To solve the problem of real-time system performance limitation by time resolution, the phase shift control principle is used to constrain the output pulse state.
In [
7], a mathematical input-output model is initially designed by constructing equations and transforming dq coordinates. Then, voltage and current double closed-loop simulation model is built in MATLAB/Simulink, and the control effect is analyzed. Based on this, a new voltage setting strategy is developed to reduce the output voltage overload of the PWM rectifier at startup.
In the studies [
8,
9], the main goal of control in the proposed inverter is to regulate the current in the network with a low level of total harmonic distortion and compensation of load power components. The proposed control and switching methods are aimed at achieving a voltage balance on the DC side and the lowest switching losses.
Approaches with pulse-width modulation necessary for regulating the power supply of multiphase AC drives are presented in [
10,
11]. The study by colleagues provides comparisons and approaches to enhancing, shaping, and modulating control used to improve the quality of output power converters.
An elevator system presented in [
12] provides energy supply inside the elevator car by eliminating the need for running cable and using a low-capacity energy storage. The work [
13] presents results on designing the PWM control algorithms.
To effectively combat the effects of both matched and mismatched power disturbances in a three-phase PWM rectifier, a robust direct power control method with a single-loop control structure is proposed in [
14,
15].
The paper [
16] presents a study of traditional propulsion systems used for ships. These systems include diesel and turbo-electric drives with a cycloconverter technology used for speed regulation. The main disadvantage of the cycloconverter technology is the characteristic output voltage waveform, which is non-sinusoidal and produces harmonic-laden currents, which negatively affects power factor and efficiency.
The paper [
17] presents the use of the Butterworth approach for the design and control of a PWM rectifier based on an LCL filter with power quality functions. By using the linear portion of the system, this approach reduces the number of variables involved in the control scheme. This approach differs from previous methods in that it does not use nonlinear controllers, dq–transformations, or double control loops. Thus, this approach simplifies the design and control of power converters through the use of polynomial synthesis, while also enhancing the system performance in complex scenarios.
PWM control algorithms for wireless charging stations are presented in [
18]. This work considers a topology with PWM controlled switched impedance.
The focus of [
19] is on AC/DC converters, with an interleaved full bridge chosen as the topology due to its flexibility and ability to increase system power. To ensure high performance, various PWM techniques are analyzed for this converter.
A study of simulation models of motor, inverter, speed detection circuit, and controller is presented in [
20].
Models of the dynamics of electric drives are usually defined using a system of differential-algebraic equations. In this case, to ensure accurate modeling, it is essential to carefully select an integration step for the model. This will enable the pulse-width modulator model to correctly process the events where the value of the reference PWM signal is exceeded relative to the modulating one. Accordingly, to fulfill this condition, it is necessary to select an integration step that is smaller than the frequency of the PWM counter or to build the model of the pulse-width modulator, considering the need to define the timing of events where the values of these signals intersect. In the first case, the model will require a significant increase in the number of integration steps. The algorithm for detection the intersection of the PWM modulating signal with the reference signal allows reducing the total number of integration steps by introducing intermediate integration steps.
2. Problem Statement
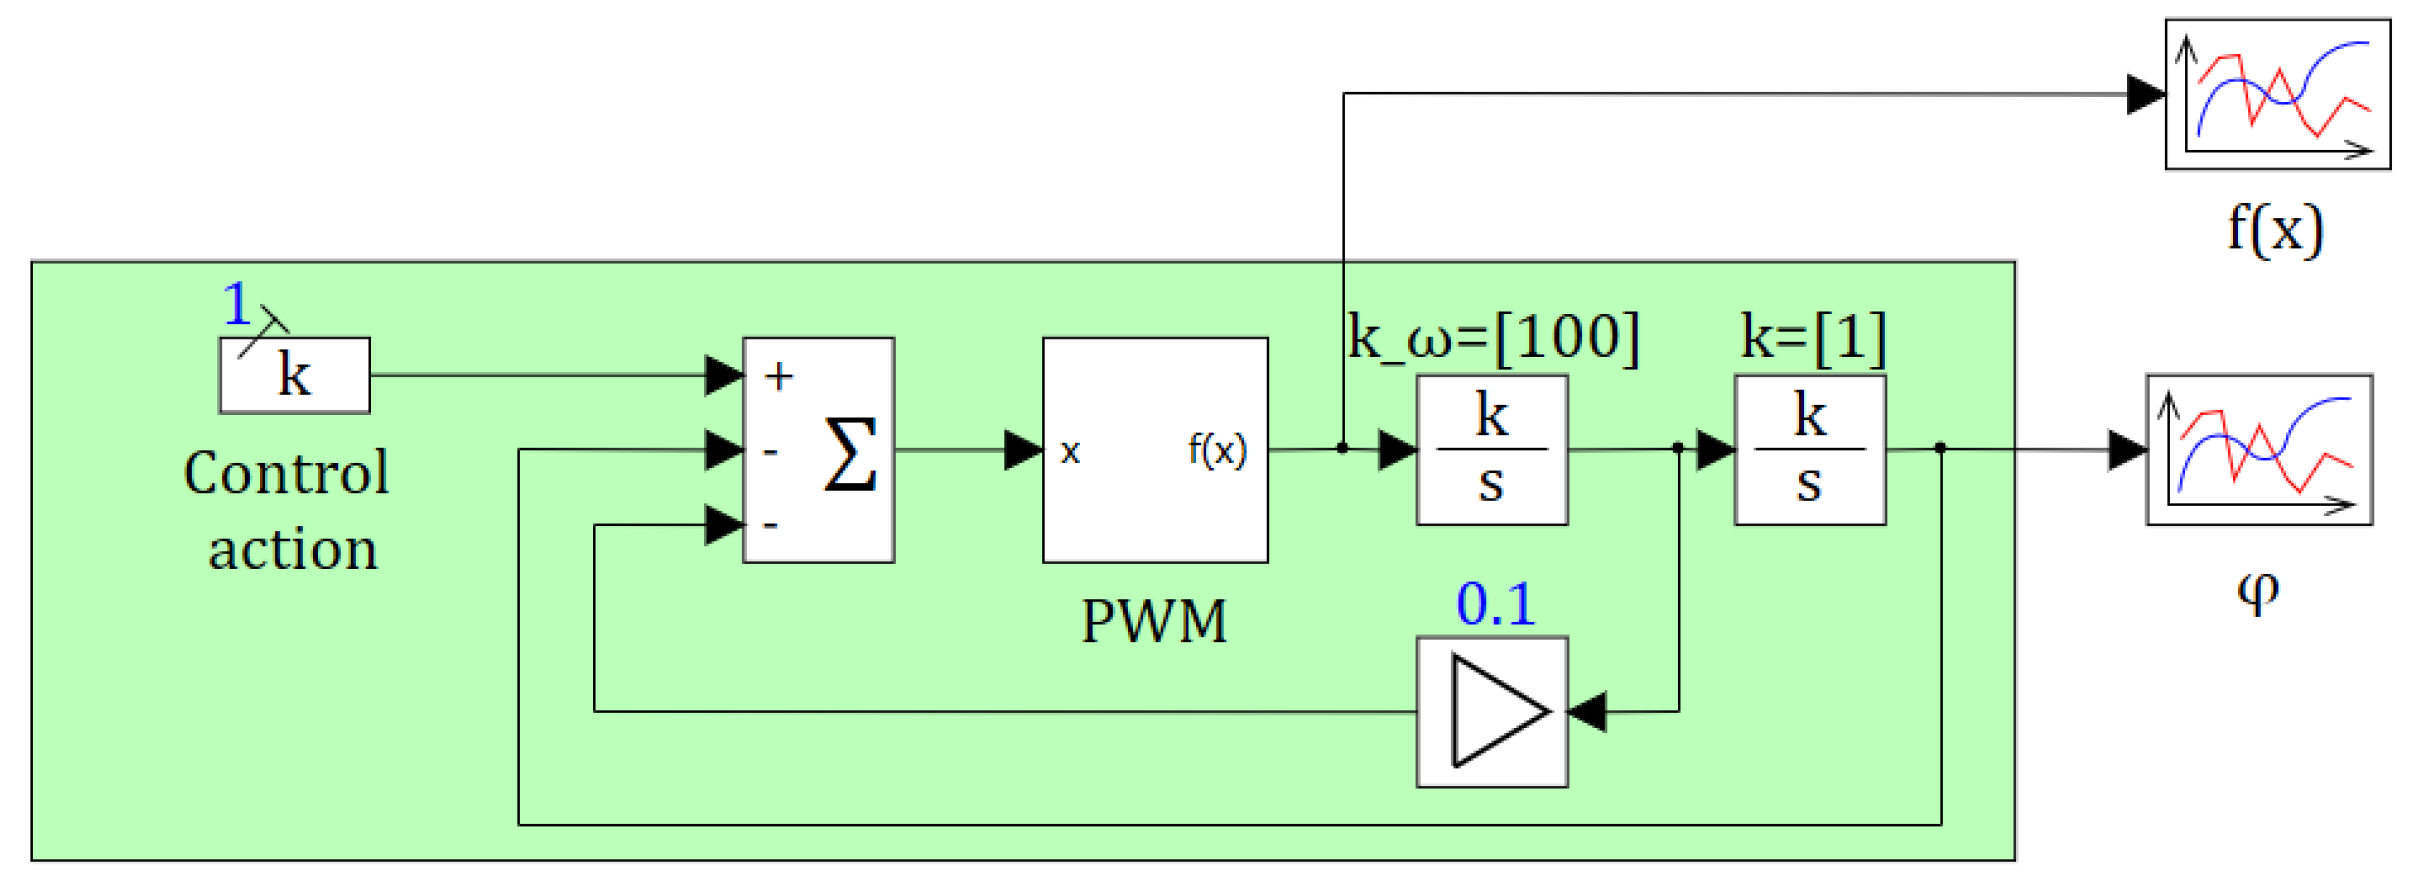
Let us consider an example of using PWM when implementing the simplest servo drive [
21], the structure of which is shown in
Figure 1.
The model of such a servo drive with a symmetrical pulse-width modulator can be described by the following system of equations
where
is the angular velocity with the initial value
;
is the speed gain;
is the control action;
is the damping coefficient;
is the angle of rotation with initial value
;
is the PWM function.
If we assume the value of the PWM modulating signal to be
, then
where
Finally, we find the function z(x, t) from (2) in the form
where
is the PWM coefficient.
In this case, the source of the reference sawtooth signal in this model is calculated as
where
is the PWM period in seconds.
As seen from the above equations, this model includes three nonlinearities with discontinuities of the first kind. This leads to corresponding computational difficulties, for example, stiffness in certain modes [
22], which are associated with the need to correctly determine the integration step when the values of the modulating and reference signals intersect [
23], and use appropriate integration methods [
24]. In this case, it is crucial to determine the time of the transition point for nonlinearity (4), which determines the pulse duration.
To do this, we introduce the intersection function
and from the condition
we will limit the integration step
,
so that it corresponds to the condition
where
is the exact time at which condition (7) is satisfied,
is the value of the model time at the next integration step,
is the value at the current step,
is the specified temporal accuracy of intersection detection,
is the integration step number.
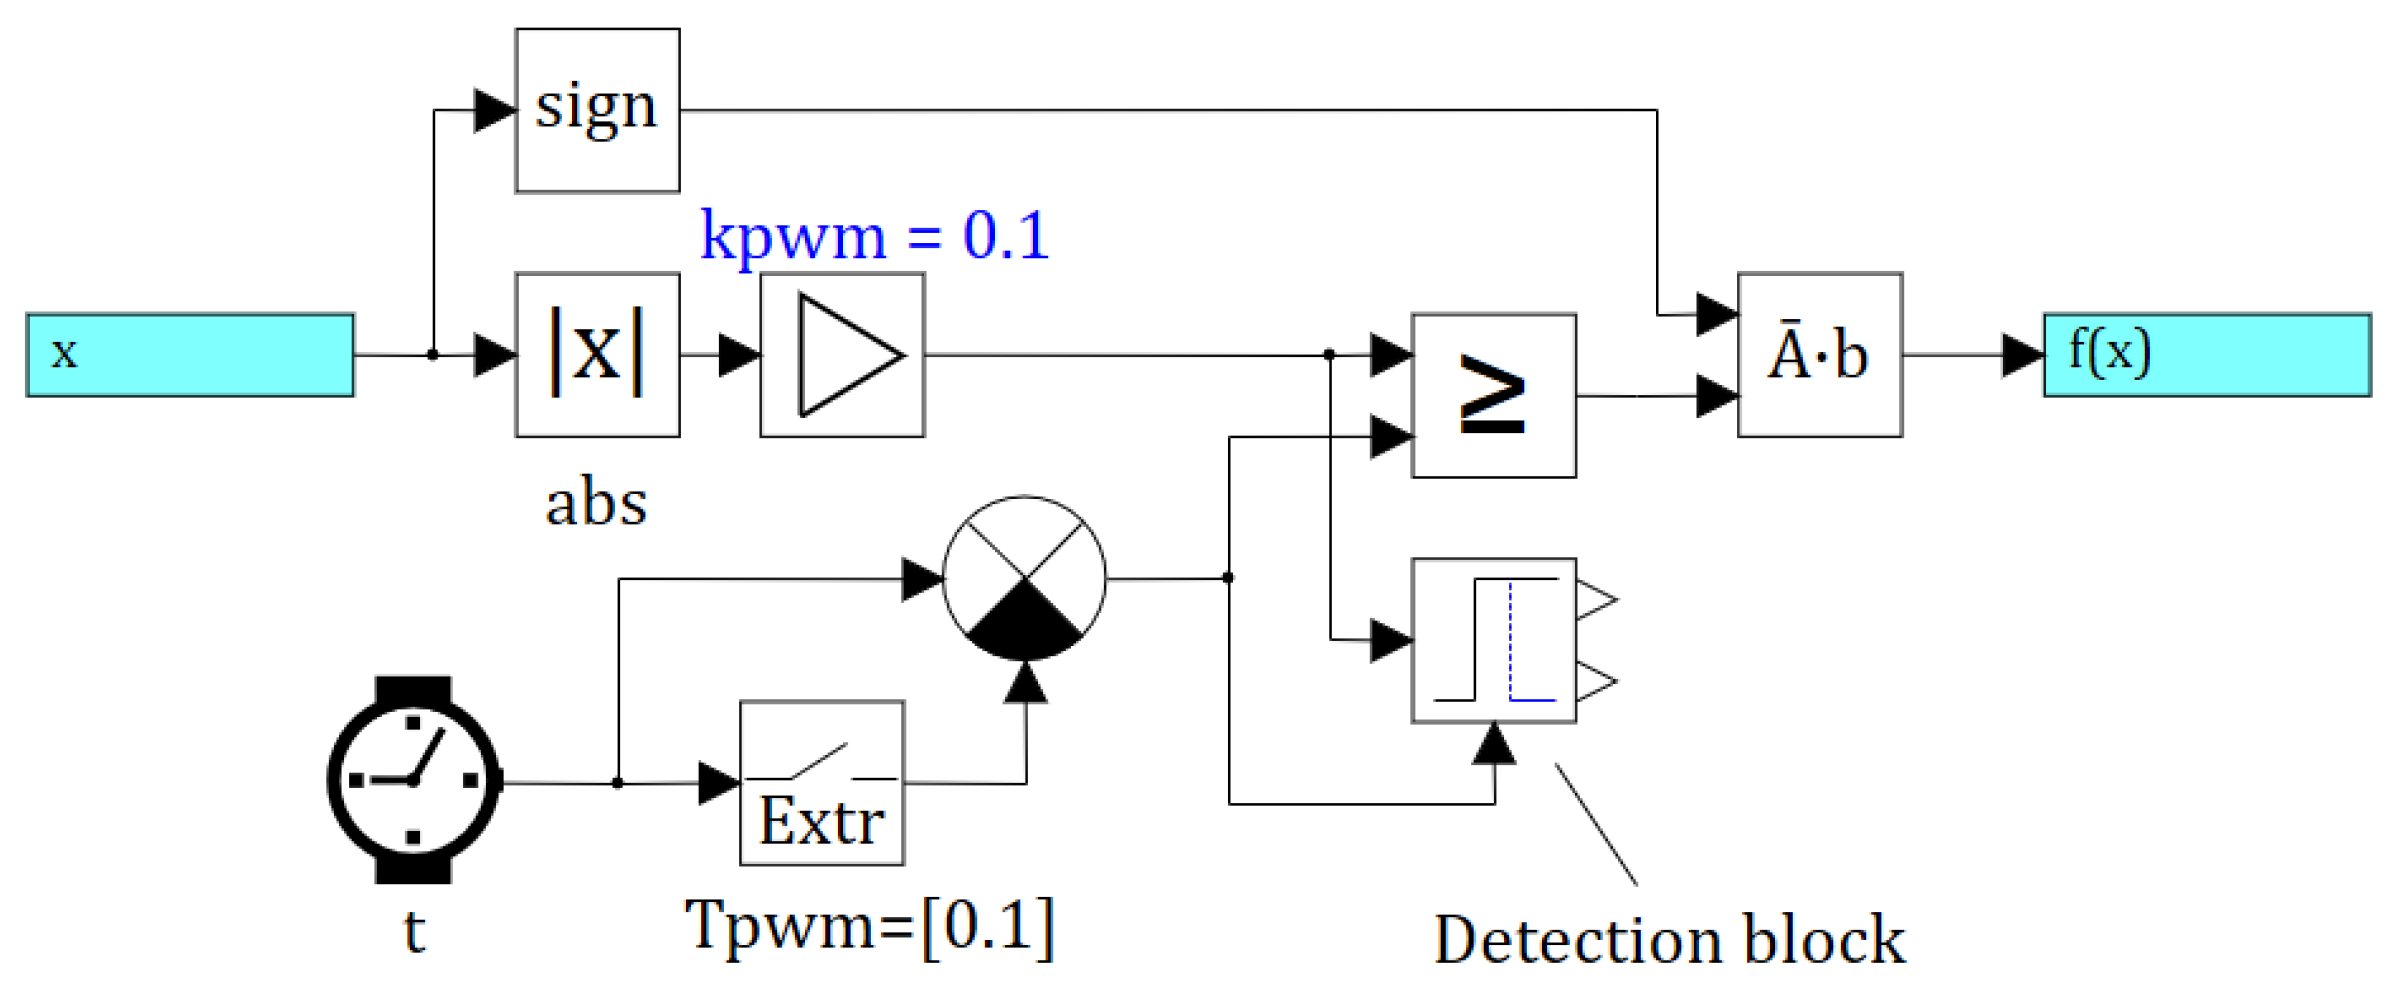
The block diagram of the PWM submodel in the SimInTech software [
25] is shown in
Figure 2.
In addition to the main comparison operator (4), the system of equations also indicates that there are at least 2 nonlinearities (3) and (5). In this case, the nonlinear equation (5), which generates the reference sawtooth signal, depends only on the model time variable. This means that in order to specify the shape of the sawtooth signal, it is also necessary to accurately calculate the times at which this function takes on zero and maximum values. This greatly affects the quality of the transient process modeling. For the nonlinear equation (5), the values of the points where this function takes on the minimum and maximum values are a priori set by the PWM period parameter .
The values of the time when the events of reaching the minimum and maximum occur are equivalent to zeros or ones of the event function
, which has the form [
26]
and is related to the generator function of a sawtooth signal as follows
By combining condition (7) with the one-sidedness condition, we can formulate an event function [
27] that describes the intersection of the reference and modulating signal values
In order to correctly specify the step for blocks with precisely known times of occurrence of events in blocks of signal sources and blocks with a given discrete time (discrete blocks, timers, delays), the required integration step of the occurrence of an event is calculated, and the formula for calculating the required steps may vary for different types of block. As a result, the integration method takes the minimum possible required step from all such blocks. For blocks with a priori known response times, which do not depend on the values of dynamic state variables, iterations are not required and the size for the next step can be immediately calculated.
The intersection detection algorithm includes two components: the integration method itself and the intersection detection algorithm that interacts with it. The intersection detection algorithm is as follows:
- 1.
Calculate function (6) of intersections at the trial step:
- 2.
Numerically calculate increment of function (5) at the current i trial step:
- 3.
Determine a predicate for the presence of an event of a given type
(increase, decrease, both) at the current trial step. For an increase, we have:
For a decrease, we have:
- 4.
Calculate the upper limit of the step at the k+1 trial iteration of the integration method
where
is the step reduction factor at iterations, taken equal to 0.55;
is the integration step at the current trial step;
is the value of function (5) at the previous accepted integration step;
is the minimum specified integration step;
is the step obtained by extrapolation method, if the event is not recorded at the intermediate step, which is calculated as
where the extrapolation estimate of the integration step is calculated by the formula
where
- 5.
If the integration step at the next trial step satisfies the calculated upper constraint and exceeds the minimum specified integration step, then the integration method stops executing trial steps and performs the accepted step, provided the specified accuracy in the dynamic and algebraic state variables is satisfied
One of the disadvantages of intersection detection algorithms for arbitrary nonlinearities is the need to perform an additional trial step for the interpolation stage of the algorithm (i.e., when an event occurs between two trial steps). This leads to a slight increase in computational cost, resulting in enhanced modeling accuracy.
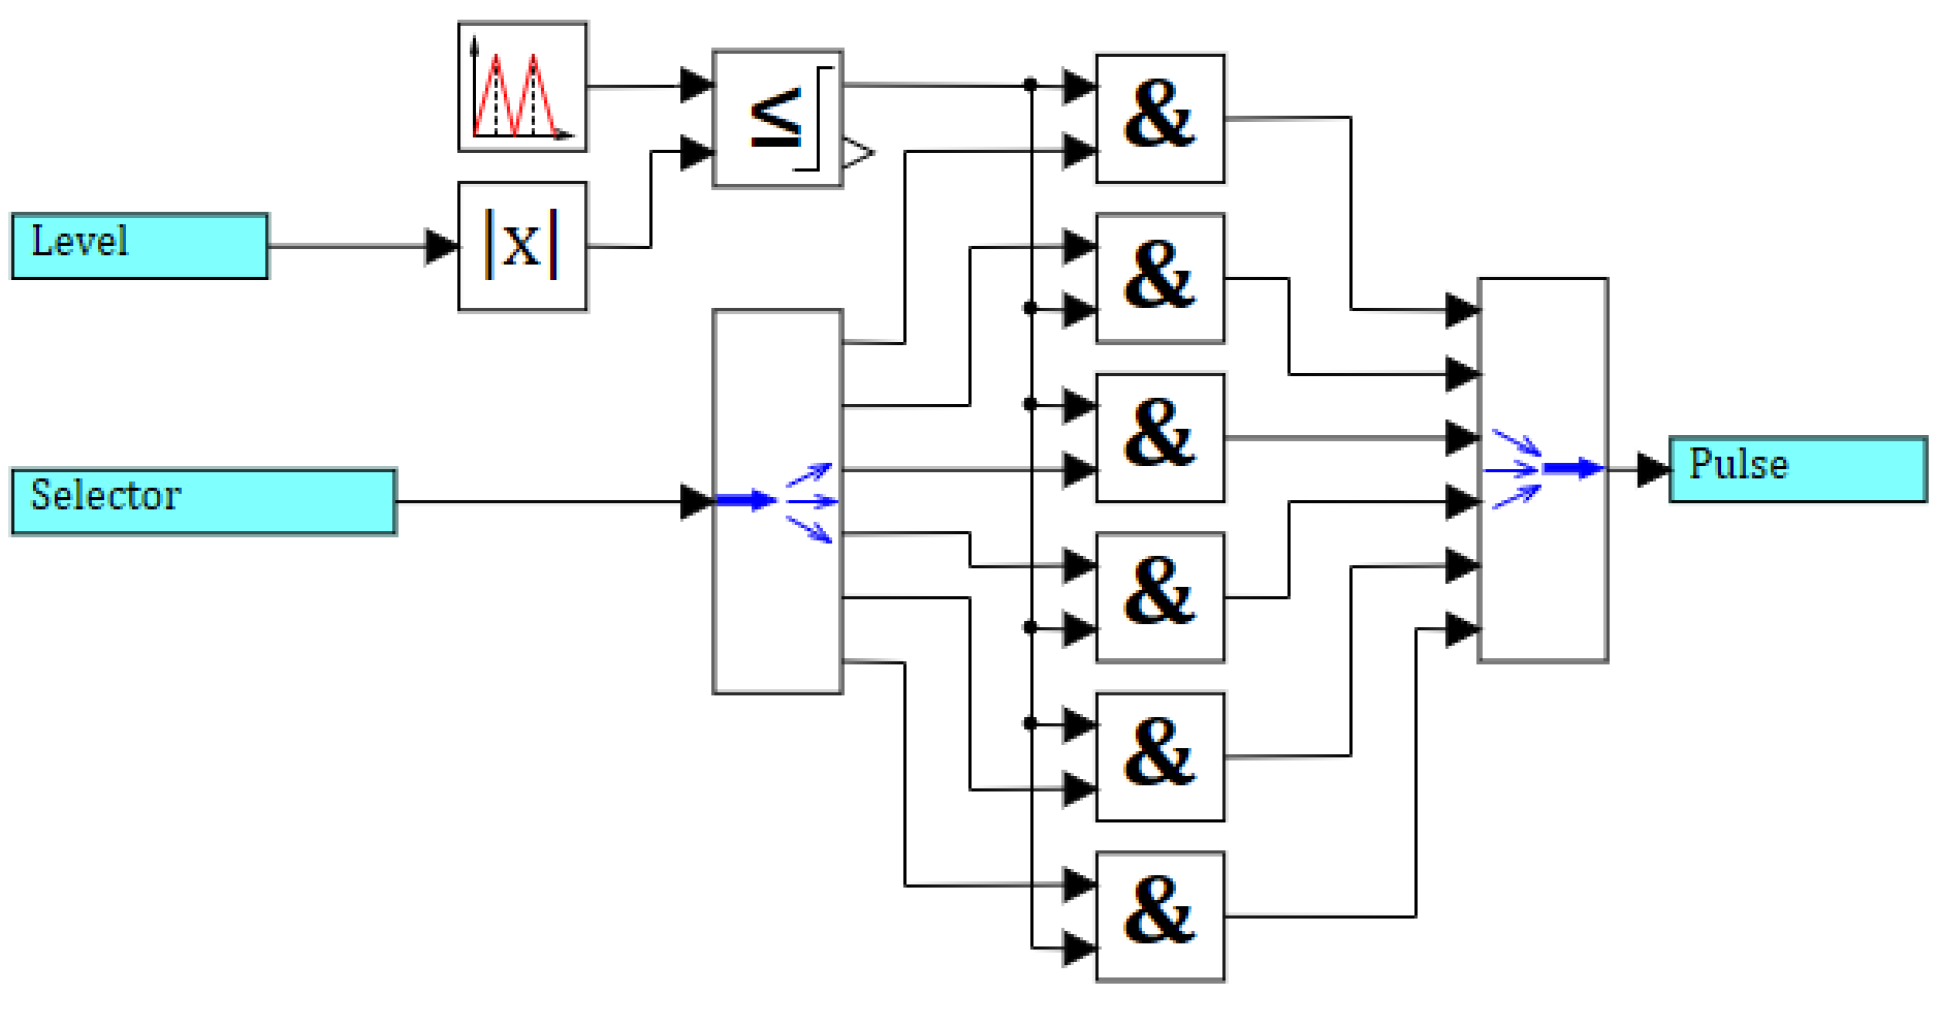
To take into account intersection events in the models that require this (for example, a PWM model), instead of a standard comparison block, a comparison block with intersection detection is used, the internal diagram of which is shown in
Figure 3.
An example of a more complex version of the PWM model for controlling a brushless DC motor (BLDC) is shown in
Figure 4.
As seen in the Figure, the model contains 2 blocks, the events of which must be factored in. These are the block of triangular signal generator and the block for comparing the values of the modulating and reference signals, which represents a nonlinearity with a discontinuity of the first kind.
3. Testing the Detection Algorithm
The intersection detection algorithm is tested using a model of PWM-based servo drive (
Figure 1) as an example, with the following calculation settings: the integration method ARK32v1 is an explicit adaptive Runge-Kutta type method of order 3 for non-stiff problems and that of order 2 for stiff problems [
28], minimum integration step of
, maximum step for the reference model without intersection detection of
s, for tested models without detection and with detection of only intersections 0.1 s, for a model with additional refinement by period of sources and discrete blocks, and detection of intersections 1 s. The model parameters assumed are:
,
,
,
, initial conditions:
,
, the control action is taken as a constant
, time detection accuracy
s. The accuracy settings of the integration method are as follows: relative error of no more than 0.001, and absolute error of no more than
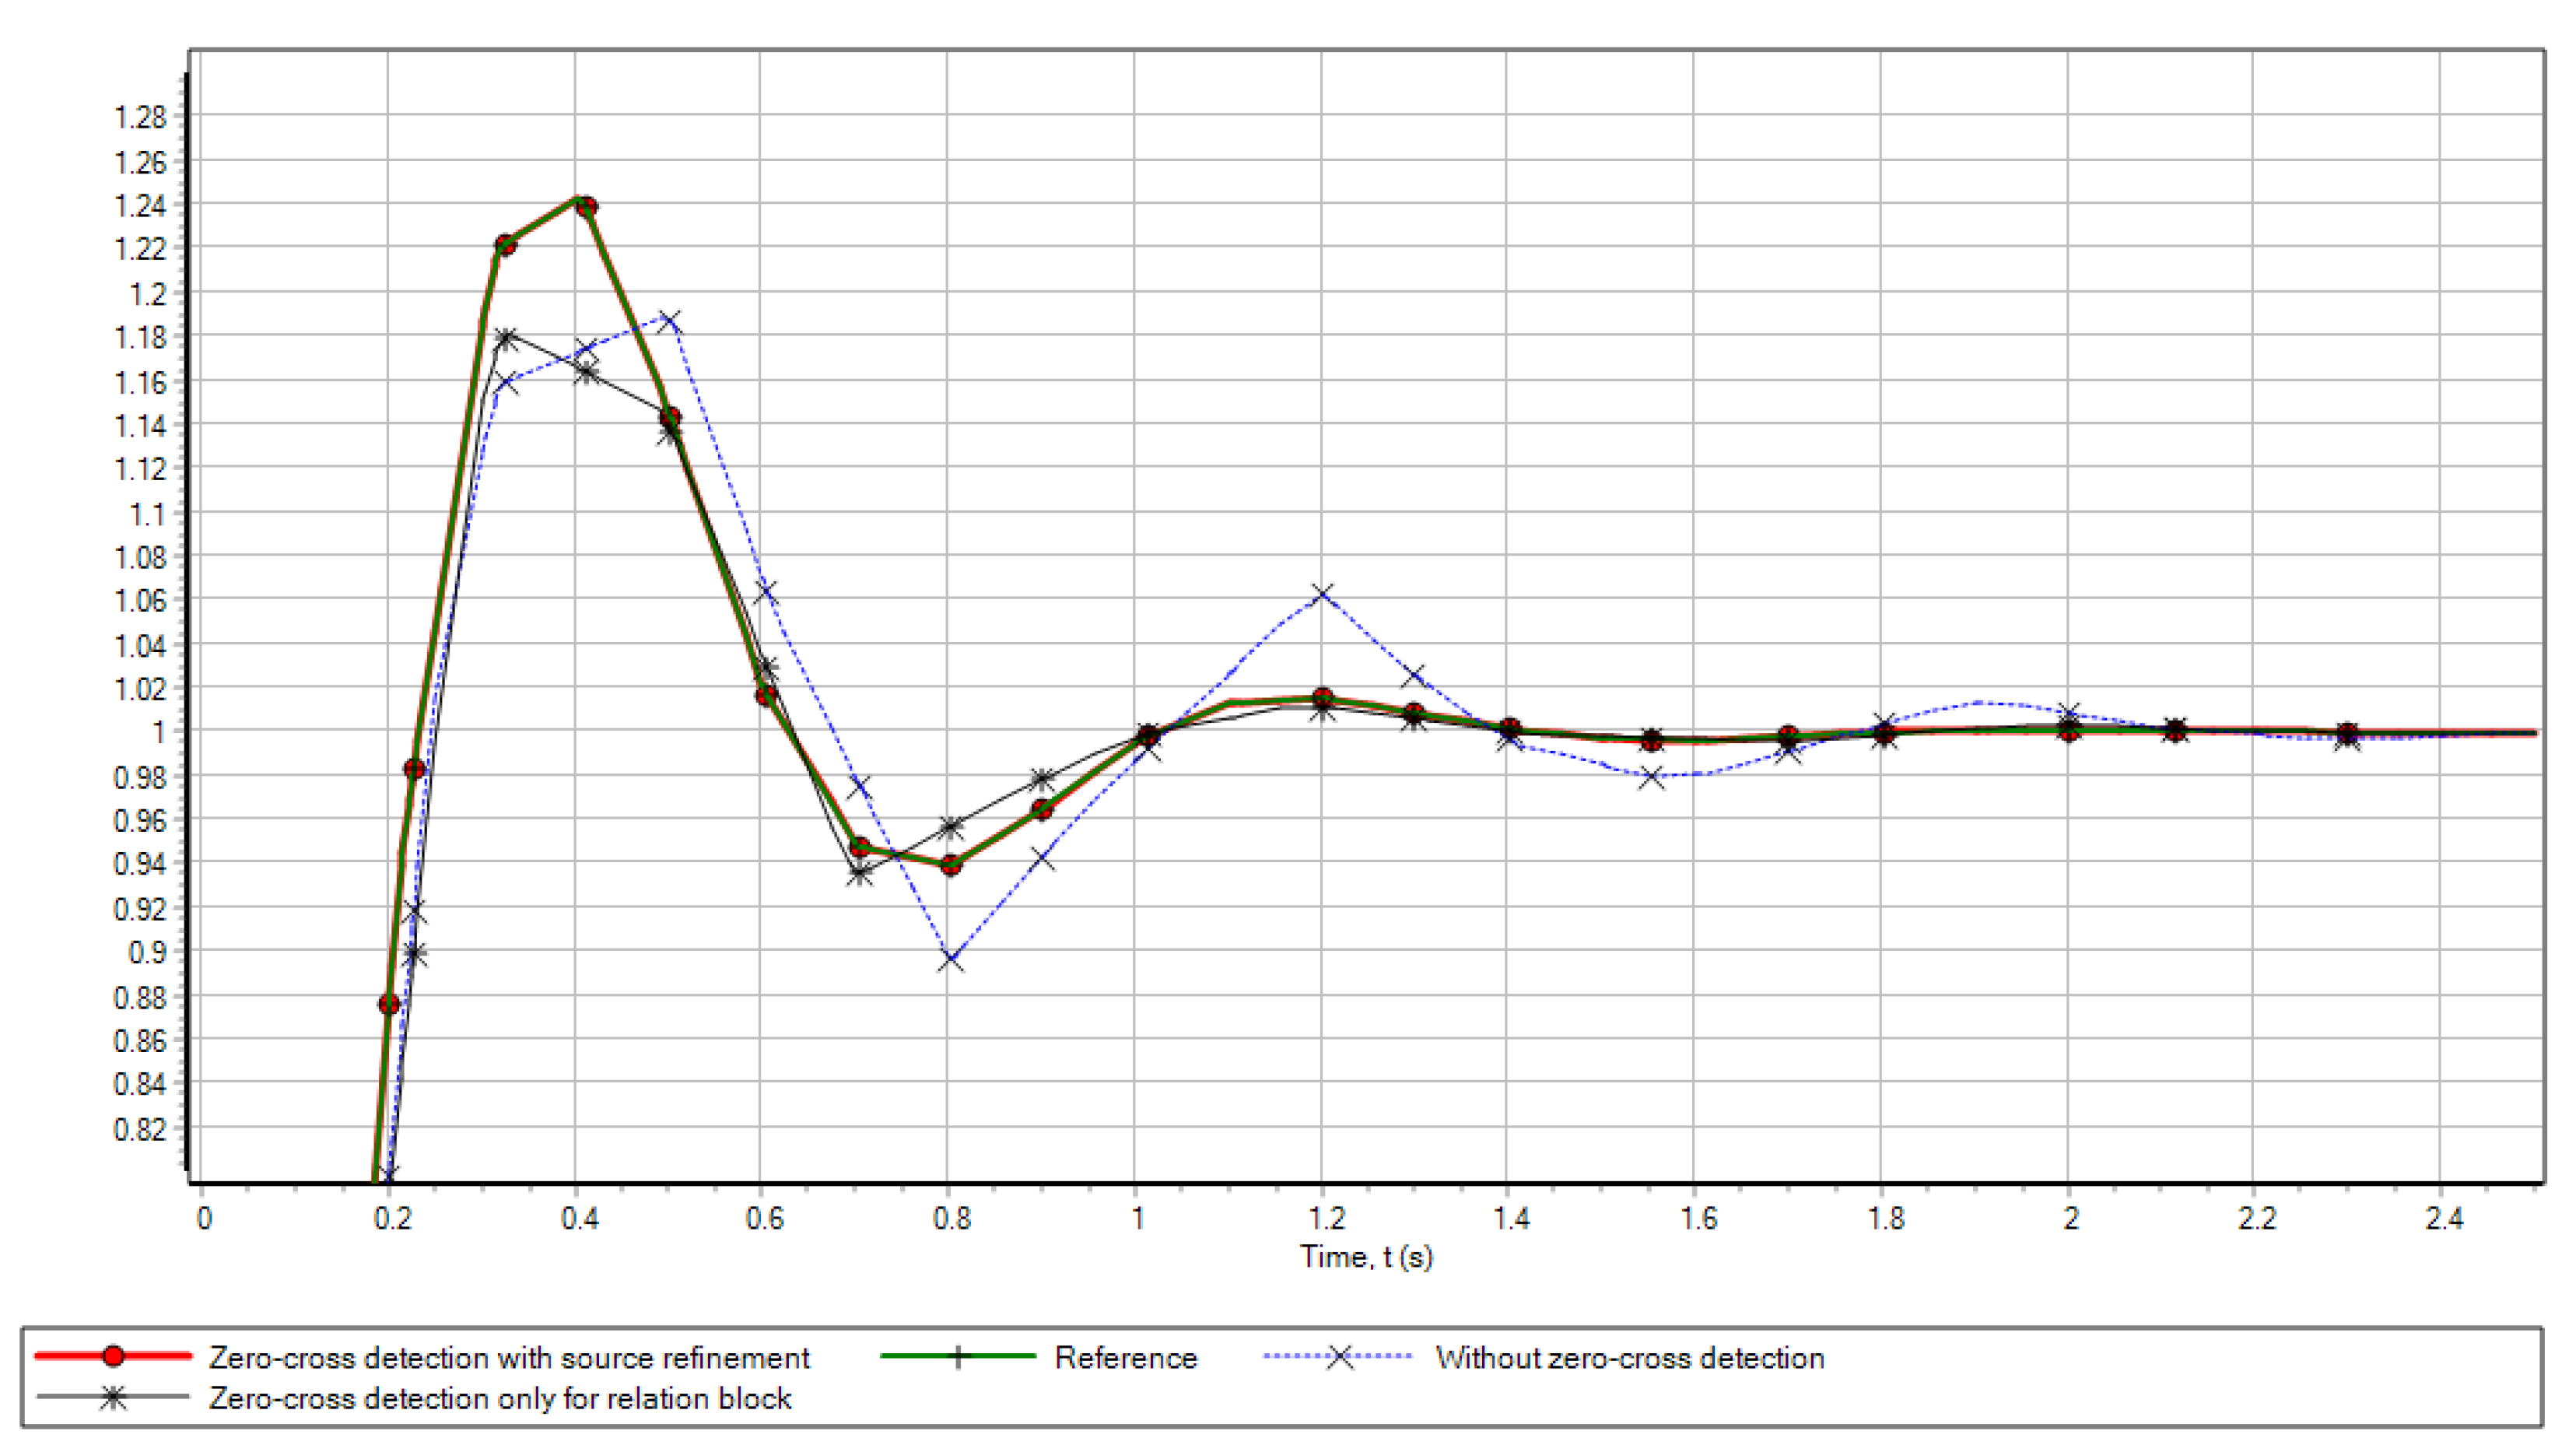
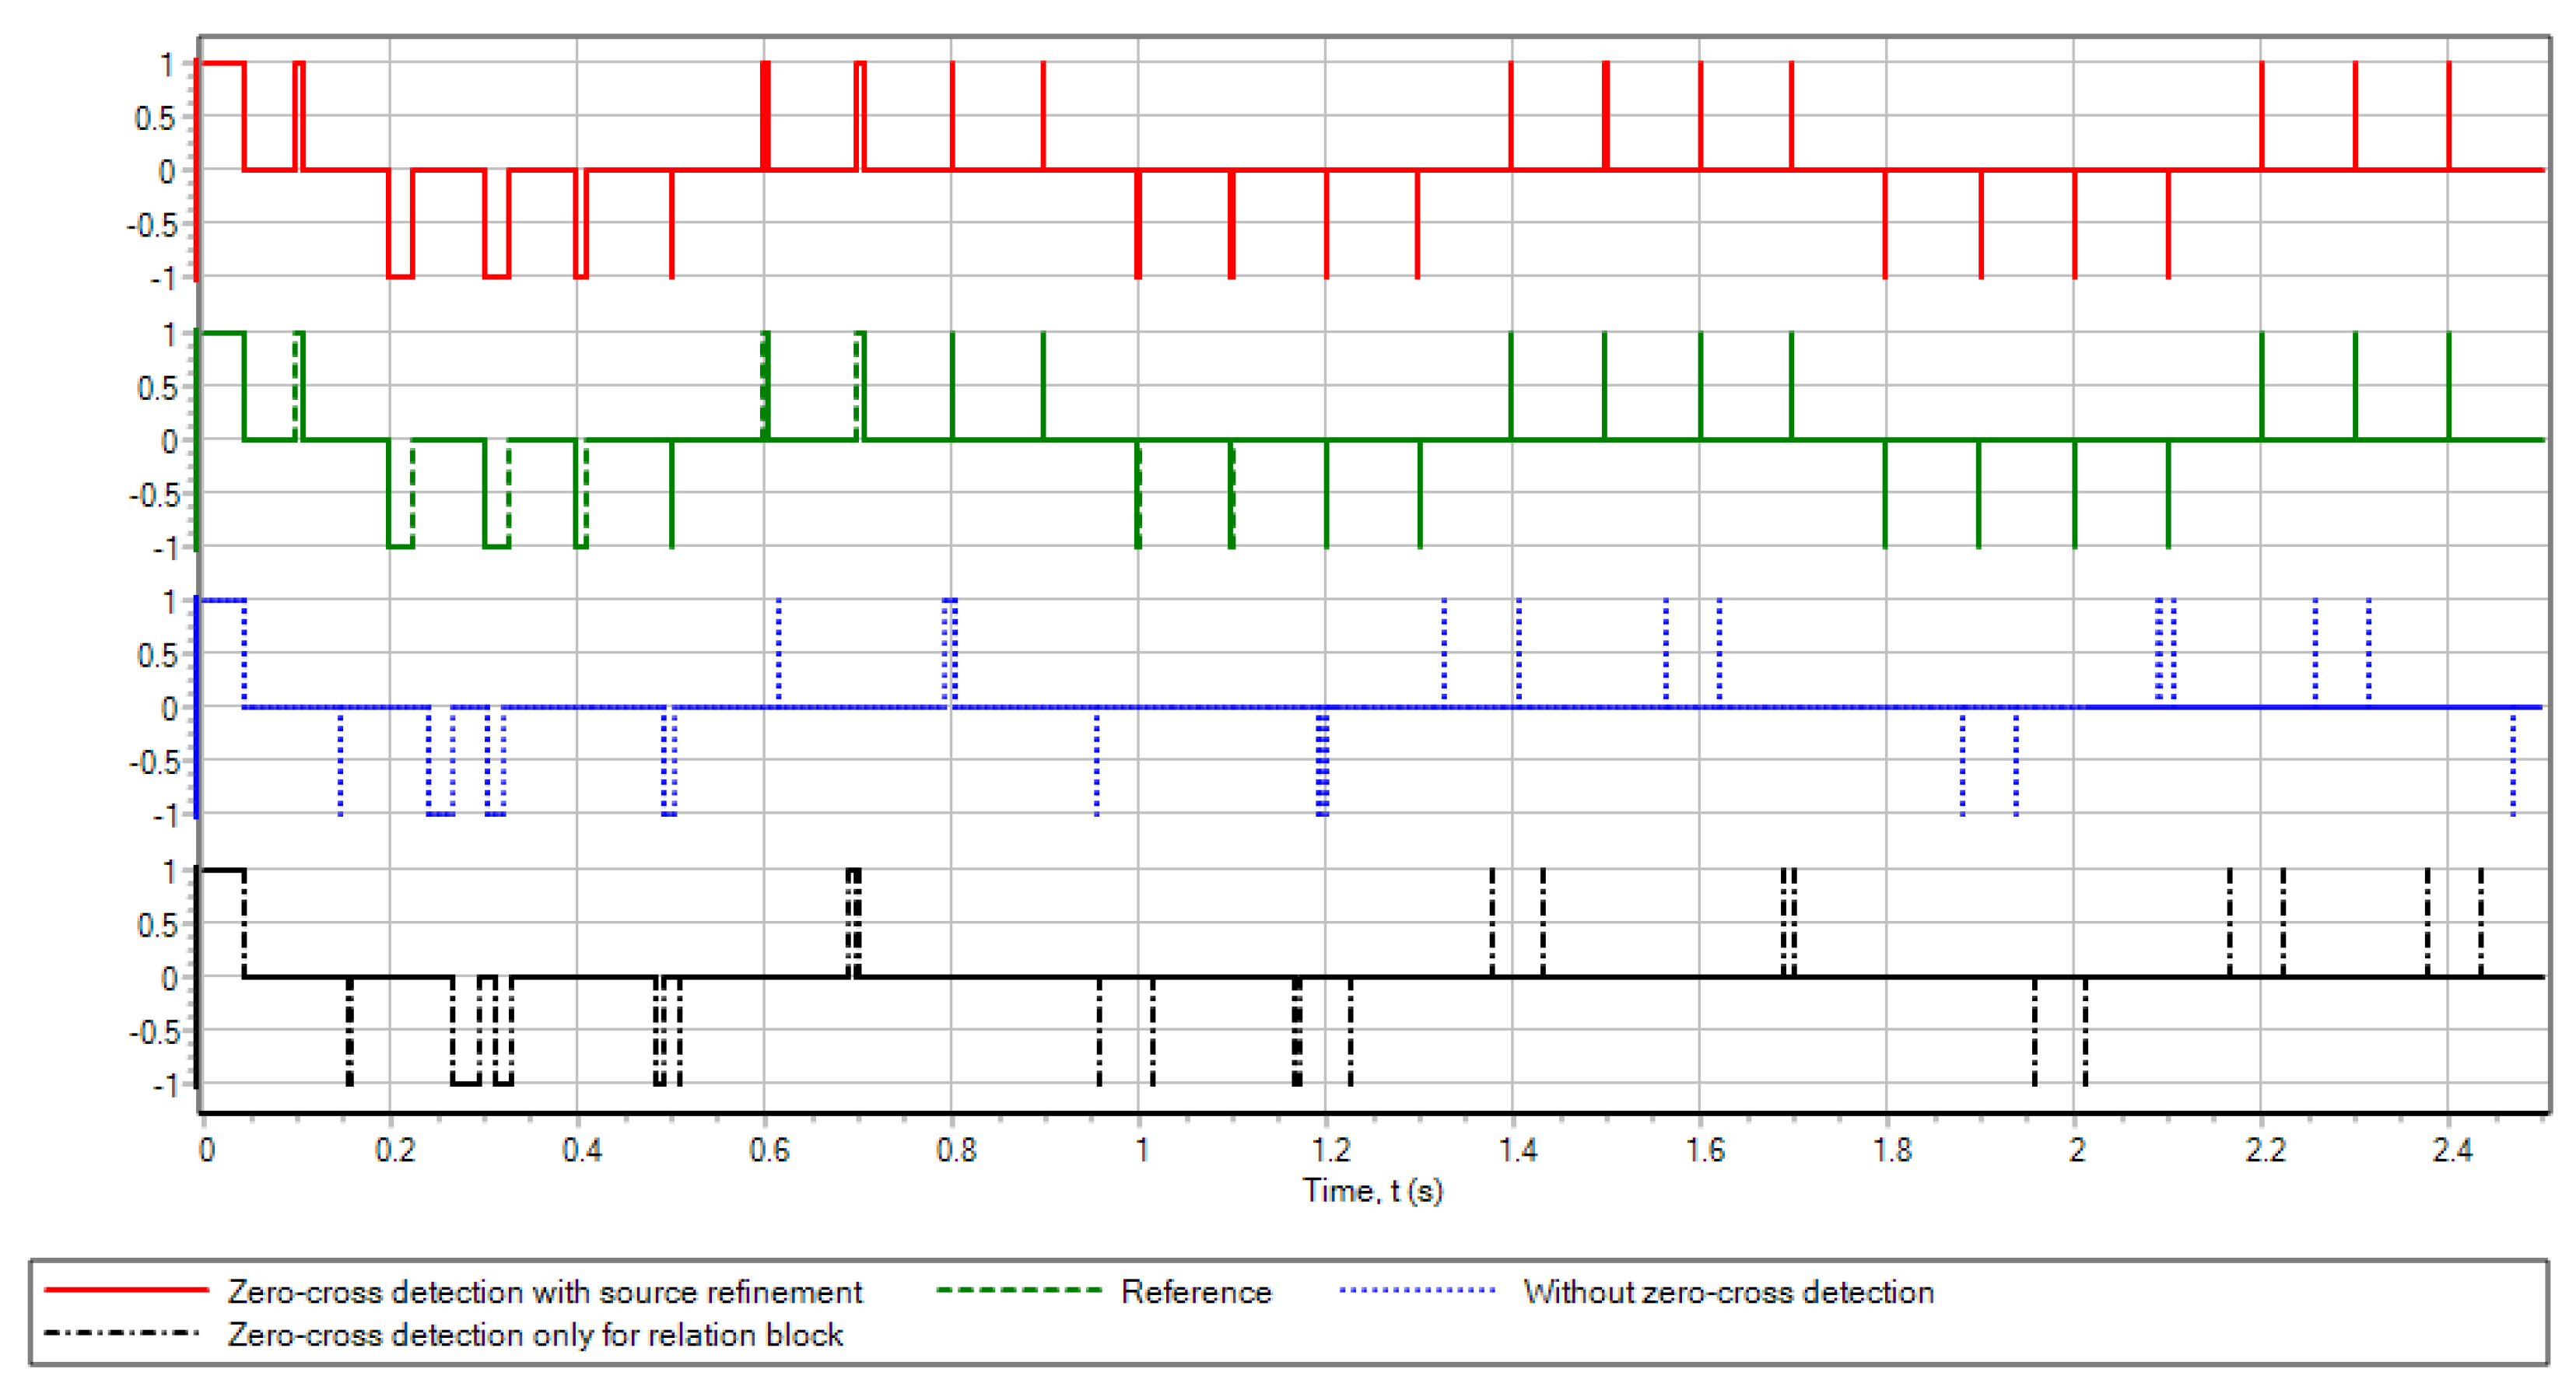
. The standard deviation of the output signal was calculated over the full modeling interval, using linear interpolation of the data calculated for the reference model. The numerical simulation results are shown in
Figure 5 and
Figure 6.
4. Cross-Verification of the Intersection Detection Algorithm
In order to cross-verify the presented intersection detection algorithm, a model of a simple servo drive with PWM was developed in the ISMA 2007 modeling and simulation environment, aimed at calculating hybrid dynamic systems.
The block diagram built in the ISMA 2007 is shown in
Figure 7. Diagram parameters are:
(amplifier on the right side of the diagram),
(amplifier to the right of the PWM block),
(amplifier to the left of the PWM block),
(set in the PWM text block). The initial conditions are
,
, the control action is taken as a constant
(the constant signal source on the left side of the diagram).
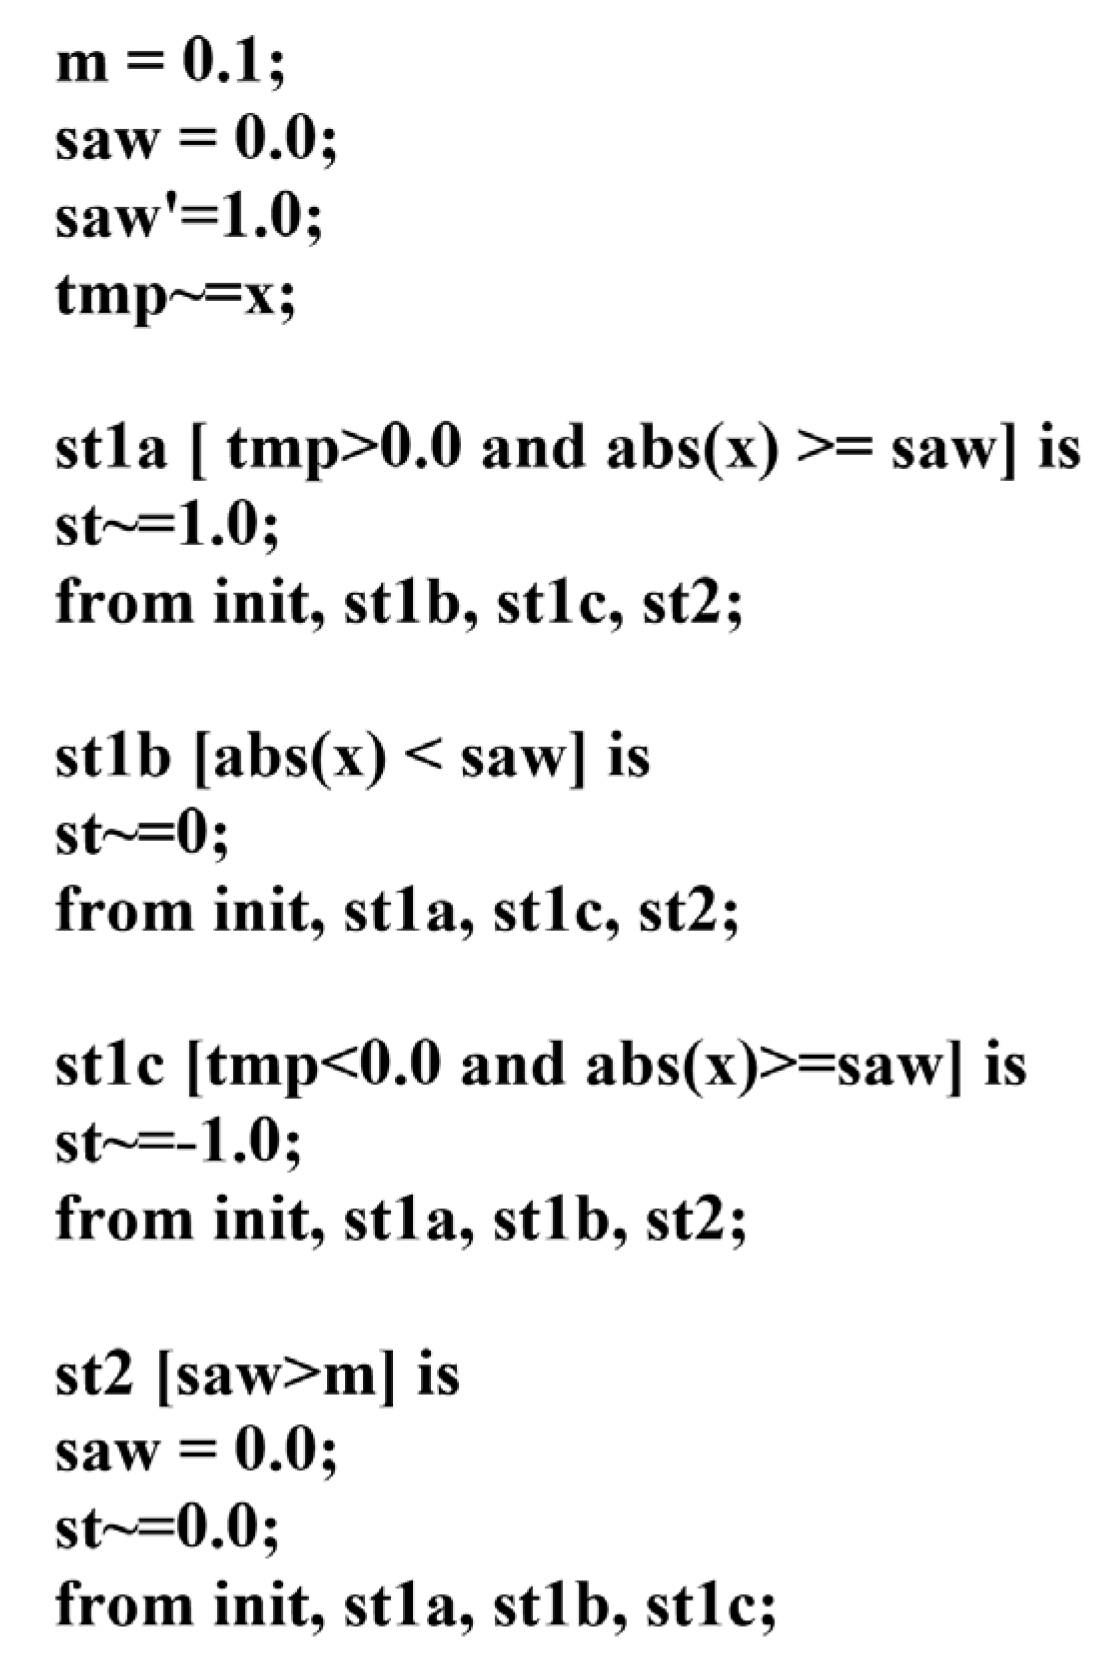
The text component of the model, which implements pulse control (error pulse signal) is presented in
Figure 8. Here,
is the value of the signal received at the PWM block input,
is the output of the block (PWM signal). The reference sawtooth signal is generated by integrating the
equation reset upon reaching a
value greater than the PWM period (
). The model can be in four states:
meets the condition
;
fulfills the condition z(x,t)=0, and
satisfies the condition
. The fourth state
is necessary to reset the value of the
saw variable when a sawtooth signal is generated.
Parameters of the computational experiment are: calculation interval STEKS integration algorithm, accuracy , initial step ; switching detection algorithm based on the Runge-Kutta method with parameter .
The computational experiment required 1 285 integration steps, with the average step size being approximately , and 6 425 calculations of the right-hand side of the Cauchy problem.
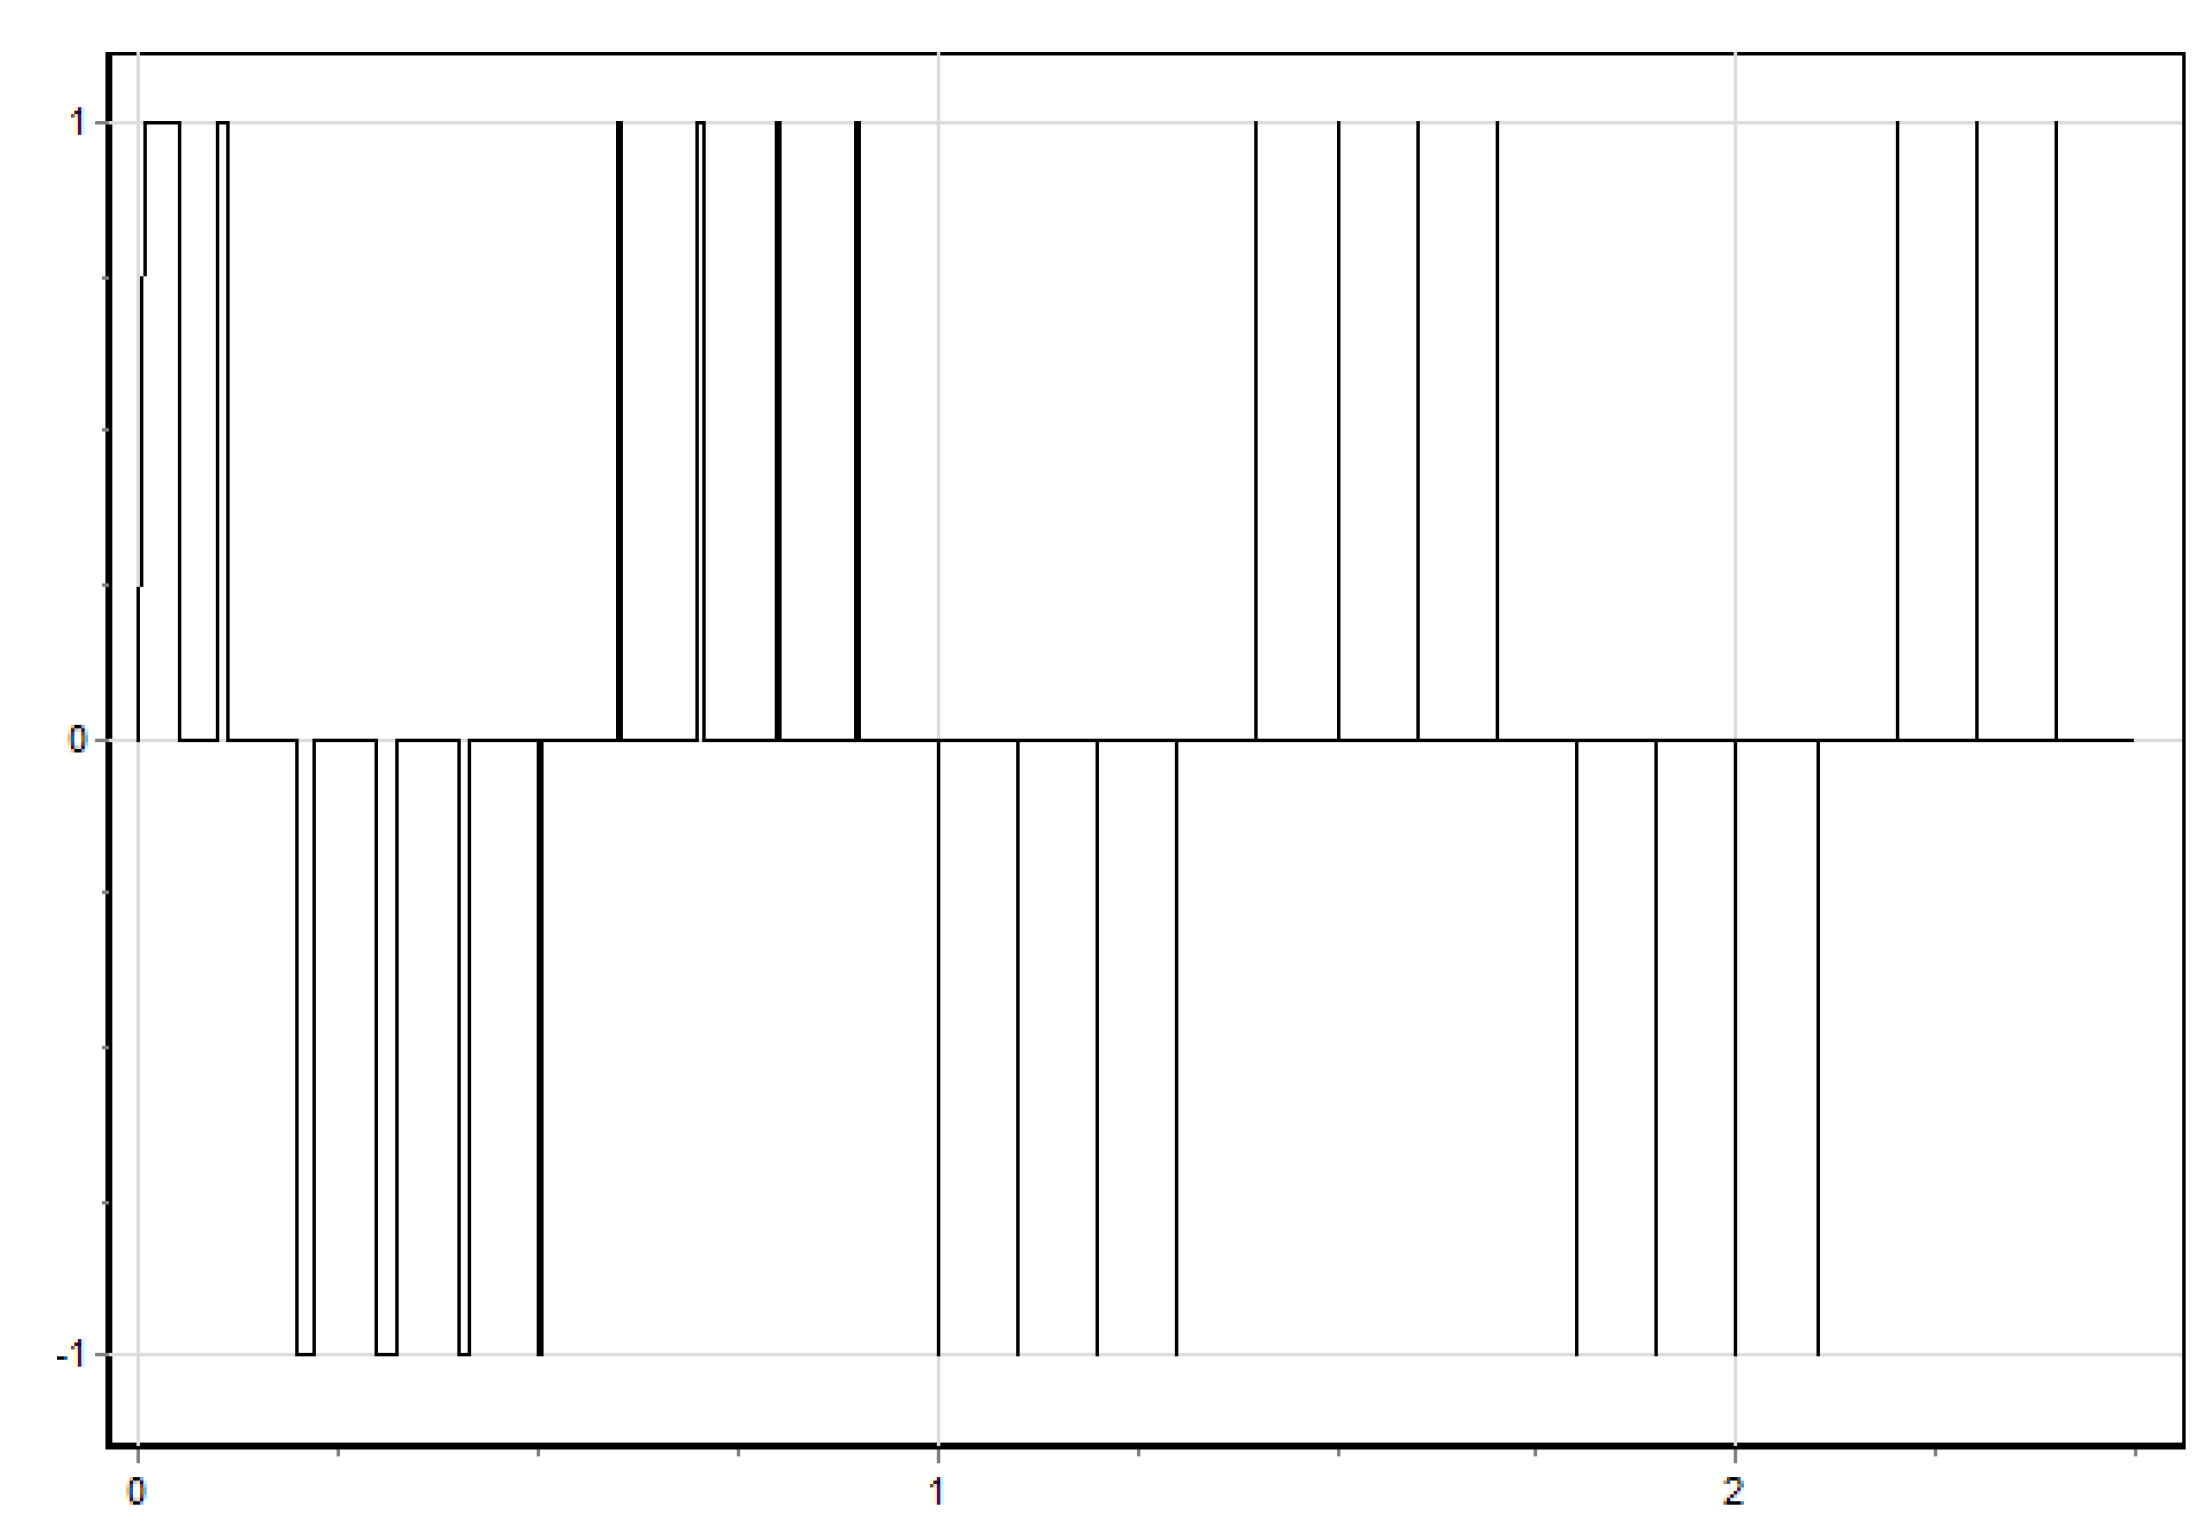
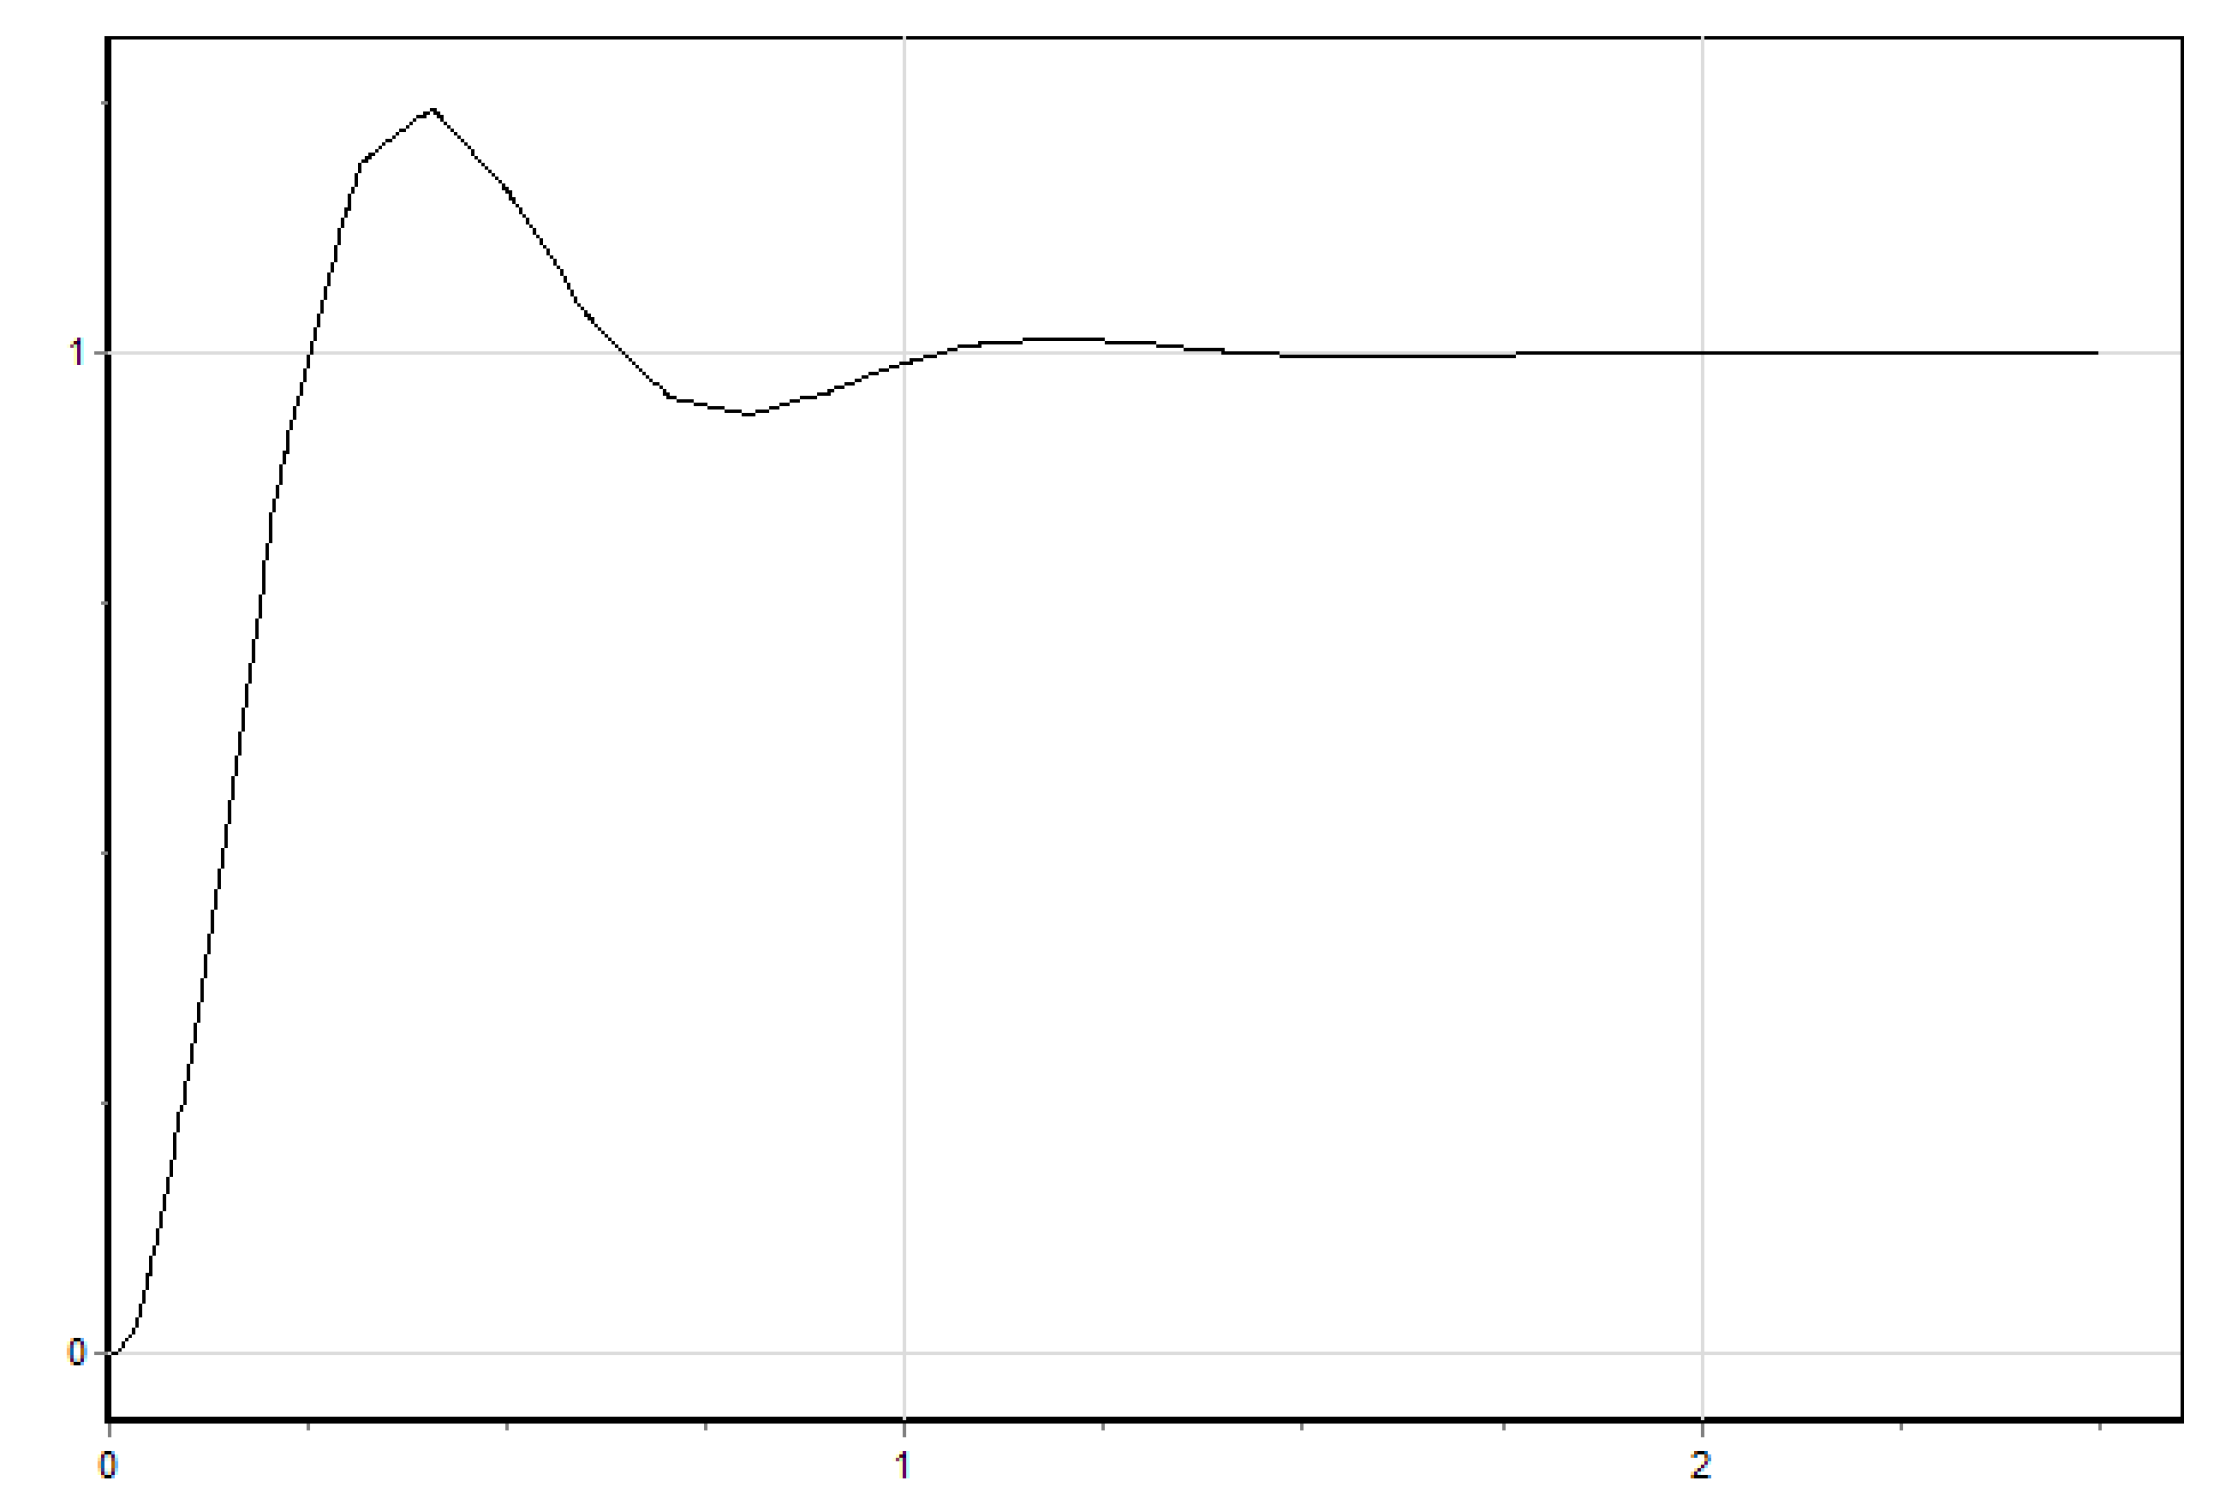
The simulation modeling results are presented in
Figure 9 and
Figure 10. The results obtained were qualitatively compared with the graphs for the model in SimInTech. The comparison did not show any differences in the graphs of the rotation angle φ(t) for the models in ISMA and SimInTech with refinement of intersection events.
The performance characteristics and accuracy of the resulting solution for various calculation options in SimInTech and ISMA are shown in
Table 1.
5. A Complex Electric Drive Model
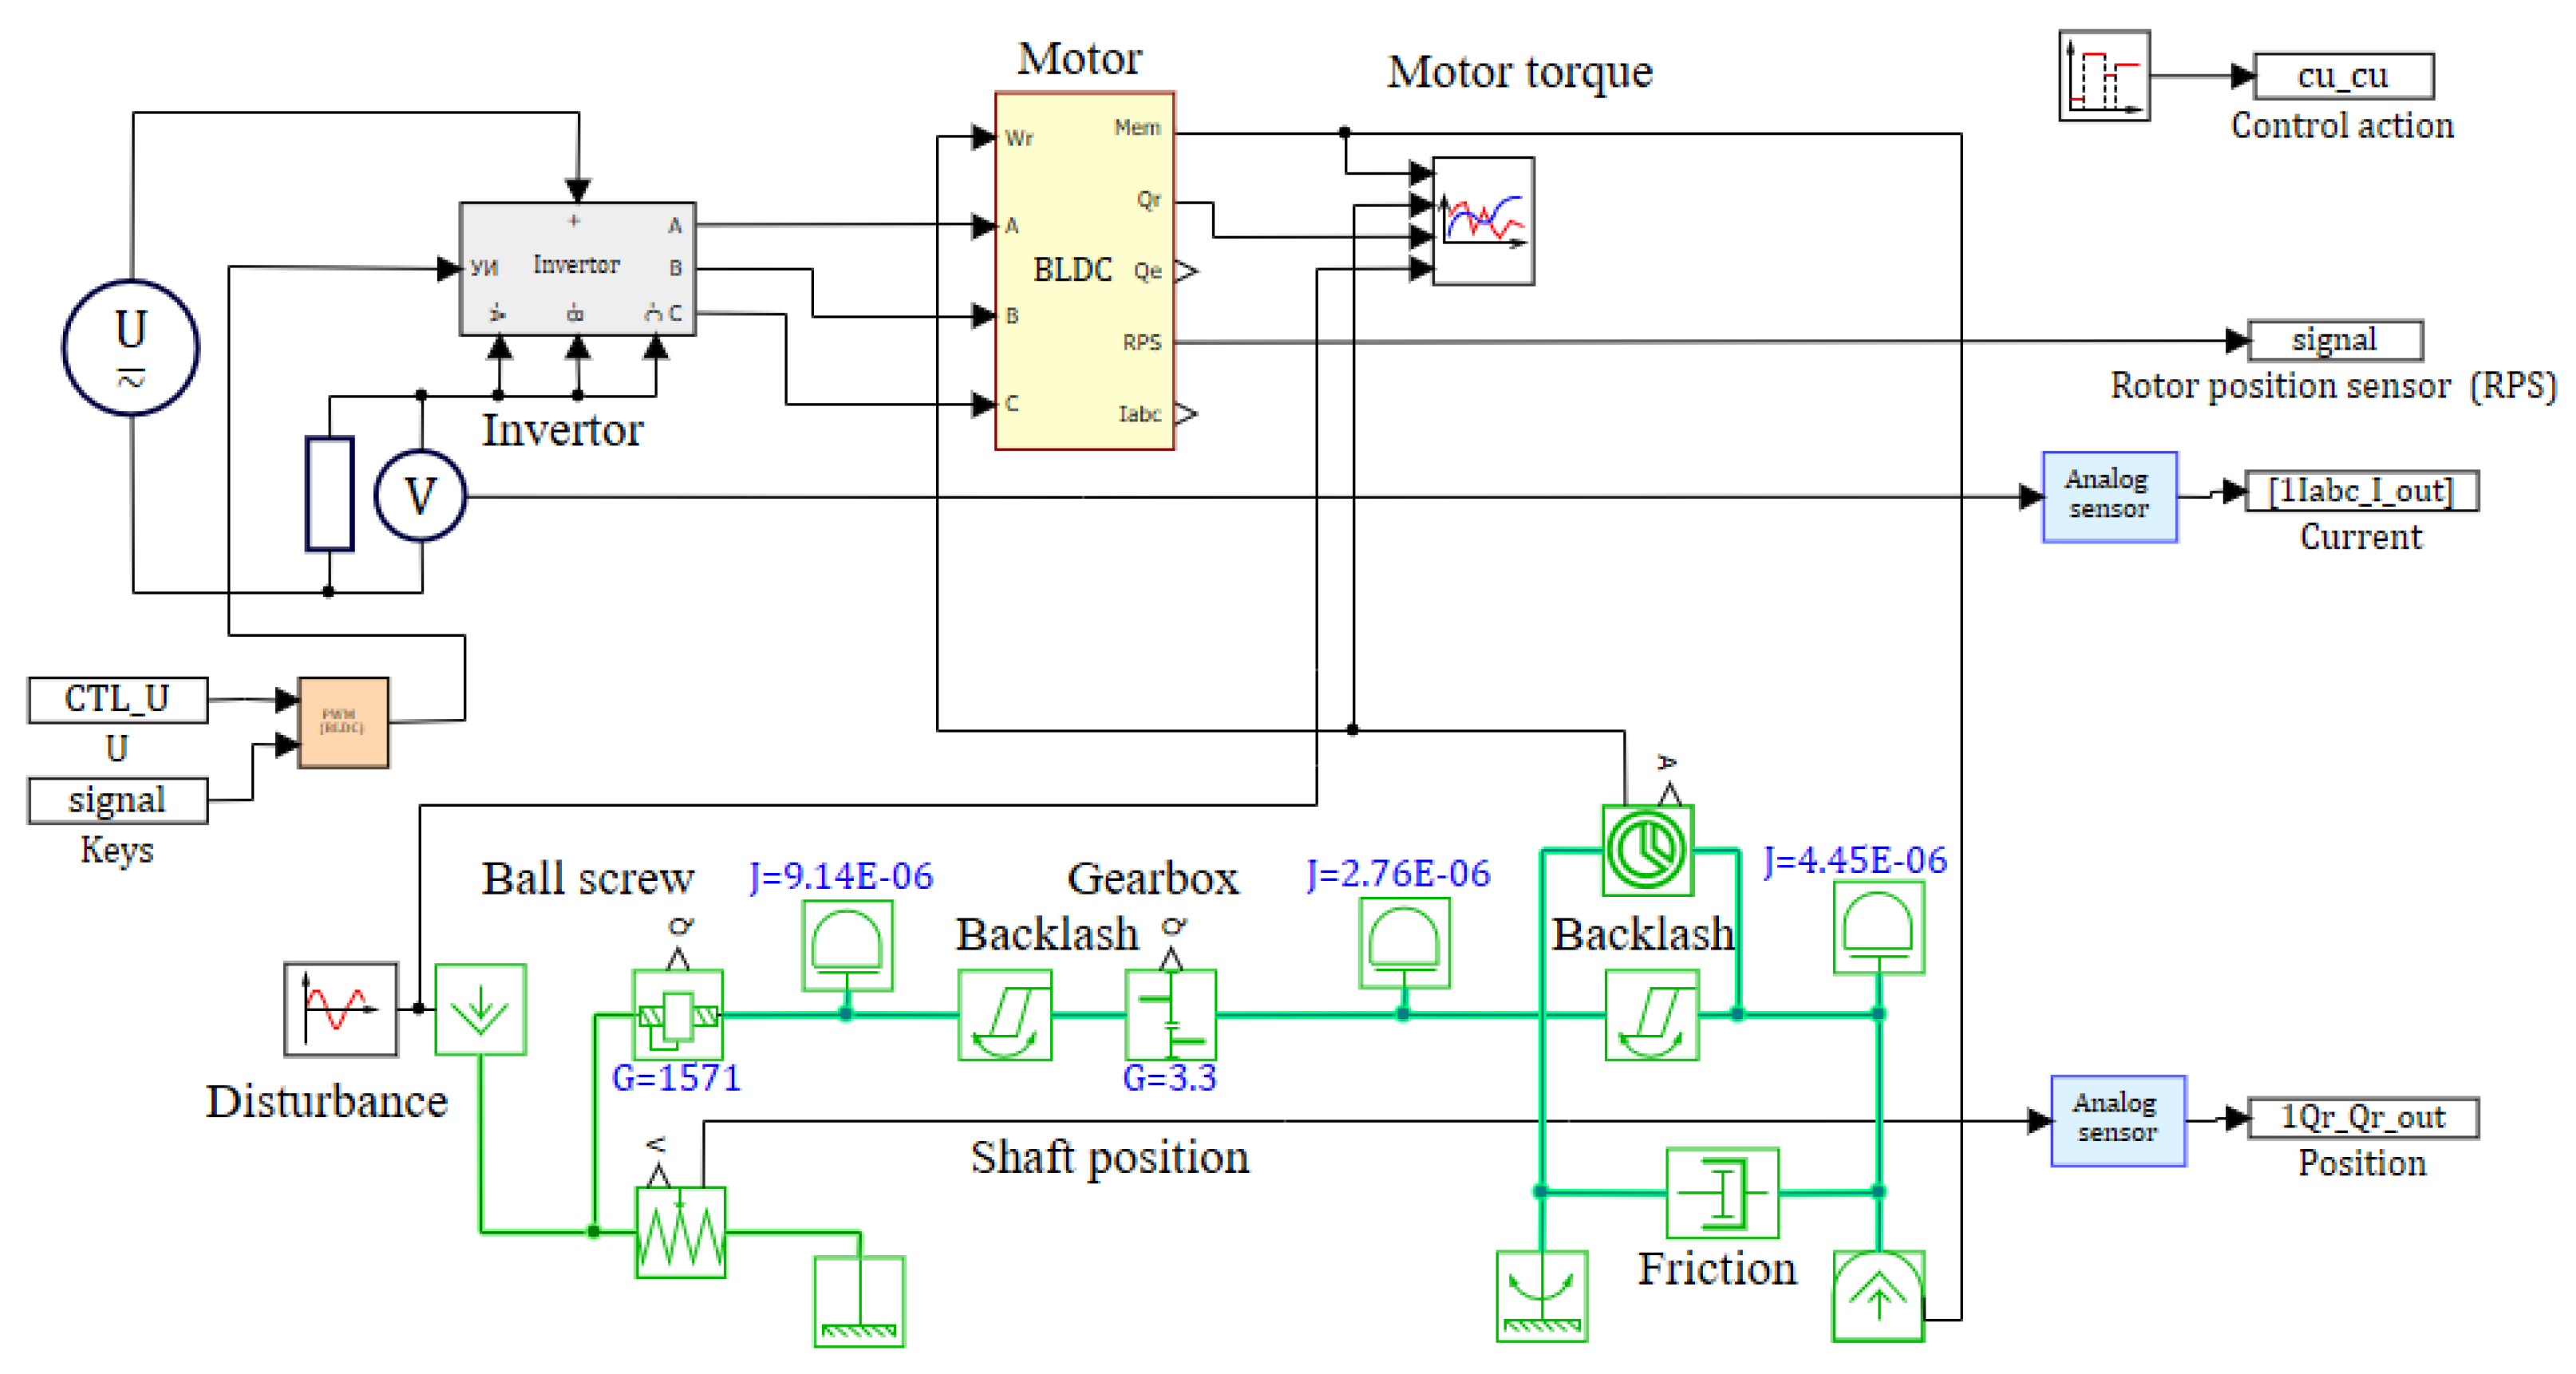
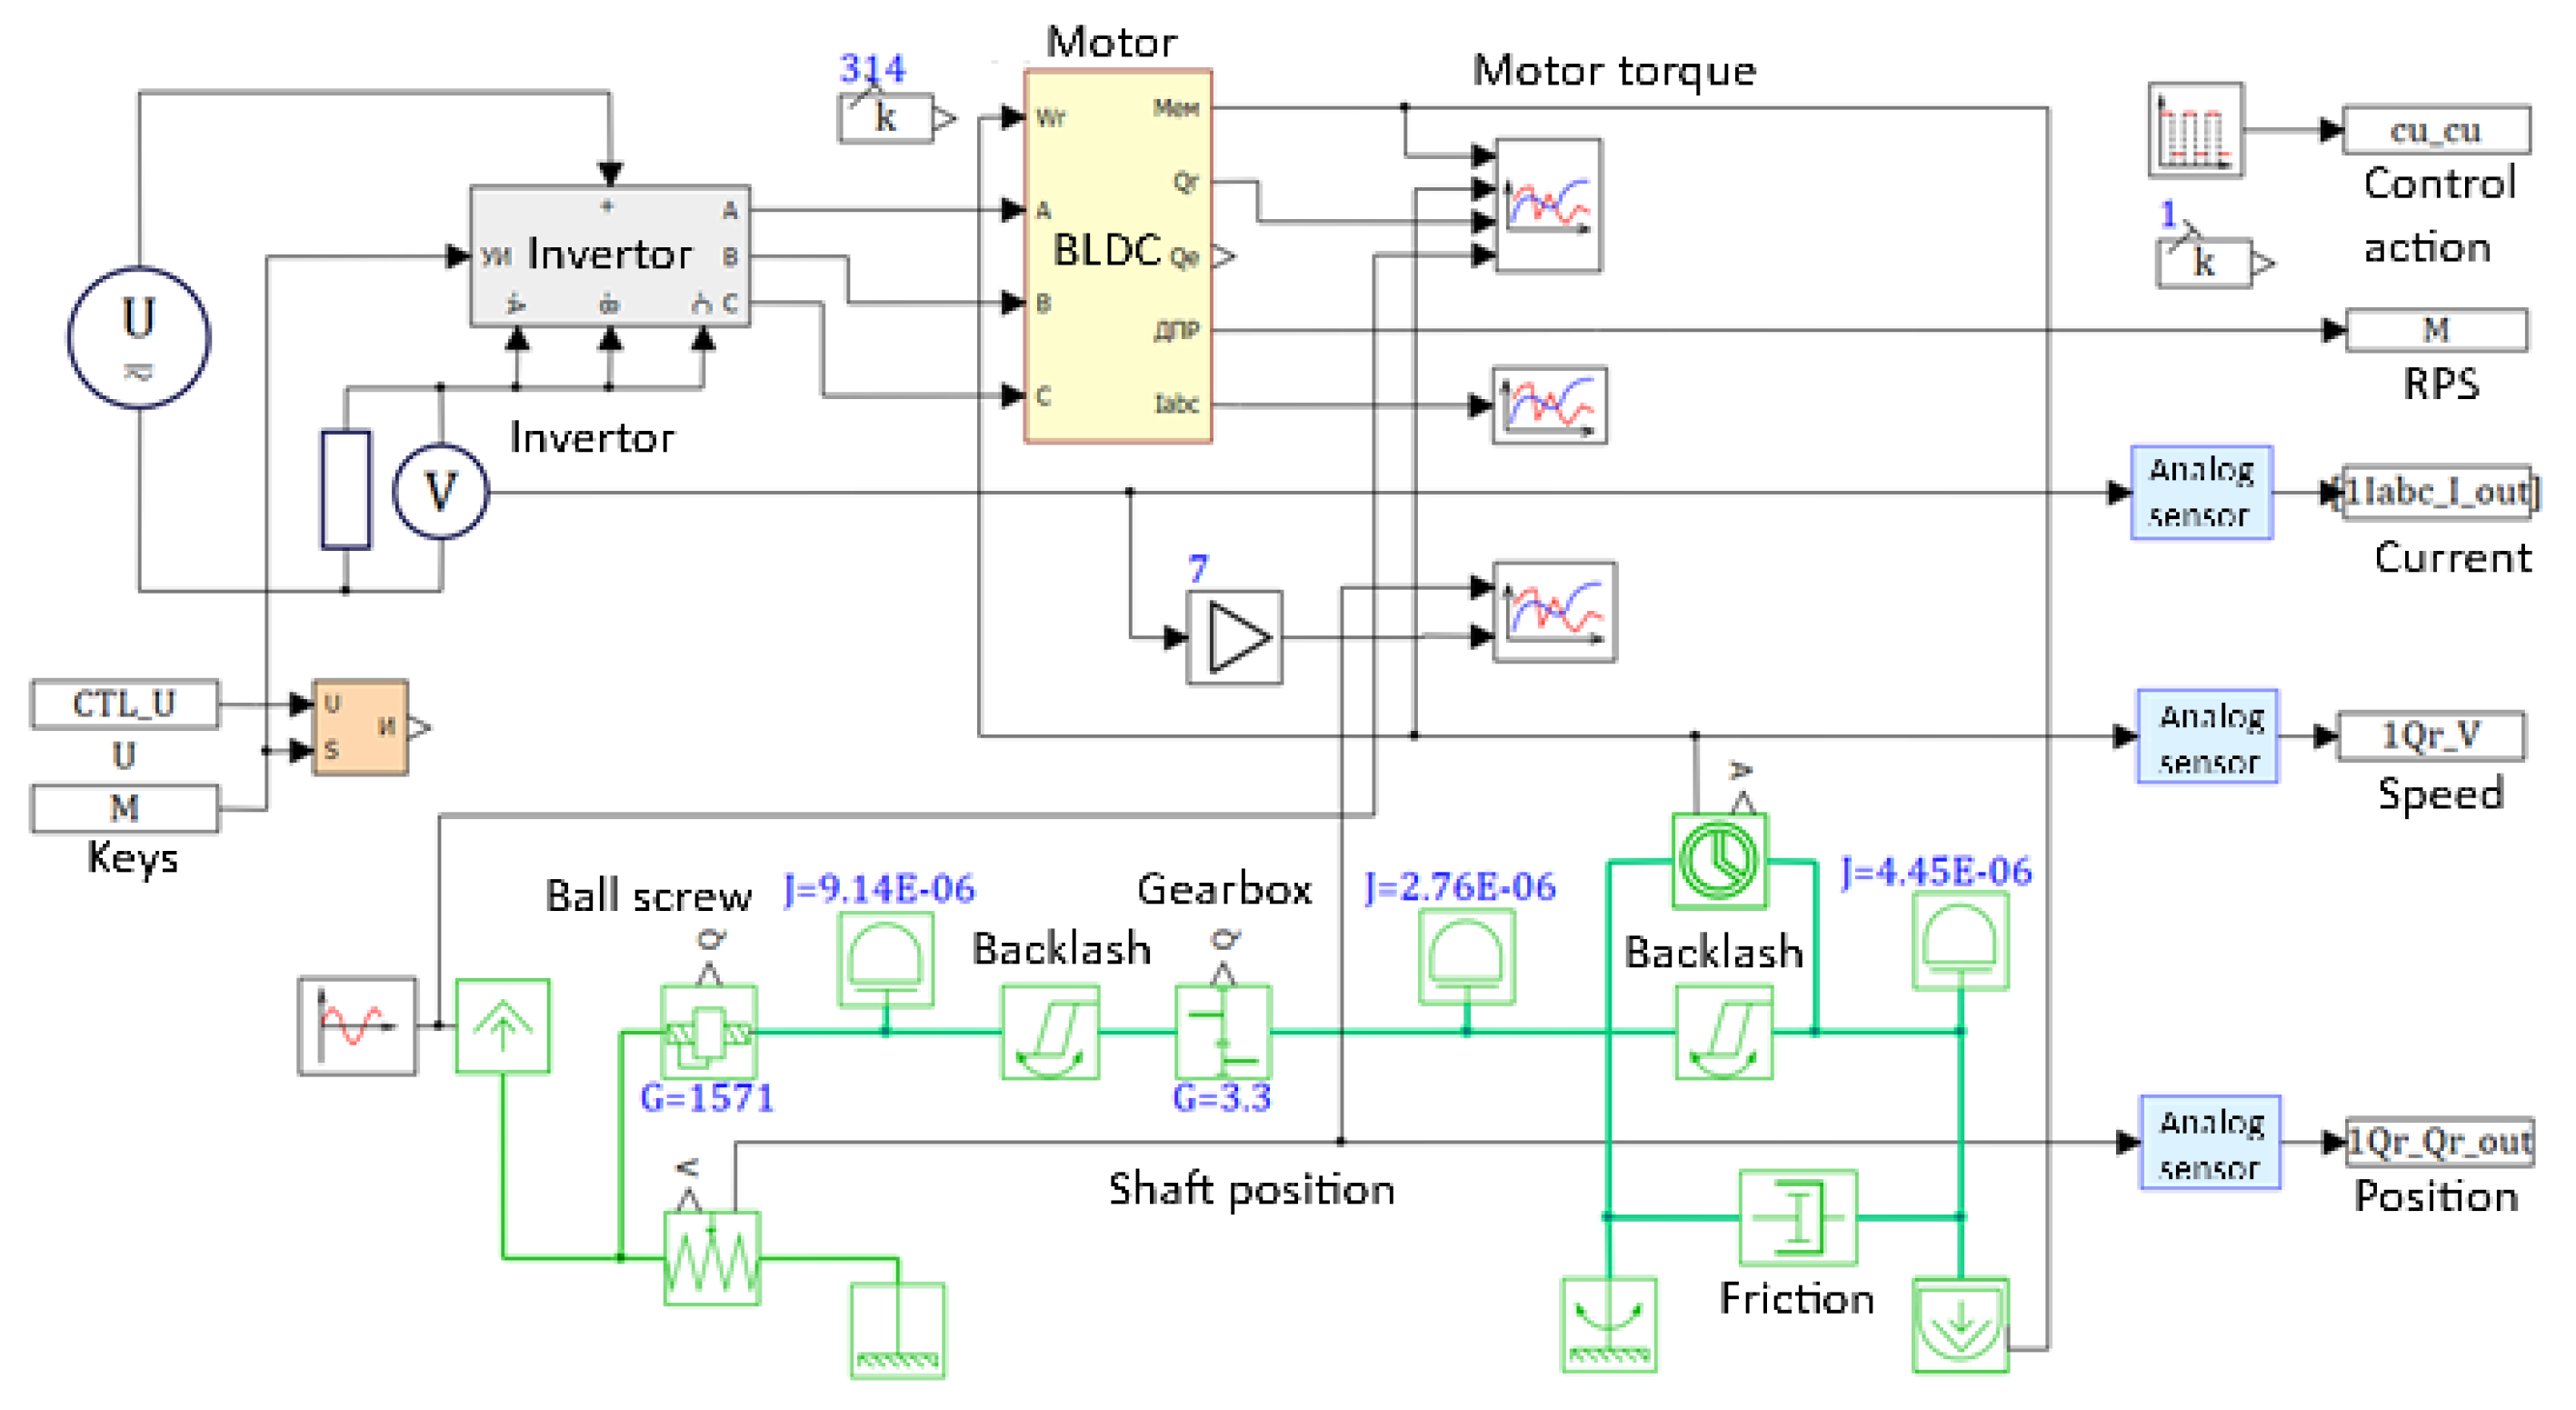
A block diagram of a computer model of a drive with a brushless DC motor [
29] is shown in
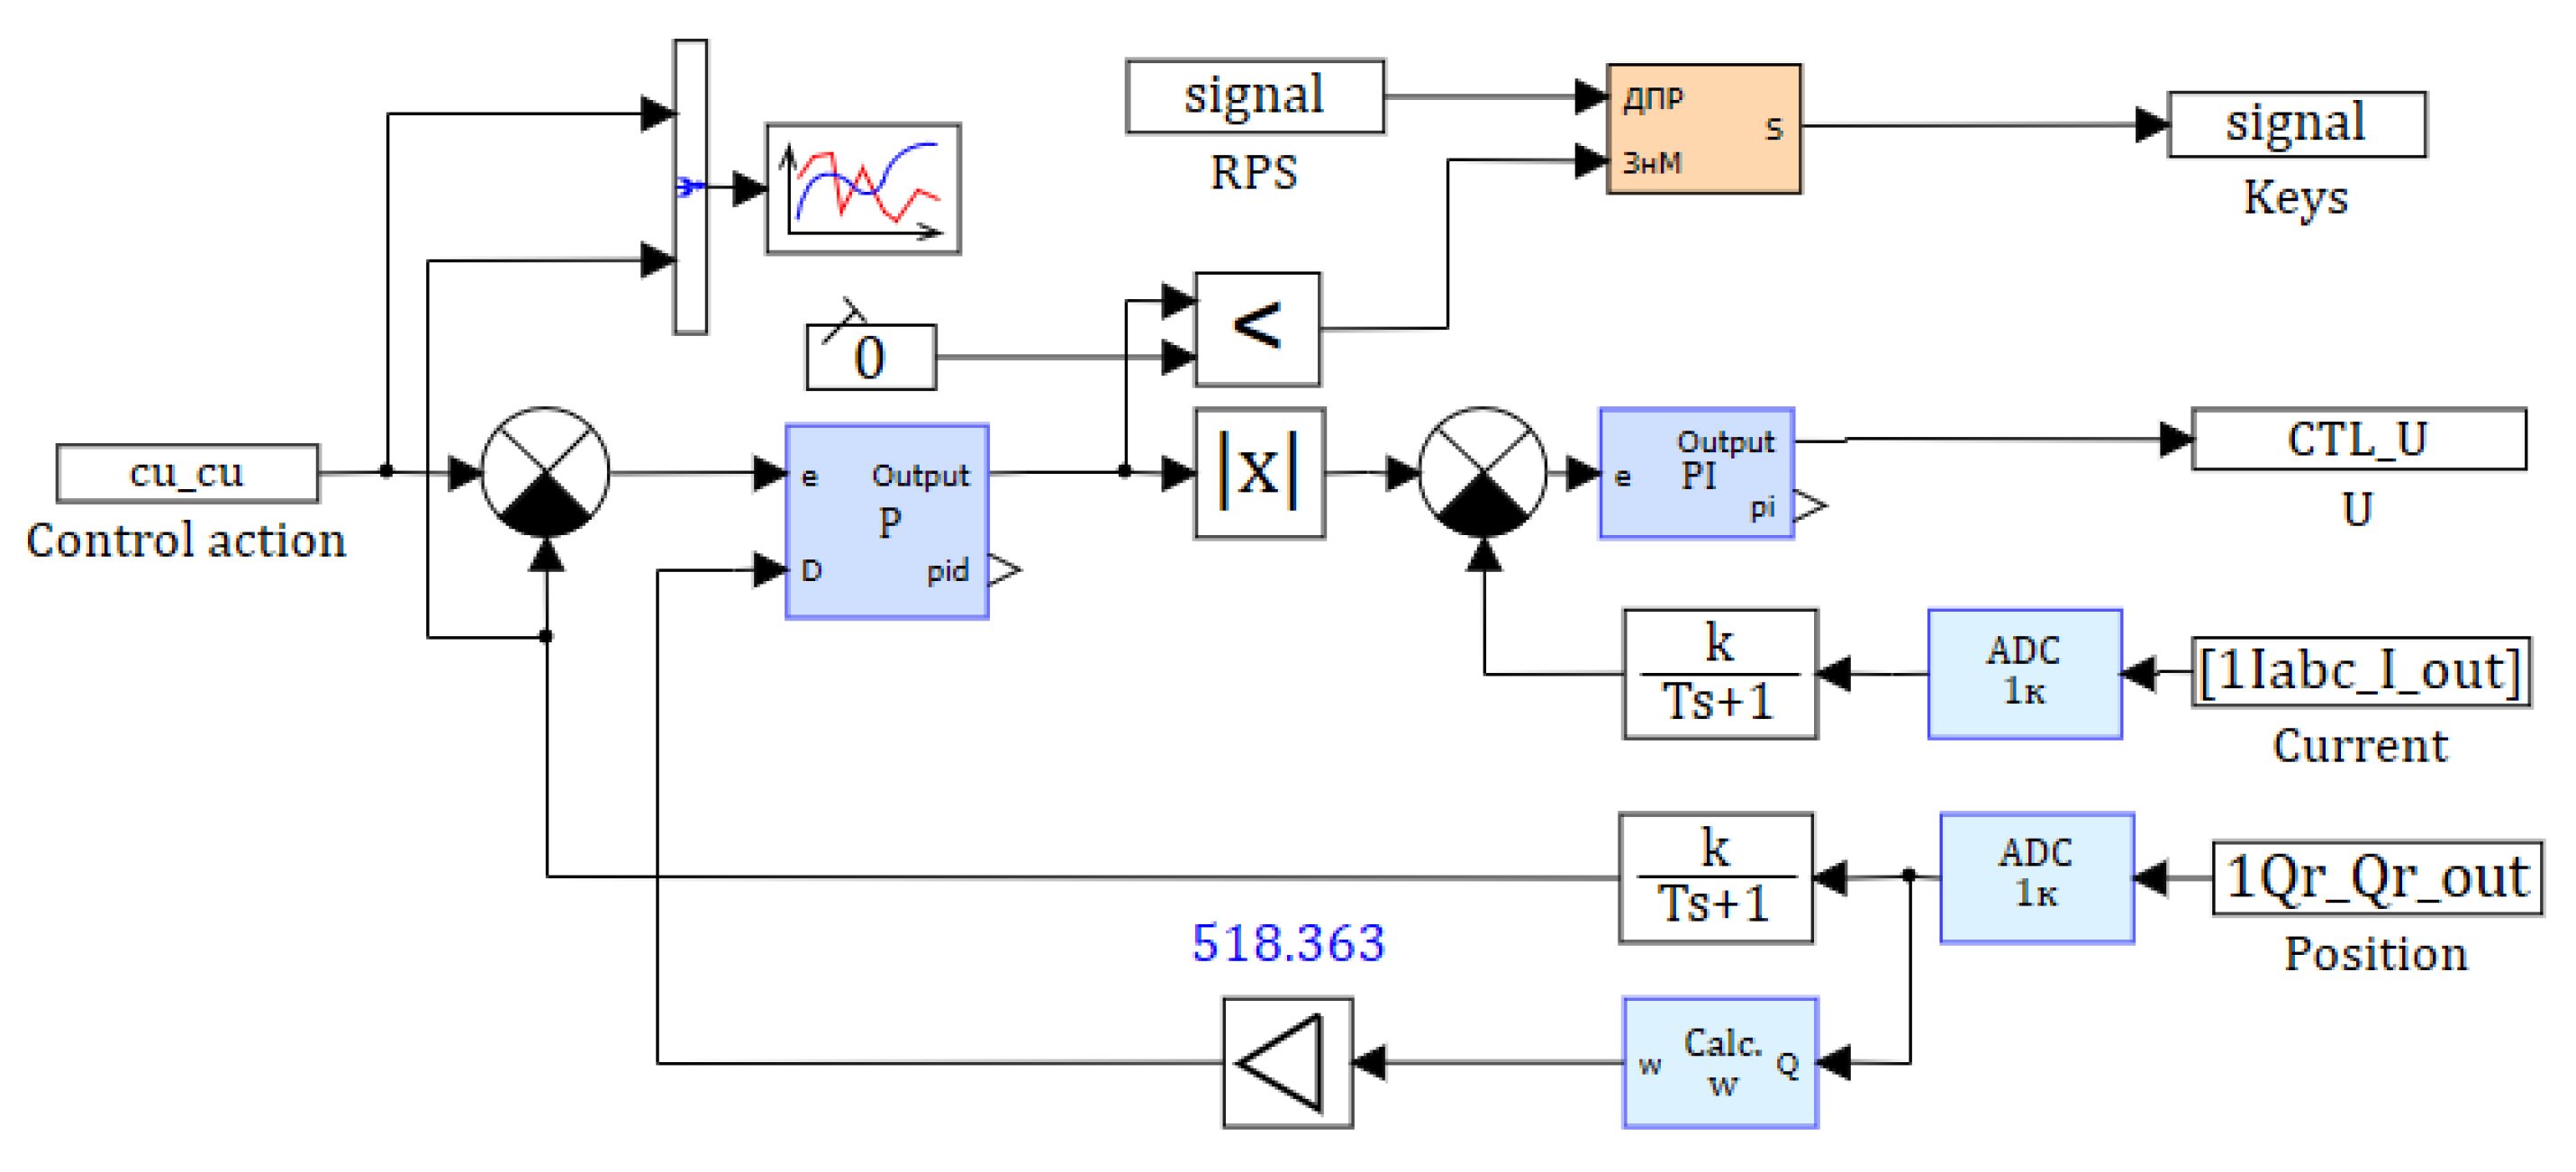
Figure 11. A block diagram of control is shown in
Figure 12. The PWM model is included in the drive model and generates control signals for the inverter model that controls the motor. The PWM modulating signal is generated in another model, calculated in parallel to the motor model with a constant integration step equal to the PWM period.
When simulating PWM and a motor with an inverter in one project, it is essential to focus on the correct operation of the motor and inverter model. PWM usually controls the transistor port of a converter, with a small (from fractions of a microsecond to several microseconds) guard interval between on-states. Its duration must also be taken into account when choosing a step. In the SimInTech software, delays are implemented by an on-delay block, which implements step control. In this case, as a rule, when modeling, the Euler method is chosen with a step less than or equal to the guard interval. For models of conventional motors, a step of is usually sufficient.
The model was calculated using the Euler integration method with a constant integration step equal to
s (while in the model, the electrical part is calculated by the implicit Shikhman method [
30]), as well as the ARK21 method with a variable step with the settings of
. The model used a PWM algorithm with detection of intersections with an acceptable time accuracy set equal to the minimum integration step.
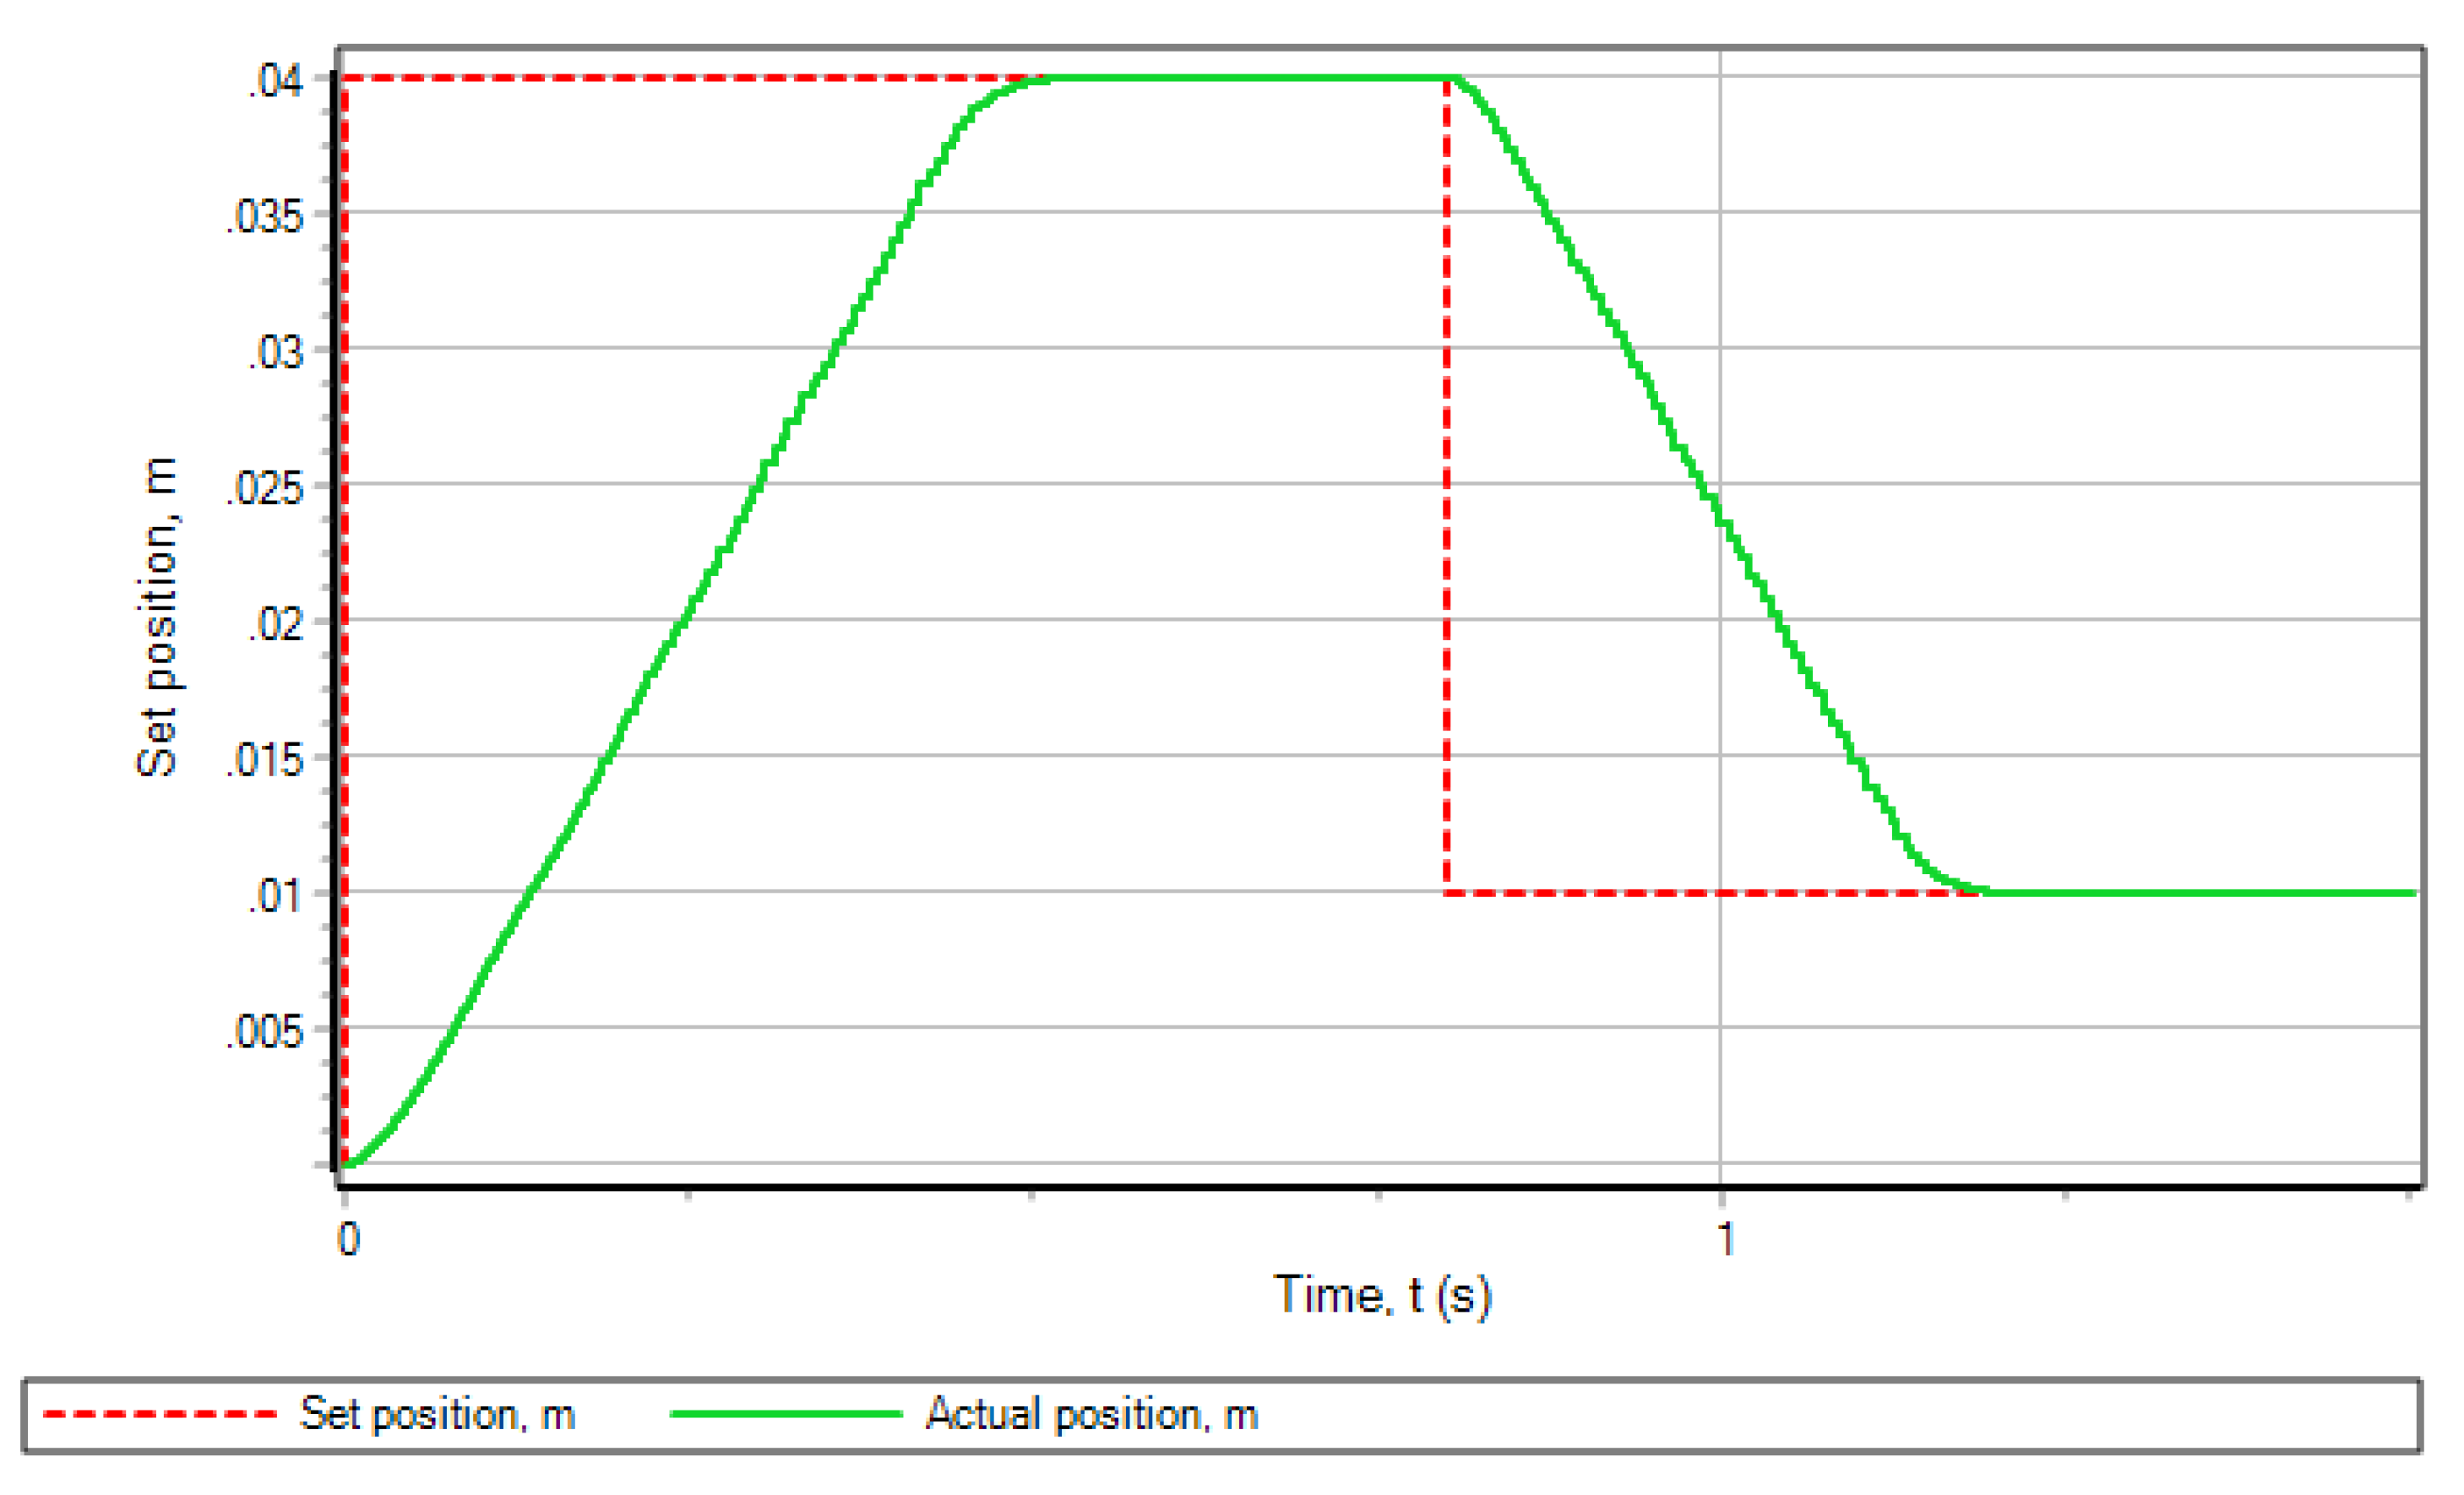
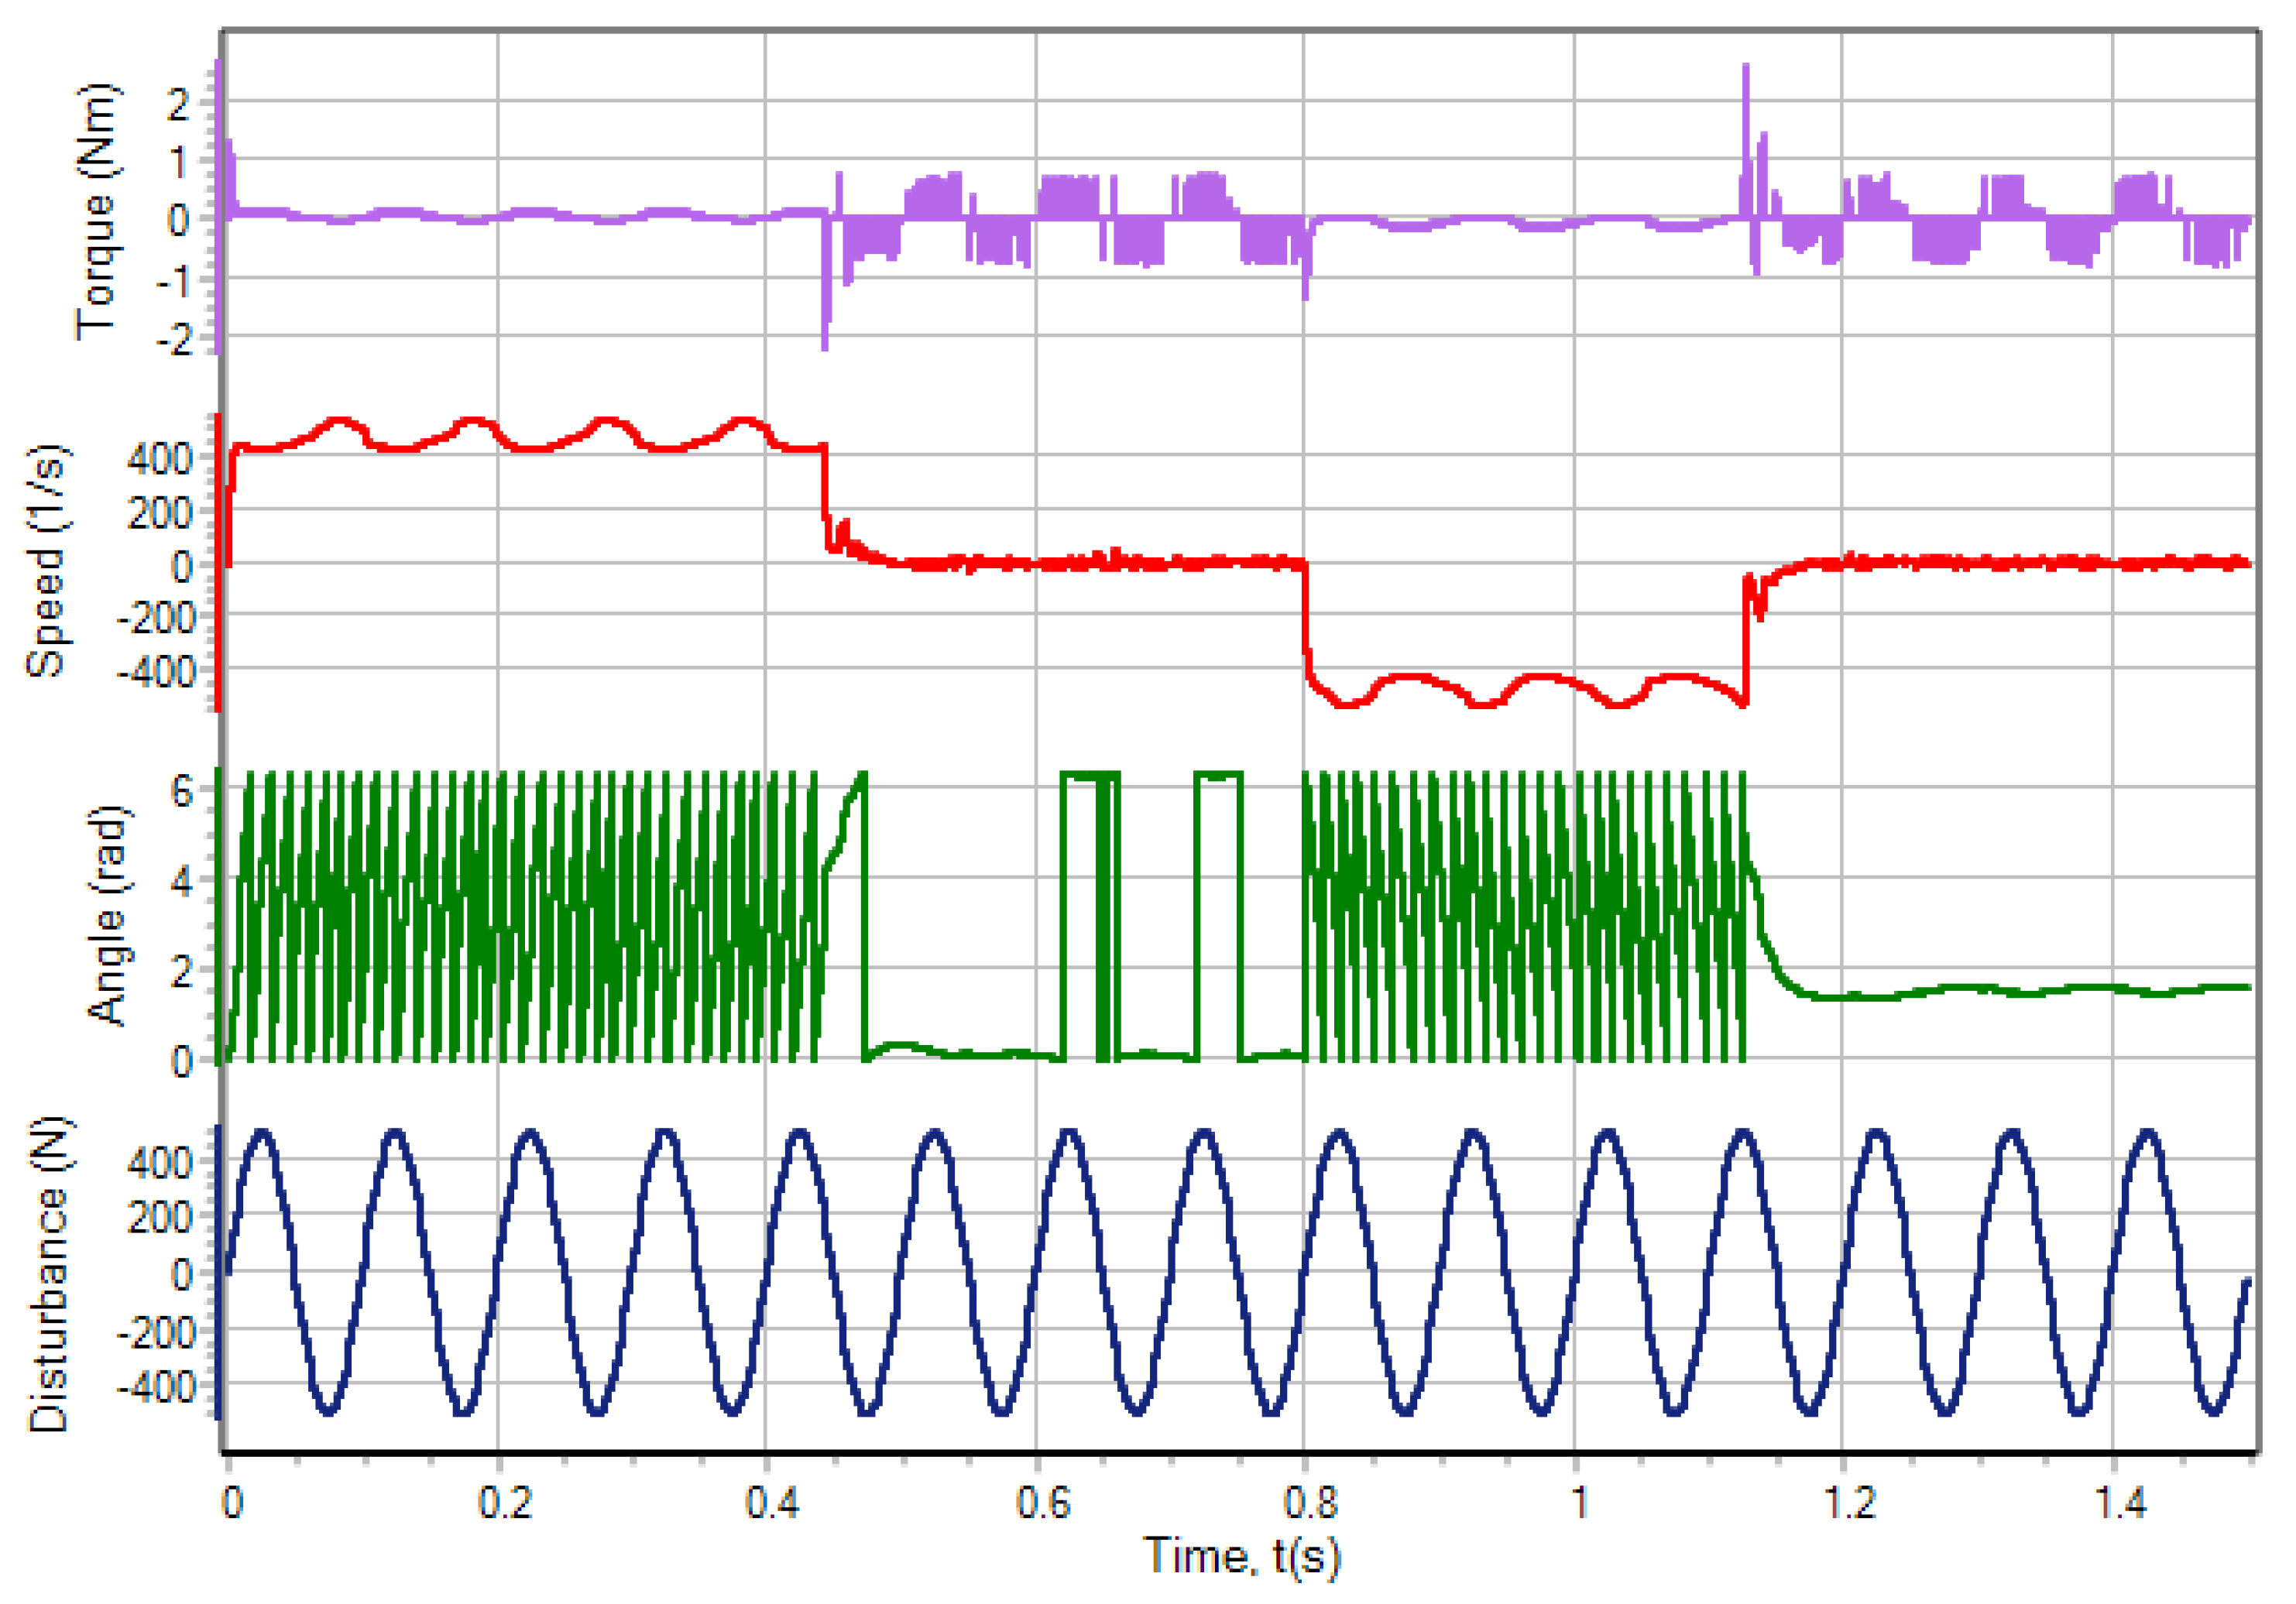
The modeling results are shown in
Figure 13 and
Figure 14. The numerical simulation of the system using various integration methods resulted in identical graphs.
Table 2 shows the numerical characteristics for the integration methods with and without the intersection detection,
is the number of calculations of the right side of the ordinary differential equation,
is the physical calculation time in seconds.
6. Experimental Verification of the Electric Drive Model
The electric drive model used in the calculations was verified to ensure compliance.
The model consists of three main parts:
The parameters of the electric motor model are shown in
Table 3.
The model verification was conducted in two stages. The first stage involved verification of the motor model. In this case, the motor was disconnected from the mechanical transmission of the electric drive. The following experiments were carried out:
An unloaded motor controlled by rotor position sensor (RPS), with a nominal power supply (54.5V), accelerated to real idle speed.
The motor phase speed and current were measured.
Similar conditions were simulated in SimInTech and the modeling results were compared with the experiment.
The RPS controlled motor was loaded to its nominal value using a load machine, with a nominal power supply (54.5V).
The motor phase speed and current were measured.
Similar conditions were modeled in SimInTech and the modeling results were compared with the experiment.
- 3.
At the second stage, the mechanical transmission model was verified. The motor was connected to the mechanical transmission of the electric drive, and the dynamic impact response experiment was performed:
The inverter was powered with a voltage of 54.5V.
A torque command was issued to a RPS -controlled motor in the form of a bipolar square wave of maximum amplitude of various frequencies.
The position of the output rod of the electric drive and the inverter shunt current were measured.
Similar conditions were simulated in SimInTech and the modeling results were compared with the experiment.
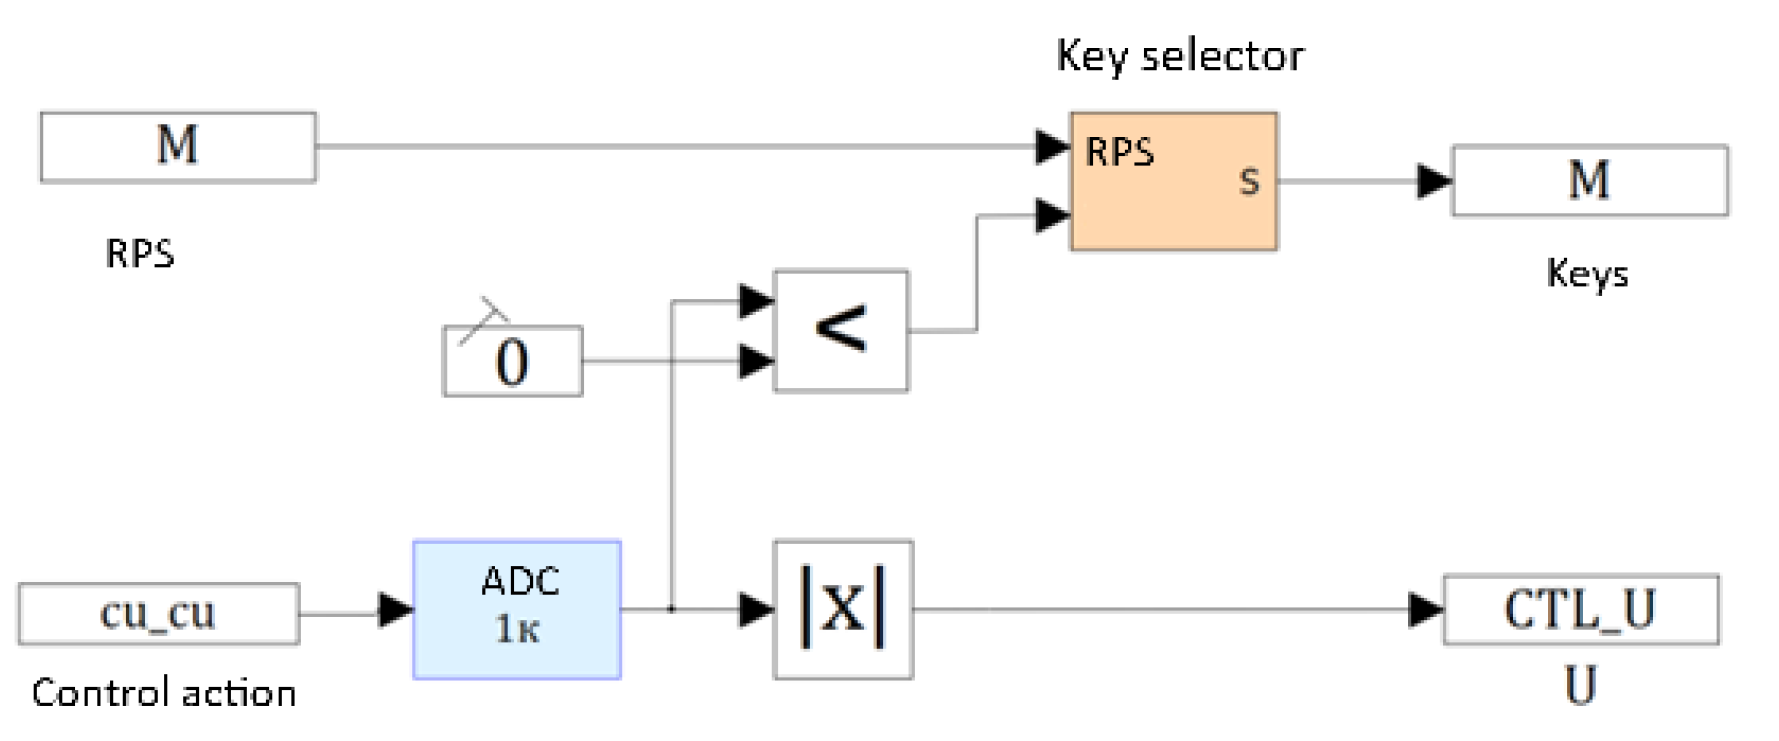
The model of the control system is shown in
Figure 15.
This structure consists of standard SimInTech modules and implements valve control of a motor using RPS. The electric drive model used for verification is shown in
Figure 16.
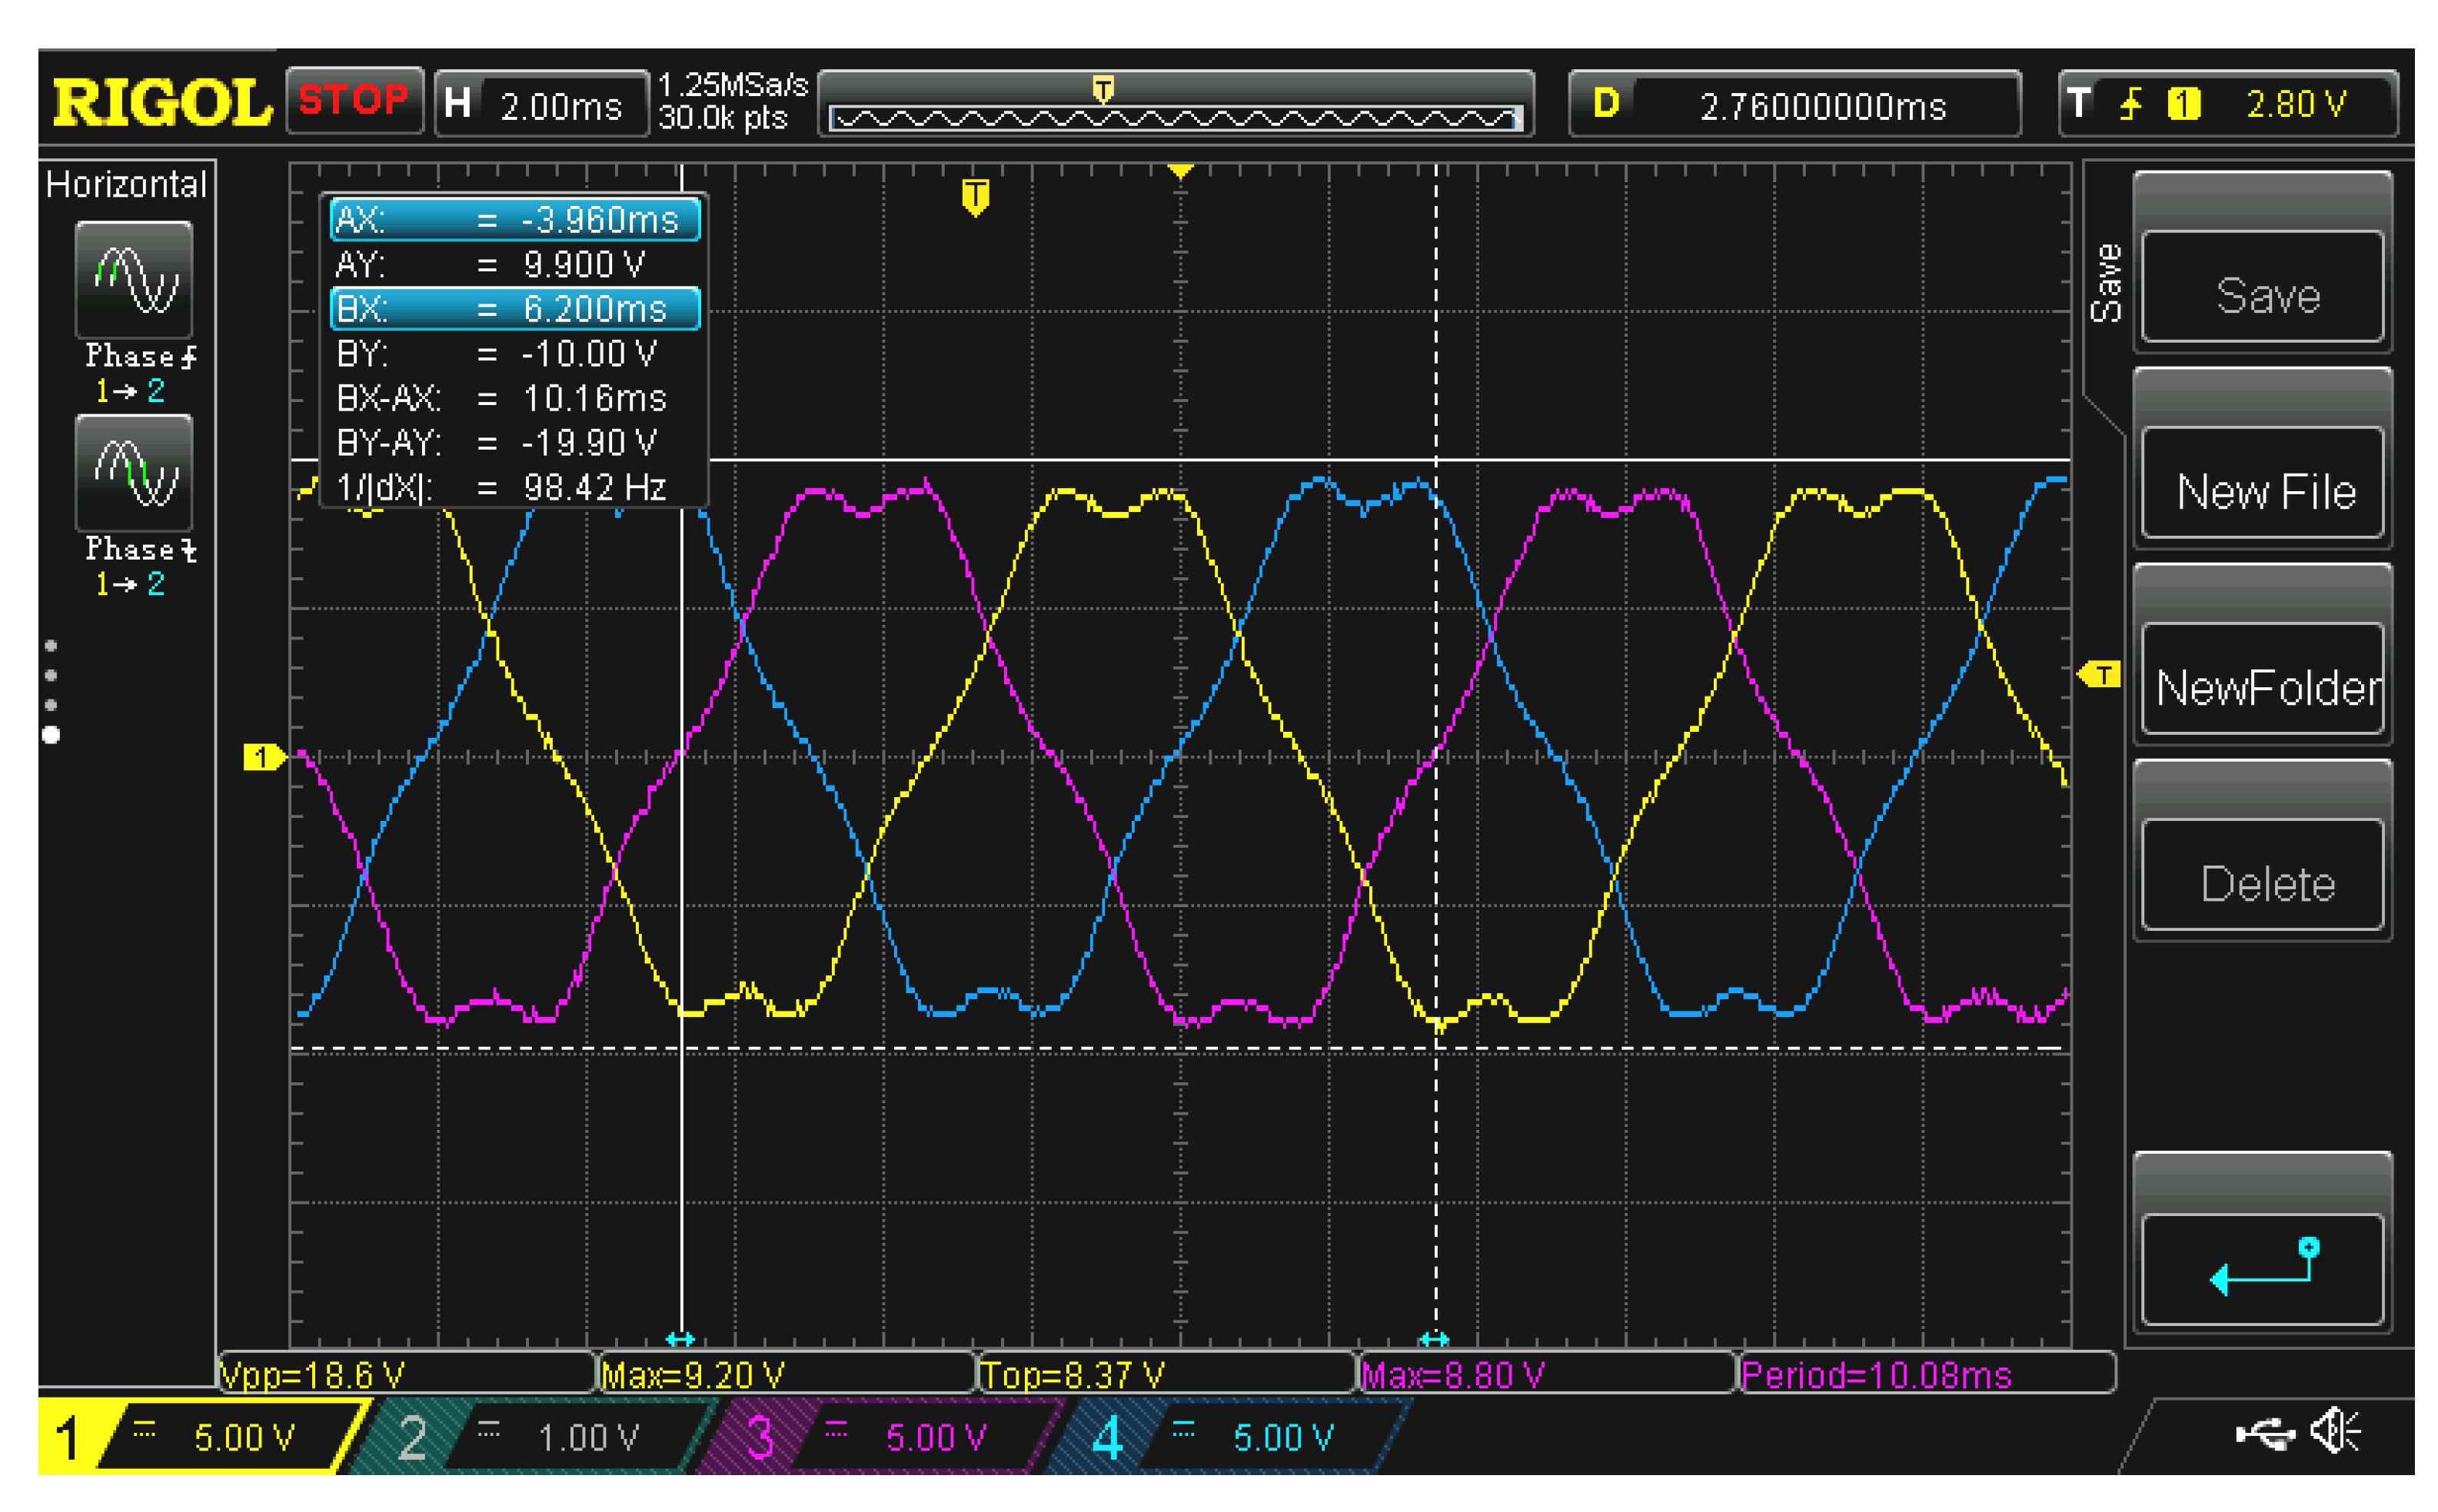
The EMF of the simulated motor differs significantly from the trapezoidal one. The actual EMF, experimentally measured at a speed of 3 000 rpm, is shown in
Figure 19.
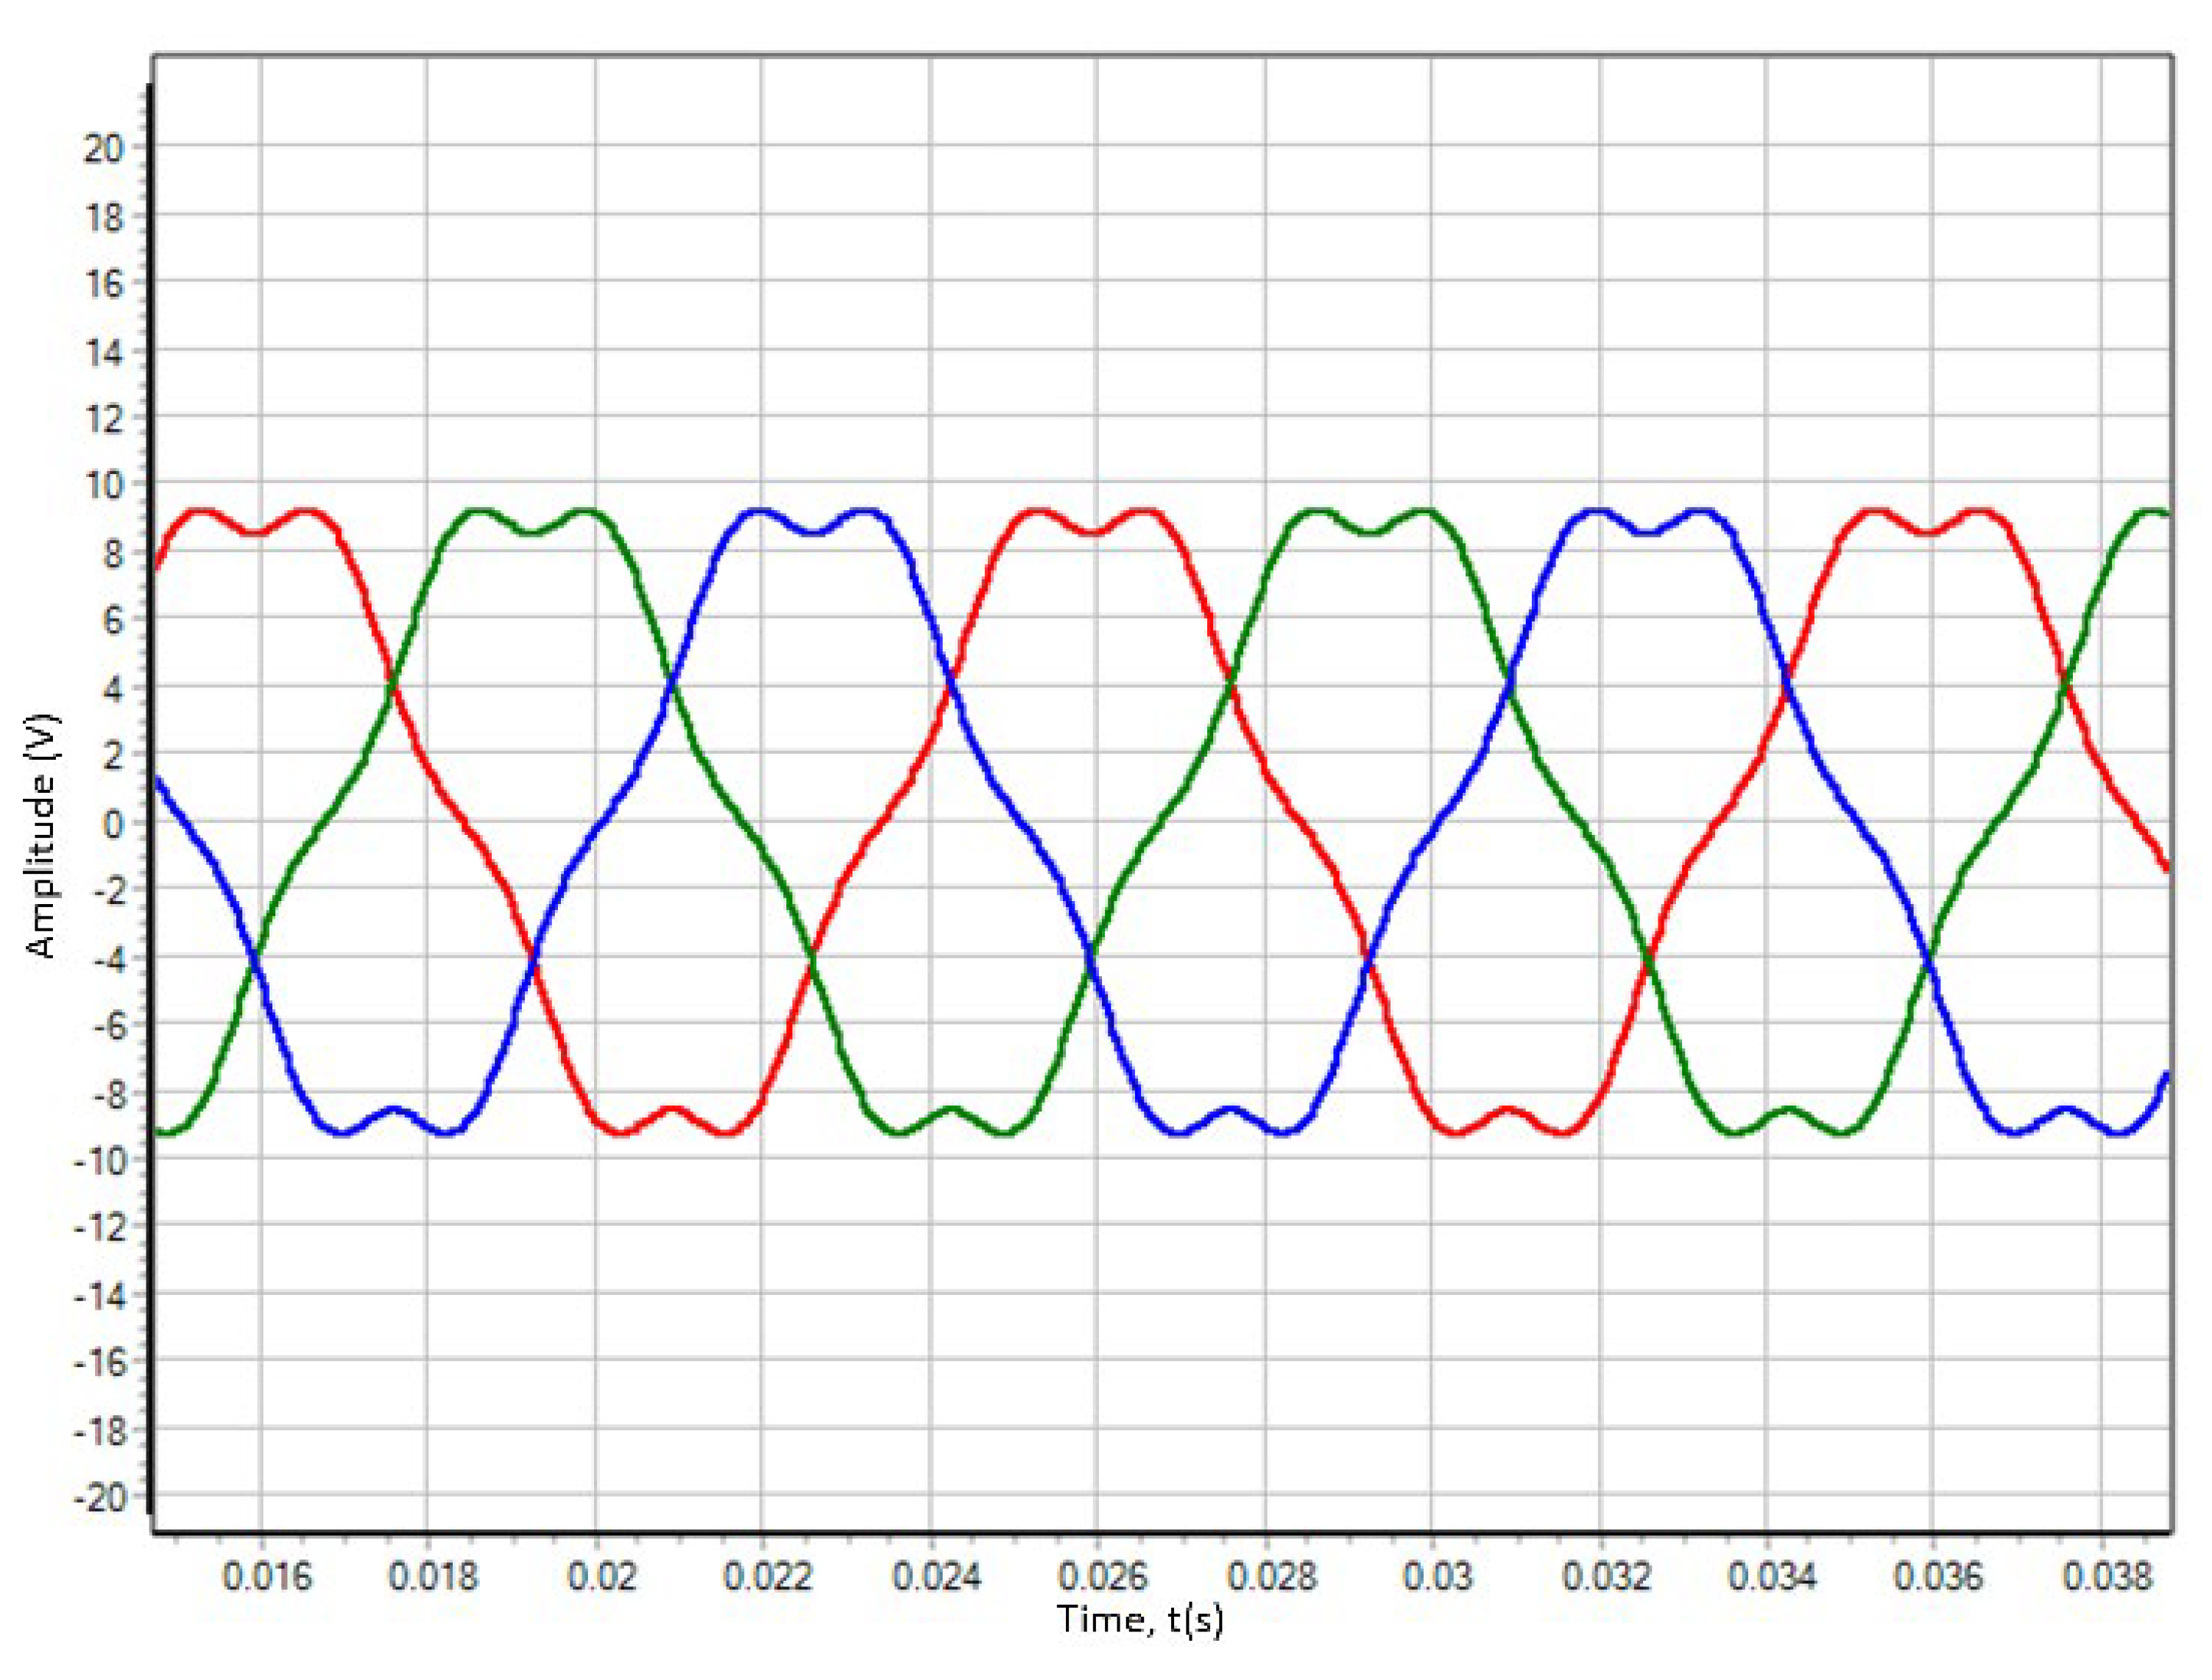
Figure 20 shows a graph of the model EMF that matches the experimental one in amplitude and shape.
Steel losses were taken into account following the agreement with the motor designer through an active resistance connected in parallel to the winding. This resistance varied in inverse proportion to the frequency of the motor field to the power of 1.5.
The parameters of the mechanical transmission model are given in
Table 4.
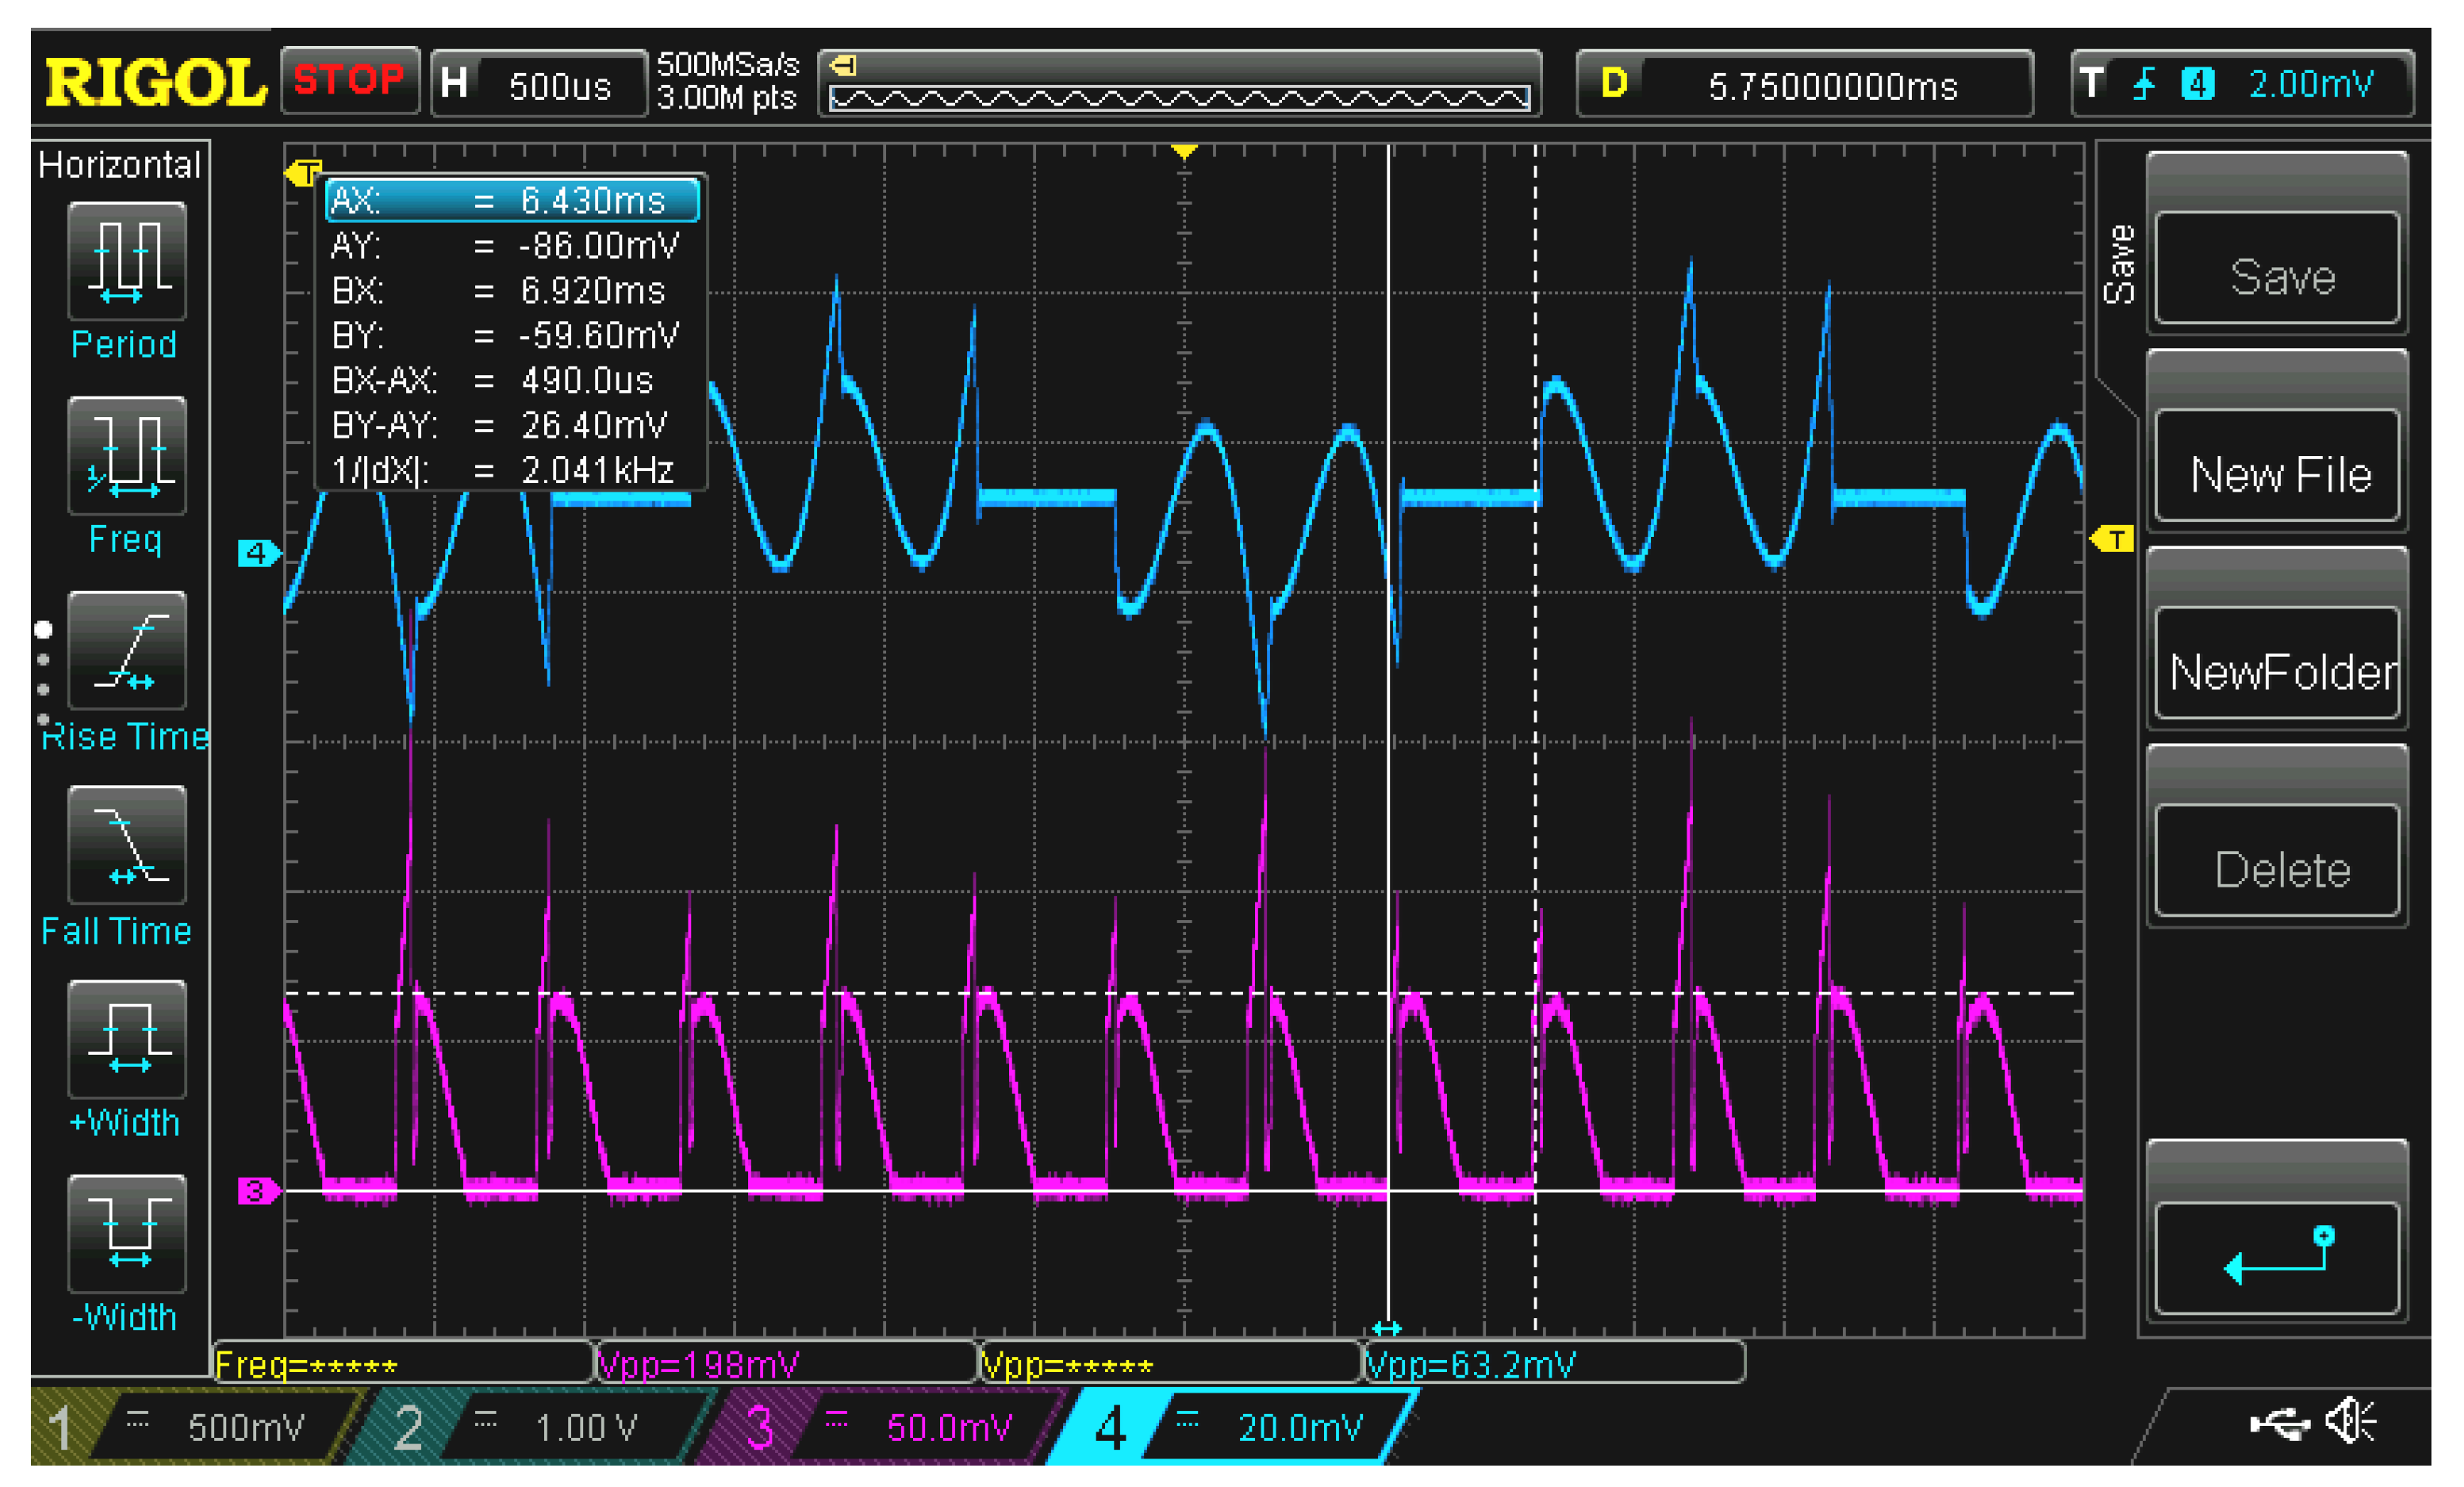
Figure 21 depicts the graph of the experimentally measured phase current in idle mode at a motor speed of 10 500 rpm (1 099 1/s).
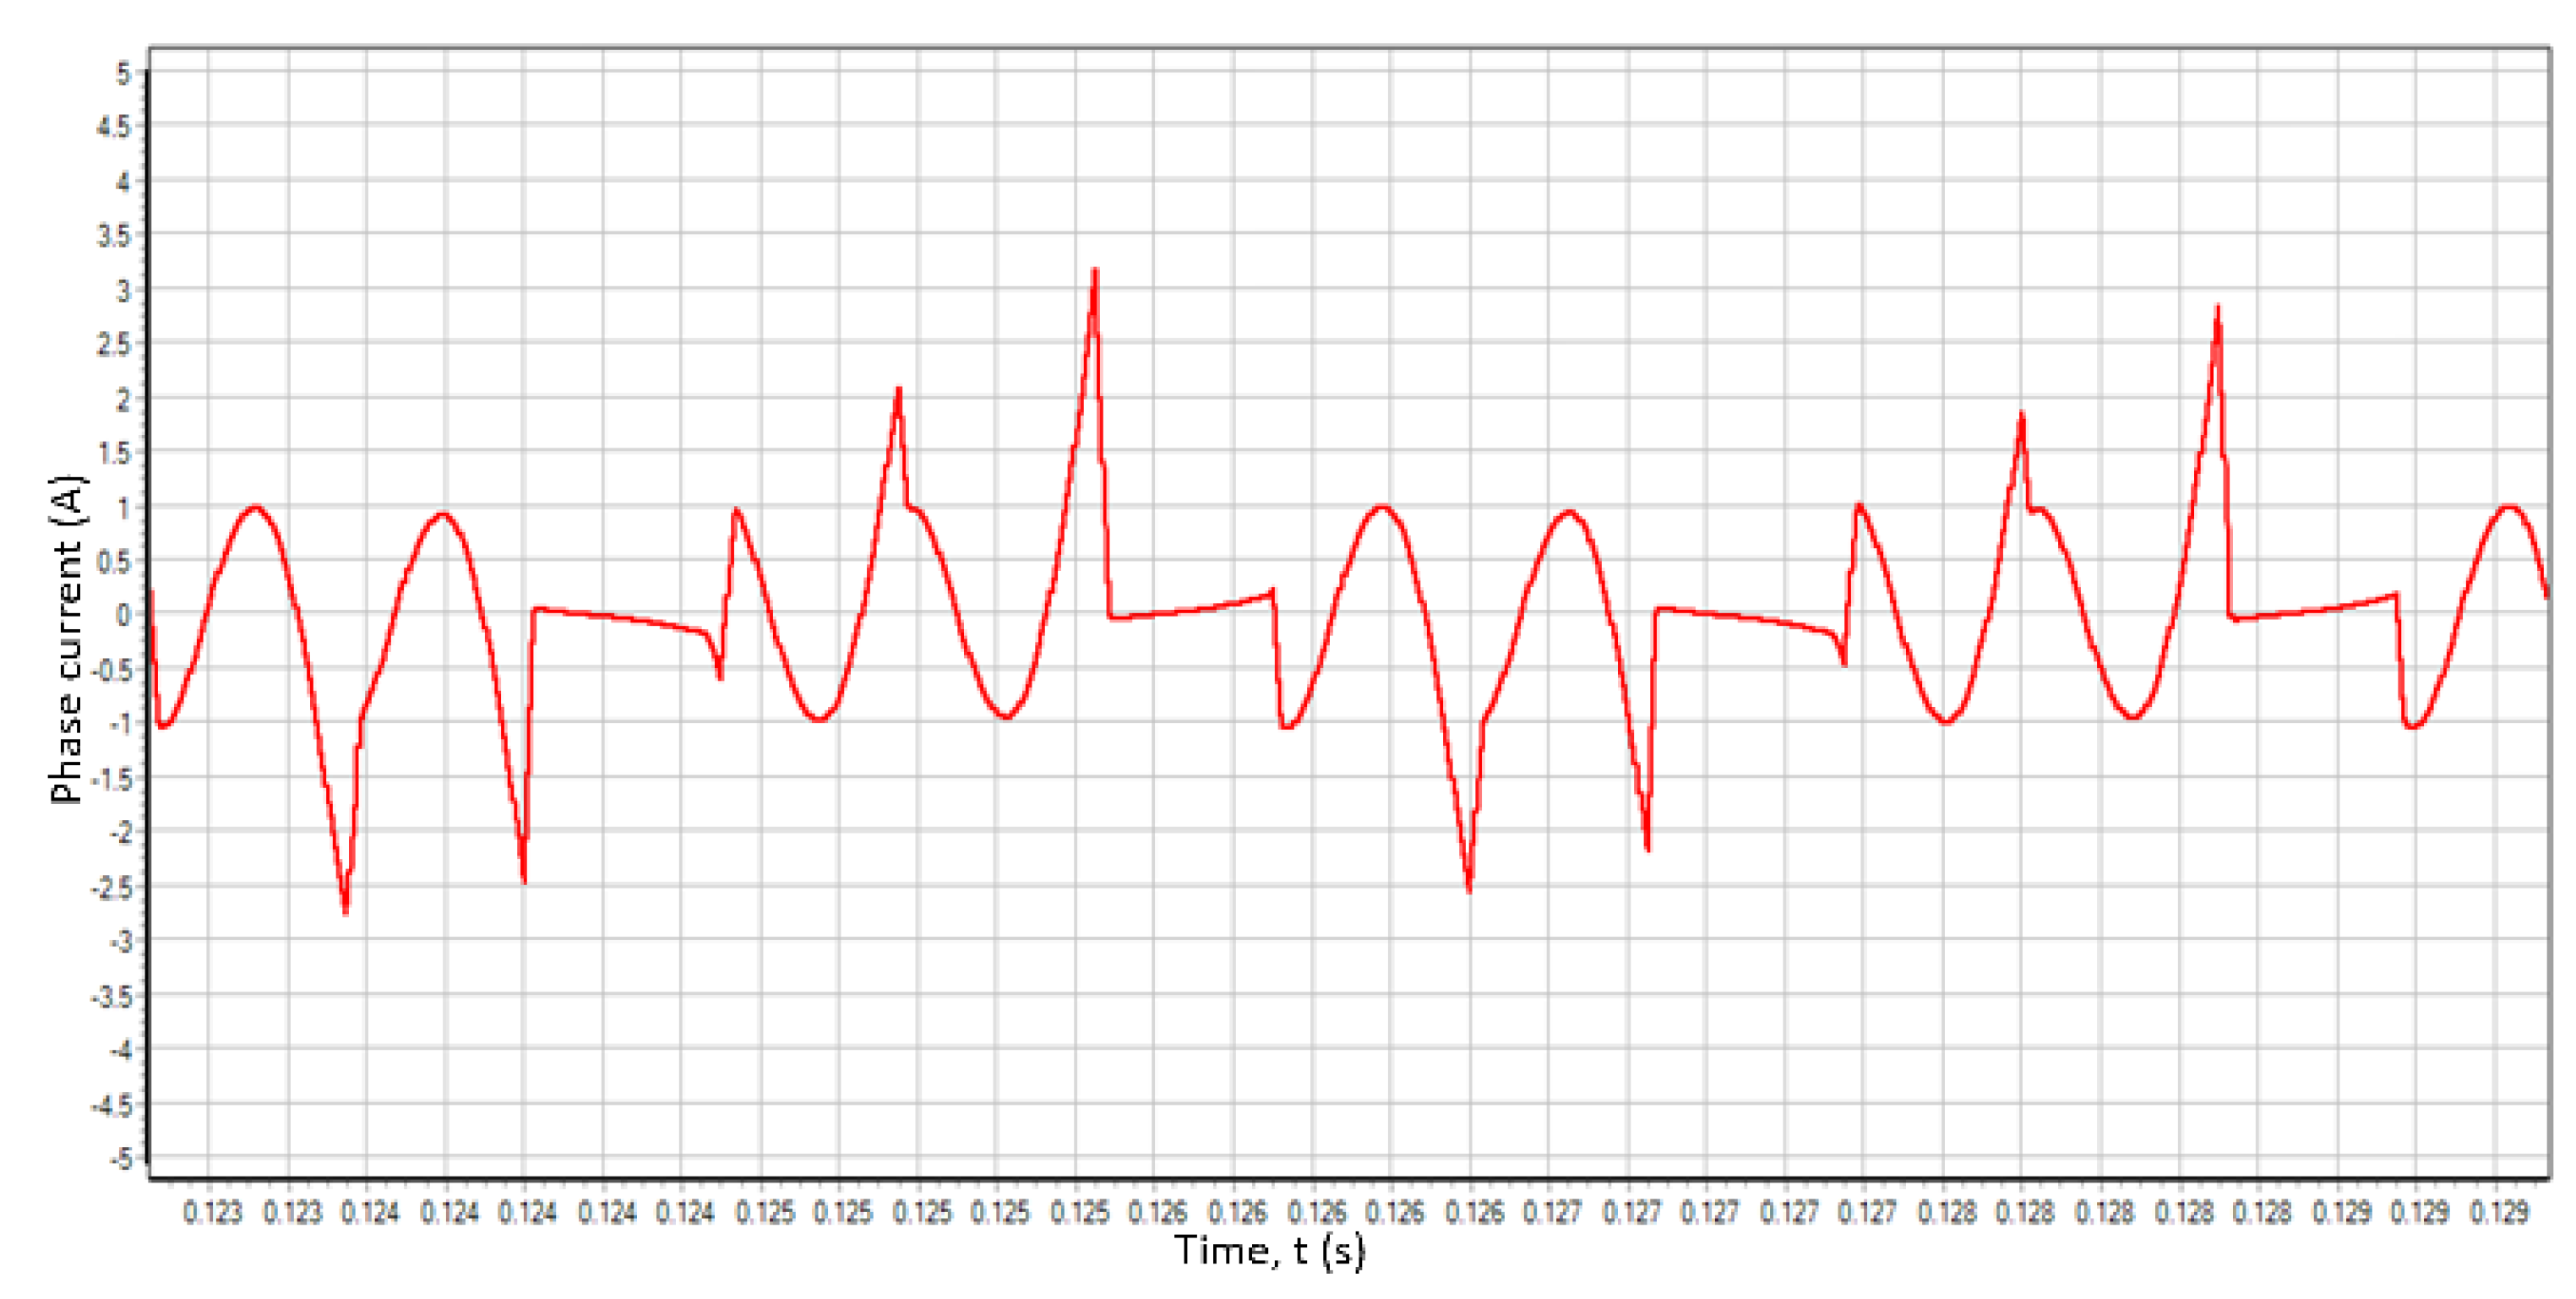
Figure 22 presents the graph of the model phase current at a motor model speed of 10 500 rpm (1 140 1/s), K tr =0.0001.
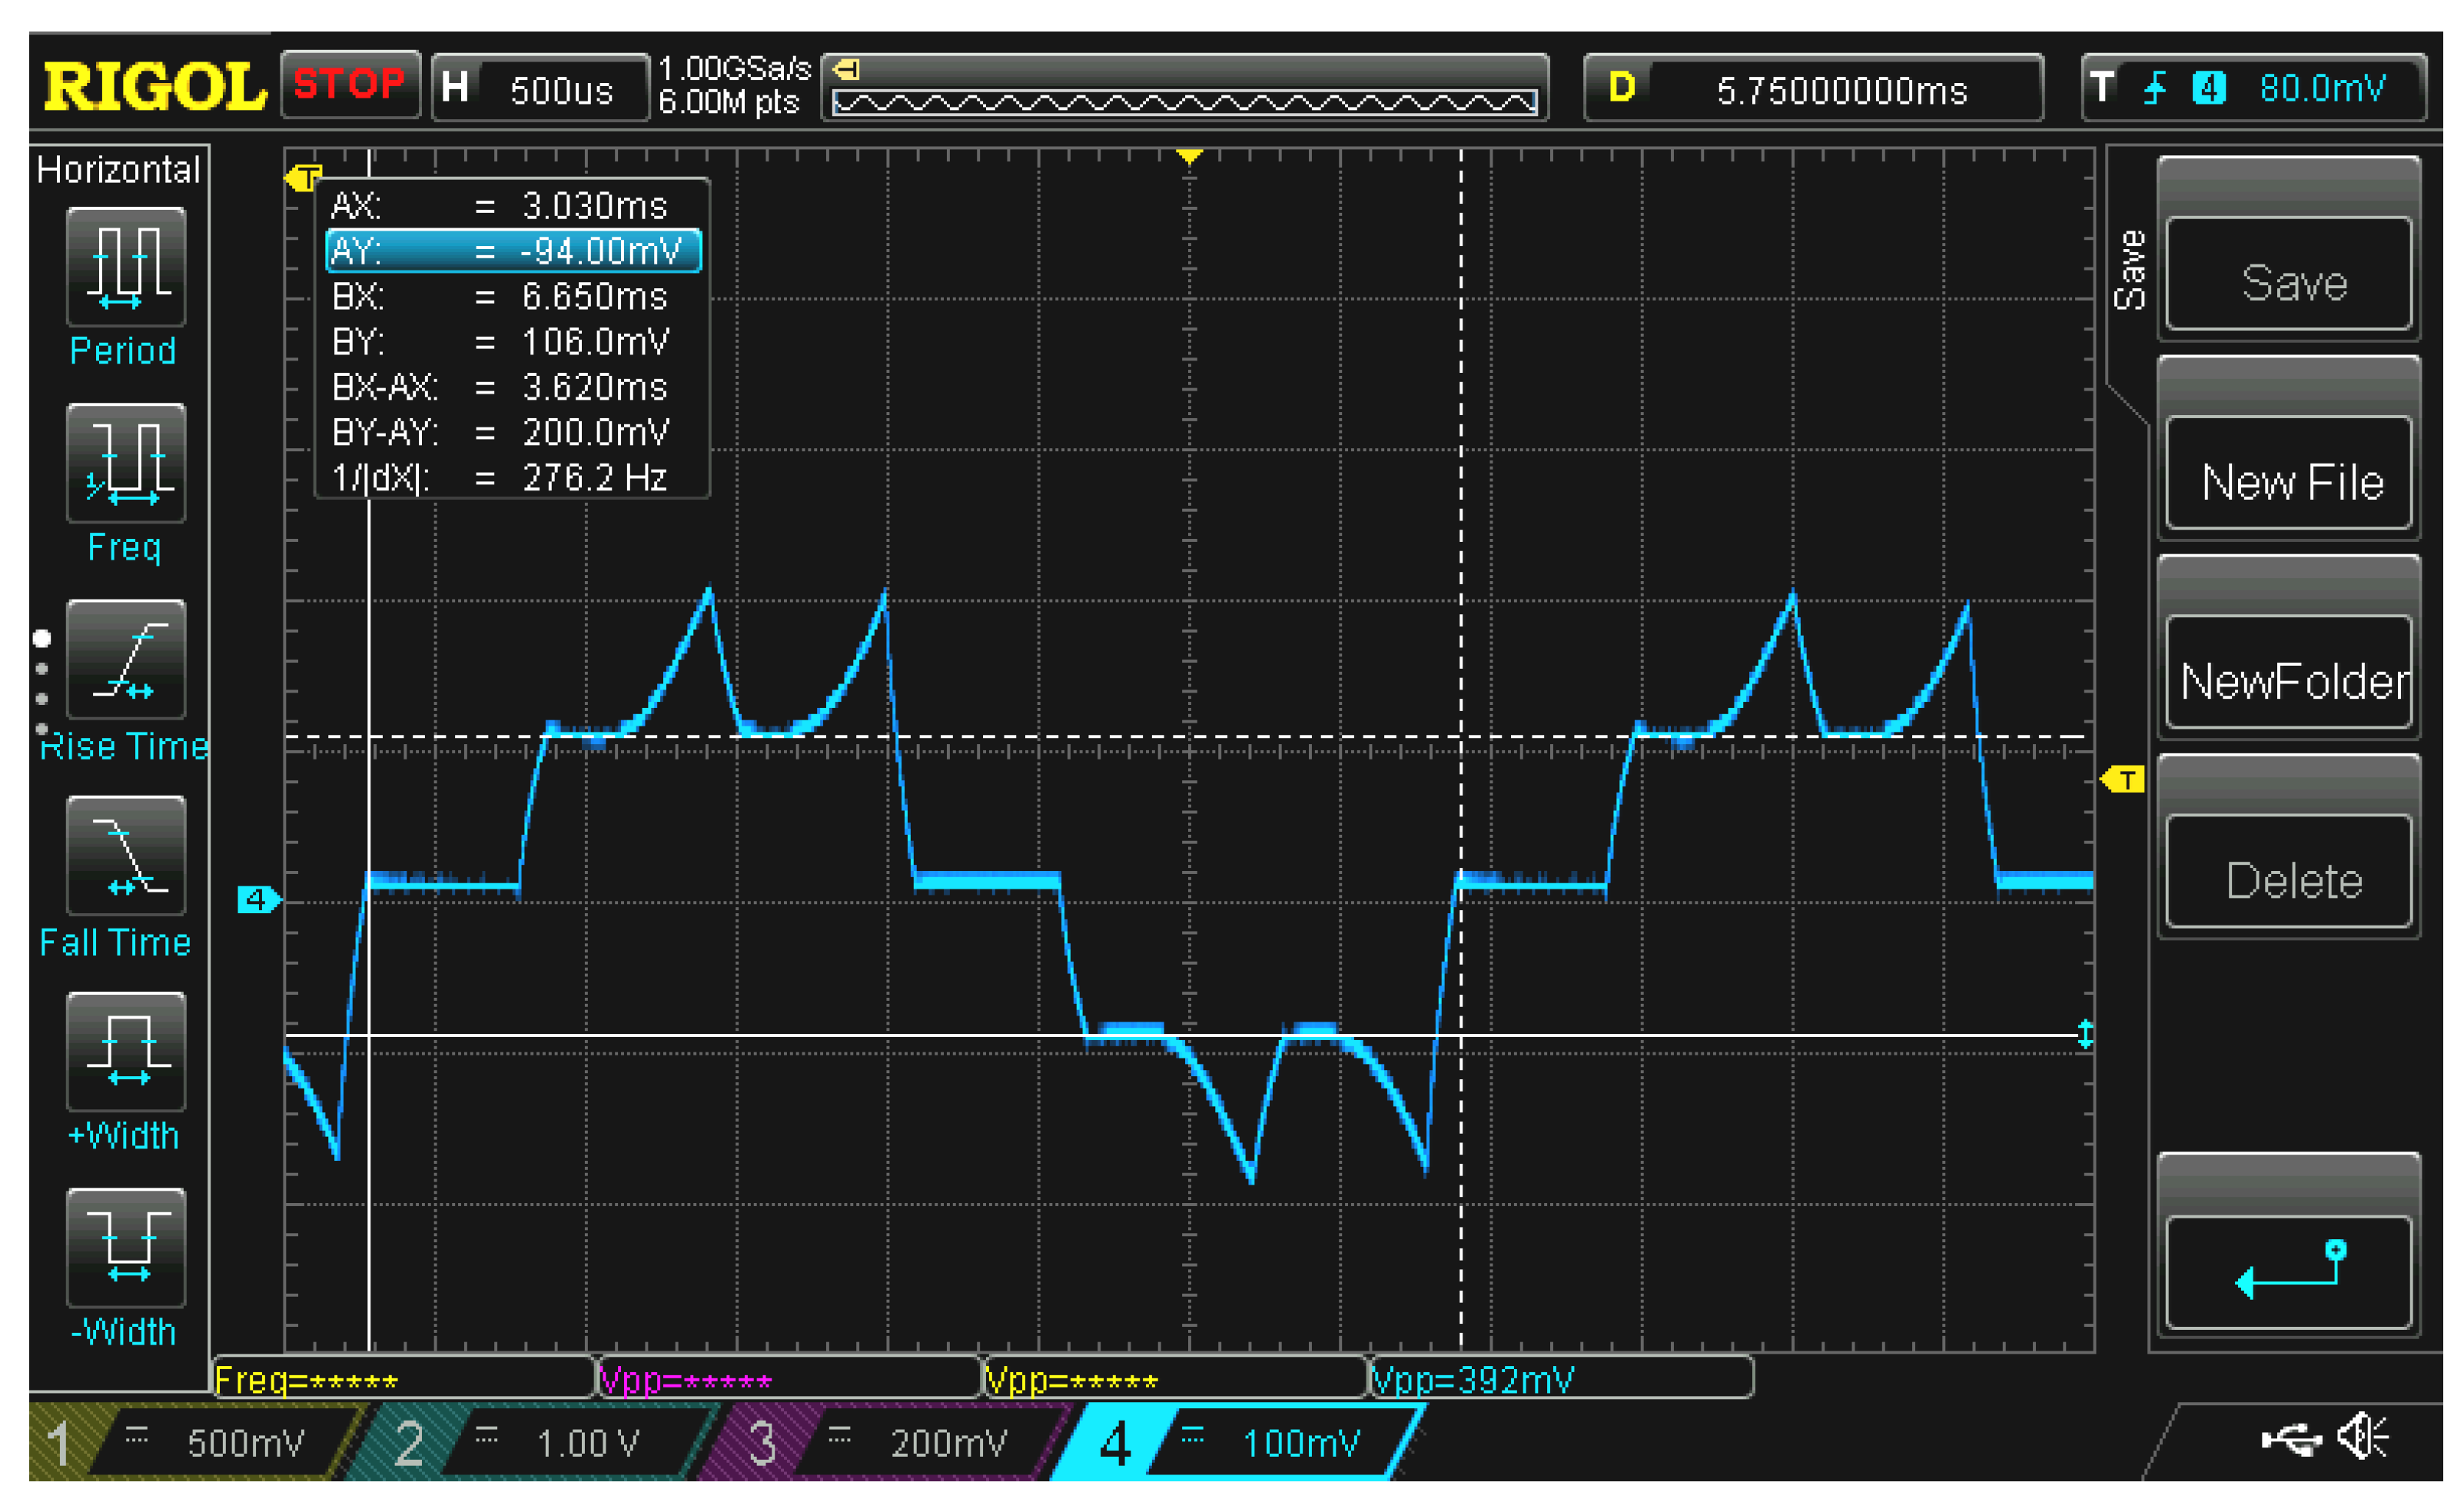
The experimentally measured phase current at a motor speed of 8 300 rpm and a torque of 0.52 Nm is shown in
Figure 23.
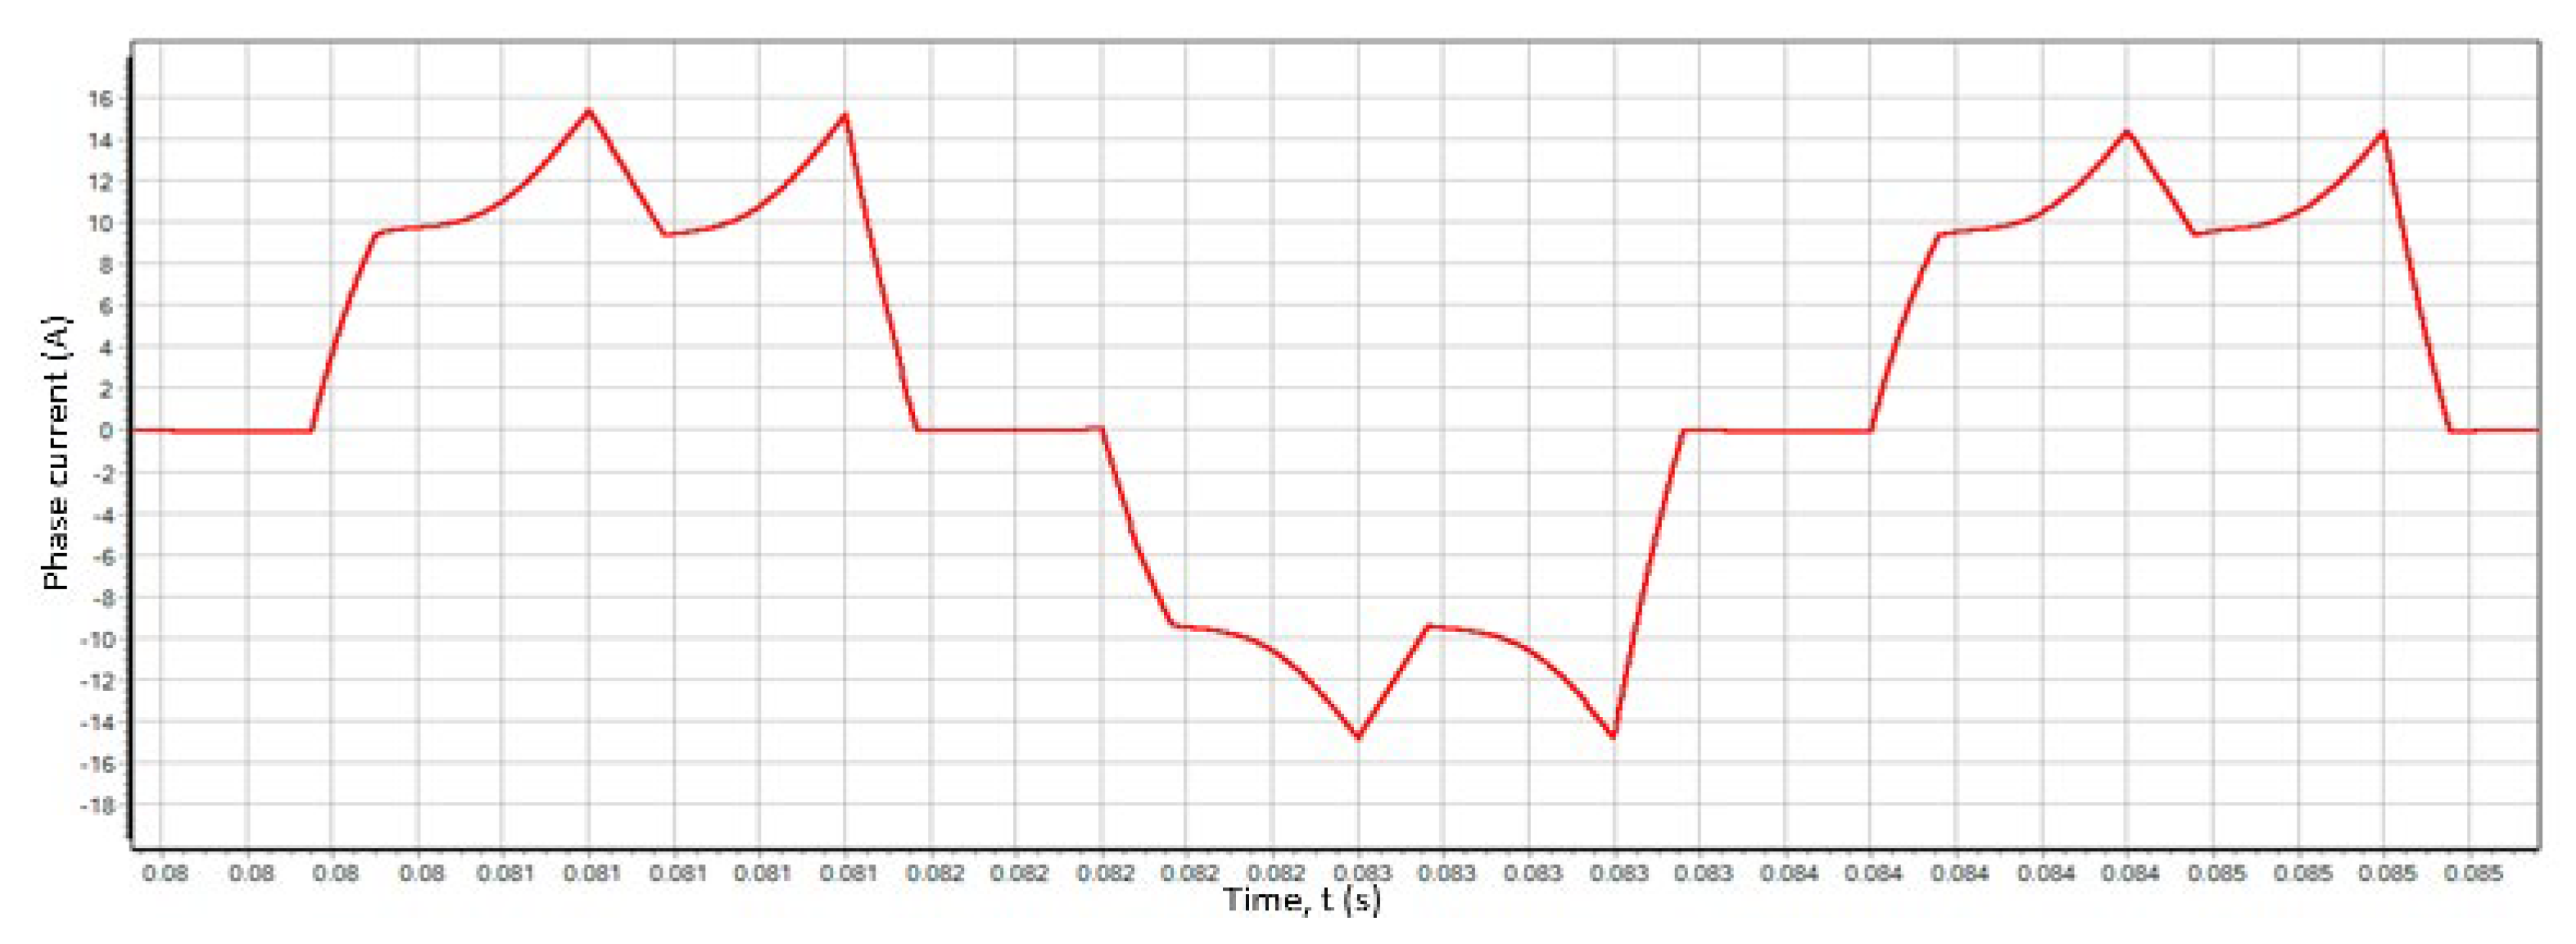
Viscous friction with a coefficient of Kfr =0.00056 was used as the motor load in the model. In this case, the average value of the electromagnetic torque at a speed of 8 300 rpm corresponds to a value of 0.49 Nm. The graph of the model phase current is shown in
Figure 24.
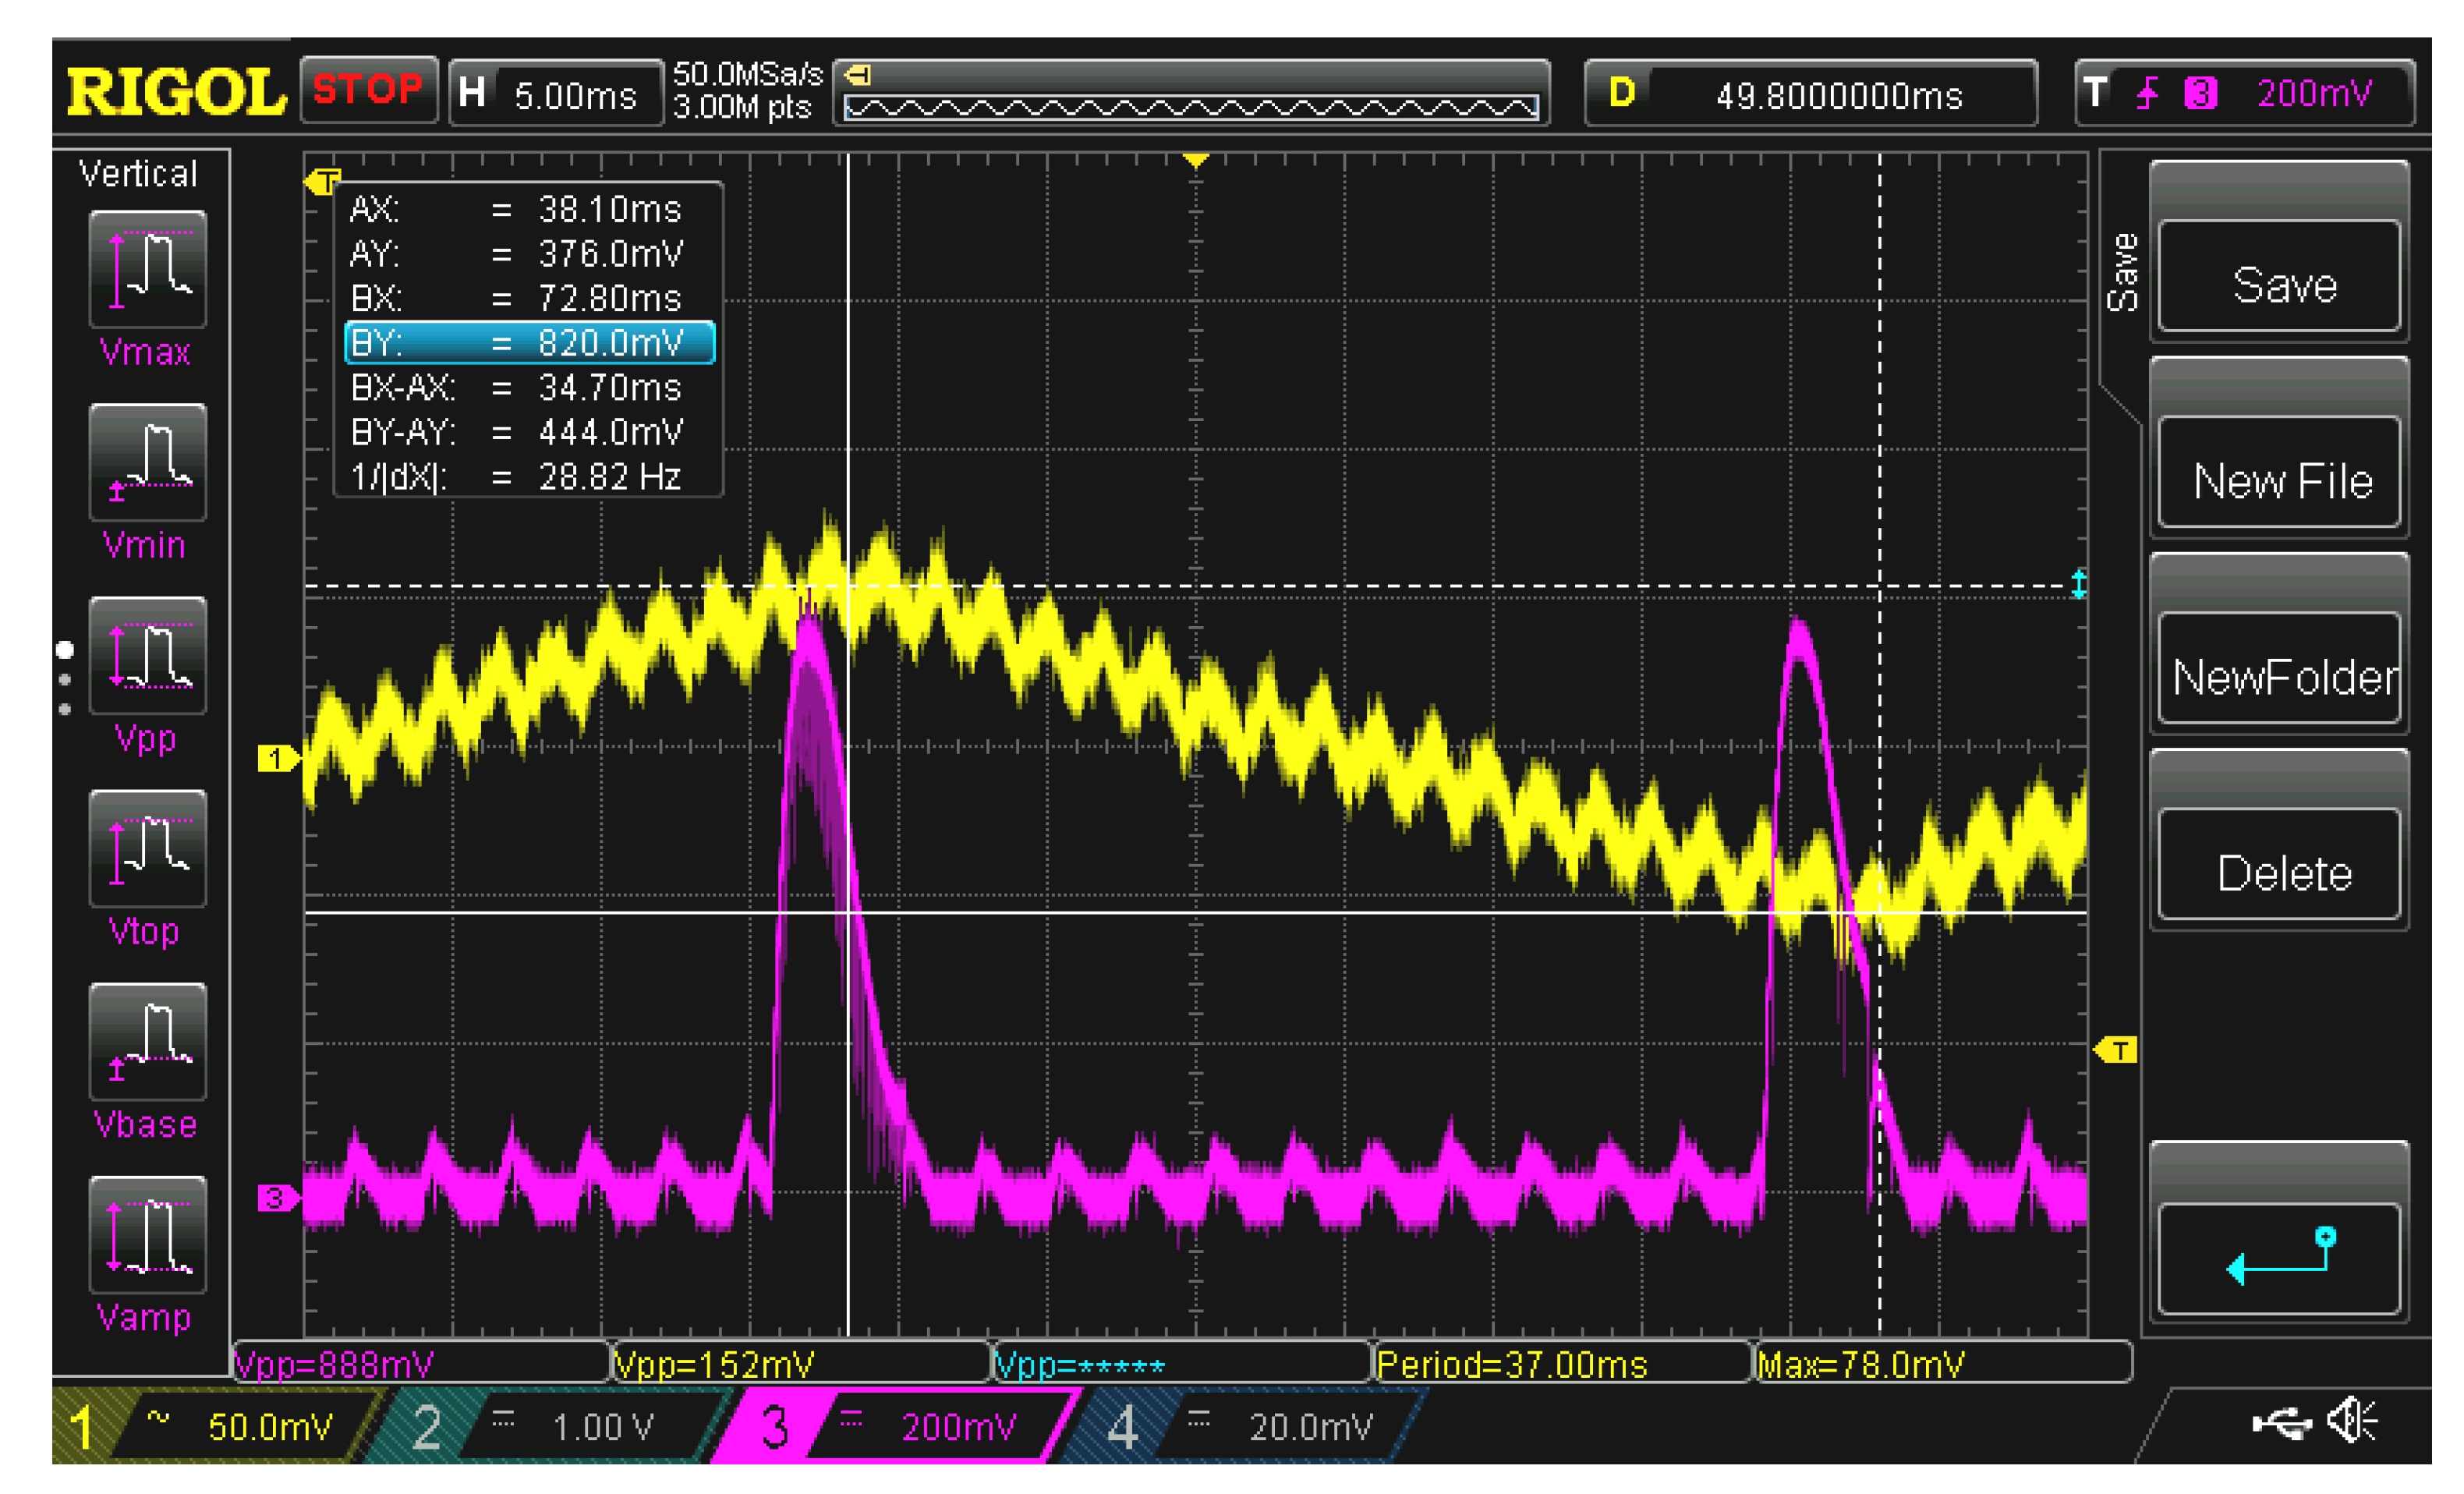
The experimentally measured position of the shaft and the shunt current of converter are shown in
Figure 25.
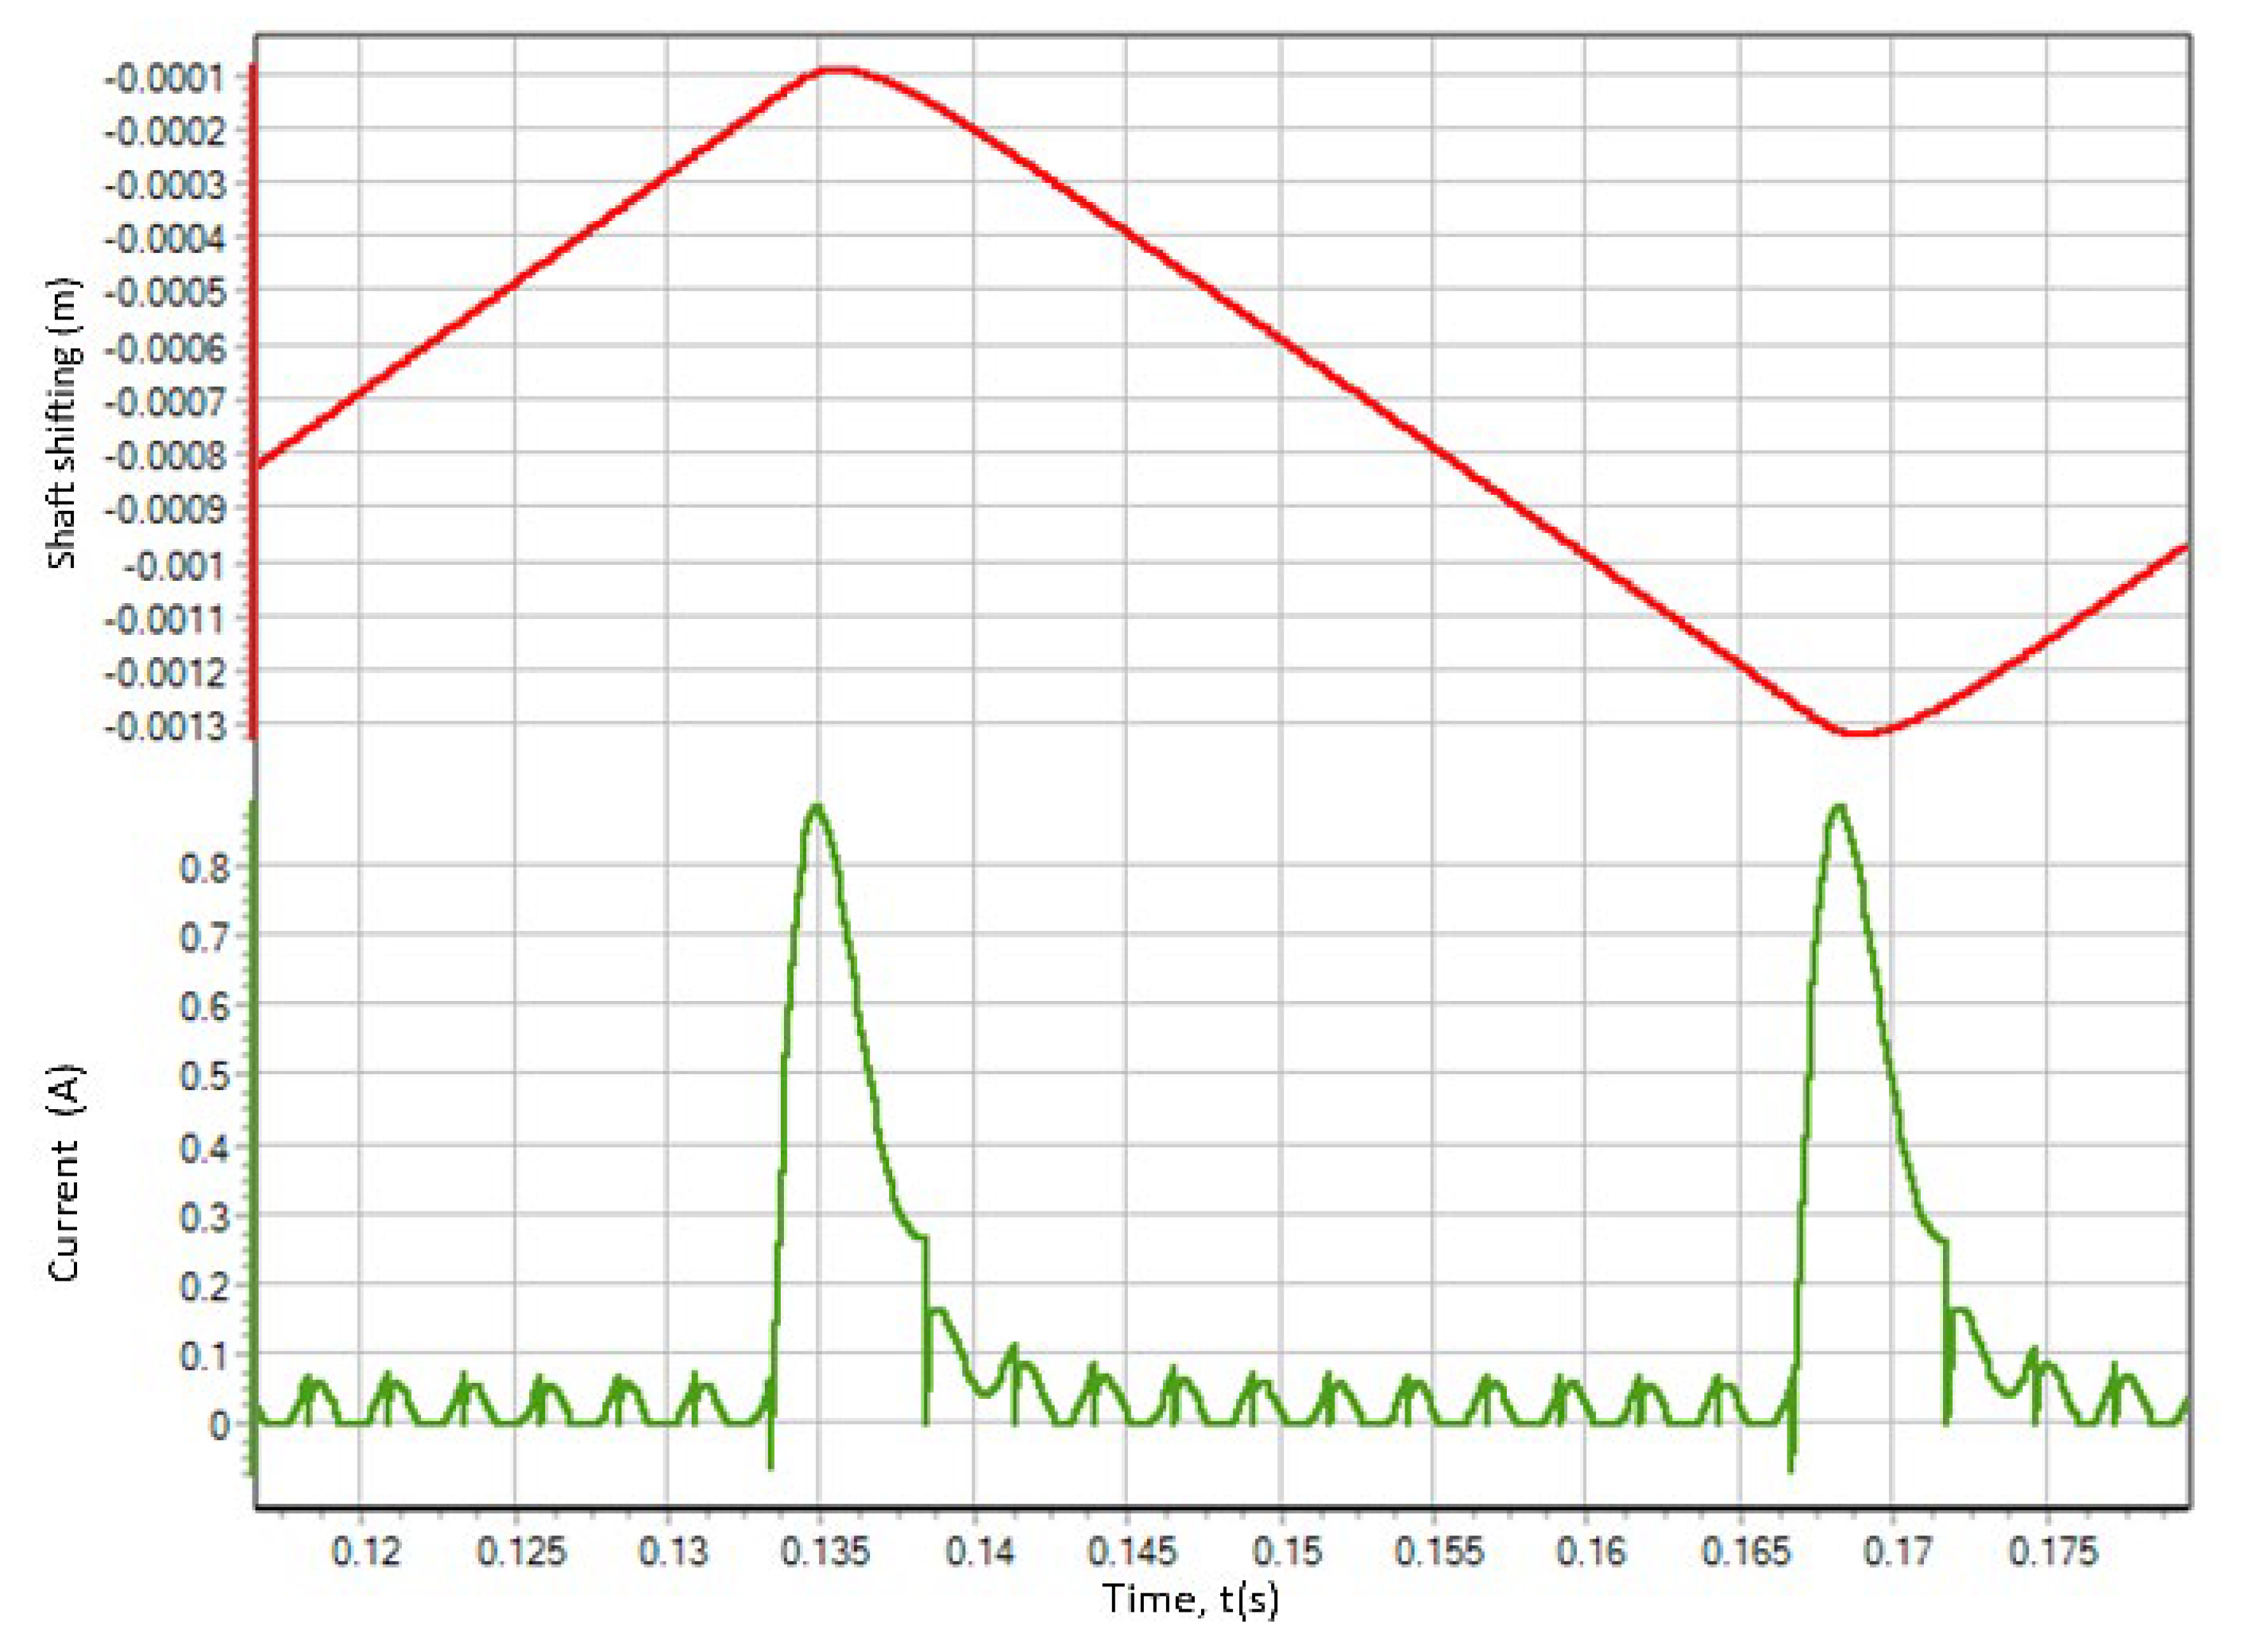
The model position of the shaft and the inverter shunt current are presented in
Figure 26.
The model showed good agreement with the experimental results. Discrepancies in the values of the inverter shunt current in the experiment of the dynamic impact response can be caused by: inaccuracy of speed measurement in the no-load and on-load experiments, inaccuracy of torque measurement in the load experiment, inaccurately set inductance and resistance of the motor winding in the model, non-ideal correspondence between the operating parameters of the model inverter and real-world electric drive inverter.
6. Conclusions
The presented graphs and tables provide clear evidence that the intersection refinement process, taking into account the step from both discrete blocks and source blocks in the model, guarantees the highest level of accuracy. In this case, there are no skipped PWM periods and the number of trial steps for the integration method is minimized. The refinement of intersections and the consideration of the periods of discrete blocks allow minimizing the number of trial steps in the integration method and calculating the dynamics of such systems as correctly as possible with coarse tuning of the maximum integration step. The above intersection refinement algorithm can also work if the input value of the refinement block is quantized. However, this may result in a decrease in accuracy.
The use of the adaptive integration method ARK21 in a complex drive model, can reduce the number of function calculations by more than 2.6 times, compared to the Euler method with a constant integration step. Moreover, the modeling results are almost identical for all methods. Enabling intersection refinement increases the number of function calculations and brings about a modest improvement in modeling accuracy. However, in this model, the impact on accuracy is negligible, because the electric circuit modeling kernel and the motor model itself influence the integration step. There is some benefit associated with increased accuracy when enabling intersection refinement in the PWM model. Since it is imperative to correctly consider the guard interval during modeling, it is also advisable to use the intersection refinement block in the PWM model and include refinement of a priori specified delays for signal sources and delay blocks.
In the simulation modeling, the use of numerical methods alongside an adaptive numerical scheme combined with an intersection refinement algorithm allows a significant increase in the integration step necessary for modeling mechatronic systems while maintaining the desired level of accuracy. This capability enables a reduction in physical modeling time and enhances the performance when modeling large-scale systems.
Author Contributions
Conceptualization, K.T. and Y.S.; methodology, Y.S.; software, K.T.; validation, K.T., A.A. and Y.K.; formal analysis, K.T.; investigation, K.T.; resources, K.T.; data curation, Y.K.; writing—original draft preparation, K.T., Y.S. and A.A.; writing—review and editing, K.T., Y.S. and A.A.; visualization, K.T.; supervision, Y.S.; project administration, K.T.; funding acquisition, K.T. All authors have read and agreed to the published version of the manuscript.
Funding
This research received no external funding.
Data Availability Statement
Data sharing not applicable. No new data were created or analyzed in this study. Data sharing is not applicable to this article.
Conflicts of Interest
The authors declare no conflicts of interest.
References
- X. Meng, Q. Duan, G. Sha; C. Zhao, H. Wang, X. Wang, Z. Lan, “An Efficiency Improvement Strategy for Triple-Active-Bridge-Based DC Energy Routers in DC Microgrids”, Electronics 2024, 13, 1172. [CrossRef]
- Y. Hakam, A. Gaga, M. Tabaa, B. El Hadadi, “Enhancing Electric Vehicle Charger Performance with Synchronous Boost and Model Predictive Control for Vehicle-to-Grid Integration”, Energies 2024, 17, 1787. [CrossRef]
- J. Kim, M.-H. Nguyen, S. Kwak, S. Choi, “Lifetime Extension Method for Three-Phase Voltage Source Converters Using Discontinuous PWM Scheme with Hybrid Offset Voltage”, Machines 2023, 11, 612. [CrossRef]
- Zahaf, S. Bouden, M. Chadli, I. Boulkaibet, B. Neji, N. Khezami, “Dynamic Sensorless Control Approach for Markovian Switching Systems Applied to PWM DC–DC Converters with Time-Delay and Partial Input Saturation”, Sensors 2023, 23, 6936. [CrossRef]
- T. A. Sakharuk, B. Lehman, A. M. Stankovic and G. Tadmor, “Effects of finite switching frequency and computational delay on PWM controlled servo DC drives,” IAS '97. Conference Record of the 1997 IEEE Industry Applications Conference Thirty-Second IAS Annual Meeting, New Orleans, LA, USA, 1997, pp. 699-706 vol.1. [CrossRef]
- S. Zeng, Q. Zhou, S. Yu, L. Zhu, J. Zhu, H. Fu, “A Three-Level RF-PWM Method Based on Phase-Shift Control and MPWM for ADTx”, Electronics 2022, 11, 2905. [CrossRef]
- Z. Zhou, J. Song, Y. Yu, Q. Xu, X. Zhou, “Research on High-Quality Control Technology for Three-Phase PWM Rectifier”, Electronics 2023, 12, 2417. [CrossRef]
- R.Abdullah, M. B. Smida, A. Thamallah, A. Khalaf, A. Sakly, “Novel DQ-Based Multicarrier PWM Strategy for a Single-Phase F-Type Inverter”, Electronics 2023, 12, 2972. [CrossRef]
- M. Madhavan, C. Nallaperumal, Md. J. Hossain, “Segment Reduction-Based Space Vector Pulse Width Modulation for a Three-Phase F-Type Multilevel Inverter with Reduced Harmonics and Switching States”, Electronics 2023, 12, 4035. [CrossRef]
- K. B. Tawfiq, A.S. Mansour, P. Sergeant, “Comparison of 2L + 2M and 6L SVPWM for Five-Phase Inverter to Reduce Common Mode Voltage”, Electronics 2023, 12, 3979. [CrossRef]
- M. Fernandez, E. Robles, I. Aretxabaleta, I. Cortabarria, J. Andrew, J. L. Martín, “A 3D Reduced Common Mode Voltage PWM Algorithm for a Five-Phase Six-Leg Inverter”, Machines 2023, 11, 532. [CrossRef]
- S.-K. Lim, J.-H. Park, H.-S. Jun, K.-B. Hwang, C. Hwangbo, J.-H. Lee, “High-Speed Tracking Controller for Stable Power Control in Discontinuous Charging Systems”, Electronics 2023, 13, 183. [CrossRef]
- X. Wang, Q. Zhou, M. Wang, H. Fu, “An Outphasing Architecture Based on Parallel Radio Frequency–Pulse Width Modulation Method for All-Digital Transmitter”, Electronics 2024, 13, 263. [CrossRef]
- Hou, J. Qi, H. Li, “Robust Direct Power Control of Three-Phase PWM Rectifier with Mismatched Disturbances”, Electronics 2024, 13, 1476. [CrossRef]
- X. Guo, J. Qiao, Y. Li, S. Jiao, “A Robust Switching Control Strategy for Three-Phase Voltage Source Converters with Uncertain Circuit Parameters”, Energies 2024, 17, 1832. [CrossRef]
- E. C. Renz, J. Turso, “Toward the Application of Pulse Width Modulated (PWM) Inverter Drive-Based Electric Propulsion to Ice Capable Ships”, Energies 2022, 15, 8217. [CrossRef]
- R. I. Viera Diaz; C. Nuñez, N. Visairo Cruz, J. Segundo Ramírez, “A Polynomial Synthesis Approach to Design and Control of an LCL-Filter-Based PWM Rectifier with Extended Functions Validated by SIL Simulations”, Energies 2023, 16, 7382. [CrossRef]
- Ma, L. Chai, J. Lu, S. Sun, “Pulse Width Modulation-Controlled Switching Impedance for Wireless Power Transfer”, Energies 2023, 16, 8103. [CrossRef]
- T.A. Do, Q. D. Nguyen, P. Vu, M. D. Ngo, S.-J. Ahn, “Comparative Analysis of PWM Techniques for Interleaved Full Bridge Converter in an AC Battery Application”, Energies 2024, 17, 375. [CrossRef]
- K. Kroičs, A. Būmanis, “BLDC Motor Speed Control with Digital Adaptive PID-Fuzzy Controller and Reduced Harmonic Content”, Energies 2024, 17, 1311. [CrossRef]
- B. K. Chemodanov, “Servo drives: In 3 volumes / ed. - 2nd ed., add. and processed [Sledyashhie privody: V 3 t. / red. - 2-e izd., dop. i pererab.]” (in Russian), M.: Publishing house of BMSTU, 1999.
- Hairer and G. Wanner, “Solving Ordinary Differential Equations II: Stiff and Differential Algebraic Problems”, Springer-Verlag, second revised edition, 1996.
- L. M. Skvortsov, “Numerical solution of ordinary differential and differential-algebraic equations [Chislennoye resheniye obyknovennykh differentsial'nykh i differentsial'no-algebraicheskikh uravneniy],” (in Russian), DMK Press, ISBN: 978-5-97060-636-0, pp. 5–225, 2018.
- A. Popov, Yu. V. Shornikov, “Detection of events of various types in hybrid dynamic systems [Detektsiya sobytiy raznogo tipa v gibridnykh dinamicheskikh sistemakh]”, (in Russian), Data Analysis and Processing Systems, no. 4 (80), 2020.
- B. A. Kartashov; et al., “The environment for dynamic modeling of technical systems SimInTech: A workshop on modeling automatic control systems [Sreda dinamicheskogo modelirovaniya tekhnicheskikh sistem SimInTech : Praktikum po modelirovaniyu sistem avtomaticheskogo regulirovaniya],” (in Russian), Moscow, DMK Press, ISBN 978-5-97060-482-3, pp. 90–200, 2017.
- A. Novikov, Yu. V. Shornikov, “Computer simulation of stiff hybrid systems: Monograph [Komp`yuternoe modelirovanie zhestkix gibridny`x sistem: Monografiya].” (in Russian), Publishing house – NSTU, Novosibirsk, 451 p., ISBN 978-5-7782-2023-2, 2013.
- J. Esposito, V. Kumar, G. J. Pappas, “Accurate event detection for simulating hybrid systems“, In: Hybrid Systems: Computation and Control (HSCC). Volume LNCS 2034, Springer–Verlag, 1998.
- L. M. Skvortsov, “Construction and analysis of explicit adaptive one-step methods for numerical solution of stiff problems [Postroyeniye i analiz yavnykh adaptivnykh odnoshagovykh metodov chislennogo resheniya zhestkikh zadach]”, (in Russian), Journal of Computational Mathematics and Mathematical Physics [Zhurnal vychislitel'noy matematiki i matematicheskoy fiziki], 2020, vol. 60, no. 7, pp. 1111-1125. [CrossRef]
- Hayder Almukhtar-Abbood, “A Review of Intelligent Techniques Based Speed Control of Brushless DC Motor (BLDC) “, Basrah Journal for Engineering Sciences, Vol. 24, No. 1, pp. 109-119, 2024.
- В. R. Boustead, “Special stability analysis for the Shichman formula“, Electronics Letters, 1971, v. 7, № 5/6, p. 127-129.
Figure 1.
Structural model of a servo drive with PWM.
Figure 1.
Structural model of a servo drive with PWM.
Figure 2.
Structural model of PWM.
Figure 2.
Structural model of PWM.
Figure 3.
Comparison with detection of intersections.
Figure 3.
Comparison with detection of intersections.
Figure 4.
Block diagram of a scalar PWM model of the dynamics of a brushless DC motor.
Figure 4.
Block diagram of a scalar PWM model of the dynamics of a brushless DC motor.
Figure 5.
Output signal for the model of a servo drive with PWM with various detection options.
Figure 5.
Output signal for the model of a servo drive with PWM with various detection options.
Figure 6.
Error pulse signal for the model of a servo drive with PWM with various detection options.
Figure 6.
Error pulse signal for the model of a servo drive with PWM with various detection options.
Figure 7.
Block diagram of the drive model in ISMA 2007.
Figure 7.
Block diagram of the drive model in ISMA 2007.
Figure 8.
Text specification of the PWM block in the language of ISMA.
Figure 8.
Text specification of the PWM block in the language of ISMA.
Figure 9.
Graph of the error pulse signal (output of the PWM block).
Figure 9.
Graph of the error pulse signal (output of the PWM block).
Figure 10.
Graph of rotation angle φ(t).
Figure 10.
Graph of rotation angle φ(t).
Figure 11.
Block diagram of the motor model in SimInTech.
Figure 11.
Block diagram of the motor model in SimInTech.
Figure 12.
Block diagram of the controller model in SimInTech.
Figure 12.
Block diagram of the controller model in SimInTech.
Figure 13.
Simulation results for the controller in SimInTech.
Figure 13.
Simulation results for the controller in SimInTech.
Figure 14.
Simulation results for the electric drive in SimInTech.
Figure 14.
Simulation results for the electric drive in SimInTech.
Figure 15.
Control system model in SimInTech.
Figure 15.
Control system model in SimInTech.
Figure 16.
Electric drive model in SimInTech.
Figure 16.
Electric drive model in SimInTech.
Figure 19.
Experimental form of the motor EMF.
Figure 19.
Experimental form of the motor EMF.
Figure 20.
Model form of the motor EMF.
Figure 20.
Model form of the motor EMF.
Figure 21.
Experimental no-load phase current.
Figure 21.
Experimental no-load phase current.
Figure 22.
Model phase current in idle mode.
Figure 22.
Model phase current in idle mode.
Figure 23.
Experimental on-load phase current.
Figure 23.
Experimental on-load phase current.
Figure 24.
Model on-load phase current.
Figure 24.
Model on-load phase current.
Figure 25.
Experimentally measured shaft position and inverter shunt current.
Figure 25.
Experimentally measured shaft position and inverter shunt current.
Figure 26.
Model shaft position and inverter shunt current.
Figure 26.
Model shaft position and inverter shunt current.
Table 1.
Simulation Performance Characteristics.
Table 1.
Simulation Performance Characteristics.
| Parameter |
ISMA 2007 |
SimInTech
reference |
SimInTech
without detection |
SimInTech with intersection refinement |
SimInTech with intersection refinement and specification of step for discrete blocks |
| Integration method |
STEKS |
ARK32v1 |
| Number of function calls |
6 425 |
3 028 |
2 195 |
1 630 |
1 865 |
| Number of integration steps |
1 285 |
1 109 |
479 |
330 |
377 |
| Number of trial steps |
n/a |
169 |
202 |
22 |
22 |
| Standard deviation |
n/a |
0 |
0.03011187 |
0.015199124 |
0.0000393341 |
Table 2.
Simulation Performance Characteristics.
Table 2.
Simulation Performance Characteristics.
| Method |
Euler |
ARK21
with detection |
SimInTech
without detection |
| Position at the end of the modeling |
0.00999914934636218 |
0.0100026831685805 |
0.0100020459415512 |
|
4 530 403 |
1 701 481 |
1 133 284 |
|
, s |
60.7 |
18.29 |
11.98 |
Table 3.
Electric motor model parameters.
Table 3.
Electric motor model parameters.
| Parameter |
Value |
| Position at the end of the modeling |
0.3 ohm |
| Winding resistance |
0.00027 H |
| Winding inductance |
0.0137 Wb |
| Rotor flux linkage |
2 |
| Number of pole pairs |
4.45∙10 -6 kg m2
|
| Moment of inertia |
0.3 ohm |
Table 4.
Mechanical transmission model parameters.
Table 4.
Mechanical transmission model parameters.
| Parameter |
Value |
| Friction coefficient on the motor shaft |
0.00001 |
| Motor - gearbox backlash |
0.013 (rad) |
| Gearbox moment of inertia |
0.00000276 |
| Gearbox transmission ratio |
3.3 |
| Gearbox – ball screw backlash |
0.0063 |
| Ball screw moment of inertia |
0.00000914 |
| Ball screw transmission ratio |
1 571 |
|
Disclaimer/Publisher’s Note: The statements, opinions and data contained in all publications are solely those of the individual author(s) and contributor(s) and not of MDPI and/or the editor(s). MDPI and/or the editor(s) disclaim responsibility for any injury to people or property resulting from any ideas, methods, instructions or products referred to in the content. |
© 2024 by the authors. Licensee MDPI, Basel, Switzerland. This article is an open access article distributed under the terms and conditions of the Creative Commons Attribution (CC BY) license (http://creativecommons.org/licenses/by/4.0/).
