2. Event-Driven Systems and the Harel Diagrams
An event-driven system is a multi-mode dynamic system with continuous (С) or discrete (D) behavior, and modes of the system are determined by certain events (E).
Event-driven discrete or event-discrete systems (ED) are defined by the state vector , , is a set of non-negative integer numbers; – a set of Boolean values; – a set of real numbers. The discrete behavior of the event system is determined by the mapping , .
Event-continuous systems (EC), defined in a time interval , are specified by the state vector and determined by the mapping , m – the number of system modes.
The modes of the EC system are defined by the state vector
with local behaviors
,
, which range of permissible values is defined on a set of continuously differentiable event functions [
8,
10]
,
, and these values exist in the half-interval
in a local region
,
, which is the range of permissible values for the local states vector
.
An event mode function [
10] works in such a way, that the corresponding predicate of the mode behavior
,
, is true (
) in the entire half-interval of the mode solution
. Therefore, the moment
, when the next event
, occurs and the mode behavior changes, is determined by the moment of time, when the predicate
changes its value from
to
.
Let’s change phase variables
and constrain the mapping
by the class of ordinary differential equations systems in the Cauchy form. Then local modes are presented as
where
;
is a non-linear vector function, satisfying the Lipschitz conditions in a local mode;
– the initial conditions vector for the local mode.
The sequence of continuous system modes generates a cause-and-effect chain of events
that are defined on a solution of (1) with initial conditions
. The set of discrete behaviors is determined by the non-empty set of event functions
,
. In moments
, when the next event
occurs, the right side of (1) meets discontinuity points. The Lipschitz conditions are broke at discontinuity points. In this case, taking into account discontinuities of phase variables, obtaining the only solution requires the Caratheodory conditions to be satisfied [
8]. As a result, the global behavior of the entire event-continuous system is determined by solving the Cauchy problem with constraints of the event function
where
;
is a piecewise continuous vector function, satisfying the Caratheodory conditions [
8];
,
– a continuously differentiable event vector function (event function).
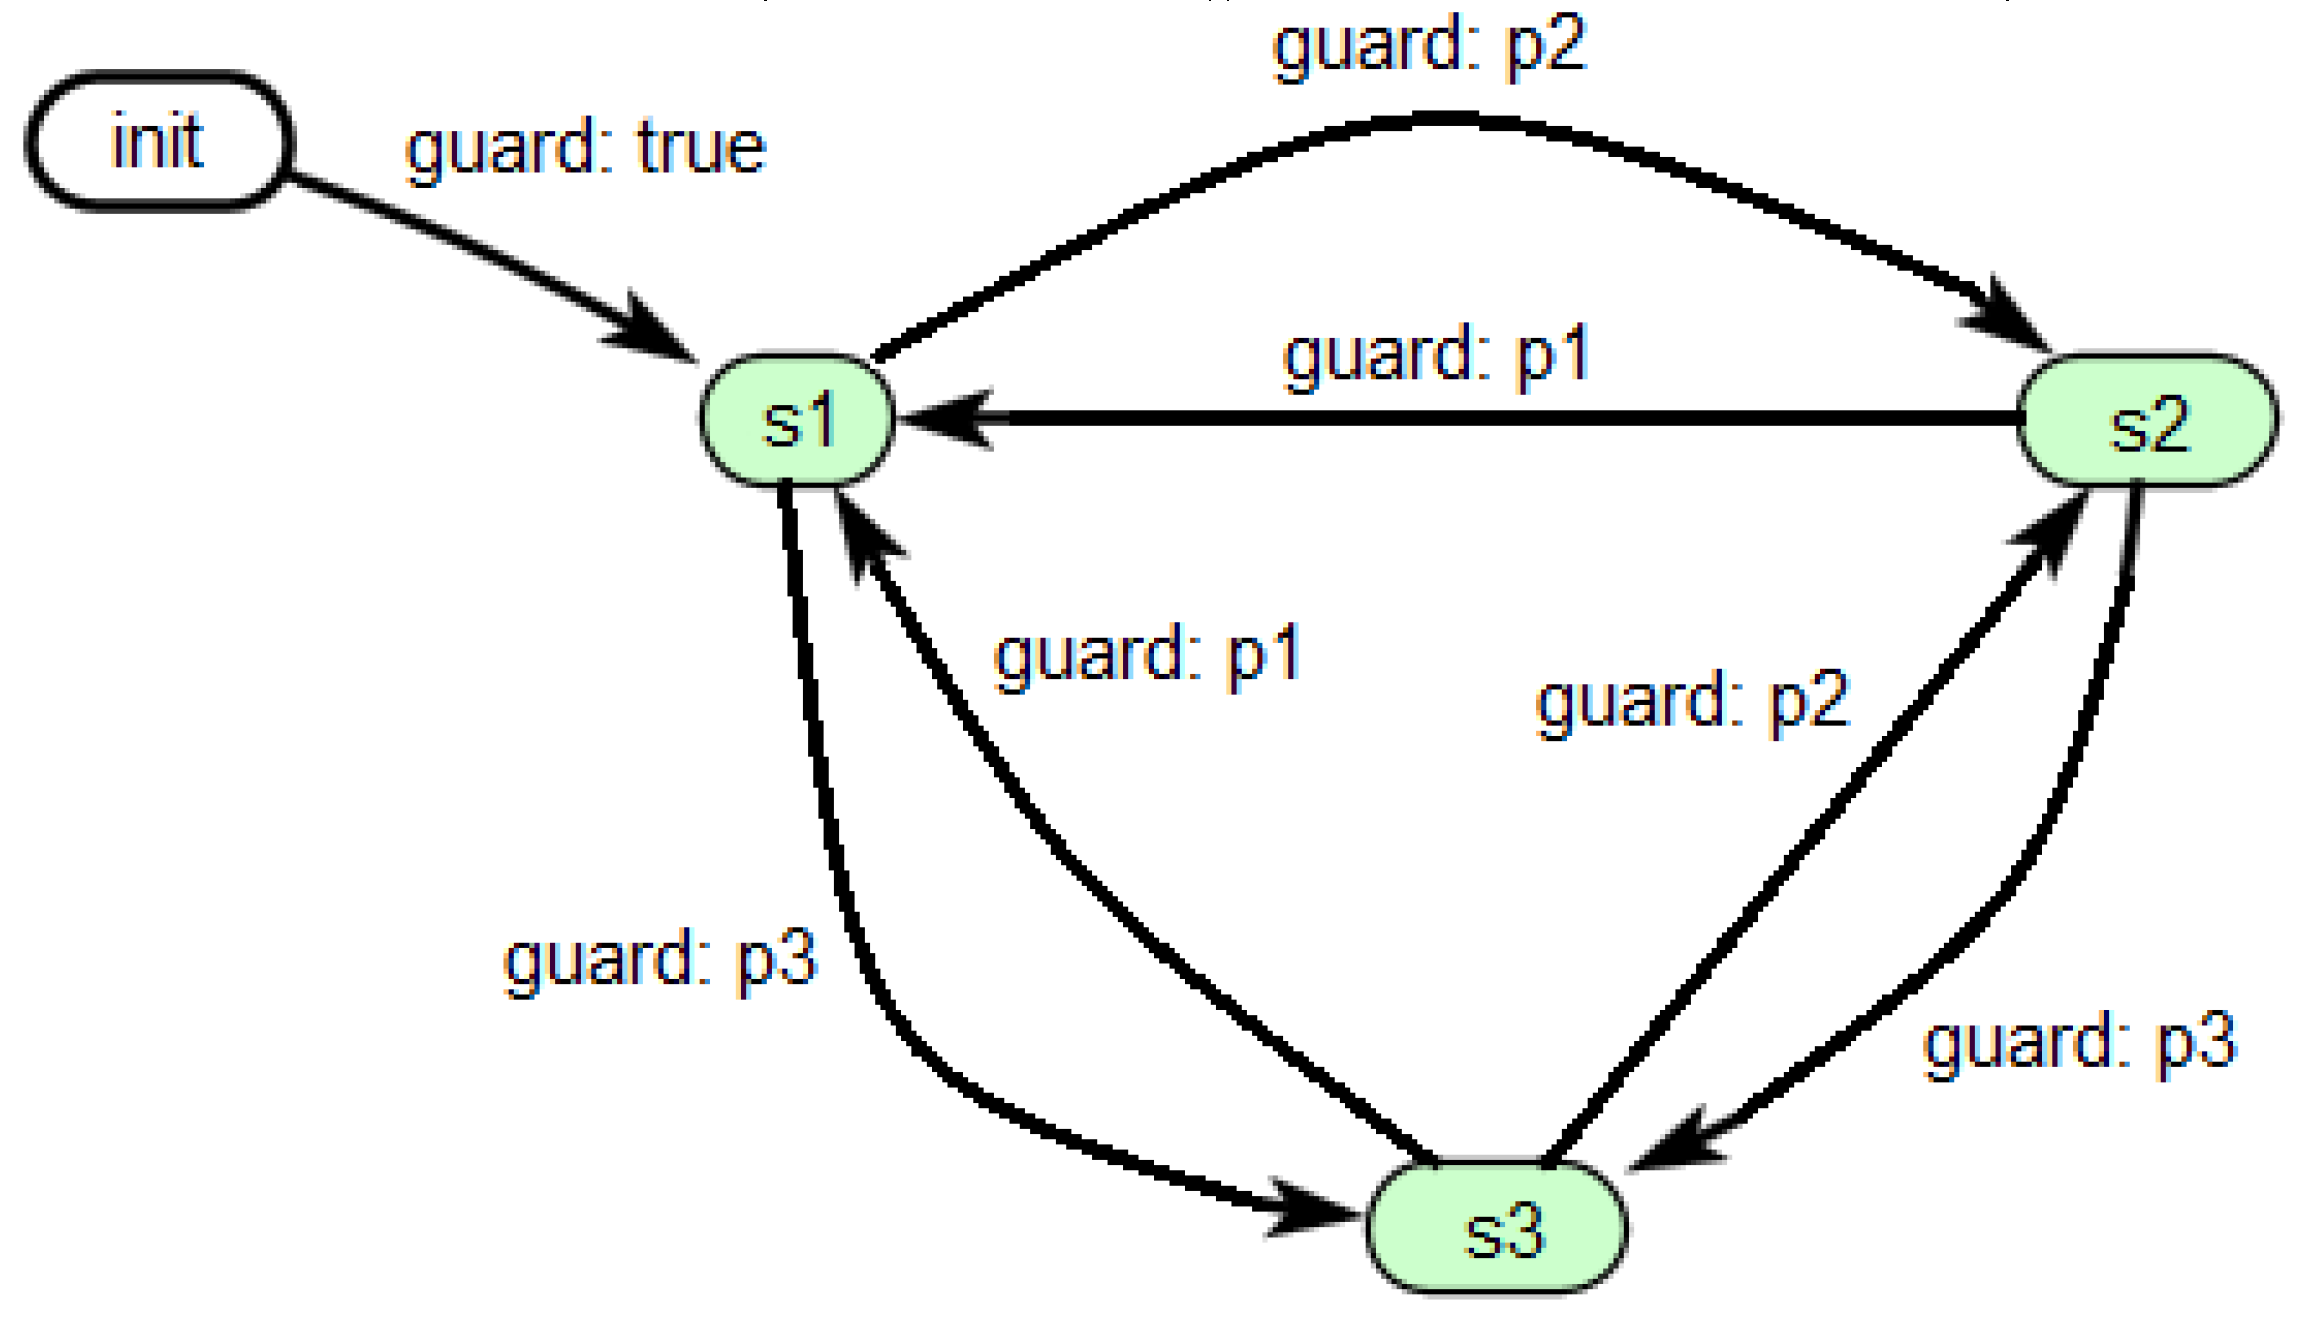
Designing multi-mode event-continuous systems (2) is based on the advanced finite state specification of the model (2) in the form of the Harel diagrams or statecharts [
5,
11]. The event-continuous system behavior changing from
,
, to a new one
,
,
, taking into account equations (1) – (2), will be determined by a new predicate
On the analogy of graph theory [
12], let a pair of behaviors
be
adjacent behaviors of an event system, if the following condition is met:
,
. If a non-empty set of behaviors
C is presented as vertices or nodes, a non-empty set of predicates
is presented as a set of directed edges, connecting adjacent nodes
, then a directed graph
is a
chart of discrete behavior. Finally, considering the fact, that both continuous
and discrete
behaviors take places in corresponding states
,
, the directed graph
can be called a
statechart or a
Harel diagram.
In the modern traditional terminology, event-continuous systems are usually called hybrid systems (HS) [
8,
13,
14]. The study of hybrid systems is based on numerical analysis of the equations (2) by the advanced tools with libraries for numerical integration and event detection algorithms to identify discrete moments of mode switching [
8,
10,
15].
8. Event Detection Algorithms in ISMA
Let’s consider the algorithms for obtaining the event mode function
as in (2), implemented in the ISMA software tool. The LISMA grammar [
17] is presented in the extended Backus–Naur form for the top-dawn parsers generator ANTLR4 [
22]. The fragment of the grammar for conditional expressions in the software model is the following:
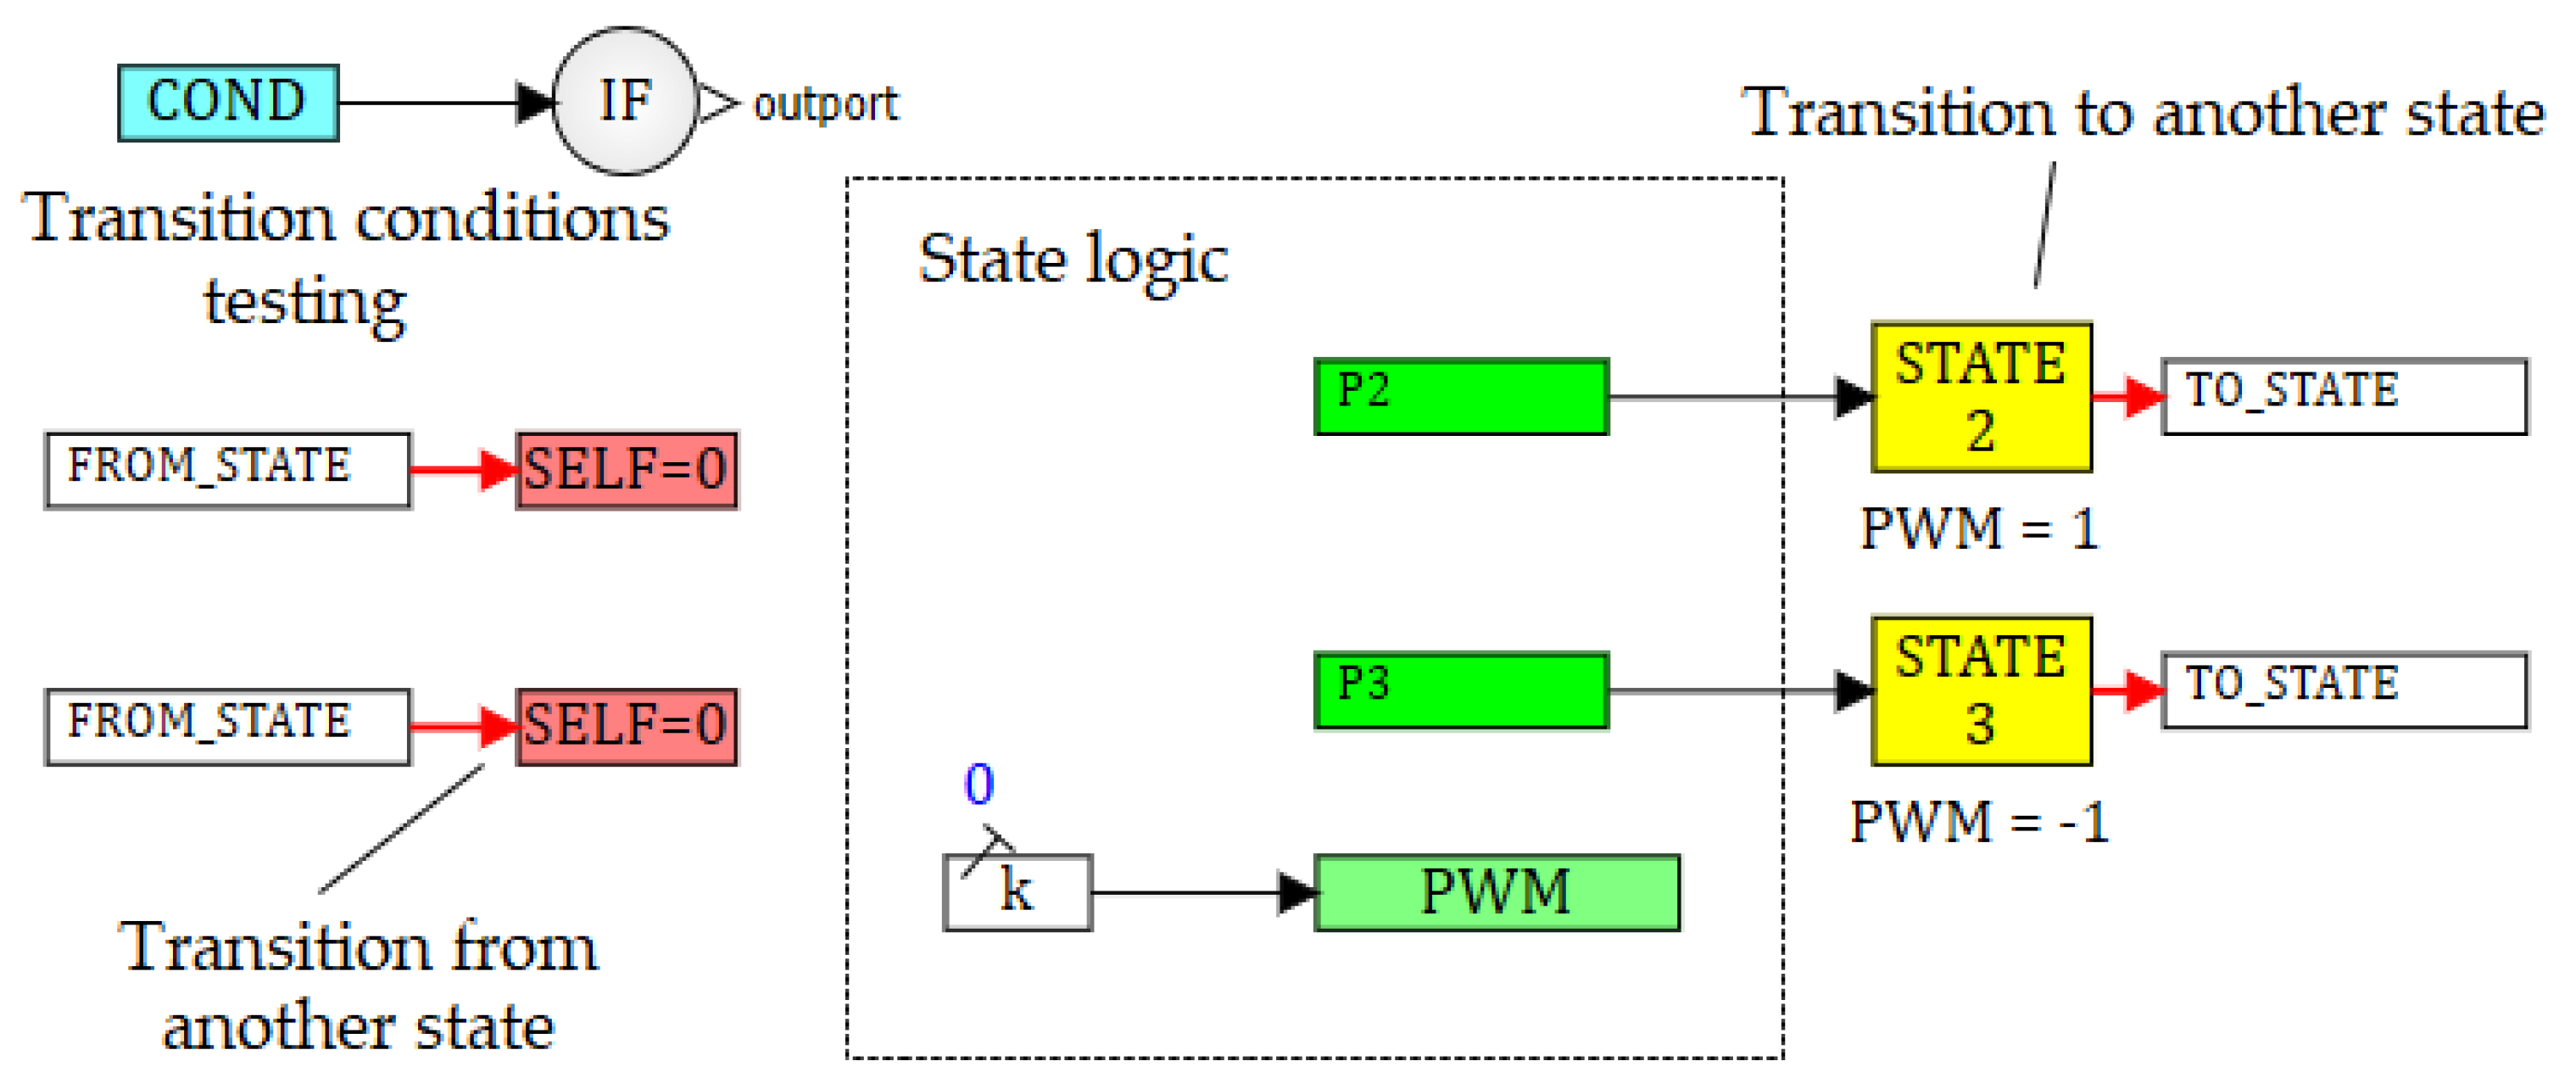
In accordance to the rules in (11), the software model includes conditions for the transition to a state
. For example, the condition expression for the predicate
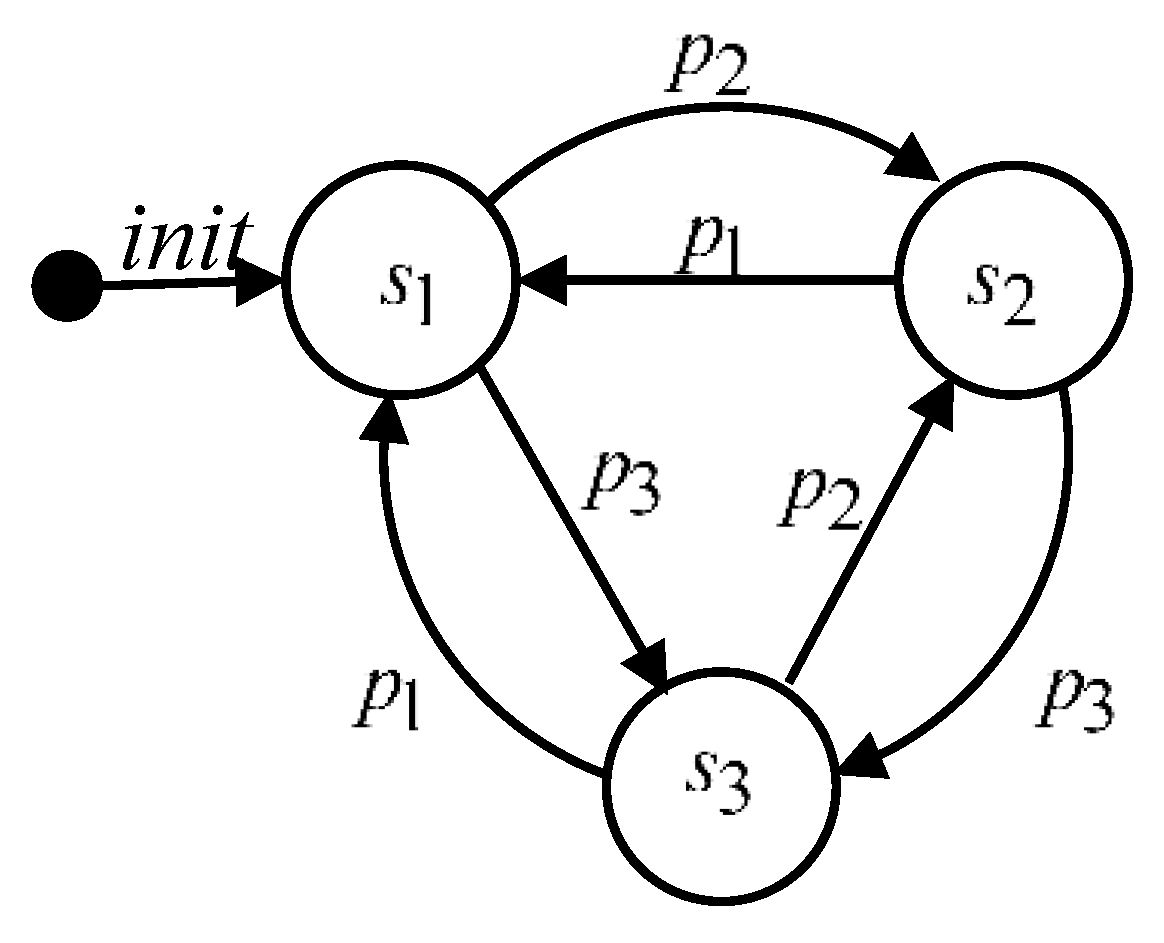
from the system (9) is written down in square brackets in the line 6 (
Figure 3). Taking into account the condition (3), let’s find the predicate
for the state
in the following form:
where
J is the adjacent states for the state
.
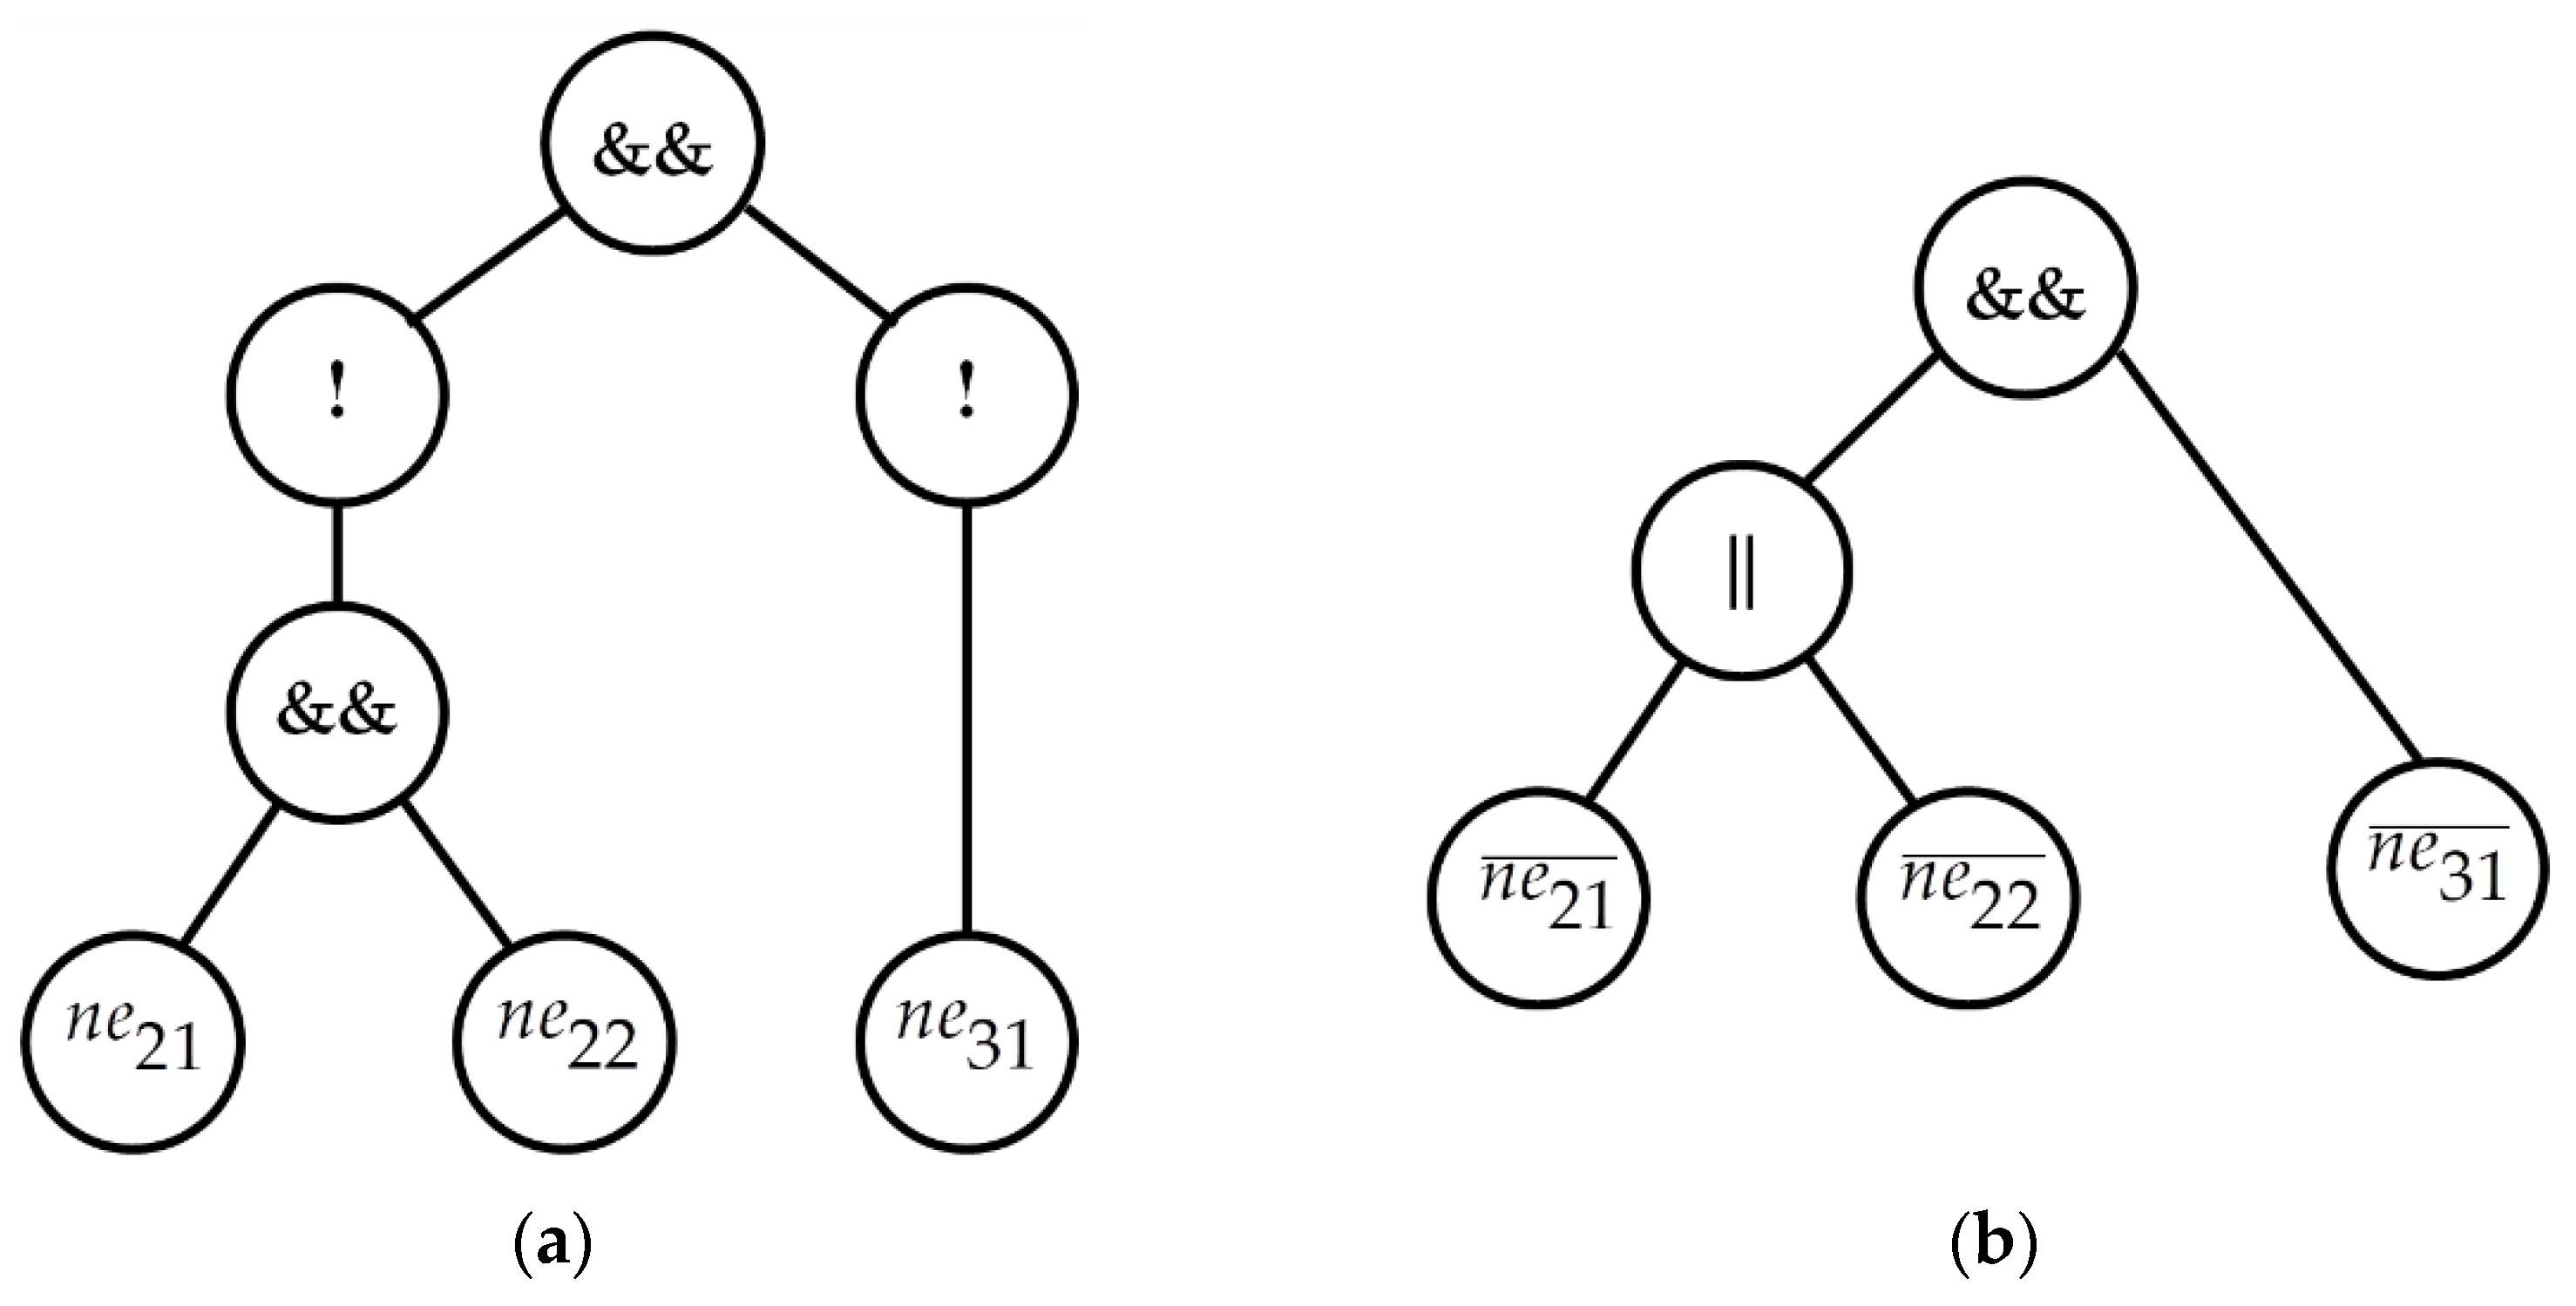
Based on the syntactic tree, which was built while analyzing the software model, and its semantic attributes, the syntactic trees for the predicates in every state of the system are constructed in the ISMA. An n-ary tree is built with the root corresponding to the conjunction operation. The root has n descendant nodes, where n is the number of adjacent states for the current mode of the hybrid system. All outgoing branches contain a vertex, corresponding to the logical negation (inversion). This vertex is the root of the syntactic tree, built for the predicate . Next, the syntactic tree is modified in a way that inversion operations are applied only to inequalities (11). De Morgan's rules for transforming logical expressions are applied here. The syntactic tree is top-down traversed, and for every node the transformations are applied according to the following recursive rules (Algorithm 1):
Algorithm 1. The mode behavior predicate transformation.
Step 1. If the tree node matches the inequality (inequalityExpression), the traverse is stopped. If the inversion operation indicator was set, the inequality sign is replaced by the opposite one.
Step 2. If the tree node matches the logical negation operation (‘!’), the inversion operation indicator is set to the descendant vertex. Resetting the indicator reverses the inversion, if negations are consecutive. The current node is excluded from the tree, the connection between a parent node and descendant one is built.
Step 3. If the tree node matches the conjunction operation (‘&&’) and the inversion operation indicator is set, the conjunction operation is replaced by the disjunction (‘||’). A new vertex with logical negation (‘!’) is added to all outgoing branches. The inversion indicator is reset.
Step 4. If the tree node matches the disjunction operation (‘||’) and the inversion indicator is set, the disjunction is replaced by the conjunction (‘&&’). A new vertex with logical negation (‘!’) is added to all outgoing branches. The inversion indicator is reset.
Computation expressions for event functions are formed based on the trees. More specifically, these structures define the rules for determining an integration step based on the event functions dynamics.
Let’s build and transform a syntactic tree for the mode behavior predicate
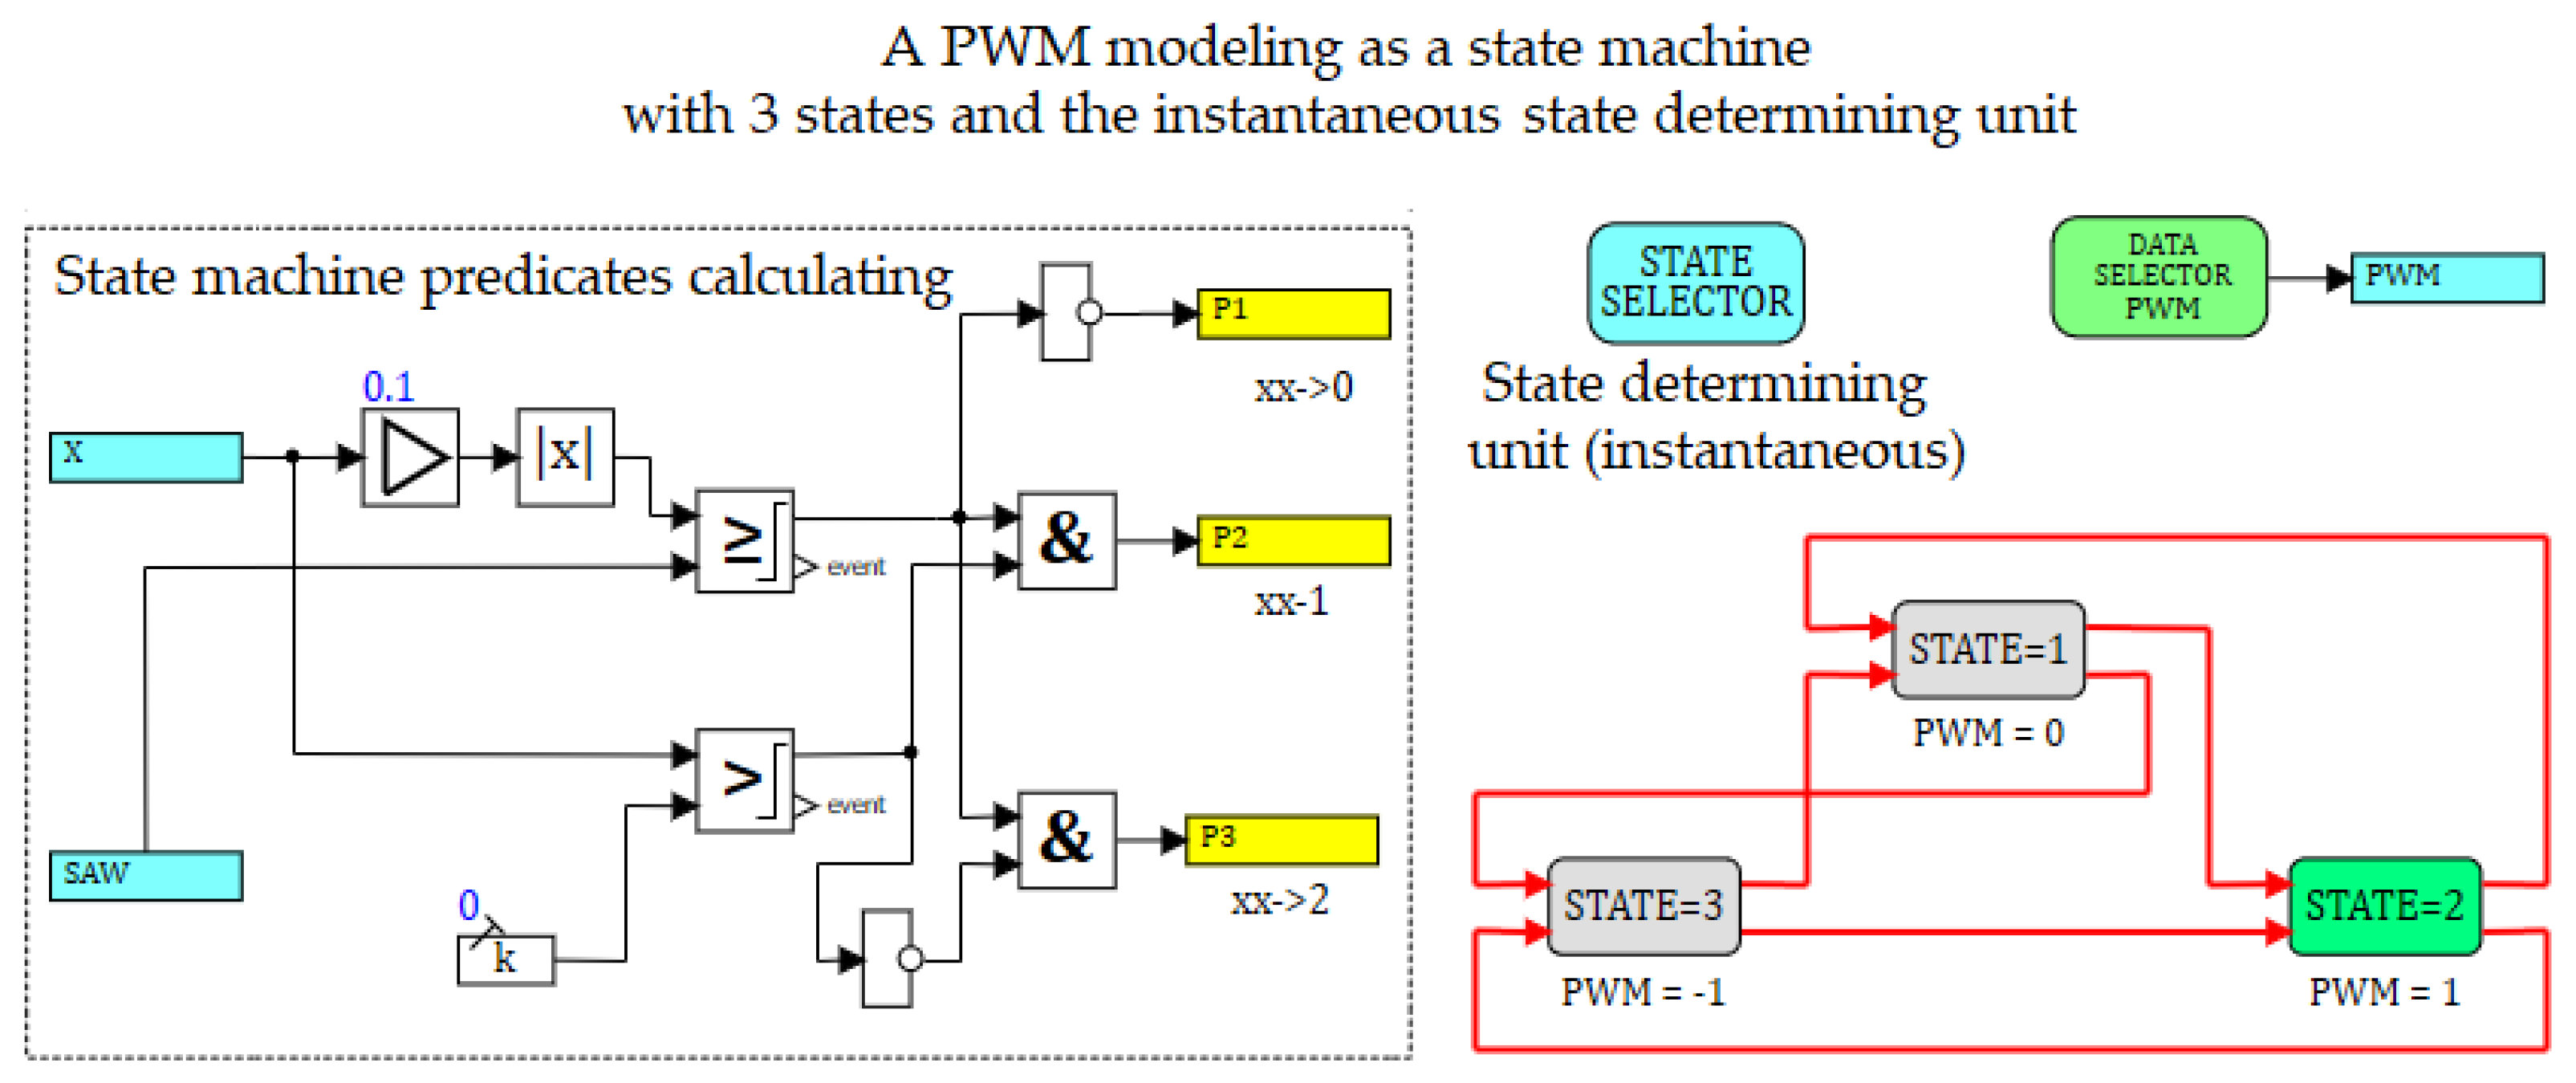
, corresponding to the state
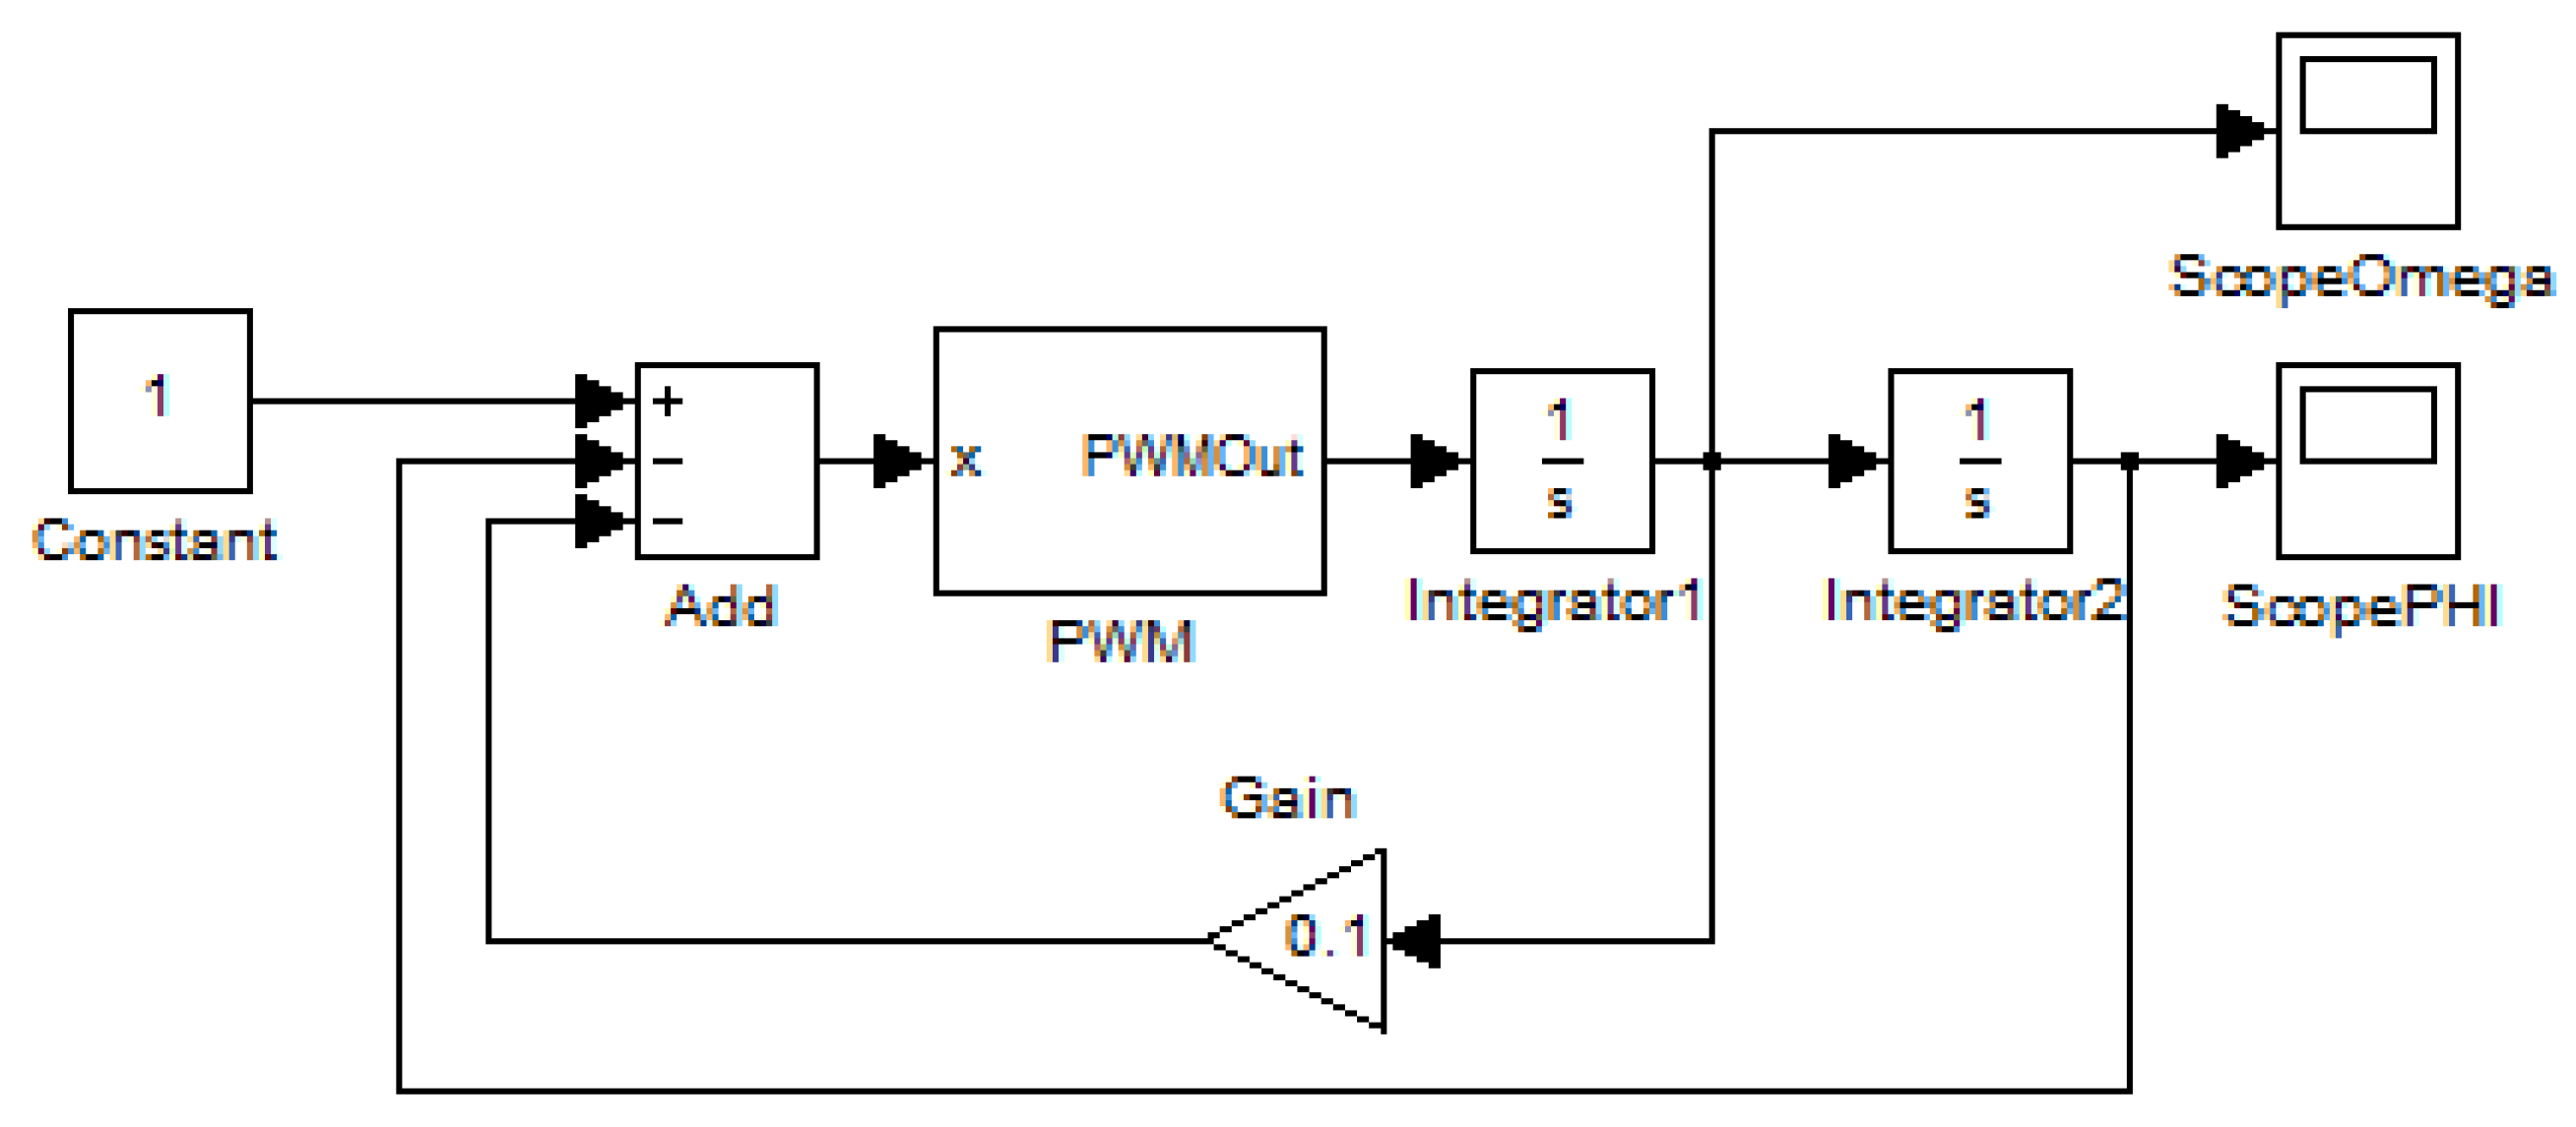
(
Figure 1) of the servo drive with the PWM controller model. Applying equations (12), we get
. Let inequalities be denoted as:
then
. The basic syntactic tree is shown in
Figure 12, a. After the transforming process, according to the Algorithm 1, the tree presented in
Figure 12, b is formed, where
The following algorithms are connected with the integration step determining, which is dependent on event functions dynamics. Let the mode behavior predicate for the state
be like
, i.e. the syntactic tree consists of the only inequality
. And the
nth step of numerical resolving the Cauchy problem (2) is performed, the value for the right side of the differential equation
is calculated. Besides, the value of the next integration step
is determined by the numerical integration algorithm. Then, according to the theorem of calculating the integration step for asymptotic approaching to the mode limit [
8], the integration step can be limited by the value, determined by the following algorithm.
Algorithm 2. Determining an integration step for one-sided events detection.
Step 1. Calculate .
Step 2. Calculate .
Step 3. Calculate .
Step 4. Calculate .
Step 5. If , let and go to the next integration step.
Step 6. Calculate the ‘event step size’ as .
Step 7. Compute the step size and go to the next integration step.
In Step 5 the event function derivative is determined. As the event function approaches the event surface, is positive, and, as it moves away from the boundary , becomes negative. Then, once the event function course has been determined, no additional constraints on the integration step value have to be imposed, if the event function moves away from the mode surface.
Let be the value of the integration step determined by the discussed algorithm. In general, as it was shown earlier, the condition for the system staying to the might be a complex logical function depending on the set of inequalities , where and . If each of the inequalities has the form , the Algorithm 2 allows to obtain a set of values for the integration step .
Let the syntactic tree be built using Algorithm 1. Then the value of the integration step can be determined at each stage of the calculating the mode behavior by the following recursive Algorithm 3, while traversing the tree nodes.
Algorithm 3. Determining the integration step in case of a set of event functions.
Step 1. If the tree node matches an inequality (inequalityExpression), the tree traversing is stopped. The integration step value, obtained by the Algorithm 2, is returned.
Step 2. If the tree node matches the conjunction operation (‘&&’), the algorithm for the step determining is called for descendant nodes. The minimal value from all those calculated is returned.
Step 3. If the tree node matches the disjunction operation (‘||’), the algorithm for the step determining is called for descendant nodes. The maximum value from all those calculated is returned.
The Algorithm 2 is justified by the requirement of the event function for the mode behavior having negative value. Using the Algorithm 3, it may turn out that event functions, evaluated at the step 1, are non-negative. It means, that at the current moment the corresponding predicate does not cause changing the system state, therefore there is no need to call the Algorithm 2. In this case, the Algorithm 3 does not limit the step value.
Let’s illustrate the Algorithm processing while calculating the ‘event’ step in the state 1 of the servo drive with the PWM controller model. There are the following conditions: , , . The event functions, corresponding to the conditions, are , , . Then the step value is determined by the formula .
9. Calculation and Simulation
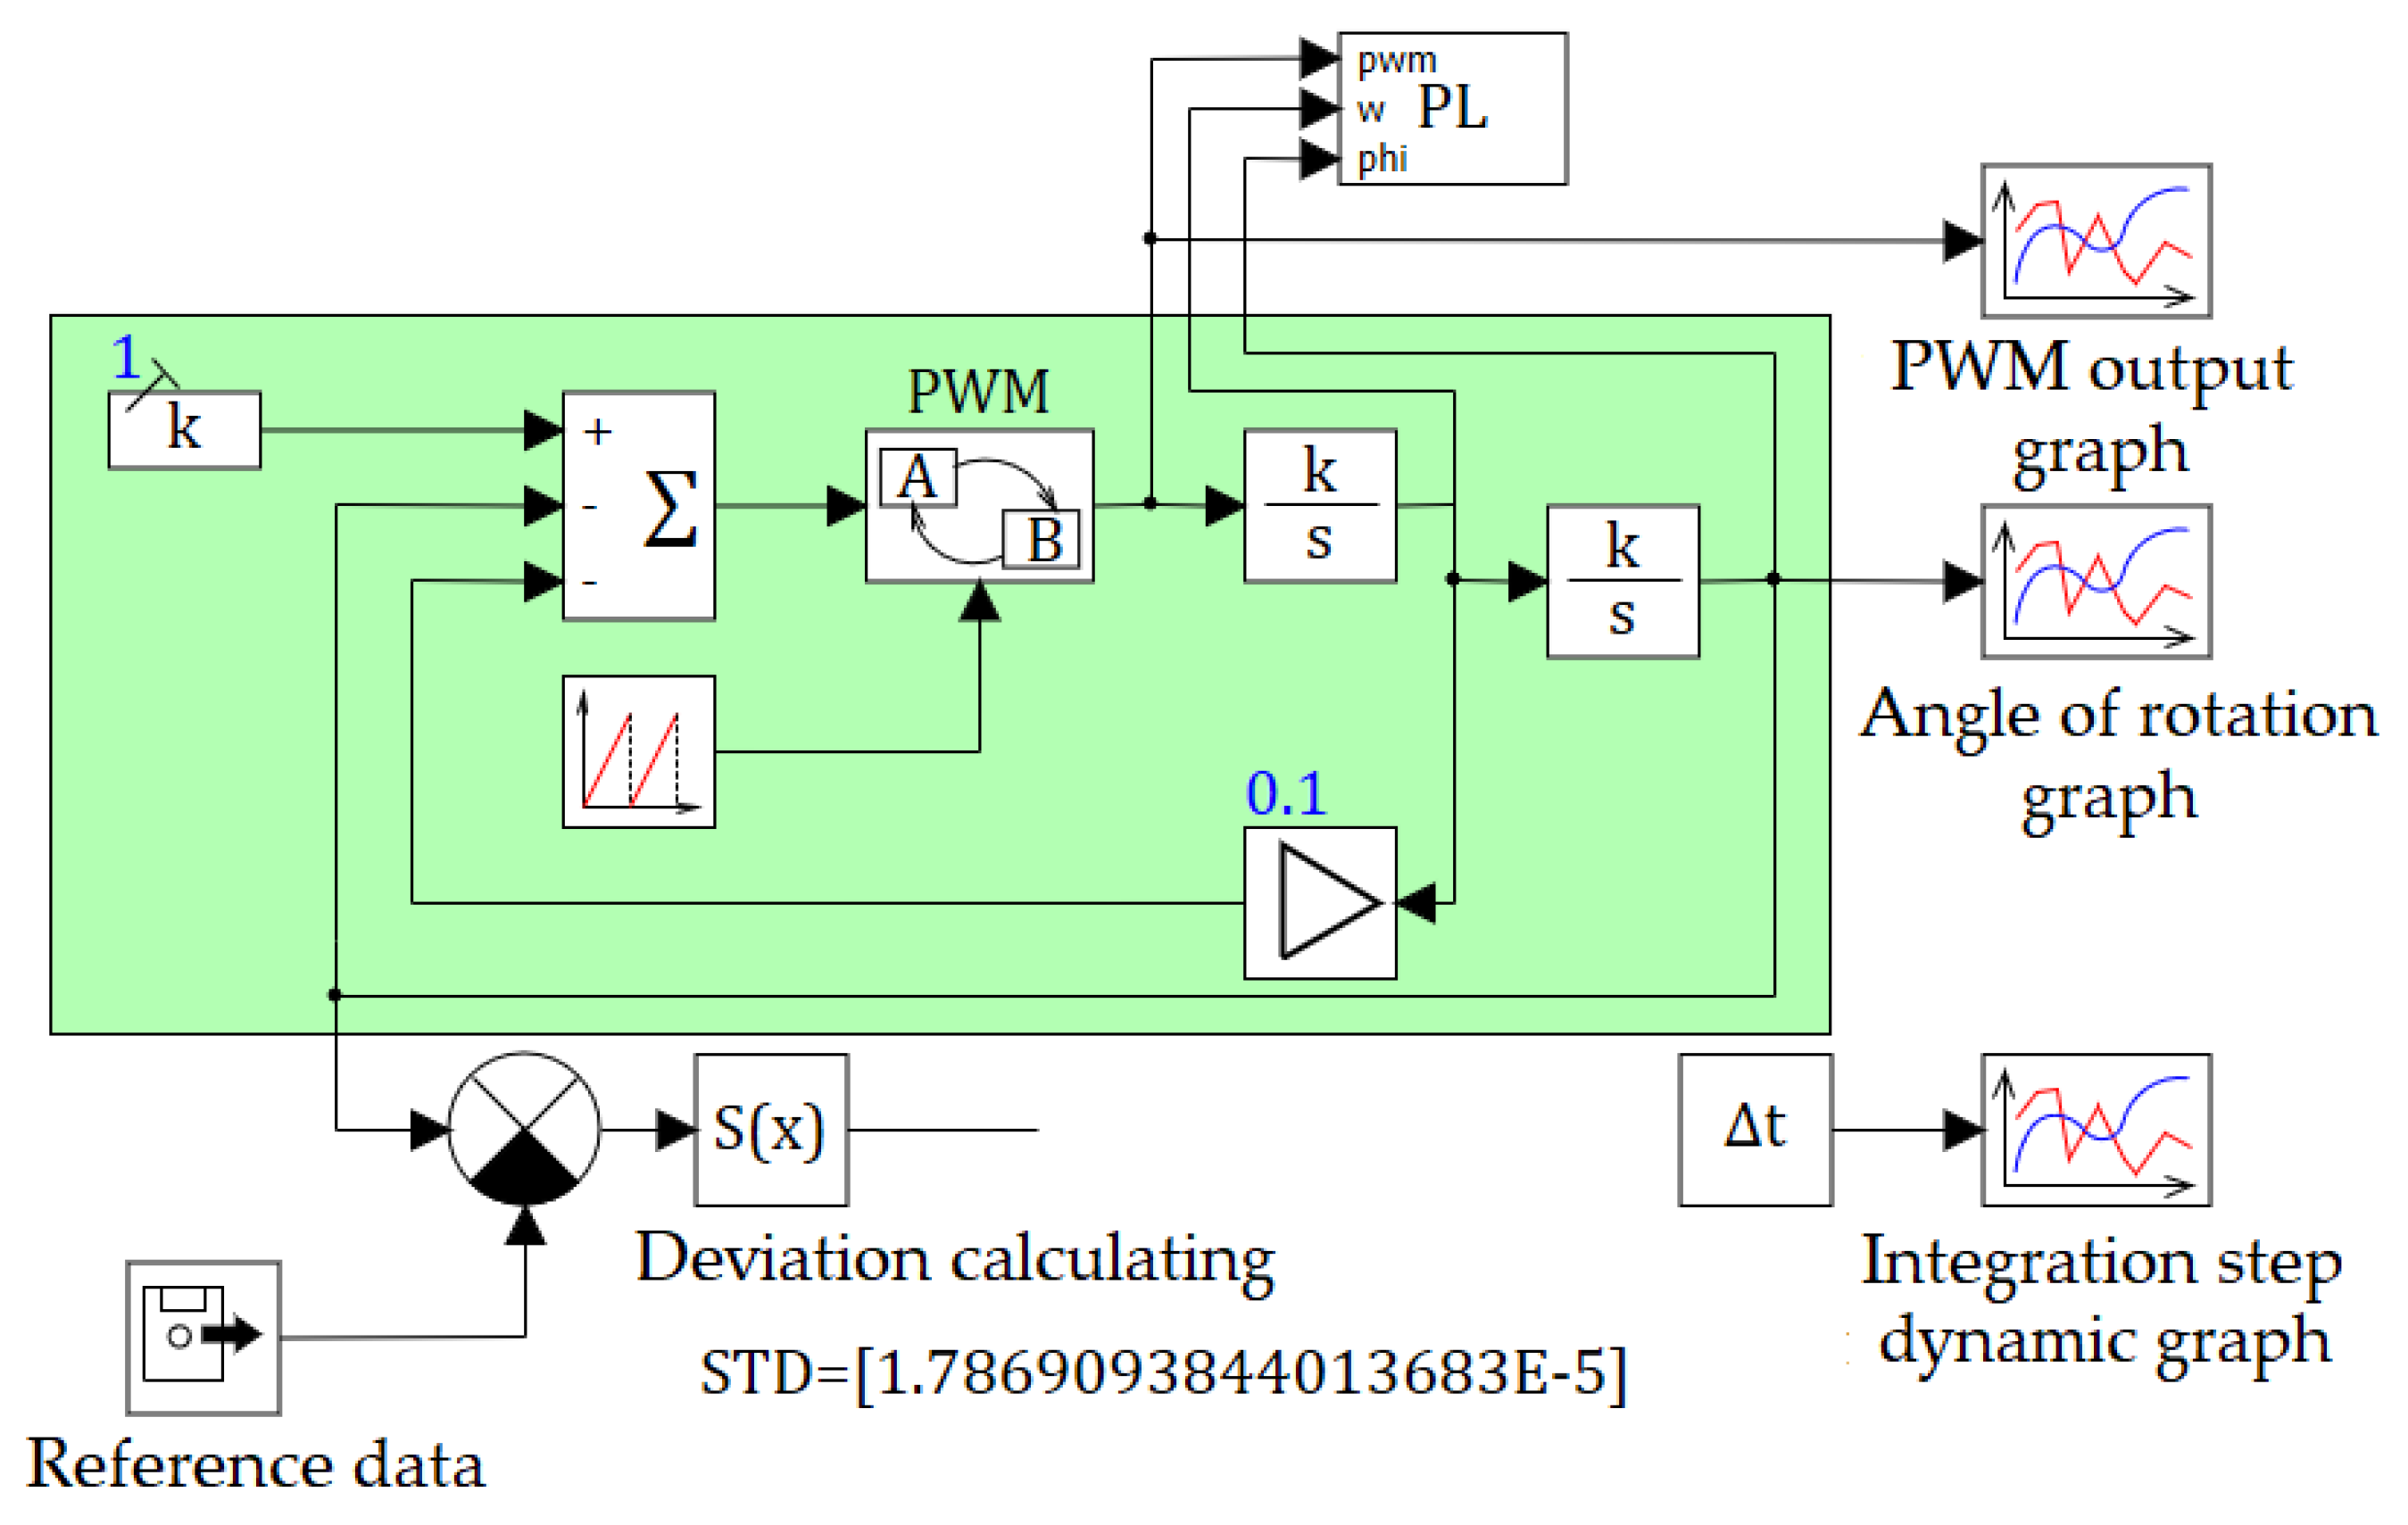
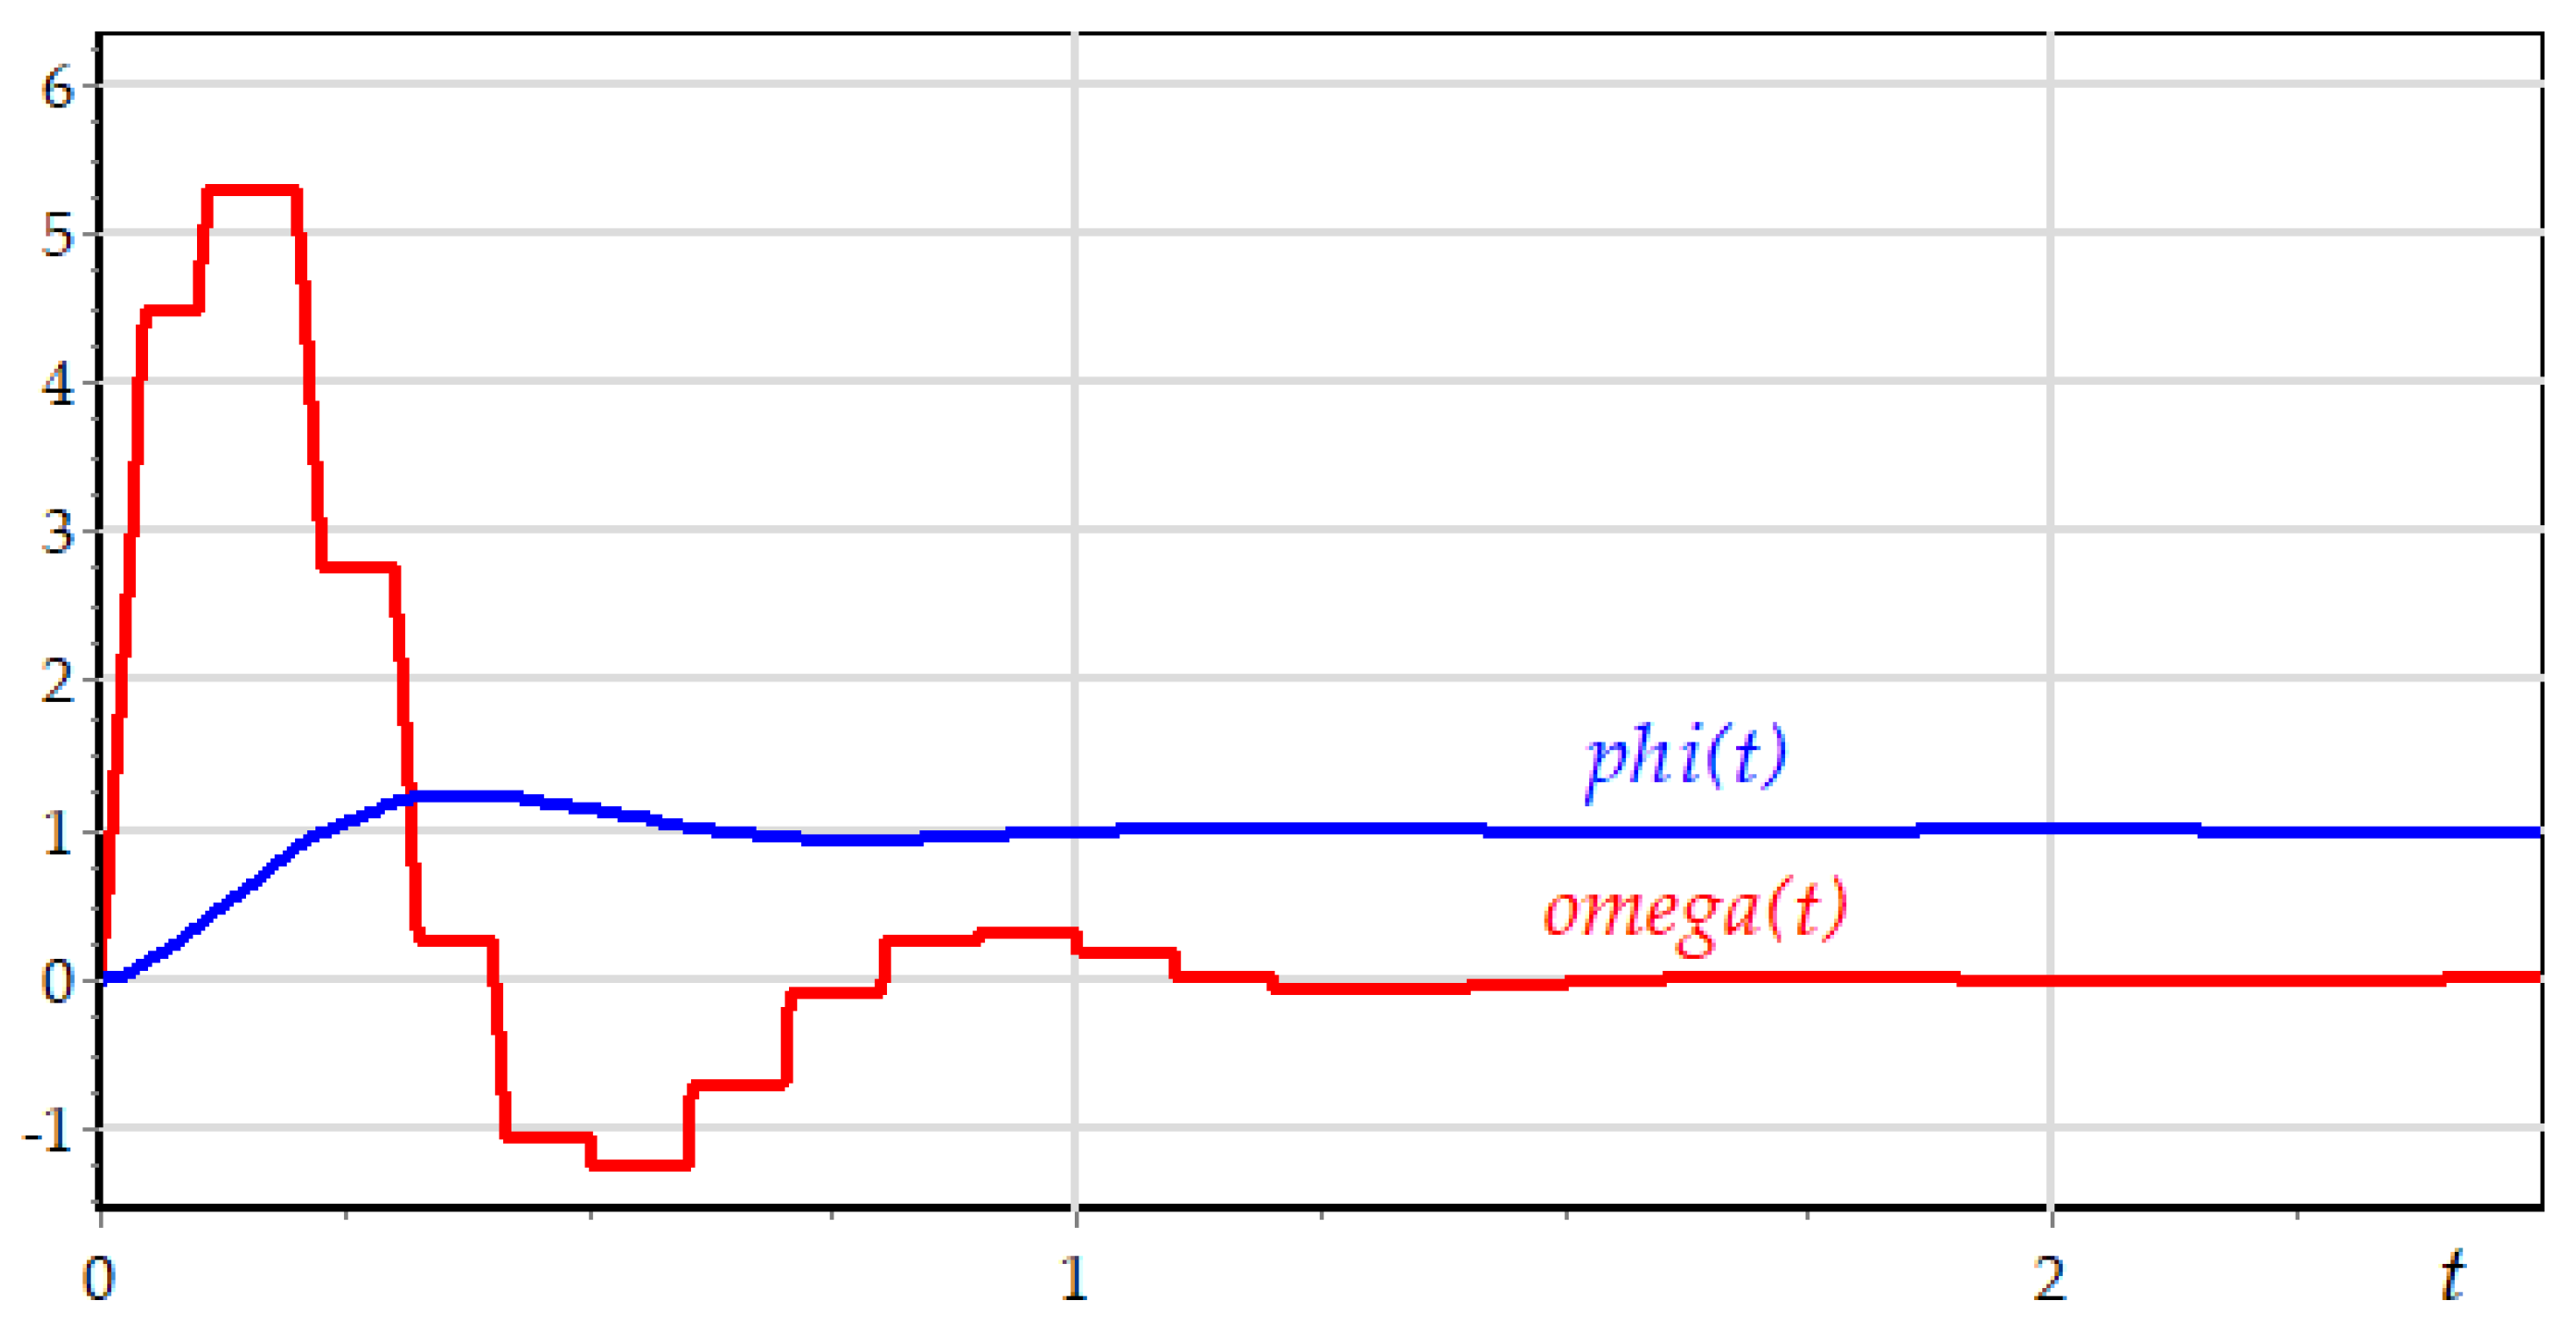
The second stage in computer modeling is implementing software models, designed at the first stage of specification. Applying various integration techniques and developed event detection algorithms, included into the libraries with numerical methods in the considered simulation platforms, for numerical computing (4) – (8) resulted in qualitatively identical solutions for phase variables
and
, as presented in
Figure 13.
The STEKS (5,4) technique [
23] combined with the algorithm for asymptotic event detection, the parameter
[
8], was used for calculations in ISMA. The adaptive algorithm ARK [
24] and the invented technique for intersections detecting [
15] with the step value refining for the signal sources and discrete units were applied in SimInTech. The integration method ode45 (Dormand-Prince) [
3,
9] with the algorithm for switching detection for all of the model units [
25] was applied in MATLAB. The integration technique Explicit RK23 Solver [
13] with double-sided event detecting was used in Ptolemy II.
Let’s evaluate the accuracy of the problem solutions in ISMA, SimInTech, MATLAB and Ptolemy II, taking into account using original libraries with numerical techniques and detection algorithms. Before the experiments, the exact moments of events generating and corresponding values of phase variables
and
for the initial system of equations (4) were obtained by the analytical fitting the initial conditions. The summary data on the calculating error for the first and seventh events are presented in
Table 1, where
is the exact time of the event
,
is the obtained time,
– the exact value of the angular velocity,
– the calculated value of the angular velocity,
– the exact value of the angle of rotation,
– the calculated value of the angle of rotation. Computing was carried out with the given accuracy
, that is commensurable with the error of the integration techniques applied.
The model in MATLAB demonstrates the most accurate results. But it does not comply with the condition of the event one-sidedness [
10], as it is presented in the table. The values of phase variables in detection points are calculated with the comparable accuracy using tools in SimInTech and ISMA. The largest calculating error is obtained in Ptolemy II by the double-sided detection method [
13]. The detection technique in ISMA differs from the others mentioned, since it meets the requirement of one-sidedness [
8,
10], and the integration step is calculated in accordance to the condition of asymptotic approaching to the mode limit. The algorithm is based on linear extrapolation of the event function and limiting the event function dynamics at the next step, the function can change its value not more than in
times [
8]. As a result, the discreteness of the system behavior representation in the vicinity of the mode limits is increasing. The accuracy of this representation is defined by the minimal value of the integration step, which in this case is equal to
.
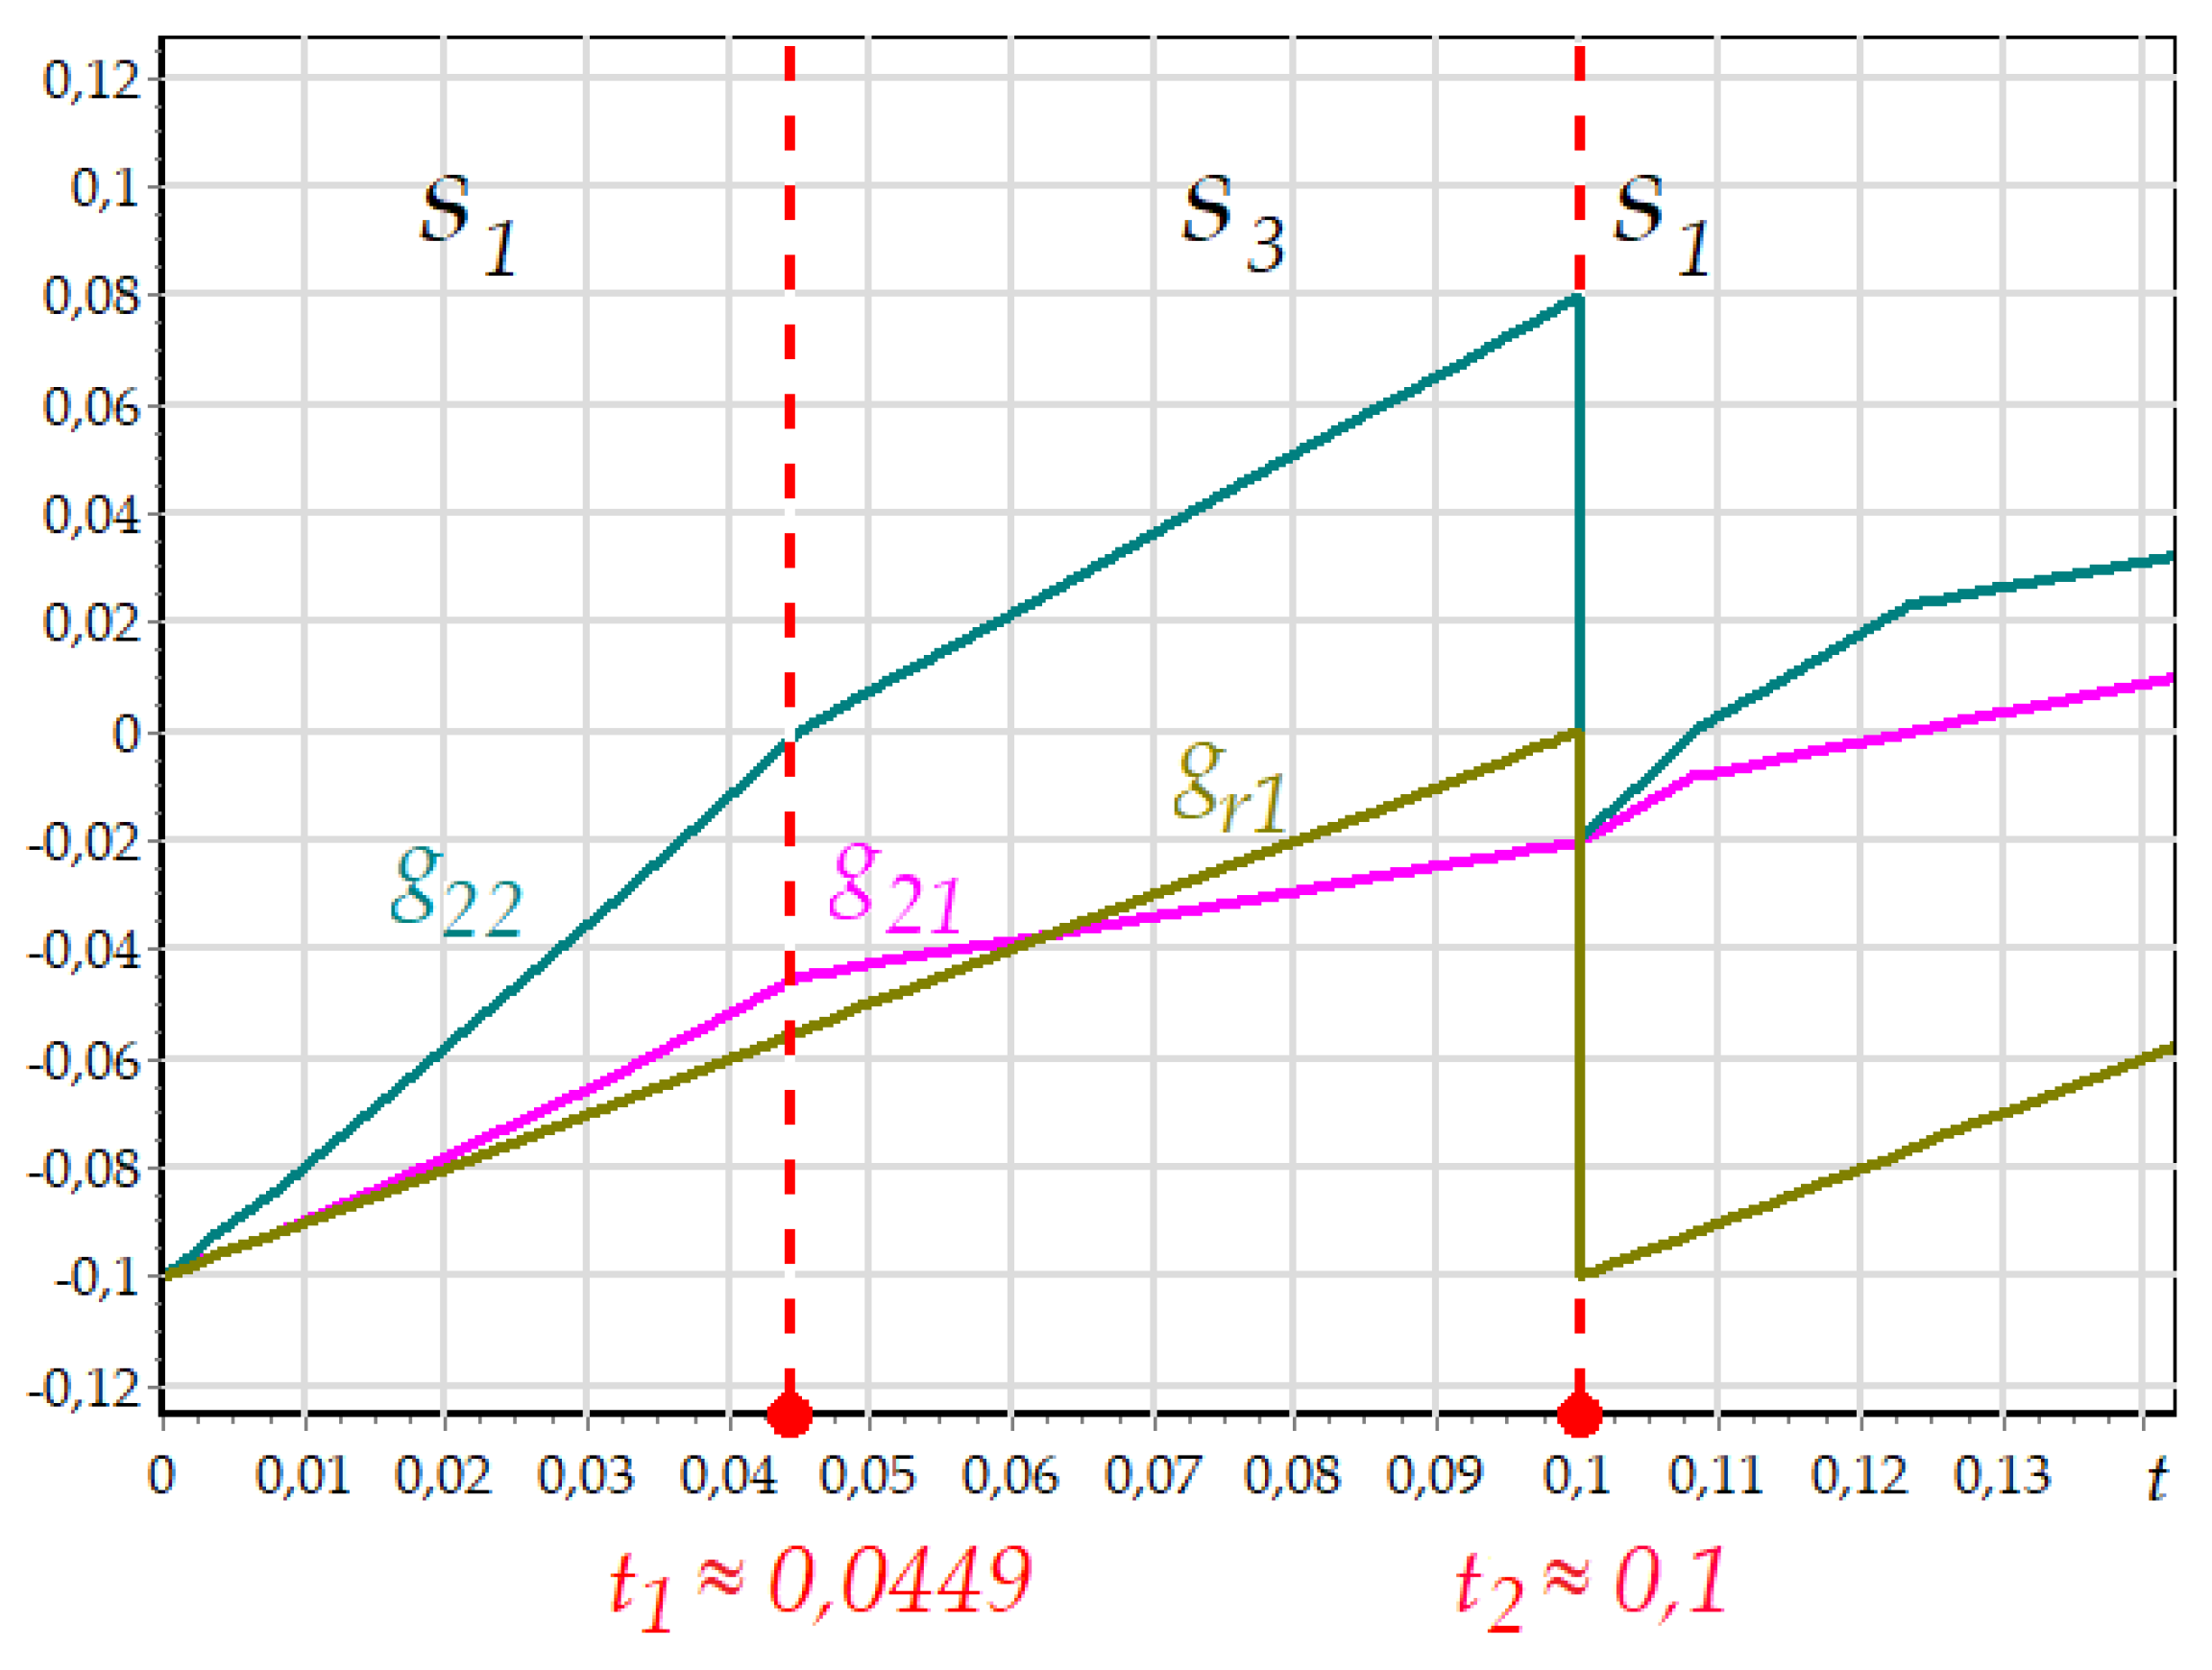
Let’s analyze the dynamics of event functions.
Figure 14 demonstrates the graphs of event functions
, that determine mode shifting in the interval
. At first, the system is in the state 1 (
), then, in
, the transition to the mode (state)
is made, after that, in
, the system returns to
. The further transitions and state changing are not considered, although two more shifting can be seen in
Figure 14.
There are three event functions for the first state:
,
,
. The system is in the state
in the interval
, but the event function
does not affect the mode shifting, since
. This graph is not presented in the figure above. As a result, the integration step calculating is dependent on the dynamics of the functions
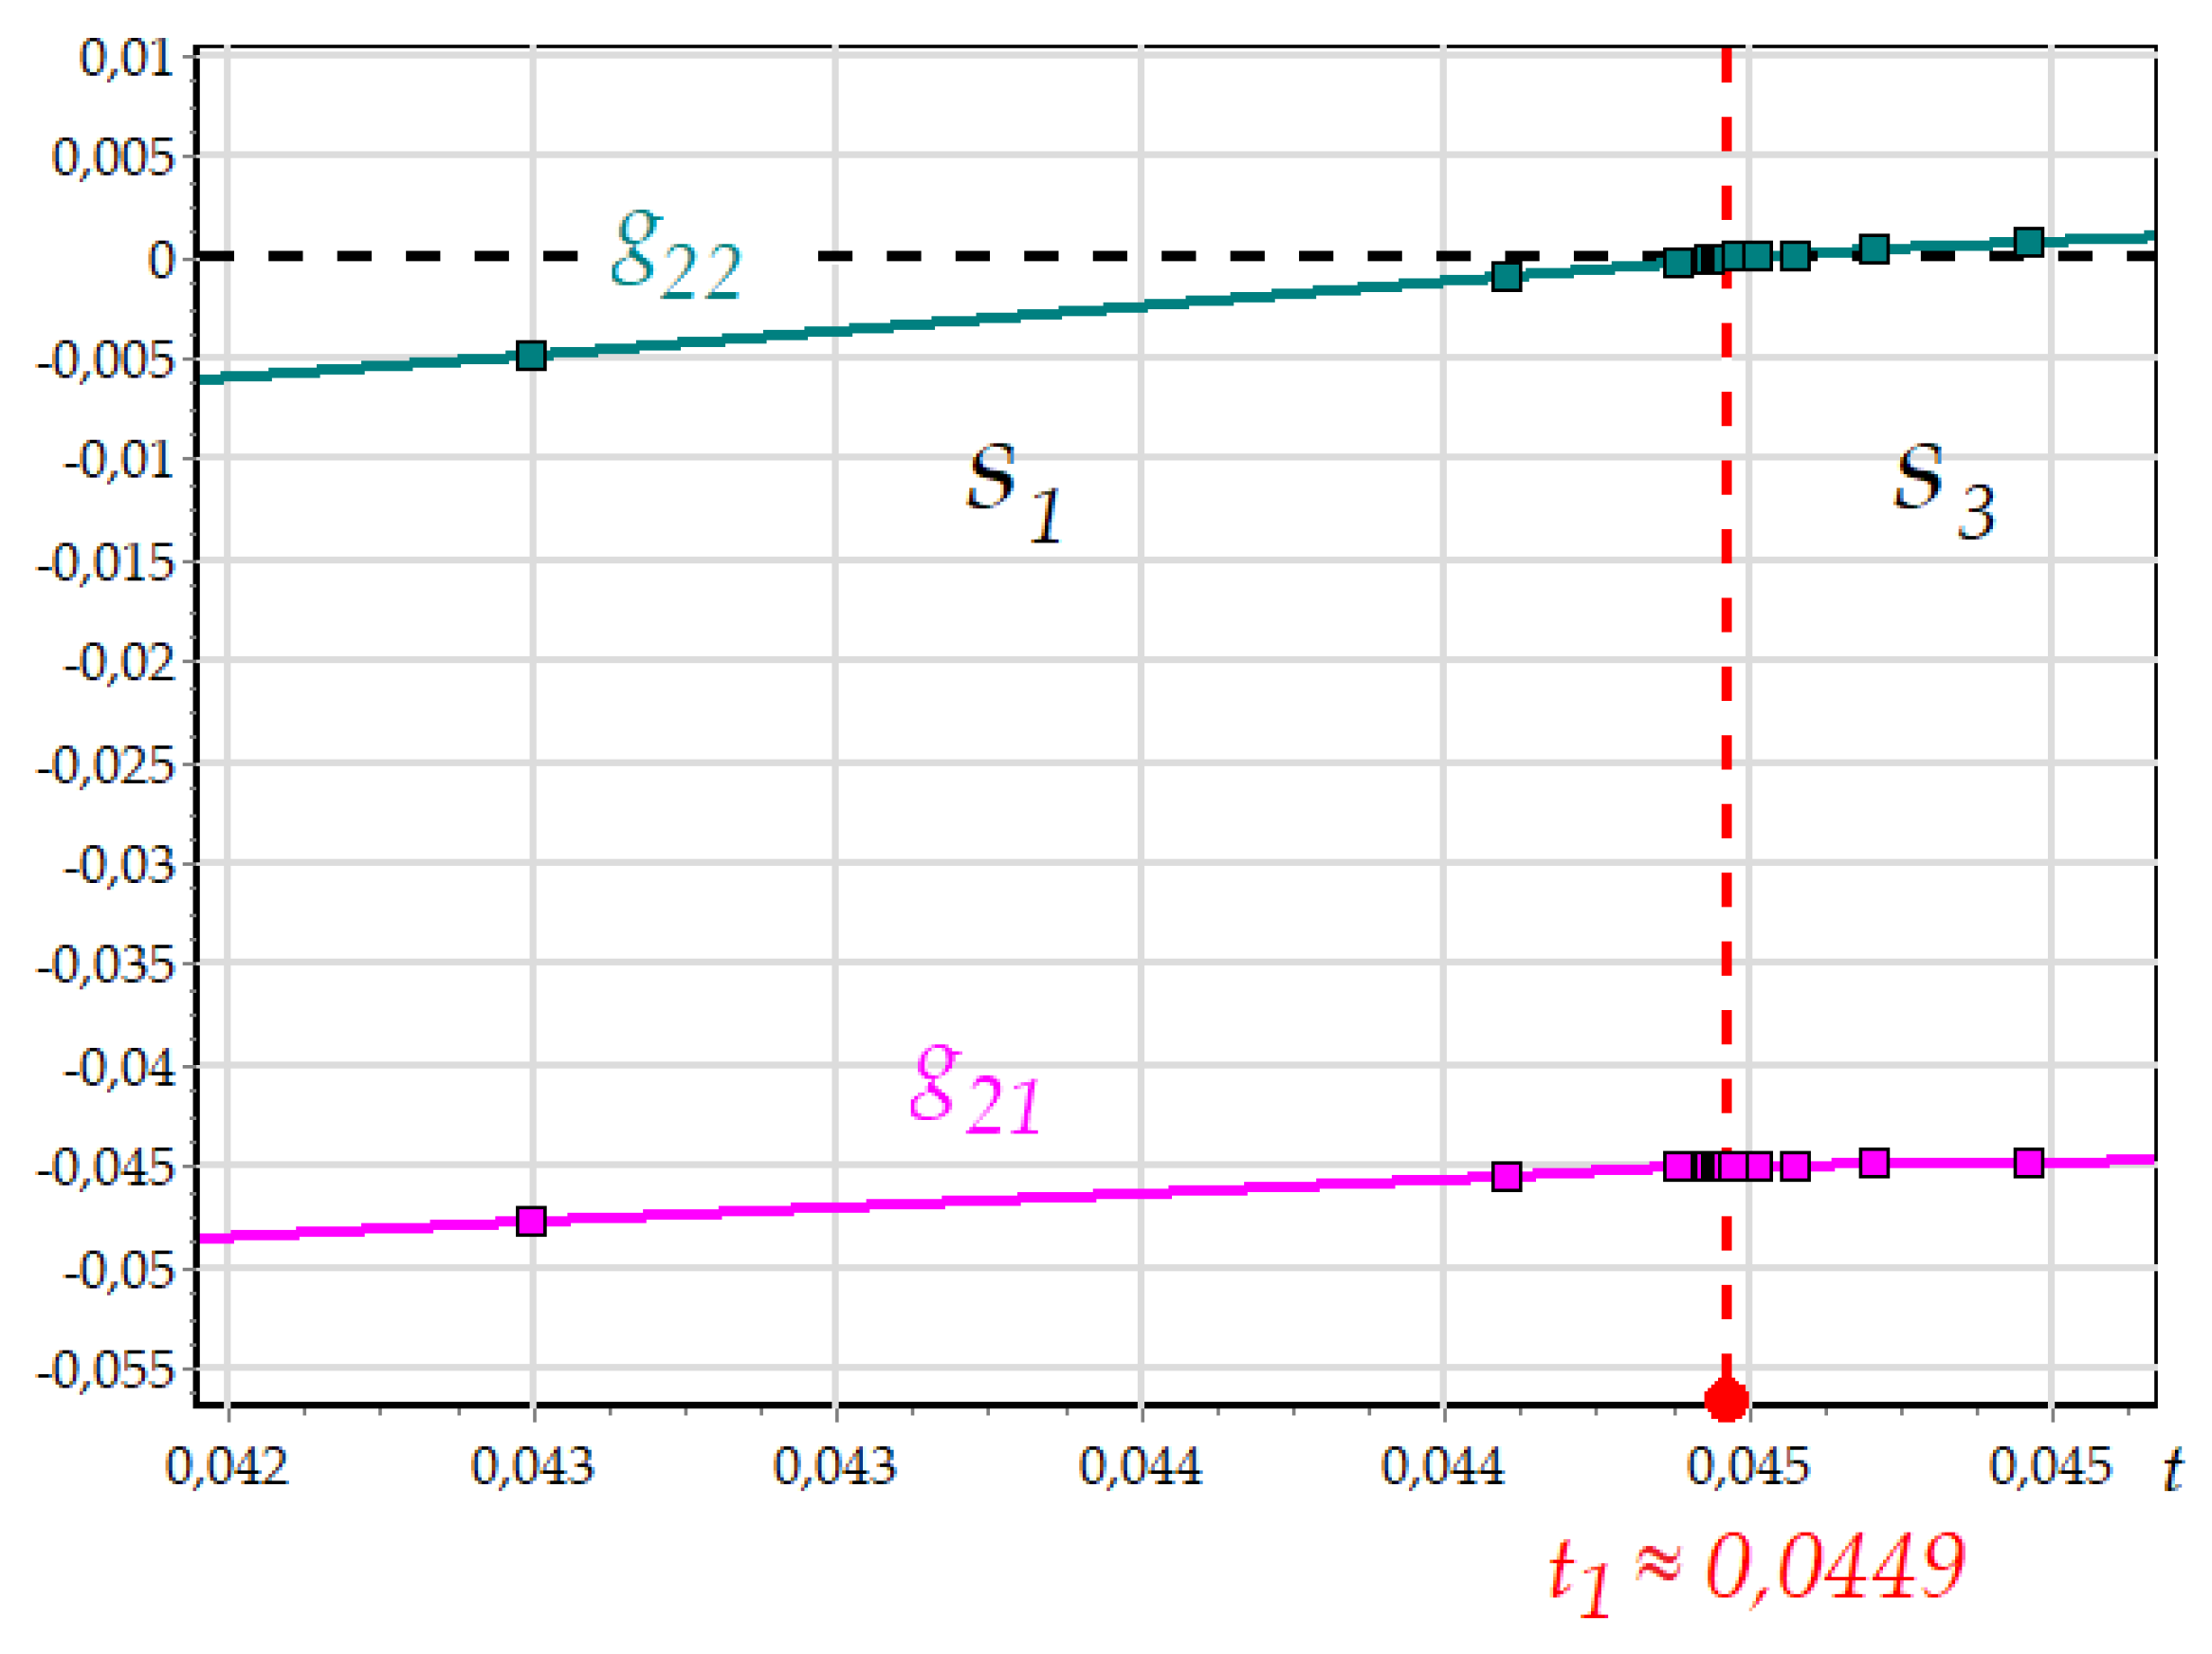
and
. The
Figure 15 shows the enlarged fragment of the graph in the vicinity of the moment
.
Since the event function
changes faster than
, the algorithm for the integration step determining uses the value
for asymptotic approaching to the mode limit. The step decreasing, while approaching to the mode limit, is shown in
Figure 15. As soon as
, the condition
from (9) is met, the system switch to the mode
. After the transition, the integration step is increased, but the detection algorithm does not limit its value: the step can be limited only by the numerical integration method.
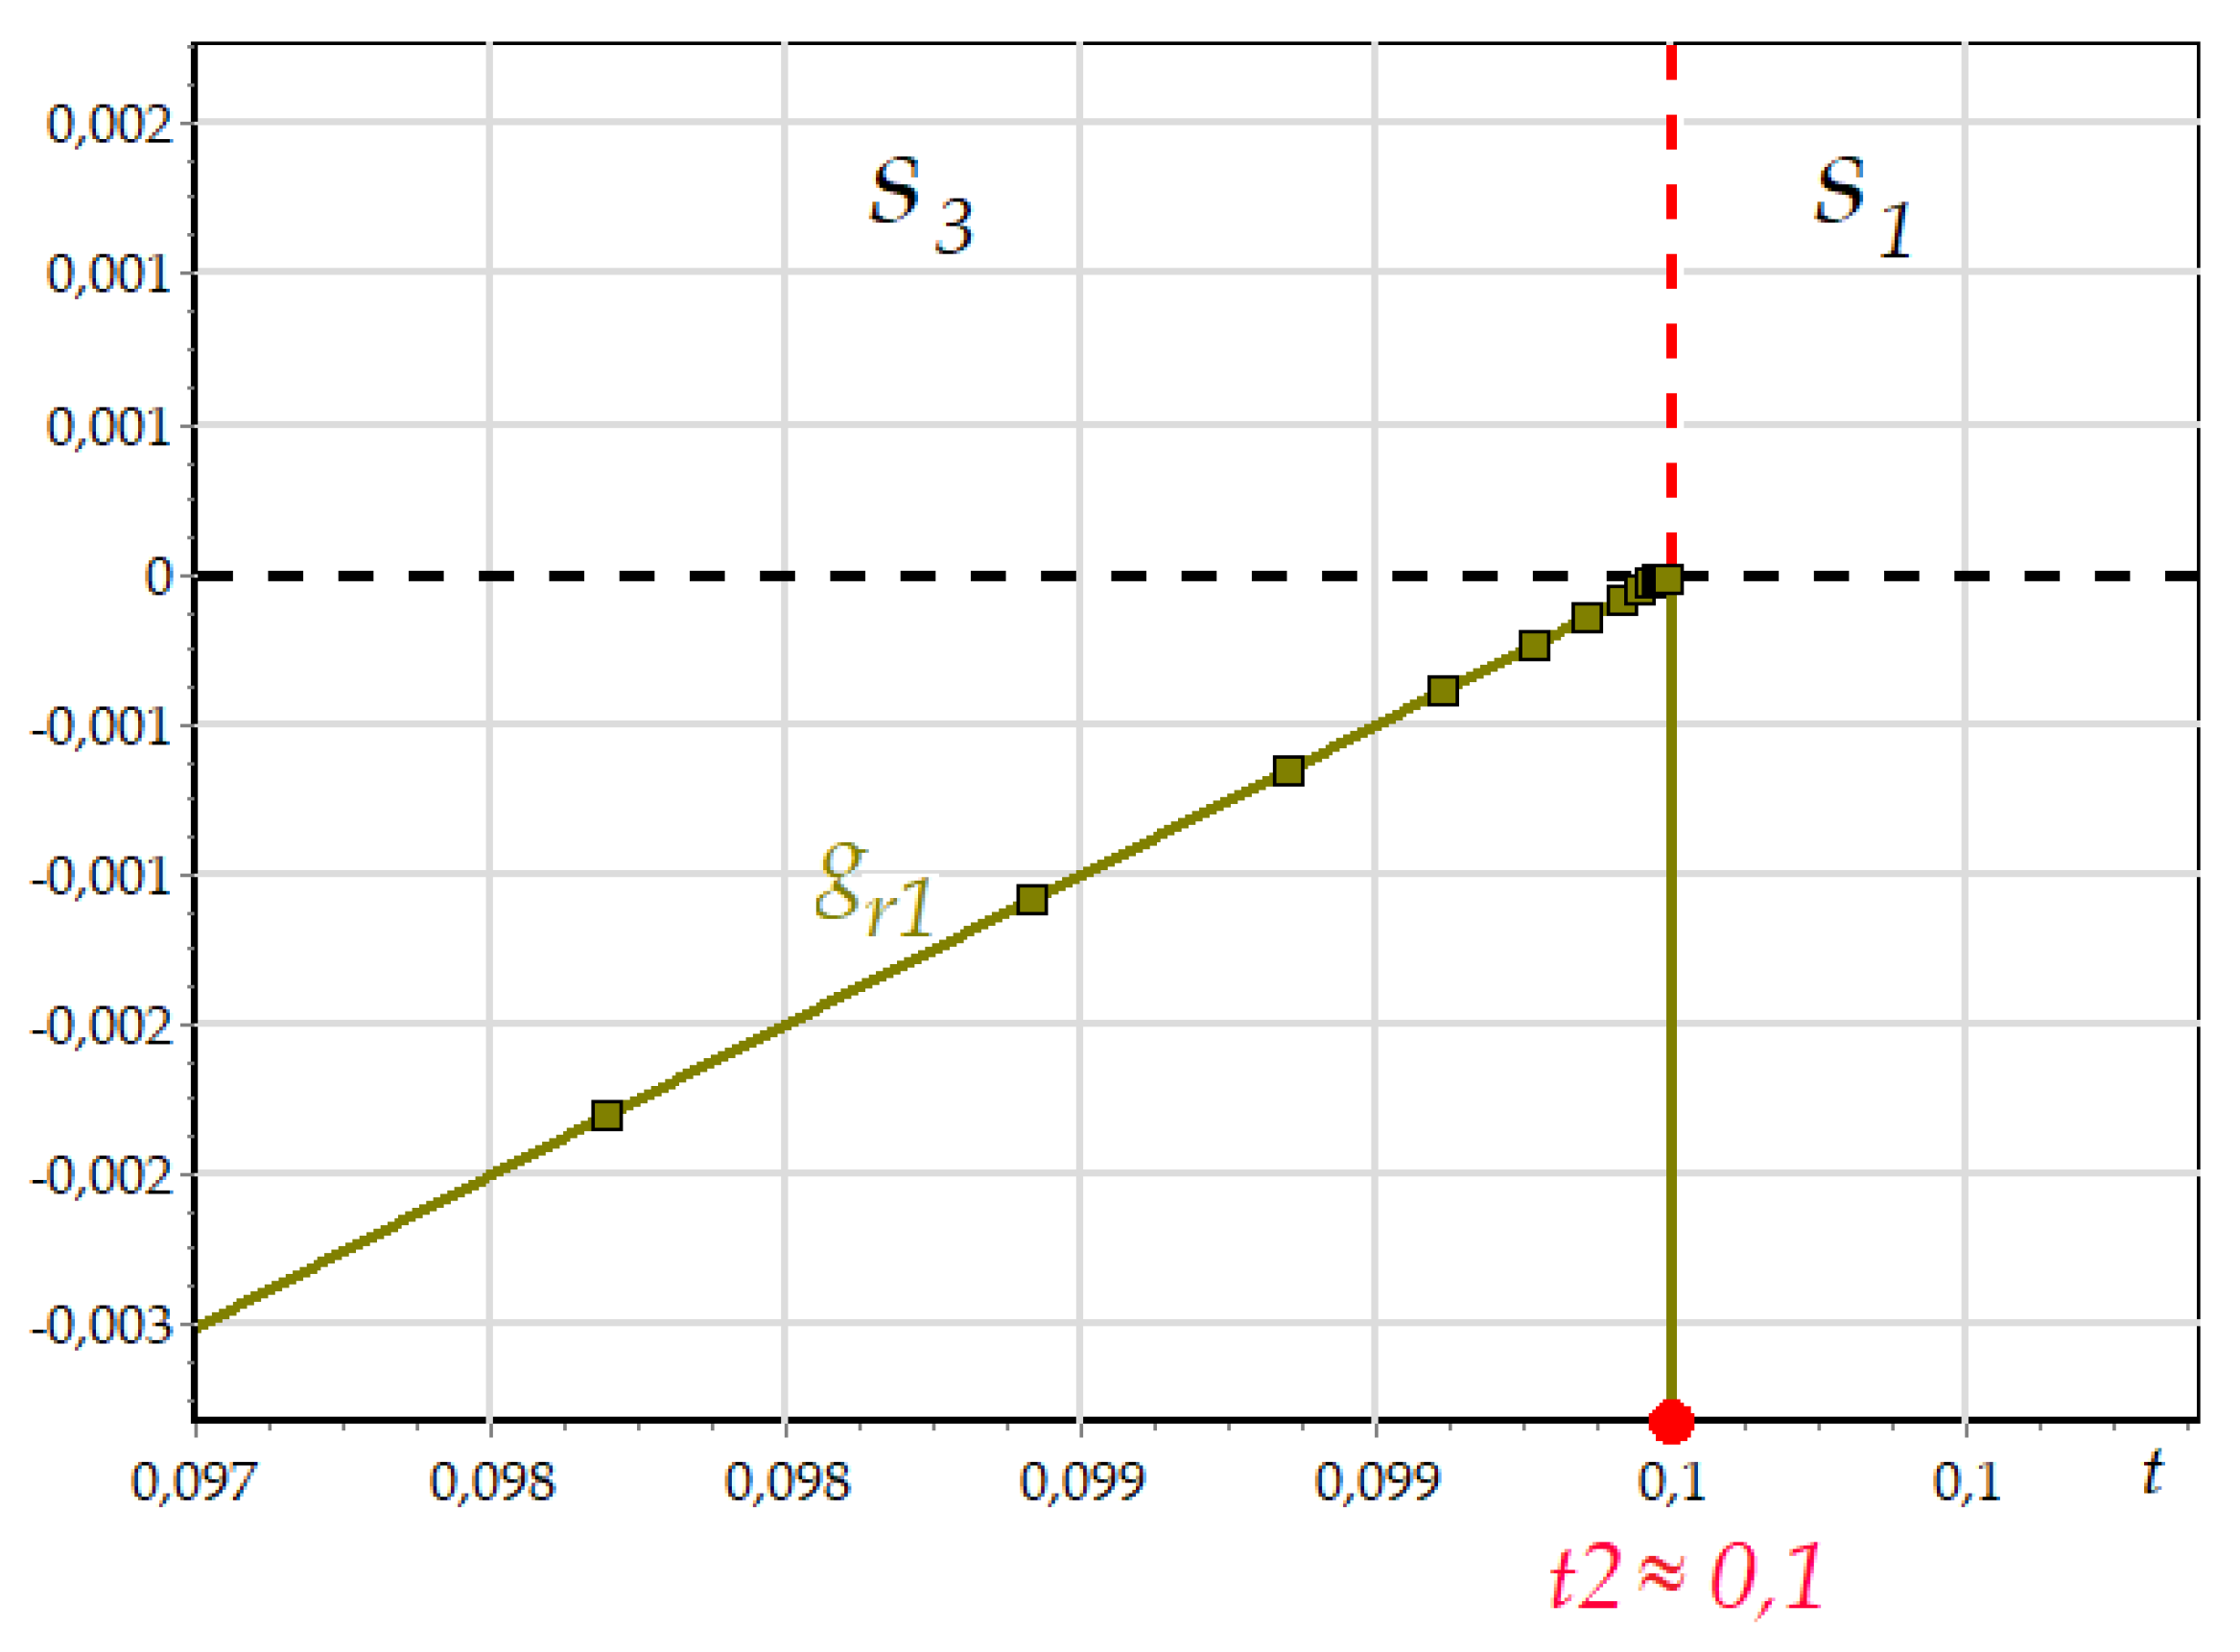
The third state has the resulting condition for the mode
, where the function
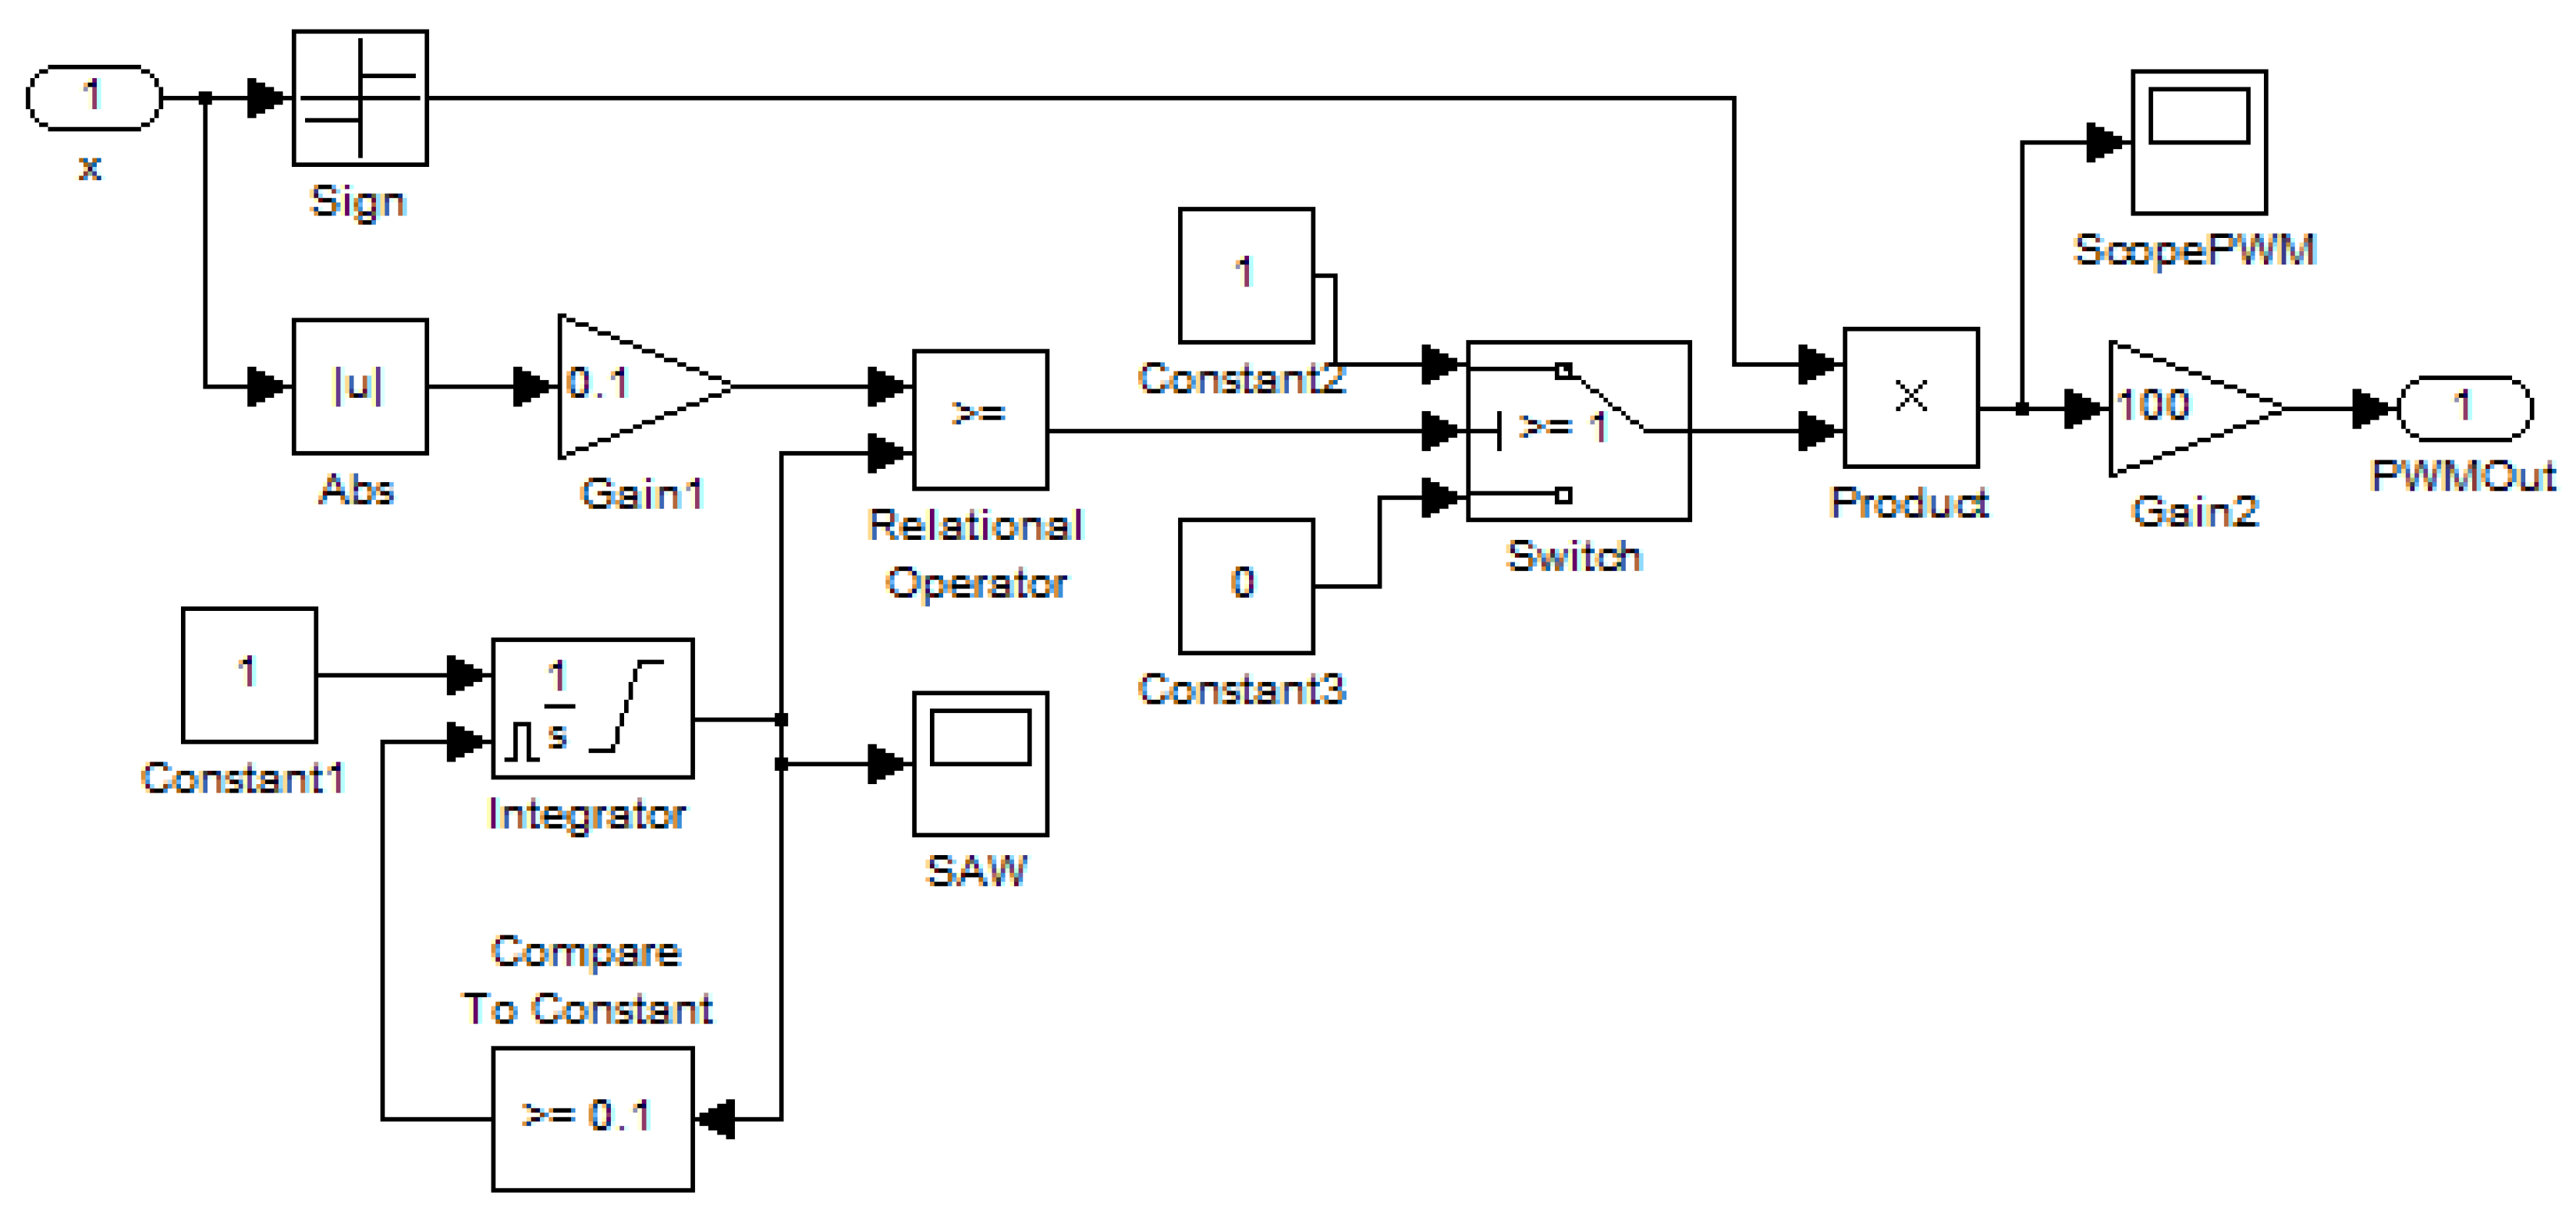
is obtained from the condition of the integrator reset (
Figure 2). The graphs of this event function are presented in
Figure 14 and
Figure 16. The enlarged fragment of the graph in the vicinity of the moment
also demonstrates the step decreasing while approaching to the mode limit. After the modes switching, the event function changes its value instantly, since the variable
saw is reset to 0. The condition
from (9) is met, and the system switches to the mode
.
