Preprint
Article

Temperature Dependence of the Thermo-Optic Coefficient of GeO2-doped Silica Glass Fiber

Altmetrics

Downloads

143

Views

89

Comments

0

A peer-reviewed article of this preprint also exists.

This version is not peer-reviewed

Submitted:

02 July 2024

Posted:

03 July 2024

You are already at the latest version

Alerts
Abstract
In this paper we derived an expression that allows the determination of the thermo-optic coefficient of weakly-guiding germanium-doped silica fibers, based on the thermal behavior of optical fiber devices, such as, fiber Bragg gratings (FBGs). The calculations rely on the full knowledge of the fiber parameters and on the temperature sensitivity of FBGs. In order to validate the results, we estimated the thermo-optic coefficient of bulk GeO2 glass at 293 K and 1.55 m to be 18.3x10⁻⁶ K-1. The determination of this value required to calculate a correction factor which is based on the knowledge of the thermal expansion coefficient of the fiber core, the Pockels’ coefficients (p11=0.125, p12=0.258 and p44=-0.0662) and the Poisson ratio (=0.161) of the SMF-28 fiber. To achieve that goal, we estimated the temperature dependence of the thermal expansion coefficient of GeO2 and we discussed the dispersion and temperature dependence of Pockels’ coefficients. We have presented expressions for the dependence of the longitudinal and transverse acoustic velocities on the GeO2 concentration used to calculate the Poisson ratio. We have also discussed the dispersion of the photoelastic constant. An estimate for the temperature dependence of the thermo-optic coefficient of bulk GeO2 glass is presented for the 200-300 K temperature range.
Keywords: 
Subject: Physical Sciences  -   Optics and Photonics

1. Introduction

Modeling the thermal behavior of fiber gratings in extreme conditions such as at cryogenic temperatures is very important in order to assess the performance of sensor devices. Recently [1], we have discussed the expected values for the thermo-optic coefficient, dn/dT, of silica glass, the main constituent of an optical fiber. In order to obtain dn/dT for the fiber core, we need to know its composition and bear in mind that during fiber drawing, due to the different viscosities of core and cladding materials, stresses will be induced and, therefore, the final refractive index will also be affected. For the sake of simplicity and to control the dopants impact we shall focus on a well-known weakly-guiding fiber, the SMF-28 from Corning which have a GeO2 dopant concentration less than 4 mol%. Fiber Bragg gratings (FBGs) imprinted in the SMF-28 fiber will be used to extract the temperature behavior of the effective refractive index that will be afterwards related to dn/dT of the fiber core through a set of equations derived for weakly-guiding fibers. Finally, we will use the additivity model to determine the thermo-optic coefficient of bulk GeO2 glass. Its temperature dependence will be also discussed through the knowledge of FBGs and the thermal expansion coefficient. To validate the obtained results, we will use data from other optical devices such as interferometers.
The paper is organized in three sections. The first is related to weakly-guiding fibers: its full characterization and the derivation of the equation that enables the determination of the core thermo-optic coefficient through the use of the additivity model. The second to fiber Bragg gratings: its effective refractive index, the temperature sensitivity and the determination of the correction factor. The third section is dedicated to the calculation of the correction factor for the SMF-28 fiber as a function of the Poisson ratio and Pockels´coefficients. The analysis requires the correlation of data obtained by using the stimulated Brillouin gain spectrum, the acoustic velocities, whispering gallery modes, the elastic properties of the fiber, the photoelastic coefficient and the thermal expansion coefficient of the fiber. Finally, we validate the values obtained for the thermo-optic coefficient by comparing with published results achieved by using Fabry-Perot interferometers.

2. Ge-Doped Silica Glass Fiber

In order to properly model fiber gratings we need to characterize the host fiber, namely to have knowledge of the core diameter and of the refractive index difference between the core and cladding regions. The SMF-28 fiber from Corning is one of the most studied standard fibers and the reasons have been pointed out by researchers as being reliable with well-defined parameters and, therefore, having a wide application in optical communications and sensing [2,3,4]. However, different values can be found in the literature and even the datasheet should be used only as a reference [5,6,7,8]. A long the past 40 years several metrological standards have been used to measure the fiber parameters [9,10,11,12,13]. The best practice may recommend to collect the maximum information possible on the fiber and use waveguide equations to correlate the obtained parameters. For instance, the mode field diameter (MFD) at a particular wavelength and the cut-off wavelength (λc) can be used to estimate the core radius though the Marcuse´s empirical formula [14,15,16,17]:
M F D = D c o 0.65 + 0.434 λ λ c 1.5 + 0.015 λ λ c 6 ,
and afterwards the numerical aperture (NA) can be determined by using the normalized frequency V expression:
V = π D c o λ n c o 2 n c l 2 ,
by putting V=2.405 and λ=λc to yield:
N A = n c o 2 n c l 2 = 2.405 * λ c π D c o .
On the other hand, one may think that the refractive index profile (RIP) would clarify any potential ambiguity on the fiber parameters determination, but different techniques such as refracted near field (RNF), transmitted near field, transverse interferometric, quantitative phase imaging, reconstruction through tomographic stress measurement profiles, or using atomic force microscopy results in different values [6,18,19,20,21,22]. In fact, considering the most common technique (RNF), and by sweeping the fiber end-face at 0º and 90º may result in different values for n and Dco, being the difference larger for the latter. We should recall that fiber cleaving changes the stress distribution which also affects the refractive index [23] and the determination of its absolute value also requires calibration with a fluid of known refractive index. In general for the SMF-28 fiber, n ranges from 4.4-5.4x10⁻³ and Dco from 8.0-8.8 μm and the most common values are: n=5.2-5.4x10⁻³ and Dco=8.2-8.6 μm. Based on our measurements [24], we will considern ~5.4x10⁻³ and Dco~8.6 μm which matches the values presented in [4]. Furthermore, the writing of weak FBGs in the SMF-28 fiber allows one to determine its effective refractive index (neff) [25] and the obtained results are also consistent with the assumed fiber parameters. The SMF-28 is a weakly-guiding fiber [26] for which the normalized propagation constant can be written as:
b = n e f f n c l n c o n c l ,
thus
n e f f = n c l + b Δ n ,
or be expressed as a function of the normalized frequency as [27]:
n e f f = n c l + 1.1428 0.996 V 2 Δ n .
Through the derivative in order to temperature results:
d n c o d T = d n e f f d T + 2 1.1428 0.996 V 0.996 V λ d λ d T Δ n + d n c l d T 1.1428 0.996 V 2 1 + 2 * 0.996 n c l 1.1428 0.996 V V n c o + n c l 1.1428 0.996 V 2 + 2 * 0.996 n c o 1.1428 0.996 V V n c o + n c l ,
From the previous equation it can be concluded that one can determine the thermo-optic coefficient of the fiber core by knowing the fiber parameters, the thermo-optic coefficient of the fiber cladding (typically, pure-silica glass) and the temperature dependence of a fiber device, such as, a FBG. On the other hand, the thermo-optic coefficient of the fiber core is related to the thermo-optic coefficients of SiO2 and GeO2 by knowing the fractional volume of glass occupied by GeO2 (m) and using the additivity model [28]:
n c o = 1 m n S i O 2 + m n G e O 2 ,
d n c o d T = 1 m d n S i O 2 d T + m d n G e O 2 d T ,
being m defined as:
m = M G e O 2 M S i O 2     ρ S i O 2   ρ G e O 2     x 1 + x   M G e O 2 M S i O 2     ρ S i O 2   ρ G e O 2   1 ,
and x is the molar fraction of GeO2 dopant concentration.
On contrary to pure silica, published values in the literature for the thermo-optic coefficient of pure GeO2 [29,30] is scarce and, therefore, this set of equations enables to determine its value, say at room temperature and for a particular wavelength (for instance, 293 K and 1.55 μm). At this point, we shall recall that the refractive index of the core and cladding materials may differ for the preform and for the optical fiber. The differences arise from mechanical and thermal stresses due to the different viscosity and thermal expansion coefficients of core and cladding materials and also from viscoelasticity, due to its time dependence induced during fiber drawing. Typically, the pure silica cladding bears the applied force and it has not enough time to reach thermodynamic equilibrium. The elastic stresses affect mainly the core, that is compressed by the cladding, while viscoelasticity affects mainly the pure silica cladding. Both contributes to a decrease of the refractive index of core and cladding materials in the fiber in comparison to the preform. Taking into account the value of 4.7 MPa [20], for the mean axial stress measured in the SMF-28, the cladding refractive index decrease due to frozen-in viscoelastic stress is calculated to be -3x10⁻⁵ [31] and can be, therefore, neglected. Furthermore, the residual elastic stresses contribute to a decrease in the cladding refractive index of about -2x10⁻⁵ and to an increase in the core of about 4x10⁻⁵ [32,33]. The overall contribution to n is of the order of 1x10⁻⁴. On the other hand, it has been claimed that the refractive index of the cladding can be several parts in the 4th decimal place higher than that of annealed silica and that is attributed to quenching of the fiber during its production [9,13]. The reference value for annealed silica is the one obtained by Malitson [34] and it is known that the value obtained by Fleming for a quenched glass is about 3x10⁻⁴ higher [35]. However, as discussed in our previous paper [1], the values obtained by Leviton et al. for four samples of annealed silica glass are even higher than for quenched silica (for instance, the values for Corning 7980 silica sample are about 1x10⁻⁴ above) [36]. Gathering all the information concerning the fiber fabrication and the errors associated to the measurement of the refractive index profile, it is not possible to clearly state that the refractive index of the silica cladding is higher than for annealed bulk samples. Moreover, it is also known that values of the order of 300 g for the drawing tension can reduce the refractive index of the cladding by about 2x10⁻⁴ [37]. Returning to the SMF-28 fiber, for which only ~12.5 g (peak stress 10 MPa) are used for the drawing tension, we do not expect considerable changes in the cladding refractive index [23,38,39]. Furthermore, those changes are within the uncertainty of the measurements and in fact, more important than knowing the absolute value of the cladding refractive index is to know the index difference, n.
As far as the core is concerned, each 1 mol% GeO2 accounts for 0.1% in  [40] and therefore for n=5.4x10⁻³ we expect ~3.7 mol% GeO2. Also, for the core we can question if we should use annealed or quenched GeO2. Calculations using the Sellmeier´s coefficients for pure GeO2 (quenched and annealed samples) presented in [41] and for silica, the ones obtained by Leviton and Frey for Corning 7980 [36], show that the difference in values for n is of about 1x10⁻⁴ being the mol% of GeO2 3.70±0.04. Therefore, we will also use the GeO2 annealed sample, resulting in n = 1.464x10⁻³ x [GeO2(mol%)] at 1.55 μm (valid for small concentrations since the dependence is in fact quadratic, Figure 1).

3. Fiber Bragg Gratings

The determination of the core thermo-optic coefficient requires the knowledge of the value of the effective thermo-optic coefficient. That, can be accomplished by following the thermal behavior of fiber Bragg gratings by using the temperature dependence of the Bragg wavelength, λ B :
λ B = n e f f Λ ,
where n e f f is the effective refractive index and Λ the pitch of the phase-mask (which is twice that of the grating period).
The derivative of the grating resonance condition yields:
d n e f f d T = n e f f 1 λ B d λ B d T α c l ,
where α c l   represents the thermal expansion coefficient of the cladding material. It should be noted that being the cladding much larger than the core and since the thermal expansion coefficient of the core is larger than that of the cladding, it is the latter that defines the expansion of the grating period. On the other hand, the core is not free to expand and thus a compressive stress is induced in the core region during fiber heating leading to an increase of the refractive index. Therefore, the effective refractive index should be corrected by using the following expressions [42,43,44]:
d n e f f d T c o r r = n e f f 3 2 2 ε o c e f f + σ o c e f f α c o α c l ,
where α c o   represents the thermal expansion coefficient of the core material, that for the SMF-28 fiber can be calculated using the additivity model resulting in the following expression:
α S M F 28 = 1 m   S i O 2   α S i O 2 +   m   G e O 2   α G e O 2 ρ S M F 28 ,
and ρ S M F 28   is the density of the fiber core determined as:
ρ S M F 28 = ρ S i O 2 1 m + ρ G e O 2 m .
The ε o c e f f   a n d   σ o c e f f represent the strain and stress-optic effective coefficients and are expressed as:
ε o c e f f = x n G e O 2 3 ε o c G e O 2 + 1 x n S i O 2 3 ε o c S i O 2 1 n e f f 3 ,
σ o c e f f = x n G e O 2 3 σ o c G e O 2 + 1 x n S i O 2 3 σ o c S i O 2 1 n e f f 3 ,
where n, εoc and σoc represent the values of refractive index, strain and stress-optic coefficients of the bulk materials:
ε o c = p 12 ν p 11 + p 12 ,
σ o c = p 11 2 ν p 12 .
The values of molar mass (M), density, thermal expansion coefficient [1], Pockels’ photoelastic coefficients (p11, p12) and Poisson ratio (ν) of germanium-doped silica glass are, respectively, presented in Table 1 [45].
There is a final issue requiring attention as a result of the fact that during the grating inscription a δnco is induced in the fiber core (averaged over the grating length being half of the amplitude modulation for a grating with a duty-cycle of 0.5) which is larger for strong gratings as the reflectivity approaches 1. Consequently, the effective refractive index will also change. In this context, the induced effective refractive index δneff can be determined from the grating spectrum by knowing the Bragg wavelength, λB the grating length, L and the reflectivity, R and, therefore, δnco can be afterwards obtained by using the confinement factor, η [46,47].
δ n e f f = λ B 2 π L t a n h 1 R ,
δ n c o = δ n e f f η ,
η = 1 1 V 2 .
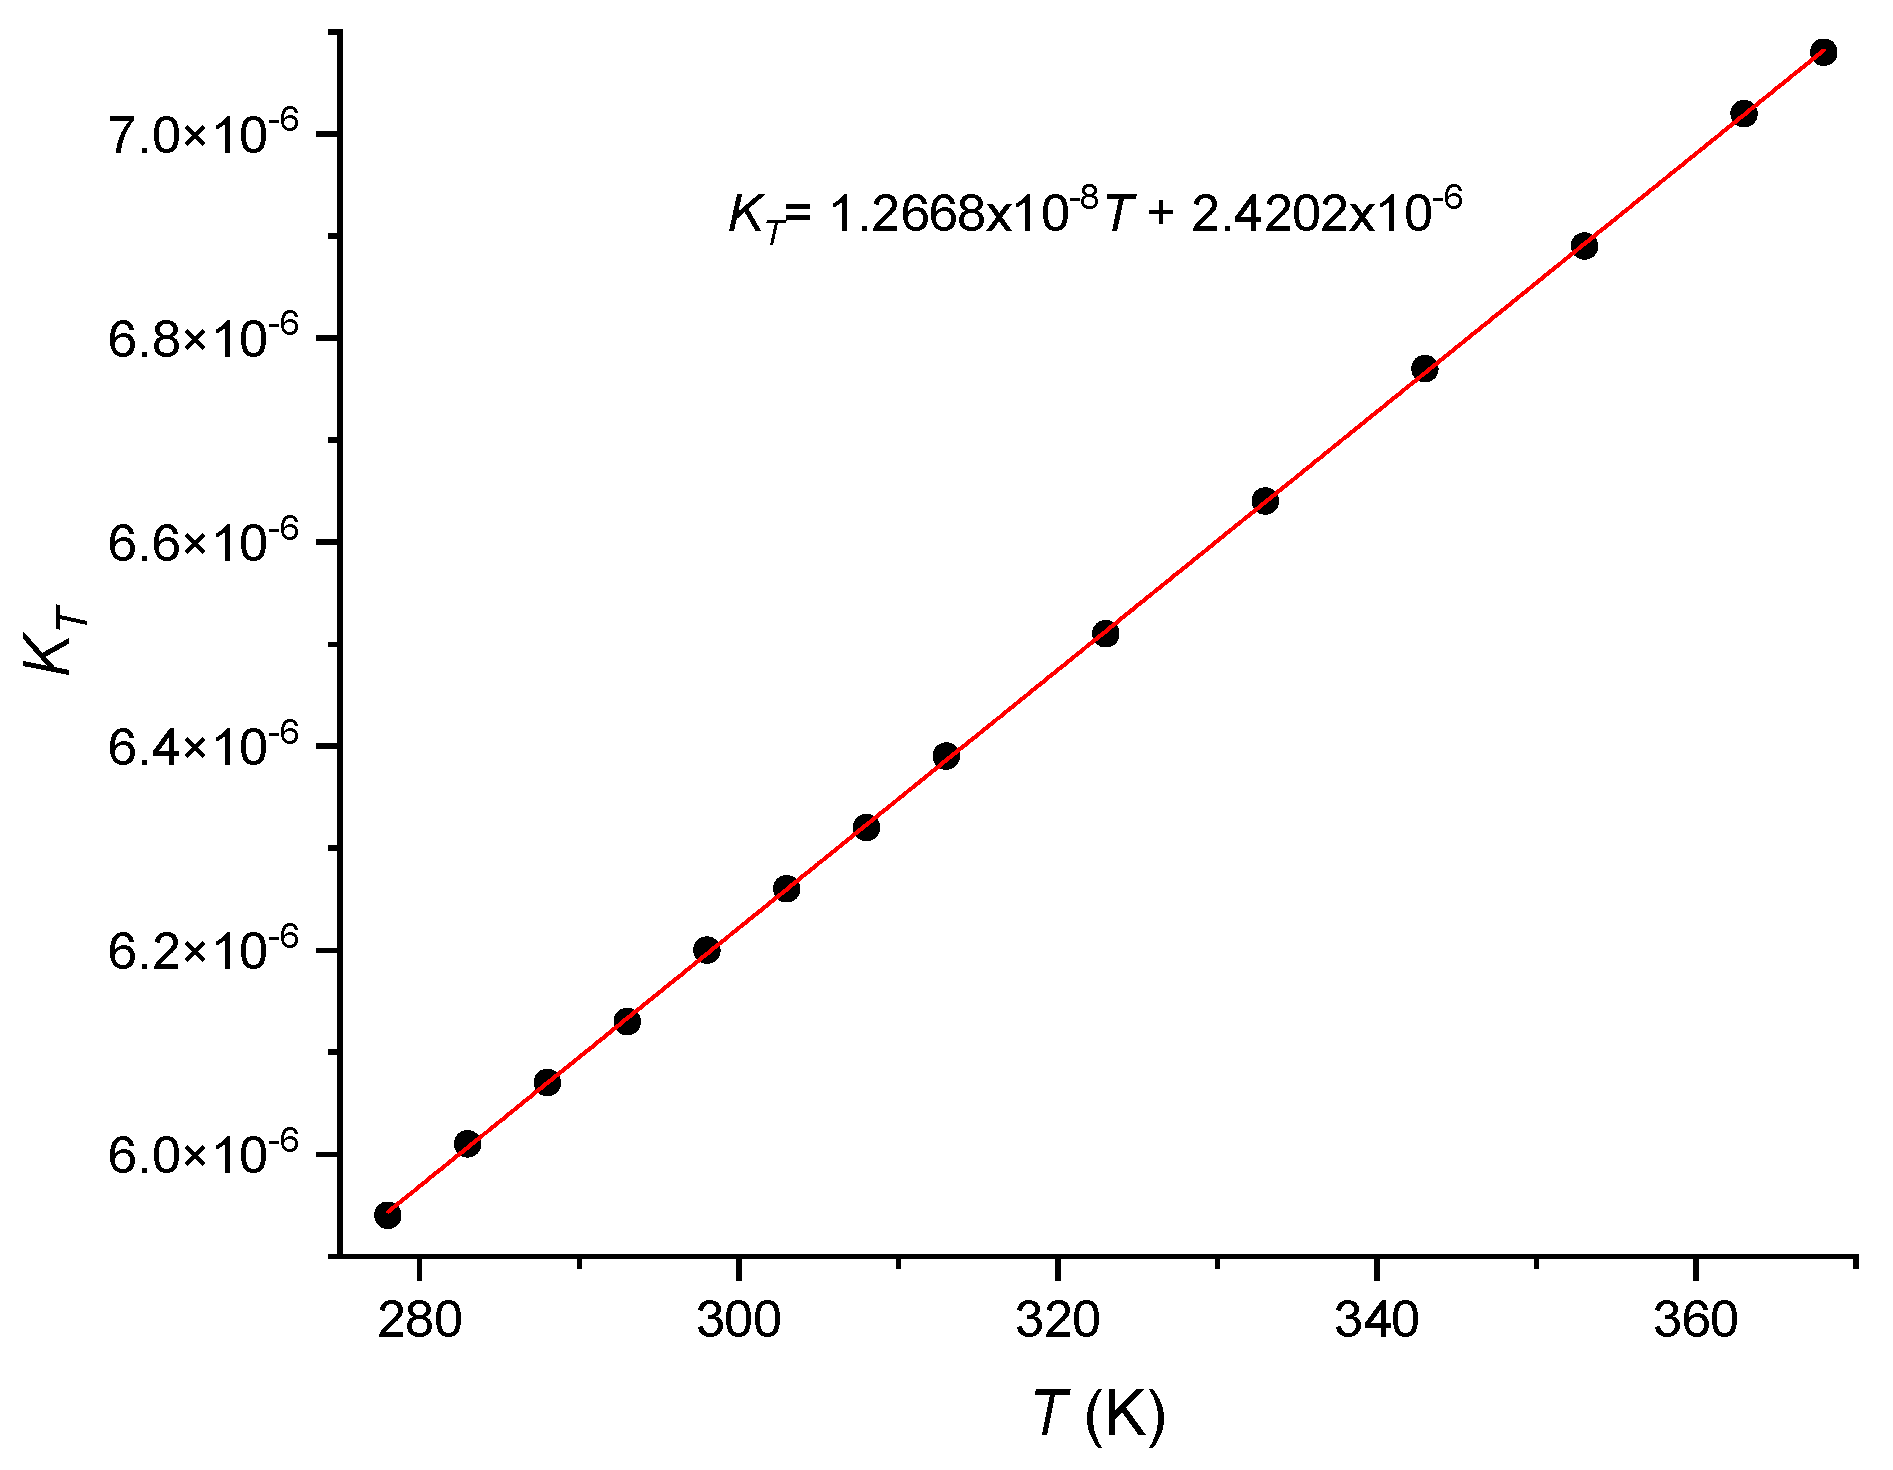
For the calculations we have assumed the values discussed in the previous section, namely, Dco=8.6 μm and n=5.4x10⁻³ and for the cladding refractive index at 1.55 μm the value obtained for Corning 7980 (1.4444) [1], by using Eq. (2) and Eq. (6) we determined the effective refractive index for the SMF-28 fiber. Afterwards, by considering a moderate grating (R~24%) [48], and by replacing the values in Eq. (20) – Eq. (22) and Eq. (11), we estimated δneff,δnco and to be respectively, 4.64x10⁻⁵, 5.96x10⁻⁵ and 1.0729 μm. Then, Eq. (6) – Eq. (19) yields the following values for the thermo-optic coefficients (corrected effective, core and bulk GeO2): 8.45, 8.55 and 18.3x10⁻⁶ K-1. In order to validate our results we have also used a strong grating [49], although in this case we knew the pitch of the phase mask (1.070 μm) but we had to estimate the grating length since it was inscribed on the splice region of two dissimilar fibers being one of them the Corning SMF-28. Based on the knowledge that we had on the impact of the arc discharge on the fiber´s stress annealing (a region of about 1 mm) [50] and also on the separation of the peaks obtained in the Fabry-Perot spectrum (λ=λ2/2ncoL=1 nm) [51] we estimated the grating length to be of ~4.6 mm (the length of the phase mask was 10 mm). Since we had the phase mask pitch we could obtain directly the effective refractive index and apply an iterative method to optimize the value obtained for the induced δnco. In this case the values obtained for the thermo-optic coefficients (corrected effective, core and bulk GeO2) were 8.48, 8.59 and 19.5x10⁻⁶ K-1. As can be observed the values are very close to the ones obtained previously for the moderate grating. It should be stressed that the grating temperature sensitivity (dλ/dT) depends on the fiber (with or without coating and its type), on the wavelength, and on temperature [52]. The values used (9.45 and 9.46 pm/ºC) were obtained for FBGs inscribed in the SMF-28 fiber without coating at ~1.55 μm and at 20 ºC. Care should be taken since the temperature sensitivity depends quadratically on temperature, a fact that sometimes seems to be ignored. We have also tested a strong FBG with a wavelength of 1608.5 nm exhibiting a sensitivity of 9.85 pm/ºC (quadratic fitting between 10 and 50 ºC) [53] and the results obtained were 8.50, 8.62 and 20.1x10⁻⁶ K-1. The temperature gauge factor KT = 1/λB.dλB/dT of the above gratings increased respectively, from 6.09x10⁻⁶ K-1 to 6.12x10⁻⁶ K-1, revealing the strong impact of this parameter. Note also that the reference value of 19.4x10⁻⁶ K-1 was obtained at room temperature in the visible region thus, assuming a similar dispersion relation for GeO2, as for SiO2, it is expected a value 6% lower at 1.5 μm. Therefore, it is instructive to measure the impact of the different parameters accuracy on the estimation of the bulk GeO2 thermo-optic coefficient. Starting from typical fiber parameters: Dco=5.2-5.4 μm and n=5.2-5.4x10⁻³, differences of the order of ~4% results in relative errors of ~1%. Regarding the thermal expansion coefficient of SiO2 it is known that it depends on the fictive temperature and on the OH- content [54,55]. Nevertheless, typical values at room temperature range from 0.40-0.55x10⁻⁶ K-1 [43,56,57,58]. Common values for type III silica glass at 20ºC can be considered to be (0.47±0.04)x10-6 K-1 [59,60,61,62]. For GeO2 at room temperature we shall consider 6.9x10⁻⁶ K-1 [63] (typical average value from 25 ºC up to 300 ºC: 7.5x10⁻⁶ K-1 [64,65,66,67,68]). Considering the uncertainty of 8.5% in the thermal expansion coefficient of silica glass, it impacts ~11% the value of the thermo-optic coefficient of GeO2 glass through Eq. (12)-(13). On the other hand, the difference in determining the grating temperature sensitivity at 20 ºC through a linear or quadratic fitting, results in an uncertainty of 6.3% that leads to a 100% variation in the value of the thermo-optic coefficient of GeO2 glass. Being aware of that fact, a ~0.45 mm weak-FBG (R<0.1%) was inscribed in the SMF-28 fiber, where a single pulse of 3 mJ at 248 nm was used through a phase mask of 1065.39 nm. The FBG has a resonance wavelength of 1541.58 nm having, therefore, an effective refractive index of 1.446964. The thermal behavior of the FBG was studied from 5 ºC up to 95 ºC and after fitting with a second order polynomial we obtained a value of 9.454 pm/ºC at 20 ºC. Figure 2 shows the temperature dependence of KT for this grating. For this weak-FBG, the former values of the thermal expansion coefficients would lead to thermo-optic coefficients (corrected effective, core and bulk GeO2): 8.52, 8.63 and 20.4x10⁻⁶ K-1, while the new values (0.47x10⁻⁶ K-1 and 6.9x10⁻⁶ K-1) lead to 8.46, 8.55 and 18.3x10⁻⁶ K-1. The latter corresponds to a 6% reduction going from visible to the infrared, as observed for bulk SiO2. The value of the effective dn/dT (without correction) is 8.20x10⁻⁶ K-1. Applying to the temperature dependence of the Bragg wavelength a similar analysis as the one presented in [69], that is, considering that the period of the phase mask increases linearly with temperature and the refractive index has a quadratic behavior (the reference is 20ºC), yields a value of 8.25x10⁻⁶ K-1 (0.6% higher). The core’s thermo-optic coefficient increases linearly with GeO2 concentration (mol%) at a ratio of ~0.106. Recently [53], it was suggested that the cladding of the SMF-28 fiber would have similar thermo-optic coefficients as the Suprasil glass. However, based on our results for Suprasil 3001 [1], this would lead to a thermo-optic coefficient of bulk GeO2 of 11.56x10⁻⁶ K-1, which is not correct. Therefore, the reason for the discrepancy lays in the higher values obtained for KT as a consequence of the linear fitting applied to the Bragg wavelength.
As a final remark, note that different values can be found in the literature for the parameters ν, p11 and p12 since they may depend on temperature, wavelength and if it is a bulk or fiber glass. Therefore, in the next section we will present another approach to obtain the correction factor, d n e f f d T c o r r .

4. Effective Parameters ν, p11 and p12 for the SMF-28 Fiber

The correction factor will be determined by using Eq. (13) through the parameters for the SMF-28 fiber. The Poisson ratio, for the fiber cladding is obtained by applying the following expression:
ν = 1 2 v s v L 2 2 1 v s v L 2 .
where vS e vL are the transverse and longitudinal acoustic velocities and can be determined by knowing the cladding radius [70]:
v s R c l = 59.345 ± 0.009   m / ( s . μ m ) ,
v L R c l = 94.463 ± 0.006   m / ( s . μ m ) .
Thus, ν for SiO2 cladding is obtained by the ratio of the acoustic velocities yielding 0.1740±0.0002 at 20 ºC. To determine Pockels’ coefficients for silica cladding we followed the procedure presented in [32], that relies on the strain dependence of TE and TM polarized whispering gallery modes (WGM) resonances. The Pockels’ coefficients were determined for two wavelengths, 1.064 μm and 1.55 μm. When using the obtained values for the calculation of the photoelastic constant, C, we found that it would be larger at the longer wavelength, what is not correct (to be discussed below) [71,72,73]. Thus, by careful analysis of the figures in [32] and [74], we realized that the slopes in those figures were incidentally interchanged. Therefore, the correct values at 1.064 μm and 1.531 μm are: p11=0.113, p12= 0.250 and p44=-0.0685 and p11=0.130, p12= 0.265 and p44=-0.0676, respectively. It is interesting to note that the coefficients are essentially wavelength independent in the 3rd telecommunication window: dp11/dλ=3.66x10-5 nm-1, dp12/dλ=3.28x10-5 nm-1 and dp44/dλ=1.93x10-6 nm-1. The signs of the wavelength dependence of Pockels’ coefficients compare fairly well in the visible and near infrared range [72,73]. For the sake of further comparison (we will use instead the stress-optic rotation coefficient, g defined below by Eq. 32), the latter value corresponds to dg/dλ=-0.069g/λ nm-1, which is in excellent agreement with the value of -0.069g/λ obtained for a silica fiber core-doped with 3.4 mol% GeO2 and B2O3 co-doped cladding, in the 1.064-1.3 μm wavelength range [75]. On the other hand, for a pure silica-core fibers and B2O3 co-doped cladding a value of -0.056g/λ nm-1 was obtained in the 630-880 nm [76] and for dispersion-shifted fibers (DSF) dg/dλ=-0.090g/λ nm-1 at 1.55 μm [77].
As far as the core is concerned, a more laborious path is required. First, it should be mentioned that the cladding diameter was not measured and the specifications of Fibercore SM1500 4.2/125 states that the cladding as a 2 μm uncertainty. Therefore, using the nominal radius of 62.5 μm and Eq. (24)-(25) yields values of vL=5940 ± 95 m/s and vS=3709 ± 60 m/s, respectively. On the other hand, for the same fiber, the echo of the longitudinal and transverse acoustic waves reflecting at the cladding/coating interface repeats at a periodicity of ~21 ns and ~33 ns (with a 0.1 ns resolution) [78], leading to velocity values around 5952 m/s and 3788 m/s. Due to discrepancy, we will proceed through the analysis of the stimulated Brillouin gain spectrum (SBS). The longitudinal acoustic velocity,νL can be related to the Brillouin frequency shift, fB through the following equation [79]:
f B = 2 n e f f v L λ p ,
where neff is the effective refractive index and λp the pump wavelength. We have used data corresponding to three germanium-doped silica fibers (3.65 and 8 mol% GeO2) [79], being one the SMF-28 fiber (3.67 mol% GeO2) [80,81,82]. We have also corrected the effect of the drawing tension on the Brillouin frequency shift (-42 MHz/100g) considering a drawing tension similar to the one used in the SMF-28 fiber [83]. Table 2 summarizes the results at 20ºC.
It should be mentioned, that, we have limited the maximum value of GeO2 core-dopant concentration in order to calculate the effective indices through the above equations valid for weakly-guiding fibers. Care should also be taken since the Brillouin frequency shift/velocity depends on several fiber properties [84]. The extrapolated value obtained for silica glass is in good agreement with the 5990 ± 10 m/s referenced in [28,85] and it also corresponds to the value obtained for the L04 longitudinal acoustic mode at 20ºC (5987 m/s) [86]. The value obtained for the SMF-28 fiber is also a common accepted one (5820 m/s) [87]. Following Koyamada et al. [88] relation between longitudinal velocity and GeO2 concentration ([GeO2] < 20 mol%) we obtain:
v L = 5987 ( 1 7.7 x 10 3 * C G e O 2 ) .
In which concerns the transverse velocity we determine vS in silica from Eq. (23) yielding a value of 3761 m/s. Note that a value of 3764 m/s was also obtained through analysis of leaky surface acoustic waves in several Corning silica samples [89]. It is interesting to note that using these values (5987 m/s and 3761 m/s) we find Rcl=63.4 μm being within the accuracy stated in the fiber´s specifications. It should be stressed that although in [88] it was considered the concentration in wt%, in fact it should be mol% [90]. Also, the fibers used as one of the references [91] for the Koyamada´s equations contains B2O3 in the cladding, with different concentrations, affecting the values obtained for the velocities. As a first guess, we estimated a value of 3673 m/s for vS in the SMF-28 fiber:
v S = 3761 ( 1 6.4 x 10 3 * C G e O 2 ) ,
and, therefore, the Poisson ratio for the SMF-28 fiber would be 0.169.
The elastic properties of materials, longitudinal and shear modulus, M and G, respectively, can be determined directly from the knowledge of the acoustic velocities:
M = v L 2 ,
G = v S 2 .
On the other hand, the Young´s modulus, E, can be related to M through the Poisson´s ratio ν:
M E = 1 ν 1 + ν 1 2 ν .
Therefore, for SiO2 we get M=78,86 GPa, E=73,08 GPa and G=31,12 GPa. For the SMF-28 fiber M=76,36 GPa and E can be estimated by knowing the effect of GeO2 concentration on Young´s modulus [64]. A decrease of ~0.35 GPa/mol% was found for GeO2 concentrations up to 4 mol%, although the temperature and density should be corrected [92]. On the other hand, from results presented in [93] a value of -0.4 GPa/mol% can be determined. Therefore, we estimate E=71.61 GPa for the SMF-28 fiber which is in excellent agreement with the value measured for an SMF without coating, E=71.63±0.43 [94]. A lower value was obtained for the SMF-28e (70.05±0.34) [95], however it requires a precise measurement of the fiber cladding diameter which was not performed. Moreover, by applying the additivity model and by using data related to pure bulk SiO2 and GeO2 from [96] results a value E=71.65 GPa which, once again, validates our result. For the sake of completion, the model can be improved by considering other factors such as the dissociation energy and ionic radius [97,98,99]. From the values of E and M for the SMF-28 fiber results ν=0.1612, also in accordance to [93] and thus vS =3698 m/s. Therefore, Eq. (28) should be corrected to be
v S = 3761 ( 1 4.6 x 10 3 * C G e O 2 ) .
It should be highlighted that the obtained Poisson´s ratio is lower for GeO2 doped silica glass fibers which also agrees with [91], but it is in contradiction to what is expected by applying the additivity model to bulk glasses [100]. We are aware that the results obtained depend on the initial values, but by following the existing interconnection between several parameters allows us to validate the results. We shall now work, with Pockels’ coefficients (p11, p12 and p44), stress-optic rotation coefficient (g) and photoelastic constants (C=C1-C2). The coefficient g can be determined through twist/rotation measurements and is related to p44 through the equation:
g = n 2 p 44 ,
and
C = C 1 C 2 = n 3 p 44 2 G ,
where the photoelastic constants, longitudinal C1 and transverse C2 are defined as:
C 1 = n 3 p 11 2 ν p 12 2 E ,
C 2 = n 3 p 12 ν p 11 + p 12 2 E .
Note that g is related to C and p44=(p11- p12)/2. Through the use of whispering gallery modes [32] we achieved a value of g=0.141 at 1.55 μm. In general, values for SMF range from 0.140 to 0.144 [101,102,103]. We also found a value for the SMF-28 fiber [104] that may be 0.139±0.002, since the slope taken from Figure 3 of that paper is at least 69.3x10⁻³ and not 63.9x10⁻³ as stated in the document. Thus, by applying Eq. (32) we obtain p44=-0.0662 and by using the value of 0.205±0.004 for the effective strain-optic coefficient peff reported in the strain measurements of FBGs [105,106]:
p e f f = E C 2 n = n e f f 2 2 p 12 ν p 11 + p 12 ,
we found for the SMF-28 fiber, p11=0.1251, p12= 0.2575. Table 3 summarizes the results for SiO2 and the SMF-28 fiber. Inserting the values in Eq. (13) results a value for the correction factor that differs only in the fourth decimal place when compared to the initial one. Therefore, we conclude that the major factor that impacts the value of the thermo-optic coefficient is the temperature sensitivity of the FBGs.
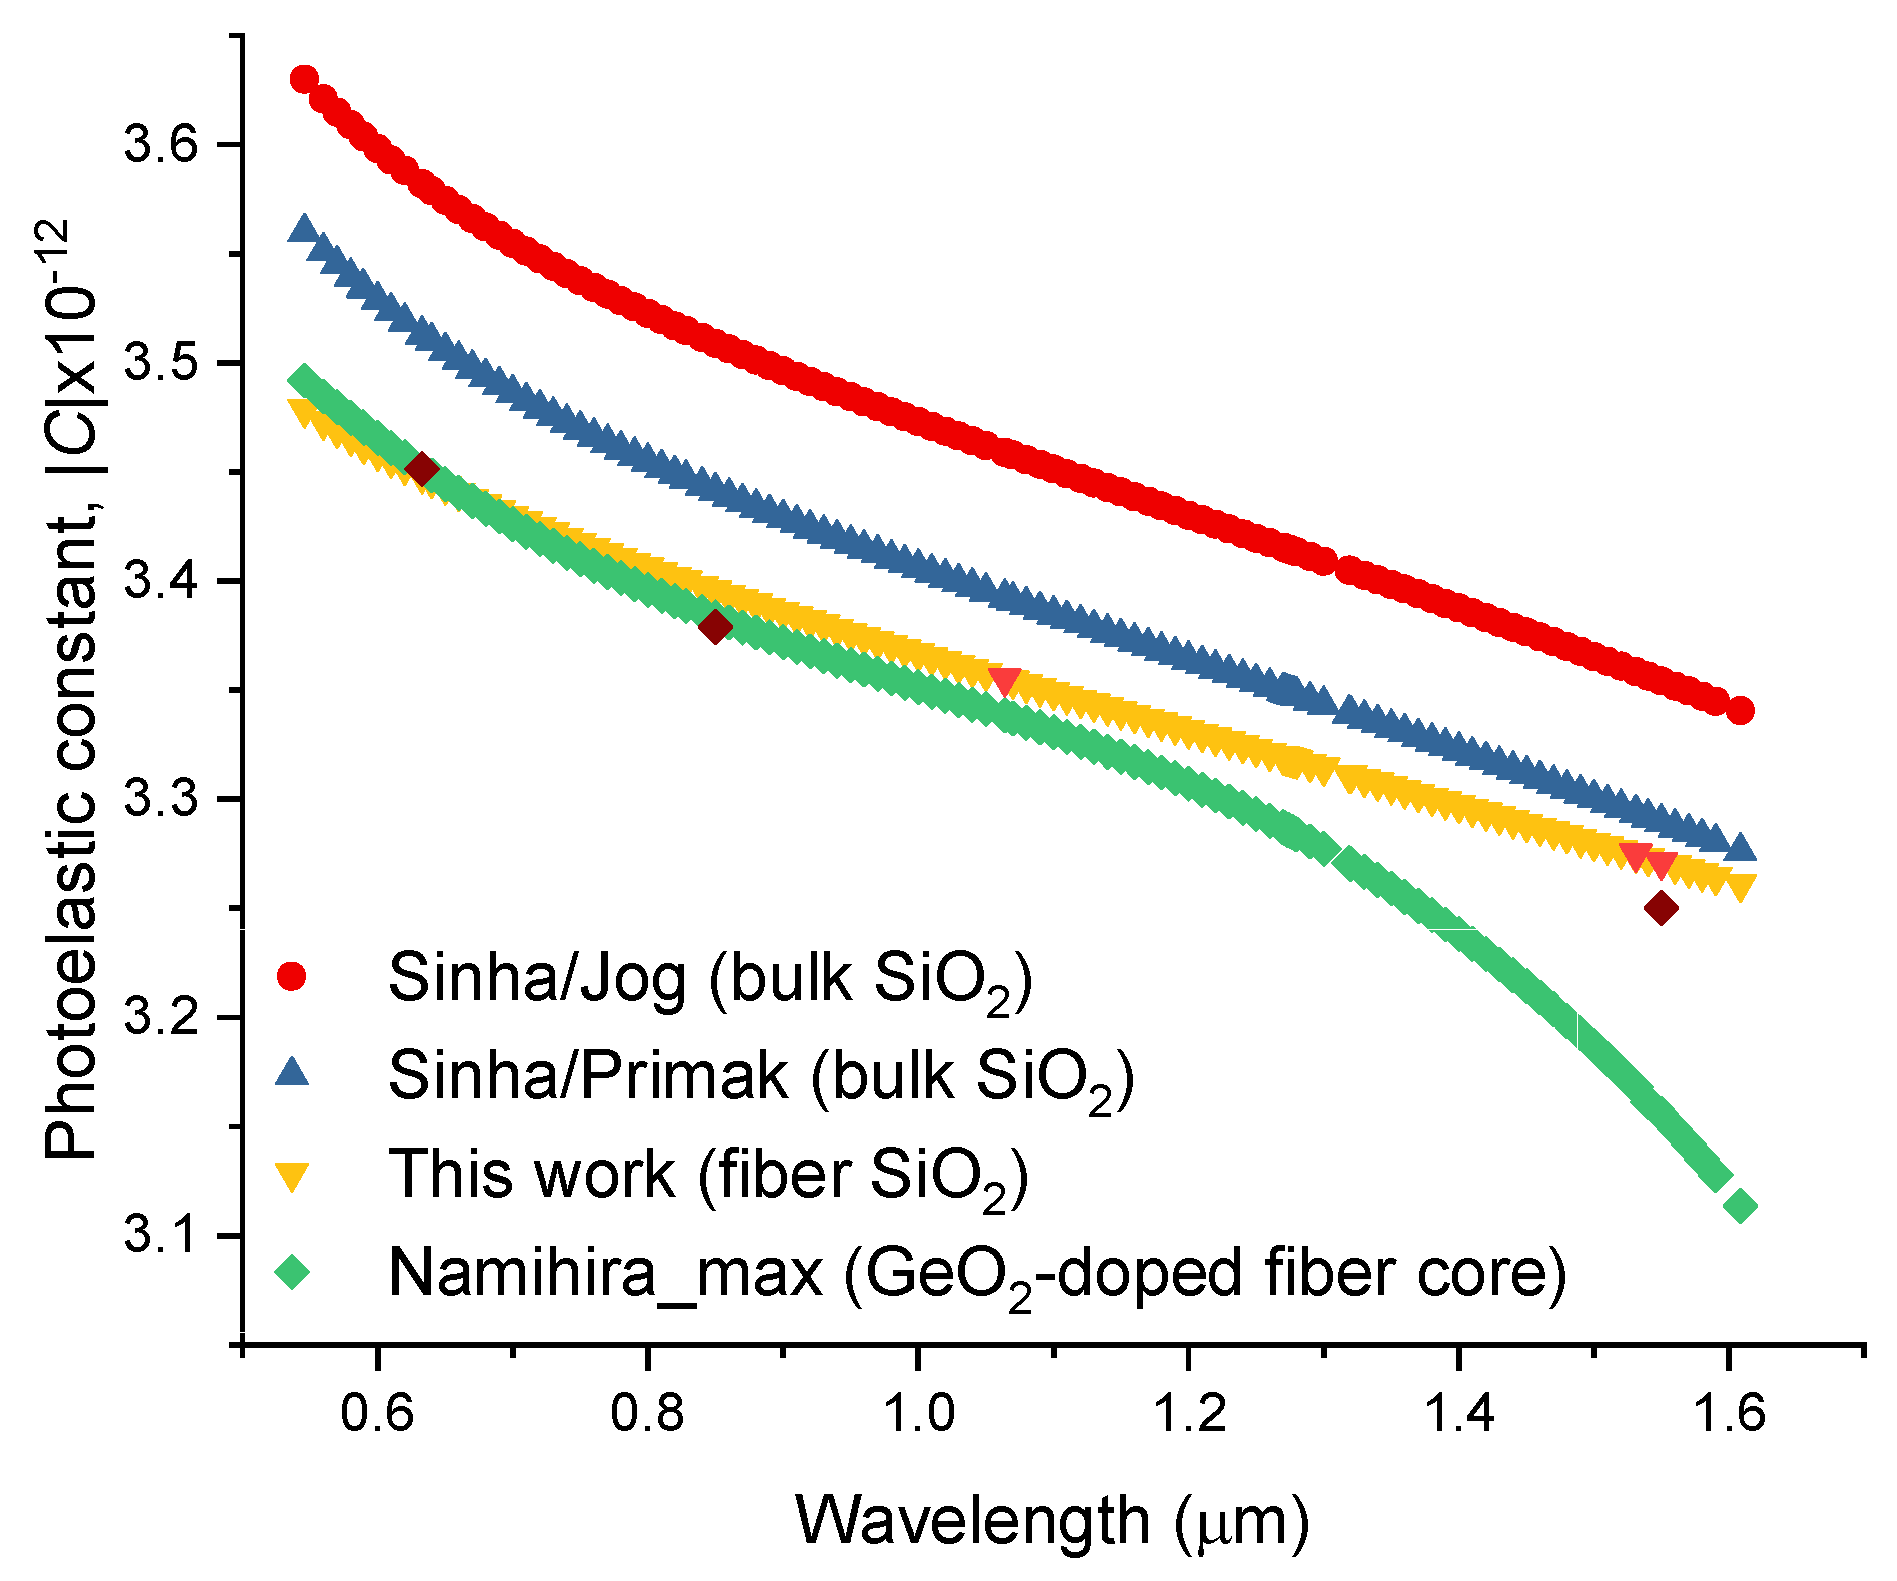
It is instructive to note that if we consider for the SMF-28 fiber a value of g=0.141 [103], it would result in p44=-0.0672 and C=-3.30x10⁻¹² Pa-1. Thus, due to the uncertainty in all calculations, the best we can say is that the photoelastic constant for the SMF-28 fiber is very close to the one obtained for pure silica cladding fiber, which is also in excellent agreement with previous results [107,108]. Sinha [109] proposed an expression for the dispersion of the photoelastic constant of fused silica by fitting data from Jog and Krishnan [71] and from Primak and Post [110].
C λ = C λ 0 n λ 0 n λ λ 2 λ 0 2 λ 0 2 λ 1 2 λ 2 λ 1 2 λ 2 λ 2 2 λ 0 2 λ 2 2 ,
where λ1=0.1215 μm and λ2=6.900 μm and the normalization was considered at 0.541 μm to be C=3.63 and 3.56 (absolute value in brewster=10-12 Pa-1) for each data set, respectively. Figure 3 shows the dispersion of the photoelastic constants for bulk fused silica (Jog and Primak), for fiber cladding (calculated in this work) and for low concentration GeO2-doped silica fiber [108]. For the latter, another expression was fitted to the experimental (maximum) values:
C λ = 3.99565 1.72552 λ + 1.5246 λ 2 0.0708 λ 3 .
It can be observed that the photoelastic constants are lower for optical fibers when compared to bulk samples and that the values for the core region (doped with low concentrations of GeO2) are lower than the ones obtained for the cladding. From the experimental values and due to uncertainty [108] it is not possible to clearly state that GeO2 increases/decreases the value of the photoelastic constant despite it seems that it affects g [103] and, therefore, p44 and ultimately C. Since Eq. (38) deviates from the expected values above 1.1 μm, we estimated the dispersion of C by assuming a linear dependence of p44 for the whole spectral range. Considering the uncertainty in values of C, at shorter wavelengths, for the Ge-doped fibers [108], they might be slightly lower than for the silica cladding.
The temperature dependence of Pockels’ coefficients can be obtained from the temperature derivative of Eq. (33) and from SBS spectrum [90]:
g 0 = 2 π n 7 p 12 2 c λ p 2 v L Δ f ,
where c is the light speed, λp is the pump wavelength, f is the spectral width and g0 the intensity. Considering that the product intensity-spectral width is temperature independent [90], results:
v L α n 7 p 12 2 ,
and therefore,
1 v L d v L d T = 7 1 n d n d T + 2 1 p 12 d p 12 d T .
Since the temperature derivative of the acoustic velocity is ~0.57 [70] and that the normalized thermo-optic coefficient equals 5.65x10⁻⁶ K-1 [1], yields dp12/dT=0.74x10-5 K-1.
From Eq. (30) and Eq. (33), results:
1 p 44 d p 44 d T = 2 1 v S d v S d T + 1 C d C d T 3 1 n d n d T ,
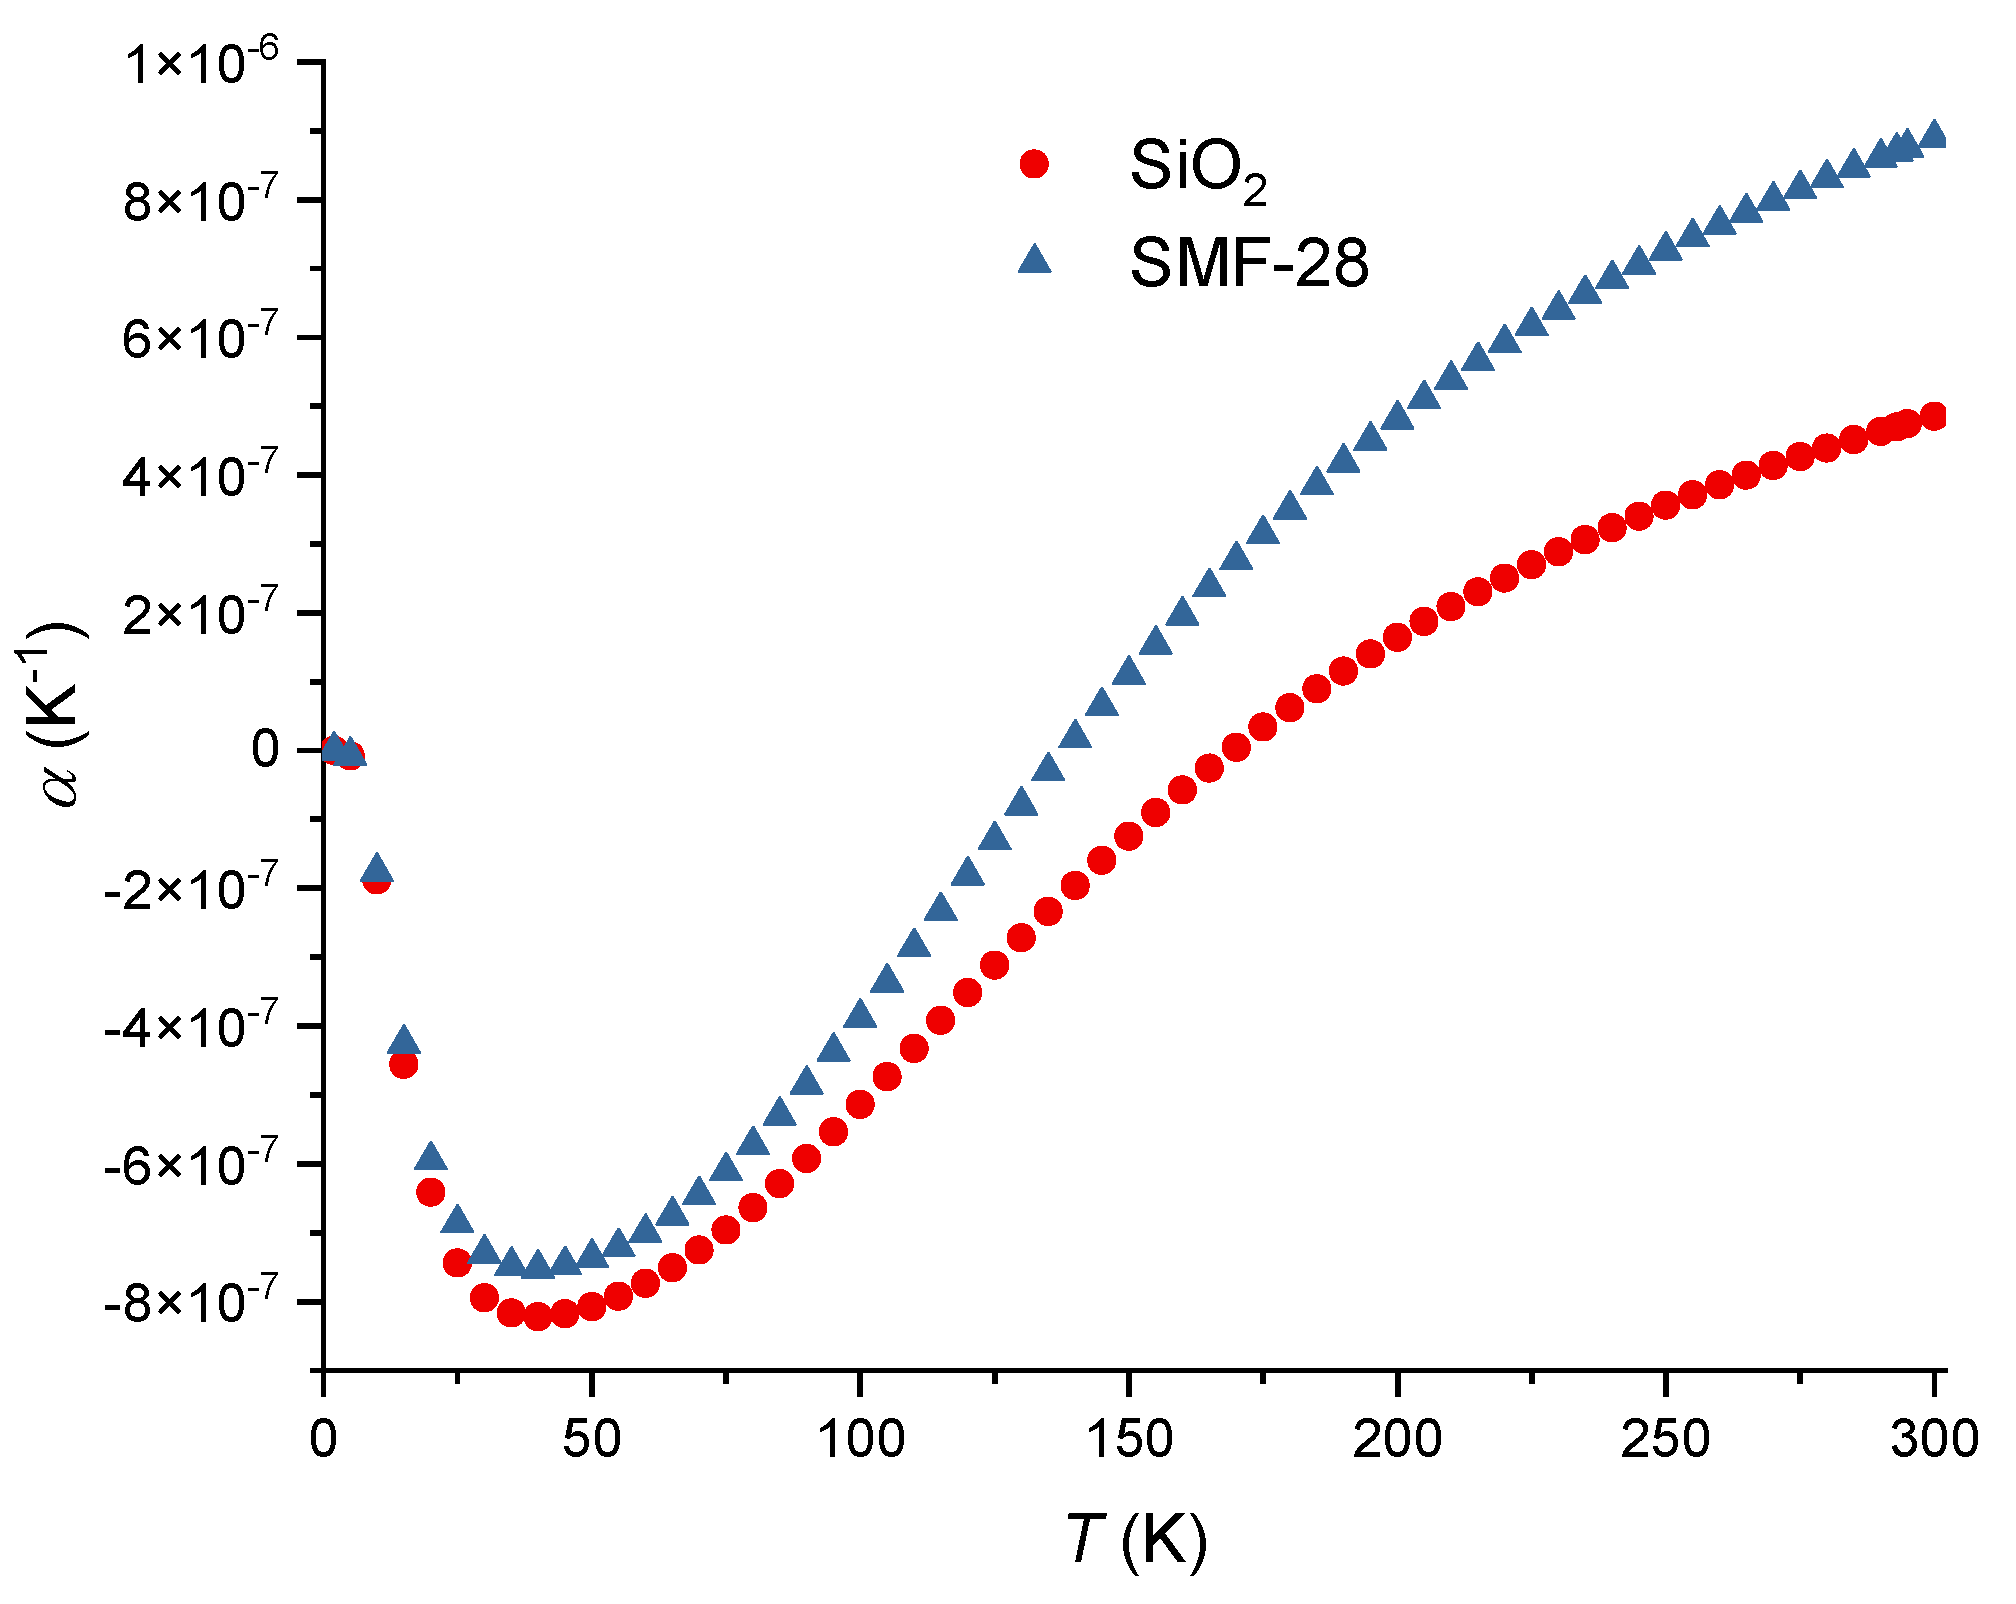
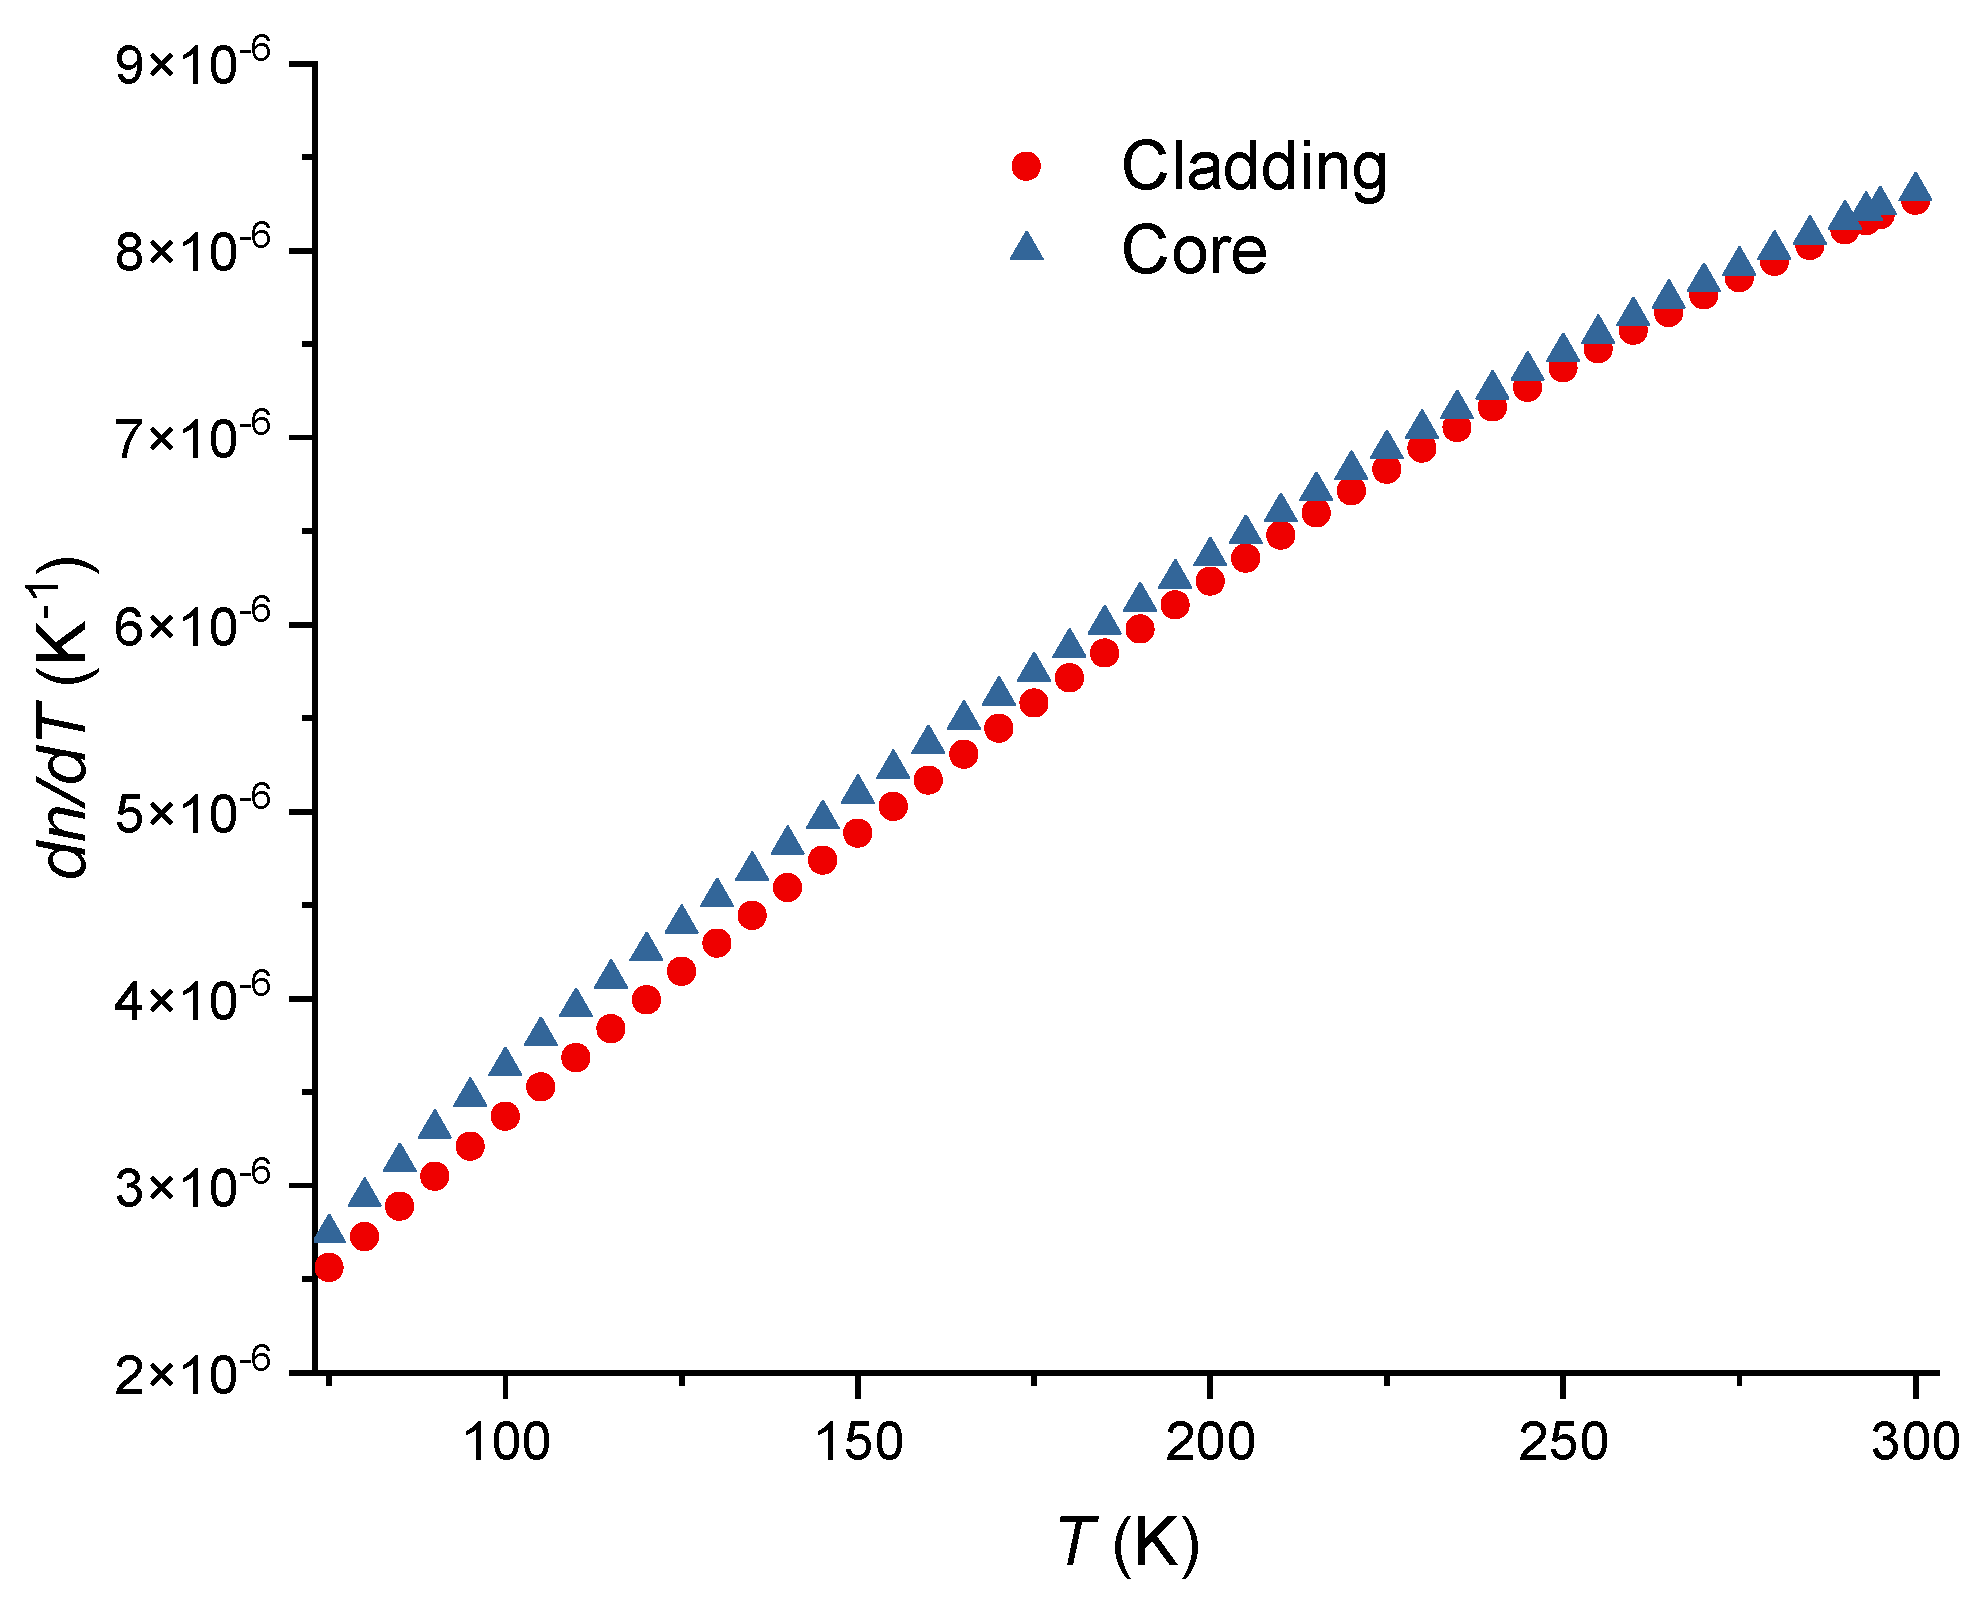
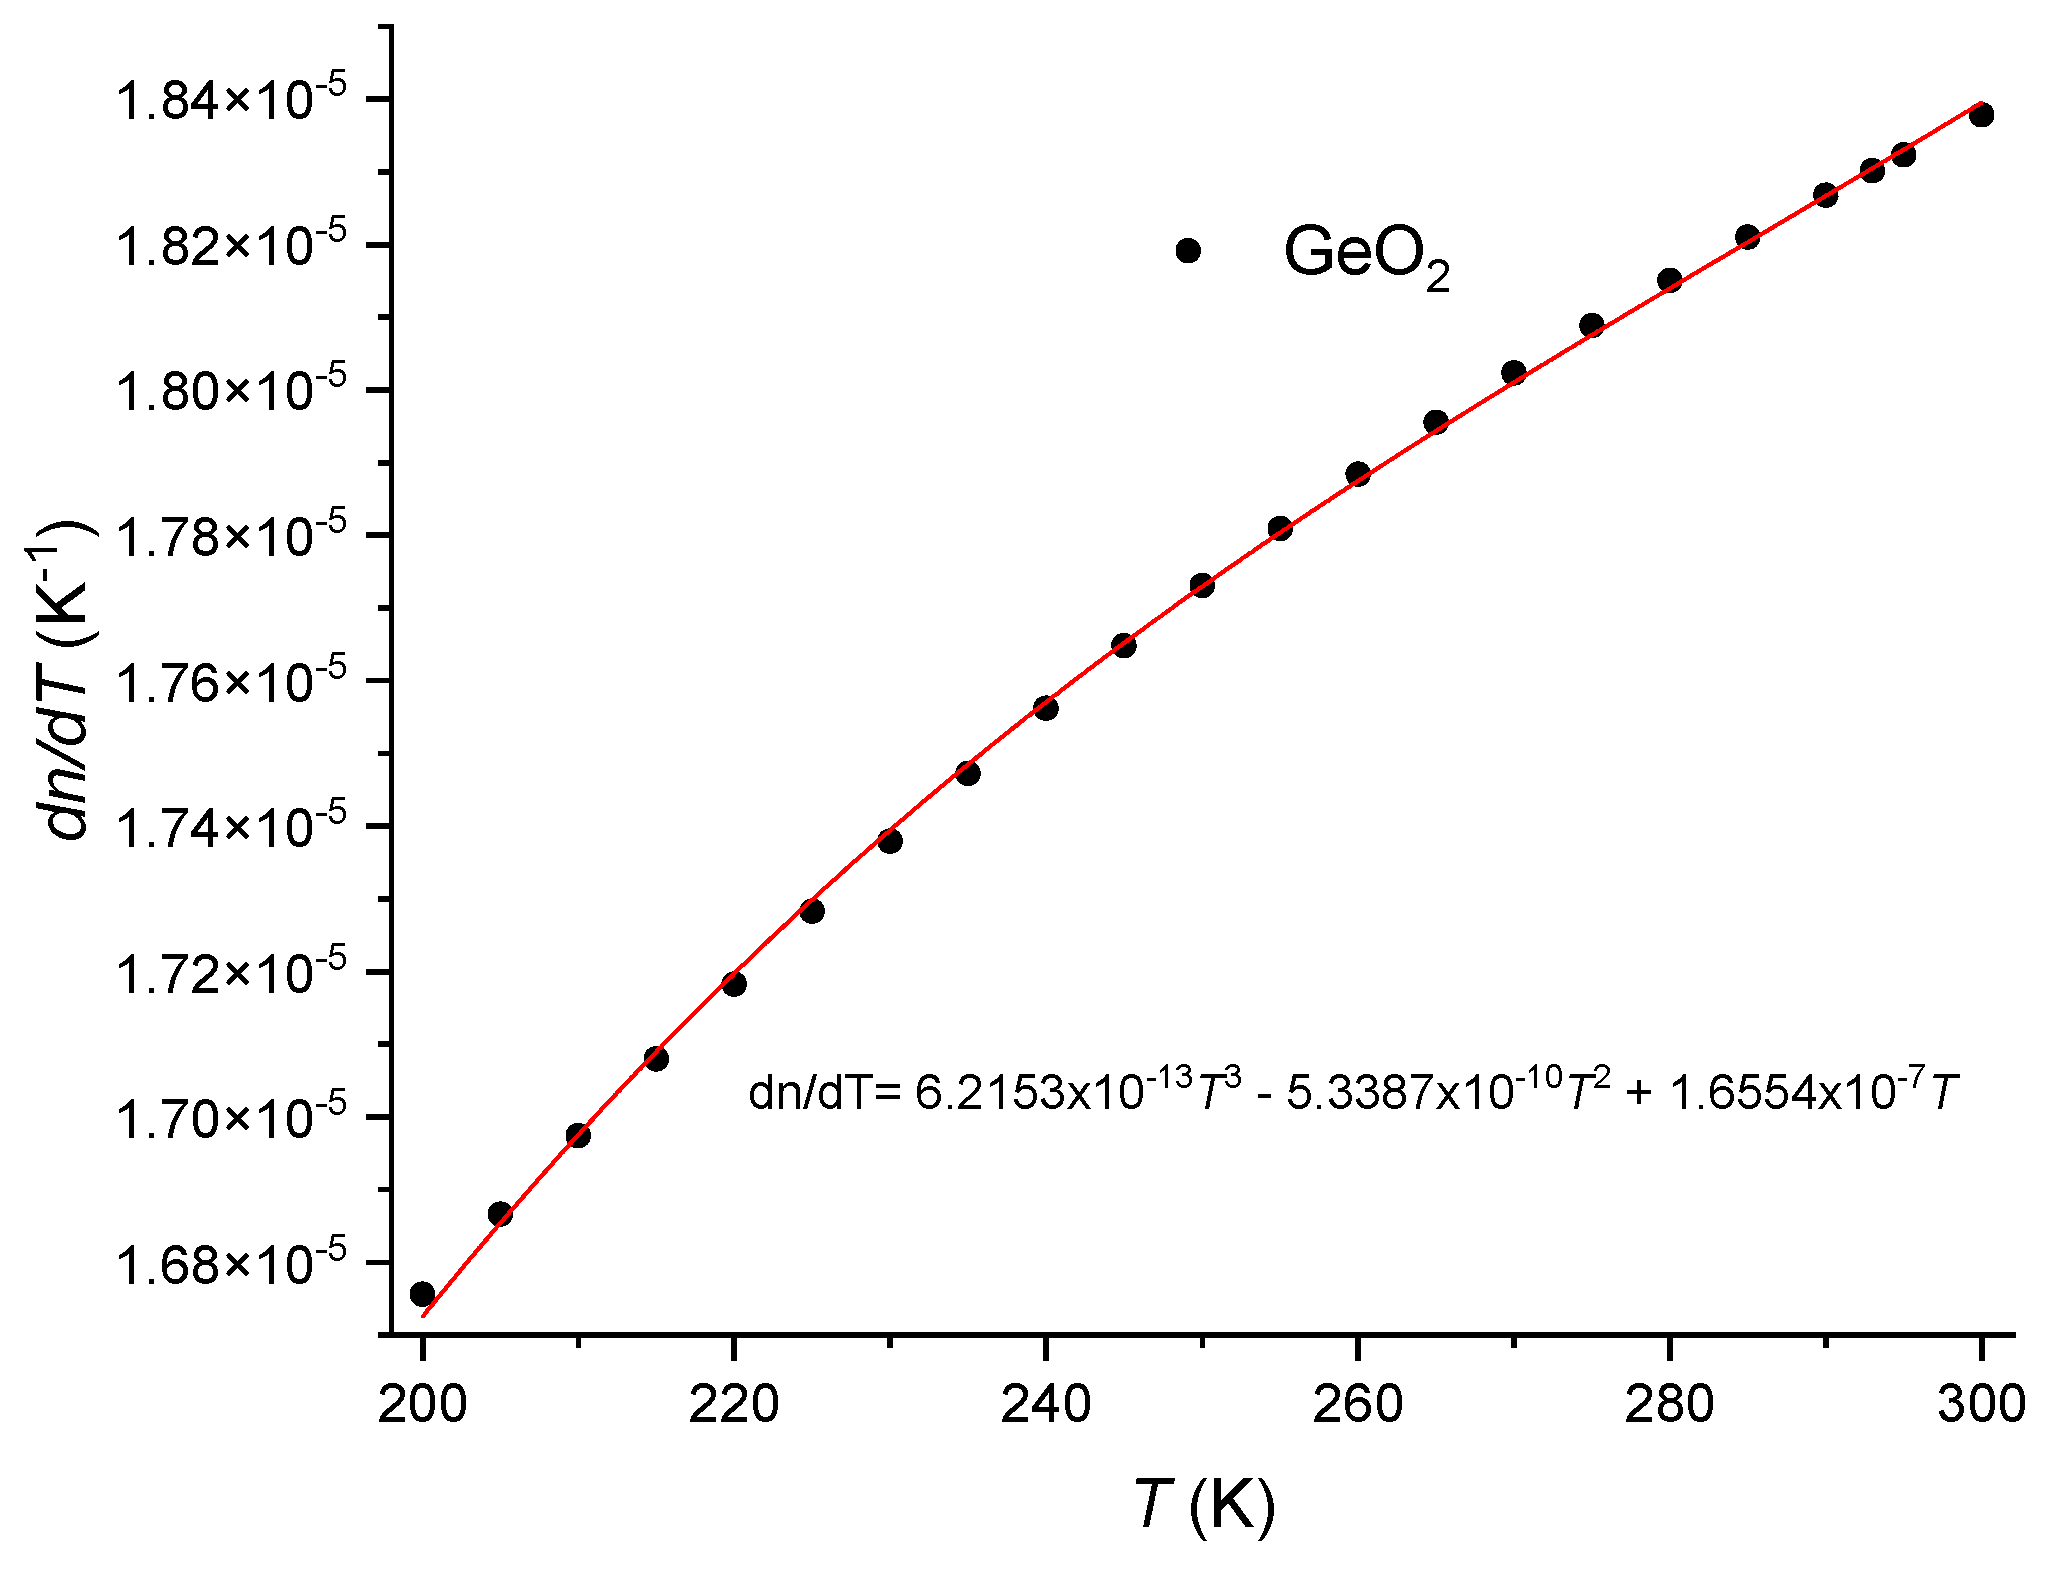
taking into consideration that dvS/dT=0.22 [70] and that (1/C)dC/dT= 1.34x10⁻⁴ K-1 [75], yields dp44/dT=-1.57x10-5 K-1. Finally, from the relation between the Pockels’ coefficients, dp12/dT=-2.40x10-5 K-1. The temperature dependence of the Poisson ratio is dν/dT=3.76x10-5 K-1 [70]. Due to the weak dependence on temperature exhibited by the Pockels’ coefficients and Poisson ratio, the correction factor is essentially dominated by the difference in the thermal expansion coefficients of the core and cladding. Figure 4 shows the thermal expansion coefficient for pure silica and the SMF-28 fiber. As can be observed the difference between the two curves decreases as the temperature decreases and, consequently, the correction factor also decreases. The thermal expansion coefficient for the SMF-28 fiber was obtained through the use of the additivity model (<4 mol% GeO2) [43,111,112] where for GeO2 glass [113,114] we have used data from [115,116] but with fix values at very low temperatures [117], 293 K [63] and 473 K [118]. Following this procedure, data was fitted with an equation similar to the one used by Okaji et al. [57] for SiO2 glass being the coefficients 1.27, 82.42, 1.23, 8.85 and 522.8, respectively. As a final remark, it should be mentioned that without the correction factor, the effective thermo-optic coefficient for the core (SMF-28 fiber) and cladding would be essentially the same. Figure 5 was obtained by using Eq. (6), Eq. (7) and Eq. (12), the values adjusted of KT from [119] and the temperature dependence of the SiO2 from [1]. An estimative for the temperature dependence of the thermo-optic coefficient is presented in Figure 6, where we have assumed a linear dependence on temperature for Pockels’ coefficients and Poisson ratio [70].
Other potential techniques to determine the thermo-optic coefficient of an optical fiber are based, for instance, on Fabry-Perot interferometers (FPI) [120,121,122,123,124], Rayleigh backscattering [125,126,127] and optoelectronic oscillations [128,129]. FPI is the most used approach and thus, for the sake of comparison we estimated from [121] a value of 8.22x10⁻⁶ K-1 for the effective thermo-optic coefficient of a standard fiber, being therefore in excellent agreement (with the value, without correction, obtained in the previous section). On the other hand, following the procedure presented in [120] the values ranged from 8.10x10⁻⁶ K-1 (average heating cycles) up to 8.70x10⁻⁶ K-1 (first heating up). The reasons for the discrepancy are related with two facts: first, the reference temperature, 20ºC, is the lower limit of the temperature interval of the experiment causing uncertainties to the derivative of the fitting equation; second, heating successively above 600 ºC makes irreversible changes to the glass structure which affects the temperature sensitivity and, consequently, the thermo-optic coefficient.

5. Conclusions

We have derived an expression that allows to determine the thermo-optic coefficient of weakly guiding fibers. Our analysis was based on FBG although it can also be used for FPI and Rayleigh scattering. We concluded that the thermo-optic coefficient (effective) of the SMF-28 fiber and of the cladding are essentially the same if one does not consider the correction factor. We estimated the thermo-optic coefficient of the bulk GeO2 glass from 200 K up to 300 K being 18.3x10⁻⁶ K-1 at 293 K and 1.55 μm We obtained an expression for the temperature dependence of the thermal expansion coefficient of GeO2-doped silica fibers. Expressions for the transverse and longitudinal acoustic velocities as a function of GeO2 concentration were also presented. We have determined values for the Poisson ratio, the Pockels’ coefficients and photoelastic constant for the SMF-28 fiber. We have also discussed the dispersion and temperature dependence of Pockels’ coefficients. We are aware of the uncertainty of some values used, however this paper presents the relations between the different parameters that allow a straightforward correction, if required. Therefore, currently we are investigating the temperature sensitivity of FBGs inscribed, with femtosecond and UV laser radiation, in fibers with different GeO2 concentration and we are also researching the effect of the Bragg wavelength, hydrogen loading and reflectivity, and the results will be published elsewhere.

Funding

This work was financed by national funds through the Portuguese funding agency, FCT-Fundação para a Ciência e a Tecnologia, within project LA/P/0063/2020.

Institutional Review Board Statement

Not applicable.

Informed Consent Statement

Not applicable.

Data Availability Statement

The data segments can be obtained by contacting the corresponding author.

Acknowledgments

The author would like to express its gratitude to Ignacio Del Villar, J. J. Imas, Rogério Nogueira and Ricardo Oliveira for providing FBGs’ data.

Conflicts of Interest

The authors declare no conflicts of interest.

References

  1. Rego, G. Temperature Dependence of the Thermo-Optic Coefficient of SiO2 Glass. Sensors 2023, 23, 6023. [Google Scholar] [CrossRef] [PubMed]
  2. Kouskousis, B.; Kitcher, D.J.; Collins, S.; Roberts, A.; Baxter, G.W. Quantitative phase and refractive index analysis of optical fibers using differential interference contrast microscopy. Appl. Opt. 2008, 47, 5182–5189. [Google Scholar] [CrossRef] [PubMed]
  3. Boilard, T.; Vallée, R.; Bernier, M. Probing the dispersive properties of optical fibers with an array of femtosecond-written fiber Bragg gratings. Sci. Rep. 2022, 12, 1–8. [Google Scholar] [CrossRef]
  4. Drouin, A.; Lorre, P.; Boisvert, J.-S.; Loranger, S.; Iezzi, V.L.; Kashyap, R. Spatially resolved cross-sectional refractive index profile of fs laser–written waveguides using a genetic algorithm. Opt. Express 2019, 27, 2488–2498. [Google Scholar] [CrossRef] [PubMed]
  5. Yablon, A.D. Multi-Wavelength Optical Fiber Refractive Index Profiling by Spatially Resolved Fourier Transform Spectroscopy. J. Light. Technol. 2009, 28, 360–364. [Google Scholar] [CrossRef]
  6. Bélanger, E.; Bérubé, J.-P.; de Dorlodot, B.; Marquet, P.; Vallée, R. Comparative study of quantitative phase imaging techniques for refractometry of optical waveguides. Opt. Express 2018, 26, 17498–17510. [Google Scholar] [CrossRef] [PubMed]
  7. Mangini, F.; Ferraro, M.; Zitelli, M.; Niang, A.; Tonello, A.; Couderc, V.; Sidelnikov, O.; Frezza, F.; Wabnitz, S. Experimental observation of self-imaging in SMF-28 optical fibers. Opt. Express 2021, 29, 12625–12633. [Google Scholar] [CrossRef] [PubMed]
  8. Wang, P.; Jenkins, M.H.; Gaylord, T.K. Arc-discharge effects on residual stress and refractive index in single-mode optical fibers. Appl. Opt. 2016, 55, 2451–2456. [Google Scholar] [CrossRef] [PubMed]
  9. Raine, K.; Baines, J.; Putland, D. Refractive index profiling-state of the art. J. Light. Technol. 1989, 7, 1162–1169. [Google Scholar] [CrossRef]
  10. Gisin, N.; Passy, R.; Perny, B. Optical fiber characterization by simultaneous measurement of the transmitted and refracted near field. J. Light. Technol. 1993, 11, 1875–1883. [Google Scholar] [CrossRef]
  11. Chavez-Gutierrez, F.; Martinez-Rios, A.; Toral-Acosta, D.; Torres-Armenta, D.; Guerrero-Viramontes, J.A. Measurement of optical fiber parameters and thermal core diffusion characteristics by digital image processing. Appl. Opt. 2018, 57, 4331–4336. [Google Scholar] [CrossRef] [PubMed]
  12. Martinez, F.; Hussey, C. (E)ESI determination from mode-field diameter and refractive index profile measurements on single-mode fibres. Iee Proc. J Optoelectron. 1988, 135, 202–210. [Google Scholar] [CrossRef]
  13. Young, M. Optical fiber index profiles by the refracted-ray method (refracted near-field scanning). Appl. Opt. 1981, 20, 3415–3422. [Google Scholar] [CrossRef] [PubMed]
  14. Bayuwati, D.; Waluyo, T.B.; Mulyanto, I. Determination of the effective cut-off wavelength of several single-mode fiber patchcords. J. Physics: Conf. Ser. 2018, 985, 012002. [Google Scholar] [CrossRef]
  15. Marcuse, D. Gaussian approximation of the fundamental modes of graded-index fibers. J. Opt. Soc. Am. 1978, 68, 103–109. [Google Scholar] [CrossRef]
  16. elikel, O. , Mode field diameter and cut-off wavelength measurements of single mode optical fiber standards used in OTDR calibrations. Optical and Quantum Electronics 2005, 37, 587–604. [Google Scholar] [CrossRef]
  17. Schermer, R.T.; Cole, J.H. Improved Bend Loss Formula Verified for Optical Fiber by Simulation and Experiment. IEEE J. Quantum Electron. 2007, 43, 899–909. [Google Scholar] [CrossRef]
  18. Kokubun, Y.; Iga, K. Refractive-index profile measurement of preform rods by a transverse differential interferogram. Appl. Opt. 1980, 19, 846–851. [Google Scholar] [CrossRef] [PubMed]
  19. Raine, K.W., J. G. Baines, and R.J. King Comparison of refractive index measurements of optical fibres by three methods. IEE Proceedings J (Optoelectronics) 1988, 135, 190–195. [Google Scholar]
  20. Hutsel, M.R.; Gaylord, T.K. Concurrent three-dimensional characterization of the refractive-index and residual-stress distributions in optical fibers. Appl. Opt. 2012, 51, 5442–5452. [Google Scholar] [CrossRef]
  21. Jenkins, M.H.; Gaylord, T.K. 3D Characterization of the Refractive-Index and Residual-Stress Distributions in Optical Fibers.
  22. Pace, P.; Huntington, S.T.; Roberts, A.; Love, J.D.; Lyytikäinen, K. Refractive index profiles of Ge-doped optical fibers with nanometer spatial resolution using atomic force microscopy. Opt. Express 2004, 12, 1452–1457. [Google Scholar] [CrossRef] [PubMed]
  23. Hutsel, M.R.; Ingle, R.; Gaylord, T.K. Accurate cross-sectional stress profiling of optical fibers. Appl. Opt. 2009, 48, 4985–4995. [Google Scholar] [CrossRef] [PubMed]
  24. Rego, G.M.; Santos, J.L.; Salgado, H.M. Refractive index measurement with long-period gratings arc-induced in pure-silica-core fibres. Opt. Commun. 2005, 259, 598–602. [Google Scholar] [CrossRef]
  25. Juelich, F.; Roths, J. OP2 - Determination of the Effective Refractive Index of Various Single Mode Fibres for Fibre Bragg Grating Sensor Applications. 2009.
  26. Gloge, D. Weakly Guiding Fibers. Appl. Opt. 1971, 10, 2252–2258. [Google Scholar] [CrossRef] [PubMed]
  27. Snyder, A.W.; Rühl, F. Single-mode, single-polarization fibers made of birefringent material. J. Opt. Soc. Am. 1983, 73, 1165–1174. [Google Scholar] [CrossRef]
  28. Dragic, P. Simplified model for effect of Ge doping on silica fibre acoustic properties. Electron. Lett. 2009, 45, 256–257. [Google Scholar] [CrossRef]
  29. Pan, G. , et al. , Thermo-optic coefficient of B2O3 and GeO2 co-doped silica fibers. Optical Materials Express 2020, 10, 1509–1521. [Google Scholar]
  30. Uhlmann, D.R. and N. J. Kreidl. Optical properties of glass. 1991.
  31. Yablon, A.D. Optical and Mechanical Effects of Frozen-in Stresses and Strains in Optical Fibers. IEEE J. Sel. Top. Quantum Electron. 2004, 10, 300–311. [Google Scholar] [CrossRef]
  32. Roselló-Mechó, X.; Delgado-Pinar, M.; Díez, A.; Andrés, M.V. Measurement of Pockels’ coefficients and demonstration of the anisotropy of the elasto-optic effect in optical fibers under axial strain. Opt. Lett. 2016, 41, 2934–2937. [Google Scholar] [CrossRef] [PubMed]
  33. Ryan, C.; Dragic, P.; Furtick, J.; Kucera, C.J.; Stolen, R.; Ballato, J. Pockels Coefficients in Multicomponent Oxide Glasses. Int. J. Appl. Glas. Sci. 2015, 6, 387–396. [Google Scholar] [CrossRef]
  34. Malitson, I.H. Interspecimen comparison of the refractive index of fused silica. J. Opt. Soc. Am. 1965, 55, 1205–1209. [Google Scholar] [CrossRef]
  35. Fleming, J. Material dispersion in lightguide glasses. Electron. Lett. 1978, 14, 326–328. [Google Scholar] [CrossRef]
  36. Leviton, D.B.; Frey, B.J. Temperature-dependent absolute refractive index measurements of synthetic fused silica. in Proceedings of SPIE - The International Society for Optical Engineering. 2006.
  37. Yablon, A.D.; Yan, M.F.; Wisk, P.; DiMarcello, F.V.; Fleming, J.W.; Reed, W.A.; Monberg, E.M.; DiGiovanni, D.J.; Jasapara, J.; Lines, M.E. Refractive index perturbations in optical fibers resulting from frozen-in viscoelasticity. Appl. Phys. Lett. 2004, 84, 19–21. [Google Scholar] [CrossRef]
  38. Hibino, Y.; Hanawa, F.; Horiguchi, M. Drawing-induced residual stress effects on optical characteristics in pure-silica-core single-mode fibers. J. Appl. Phys. 1989, 65, 30–34. [Google Scholar] [CrossRef]
  39. Anuszkiewicz, A.; Bidus, M.; Filipkowski, A.; Pysz, D.; Dlubek, M.; Buczynski, R. Experimental analysis of axial stress distribution in nanostructured core fused silica fibers. Opt. Mater. Express 2019, 9, 4370–4378. [Google Scholar] [CrossRef]
  40. Kawachi, M., T. Edahiro, and H. Toba Microlens formation on VAD single-mode fibre ends. Electronics Letters 1982, 18, 71–72. [Google Scholar]
  41. Devyatykh, G.G.; Dianov, E.M.; Karpychev, N.S.; Mazavin, S.M.; Mashinskiĭ, V.M.; Neustruev, V.B.; Nikolaĭchik, A.V.; Prokhorov, A.M.; I Ritus, A.; I Sokolov, N.; et al. Material dispersion and Rayleigh scattering in glassy germanium dioxide, a substance with promising applications in low-loss optical fiber waveguides. Sov. J. Quantum Electron. 1980, 10, 900–902. [Google Scholar] [CrossRef]
  42. Grobnic, D.; Mihailov, S.J.; Ballato, J.; Dragic, P.D. Type I and II Bragg gratings made with infrared femtosecond radiation in high and low alumina content aluminosilicate optical fibers. Optica 2015, 2, 313. [Google Scholar] [CrossRef]
  43. Cavillon, M.; Dragic, P.D.; Ballato, J. Additivity of the coefficient of thermal expansion in silicate optical fibers. Opt. Lett. 2017, 42, 3650–3653. [Google Scholar] [CrossRef]
  44. Dragic, P.D.; Cavillon, M.; Ballato, A.; Ballato, J. A unified materials approach to mitigating optical nonlinearities in optical fiber. II. A. Material additivity models and basic glass properties. Int. J. Appl. Glas. Sci. 2017, 9, 278–287. [Google Scholar] [CrossRef]
  45. Dianov, E.M. and V. M. Mashinsky, Germania-based core optical fibers. Journal of Lightwave Technology 2005, 23, 3500–3508. [Google Scholar]
  46. Erdogan, T. , Fiber grating spectra. Journal of Lightwave Technology 1997, 15, 1277–1294. [Google Scholar] [CrossRef]
  47. Pal, S.; Mandal, J.; Sun, T.; Grattan, K.T.V.; Fokine, M.; Carlsson, F.; Fonjallaz, P.Y.; A Wade, S.; Collins, S.F. Characteristics of potential fibre Bragg grating sensor-based devices at elevated temperatures. Meas. Sci. Technol. 2003, 14, 1131–1136. [Google Scholar] [CrossRef]
  48. Filho, E.S.d.L.; Baiad, M.D.; Gagné, M.; Kashyap, R. Fiber Bragg gratings for low-temperature measurement. Opt. Express 2014, 22, 27681–27694. [Google Scholar] [CrossRef] [PubMed]
  49. Frazão, O.; Santos, J.L. Simultaneous measurement of strain and temperature using a Bragg grating structure written in germanosilicate fibres. J. Opt. A: Pure Appl. Opt. 2004, 6, 553–556. [Google Scholar] [CrossRef]
  50. Durr, F.; Rego, G.; Marques, P.; Semjonov, S.; Dianov, E.; Limberger, H.; Salathe, R. Tomographic stress profiling of arc-induced long-period fiber gratings. J. Light. Technol. 2005, 23, 3947–3953. [Google Scholar] [CrossRef]
  51. Rego, G.; Caldas, P.; Ivanov, O.; Santos, J.L. Investigation of the long-term stability of arc-induced gratings heat treated at high temperatures. Opt. Commun. 2010, 284, 169–171. [Google Scholar] [CrossRef]
  52. Flockhart, G.M.H.; Maier, R.R.J.; Barton, J.S.; MacPherson, W.N.; Jones, J.D.C.; Chisholm, K.E.; Zhang, L.; Bennion, I.; Read, I.; Foote, P.D. Quadratic behavior of fiber Bragg grating temperature coefficients. Appl. Opt. 2004, 43, 2744–2751. [Google Scholar] [CrossRef]
  53. Imas, J.J.; Bai, X.; Zamarreño, C.; Matias, I.; Albert, J. Accurate compensation and prediction of the temperature cross-sensitivity of tilted FBG cladding mode resonances. Appl. Opt. 2023, 62, E8–E15. [Google Scholar] [CrossRef]
  54. Brückner, R. Properties and structure of vitreous silica. II. J. Non-Crystalline Solids 1971, 5, 177–216. [Google Scholar] [CrossRef]
  55. Kühn, B.; Schadrack, R. Thermal expansion of synthetic fused silica as a function of OH content and fictive temperature. J. Non-Crystalline Solids 2009, 355, 323–326. [Google Scholar] [CrossRef]
  56. Patrick, E. , Expansivity of fused quartz glass measured within 6 x 10^-10 /K. 2023.
  57. Okaji, M.; Yamada, N.; Nara, K.; Kato, H. Laser interferometric dilatometer at low temperatures: application to fused silica SRM 739. Cryogenics 1995, 35, 887–891. [Google Scholar] [CrossRef]
  58. Hahn, T.A. and R. K. Kirby, Thermal Expansion of Fused Silica from 80 to 1000 K - Standard Reference Material 739. AIP Conference Proceedings 1972, 3, 13–24. [Google Scholar]
  59. Bennett, S.J. An absolute interferometric dilatometer. J. Phys. E: Sci. Instruments 1977, 10, 525–530. [Google Scholar] [CrossRef]
  60. Birch, K.P. An automatic absolute interferometric dilatometer. J. Phys. E: Sci. Instruments 1987, 20, 1387–1392. [Google Scholar] [CrossRef]
  61. Berthold, J.W.; Jacobs, S.F. Ultraprecise thermal expansion measurements of seven low expansion materials. Appl. Opt. 1976, 15, 2344–2347. [Google Scholar] [CrossRef]
  62. Wang, H.; Yamada, N.; Okaji, M. Precise Dilatometric Measurements of Silica Glasses. Netsu Bussei 1999, 13, 17–22. [Google Scholar] [CrossRef]
  63. White, T.H.K.B.a.G.K. , Heat capacity and thermal expansion at low temperatures. International cryogenics monograph series. 1999: New York : Kluwer Academic/Plenum.
  64. Gulati, S.T. and J. D. Helfinstine, Fatigue Behavior of GeO2-SiO2 Glasses. MRS Online Proceedings Library 1998, 531, 133–141. [Google Scholar] [CrossRef]
  65. Riebling, E.F. , Nonideal Mixing in Binary Ge0,-SiO, Glasses. Journal of the American Ceramic Society 1968, 51, 406–407. [Google Scholar] [CrossRef]
  66. Huang, Y.; Sarkar, A.; Schultz, P. Relationship between composition, density and refractive index for germania silica glasses. J. Non-Crystalline Solids 1978, 27, 29–37. [Google Scholar] [CrossRef]
  67. Mackenzie, J.D. Density and Expansivity of Vitreous Germania. J. Am. Ceram. Soc. 1959, 42, 310–310. [Google Scholar] [CrossRef]
  68. Napolitano, A.; Macedo, P. Spectrum of Relaxation Times in GeO2 Glass. J. Res. Natl. Bur. Stand. Sect. A: Phys. Chem. 1968, 72, 425–433. [Google Scholar] [CrossRef] [PubMed]
  69. Adamovsky, G.; Lyuksyutov, S.F.; Mackey, J.R.; Floyd, B.M.; Abeywickrema, U.; Fedin, I.; Rackaitis, M. Peculiarities of thermo-optic coefficient under different temperature regimes in optical fibers containing fiber Bragg gratings. Opt. Commun. 2012, 285, 766–773. [Google Scholar] [CrossRef]
  70. Sánchez, L.A.; Diez, A.; Cruz, J.L.; Andrés, M. High accuracy measurement of Poisson’s ratio of optical fibers and its temperature dependence using forward-stimulated Brillouin scattering. Opt. Express 2021, 30, 42–52. [Google Scholar] [CrossRef] [PubMed]
  71. Jog, E.S.; Krishnan, R.S. Dispersion of the Photoelastic Constants of Fused Silica. Nature 1957, 179, 540–541. [Google Scholar] [CrossRef]
  72. Biegelsen, D.K.; Zesch, J.C. Optical frequency dependence of the photoelastic coefficients of fused silica. J. Appl. Phys. 1976, 47, 4024–4025. [Google Scholar] [CrossRef]
  73. Jenkins, A.; Sutherland, C.; Werner-Zwanziger, U.; Zwanziger, J. Wavelength-dependent elasto-optic tensor elements from acoustic Bragg diffraction. J. Non-Crystalline Solids 2023, 620. [Google Scholar] [CrossRef]
  74. Martina, D.-P. , et al., Whispering Gallery Modes for Accurate Characterization of Optical Fibers’ Parameters, in Applications of Optical Fibers for Sensing, C.-L. Christian, Editor. 2018, IntechOpen: Rijeka. Ch. 8.
  75. Barlow, A.; Payne, D. The stress-optic effect in optical fibers. IEEE J. Quantum Electron. 1983, 19, 834–839. [Google Scholar] [CrossRef]
  76. Bertholds, A.; Dandliker, R. Determination of the individual strain-optic coefficients in single-mode optical fibres. J. Light. Technol. 1988, 6, 17–20. [Google Scholar] [CrossRef]
  77. Schuh, R.; Shan, X.; Siddiqui, A. Polarization mode dispersion in spun fibers with different linear birefringence and spinning parameters. J. Light. Technol. 1998, 16, 1583–1588. [Google Scholar] [CrossRef]
  78. Sánchez, L.A.; Díez, A.; Cruz, J.L.; Andrés, M.V. Strain and temperature measurement discrimination with forward Brillouin scattering in optical fibers. Opt. Express 2022, 30, 14384–14392. [Google Scholar] [CrossRef] [PubMed]
  79. Zou, W., Z. He, and K. Hotate, Investigation of Strain- and Temperature-Dependences of Brillouin Frequency Shifts in GeO$_{2}$ -Doped Optical Fibers. Journal of Lightwave Technology 2008, 26, 1854–1861. [Google Scholar]
  80. Deroh, M.; Kibler, B.; Maillotte, H.; Sylvestre, T.; Beugnot, J.-C. Large Brillouin gain in Germania-doped core optical fibers up to a 98 mol% doping level. Opt. Lett. 2018, 43, 4005–4008. [Google Scholar] [CrossRef] [PubMed]
  81. Beugnot, J.-C.; Laude, V. Electrostriction and guidance of acoustic phonons in optical fibers. Phys. Rev. B 2012, 86. [Google Scholar] [CrossRef]
  82. Lambin-Iezzi, V.; Loranger, S.; Saad, M.; Kashyap, R. Stimulated Brillouin scattering in SM ZBLAN fiber. J. Non-Crystalline Solids 2013, 359, 65–68. [Google Scholar] [CrossRef]
  83. Zou, W.; He, Z.; Yablon, A.D.; Hotate, K. Dependence of Brillouin Frequency Shift in Optical Fibers on Draw-Induced Residual Elastic and Inelastic Strains. IEEE Photon- Technol. Lett. 2007, 19, 1389–1391. [Google Scholar] [CrossRef]
  84. Le Parc, R.; Levelut, C.; Pelous, J.; Martinez, V.; Champagnon, B. Influence of fictive temperature and composition of silica glass on anomalous elastic behaviour. J. Physics: Condens. Matter 2006, 18, 7507–7527. [Google Scholar] [CrossRef]
  85. Thomas, P.J.; Rowell, N.L.; van Driel, H.M.; Stegeman, G.I. Normal acoustic modes and Brillouin scattering in single-mode optical fibers. Phys. Rev. B 1979, 19, 4986–4998. [Google Scholar] [CrossRef]
  86. Zou, W.; He, Z.; Hotate, K. Two-Dimensional Finite-Element Modal Analysis of Brillouin Gain Spectra in Optical Fibers. IEEE Photon- Technol. Lett. 2006, 18, 2487–2489. [Google Scholar] [CrossRef]
  87. Dragic, P.D. Brillouin spectroscopy of Nd–Ge co-doped silica fibers. J. Non-Crystalline Solids 2009, 355, 403–413. [Google Scholar] [CrossRef]
  88. Koyamada, Y.; Sato, S.; Nakamura, S.; Sotobayashi, H.; Chujo, W. Simulating and Designing Brillouin Gain Spectrum in Single-Mode Fibers. J. Light. Technol. 2004, 22, 631–639. [Google Scholar] [CrossRef]
  89. Jen, C.-K. , et al. , Acoustic Characterization of Silica Glasses. Journal of the American Ceramic Society 1993, 76, 712–716. [Google Scholar]
  90. Nikles, M.; Thevenaz, L.; Robert, P. Brillouin gain spectrum characterization in single-mode optical fibers. J. Light. Technol. 1997, 15, 1842–1851. [Google Scholar] [CrossRef]
  91. Lagakos, N.; Bucaro, J.A.; Hughes, R. Acoustic sensitivity predictions of single-mode optical fibers using Brillouin scattering. Appl. Opt. 1980, 19, 3668–3670. [Google Scholar] [CrossRef]
  92. Munro, R.G. Elastic Moduli Data for Polycrystalline Oxide Ceramics | NIST. 2002.
  93. Clowes, J.; Syngellakis, S.; Zervas, M. Pressure sensitivity of side-hole optical fiber sensors. IEEE Photon- Technol. Lett. 1998, 10, 857–859. [Google Scholar] [CrossRef]
  94. Li, P.; Fu, C.; Zhong, H.; Du, B.; Guo, K.; Meng, Y.; Du, C.; He, J.; Wang, L.; Wang, Y. A Nondestructive Measurement Method of Optical Fiber Young’s Modulus Based on OFDR. Sensors 2022, 22, 1450. [Google Scholar] [CrossRef] [PubMed]
  95. Antunes, P.; Lima, H.; Monteiro, J.; André, P.S. Elastic constant measurement for standard and photosensitive single mode optical fibres. Microw. Opt. Technol. Lett. 2008, 50, 2467–2469. [Google Scholar] [CrossRef]
  96. Suito, K. , et al., Elastic Properties of Obsidian, Vitreous SiO2, and Vitreous GeO2 under High Pressure up to 6 GPa, in High-Pressure Research: Application to Earth and Planetary Sciences. 1992, 219–225.
  97. Makishima, A. and J. D. Mackenzie, Calculation of bulk modulus, shear modulus and Poisson's ratio of glass. Journal of Non-Crystalline Solids 1975, 17, 147–157. [Google Scholar]
  98. Rocherulle, J. , et al. , Elastic moduli of oxynitride glasses: Extension of Makishima and Mackenzie's theory. Journal of Non-Crystalline Solids 1989, 108, 187–193. [Google Scholar]
  99. Dragic, P.D. The Acoustic Velocity of Ge-Doped Silica Fibers: A Comparison of Two Models. Int. J. Appl. Glas. Sci. 2010, 1, 330–337. [Google Scholar] [CrossRef]
  100. Urbanczyk, W.; Martynkien, T.; Bock, W.J. Dispersion effects in elliptical-core highly birefringent fibers. Appl. Opt. 2001, 40, 1911–1920. [Google Scholar] [CrossRef] [PubMed]
  101. Galtarossa, A.; Grosso, D.; Palmieri, L. Accurate Characterization of Twist-Induced Optical Activity in Single-Mode Fibers by Means of Polarization-Sensitive Reflectometry. IEEE Photon- Technol. Lett. 2009, 21, 1713–1715. [Google Scholar] [CrossRef]
  102. Galtarossa, A.; Palmieri, L. Measure of twist-induced circular birefringence in long single-mode fibers: theory and experiments. J. Light. Technol. 2002, 20, 1149–1159. [Google Scholar] [CrossRef]
  103. Ivanov, O.V. Experimental Investigation of Rotation of Polarization in Strongly Twisted Optical Fibers of Various Types. in 2018 International Conference Laser Optics (ICLO). 2018.
  104. El-Khozondar, H.J. , et al. Experimental investigation of polarization rotation in twisted optical fibers. in 2009 International Symposium on Optomechatronic Technologies. 2009.
  105. Roths, J. and F Jülich. Determination of strain sensitivity of free fiber Bragg gratings. in Photonics Europe. 2008.
  106. Jülich, F.; Aulbach, L.; Wilfert, A.; Kratzer, P.; Kuttler, R.; Roths, J. Gauge factors of fibre Bragg grating strain sensors in different types of optical fibres. Meas. Sci. Technol. 2013, 24, 094007. [Google Scholar] [CrossRef]
  107. Acheroy, S.; Merken, P.; Geernaert, T.; Ottevaere, H.; Thienpont, H.; Berghmans, F. Algorithms for determining the radial profile of the photoelastic coefficient in glass and polymer optical fibers. Opt. Express 2015, 23, 18943–54. [Google Scholar] [CrossRef]
  108. Namihira, Y. Opto-elastic constant in single mode optical fibers. J. Light. Technol. 1985, 3, 1078–1083. [Google Scholar] [CrossRef]
  109. Sinha, N.K. , Normalised dispersion of birefringence of quartz and stress optical coefficient of fused silica and plate glass. Physics and Chemistry of Glasses 1978, 19, 69–77. [Google Scholar]
  110. Primak, W.; Post, D. Photoelastic Constants of Vitreous Silica and Its Elastic Coefficient of Refractive Index. J. Appl. Phys. 1959, 30, 779–788. [Google Scholar] [CrossRef]
  111. Riebling, E.F. Nonideal Mixing in Binary Ge0,-SiO, Glasses. J. Am. Ceram. Soc. 1968, 51, 406–407. [Google Scholar] [CrossRef]
  112. Huang, Y.; Sarkar, A.; Schultz, P. Relationship between composition, density and refractive index for germania silica glasses. J. Non-Crystalline Solids 1978, 27, 29–37. [Google Scholar] [CrossRef]
  113. Mackenzie, J.D. Density and Expansivity of Vitreous Germania. J. Am. Ceram. Soc. 1959, 42, 310–310. [Google Scholar] [CrossRef]
  114. Doweidar, H. , Considerations on the structure and physical properties of B2O3–SiO2 and GeO2–SiO2 glasses. Journal of Non-Crystalline Solids 2011, 357, 1665–1670. [Google Scholar] [CrossRef]
  115. Napolitano, A.; Macedo, P. Spectrum of Relaxation Times in GeO2 Glass. J. Res. Natl. Bur. Stand. Sect. A: Phys. Chem. 1968, 72, 425–433. [Google Scholar] [CrossRef] [PubMed]
  116. Spinner, S. and G. W. Cleek, Temperature Dependence of Young's Modulus of Vitreous Germania and Silica. Journal of Applied Physics 1960, 31, 1407–1410. [Google Scholar]
  117. Krause, J.T.; Kurkjian, C.R. Vibrational Anomalies in Inorganic Glass Formers. J. Am. Ceram. Soc. 1968, 51, 226–227. [Google Scholar] [CrossRef]
  118. Shelby, J.E. , Properties and structure of B2O3–GeO2 glasses. Journal of Applied Physics 1974, 45, 5272–5277. [Google Scholar] [CrossRef]
  119. Filho, E.S.d.L. , et al. , Fiber Bragg gratings for low-temperature measurement. Optics Express 2014, 22, 27681–27694. [Google Scholar] [PubMed]
  120. Wenyuan, W. , et al. Measurements of thermo-optic coefficient of standard single mode fiber in large temperature range. in Proc.SPIE. 2015.
  121. Wang, W. , et al. Fiber-Optic Intrinsic Fabry-Perot Temperature Sensor Fabricated by Femtosecond Lasers. in Optical Sensors and Biophotonics II. 2010. Shanghai: Optica Publishing Group.
  122. Chang, S. , et al. , Heterodyne interferometric measurement of the thermo-optic coefficient of single mode fiber. 2000, 38, 437–442. [Google Scholar]
  123. Li, L.L.L.; Zhang, D.Z.D.; Wen, X.W.X.; Peng, S.P.S. FFPI-FBG hybrid sensor to measure the thermal expansion and thermo-optical coefficient of a silica-based fiber at cryogenic temperatures. Chin. Opt. Lett. 2015, 13, 100601–100605. [Google Scholar] [CrossRef]
  124. Gao, H.; Jiang, Y.; Cui, Y.; Zhang, L.; Jia, J.; Jiang, L. Investigation on the Thermo-Optic Coefficient of Silica Fiber Within a Wide Temperature Range. J. Light. Technol. 2018, 36, 5881–5886. [Google Scholar] [CrossRef]
  125. Du, Y.; Liu, T.; Ding, Z.; Han, Q.; Liu, K.; Jiang, J.; Chen, Q.; Feng, B. Cryogenic Temperature Measurement Using Rayleigh Backscattering Spectra Shift by OFDR. IEEE Photon- Technol. Lett. 2014, 26, 1150–1153. [Google Scholar] [CrossRef]
  126. Kreger, S.T. , et al. High Resolution Distributed Strain or Temperature Measurements in Single-and Multi-mode Fiber Using Swept-Wavelength Interferometry. in Optical Fiber Sensors. 2006. O: Cancun.
  127. Chaccour, L. Rayleigh Backscattered Signal Enhancement in Highly GeO₂-Doped-Core Silica Fibers. IEEE Photon- Technol. Lett. 2022, 34, 345–348. [Google Scholar] [CrossRef]
  128. Terra, O. Optoelectronic oscillations for thermo-optic coefficient measurement of optical fibers. Meas. Sci. Technol. 2019, 30, 035205. [Google Scholar] [CrossRef]
  129. Zou, X.; Liu, X.; Li, W.; Li, P.; Pan, W.; Yan, L.; Shao, L. Optoelectronic Oscillators (OEOs) to Sensing, Measurement, and Detection. IEEE J. Quantum Electron. 2015, 52, 1–16. [Google Scholar] [CrossRef]
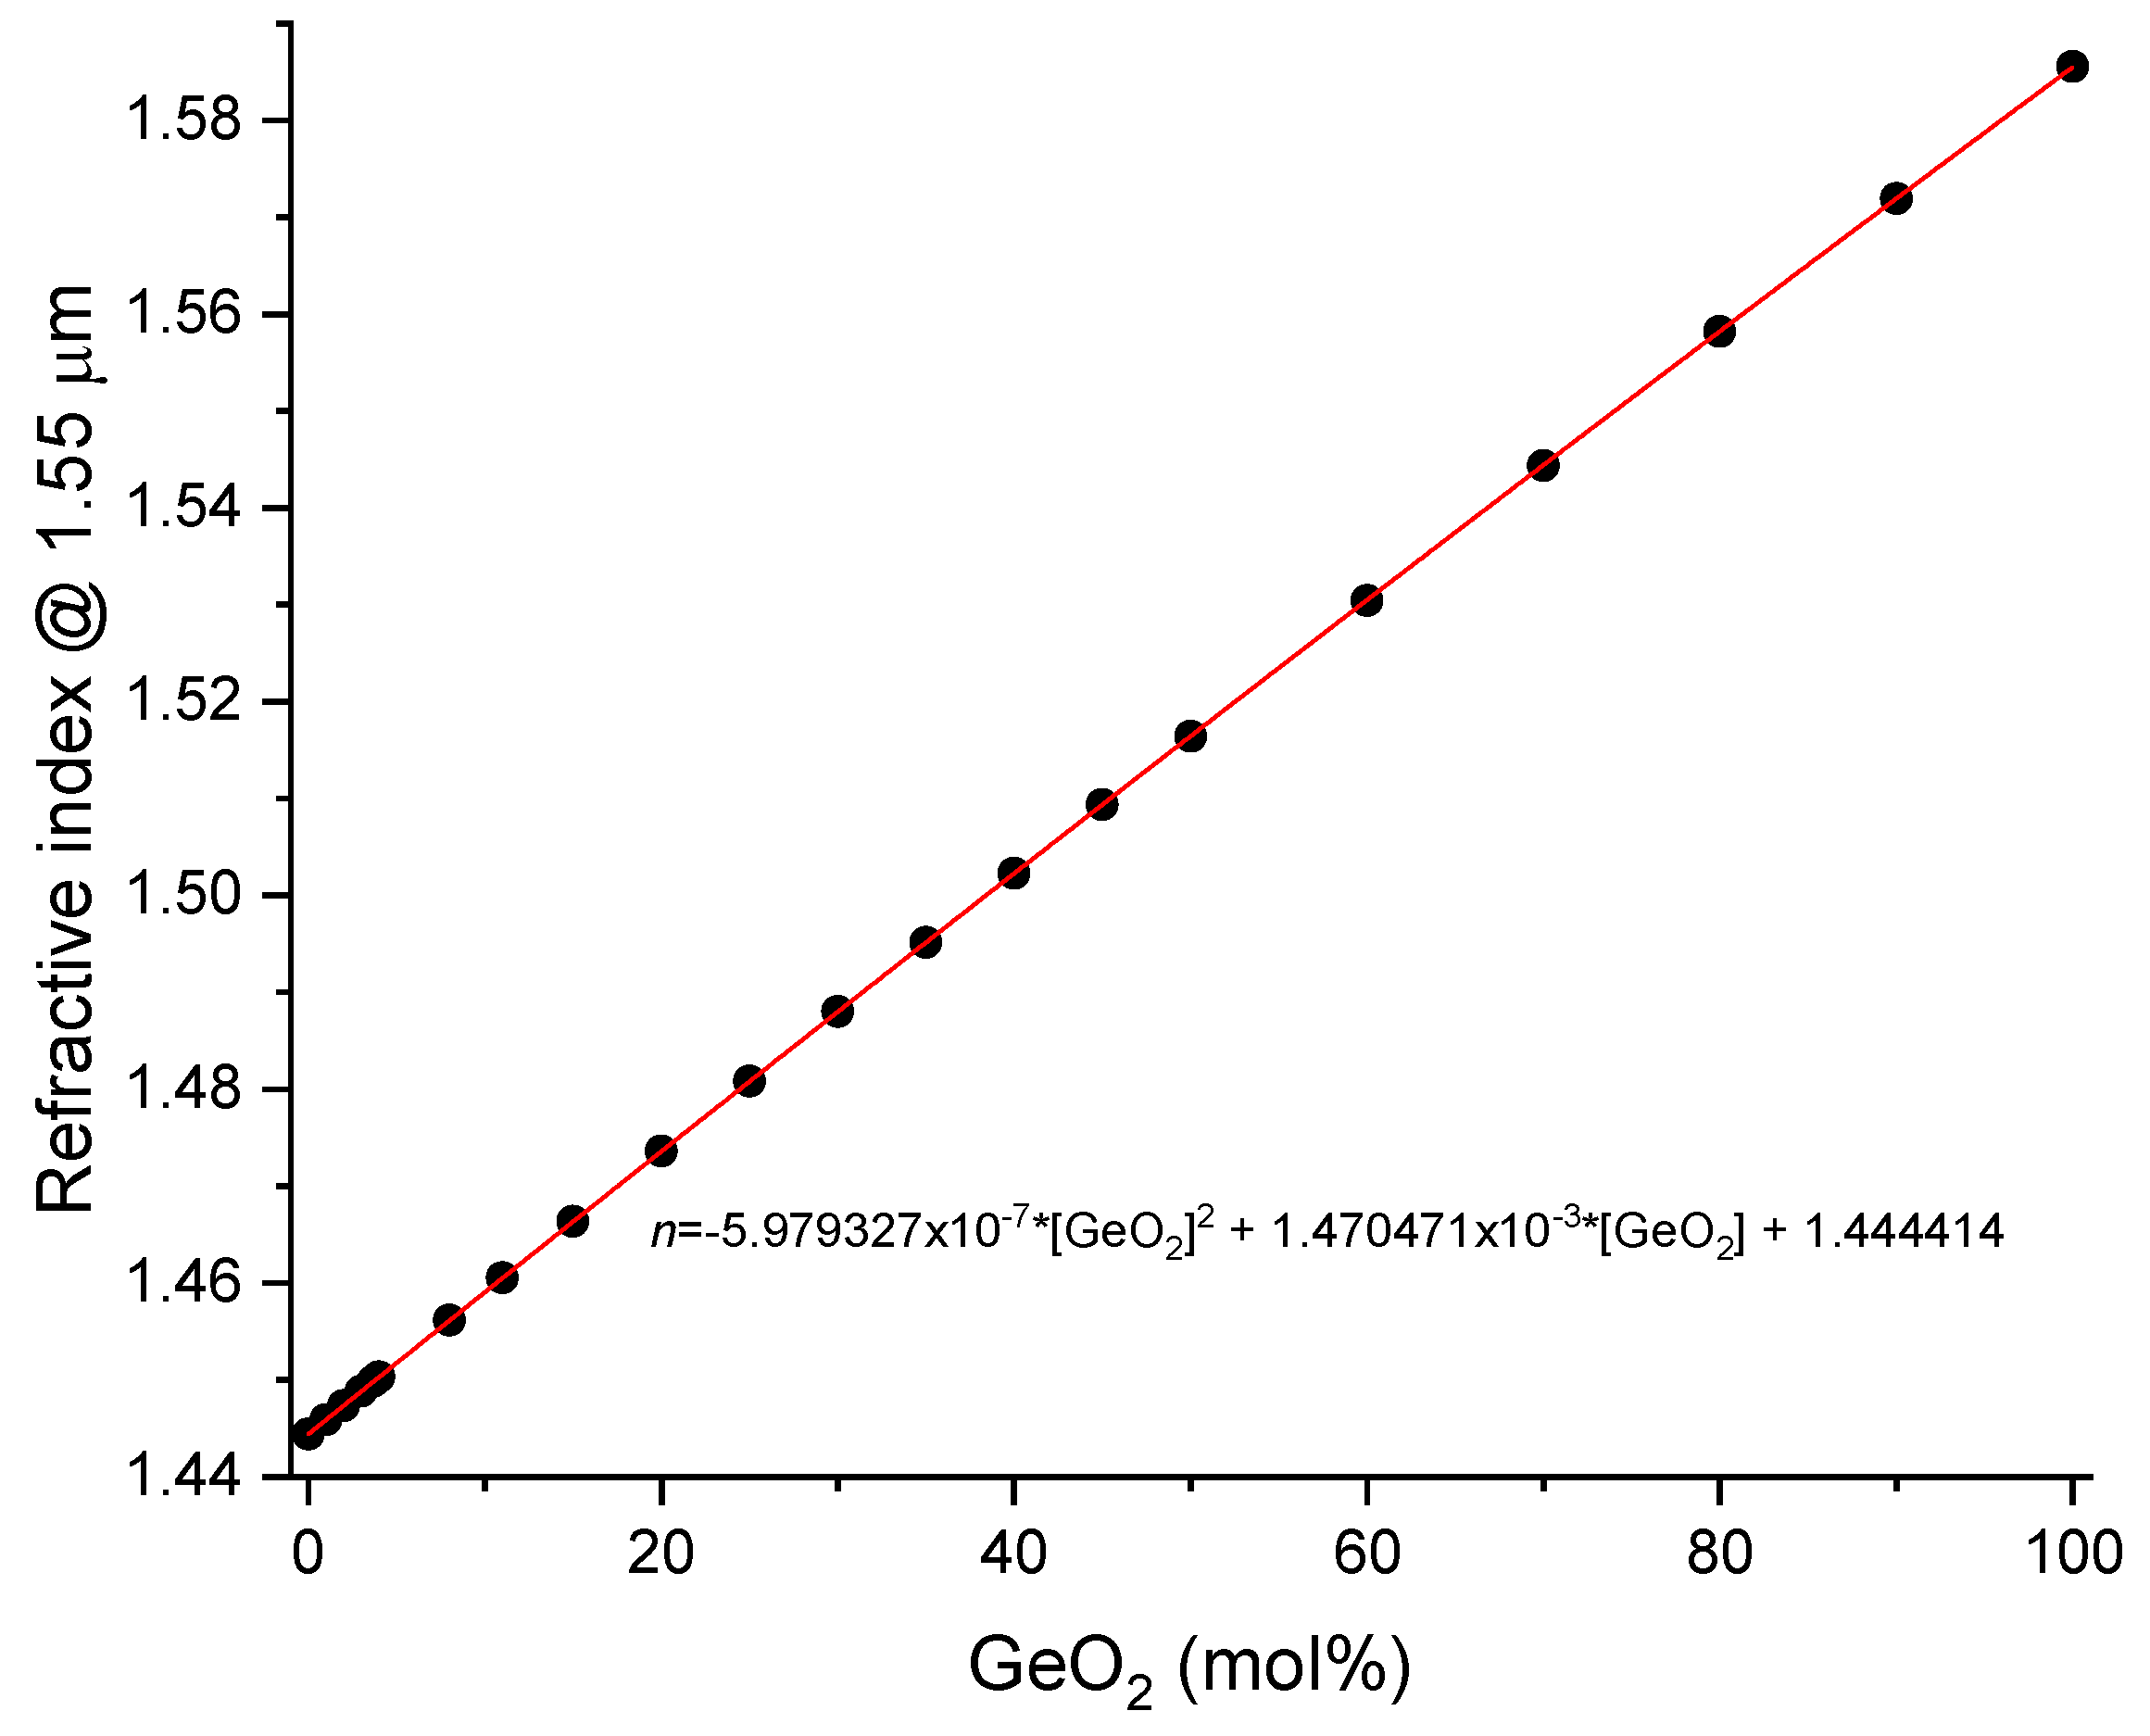
Figure 1. Refractive index of binary SiO2-GeO2 glasses at room temperature and 1.55 μm.
Preprints 111040 g001
Figure 2. Temperature gauge factor of a weak-FBG.
Preprints 111040 g002
Figure 3. Dispersion of the photoelastic constant for SiO2 and SiO2-GeO2 glasses.
Preprints 111040 g003
Figure 4. Thermal expansion coefficients for SiO2 and SMF-28 fiber.
Preprints 111040 g004
Figure 5. Thermo-optic coefficients for the cladding and core of the SMF-28 fiber.
Preprints 111040 g005
Figure 6. Thermo-optic coefficient for bulk GeO2 glass.
Preprints 111040 g006
Table 1. Physical parameters.
Material M (g/mol) ρ (kg/m3) α (x10-6 K-1) P11 P12 ν
SiO2 60.08 2200 0.45 0.121 0.270 0.170
GeO2 104.64 3650 7.7 0.130 0.288 0.212
Table 2. SBS and acoustic velocity.
GeO2 concentration (mol%) Brillouin frequency, fB (GHz) Longitudinal velocity, vL (m/s)
0 11.143 (extrapolated) 5986.5 (extrapolated)
3.65 10.872 5819.5
3.67 10.863 5818.5
8.0 10.542 5620.3
Table 3. Physical parameters calculated for SiO2 and the SMF-28 fiber @1.55 μm.
SiO2 SMF-28 (3.67 mol% GeO2)
ncl or neff 1.444414 1.446973
p11 0.130 0.125
p12 0.266 0.258
p44 -0.0676 -0.0662
g 0.141 0.139
C1(Pa-1) 7.81x10⁻¹³ 8.90x10⁻¹³
C2(Pa-1) 4.06x10⁻¹² 4.14x10⁻¹²
C(Pa-1) -3.27x10⁻¹² -3.25x10⁻¹²
M(GPa) 78.86 76.36
E(GPa) 73.08 71.63
G(GPa) 31.12 30.83
ν 0.174 0.161
Disclaimer/Publisher’s Note: The statements, opinions and data contained in all publications are solely those of the individual author(s) and contributor(s) and not of MDPI and/or the editor(s). MDPI and/or the editor(s) disclaim responsibility for any injury to people or property resulting from any ideas, methods, instructions or products referred to in the content.
Copyright: This open access article is published under a Creative Commons CC BY 4.0 license, which permit the free download, distribution, and reuse, provided that the author and preprint are cited in any reuse.
Prerpints.org logo

Preprints.org is a free preprint server supported by MDPI in Basel, Switzerland.

Subscribe

© 2024 MDPI (Basel, Switzerland) unless otherwise stated