Submitted:
02 July 2024
Posted:
03 July 2024
You are already at the latest version
Abstract
Keywords:
1. Introduction
2. PAS Due to Congenital Etiology
2.1. Pulmonary Valvular Stenosis
2.2. Pulmonary Artery Atresia
2.3. Pulmonary Vein Atresia
3. PAS Due to Acquired Disease
3.1. Intraluminal Anomalies
3.1.1. Pulmonary Thromboembolism (PTE)
3.1.2. In Situ Pulmonary Artery Thrombosis (PAT)
3.1.3. Pulmonary Tumor Embolism and Pulmonary Tumor Thrombotic Microangiography (PTTM)
3.1.4. Septic Pulmonary Embolism (SPE)
3.1.5. Pulmonary Embolism caused by Foreign Bodies
3.1.6. Pulmonary Artery Sarcoma
3.2. Vessel Wall Lesions
3.2.1. Vasculitis
3.2.1.1. Takayasu Arteritis (TA)
3.2.1.2. Behçet Disease (BD)
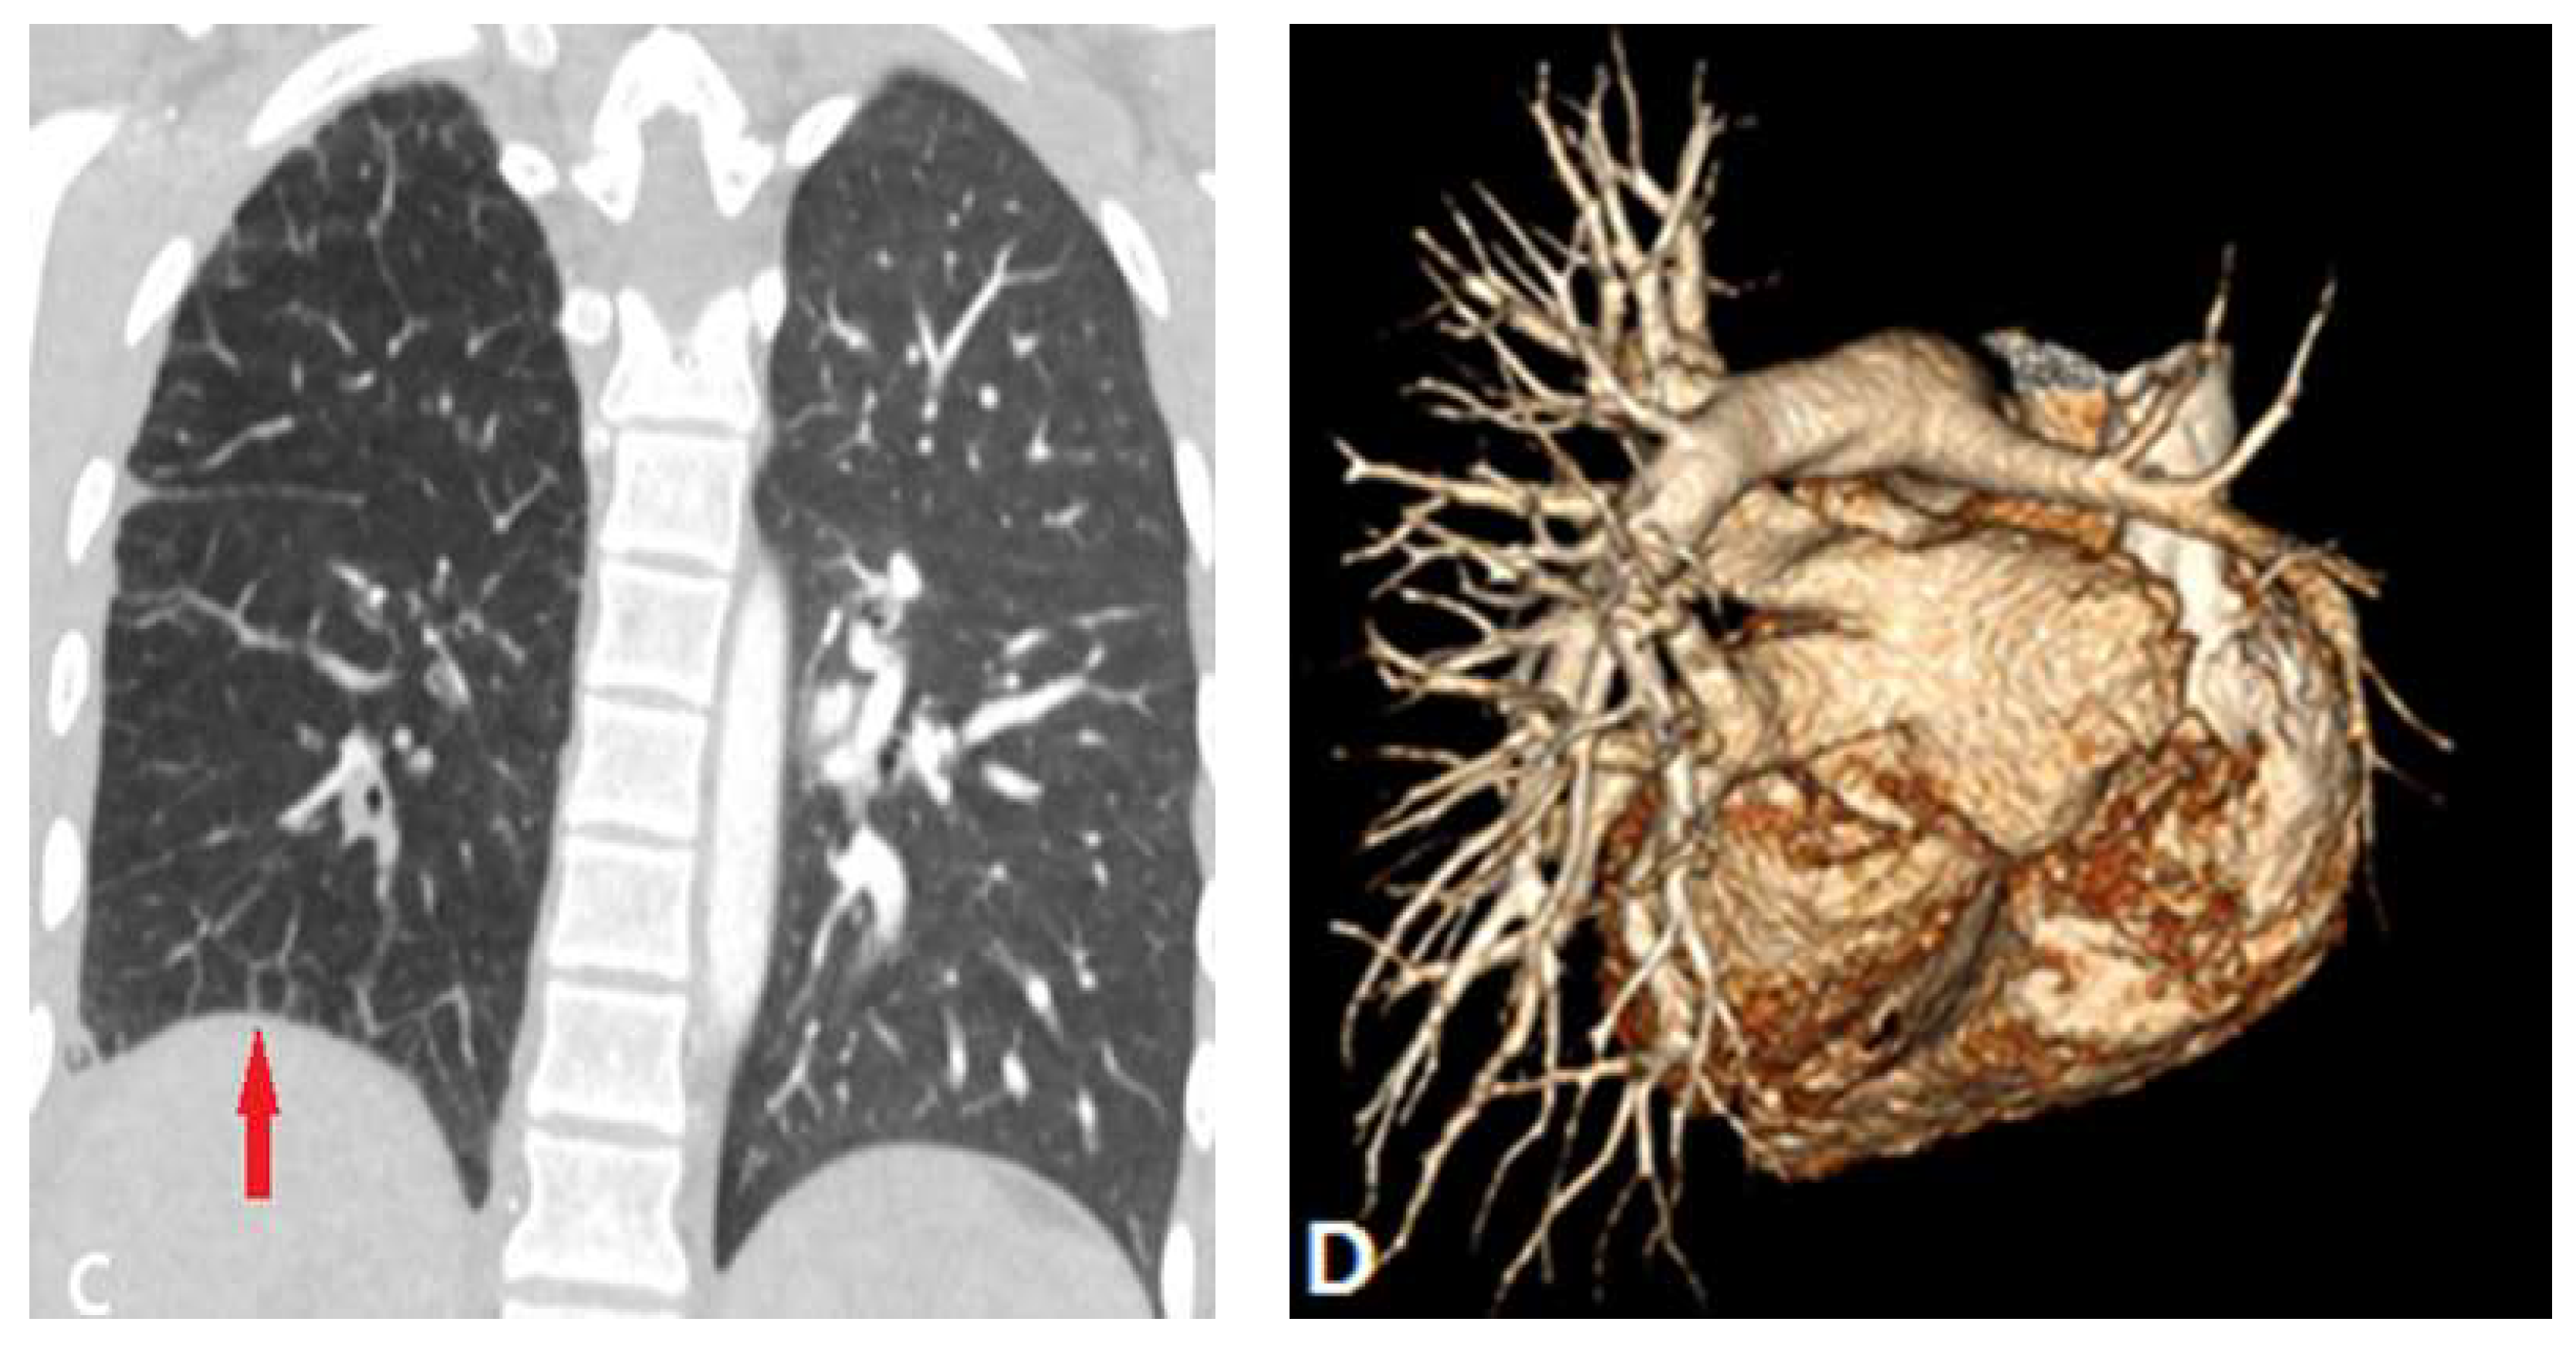
3.2.1.3. Swyer James Macleod Syndrome (SJMS)
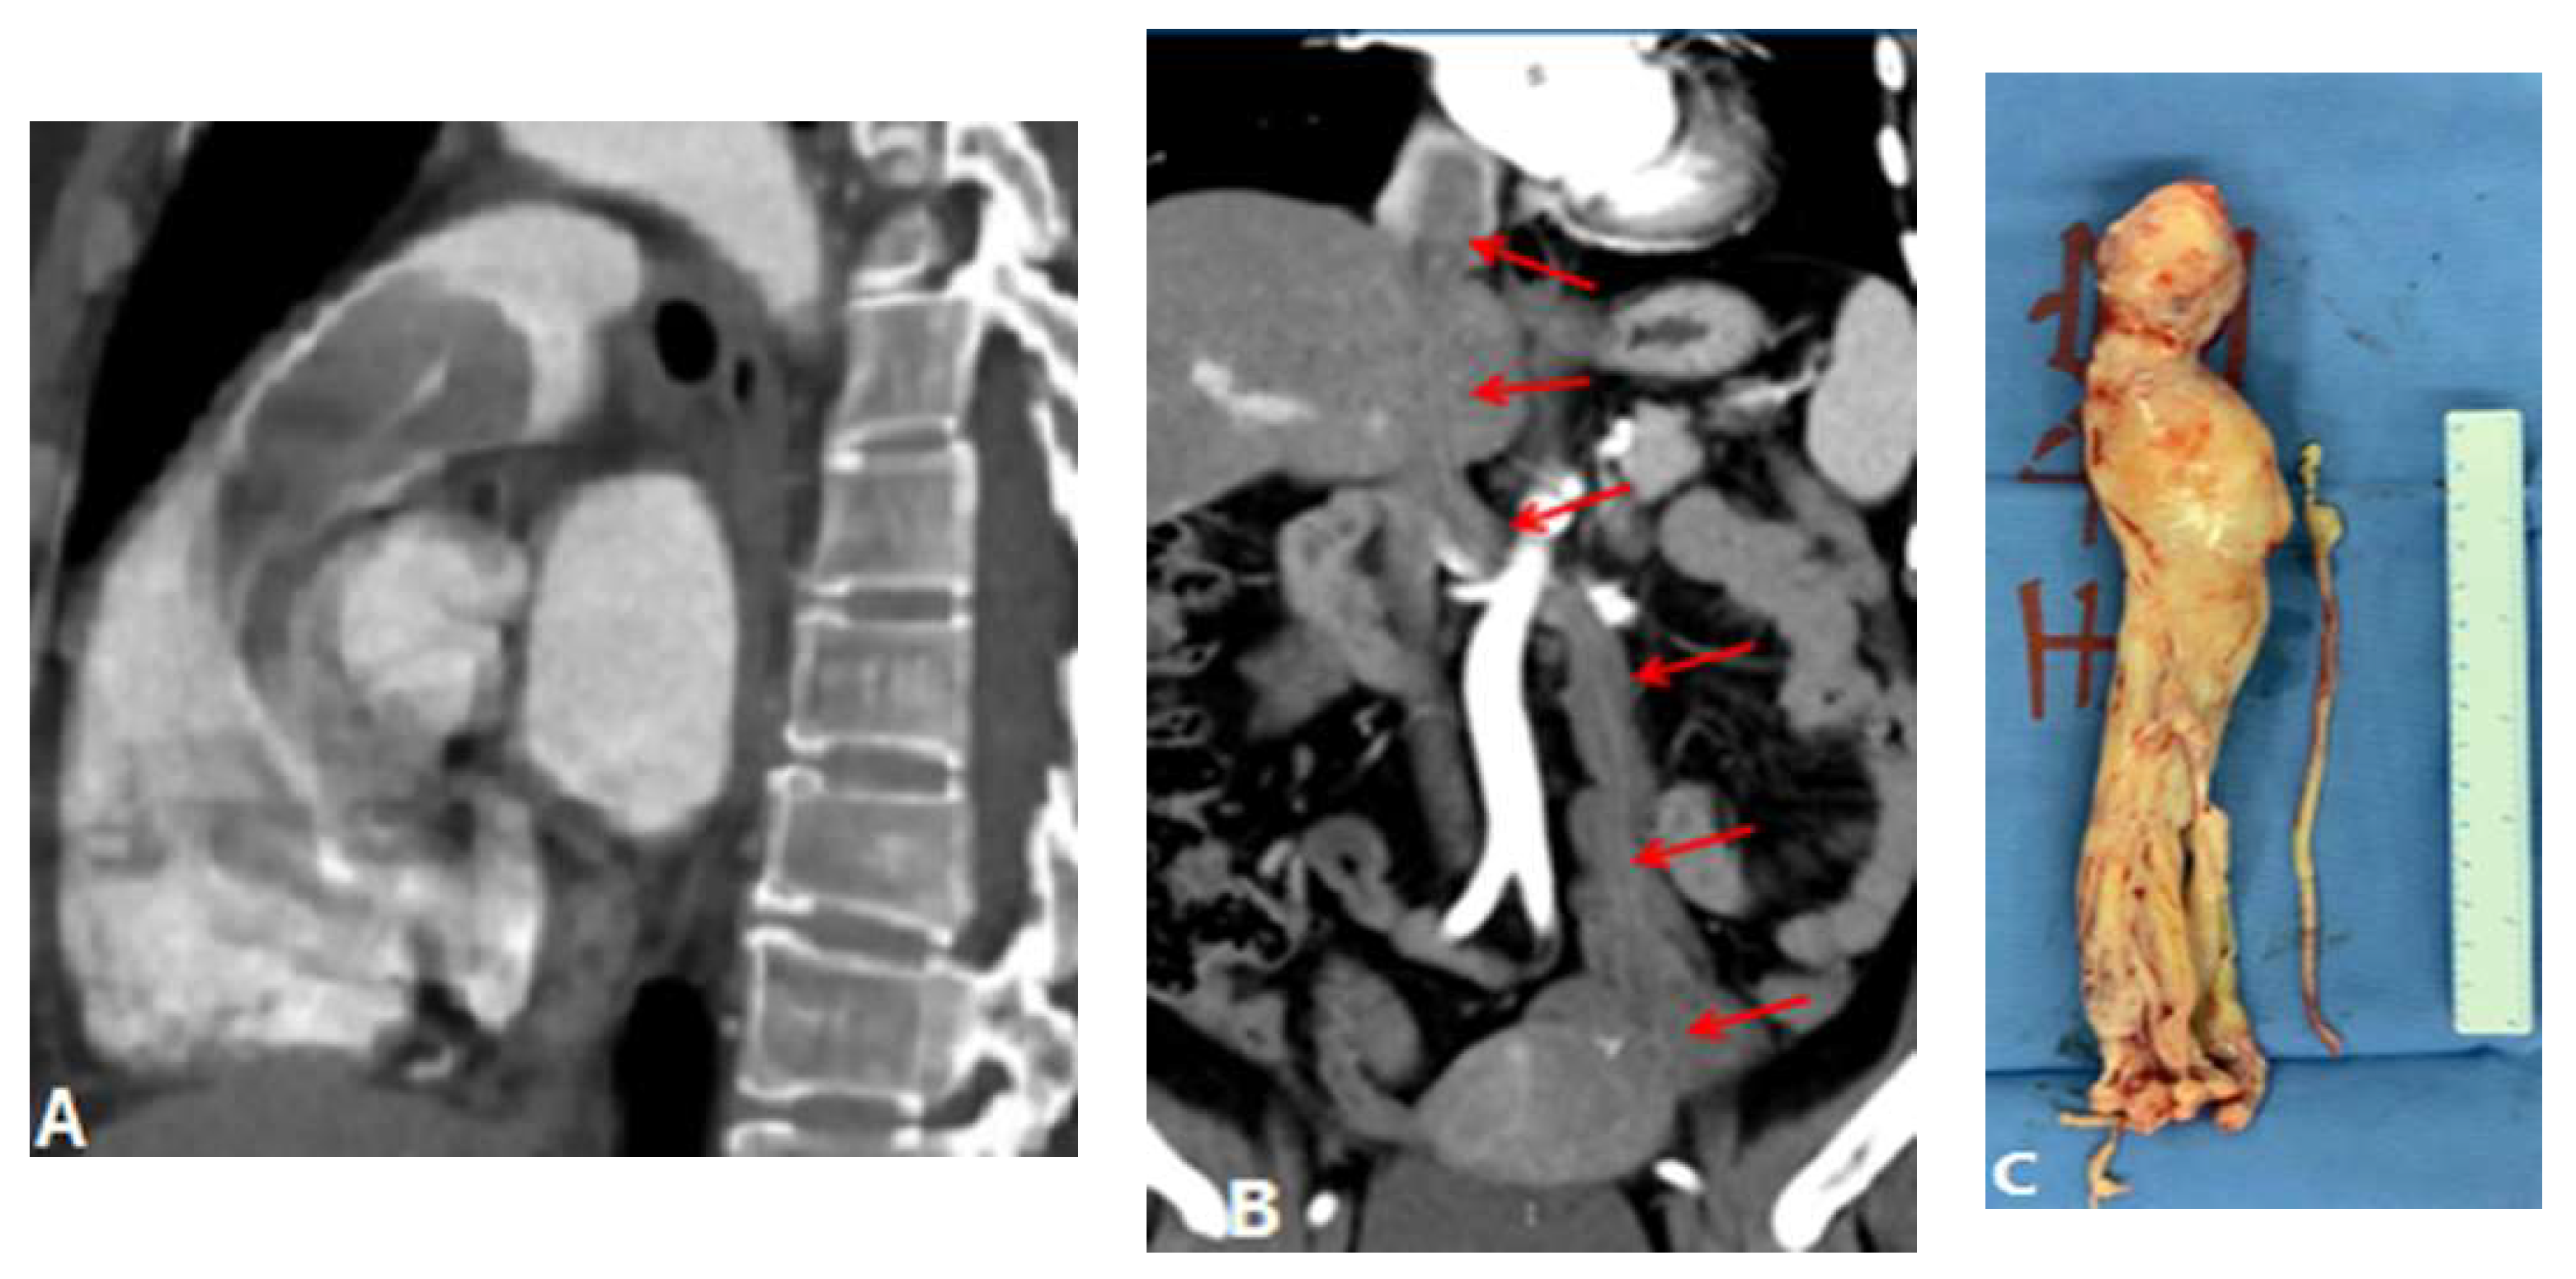
3.2.2. Arterial Dissection (AD)
3.3. Extraluminal Abnormalities
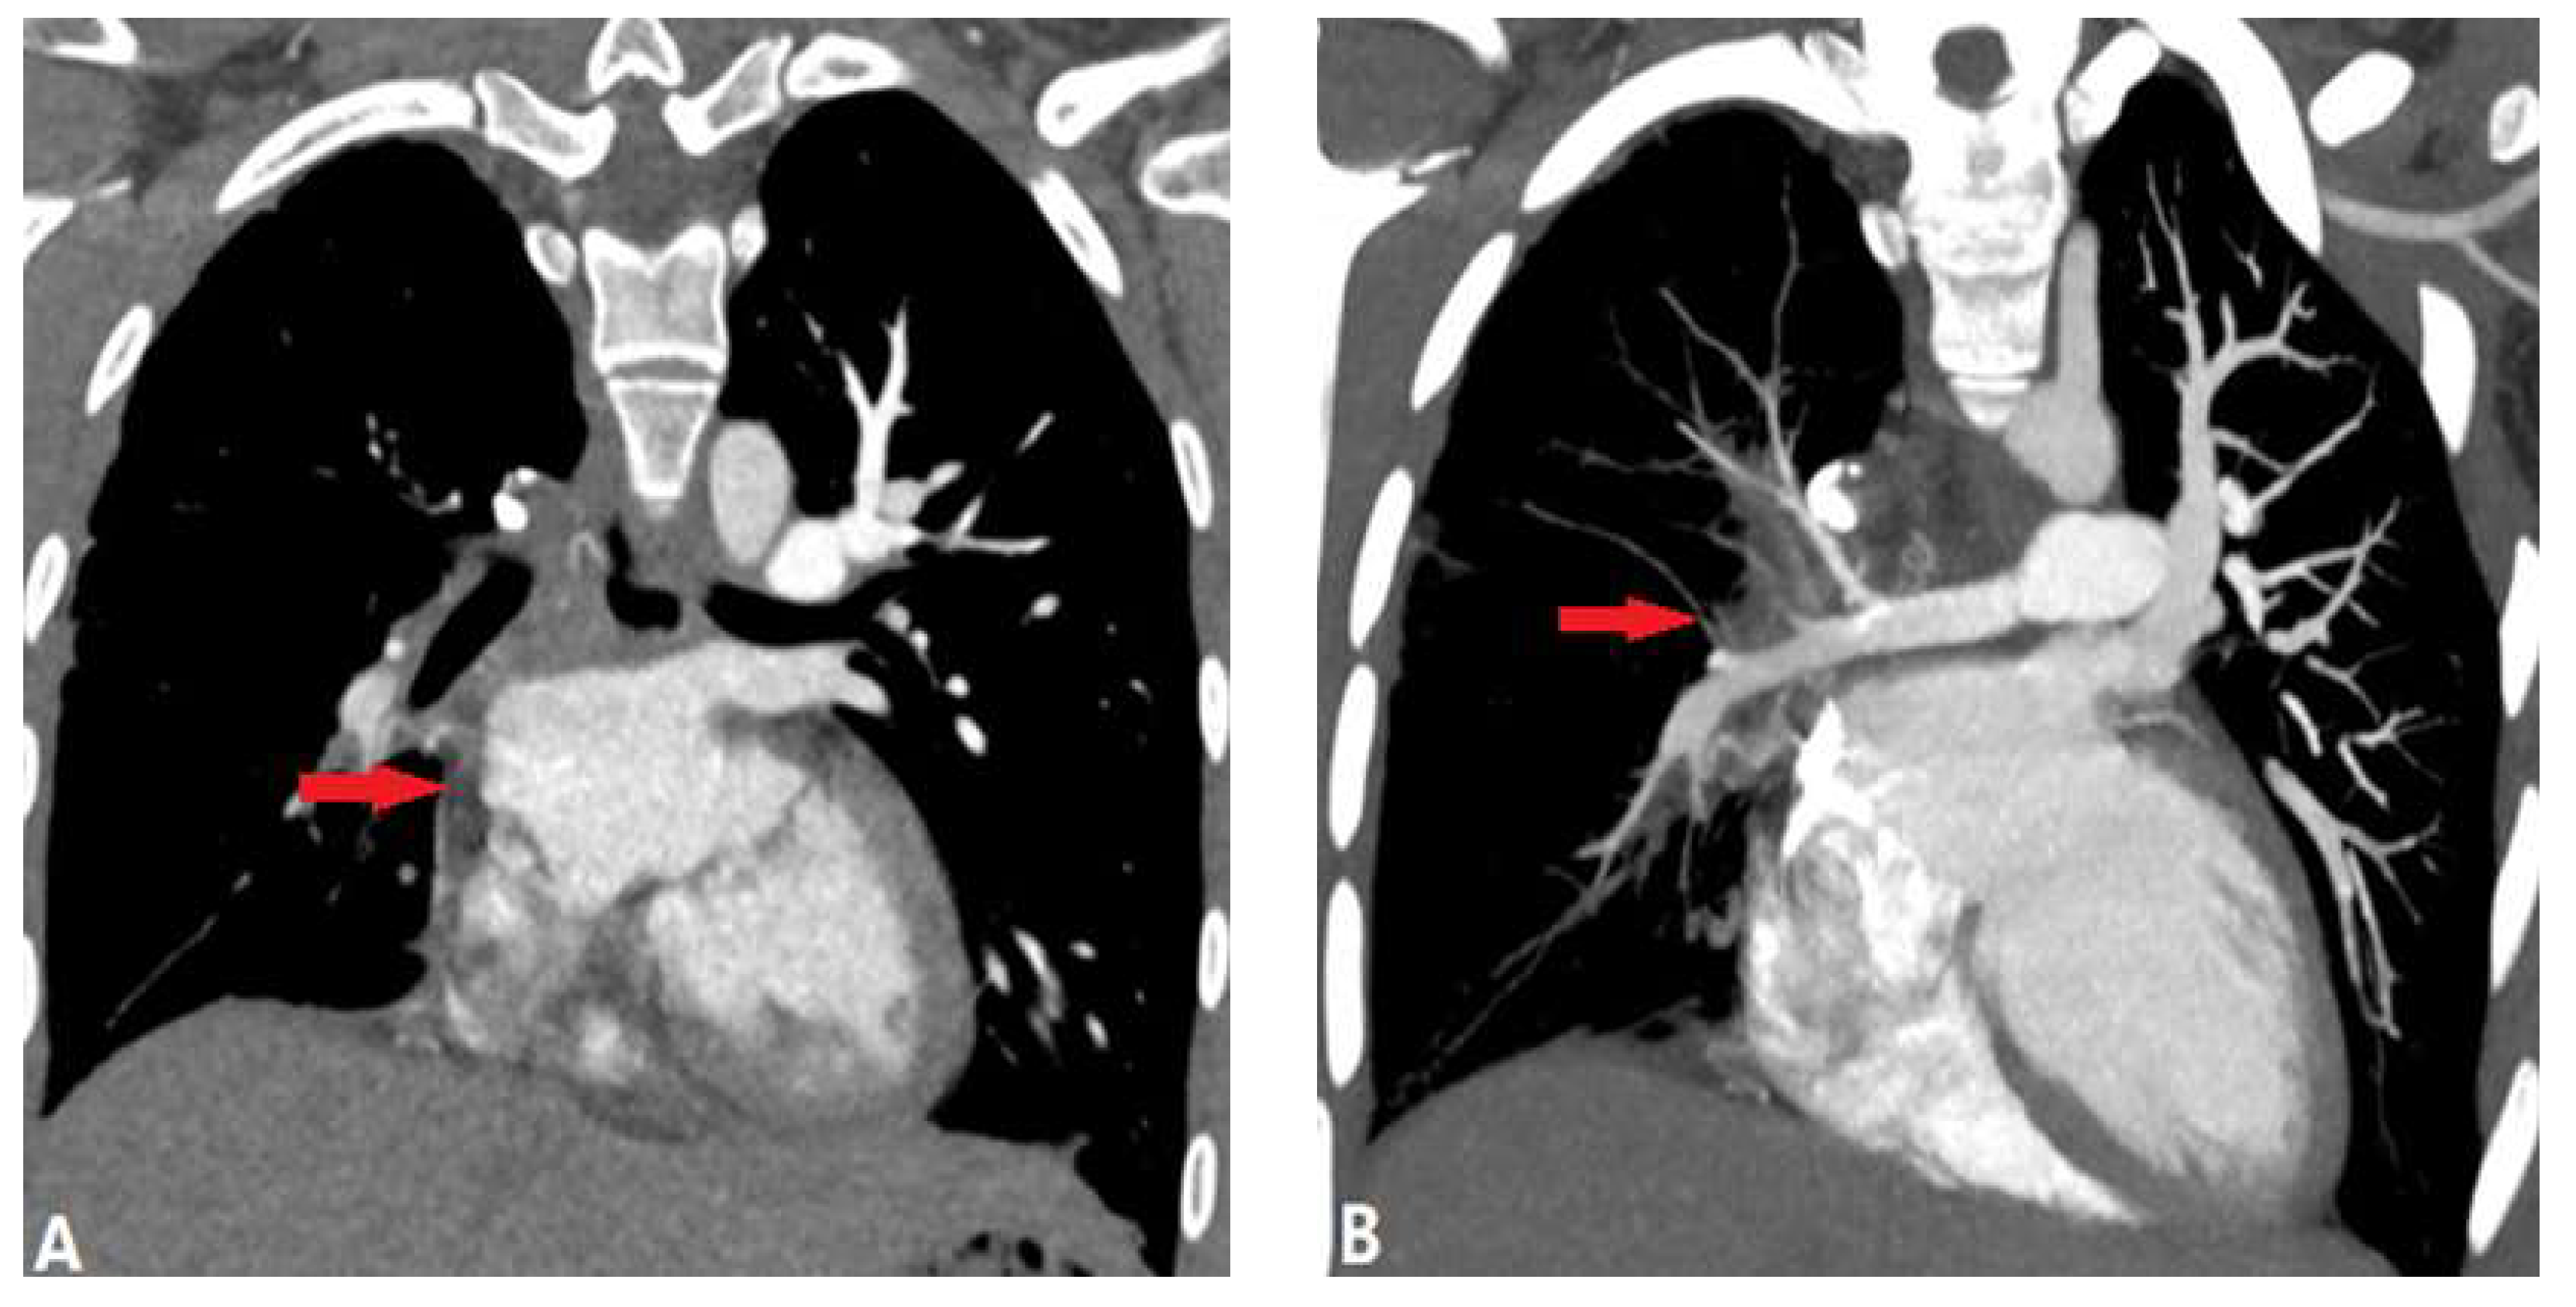
3.3.1. Fibrosis Mediastinitis (FM)
3.3.2. Tumour Causing Pulmonary Artery Stenosis
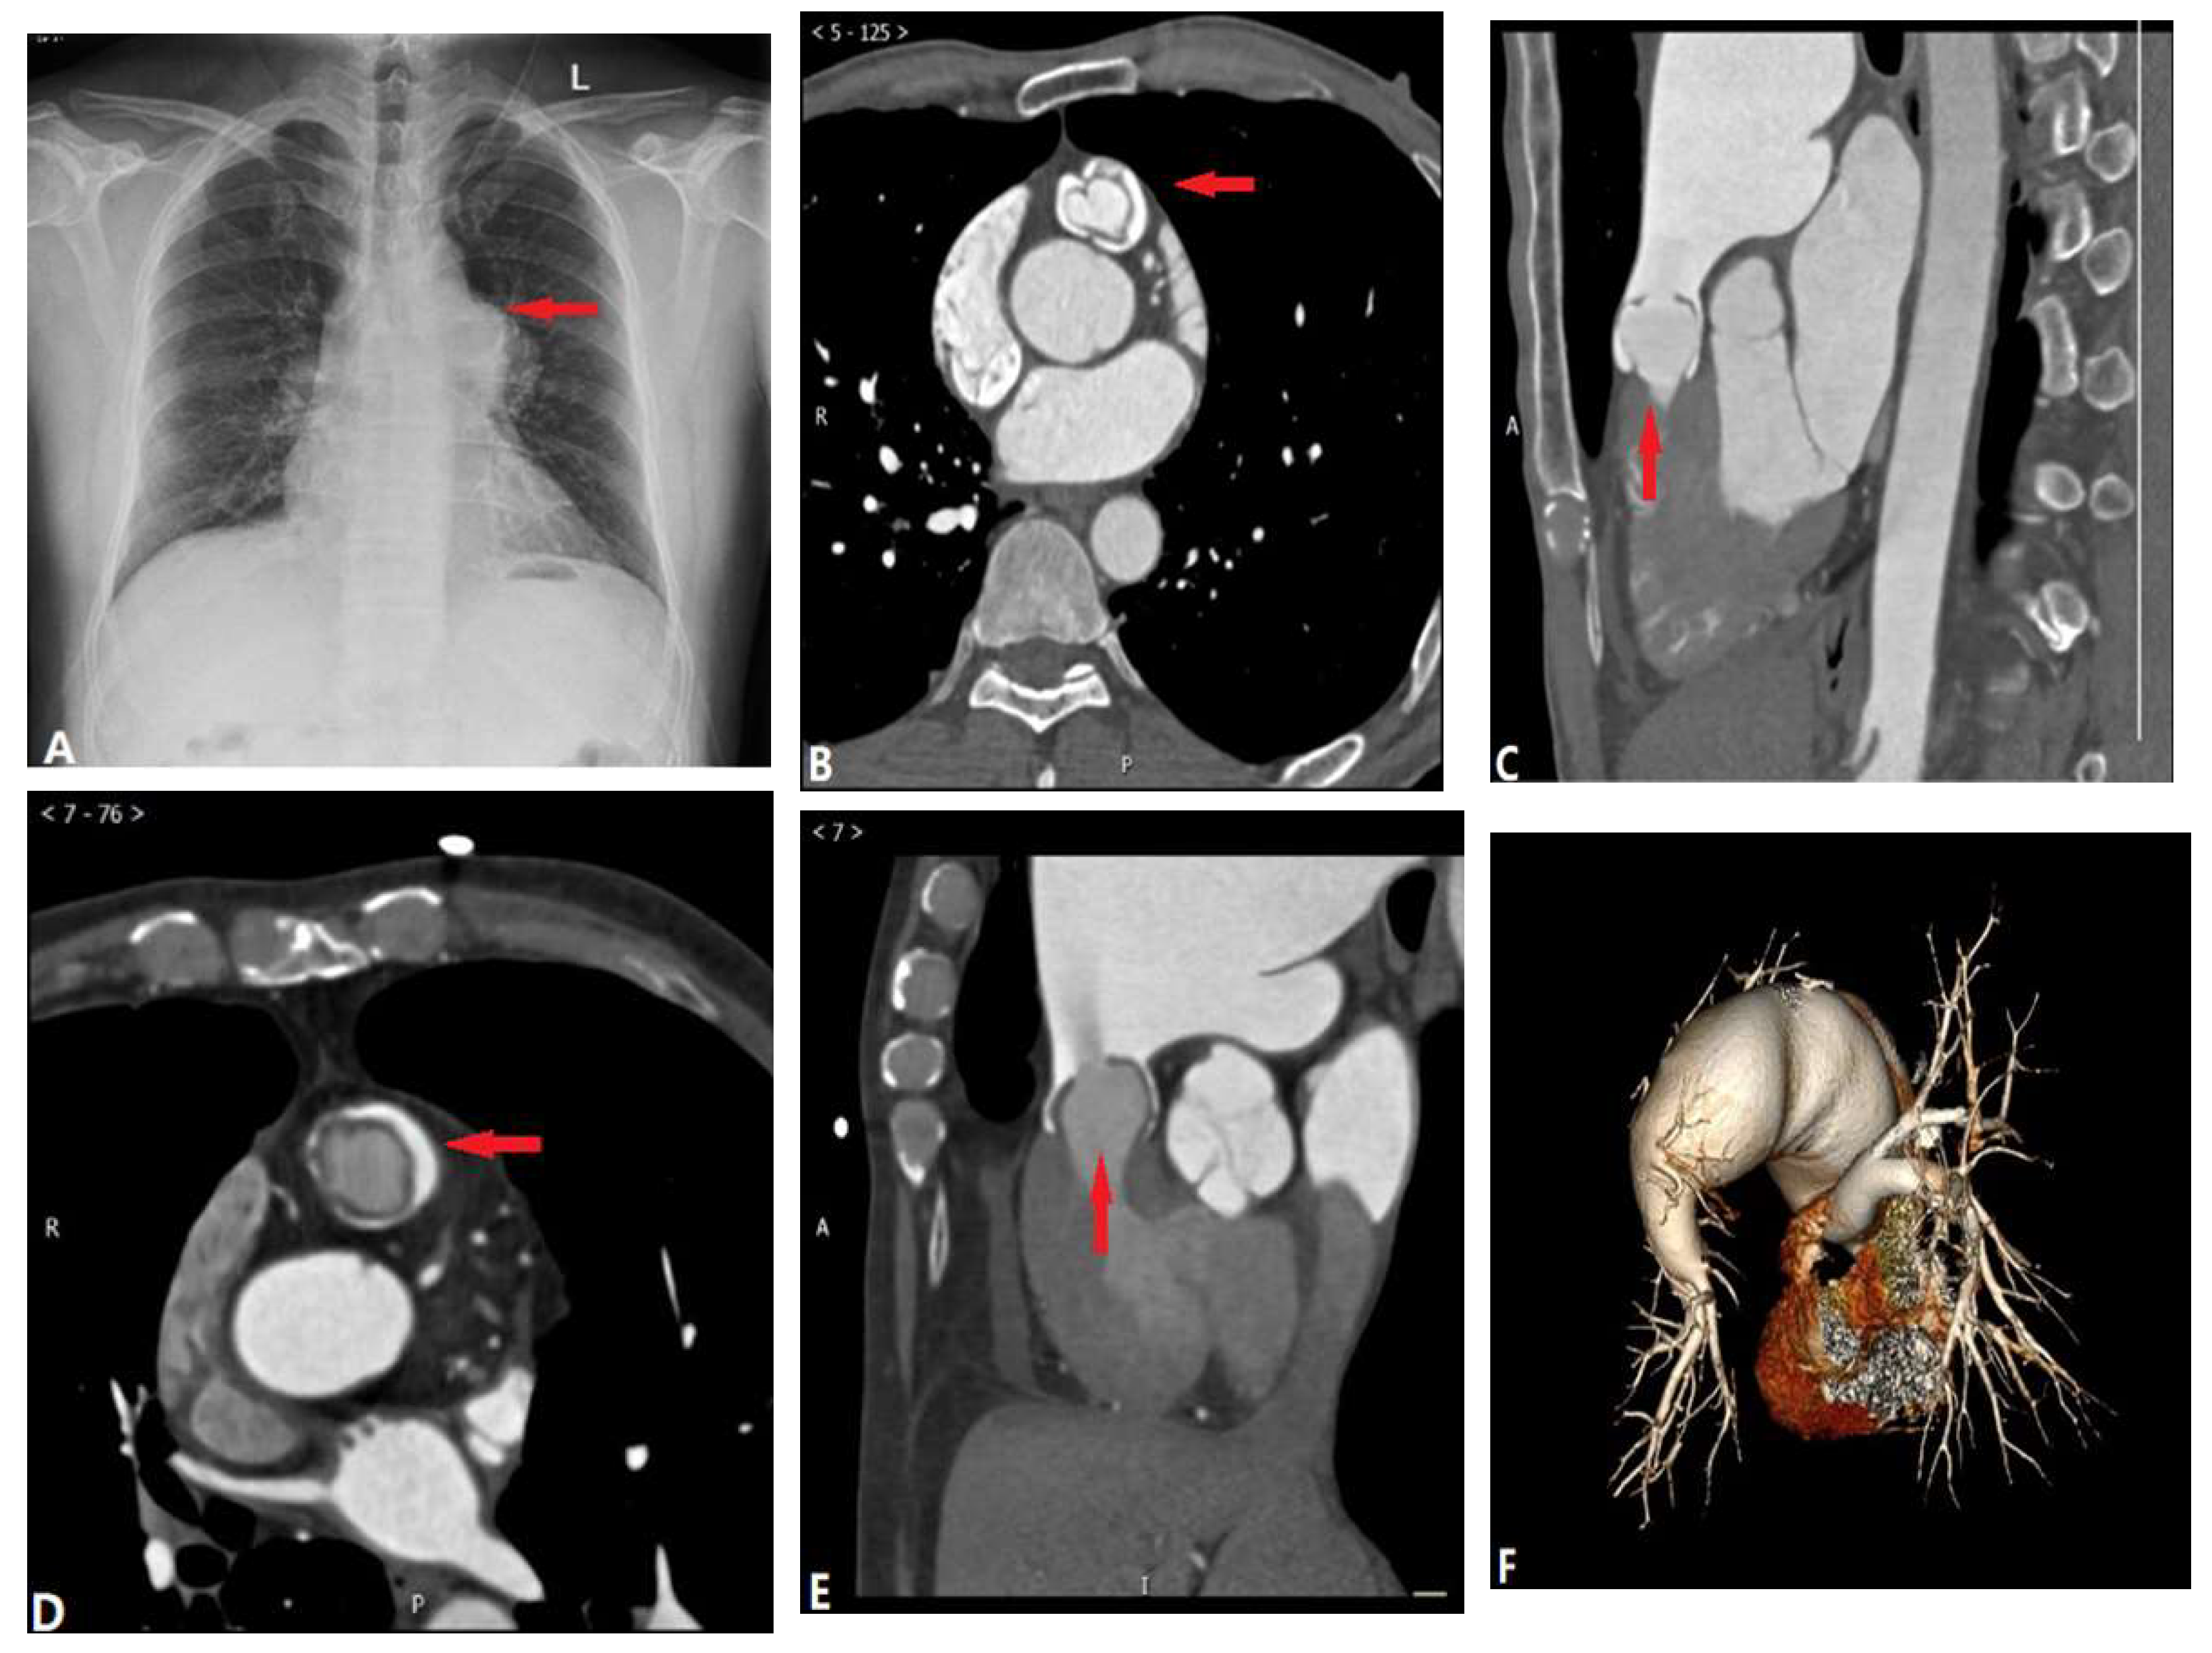
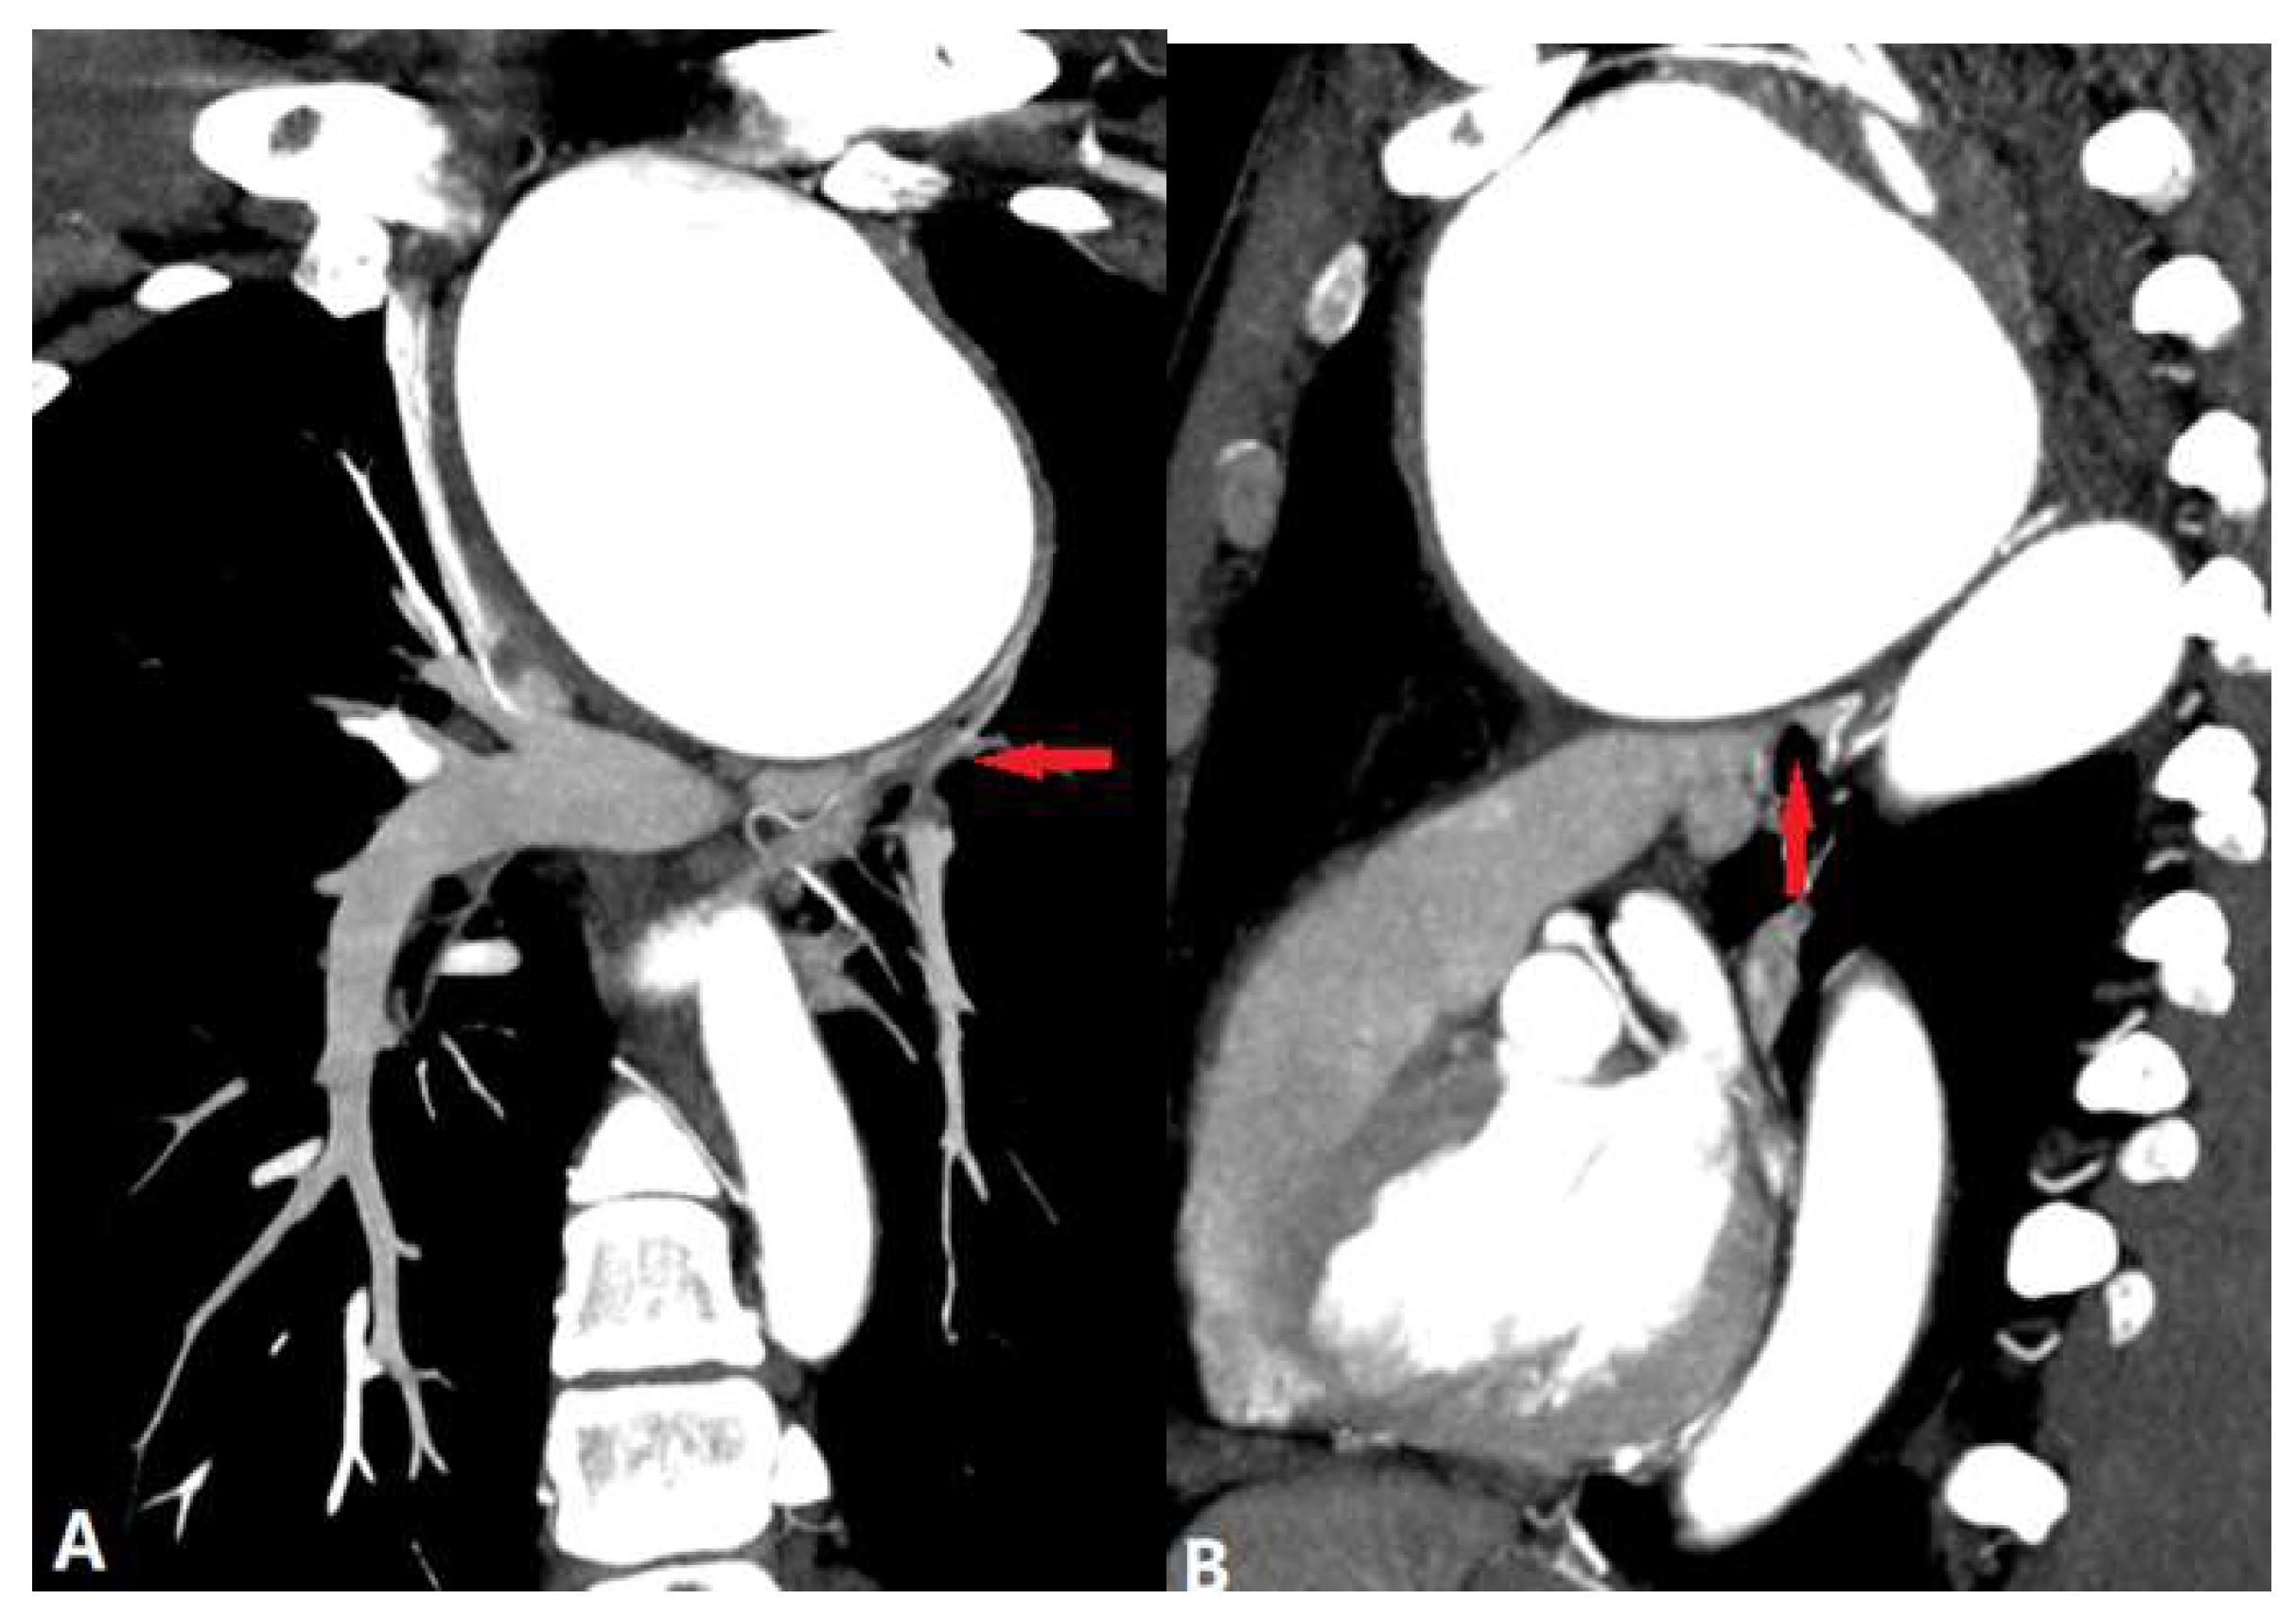
3.3.3. Aortic Aneurysm
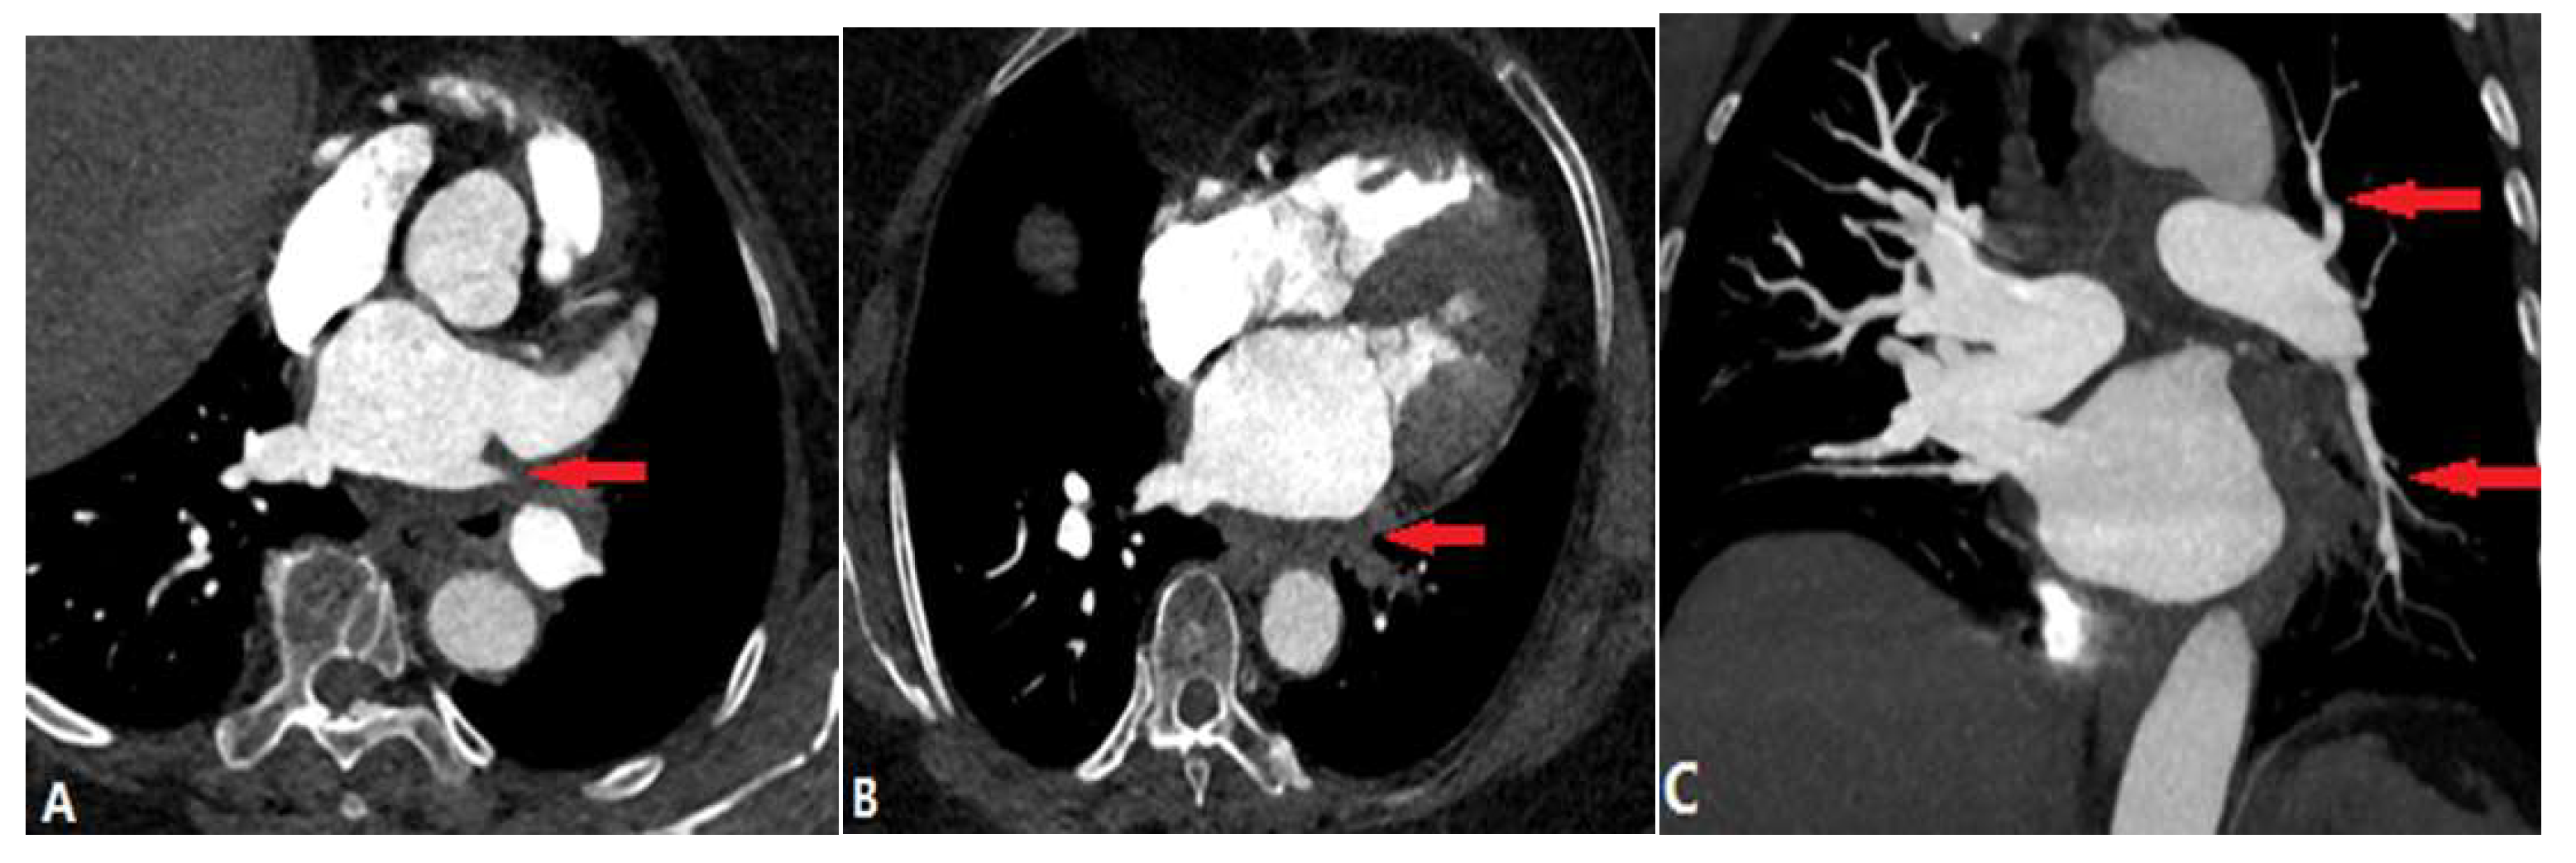
4. Complications of Radiofrequency Ablation Of Atrial Fibrillation
5. Conclusions
Author Contributions
Funding
Institutional Review Board Statement
Informed Consent Statement
Data Availability Statement
Conflicts of Interest
References
- Kim, C.W.; Aronow, W. S.; Dutta, T.; Spevack, D.M.; Frishman, W.H. Treatment of peripheral pulmonary artery stenosis. Cardiol. Rev. 2021, 29(3), 115-9. [CrossRef]
- Ngo, M. L. D.; Aggarwal, A.; Knudson, J. D. Peripheral pulmonary artery stenosis: an unusual case and discussion of genetic associations. Congent. Heart. Dis. 2014, 9(5), 448-52. [CrossRef]
- Newman, B.; Alkhori, N. Congenital central pulmonary artery anomalies: Part 2. Pediatr. Radiol. 2020, 50(8), 1030-40.. [CrossRef]
- Ruckdeschel, E.; Kim, Y.Y. Pulmonary valve stenosis in the adult patient: pathophysiology, diagnosis and management. Heart. 2019, 105, 414-422. [CrossRef]
- Castneda-Zuniga, W.R.; Formanek, A.; Amplatz, K. Radiologic diagnosis of different types of pulmonary stenoses. Cardiovasc. Radiol.1978, 1, 45-57. [CrossRef]
- Escalon, J.G.; Browne, L.P.; Bang, T.J.; Restrepo, C.S.; Ocazionez, D.; Vargas, D. Congenital anomalies of the pulmonary arteries: an imaging overview. Br. J. Radiol. 2019, 92(1093): 20180185. [CrossRef]
- Newman, B.; Alkhori, N. Congenital central pulmonary artery anomalies: Part 1. Pediatr. Radiol. 2020, 50(8), 1022-9. [CrossRef]
- Romberg, E.K.; Stanescu, A.L.; Bhutta, S.T.; Otto, R.K.; Ferguson, M.R. Computed tomography of pulmonary veins: review of congenital and acquired pathologies. Pediatr. Radiol. 2022, 52, 2510-2528. [CrossRef]
- Tang, C.; Duan, H.; Zhou, K,; Hua, Y.; Lu, X.; Li, X.; Wang, C. Isolated unilateral pulmonary vein atresia with hemoptysis in a child: A case report and literature review. Medicine (Baltimore). 2018, 97(34), e11882. [CrossRef]
- Khan, F.; Tritschner, T.; Kahn, S.R.; Rodger, M.A. Venous thromboembolism. Lancet. 2021, 398, 64-77. [CrossRef]
- Alp-Zaher, N.; Vitali, F.; Neurath, M.; Goertz, R.S. The positive rate of pulmonary angiography is high in an emergency department, even in low-risk or young patients. Med. Princ. Prac. 2021, 30:37-44.
- Palm, V.; Rengier, F.; Rajiah. P.; Heussel, C.P.; Partovi, S. Acute pulmonary embolism: Imaging techniques, findings, endovascular treatment and differential diagnosis. Rofo. 2020, 192:38-49. [CrossRef]
- Boon, G.J.A.; Ende-Verhaar, Y.M.; Beenen, L.F.; Coolen, J.; Delcroix, M.; Golebiowski, M.; et al. Prediction of chronic thromboembolic pulmonary hypertension with standardised evaluation of initial computed tomography pulmonary angiography performed for suspected acute pulmonary embolism. Eur. Radiol. 2022, 32, 2178-2187. [CrossRef]
- Castaner, E.; Gallardo, X.; Rimola, J.; Pallardo, Y.; Mata, J.M.; Perendreu, J.; Martin, C.; Gil, D. Congenital and acquired pulmonary artery anomalies in the adult: radiologic overview. Radiographics. 2006, 26(2), 349-71. [CrossRef]
- Konstantinides, S.V.; Meyer, G.; Becattini, C.; Bueno, H.; Geersing, G.J.; Harjola, V.P, et al. 2019 ESC Guidelines for the diagnosis and management of acute pulmonary embolism developed in collaboration with the European Respiratory Society (ERS) The Task Force for the diagnosis and management of acute pulmonary embolism of the European Society of Cardiology (ESC). Eur. Heart. J. 2020, 41(4), 543-603.
- Fletcher-Sanfeliu, D.; Redon, J.; Garcia-Granero, A.; Frasson, M.; Barreira, I.; Martinez-Leon, J.; Garcia-Fuster, M.J. Pulmonary thrombosis in situ’: risk factors, clinic characteristics and long-term evolution. Blood. Coagul. Fibrinolysis. 2020, 31(7), 469-75. [CrossRef]
- Cao, Y.; Geng, C.; Li, Y.; Zhang, Y. In situ pulmonary artery thrombosis: a previously overlooked disease. Front. Pharmacol. 2021, 12, 671589. [CrossRef]
- Baranga, L.; Khanuja, S.; Scott, J.A.; Provancha, I.; Gosselin, M.; Walsh, J.; Arancibia, R.; Bruno, M.A.; Waite, S. In Situ Pulmonary Arterial Thrombosis: Literature Review and Clinical Significance of a Distinct Entity. AJR. Am. J. Roentgenol. 2023, 221. 57-68. [CrossRef]
- Sahiti, S.; Rotman, S.; Benmachiche, M. Pulmonary tumor embolism. Rev. Med. Suisse. 2021, 17, 2034-2037.
- Lashari, B.H.; Kumaran, M.; Aneja, A.; Bull, T.; Rali, P. Beyond clots in the pulmonary circulation: pulmonary artery tumors mimicking pulmonary embolism. Chest. 2022, 161(6), 1642-50.. [CrossRef]
- Rajev, K.; Madan, U.; McMilan, S.; Wilson, K.; Fisher, K.; Hein, A. et al. Pulmonary tumor embolism and pulmonary tumor thrombotic microangiopathy causing rapidly progressive respiratory failure: a case series. J. Investig. Med. High. Impact. Case. Rep. 2022, 10, 23247096221086453. [CrossRef]
- Kwon, W.J.; Jeong, Y.J.; Kim, K.I.; Lee, I.S.; Jeon, U.B.; Lee, S.H, Kim, Y.D. Computed tomographic features of pulmonary septic emboli: comparison of causative microorganisms. J. Comput. Assist. Tomogr. 2007, 31(3) 390-4. [CrossRef]
- Kuhlman, J.E.; Fishman, E.K.; Teigen, C. Pulmonary septic emboli: diagnosis with CT. Radiology. 1990, 174(1): 211-3. [CrossRef]
- Matuscov, Y.; Tapson, V.F. Radiologic mimics of pulmonary embolism. Postgrad. Med. 2021, 133(sup1), 64-70. [CrossRef]
- Ye, R.; Zhao, L.; Wang, C.; Wu, X.; Yan, H. Clinical characteristics of septic pulmonary embolism in adults: a systematic review. Respir. Med. 2014, 108(1), 1-8. [CrossRef]
- Bach, A.G.; Restrepo, C.S.; Abbas, J.; Villanueva, A.; Lorenzo Dus, M.J, Schopf, R. et al. Imaging of nonthrombotic pulmonary embolism: biological materials, nonbiological materials, and foreign bodies. Eur. J. Radiol. 2013, 82(3), e120-e41. [CrossRef]
- McCabe, B.E.; Veseleis, C.A.; Goykhman, I.; Hochhold, J.; Eisenberg, D.; Son, H. Beyond pulmonary embolism; nonthrombotic pulmonary embolism as diagnostic challenges. Curr. Probl. Diagn. Radiol. 2019, 48(4), 387-92. [CrossRef]
- Unal, E.; Balci, S.; Atceken, Z.; Akpinar, E.; Ariyurek, O.M. Nonthrombotic pulmonary artery embolism: imaging findings and review of the literature. AJR. Am. J. Roentgenol. 2017, 208(3), 505-16. [CrossRef]
- Trongtorsak, A.; Tumkosit, M.; Chantranuwatana, P.; Ariyachaipanich, A.; Chattranukulchai, P.; Boonyaratavej, S.; Puwanant, S. Pulmonary artery sarcoma: an unusual cause of acquired supravalvular pulmonary stenosis. Cir. Cardiovass. Imaging. 2020, 13(1), e009932. [CrossRef]
- Yin, K.; Zhang, Z.; Luo, R.; Ji, Y.; Zheng, D.; Lin, Y.; Wang, C. Clinical features and surgical outcomes of pulmonary artery sarcoma. J. Thorac. Cardiovasc. Surg. 2018, 155(3), 1109-15. e1. [CrossRef]
- Liu, M.X.; Ma, Z.H.; Jiang, T.; Guo, X.J.; Yu, F.F.; Yang, Y.H.; Zhai, Z.G. Differential diagnosis of pulmonary artery sarcoma and central chronic pulmonary thromboembolism using CT and MR images. Heart Lung. Circ. 2018, 27(7), 819-27. [CrossRef]
- Kronzer, E.; Robinson, S.I.; Collins, D.A.; McBane 2nd, R.D. Primary pulmonary artery sarcoma versus pulmonary thromboembolism: a multimodal imaging comparison. J. Thromb. Thrombolysis. 2021, 52(4), 1129-32. [CrossRef]
- Adams, T.N.; Zhang, D.; Batra., K.; Fitzgerald, J.E. Pulmonary manifestations of large, medium, and variable vessel vasculitis. Respir. Med. 2018, 145, 182-91. [CrossRef]
- Xi, X.; Du, J.; Liu, J.; Zhu, G.; Qi, G.; Pan, L. Pulmonary artery involvement in Takayasu arteritis: a retrospective study in Chinese population. Clin. Rheumatol. 2021, 40, 635-44. [CrossRef]
- Saadoun, D.; Vautier, M.; Cacoub, P. edium-and large-vessel vasculitis. Circulation. 2021, 143(3), 267-82.
- Odev, K.; Tunc, R.; Varol, S.; Aydemir, H.; Yilmaz, P.D.; Korkmaz, C. Thoracic complications in Behçet’s disease: imaging findings. Can. Respir. J. 2020, 2020, 4649081. [CrossRef]
- Aksoy, E.; Aktas, O.; Tokgoz, F.; Kongar, N.; Goksenoglu, N.; Bodur, Y. et al. Cases diagnosed with Swyer James Macleod syndrome in adulthood. Turk. Thorac. J. 2015, 16(1), 36-42. [CrossRef]
- Yuan, X.; Mitsis, A.; Nienaber, C.A. Current understanding of aortic dissection. Life (Basel). 2022, 12(10), 1606. [CrossRef]
- Seferian, A.; Steriade, A.; Jais, X.; Planche, O.; Savale, L.; Parent F, et al. Pulmonary hypertension complicating fibrosing mediastinitis. Medicine. 2015, 94(44), e1800. [CrossRef]
- Zhou, M.; Li, B.; Chen, Y.; Wang, A.; Zhu, Y.; Li, Y, et al. Chest X-ray features facilitate screening for pulmonary hypertension caused by fibrosing mediastinitis. Ther. Adv. Chronic. Dis. 2022, 13, 20406223221143245. [CrossRef]
- Han, C.B.; Wang, W.L.; Quint, L.; Xue, J.X.; Matuszak, M.; Haken, R.T.; Kong, F.M. Pulmonary artery invasion, high-dose radiation, and overall survival in patients with non-small cell lung cancer. Int. J. Radiat. Oncol. Biol. Phys. 2014, 89(2), 313-21. [CrossRef]
- Sugiyama, H.; Tohma, R.; Misato, T.; Okamoto, K.; Hayashi, T.; Tobe, S, et al. Right heart failure caused by direct pressure of distal arch aneurysm. Gen. Thoracic. Cardiovasc. Surg. 2019; 67, 263-265. [CrossRef]
- Abe, T.; Kamikubo, Y.; Taneichi, T,; Terada, T.; Sugiura, J.; Sakurai, T.; Tsuboi, N.; Sakurai, H. Right heart failure secondary to compression of the right pulmonary artery by a large proximal aortic aneurysm. Circulation; 2013: 128(14), 1588-9. [CrossRef]
- Alfudhili, K.M.; Hassan, H.H.; Abdullah, H.; Sherbiny, M. Pulmonary vein occlusion and lung infarction complicating non-treated moderate single pulmonary vein stenosis after radiofrequency ablation of atrial fibrillation. BJR|. Case. Rep. 2017, 18, 20160091. [CrossRef]
- Xu, L.; Cui, L.; Hou, J.; Wang, J.; Chen, B.; Xue, X.; Yang, Y.; Wu, J.; Chen, J. Clinical characteristics of patients with atrial fibrillation suffering from pulmonary vein stenosis after radiofrequency ablation. J. Int. Med. Res. 2020; 48(3), 0300060519881555. [CrossRef]
- Ravenel, J.G.; McAdams, H.P. Pulmonary venous infarction after radiofrequency ablation for atrial fibrillation. AJR. Am. J. Roentgenol. 2002, 178(3), 664-6. [CrossRef]




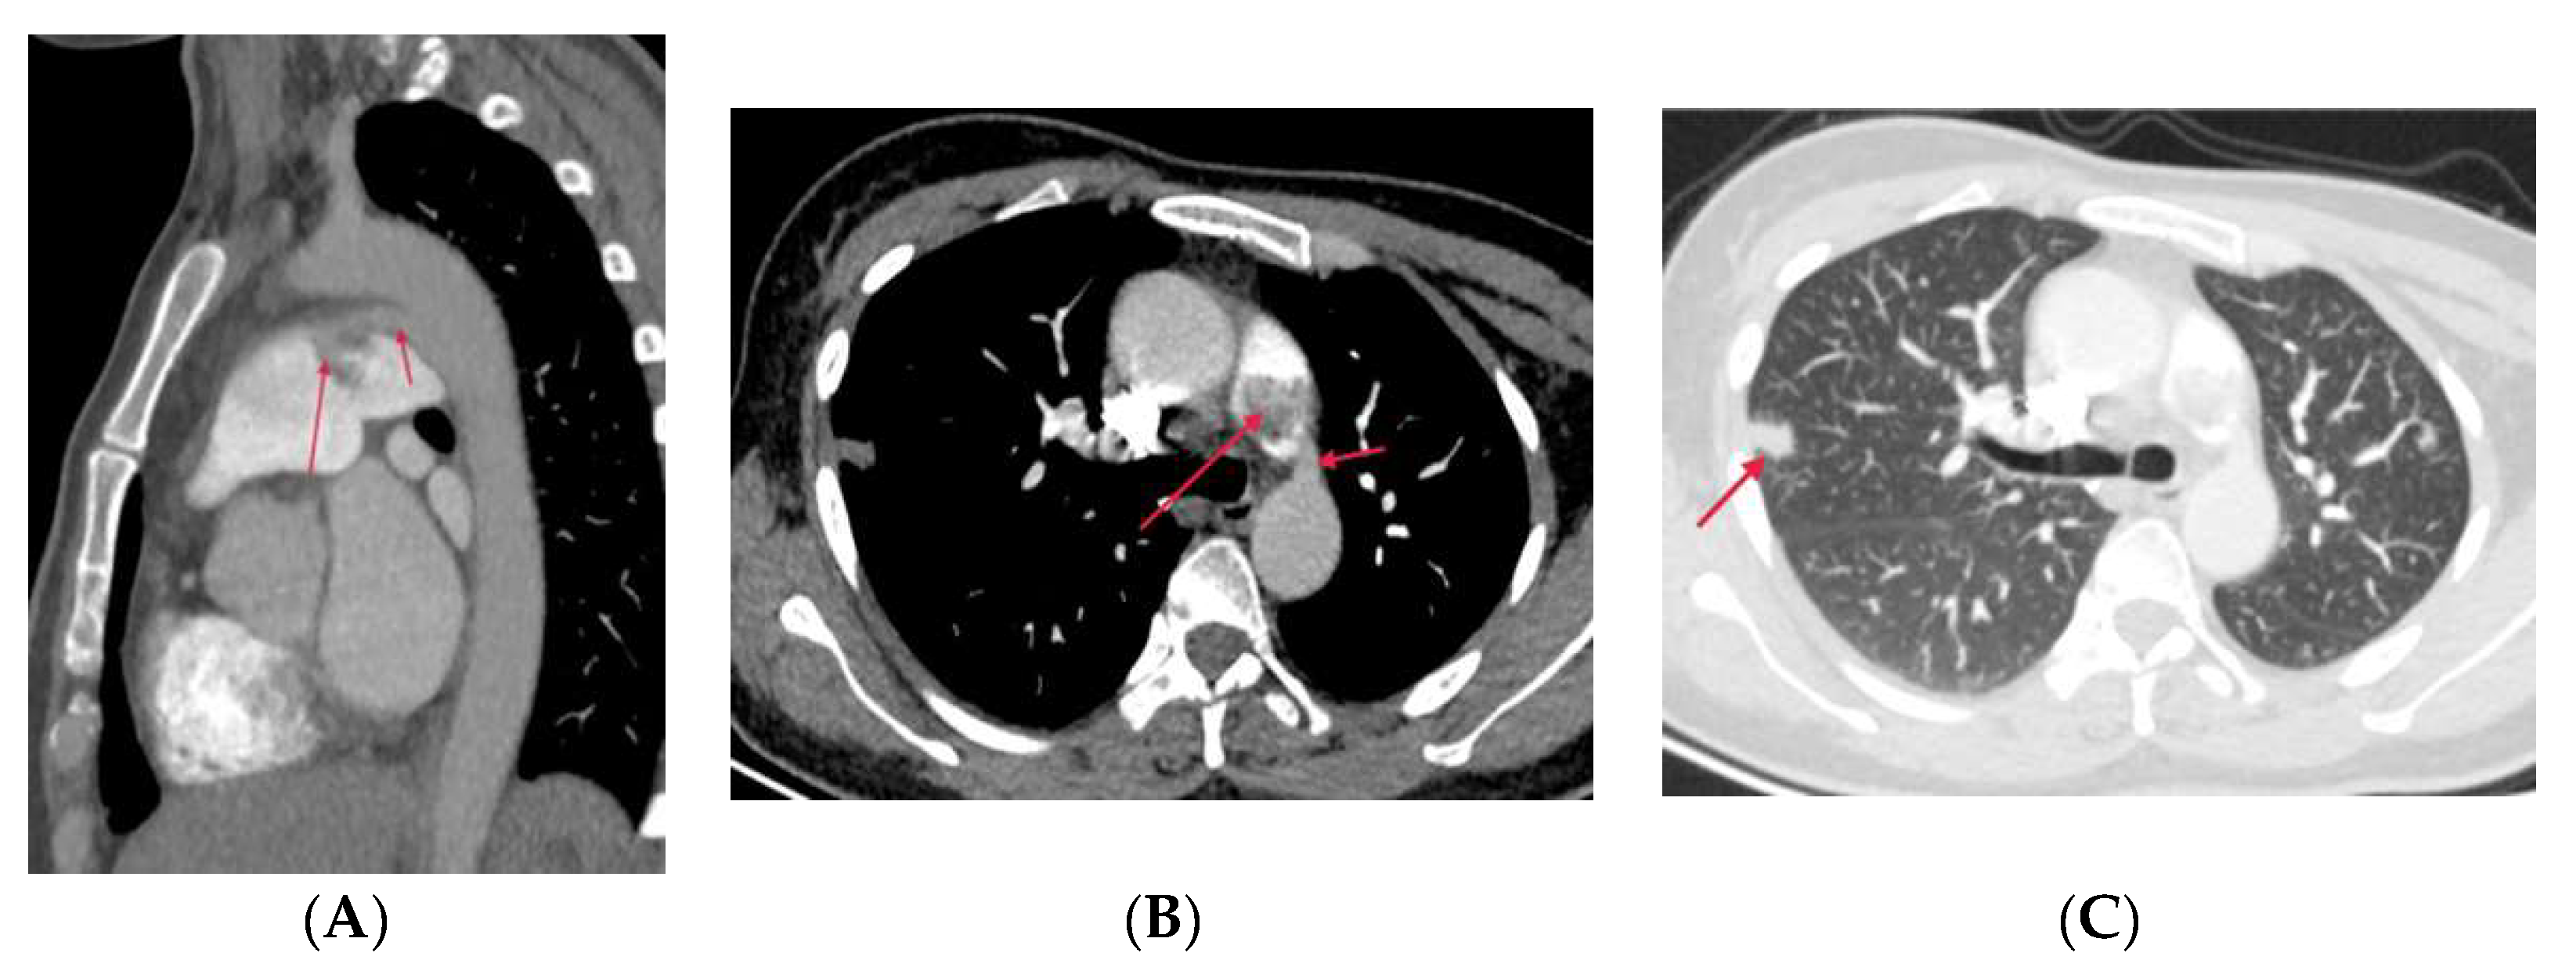


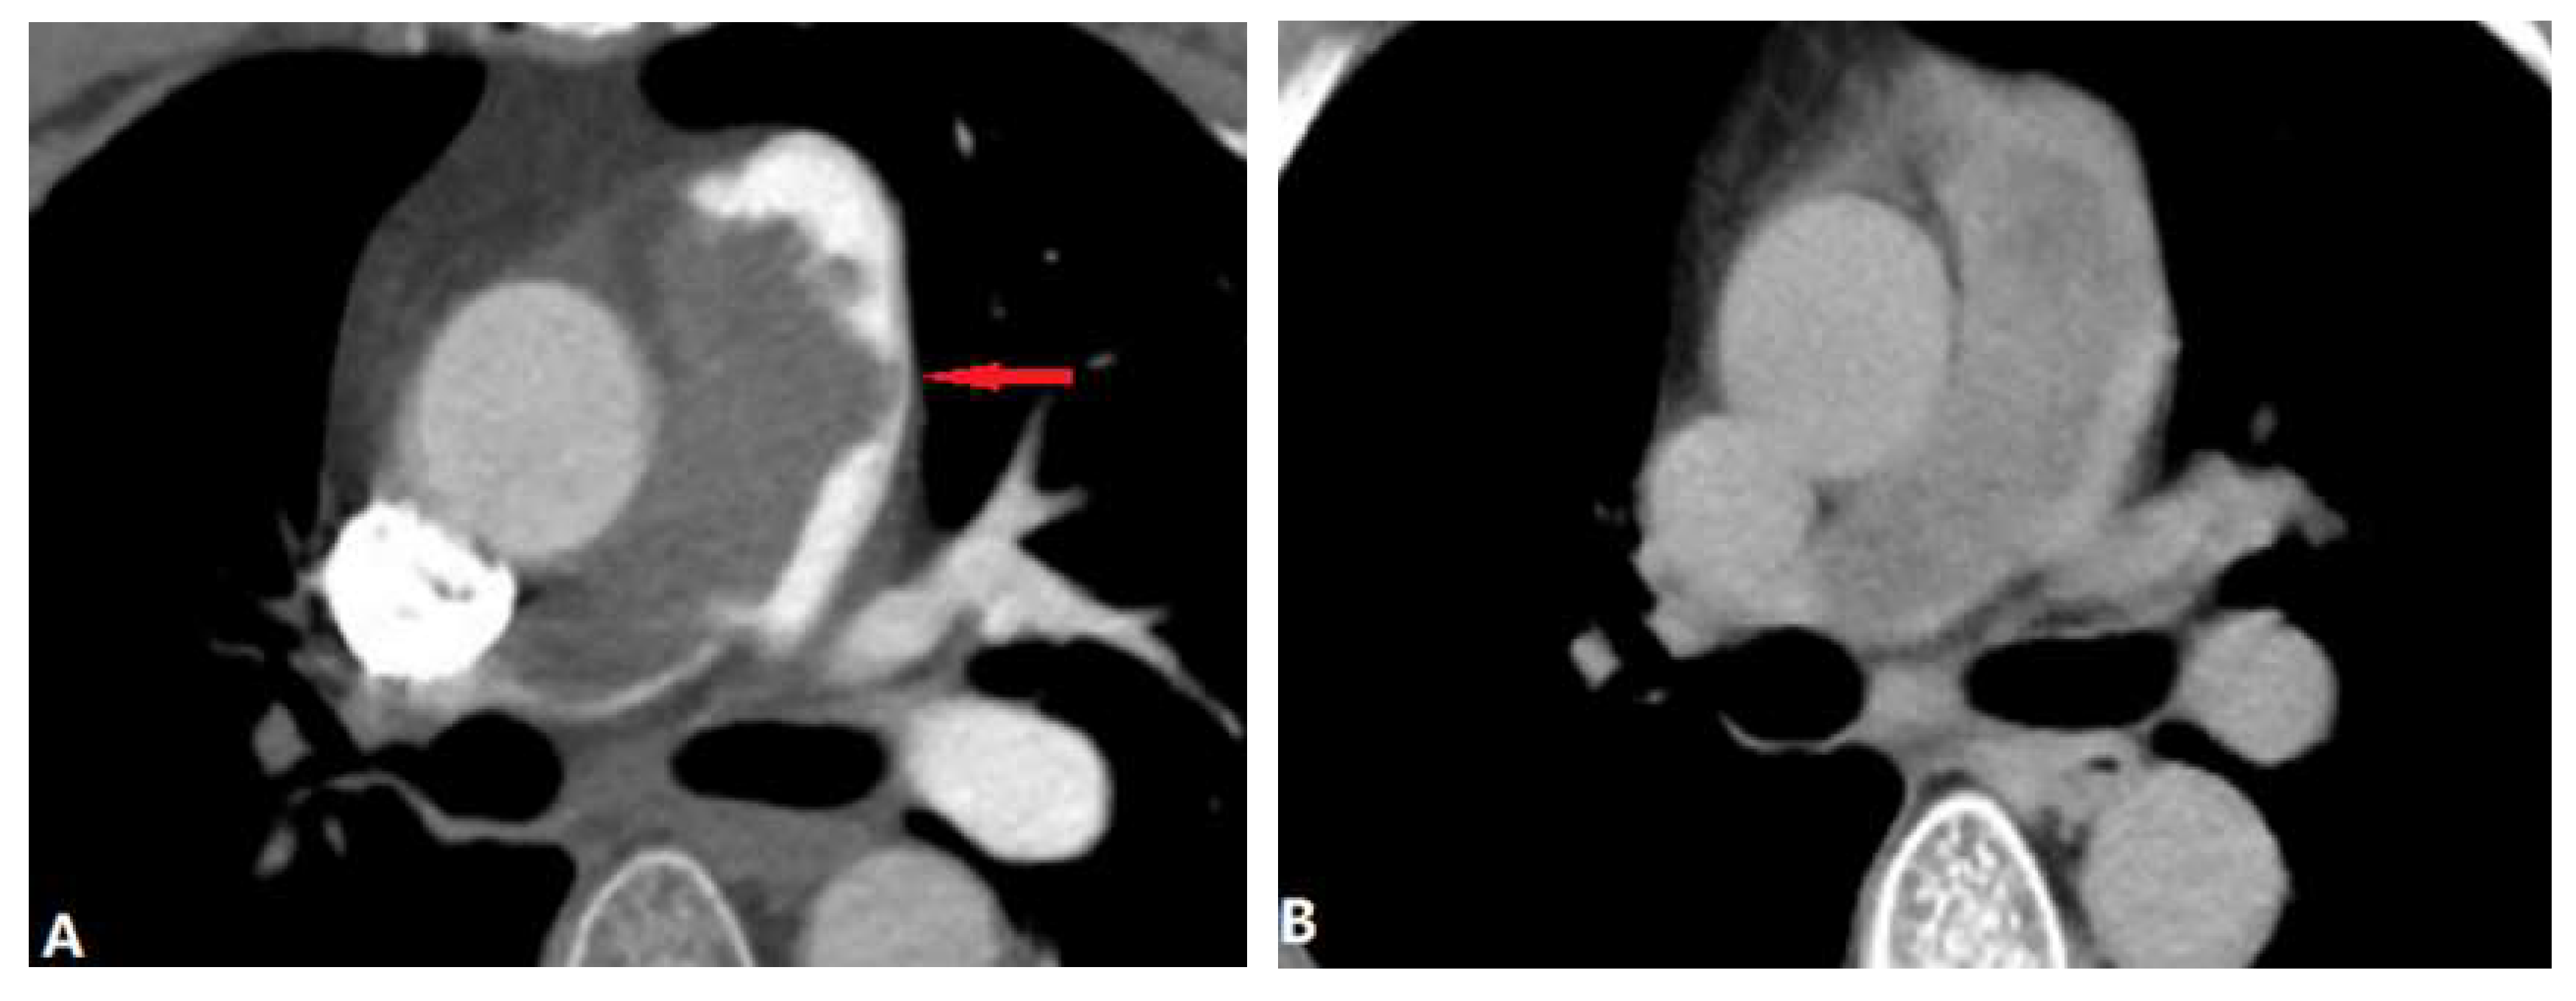
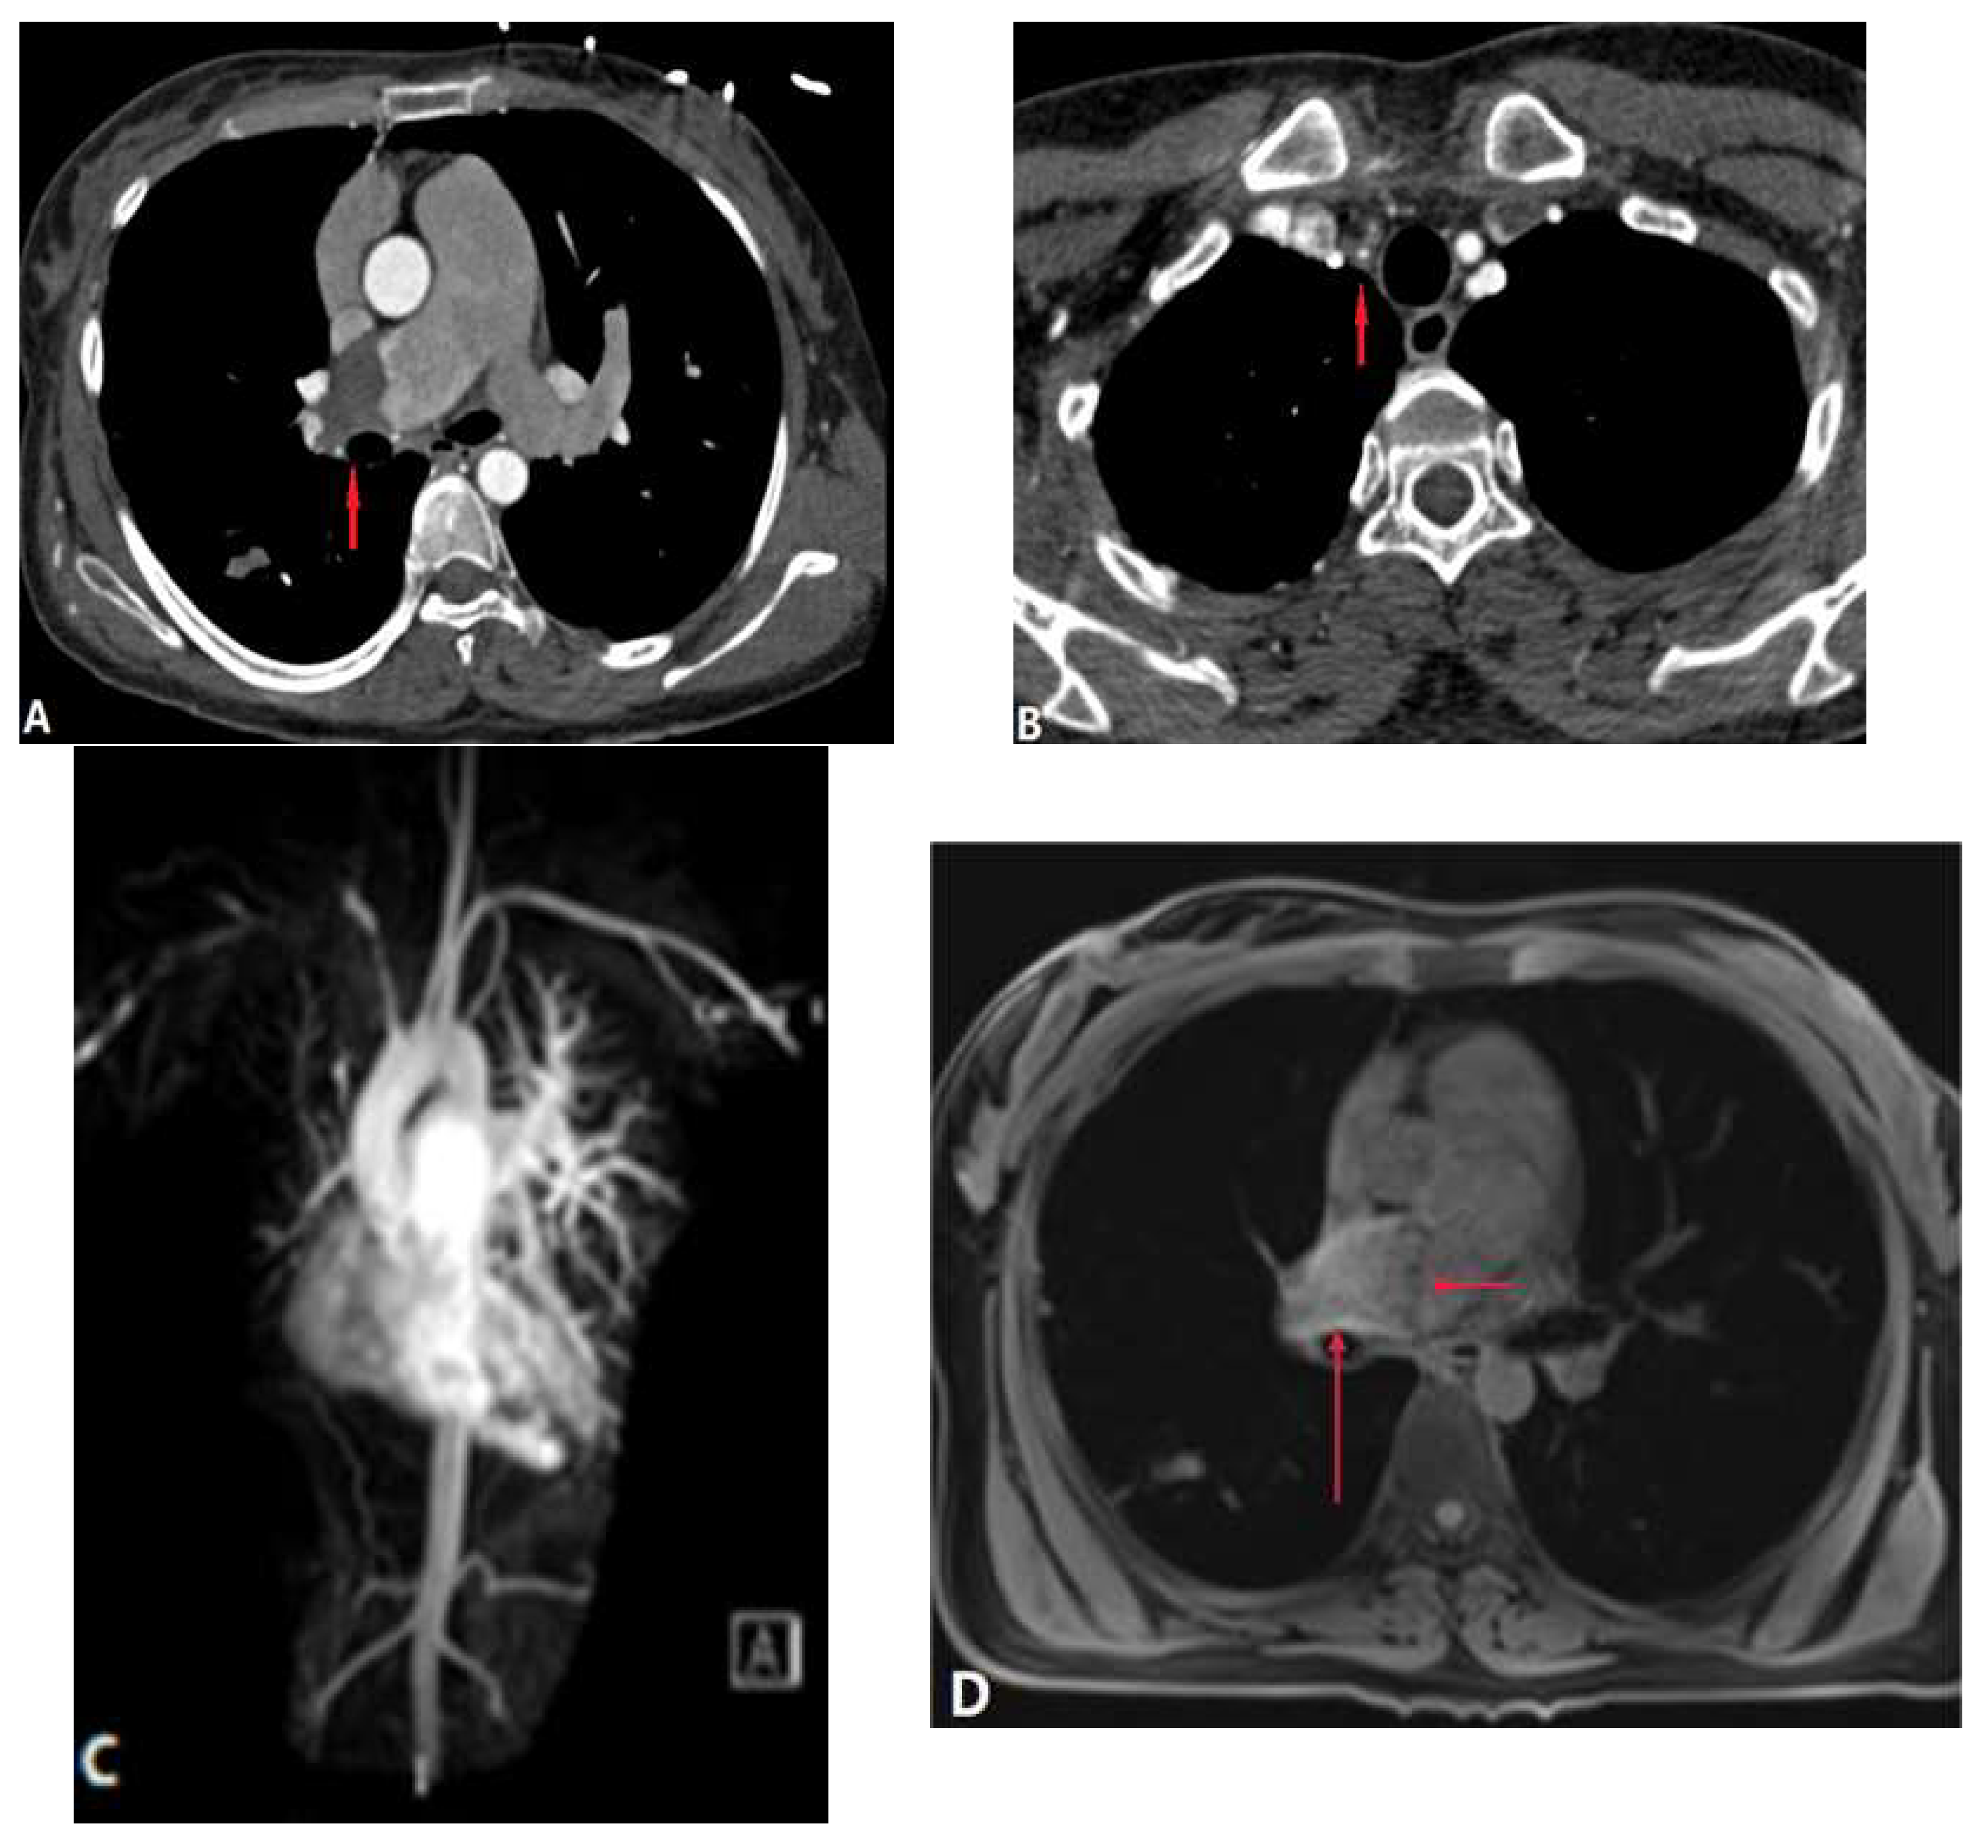
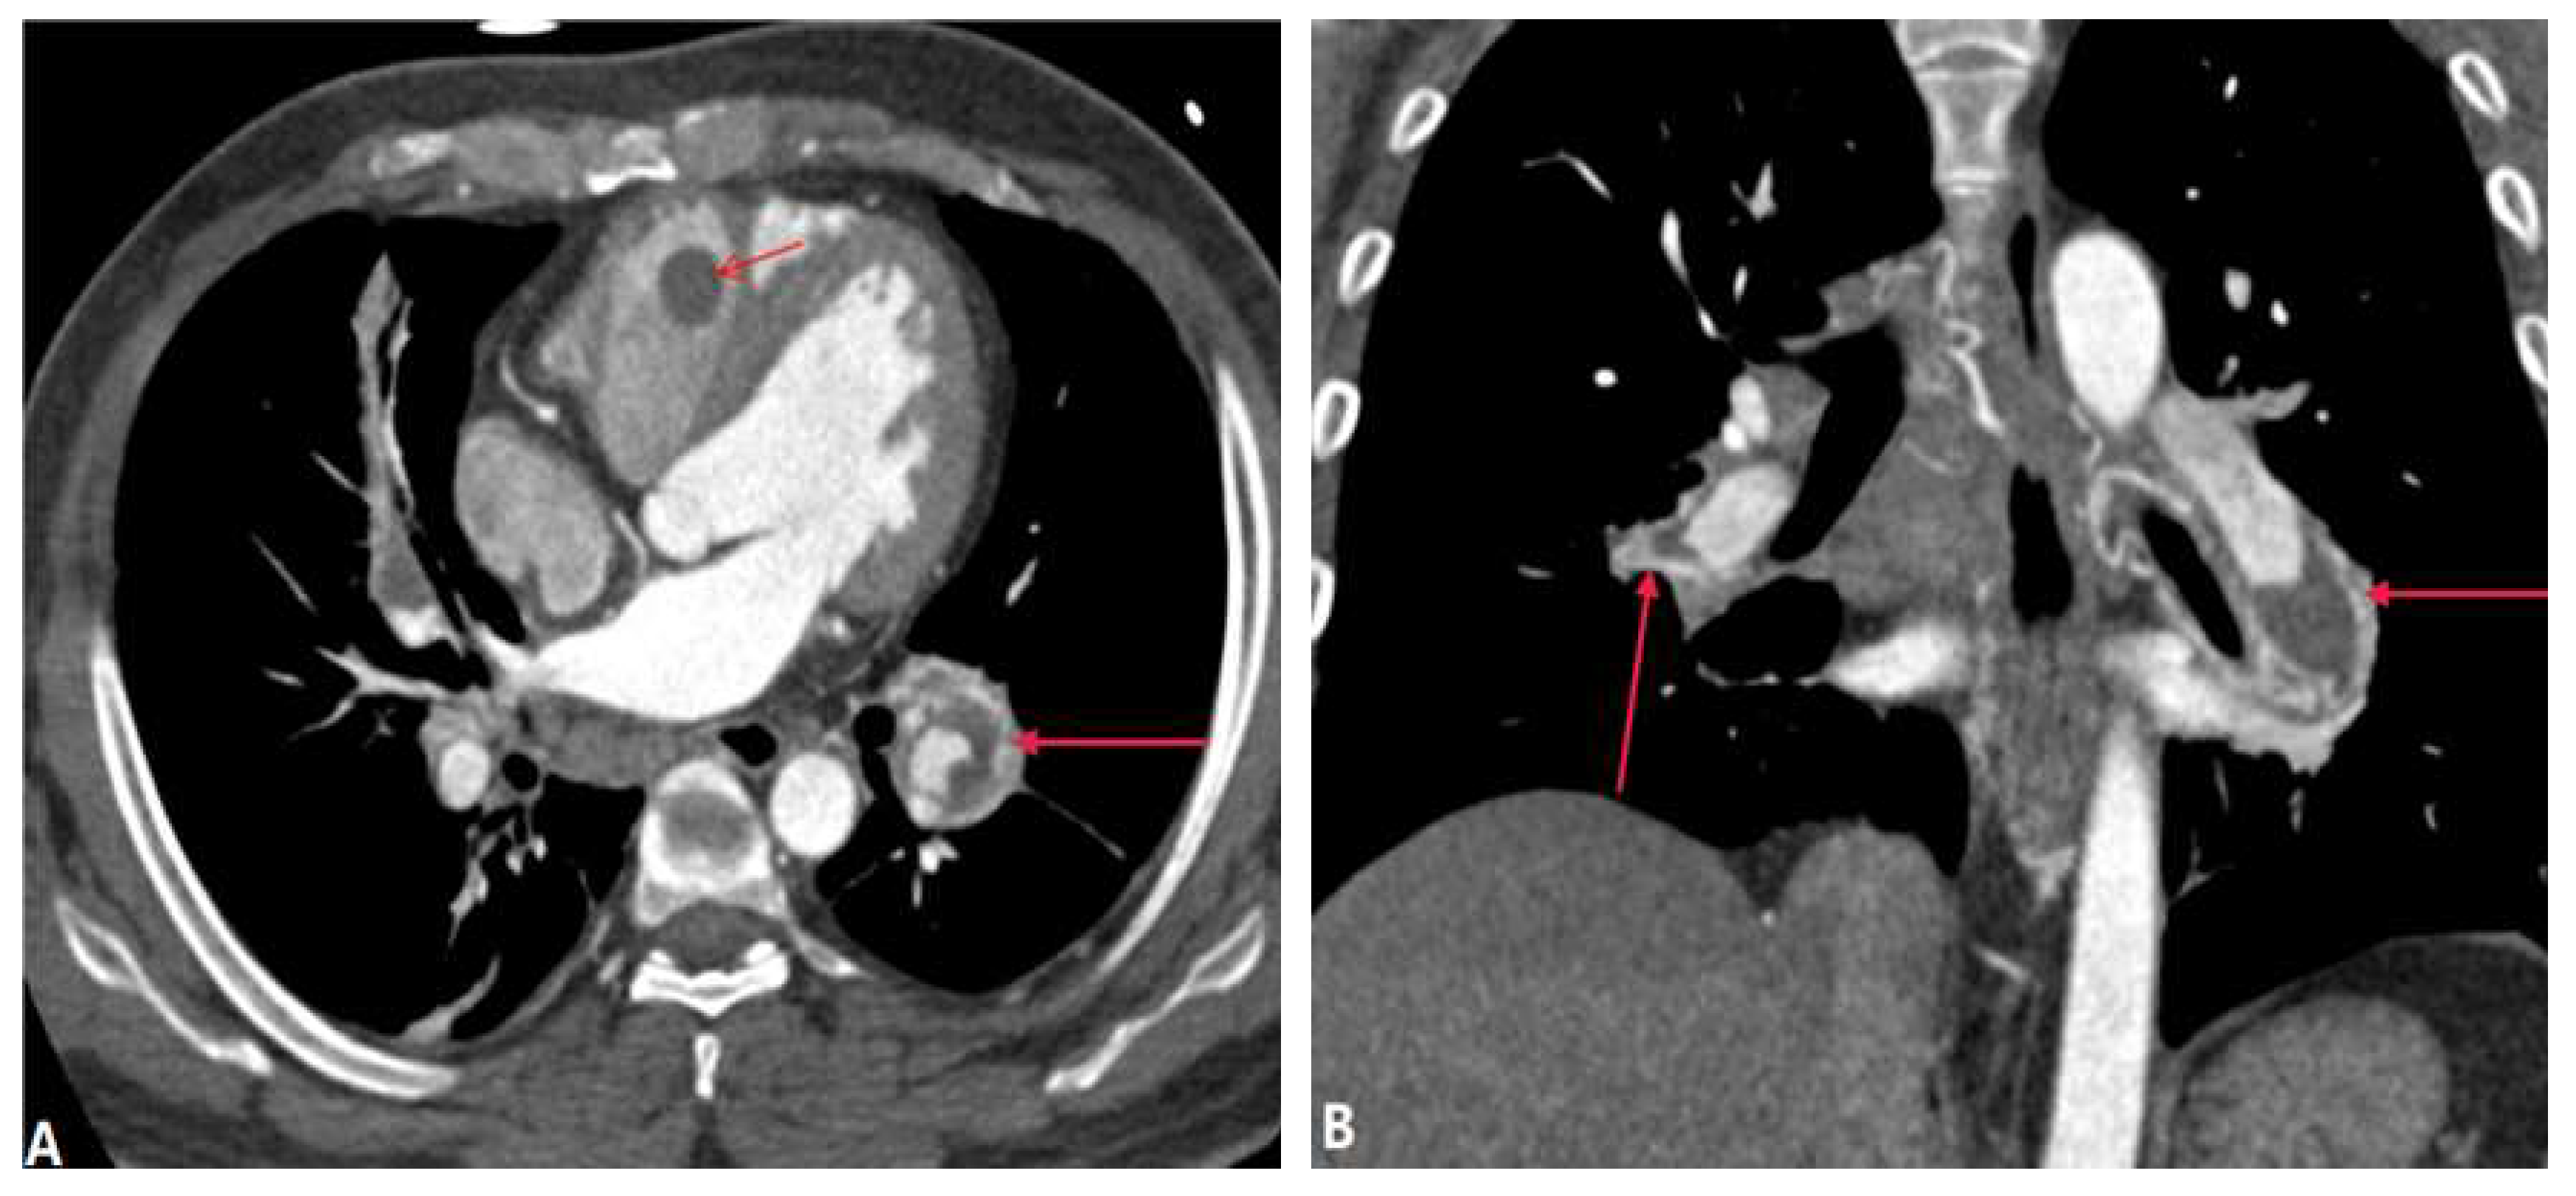
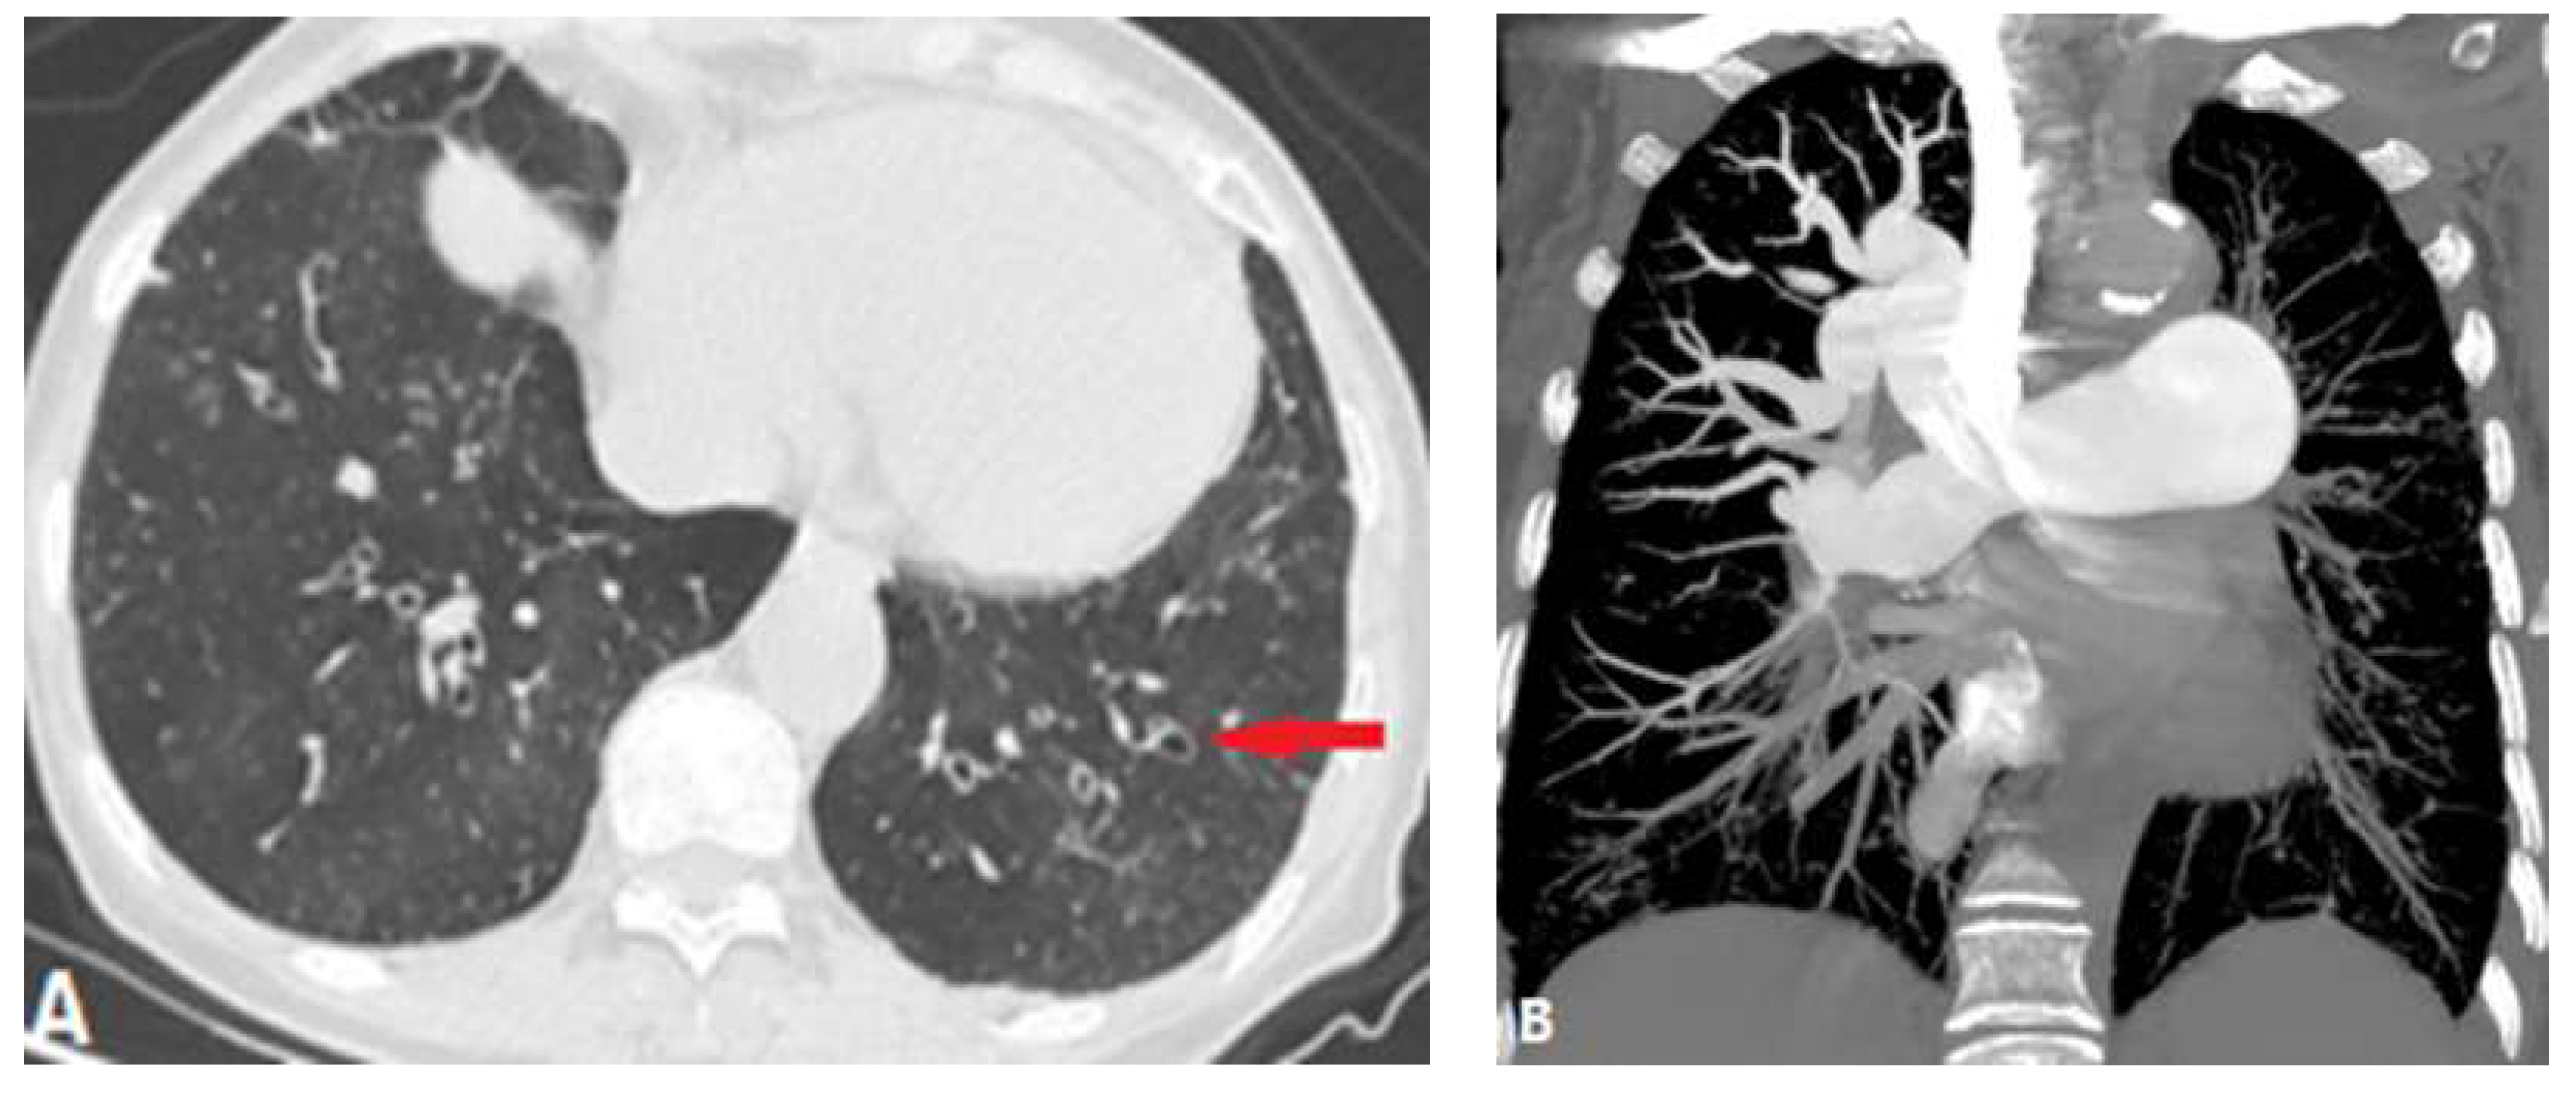
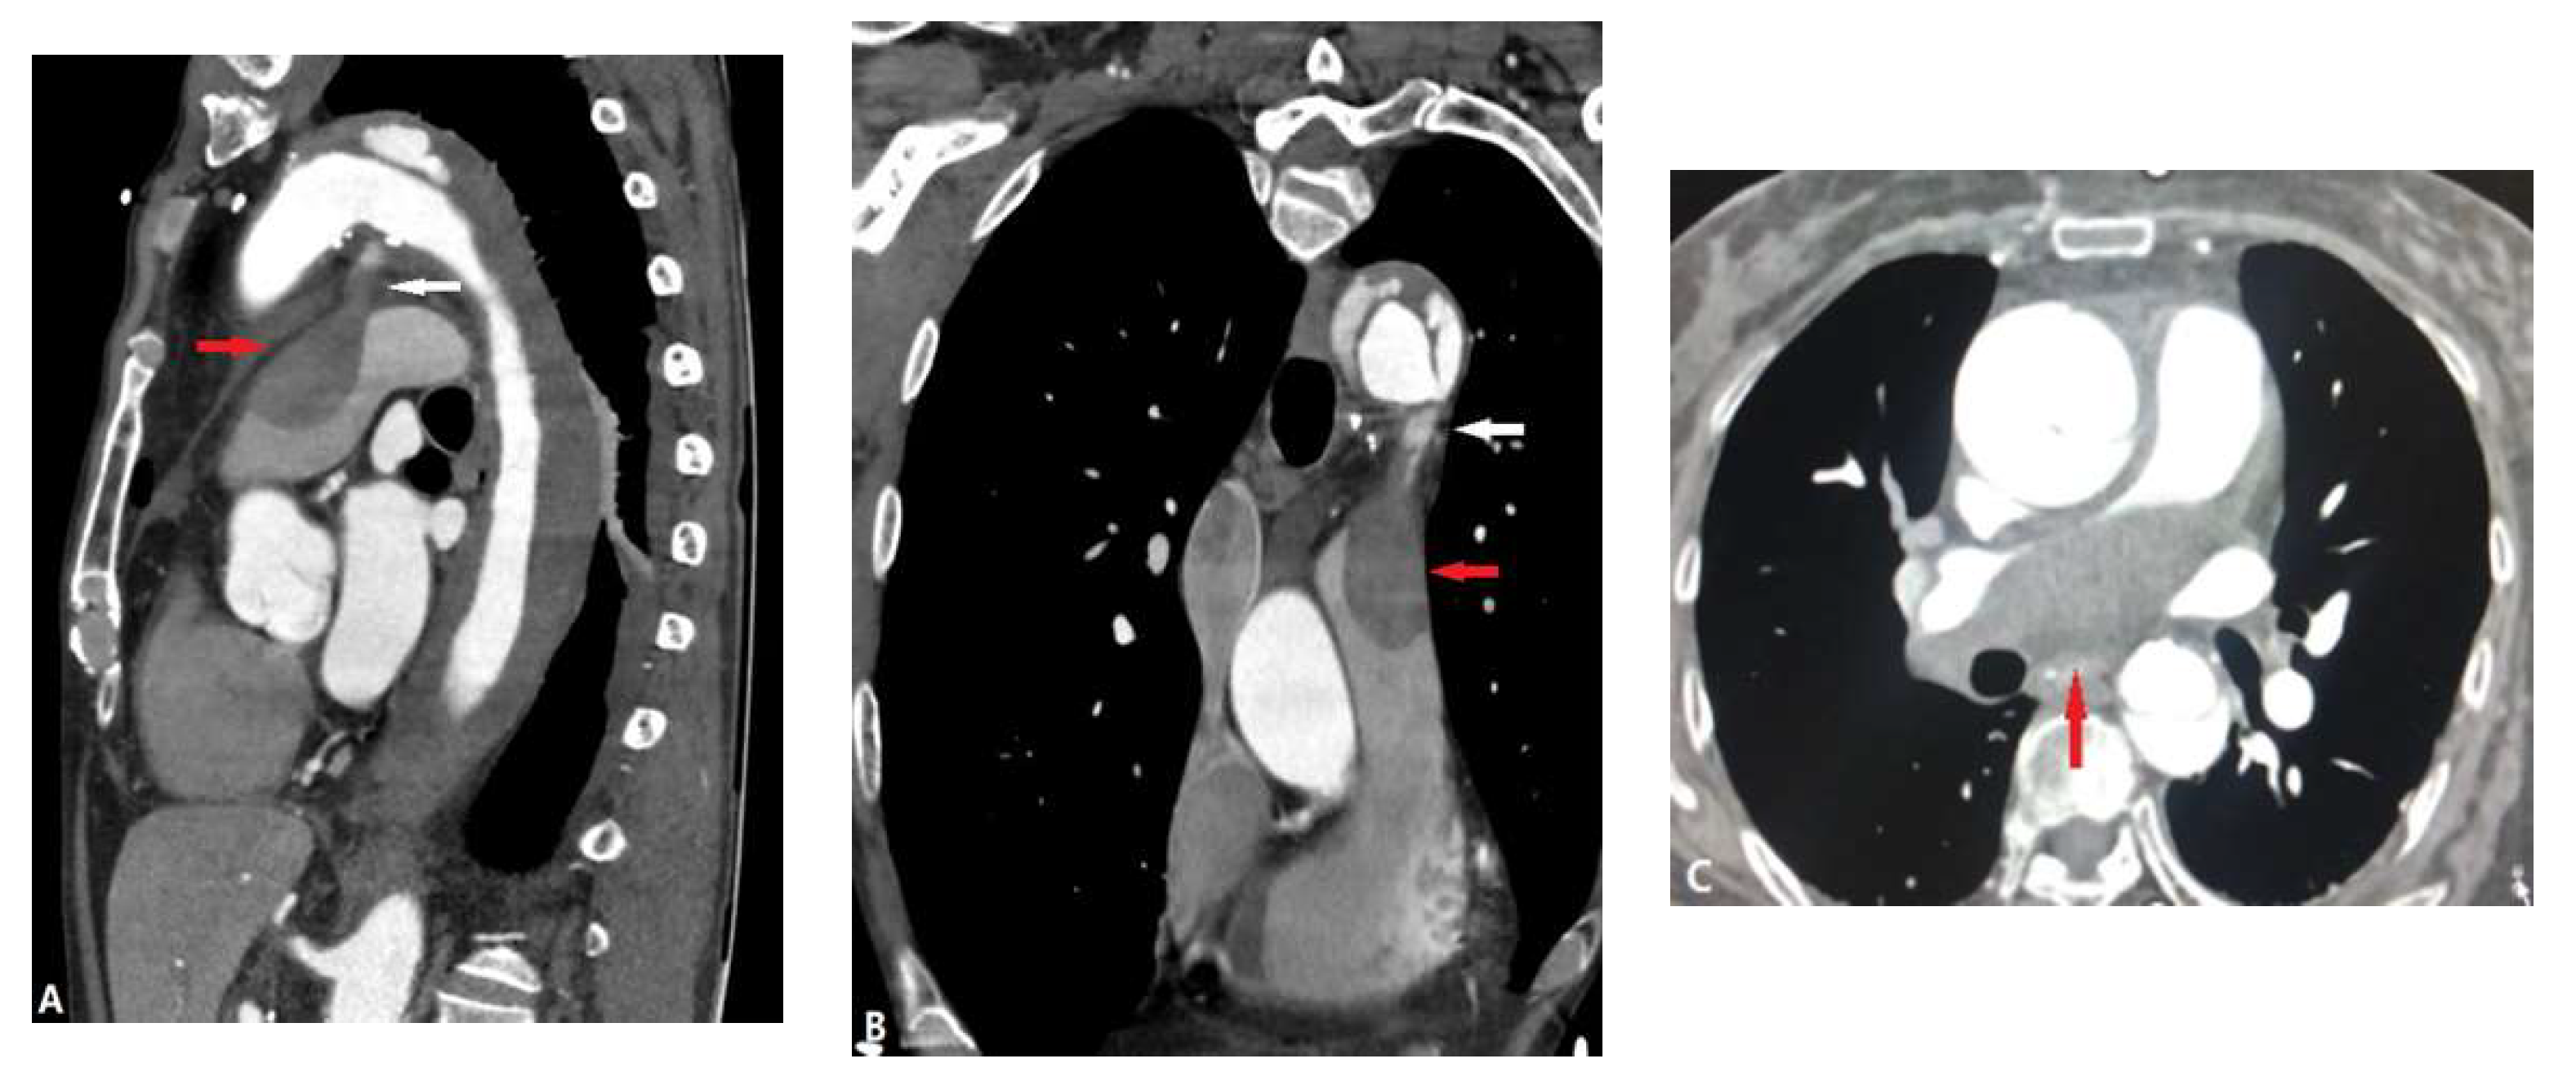

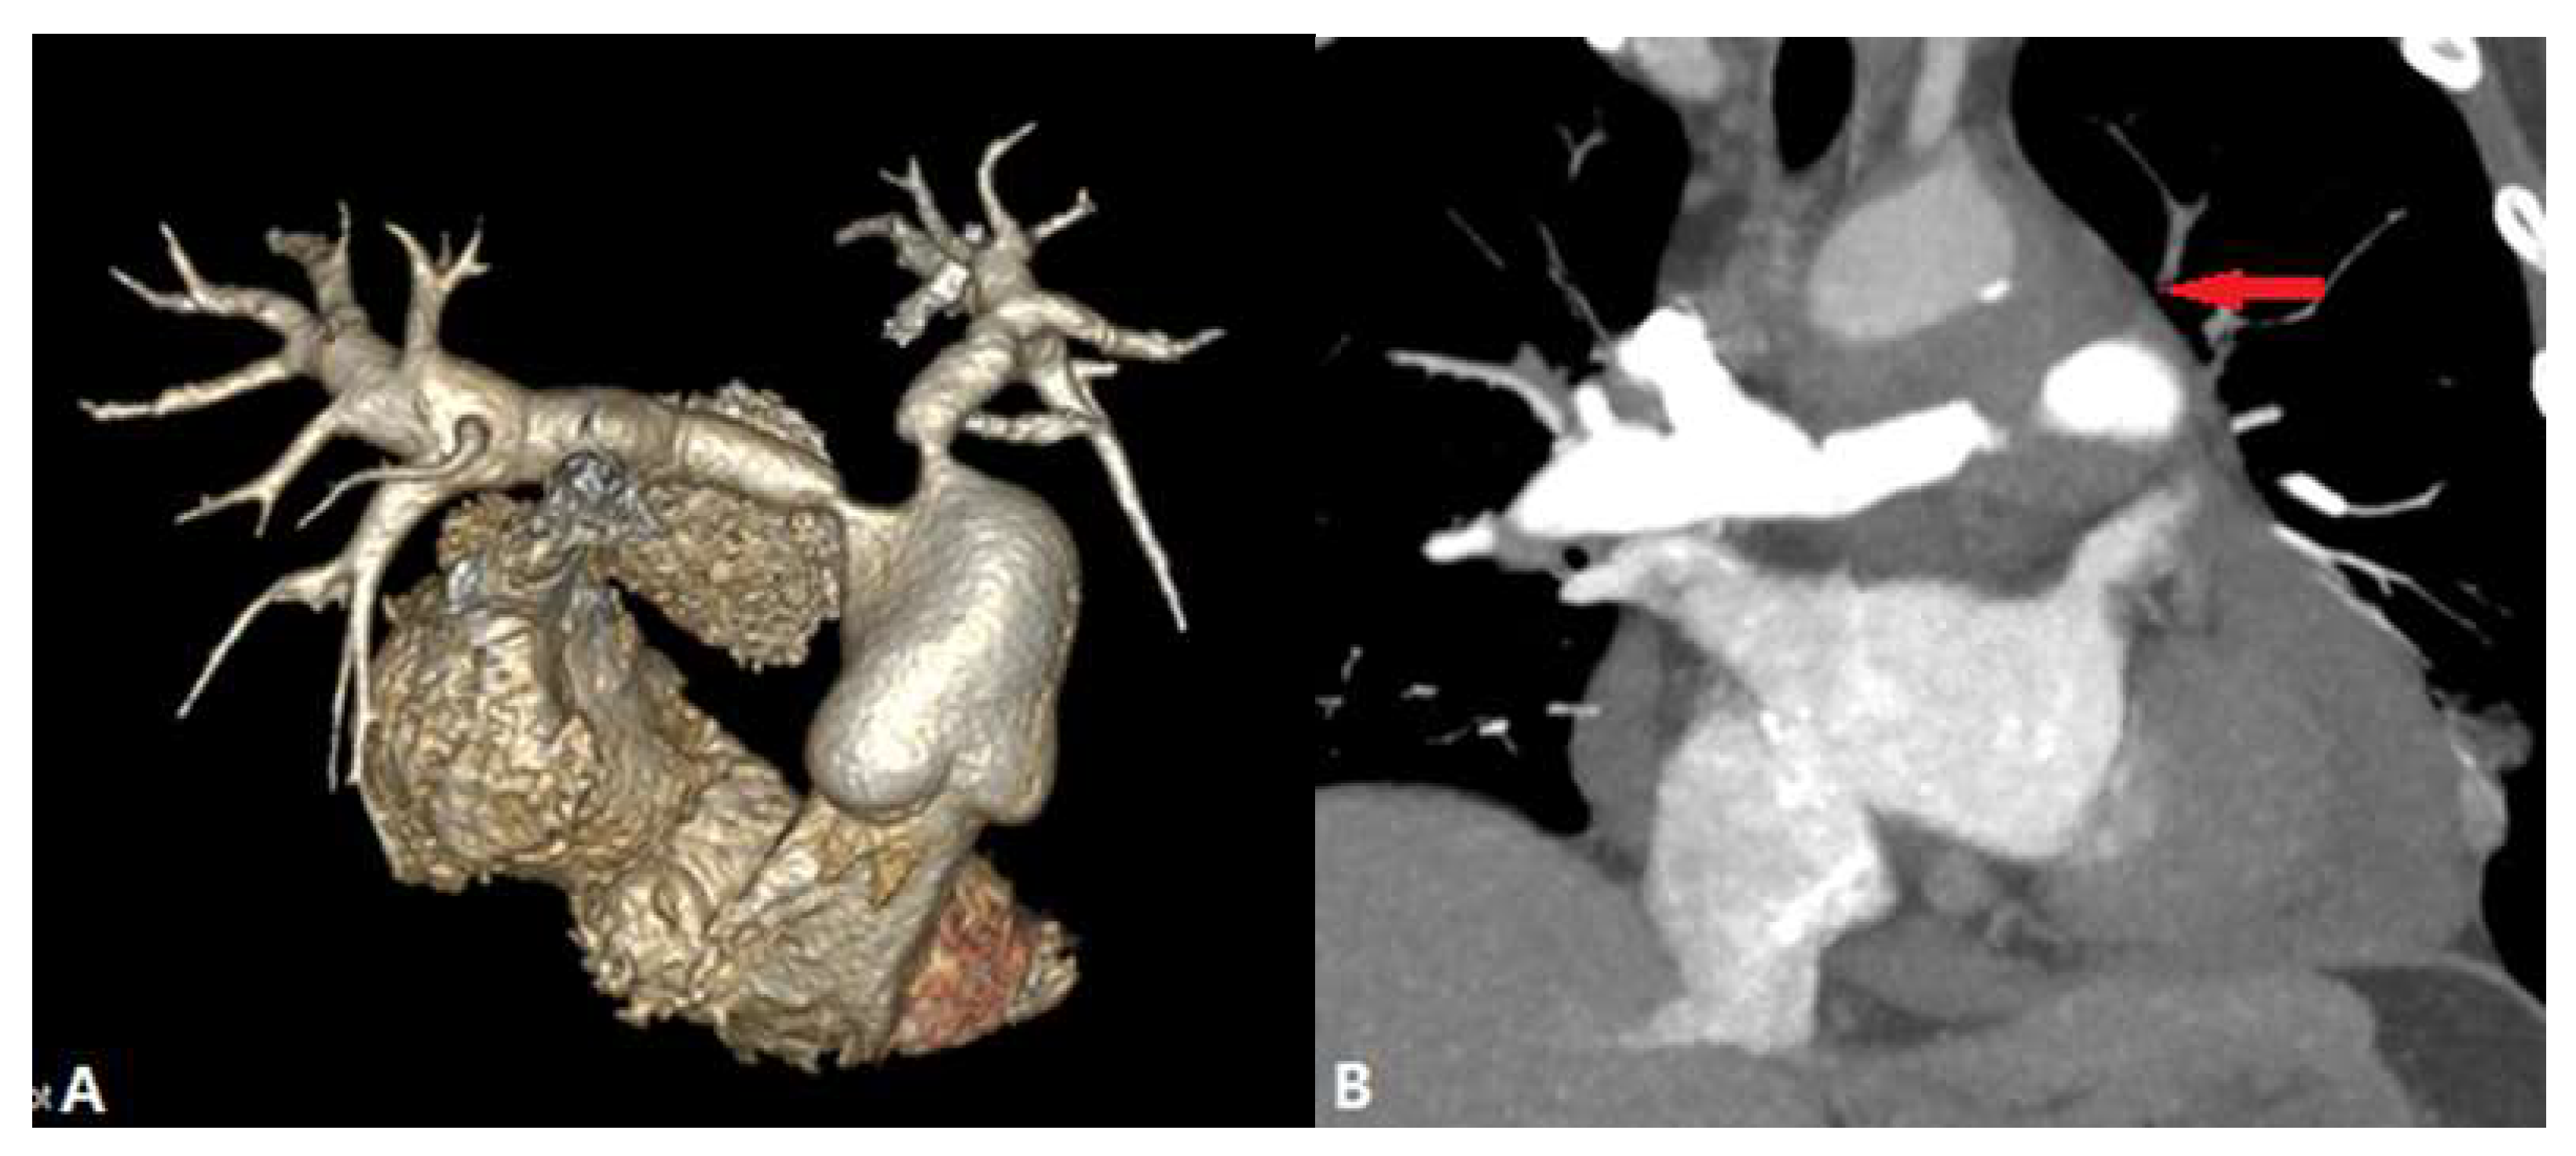
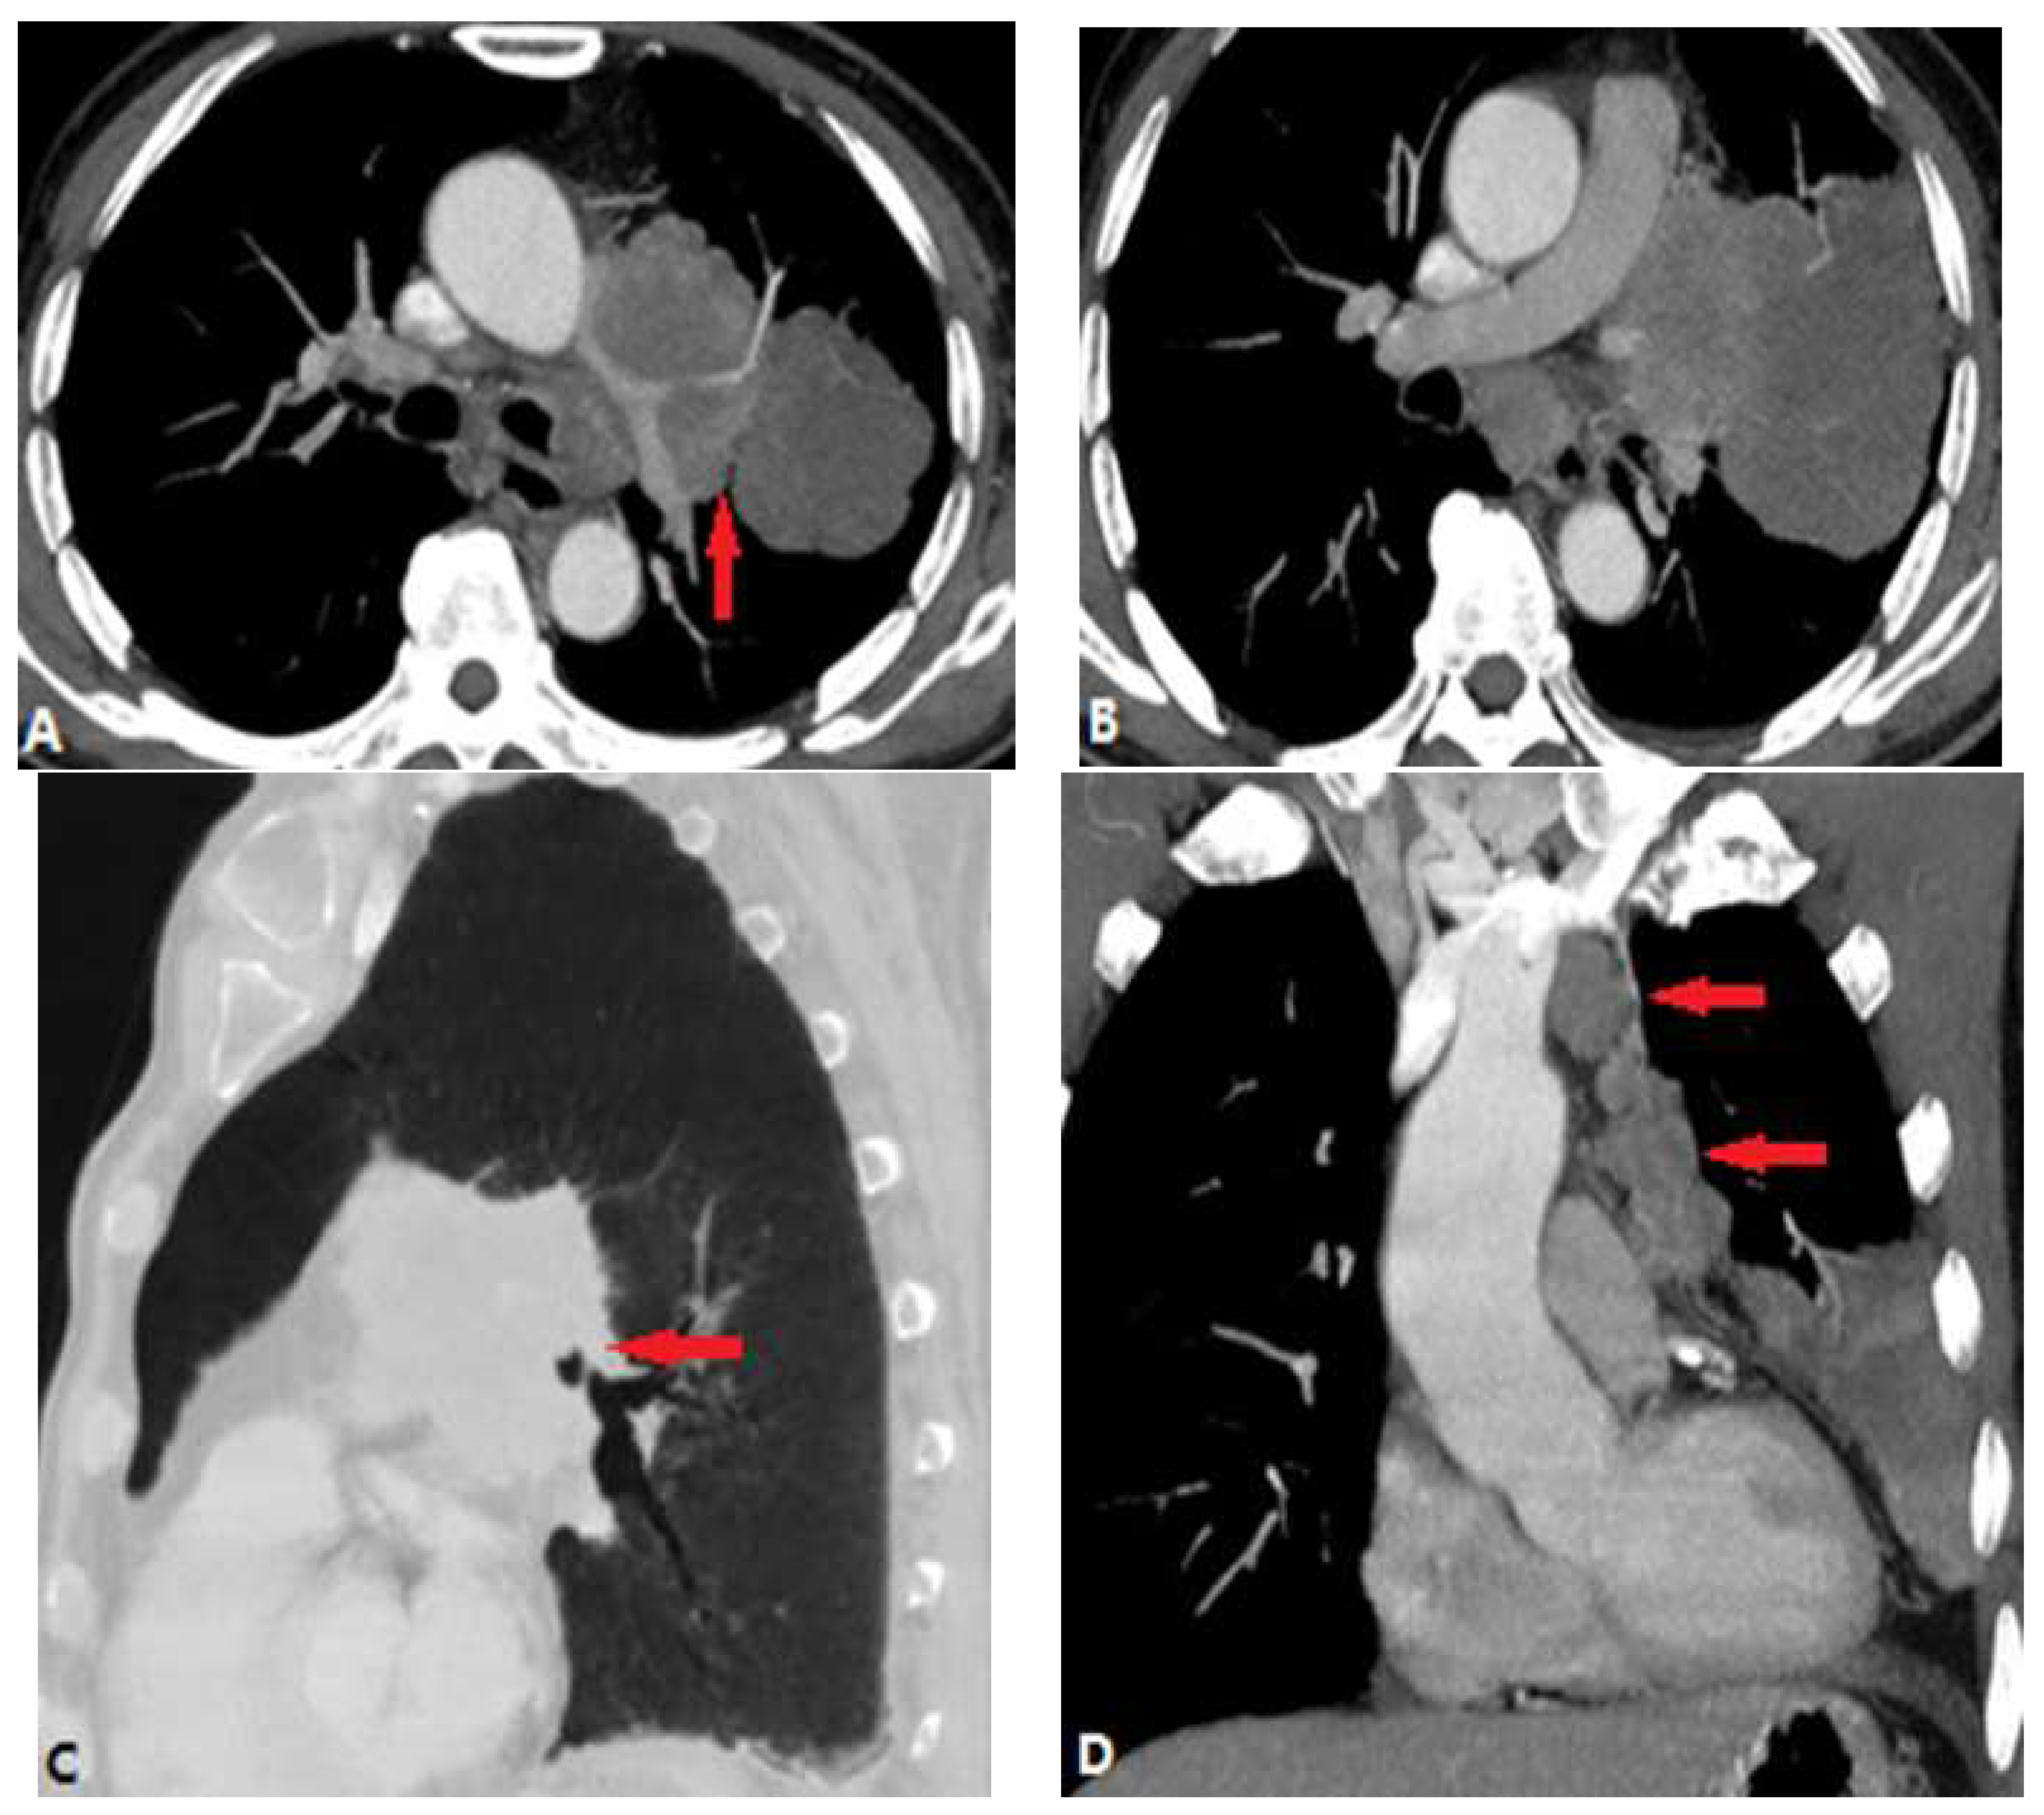
| CONGENITAL DISEASE | |||
| Pulmonary valvular stenosis | |||
| Pulmonary artery atresia | |||
| Pulmonary vein atresia | |||
| ACQUIRED DISEASE | |||
| INTRALUMINAL ANOMALIES | |||
| Pulmonary thromboembolism | |||
| In situ pulmonary artery thrombosis | |||
| Pulmonary tumor embolism | |||
| Pulmonary tumor thrombotic microangiography | |||
| Septic pulmonary embolism | |||
| Foreign bodies pulmonary embolism | |||
| Pulmonary artery sarcoma | |||
| VESSEL WALL LESIONS | |||
| Takayasu arteritis | |||
| Behçet disease | |||
| Swyer James Macleod Syndrome | |||
| Arterial dissection | |||
| EXTRALUMINAL ANOMALIES | |||
| Fibrosis mediastinitis | |||
| Tumor | |||
| Aortic aneurysm | |||
| Complications of radiofrequency ablation of atrial fibrillation | |||
Disclaimer/Publisher’s Note: The statements, opinions and data contained in all publications are solely those of the individual author(s) and contributor(s) and not of MDPI and/or the editor(s). MDPI and/or the editor(s) disclaim responsibility for any injury to people or property resulting from any ideas, methods, instructions or products referred to in the content. |
© 2024 by the authors. Licensee MDPI, Basel, Switzerland. This article is an open access article distributed under the terms and conditions of the Creative Commons Attribution (CC BY) license (http://creativecommons.org/licenses/by/4.0/).


