Preprint
Article

Optimization of Cassava (Manihot esculenta) Effluent Methani-Zation by Organic Nitrogen Supply in Mesophilic Conditions

Altmetrics

Downloads

112

Views

82

Comments

0

Submitted:

01 July 2024

Posted:

03 July 2024

You are already at the latest version

Alerts
Abstract
This study aims to explore anaerobic co-digestion (AcoD) of cassava (EUM) and poultry (FP) ef-fluents using one inoculum-substrate ratio (30%) and three EUM vs FP substrate composition ra-tios (25 :75, 50 :50 and 75 :25). The AcoD process was therefore designed for 20 L batch digesters, under mesophilic conditions, with less than 5% total solids for 66 days. The results showed that EUMs were highly resistant to degradation, while FPs were the most easily degradable. Kinetic analysis indicated specific organic matter reduction rates of 0.28% per day for EUM and 0.76% per day for FP. EUM alone produced 45.47 mL/g MOV, while the 50 :50 substrate produced 1184.60 mL/g MOV. The main factors contributing to EUM inefficiency were the inability to tame acidic conditions, and the accumulation of volatile fatty acids. AcoD produced 23 to 50 times more methane than EUM alone, 2 to 5 times more than FP alone and 2 to 4 times more than ino-culum. Consequently, AcoD of both types of waste had a positive effect on gas formation in terms of quantity and quality, with CH4 content increasing from around 2 to 75% as a function of organic nitrogen input
Keywords: 
Subject: Physical Sciences  -   Applied Physics

1. Introduction

According to the FAO, every year a third (around 1.3 billion tonnes) of the world’s food production is lost or wasted along the food supply chain, creating huge social, environmental and economic problems.
In the European Union, over 98 million tonnes of food waste is produced every year. In China, over 90 million tonnes of food waste is disposed of each year, representing 37% to 62% of municipal solid waste (Ma & Liu, 2019; Pramanik et al., 2019; Slorach et al., 2019; Y. Sun et al., 2014)
According to current estimates, the rate of food loss in sub-Saharan Africa is close to 20%[5]. In addition, the production, processing, transport and storage of food and the burial of food waste generate greenhouse gas emissions, which contribute to climate change. Food loss and waste also contribute to food insecurity and malnutrition. The depletion of these resources and the resulting environmental damage are major global concerns [5].
Against the backdrop of the current energy crisis, the challenges of renewable energy production and the need to find complementary resources for agricultural activity, through the valorization of waste, are all reasons that justify the new recourse to methanization of agricultural biomass. Faced with the high cost of imported products, local products, particularly agri-food products, are becoming increasingly popular with people in developing countries. Agri-food processing industries are springing up all over the place. These agri-food industries generate large quantities of solid and liquid (wastewater) waste, as well as emissions during their processing. These include cassava processing industries, whose wastewater discharges are a problem in many developing countries.
According to the Food and Agriculture Organization of the United Nations (FAO), the world produced around 121 million tonnes of cassava roots in 2017 ; Africa alone produced 55% of global production. Of this production, 25 to 37% is lost as peel ; 14.51% as pulp and around 600 liters of effluent generated per ton of processed cassava tubers [6]. Given this potential, agro-industrial cassava residues, including cassava pulp [7], cassava wastewater [8], cassava stalks, have attracted research attention on its valorization in the form of biogas.
These residues are extremely high in carbohydrates and low in nitrogen, and have traces of residual cyanide, which has been reported to be toxic to methanogenic bacteria (Jiang et al., 2018). According to [7], both problems can be solved by introducing a nitrogen-rich co-substrate, thereby adjusting the C/N ratio to the optimal range and diluting the cyanide content [9], [10] proposed two sequential treatments prior to anaerobic digestion of cassava wastewater. The former used natural oyster shells as a source of calcium carbonate (CaCO3) to stabilize the pH of cassava wastewater, while the latter focused on photo-catalytic degradation to remove hydrogen sulfide.
Unfortunately, these solutions are not accessible to everyone, especially those living in rural areas of our societies. It is therefore essential to propose a locally available co-substrate that could solve the above-mentioned problems, on the one hand, and preserve the environment, manage resources and improve the energy supply of populations in developing countries (DCs) through waste valorization on the other.
Poultry farming is one of the most advanced branches of the agro-industrial complex which could provide the said co-substrate for cassava effluent. It is important to note that this branch also generates large quantities of solid waste (chicken droppings), which are insufficiently utilized [11].
Chicken droppings and manure are hazardous waste for human life and the environment. The greatest threats are related to the emission of harmful gases (mainly ammonia), the release of leachates into soil, groundwater and surface water, and microbiological risks [11]. Anaerobic digestion (AD) is one of the most economically attractive methods for utilizing these types of waste ([12] This approach produces biogas, which can be used for heating or electricity generation [11]
However, it has been noted that digestion of chicken droppings is mainly limited by the content of nitrogen compounds, which can be present in a substrate in the form of ammonium and undissociated ammonia [11]. To reduce the effect of ammonia inhibition, it is necessary to set up an anaerobic digestion process with a high hydraulic retention time (HRT) and, consequently, a low organic loading rate (OLR) [11].
Other authors have reported that co-digestion with different feedstocks increases methane production, and is more economically advantageous than mono-digestion [11], [13]. During co-digestion, increased methane yields are attributable to better substrate degradation and higher volatile solid concentration, both of which translate into greater methane potential [12], [14]. As a result, chicken droppings could constitute a source of organic nitrogen for optimizing the anaerobic digestion of cassava effluents.
The overall aim of this study is to define the optimum conditions for the production of methane-rich biogas by co-digestion of cassava processing effluents and chicken droppings. Anaerobic co-digestion of liquid and/or solid substrates is the anaerobic fermentation of a combination of two or more wastes. It operates on the same basic principles as mono-substrate anaerobic digestion. Anaerobic co-digestion can be a combination of liquid/liquid, solid/solid or liquid/solid co-products. The present study is a co-digestion of liquid substrate (cassava effluent) and solid substrate (chicken droppings). This technology is an attractive approach for improving waste anaerobic digestion yields due to the positive synergies established in the digestion medium and the nutrient balance achieved by combining several substrates. Nutrient inputs improve the organic matter content of the digester [15], [16].
One of the main advantages of co-digestion is the balance between carbon and nitrogen in the organic matter, and that a balanced C/N ratio of the material is likely to improve methane production [17]. The main objective is to maintain process stability [17]. This process stability encompasses the proper functioning of the reaction medium: maintaining the alkalinity of the reaction medium, balancing the C/N ratio and adjusting the dry matter content. It generally contributes to diluting toxic elements, providing additional nutrients and adequate humidity. To improve methane yield during methanization, they need to be combined with substrates rich in organic matter and low in nitrogen, as in the case of cassava effluent. To enable bacteria to thrive under optimum working conditions, the balance of the organic matter’s C/N ratio is an important factor [17]. The addition of co-products is also necessary. In the present study, the aim is to define the conditions for co-digestion of cassava and poultry effluents as an alternative to circumvent the risk of inhibiting mono-digestion of these two substrates. Specifically, the effects of combining several substrates on the optimization of methanization will be verified by assessing their methanogenic potential.
Cassava (Manihot esculenta) is a native South American plant of significant nutritional value, used as a food or raw material for certain processed products such as cassava flour, tapioca and cassava starch [10]. Agro-industrial cassava residues, including cassava pulp [7], cassava effluents [8], cassava stems, have attracted attention with the development of starch processing and manufacturing. However, these residues are extremely high in carbohydrates and low in nitrogen [18] and have residual cyanide, which has been reported to be toxic to methanogens. According to [7], both problems can be solved by introducing a nitrogen-rich co-substrate, which adjusts the C/N ratio to the optimal range and dilutes the cyanide content. In addition, this co-substrate also reduces the amount of alkalinity required for pH control and provides methanogenic inoculum [8].
Nevertheless, the literature has shown that the toxicity of cassava residues varies according to altitude, geographical location, harvesting period, crop variety and seasonal conditions [19]. In northeastern Brazil, for example, cassava processing is generally carried out in small facilities, which generally discharge these effluents nearby without any treatment. However, when large quantities of these contaminants are discharged, this causes serious environmental problems such as soil contamination, unpleasant odors, disease vectors and water pollution when discharged into waterways, resulting in the poisoning and death of fish and other aquatic animals [20]
Among nitrogen-rich co-substrates, some authors have considered co-digestion of cassava residues with cattle manure [21], cattle rumen[22], pig manure [23] and buffalo dung [8]. [7], for example, evaluated cyanide degradation during co-digestion of cassava pulp with pig manure. The research concluded that co-digestion was conducted successfully ; once after a short acclimatization period, the anaerobic slurry degraded cyanide, indicating that its inhibition was reversible. In addition, the application of pretreatment is another possible approach to cyanide removal [9].
For some authors, cassava starch wastewater has, among other things, potential as a feedstock for biogas production, which is summarized in Table 4. In this regard (Jiraprasertwong et al., 2019) evaluated co-digestion of cassava wastewater at different loading rates from 5 to 18 kg/m 3-D (based on total liquid volume), and 15 kg/m3 d was considered the optimal rate, resulting in increased H2 and CH4 yield, as well as the highest COD removal. According to [25], an average retention time of 15 to 30 days is required to treat waste under mesophilic temperatures. Successful HRT also depends on substrate composition (Thanwised et al., 2012). Wastewater from cassava processing has also been reported in the literature as a good substrate for hydrogen production by anaerobic digestion [27].
Table 1. Characteristics of manioc effluents from selected works.
Parameters [28] [23] [8] [20] [29] [30]
pH 3.67 5.80 5.18 3.90 4.50 4.71
DBO (g/l) NA NA NA 29.2 NA 6.3
DCO (g/l) 58.790 37.700 21.690 101.380 69.830 10.500
Total solids (g/l) NA NA 16.89 92.9 57.92 NA
Volatile solids (g/l) NA 4. 332 16,480 73,400 42,270 NA
Azote (%) 0.710* 0.028* 0.030 2,140 NA 0.525*
Cyanure (mg/l) NA NA NA NA 13.2 2.3
*g/l, NA=No analysis.

2. Materials and Methods

2.1. Materials

A platform consisting of 6 digesters in batch mode was developed for the present study. Each digester has a volume of 20 liters and a gasometer consisting of an air chamber. The digesters are painted black to facilitate heat accumulation during the day. Figure 1 shows an illustration of the platform.

2.1. Methods

2.2.1. Substrate and Inoculum Preparation

Two substrates were used in the present study: (i) chicken droppings from three poultry farms as a source of organic nitrogen and (ii) cassava wastewater from cassava processing units as a base substrate. An active inoculum operating in a mesophilic digester (at the FASO BIOGAZ station) was used to activate the methanization of the different digesters in our study. The inoculum was introduced into the digesters in mass proportions ranging from 17 to 25% (30% volume ratio: 4.5/15).

2.2.2. Immediate Substrate Characterization

2.2.1.1. Dryness

Dry matter (total solids for wastewater) is determined in accordance with NF ISO 11,465 AFNOR X 90-029 (1994) by drying in an oven at 105 °C for 24 hours. The difference in weight corresponds to the moisture loss, and the residue represents the dry matter content of the sample. The capsule is weighed after cooling in a desiccator. The dry matter content is determined by Equation (1).
M S = M f M v M i M v × 100
Mf: final mass of crucibles and sample after drying at 105 °C (g) ; Mv: mass of empty crucible (g) ; Mi: mass of crucibles and samples before drying (g) ; MS: dry matter (g).
From Equation (1), we obtain the moisture content (% H) of the substrate, which is:
% H = 100 M S ( % )

2.2.1.2. Organic Matter Content

The organic matter content (total volatile solids for wastewater) of the samples is measured in accordance with NF U 44,160 (1985). The previously dried samples are calcined in an oven at 550 °C for 4 hours in an oxidizing atmosphere. The organic matter is consumed, and the residual matter constitutes the mineral matter. The loss of mass, in relation to the quantity of dry matter, corresponds to the rate of volatile matter.
M O ( % ) = M f ' M v M f M v × 100
Mf’: final mass after calcination at 550 °C ; Mf: final mass after drying at 105 °C ; MO: organic matter.

2.2.1.3. Determination of COD

The method used is photometric in accordance with NF ISO 15,705. Samples are homogenized beforehand. The reactor is preheated to 150 °C. A first tube containing potassium dichromate (the standard) is filled with 2 mL deionized water. 0.2 mL of each sample is introduced into each reagent tube, holding them at 45°. The tubes are then inserted into the reactor and heated for 2 hours at 150 °C. They are then placed in a rack for 20 min to bring the temperature down to around 120 °C. The displayed value is read with the photometer and the COD are calculated according to Equation (4), always starting with the standard solution (as per HANNA instruction manual).
D C O ( m g O 2 / l ) = F × A
Where, F: COD concentration (mg/l O2) displayed by the photometer ; A: dilution factor.

2.2.1.4. Determination of Total Kjeldahl Nitrogen (N-NTK)

Total Kjeldahl nitrogen was determined in accordance with AFNOR T90-110. The Griess colorimetric method was used. Almost one gram (1 g) of a sample is added to a Kjeldahl tube, followed by 20 mL of concentrated sulfuric acid H2SO4 (96%) and 5 grams of Kjeldahl catalyst (Cu-Se). The sample is then transferred to the digestion block for mineralization, successively at the following temperatures: 180 °C for 2 hours, 250 °C for 2h and 340 °C for 2h. After digestion, the tubes are removed and cooled for approximately 10 min. Thirty (30) mL of water are added, and the whole is stirred directly with the vortex mixer to dissolve residual salts. Next, the water is made up to 75 mL and a stopper is placed on the tube and inverted several times. Leave to cool for 24 hours. Total nitrogen is determined using an automated colorimetric analyzer. The color produced by the reaction between ammoniacal nitrogen, salicylate, nitroferricyanide and hypochlorite is measured as a spectrum with a wavelength of 660 nm.

2.2.1.5. Determination of Total Carbon

A furnace combined with a Shimadzu TOC-VCSH model carbon analyzer was used to determine total soluble organic carbon. The analysis was carried out according to MA 405-C 1.1, which is a modification of the Walkley and Black method. The method is based on thermal oxidation at 900 °C of all carbon present in the sample to CO2 and subsequent detection of CO2 by infrared spectrophotometry.

2.2.2. Methanization

2.2.2.1. Digester Composition

Digesters have been designed using recycled materials. Each digester is 75% full, i.e., 15 liters out of a capacity of 20 liters. Three standard digesters were added, consisting of chicken droppings + inoculum, cassava wastewater + inoculum and inoculum alone. Three further digesters were set up for co-digestion with the mixtures (chicken droppings: cassava wastewater in the volume proportions shown in Table 2.
Subsequently, the pH of each digester was adjusted with dietary sodium bicarbonate to 7-8, in order to achieve an optimum range for microorganism growth.

2.2.2.2. Analysis of Biogas Composition

The Geotech BIOGAS 5000 (Équipement scientifique - ES, Garches, France) is a portable gas analyzer for measuring the precise composition of gases in biogas applications. The data collected by this tool is consistent and helps us verify the efficiency of the digestion process. When connected to the reactor, it automatically uses infrared sensors to analyze the biogas produced by the reactor, displaying the exact proportion (in %) of CH4, CO2. Using its electrochemical sensors, it quantifies oxygen content (accurate to approx. 1.5%) and hydrogen sulfide content (accurate to approx. 3%). The analyzer samples biogas continuously at a rate of 550 ml/min. Depending on the sampling time, the integrated flow meter can also be used to deduce the volume of biogas produced daily.

2.2.2.3. Conversion Efficiency

At the end of the experiment, the VS. conversion efficiency (%) was calculated for all the mixtures in this study using Equation (5) [14]:
E ( % ) = 100 × V S b V S e V S b
Where VSb and VSe are the quantities of VS in the reactor at the start and end of the batch test respectively. This parameter is used to assess the degree of conversion of volatile solids into biogas.

3. Results

3.1. Substrate Characteristics

Table 3 shows the characteristics of the substrates prior to digestion.
These results show that the nitrogen content of cassava effluent average 0.028% on a dry basis. This value is in the order of magnitude of those in the literature (0.19% according to (Panichnumsin et al., 2010 ; Wadjeam et al., 2019). Therefore, with a very high ratio, it is difficult to perform AD with such a substrate. Before and after the digestion process, predigestion and post-digestion tests were carried out and the results are presented in Table 4.
Table 4. Substrate characteristics for the various pre- and post-digestion reactors.
Reactor TS (%) before digestion TS (%) post-digestion MOV (%)Before digestion MOV (%)post digestion
Reactor 1 (Chicken droppings) 4.13 2.18 78.65 62.15
Reactor 2 (Cassava effluent) 4.22 2.59 91.73 75.01
Reactor 3 (25%Fp+ 75% EUM) 4.32 1.83 84.81 59.45
Reactor 4 (50%Fp+ 50%EUM) 4.42 1.97 87.89 61.04
Reactor 5 (75% Fp+25%EUM) 4.51 3.34 90.97 46.14
Reactor 6 (Inoculum) 6.66 3.00 81.95 59.23

3.2. Daily Production

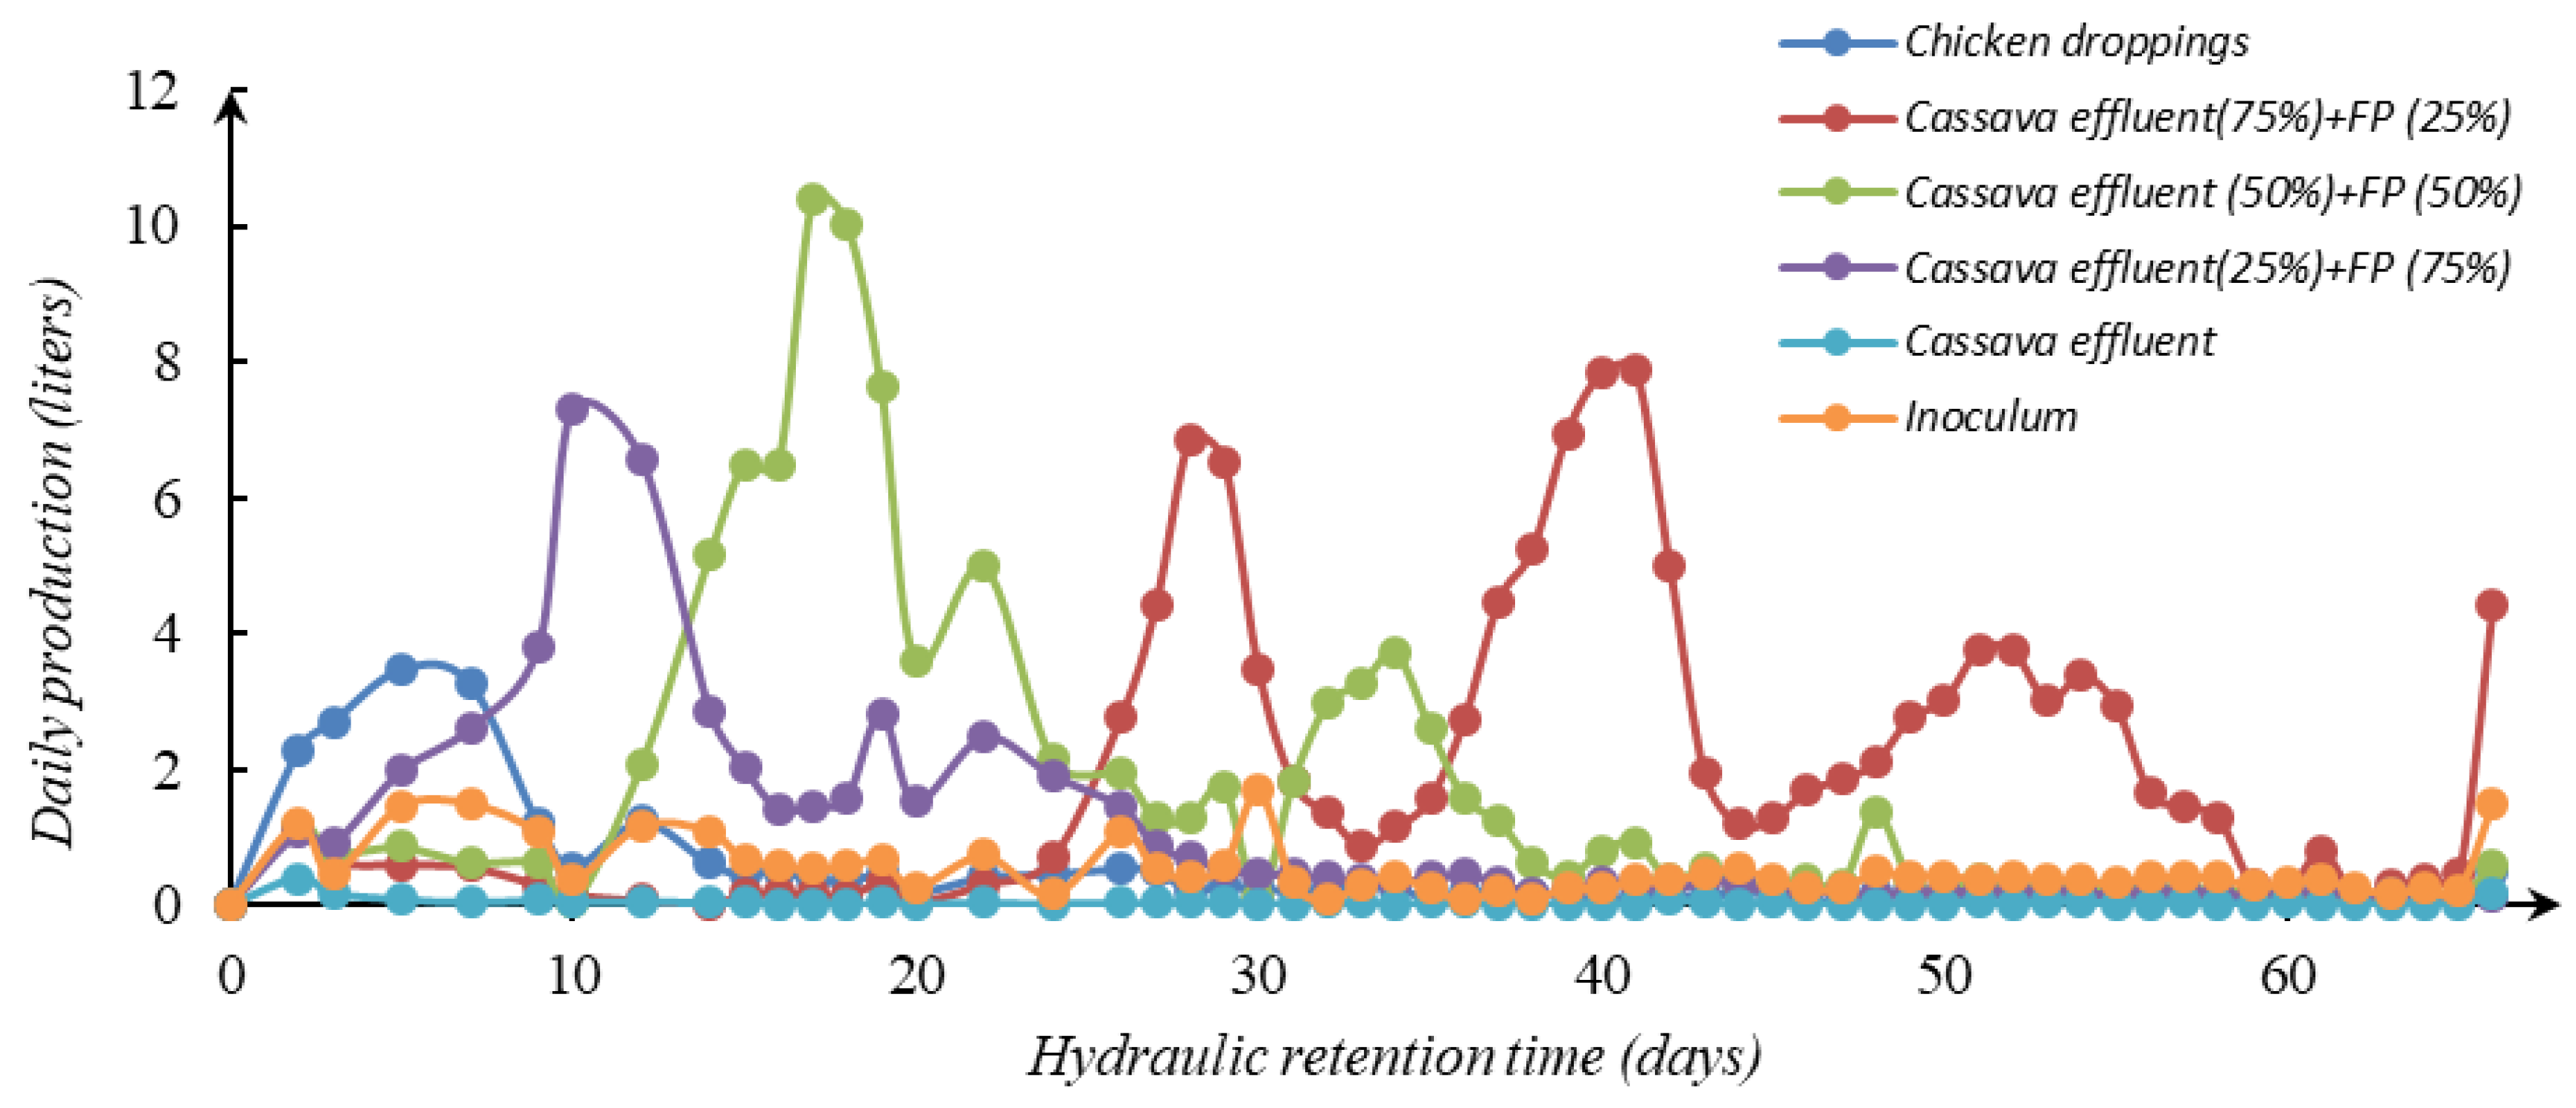
Figure 2 shows daily methane production as a function of time for all reactors.
The average ambient temperature recorded during the experiments ranged from 26.3 to 45.2 °C, allowing the reactors (painted black to promote heat accumulation during the day) to be placed in mesophilic conditions (22–35°C). As shown in Figure 1, daily biogas production increased progressively as a function of the substrate until it reached a maximum value. It was observed that reactors containing more chicken droppings produced faster than those containing more cassava effluent. Daily production is unstable and this is linked to temperature variation. As Sharma et al., 2022 have pointed out, temperature fluctuations affect bacterial activity and, as a result, biogas yield was significantly reduced. Methanogenic bacteria are responsible for this. These types of bacteria struggle to survive in their cool environment for the first ten days because they are unable to adapt to the conditions, resulting in low volatile substance consumption and reduced microbial activity. Delays in production start-ups observed in some reactors are due to the toxic and nutrient-poor nature of substrates containing more cassava effluent, which prevents the normal growth and activity of biogas-producing bacteria on the feed substrate.

2.1. Evolution of Biogas Composition

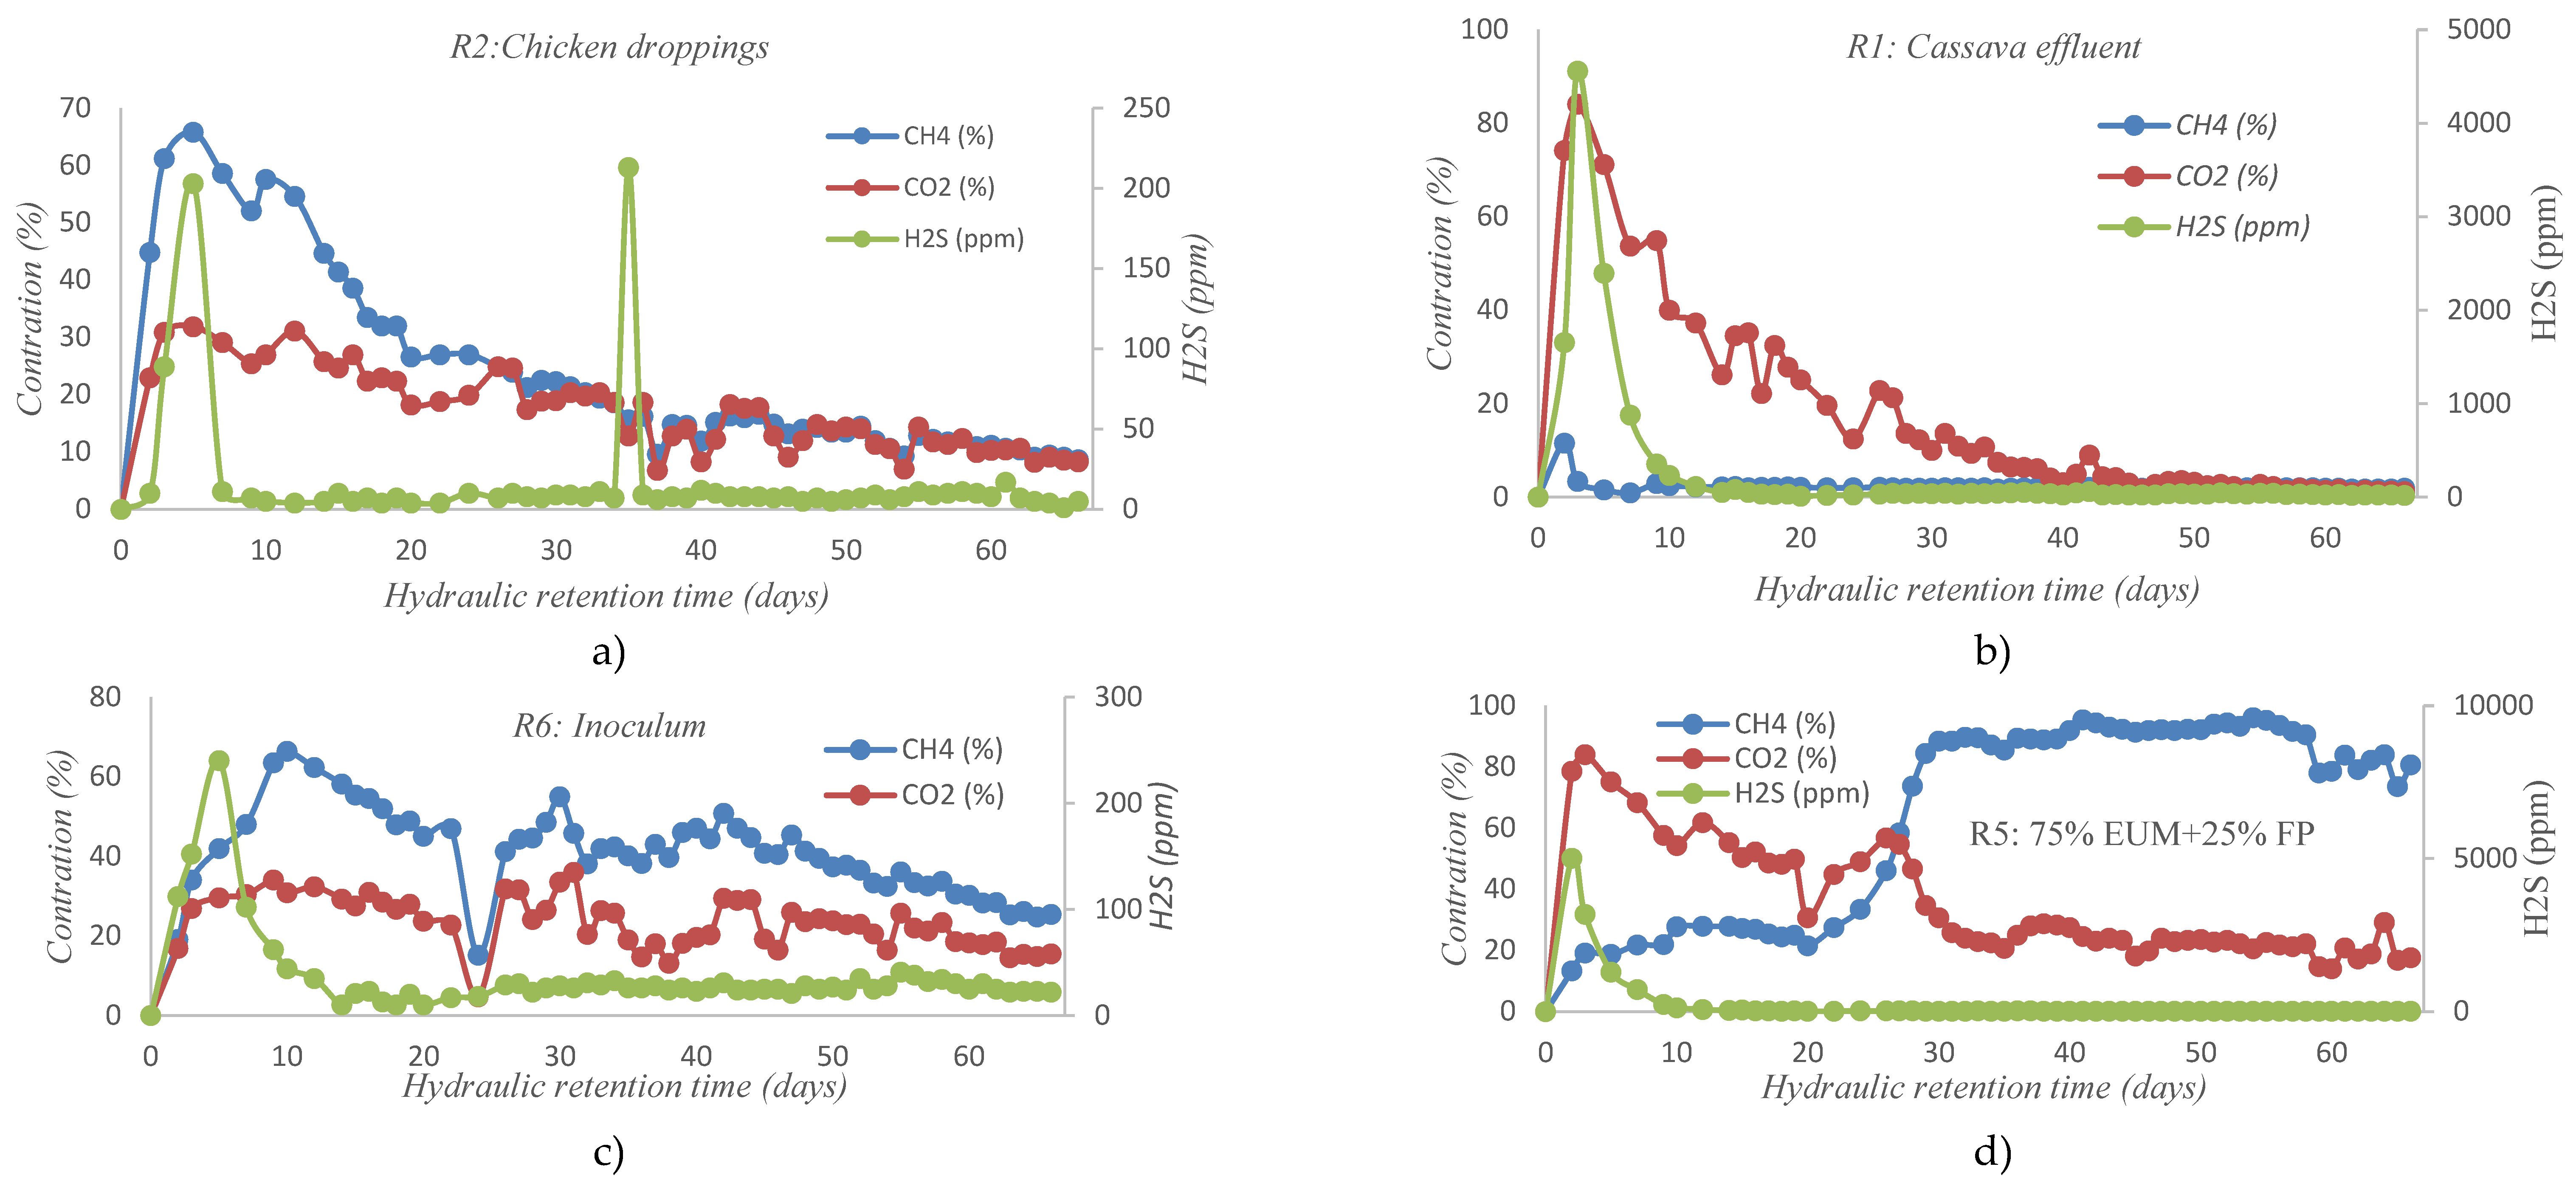
Figure 3 shows the evolution of biogas composition in the various reactors over time. From Figure 3, a-f, it can be seen that from days 1 to 5 of digestion, methane production remains low in reactors R1, R3, R4, R5 and R6. On the other hand, reactor R2 (containing only chicken droppings) starts on day 2 with a methane concentration already reaching 44%. There are several reasons for these results. In the case of Reactor 1, this is due to the fact that at the start of organic matter degradation, the hydrolysis process predominates, with a high production of hydrogen sulfide (H2S) reaching 4560 ppm. This is a limiting factor for the start-up of methanogenesis. The R2 substrate (chicken droppings only), on the other hand, degrades more easily with moderate H2S production (with a maximum concentration of 213 ppm on day 35). This can be explained by the fact that this substrate is balanced (C/N=20.48).
It was noted that the reactors start up progressively in ascending order of the proportion of chicken droppings in the substrate. Reactor R2 (100% chicken droppings) starts on day 2, followed by reactor R5 (75% chicken droppings) on day 5, then R4 (50% chicken droppings) on day 12, and finally R3 (25% chicken droppings) on day 20. Methane concentration peaks also follow the same gradual order (R2: day 5 ; R5: day 12 ; R4: day 36 and R3: day 42). This can be explained by the gradual stabilization of microorganisms over time in the various reactors. This finding corroborates the results of [31], [32], [33] who showed that it is not until around one week after the start of the process that methanogenic bacteria begin to rapidly consume nutrients to produce methane.
It was also noted that cassava effluent is low in nitrogen (%N= 0.028%), one of the main nutrients for methanogenic bacteria. The high content of cassava effluent in the substrate delays the multiplication of the latter, resulting in a slow start-up of methanogenesis in reactors with high cassava effluent contents. It’s important to note that cassava effluent is highly acidic (pH ranges from 3 to 5), and despite pH adjustment during seeding, acidity falls after the hydrolysis phase. During effluent digestion, the reaction medium experiences a strong accumulation of VFAs, which contributes to acidification. This observation has been noted by several authors [31], [34], who have shown that even after seeding cassava effluents, methanogenesis fails, one of the major causes being the high production of VFAs during hydrolysis.
After a certain period of DA, methane production gradually declines until the end of digestion (R2: day 5 ; R5: day 12 ; R4: day 36 and R3: day 42). This reflects the depletion of organic matter in the environment for the micro-organisms. The results of work by [31] have shown that as soon as the ascending phase of production is reached, the methane content of the biogas becomes increasingly low throughout the rest of the process. The latter also justify this low production by the decrease in the bacteria/substrate ratio. They also point out that the bacteria are either transported by the effluent in the digestate (in the case of continuous digesters) or die off in part due to their aging rates (in the case of the present study).
Specifically, reactors R4 and R3 exhibited rather peculiar kinetics. Disturbances were noted during the first thirty-six (36) days before AD stabilized. This instability is thought to be due to high C/N ratios (linked to the cassava effluent), resulting in a nitrogen deficiency in the medium (an imbalance) for the proper progress of methanogenesis, hence more difficult degradation for the microorganisms [35]. After fairly fluctuating metabolic kinetics, the environment eventually stabilized. This resulted in a methane-rich biogas (a maximum of over 90%). It’s important to note that co-digestion balanced the reaction medium, which is consistent with the results from reactor R1 (mono-digestion of cassava effluent), where methanogenesis (unbalanced medium with a C/N ratio of 761.75) virtually failed to get off the ground. By way of illustration, the carbon dioxide content was very high (22.2 to 84.1%) during the first 15 days of AD. A methanation defect could explain these results. It could also be explained by the very high COD of the cassava effluent (208,350 mgO2/l).
Furthermore, hydrogen sulfide concentrations in the various digesters are very high in the first week of AD (˃5000 ppm) (for R1 and R5). These high H2S concentrations are due to the richness of the substrates in sulfur proteins and sulfates with reference to the work of [18]. This limits the growth of the microbial population. The same observation was made by [29]. An increase in methane concentration was observed just after the drop in hydrogen sulfide concentration in all reactors except R1. In addition to the acidity and hydrogen sulfide, some authors have noted that cassava effluent contains residual cyanide (highly toxic to methanogenic bacteria). All these aspects could explain the lethargy of the bacteria in the R2 reactor.

3.3. Cumulative Methane Production

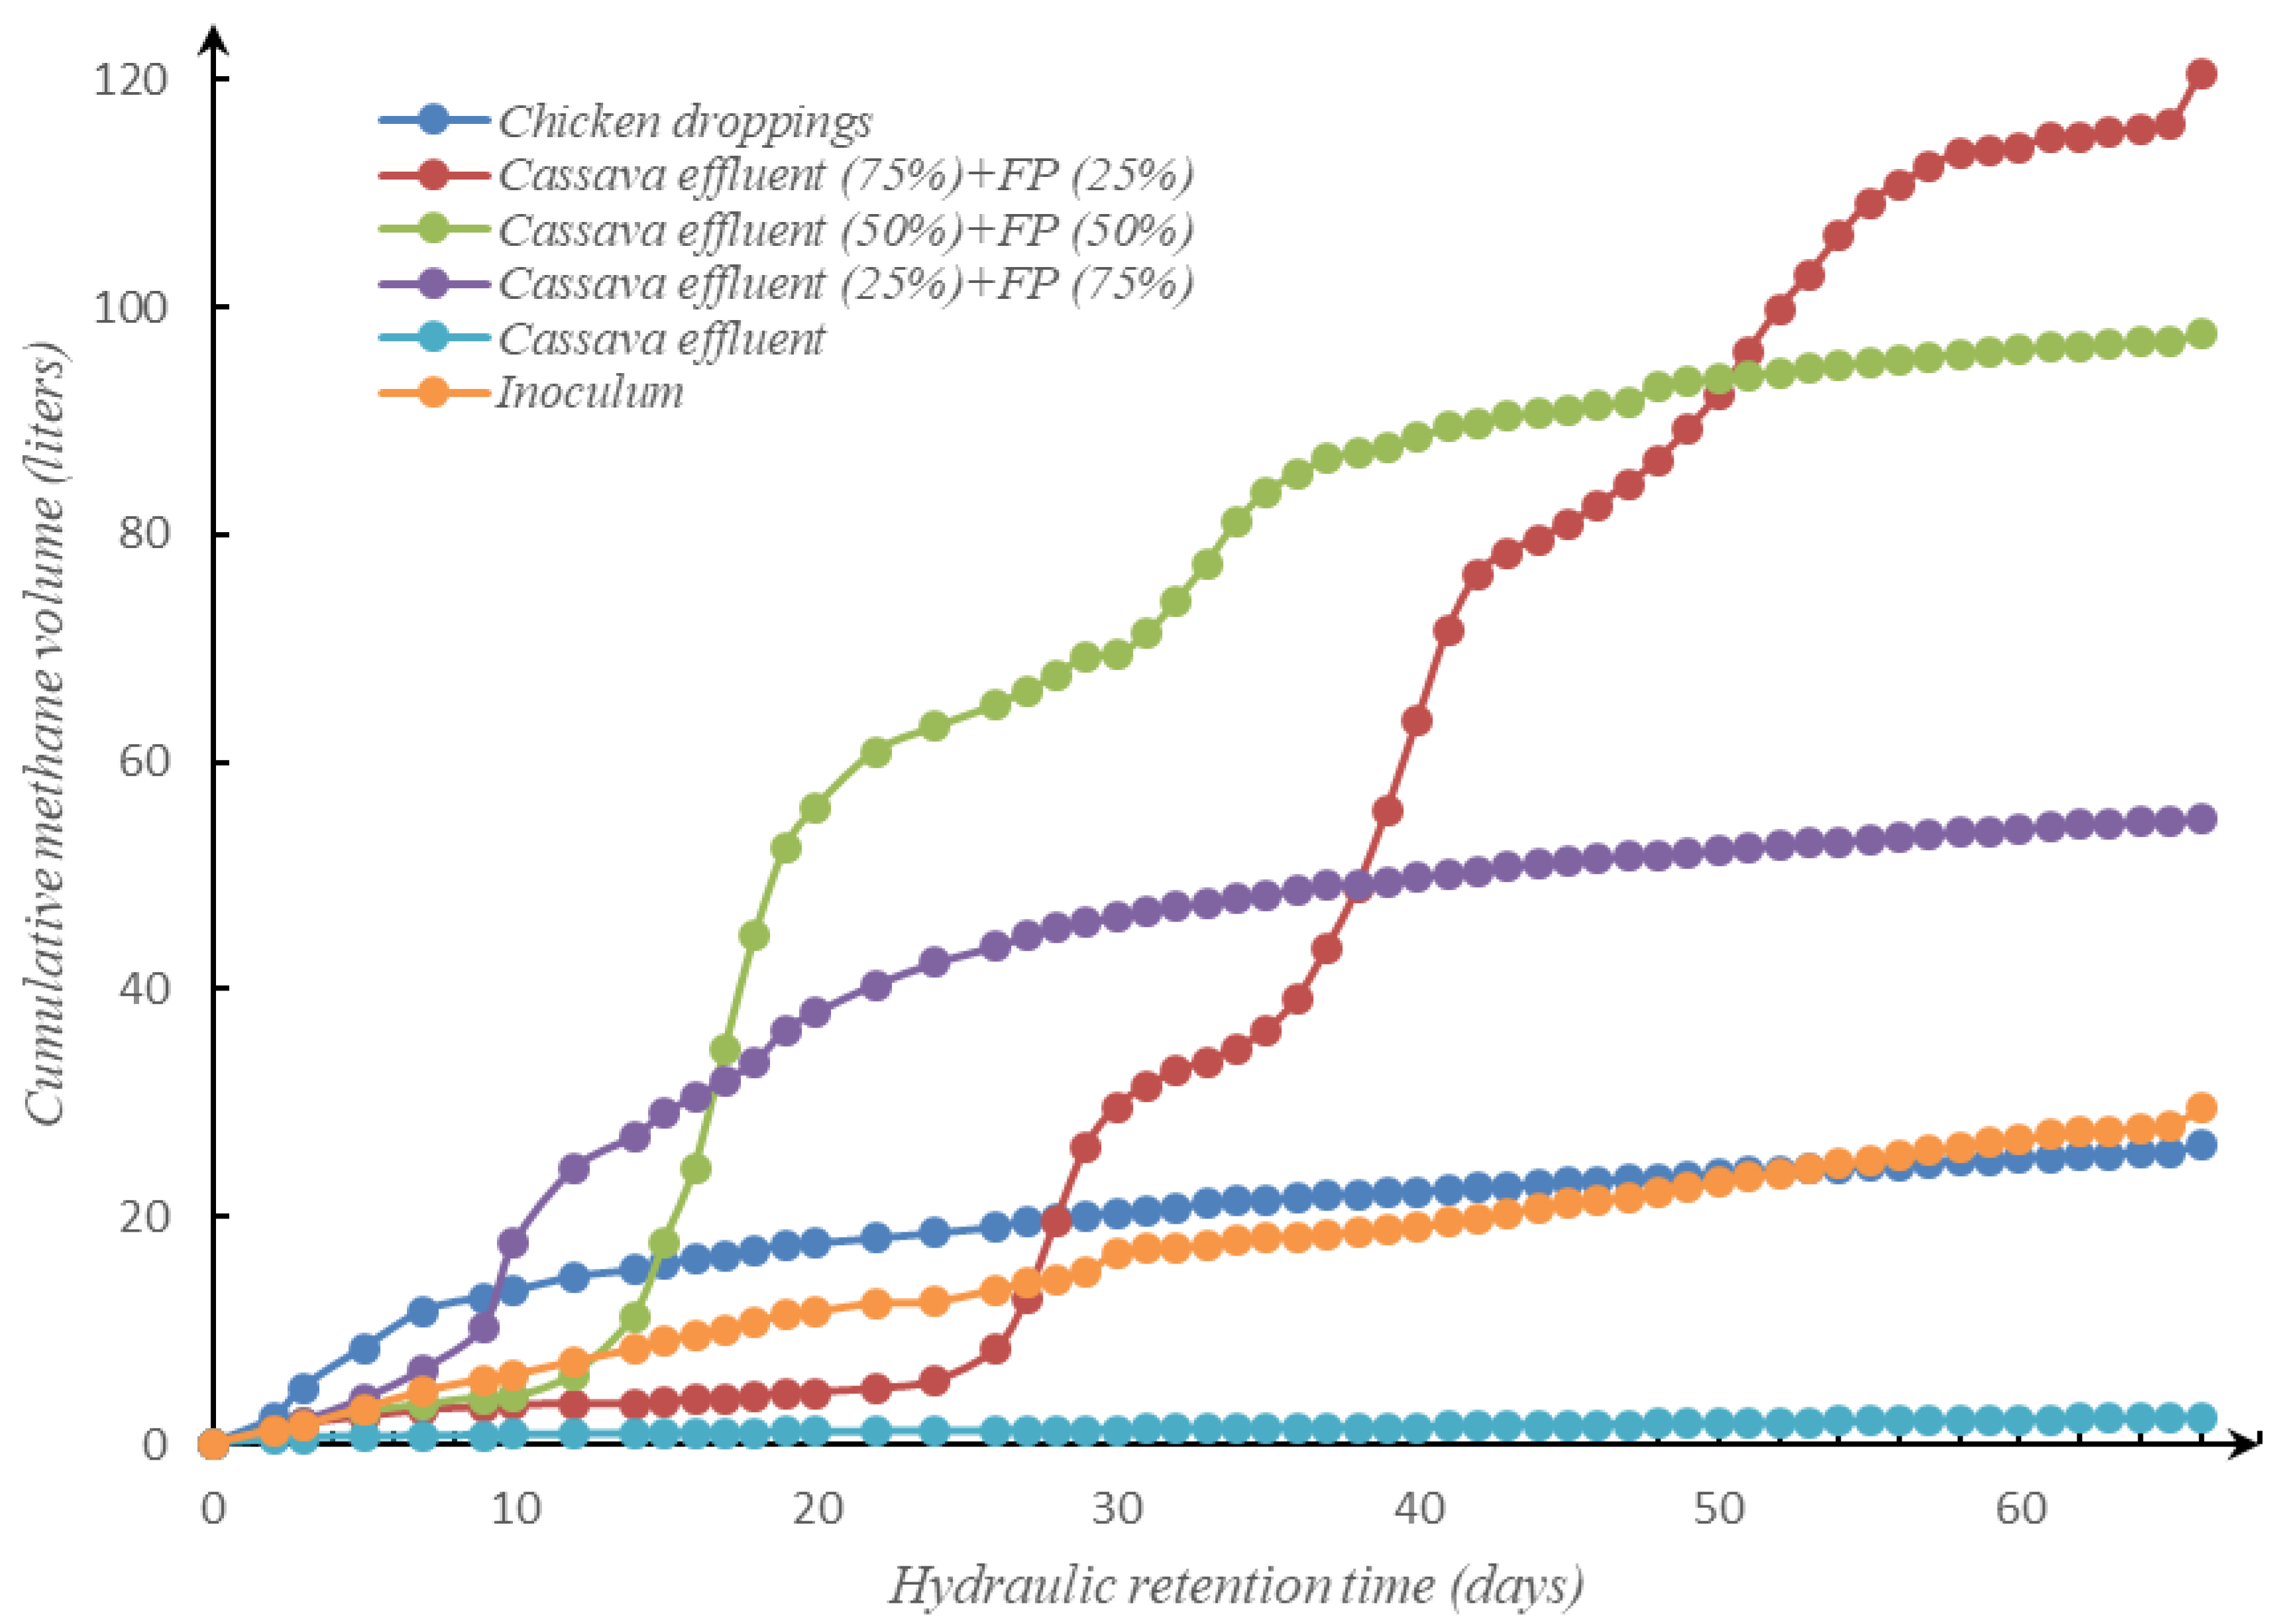
Figure 4 shows the evolution of cumulative methane production for the various reactors over time.
Cumulative methane production over the retention time varied between reactors, as shown in Figure 4. Reactor R1, containing only cassava effluent as substrates, accumulated a total of 2.43 liters of methane. R2, containing only chicken droppings, showed a cumulative methane production of 26.22 liters. R3, containing a mixture of cassava effluent (25%) and chicken droppings (75%), showed a cumulative methane production of 54.96 liters. R4 with cassava effluent (50%) and chicken droppings (50%) as substrates showed a cumulative methane production of 97.57 liters, and R5 with cassava effluent (75%) and chicken droppings (25%) as substrates showed a cumulative methane production of 120.54 liters. Reactors R4 and R5 showed the highest methane production. Comparing these productions with that of the inoculum (R6 with 29.57 liters of methane), we note that co-digestion produced more methane than mono-digestion. Co-digestion produced 23 to 50 times more than cassava effluent, 2 to 5 times more than chicken droppings and 2 to 4 times more than inoculum. We deduce that co-digestion has a significant effect in optimizing AD. As a result, the addition of organic nitrogen via chicken droppings optimizes methane production during the digestion of cassava effluent.

3.4. Effect of Organic Nitrogen Addition on Digestion

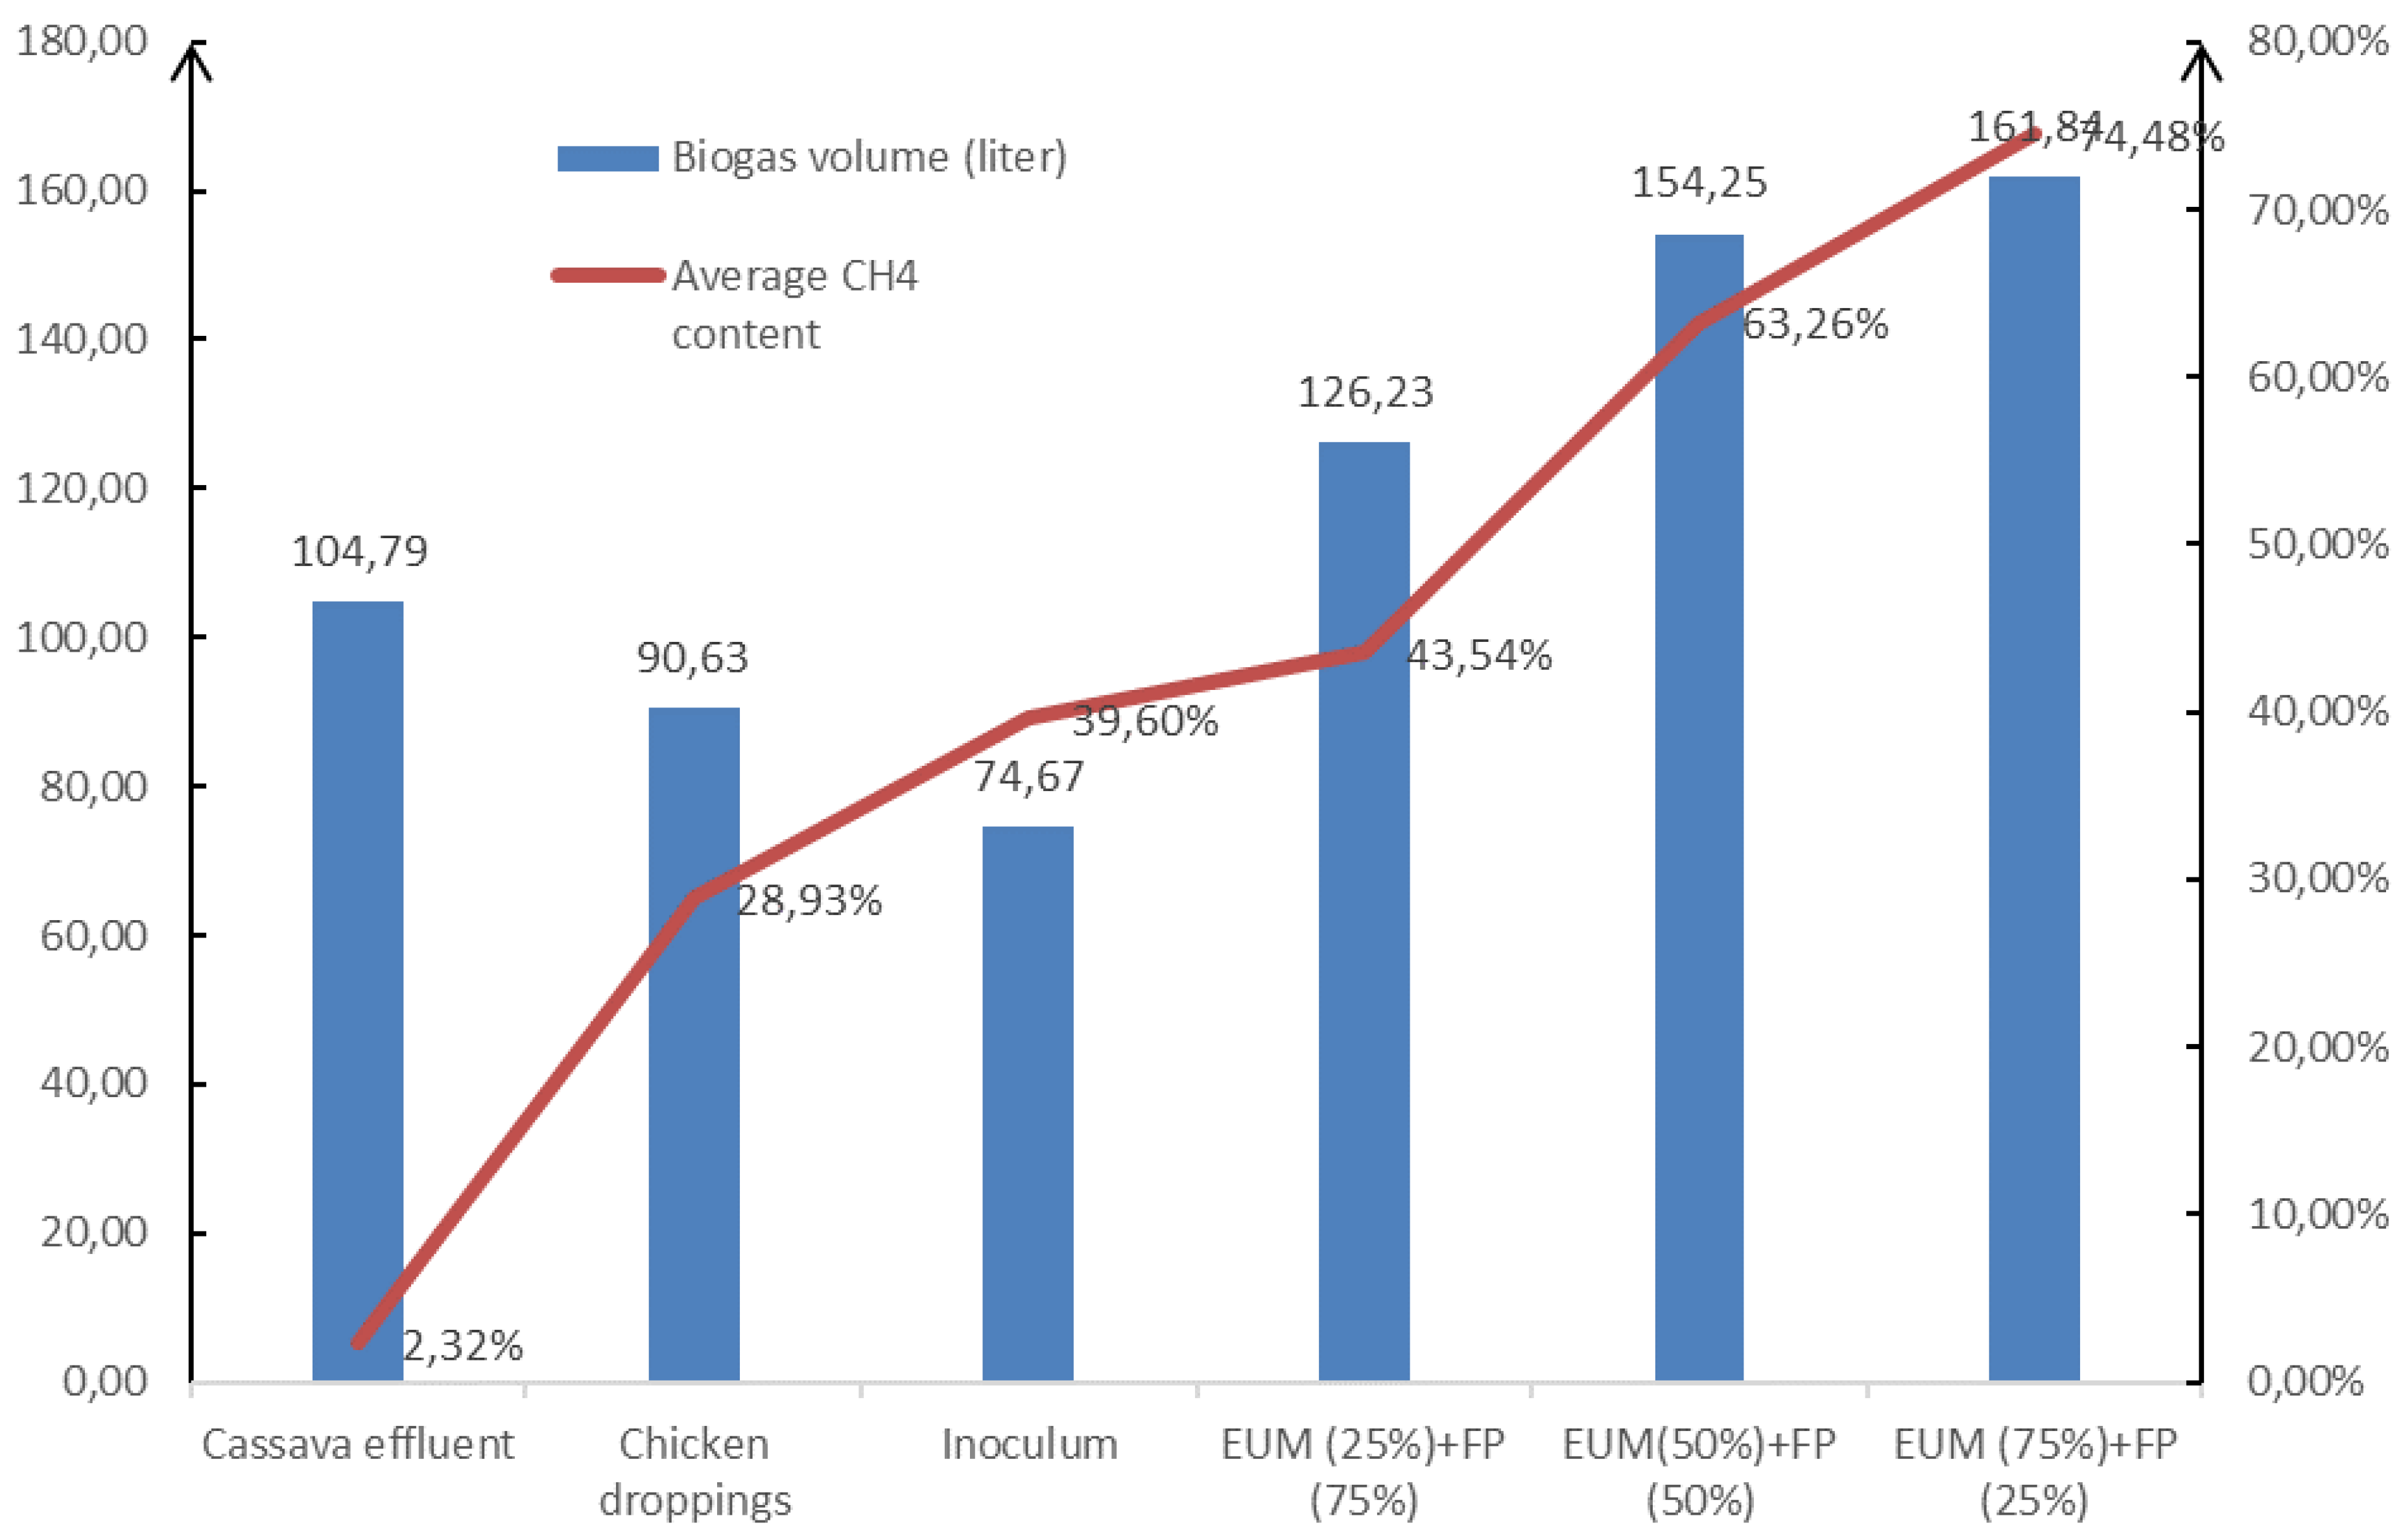
Figure 5 and Table 5 show the effect of organic nitrogen addition on methane production and biogas characteristics in the different reactors.
Methane production potential (MPP) varies between reactors. Results ranged from 45.47 to 1184.60 mL/g MOV. Reactor R1 produced 45.47 mL/g MOV, while reactors R4 yielded 1184.60 mL/g MOV. These differences reflect the influence of substrate composition. R1’s lower yield may be due to factors such as lower alkalinity, nutrient deficiency (nitrogen) with highly volatile fatty acid (VFA) production, and higher lignin and cellulose content. On the other hand, R4 showed higher yields, suggesting a more favorable substrate composition, nutrient balance and greater availability of readily degradable organic matter. It was noted that the addition of organic nitrogen via chicken droppings optimized the methanization process. The co-digestions carried out showed significantly better performance (from 527.39 to 1184.60 mL/g MOV) than the mono-digestion and even the inoculum (from 45.47 to 585.27 mL/g MOV). In addition, manure, and more particularly poultry droppings, are interesting substrates due to their supply of the nutrients required for the growth of the micro-organisms responsible for anaerobic digestion, as well as their buffering capacity to stabilize the process.

3.5. Conversion Efficiency

Table 6 shows the conversion efficiencies of organic matter during the anaerobic degradation process.
During the AD process, the reactors showed variable levels of MOV reduction, as shown in Table 6. It was noted that conversion efficiencies increased with the addition of organic nitrogen. They ranged from 18.23 to 49.28% (when the dosage varied from 0 to 50%). Reactor R1 showed the lowest conversion efficiency (18.23%). This may be due to the presence of recalcitrant compounds such as lignin and cellulose. The highest MOV reduction was observed in the R4 reactor, with a remarkable 49.28%. This removal efficiency indicates the extent of organic matter degradation during AD. In addition, R4 benefited from a balanced C/N ratio and positive synergistic effects between co-digested substrates, leading to enhanced organic matter degradation.

5. Conclusions

In this study, a combined approach to the optimization of biogas production from cassava effluents through organic nitrogen addition via anaerobic co-digestion with poultry droppings was carried out. The main objectives were to study the synergistic effect of their co-digestion on the efficiency of biogas production. The experiment was carried out in six (6) 20-liter batch reactors under mesophilic conditions. These six reactors were inoculated with an inoculum from an operating reactor. Incubation lasted nine (9) weeks. Regular analyze were carried out to assess biodegradability, the specific rate of volatile matter reduction and methane production potential. Results showed that the biodegradability analysis revealed that all wastes were biodegradable, with degradation levels ranging from 18.23 ± 2.89% to 49.28 ± 4.17%. Cassava effluent showed the greatest resistance to degradation, while chicken droppings were the most readily degradable. Kinetic analysis indicated specific organic matter reduction rates of 0.28% per day for the most resistant waste and 0.76% per day for the least resistant waste.
Co-digestion of these two types of waste in the biogas production process had a positive effect on biogas formation in terms of both quantity and quality. Methane content rose from around 2% to 75%, depending on the amount of organic nitrogen added (mixing rate of the two substrates). It was noted that conversion efficiency increased with the addition of organic nitrogen. They ranged from 18.23 to 49.28% (when the dosage varied from 0 to 50%). It was also noted that the methane production potential (MPP) varied from 45.47 to 1184.60 mL/g MOV depending on the substrates. In the anaerobic mono-digestion tests of cassava effluent and chicken droppings carried out in this study, the highest mean value for methane yield was found to be 585.27 mL CH4/g MOV versus 45.47 mL/g MOV for cassava effluent. The anaerobic co-digestions carried out showed that the mixture of 50% cassava effluent and 50% chicken droppings performed better. The BMP obtained was 1184.60 mL/g MOV. Co-digestion produced 23 to 50 times more than cassava effluent, 2 to 5 times more than chicken droppings and 2 to 4 times more than inoculum.
Chicken droppings are therefore an interesting substrate, both because of the nutrients they provide for the development of the methanogens responsible for anaerobic digestion, and because of their buffering capacity to stabilize the process. These organic wastes hold promise as valuable resources for the production of rich biogas, addressing both the problem of waste accumulation and the energy crisis in an environmentally beneficial way. However, this study did not include an analysis of the chemical composition of the substrates for a better understanding of the synergistic effect observed. This should be taken into account in future research. Based on the results of similar studies [17], it has been noted that operating parameters exert a decisive influence on digestate characteristics. As a result, it would be relevant to characterize the effect of anaerobic co-digestion on the quality of the digestates obtained.

6. Patents

Author Contributions

Conceptualization: Kayaba HARO; methodology: Kayaba HARO.; validation: Oumar SANOGO and Antoine BERE.; formal analysis: Kayaba HARO and Abdoulaye COMPAORE; investigation: SANDWIDI Sayouba.; resources: SANDWIDI Sayouba.; data curation: Kayaba HARO, Abdel NOUROU, SANDWIDI Sayouba and Oumou SESSOUMA ; writing—original draft preparation: Kayaba HARO.; writing—review and editing: Kayaba HARO., SANDWIDI Sayouba and Abdoulaye COMPAORE and Oumar SANOGO; visualization: Kayaba HARO; Platform schematic: Ibrahim KOURITA ; supervision: Oumar SANOGO; project administration: Oumar SANOGO and funding acquisition: Oumar SANOGO All authors have read and agreed to the published version of the manuscript.

Funding

This research received no external funding

Data Availability Statement

Data for this study are available on request.

Acknowledgments

This study was carried out thanks to the scientific support of the cited co-authors. We would like to express our gratitude to the staff of the Institut de Recherche en Sciences Appliquées et Technologies (IRSAT) for making the equipment and data available. We would also like to thank the private individuals who facilitated this study by agreeing to collect data in their homes. We would also like to thank the FASO énergie company for providing us with inoculum free of charge during our incubation sessions for the present study.

Conflicts of Interest

The authors declare that they have no known competing financial interests or personal relationships that could have appeared to influence the work reported in this paper.

References

  1. Y. Ma and Y. Liu, “Turning food waste to energy and resources towards a great environmental and economic sustainability: An innovative integrated biological approach,” Biotechnol. Adv., vol. 37, no. 7, 2019. [CrossRef]
  2. S. K. Pramanik, F. B. Suja, S. M. Zain, and B. K. Pramanik, “The anaerobic digestion process of biogas production from food waste: Prospects and constraints,” Bioresour. Technol. Reports, vol. 8, p. 100310, 2019. [CrossRef]
  3. P. C. Slorach, H. K. Jeswani, R. Cuéllar-Franca, and A. Azapagic, “Environmental sustainability of anaerobic digestion of household food waste,” J. Environ. Manage., vol. 236, no. January, pp. 798–814, 2019. [CrossRef]
  4. Y. Sun, J. Zhang, Y. Pan, Y. Wang, T. Liao, and T. Song, “Short Communication A tm spheric P ollution during the implementation of pollution reduction measures,” vol. 5, pp. 789–795, 2014,. [CrossRef]
  5. FAO, “Conference Regionale de La FAO pour L ’Afrique,” Rabbat, 2024.
  6. J. C. de Carvalho, I. A. Borghetti, L. C. Cartas, A. L. Woiciechowski, V. T. Soccol, and C. R. Soccol, “Biorefinery integration of microalgae production into cassava processing industry: Potential and perspectives,” Bioresour. Technol., vol. 247, pp. 1165–1172, 2018. [CrossRef]
  7. N. Glanpracha and A. P. Annachhatre, “Anaerobic co-digestion of cyanide containing cassava pulp with pig manure,” Bioresour. Technol., vol. 214, pp. 112–121, 2016. [CrossRef]
  8. P. Wadjeam, A. Reungsang, T. Imai, and P. Plangklang, “Co-digestion of cassava starch wastewater with buffalo dung for bio-hydrogen production,” Int. J. Hydrogen Energy, vol. 44, no. 29, pp. 14694–14706, 2019. [CrossRef]
  9. A. Cruz et al., “Valorization of cassava residues for biogas production in Brazil based on the circular economy: An updated and comprehensive review,” Clean. Eng. Technol., vol. 4, no. December 2020, p. 100196, 2021. [CrossRef]
  10. S. Sánchez, Y. L. Silva, R. A. Kalid, E. Cohim, and E. A. Torres, “Waste bio-refineries for the cassava starch industry: New trends and review of alternatives,” Renew. Sustain. Energy Rev., vol. 73, no. February, pp. 1265–1275, 2017. [CrossRef]
  11. Y. Shapovalov, S. Zhadan, G. Bochmann, A. Salyuk, and V. Nykyforov, “Dry anaerobic digestion of chicken manure: A review,” Appl. Sci., vol. 10, no. 21, pp. 1–24, 2020. [CrossRef]
  12. W. CZEKAŁA, J. DACH, A. LEWICKI, K. GAJEWSKA, and Ż. STASZAK, “Utilization of Digestate Obtained From Methane Fermentation of Chicken Manure,” in Farm Machinery and Processes Management in Sustainable Agriculture, 2017, pp. 92–96. [CrossRef]
  13. F. Abouelenien et al., “Optimization of biomethane production via fermentation of chicken manure using marine sediment: A modeling approach using response surface methodology,” Int. J. Environ. Res. Public Health, vol. 18, no. 22, 2021. [CrossRef]
  14. Konkol, L. Świerczek, and A. Cenian, “Chicken Manure Pretreatment for Enhancing Biogas and Methane Production,” Energies, vol. 16, no. 14, 2023. [CrossRef]
  15. S. M. Ashekuzzaman and T. G. Poulsen, “Optimizing feed composition for improved methane yield during anaerobic digestion of cow manure based waste mixtures,” Bioresour. Technol., vol. 102, no. 3, pp. 2213–2218, 2011. [CrossRef]
  16. M. N. I. Siddique and Z. A. Wahid, “Achievements and perspectives of anaerobic co-digestion: A review,” J. Clean. Prod., vol. 194, pp. 359–371, 2018. [CrossRef]
  17. Beniche, “Optimisation Du Rapport Carbone / Azote Des Résidus Agricoles Et Des Déchets Alimentaires Par Co-Diges,” UNIVERSITE IBN TOFAIL, 2021. [Online]. Available: https://helvia.uco.es/xmlui/bitstream/handle/10396/21433/2021000002272.pdf?sequence=1&isAllowed=y.
  18. H. Jiang, Y. Qin, S. I. Gadow, A. Ohnishi, N. Fujimoto, and Y. Y. Li, “Bio-hythane production from cassava residue by two-stage fermentative process with recirculation,” Bioresour. Technol., vol. 247, pp. 769–775, 2018. [CrossRef]
  19. Y. Njankouo Ndam et al., “Influence of cultivars and processing methods on the cyanide contents of cassava (Manihot esculenta Crantz) and its traditional food products,” Sci. African, vol. 5, 2019,. [CrossRef]
  20. S. Peres, M. R. Monteiro, M. L. Ferreira, A. F. do Nascimento Junior, and M. de Los Angeles Perez Fernandez Palha, “Anaerobic Digestion Process for the Production of Biogas from Cassava and Sewage Treatment Plant Sludge in Brazil,” Bioenergy Res., vol. 12, no. 1, pp. 150–157, 2019,. [CrossRef]
  21. J. G. Ferreira Madeira et al., “Optimum Co-Digestion Ratio of Cattle Manure and Manipueira in a Single-Stage Anaerobic Digester for Biogas Production,” Clean - Soil, Air, Water, vol. 48, no. 12, 2020. [CrossRef]
  22. M. C. C. De Amorim, P. T. De Souza Silva, P. S. Barbosa, and N. E. Montefusco, “Anaerobic biodegradation of cassava wastewater under different temperatures and inoculums,” Comun. Sci., vol. 10, no. 1, pp. 65–76, 2019. [CrossRef]
  23. L. M. Villa, A. C. A. Orrico, L. A. Akamine, J. de L. Junior, and N. da S. Sunada, “Anaerobic co-digestion of swine manure with sweet potato or cassava in different c/n ratios,” Cienc. Rural, vol. 50, no. 10, pp. 1–9, 2020. [CrossRef]
  24. Jiraprasertwong, K. Maitriwong, and S. Chavadej, “Production of biogas from cassava wastewater using a three-stage upflow anaerobic sludge blanket (UASB) reactor,” Renew. Energy, vol. 130, pp. 191–205, 2019. [CrossRef]
  25. Mao, Y. Feng, X. Wang, and G. Ren, “Review on research achievements of biogas from anaerobic digestion,” Renew. Sustain. Energy Rev., vol. 45, pp. 540–555, 2015. [CrossRef]
  26. P. Thanwised, W. Wirojanagud, and A. Reungsang, “Effect of hydraulic retention time on hydrogen production and chemical oxygen demand removal from tapioca wastewater using anaerobic mixed cultures in anaerobic baffled reactor (ABR),” Int. J. Hydrogen Energy, vol. 37, no. 20, pp. 15503–15510, 2012. [CrossRef]
  27. S. D. M. L. Corbari, C. L. Andreani, D. G. B. Torres, F. Eng, and S. D. Gomes, “Strategies to improve the biohydrogen production from cassava wastewater in fixed-bed reactors,” Int. J. Hydrogen Energy, vol. 44, no. 32, pp. 17214–17223, 2019. [CrossRef]
  28. K.-K. Nazo Edith, K. K. Felix, K. Y. Francis, G. Theophile, and T. Kablan, “Characterization of Waste From Attiéké Factory: Case of Azito Village (Abidjan, Côte d’Ivoire),” Eur. Sci. Journal, ESJ, vol. 12, no. 35, p. 73, 2016. [CrossRef]
  29. L. R. S. Andrade et al., “Oyster shell-based alkalinization and photocatalytic removal of cyanide as low-cost stabilization approaches for enhanced biogas production from cassava starch wastewater,” Process Saf. Environ. Prot., vol. 139, pp. 47–59, 2020. [CrossRef]
  30. H. Sun, I. Angelidaki, S. Wu, R. Dong, and Y. Zhang, “The potential of bioelectrochemical sensor for monitoring of acetate during anaerobic digestion: Focusing on novel reactor design,” Front. Microbiol., vol. 10, no. JAN, pp. 1–10, 2019. [CrossRef]
  31. Prayitno and S. Rulianah, “Production of biogas using AnF2B reactor from cassava starch wastewater with consortium bacteria as biocatalyst,” IOP Conf. Ser. Earth Environ. Sci., vol. 969, no. 1, pp. 2–8, 2022. [CrossRef]
  32. K. Sharma, P. K. Sahoo, M. Mukherjee, and A. Patel, “Assessment of Sustainable Biogas Production from Co-Digestion of Jatropha De-Oiled Cake and Cattle Dung Using Floating Drum Type Digester under Psychrophilic and Mesophilic Conditions,” Clean Technol., vol. 4, no. 2, pp. 529–541, 2022. [CrossRef]
  33. M. Mirabi, M. Karrabi, and B. Shahnavaz, “Anaerobic co-digestion of lignocellulosic/lipidic wastes with cattle manure: Investigating biogas production and methane yield,” Fuel, vol. 366, no. June, p. 131286, 2024. [CrossRef]
  34. N. E. Kpata-Konan, K. M. Kouamé, Y. F. Kouamé, S. A. Yaovi, K. F. Konan, and T. Gnagne, “Anaerobic Digestion of Liquid Waste from an Attiéké Factory: From the Experimental Scale to the Semi-Industrial Scale,” J. Environ. Prot. (Irvine,. Calif)., vol. 11, no. 07, pp. 531–539, 2020. [CrossRef]
  35. Moukazis, F. M. Pellera, and E. Gidarakos, “Slaughterhouse by-products treatment using anaerobic digestion,” Waste Manag., vol. 71, pp. 652–662, 2018. [CrossRef]
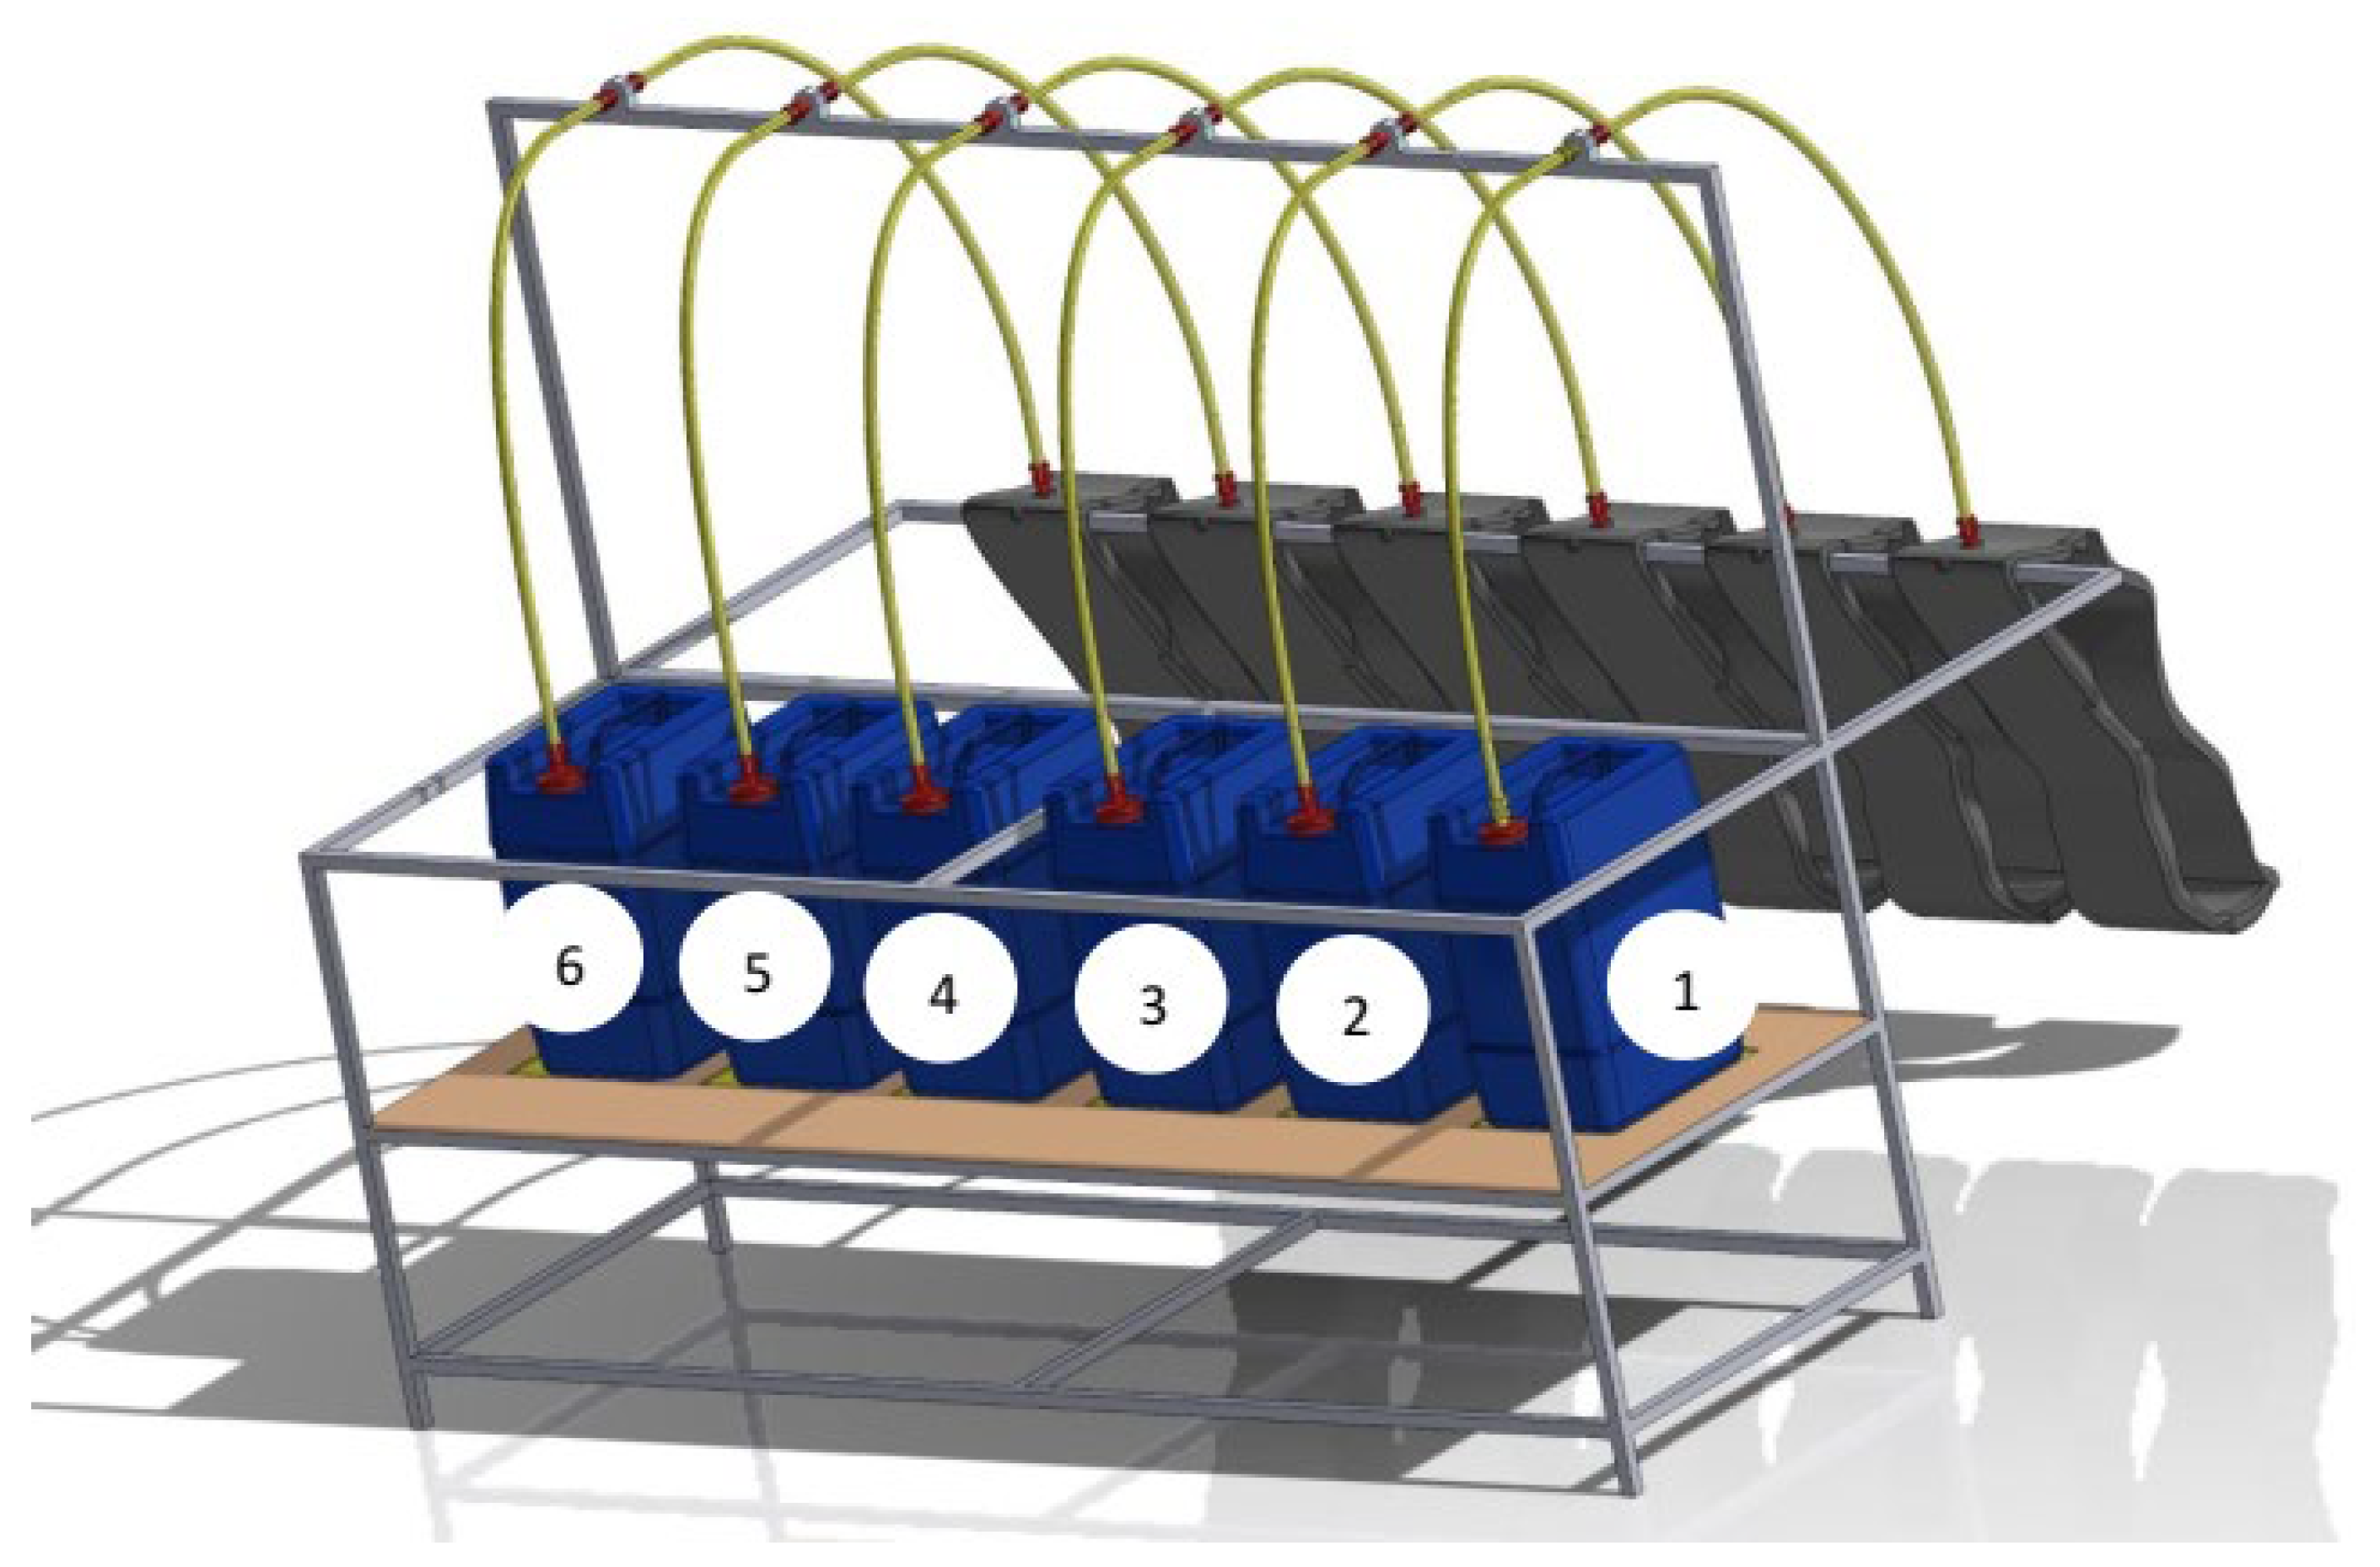
Figure 1. Schematic diagram of AD system: 1: Cassava effluent ; 2: Chicken droppings ; 3: 25%EUM+75%FP ; 4: 50%EUM+50%FP ; 5: 75% EUM+25% FP and 6: Inoculum.
Preprints 110906 g001
Figure 2. Daily methane production from various reactors.
Preprints 110906 g002
Figure 3. Composition of biogas from different reactors: a): Chicken droppings; b): Cassava effluent; c): Inoculum; d):: 75% EUM+25% FP e): 50%EUM+50%FP and f): 25%EUM+75%FP.
Preprints 110906 g003aPreprints 110906 g003b
Figure 4. Cumulated methane production from various reactors.
Preprints 110906 g004
Figure 5. Effect of organic nitrogen addition on methane production in different reactors.
Preprints 110906 g005
Table 2. Dosage of chicken droppings/ cassava effluents introduced in different proportions.
Reactor Ratio Substrate volume (FP: EUM) (liters) Inoculum volume (liters)
1 100:00 10.5:0 4.5
2 00:100 0:10.5
3 25:75 2,625:7,875
4 50:50 5.25:5.25
5 75:25 7,875:2,625
6 Inoculum - 15
Table 3. Substrate characteristics.
Substrat Dry matter (DM (%)) Organic matter (MOV (%)) N (%) C/N DCO (mgO2/l)
Cassava effluent 3.60 94.83 0.028 761.75 208,350
Chicken droppings 97.96 77.24 1.71 20.48 NA
Inoculum 6.66 81.95 NA NA NA
NA=No analysis.
Table 5. Methane and biogas production characteristics of the various reactors.
Substrat R1 (Cassava effluent) R2 (Chicken droppings) R3 (EUM (25%)+FP (75%)) R4 (EUM (50%)+FP (50%)) R5 (EUM (75%)+FP (25%)) R6 (Inoculum)
Biogas volume (liter) 104.79 90.63 126.23 154.25 161.84 74.67
Methane volume (liter) 2.43 26.22 54.96 97.57 120.54 29.57
BMP (mL/g MOV) 45.47 585.27 527.39 1184. 60 1075.27 290.52
Table 6. Conversion efficiency of organic matter during the anaerobic degradation process.
Reactors Conversion efficiency (%)
R1 (Cassava effluent) 18.23
R2 (Chicken droppings) 20.46
R3 (EUM (25%)+FP (75%)) 30.55
R4 (EUM (50%)+FP (50%)) 49.28
R5 (EUM (75%)+FP (25%)) 27.72
R6 (Inoculum) 29.90
Disclaimer/Publisher’s Note: The statements, opinions and data contained in all publications are solely those of the individual author(s) and contributor(s) and not of MDPI and/or the editor(s). MDPI and/or the editor(s) disclaim responsibility for any injury to people or property resulting from any ideas, methods, instructions or products referred to in the content.
Copyright: This open access article is published under a Creative Commons CC BY 4.0 license, which permit the free download, distribution, and reuse, provided that the author and preprint are cited in any reuse.
Prerpints.org logo

Preprints.org is a free preprint server supported by MDPI in Basel, Switzerland.

Subscribe

© 2024 MDPI (Basel, Switzerland) unless otherwise stated