1. Introduction
When activated, neutrophils undergo cell death via NETosis via the release of extracellular traps (NETs). This form of cell death differs from apoptosis and necrosis in terms of changes in cell morphology and mechanism [
1,
2]. Several studies have reported that increased NETosis induces inflammation, thrombosis, or autoimmune diseases [
3,
4,
5]. We have previously reported that estradiol activates NETosis [
6], which may be associated with the predominance of diseases such as systemic lupus erythematosus and rheumatoid arthritis in females. Recently, it has been reported that excessive induction of NETosis causes inflammation and thrombosis during the SARS-CoV-2 infection [
7,
8,
9,
10]. Therefore, understanding and suppressing NETosis will play an important role in the development of therapeutic agents against various diseases.
There are two types of NETosis: NADPH oxidase (NOX)-dependent and NOX-independent [
11,
12]. NOX-dependent NETosis is induced by phorbol myristate acetate (PMA), whereas NOX-independent NETosis is induced by the calcium ionophore A23187 in the presence of calcium. As reactive oxygen species (ROS) production and histone citrullination are important factors in NETosis, the development of treatments for excessive NET formation relies on antioxidants and the peptidyl arginine deiminase-4 (PAD4) inhibitor, Cl-amidine. Moreover, these treatments are successful in suppressing NETosis [
13,
14,
15]. NETosis is essentially a biological defense mechanism and its activation is beneficial for the innate immune response.
Recently, it has become clear that short-chain fatty acids (SCFAs) produced by the gut microbiota play a crucial role in host health. Among the SCFAs, acetic acid ingestion has been shown to help prevent lifestyle-related diseases by regulating acetic acid metabolism and signal transduction via receptors. SCFAs bind directly to GPR43 [
16]. Moreover, SCFAs promote insulin-mediated fat accumulation [
16], inhibit histone deacetylase activity [
17], and regulate T-cell differentiation in adipose tissues via GPR43 [
18]. In addition, SCFAs affect innate immune cells, inducing inflammatory mediator production by macrophages, and also ROS production and phagocytosis by neutrophils [
19,
20,
21]. Although the effects of SCFAs on various processes have been studied, their effects on NET function are unknown. This study aimed to identify the histone acetylation that contributes to the regulation of extracellular traps in neutrophils.
Acetic acid has previously been reported to promote the extracellular trapping of neutrophils via signaling from GPR43 receptors present on the cell membrane [
22,
23]. However, acetate has also been reported to affect cellular metabolism not only through the GPR43-mediated pathway [
22,
23] but also by being taken up intracellularly by monocarboxylic acid transporters [
24]. Acetic acid taken up by cells is converted to acetyl CoA by acetyl CoA synthase 2 and to histone acetylation [
25]. Extracellular neutrophil trapping is also been reported to be affected by histone acetylation [
26,
27]. However, it is unclear whether the effects of acetic acid on cells, particularly on extracellular traps, occur via the GPR43-mediated pathway or histone acetylation. Therefore, in this study, we analyzed whether the effect of acetic acid on extracellular traps was affected by histone acetylation.
We used neutrophil-like HL-60 cells (nHL-60 cells) differentiated in dimethyl sulfoxide (DMSO) to investigate the association between sodium acetate and calcium ionophore-induced NOX-independent NETosis in vitro. This is the first study to explore the mechanisms underlying the relationship between sodium acetate and NOX-independent NETosis in differentiated neutrophils.
3. Discussion
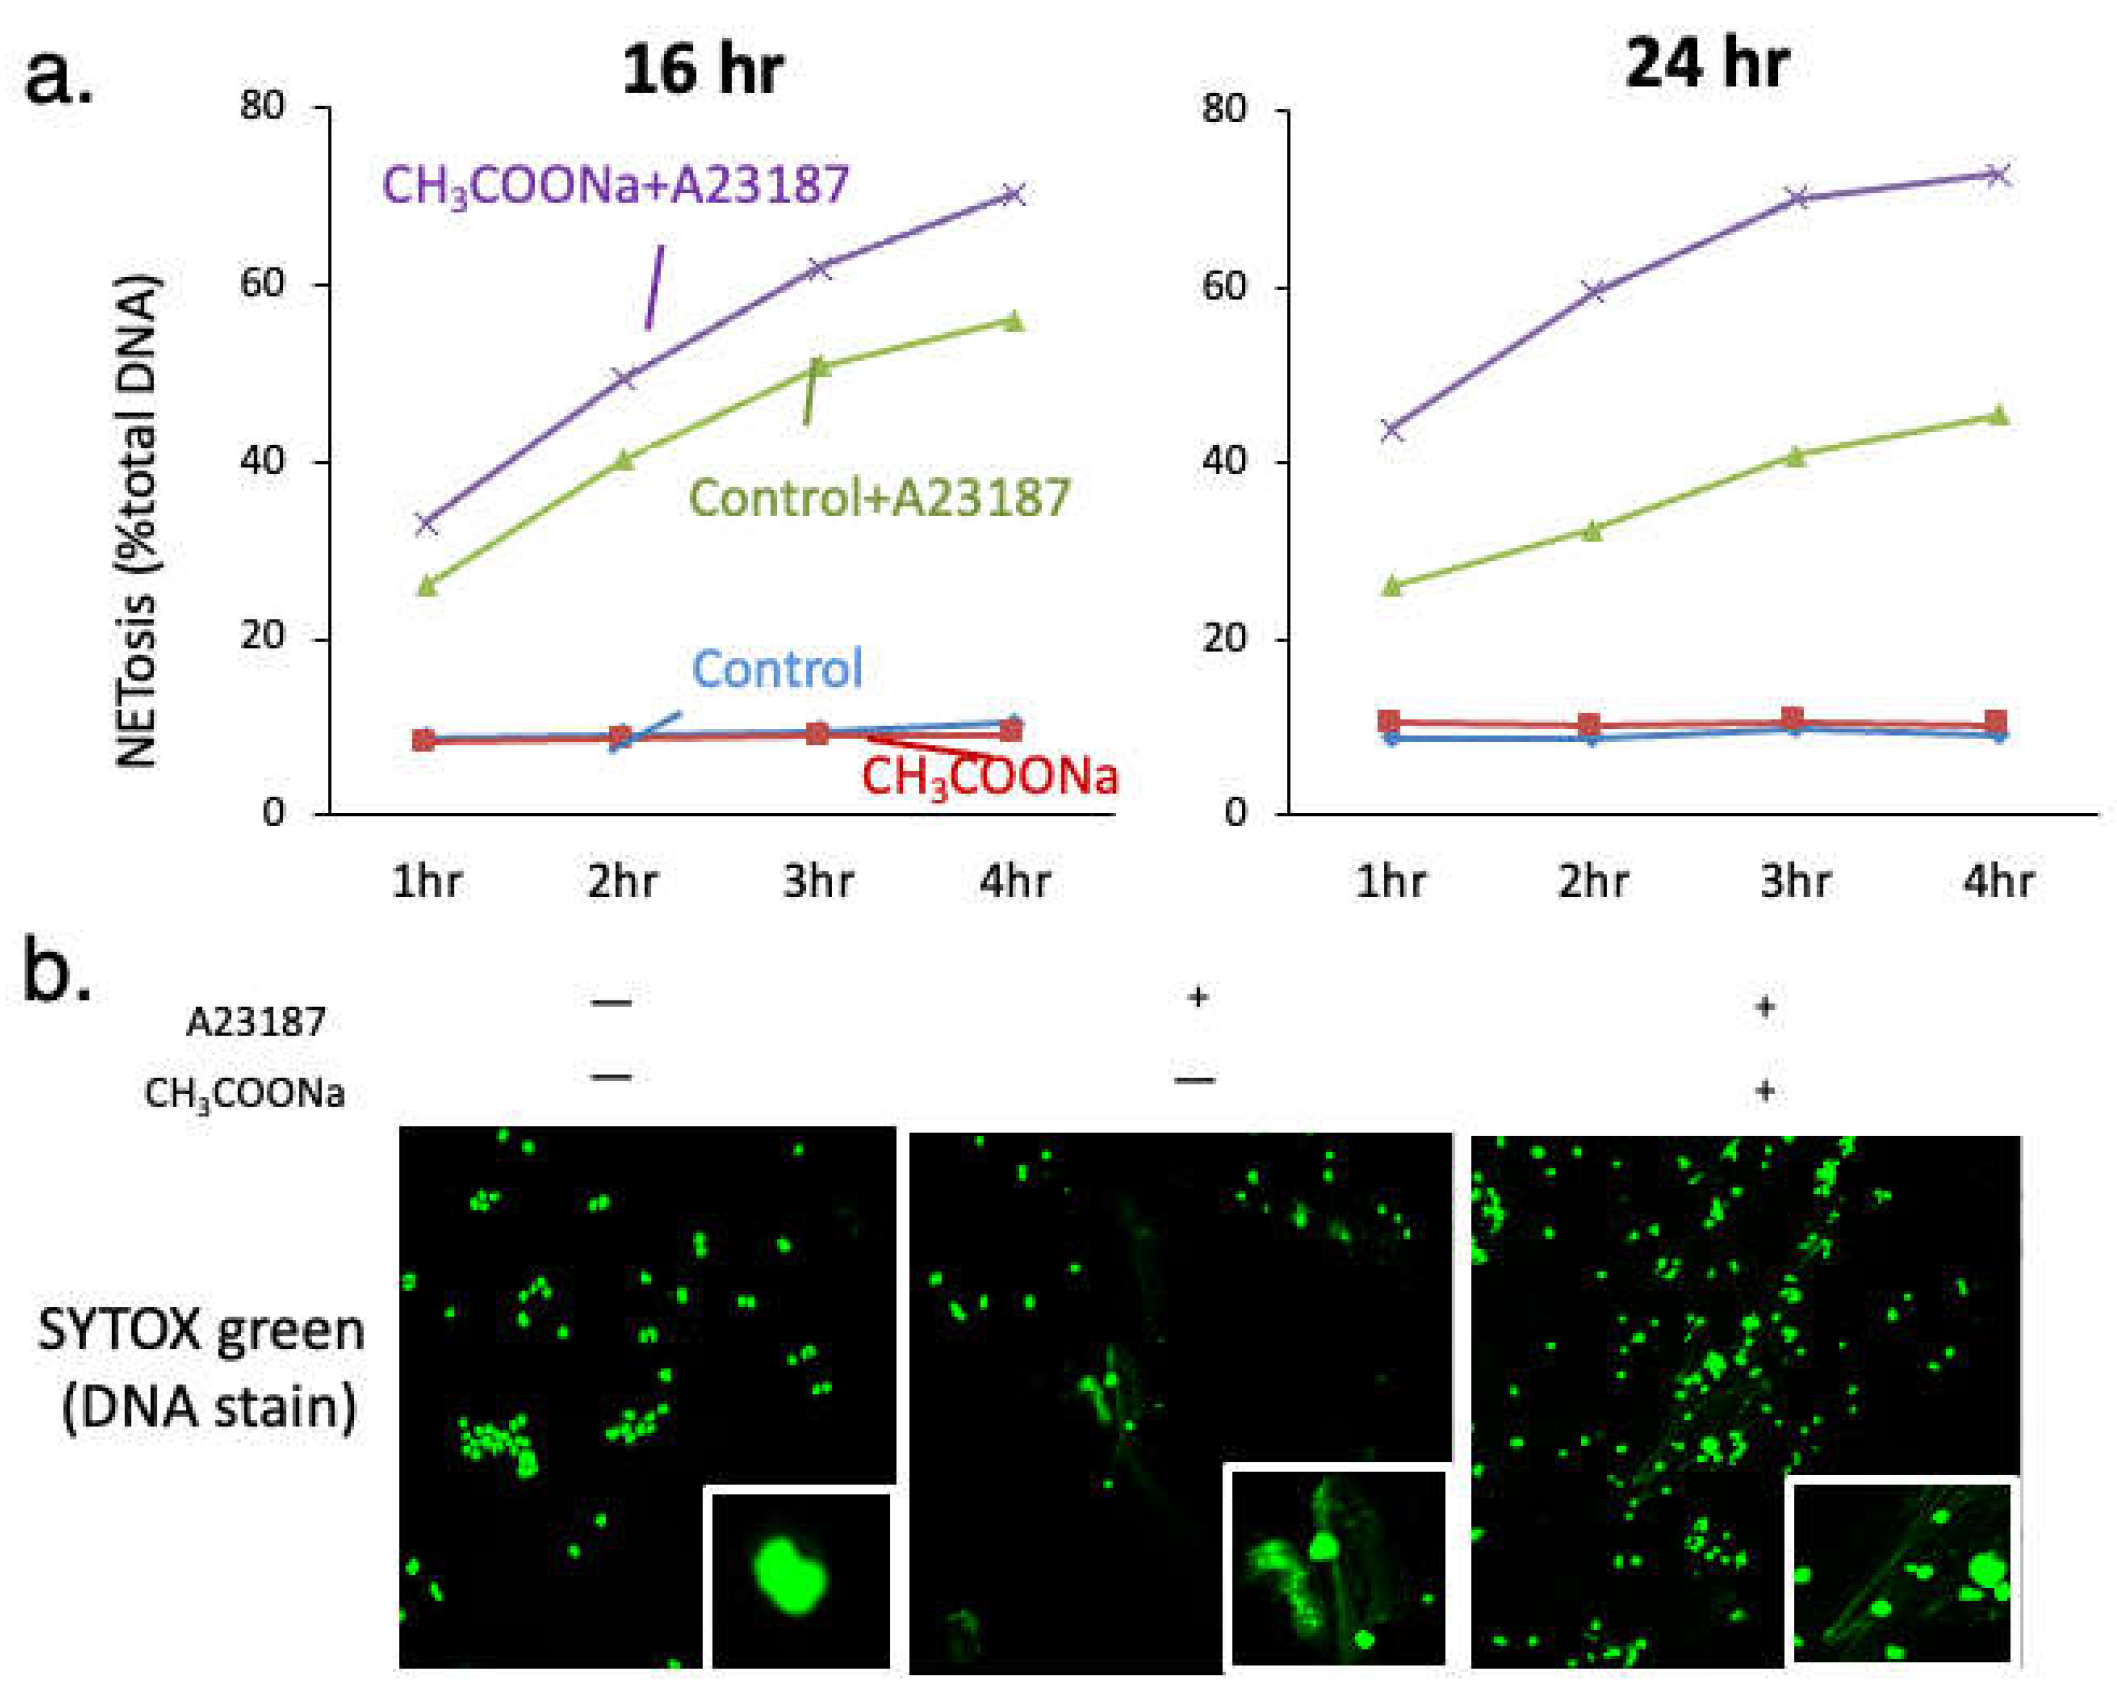
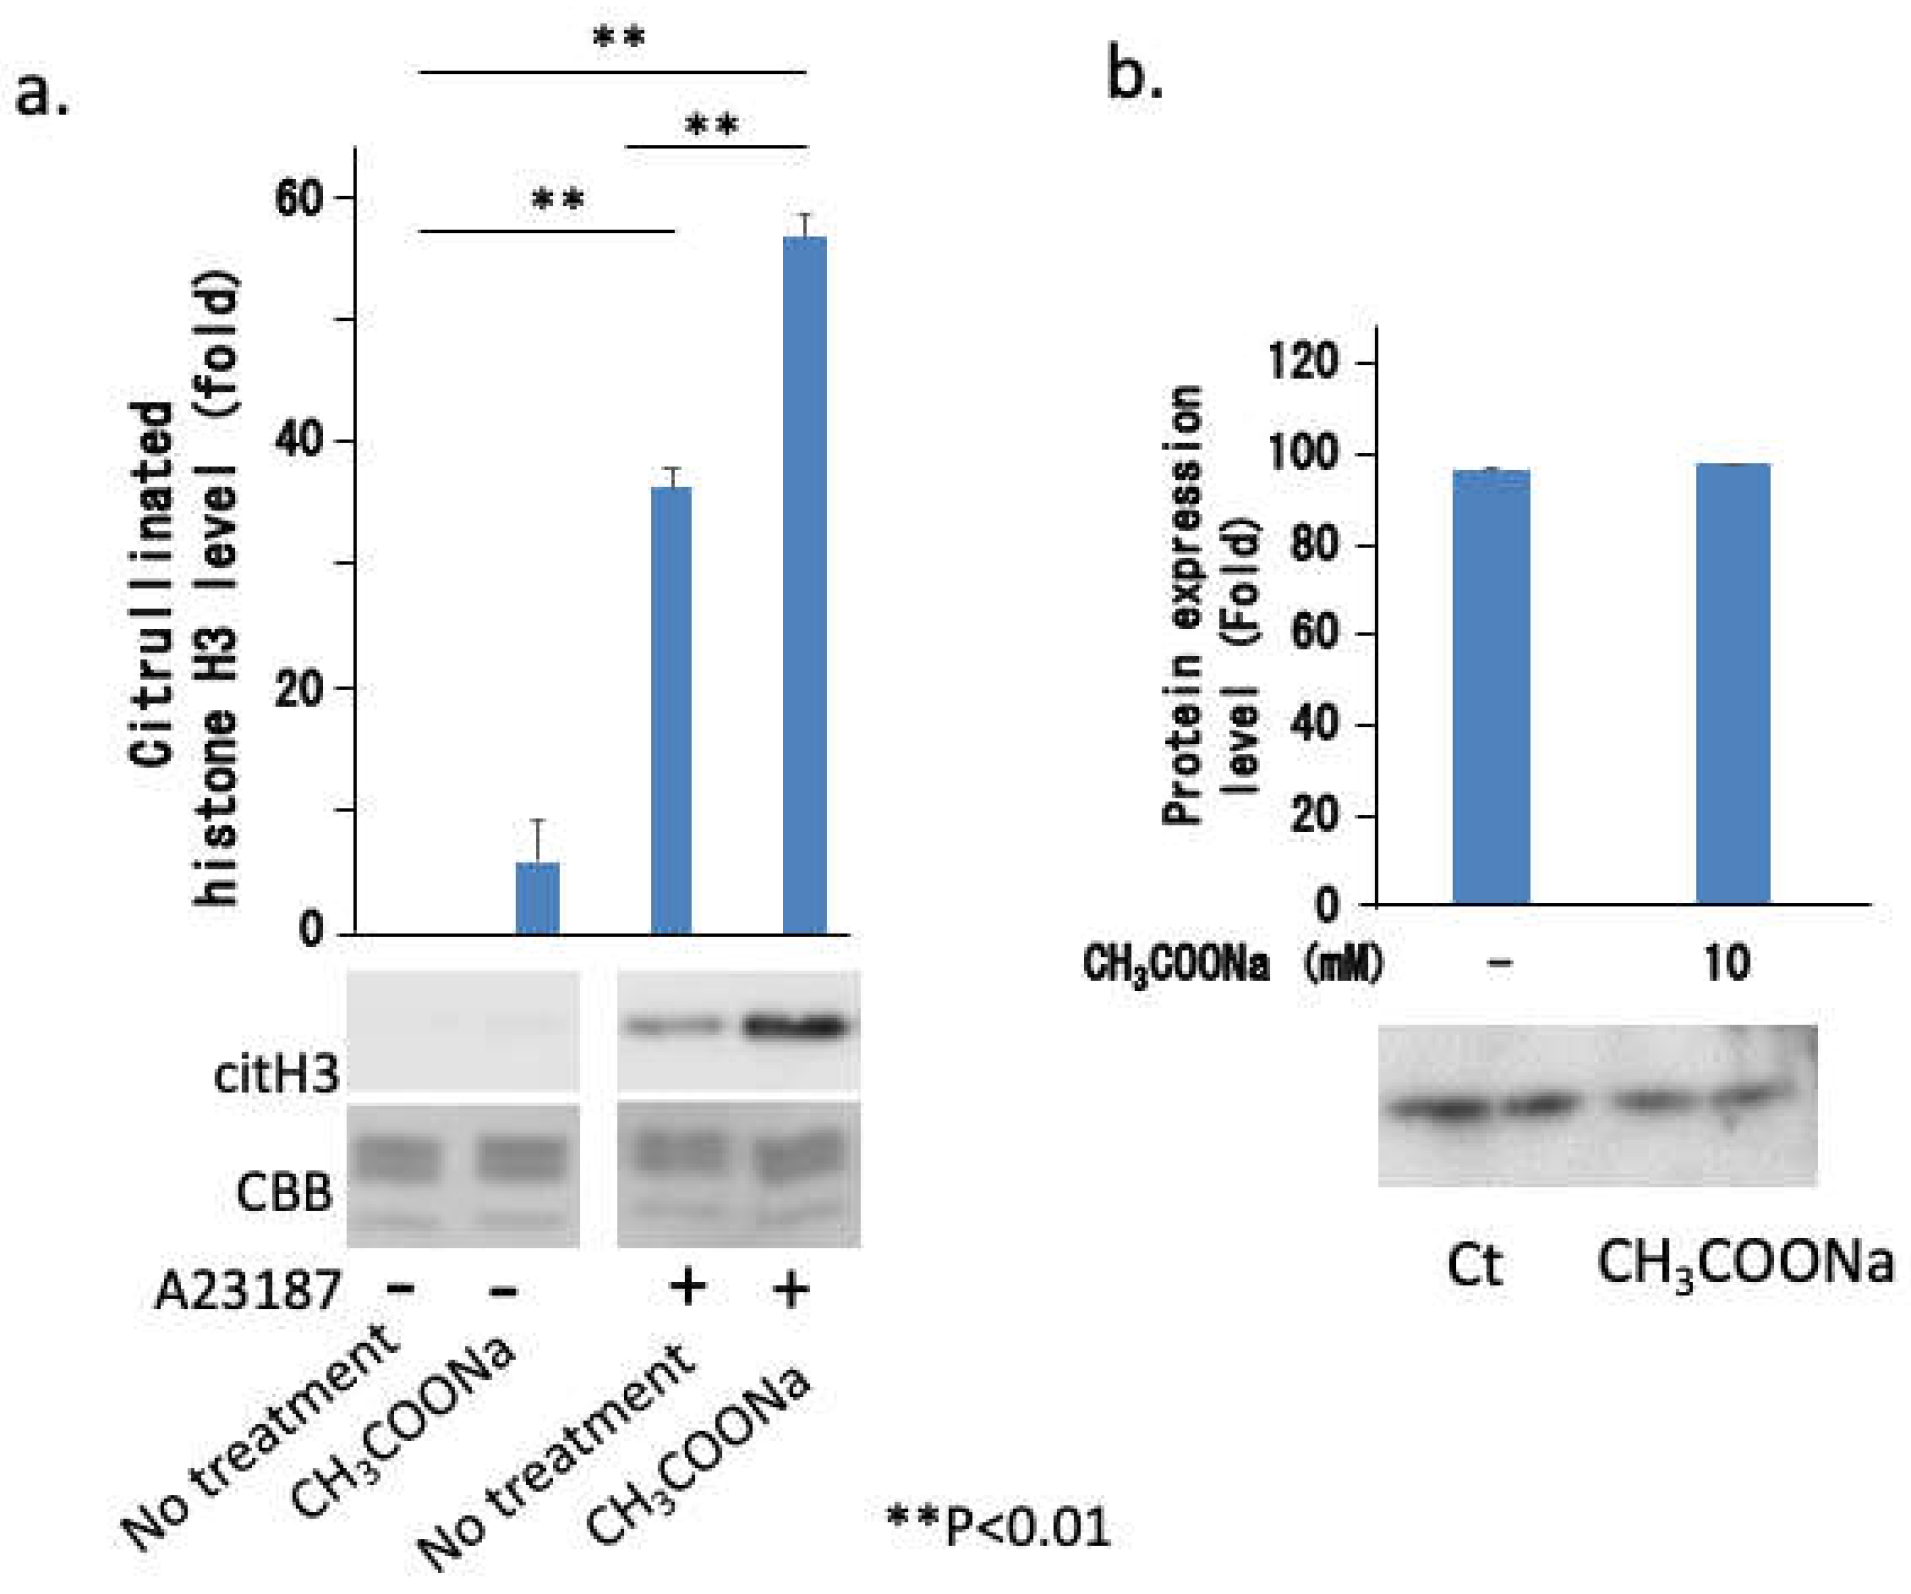
We found that sodium acetate alone did not induce NETosis; however, long-term treatment with 10 mM sodium acetate combined with A23187 enhanced NETosis induction. These treatments did not affect the expression of PAD4 but enhanced histone acetylation and citrullination. Surprisingly, histone acetylation instantly disappeared when stimulated with A23187, although it increased upon sodium acetate treatment (
Figure 6). Therefore, the increase in NETosis could be attributed to an increase in histone citrullination.
In this study, sodium acetate did not induce NETosis but increased NOX-independent NETosis. Sodium acetate induces NETosis in isolated human peripheral blood neutrophils when cultured at a physiological concentration of 100 μM [
22], but such results were not obtained in this study. As this study used DMSO-differentiated HL-60 cells, the data may differ from those of isolated human peripheral blood neutrophils [
22,
23]. Additionally, NETosis has not yet been reported in human blood, even after increasing the concentration of acetic acid in the blood of healthy participants. However, in a previous study, the reaction solution did not contain serum, and acetic acid alone induced NETosis [
22]. In contrast, the reaction solution used in our study was RPMI1640 culture solution containing 10% FCS, which closely simulates human physiological conditions. Ohbuchi et al. showed that acetic acid reduces PMA-induced NETosis in isolated human blood neutrophils [
23]. However, we did not observe similar results in nHL-60 cells (data not shown).
Recently, it was reported that SCFAs, including acetic acid, enhance innate immunity in various ways, such as by activating inflammasomes in macrophages [
28]. This study showed that SCFAs activate inflammasomes even in GPR43 knockout mice, demonstrating that the reaction is not mediated by GPR43. It is transported into cells by a monocarboxylic acid transporter. Because the monocarboxylic acid transporter is present in neutrophils, it is possible that intracellular inflammasomes are activated and NETosis is promoted without GPR43 involvement. Moreover, it has been reported that the activation of the neutrophil inflammasome enhances NETosis [
29,
30,
31].
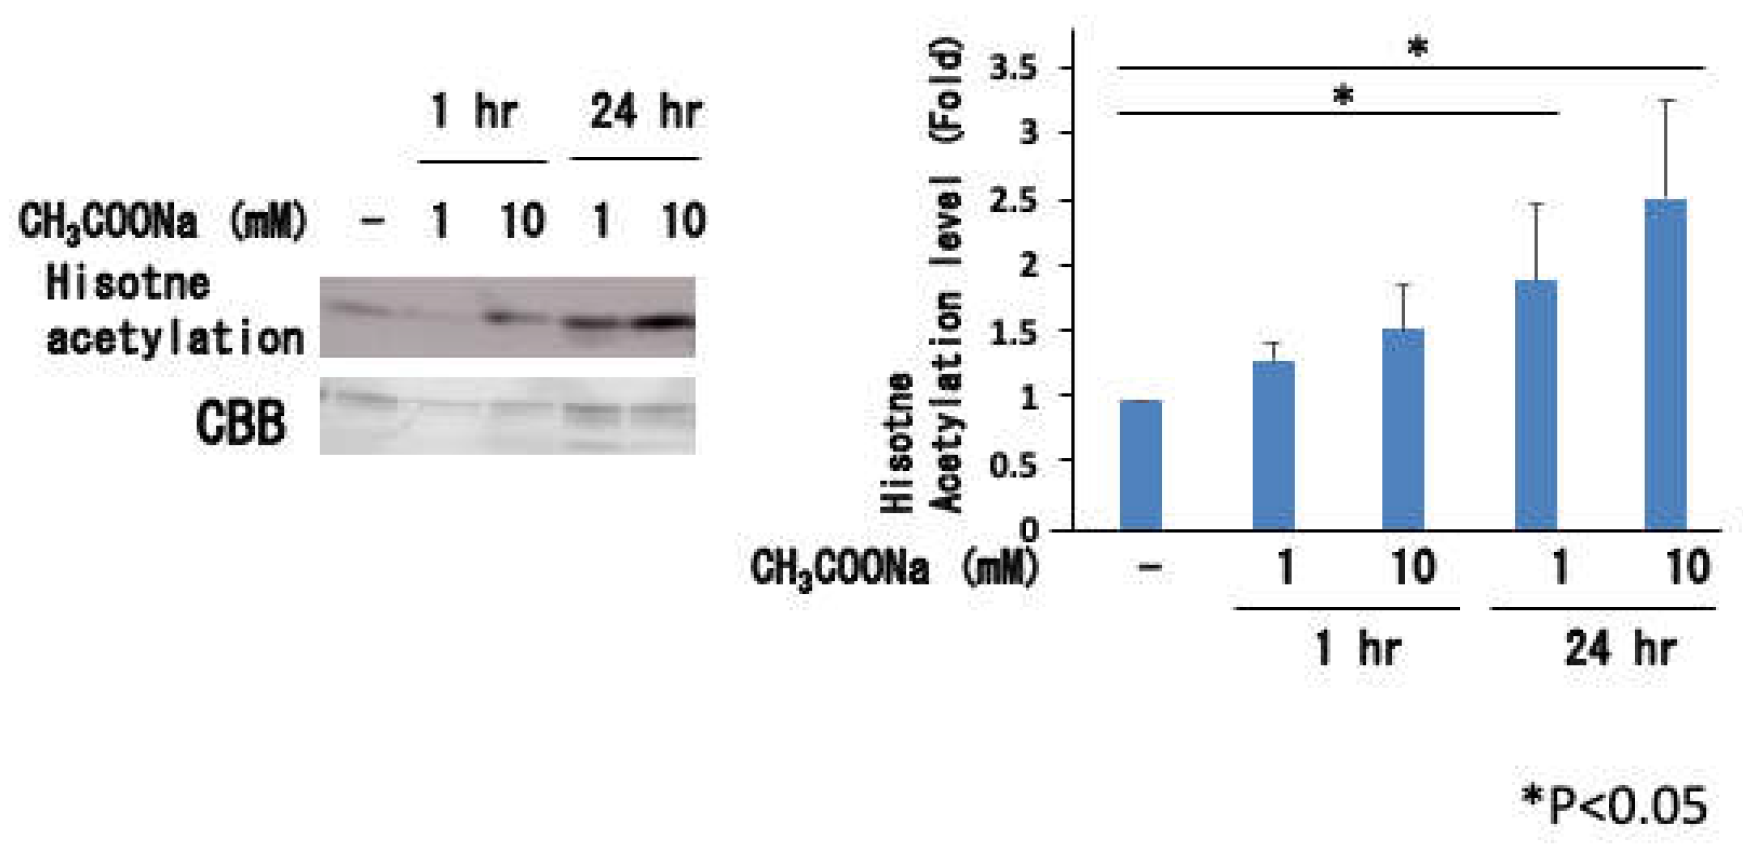
Sodium acetate treatment increased histone acetylation in a concentration-dependent manner (
Figure 5). Thomas and Denu [
32] reported that histone acetylases are activated when acetic acid is taken up by the cells. Furthermore, it has been reported that histone deacetylases are inhibited by acetic acid administration [
33]. Thus, acetic acid administration may sufficiently increase histone acetylation of intracellular chromatin. Previous studies [
26,
27] have reported that stimulant-dependent neutrophil extracellular trapping is increased by increasing histone acetylation through drug treatment, which inhibits histone deacetylases. However, the acetylation status of histones following stimulation has not yet been reported. In these studies, decondensation by acetylation was thought to increase extracellular trap formation. However, in this study, it was found that even though histone acetylation is increased by acetic acid administration, acetylation is markedly decreased in a short time after stimulation with A23187 (
Figure 7). Stimulation with A23187 causes an influx of calcium ions into the cell. This induces activation of PAD4, an enzyme that causes histone citrullination which is the enzyme responsible for histone citrullination by inducing an influx of calcium ions into the cell. Previous studies [
34] have reported that PAD4 forms a complex with histone deacetylase HDAC2. Therefore, the activation and binding of PAD4 to histones simultaneously induce the binding of histone deacetylases to histones. Saiki et al. [
35] reported that the binding of PAD4 to the N-terminus of histone H3 was significantly increased by acetylation in
in vitro experiments using peptides. Thus, it is possible that histone H3 acetylation in this study increased the binding of PAD4 and citrullination, and that HDAC2, which forms a complex with PAD4, increases deacetylation. As shown in
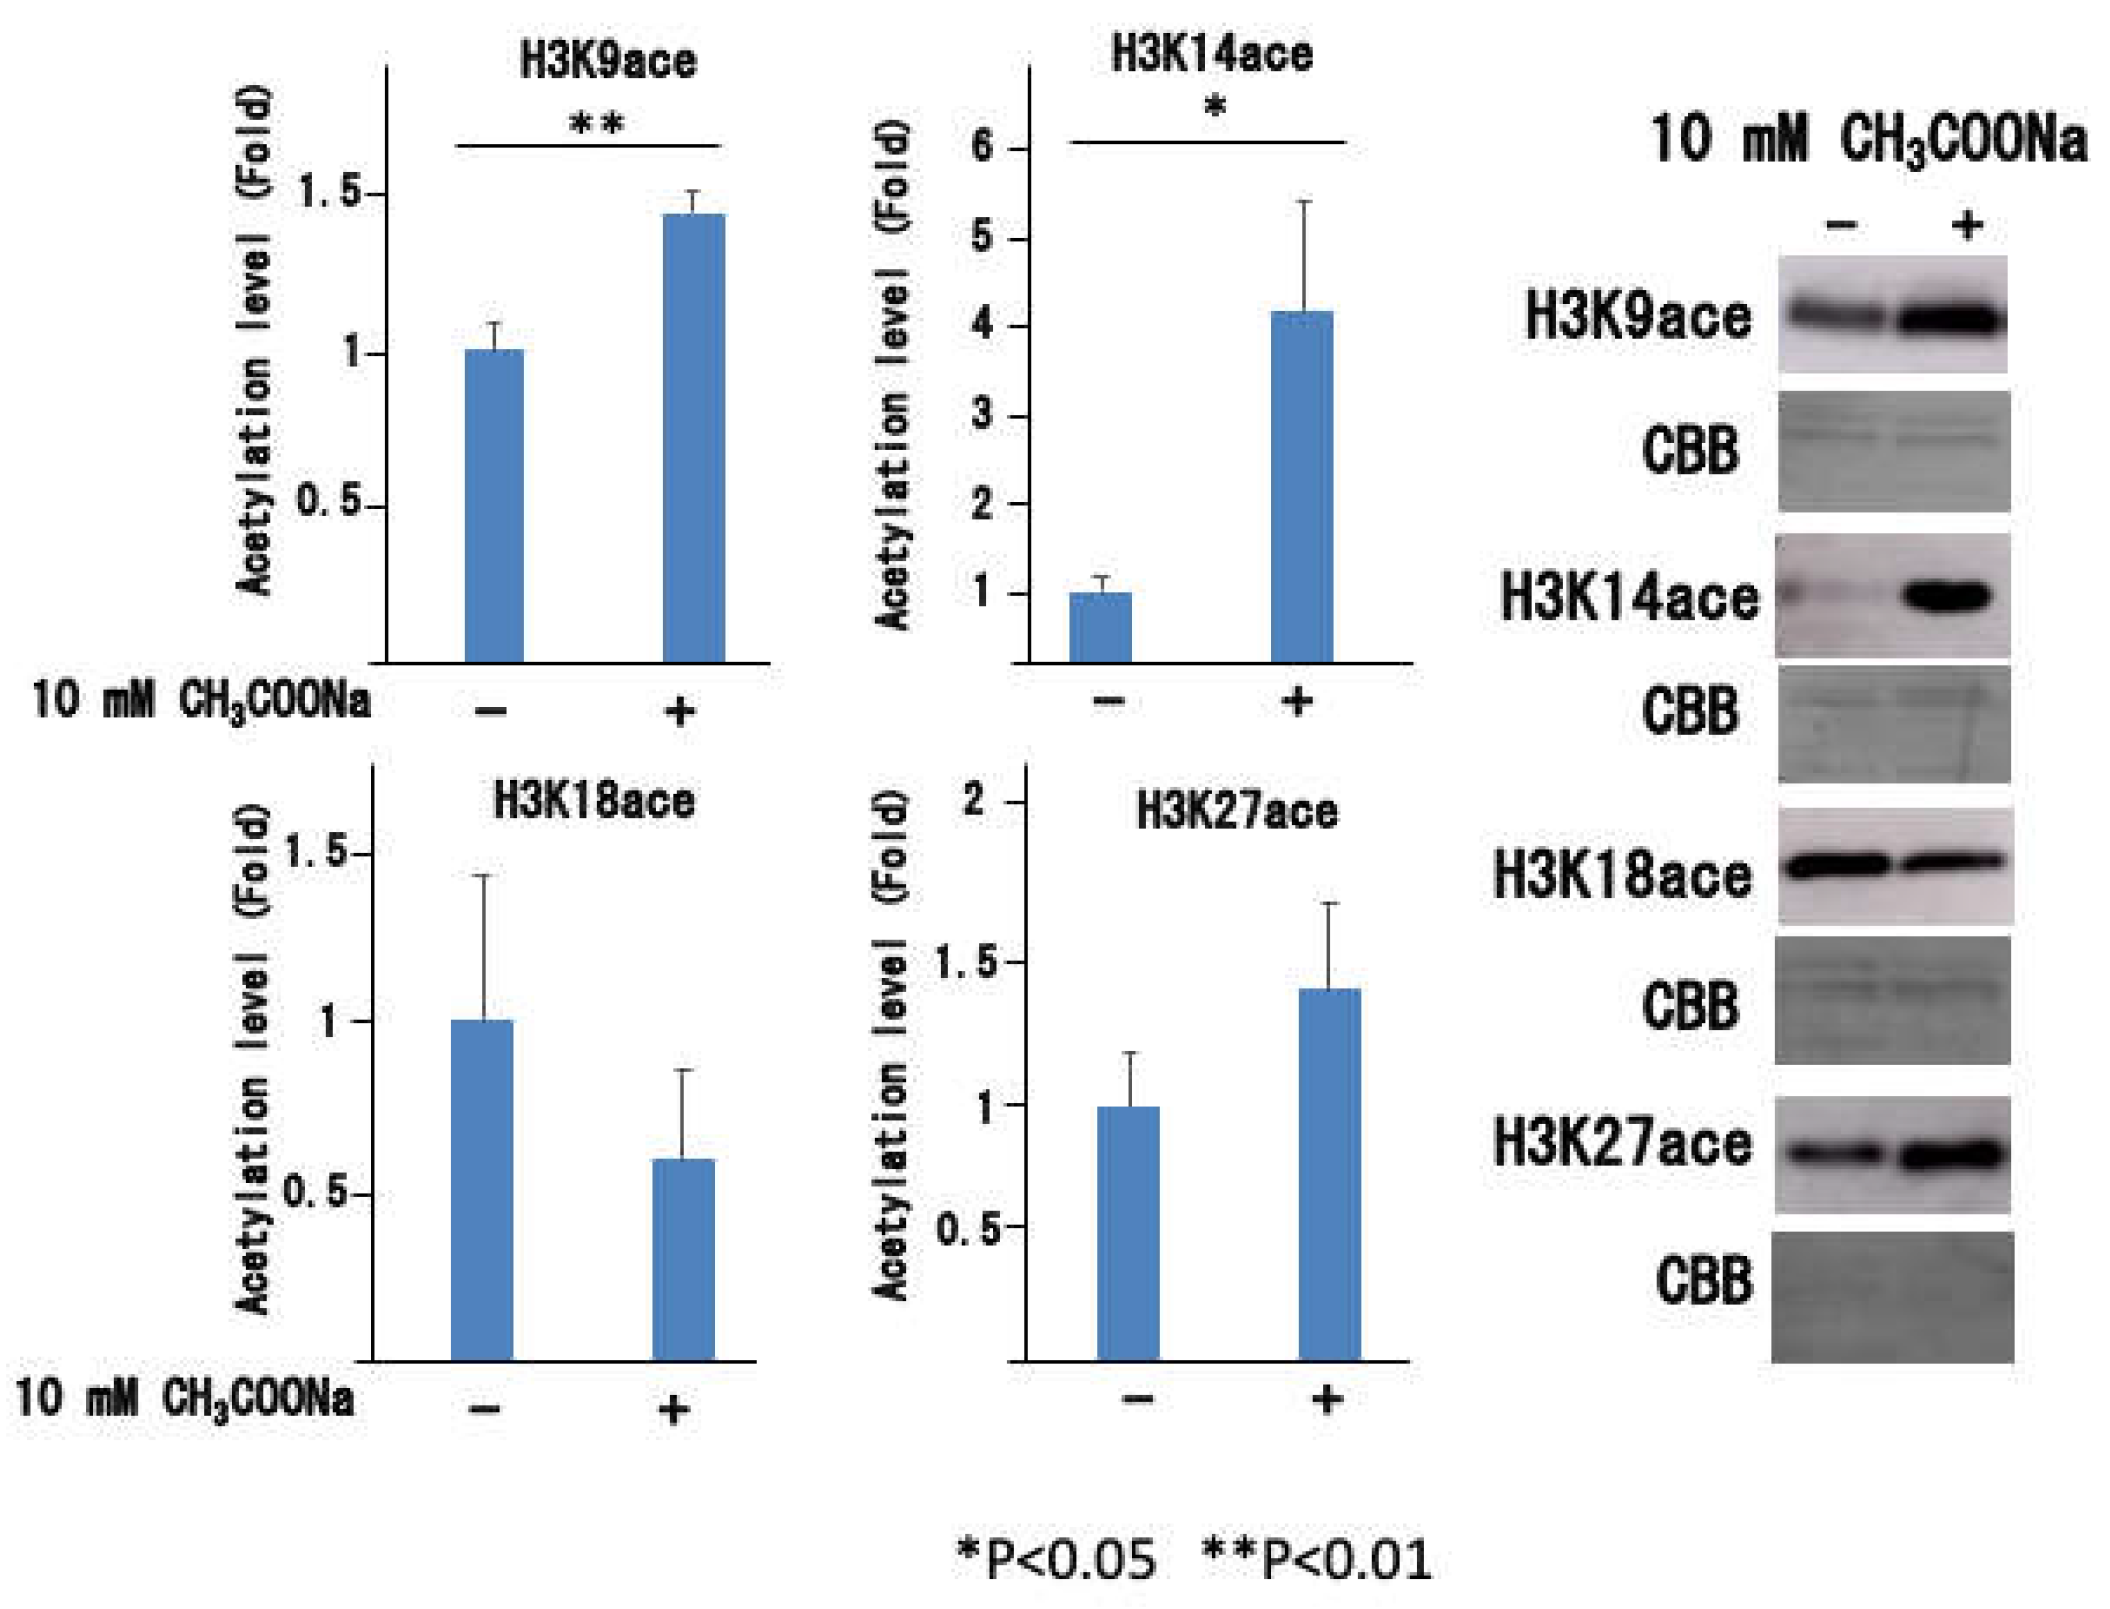
Figure 6, the acetylation of histone H3 by sodium acetate treatment increased at H3K9, H3K14, and H3K27. The acetylation site responsible for the increased binding of PAD4 requires further analysis.
We examined whether propionate and butyrate had similar effects; however, they did not show any such effects (data not shown). It has been reported that sodium propionate and butyrate salts are present in the gastrointestinal tract to some extent, but only acetate is usually found in the blood at an effective concentration of approximately 0.5 mM [
22]. However, since the serum acetate concentration varies with diet, histone acetylation-mediated enhancement of NETosis may only occur when the acetic acid concentration crosses the minimum threshold.
The effect of 10 mM sodium acetate used in this experiment was expected to be similar to that observed in
in vivo experiments. As the main sources of sodium acetate are food intake and metabolism by the gut microbiota [
36], the bloodstream around the gastrointestinal tract may contain sodium acetate at concentrations close to 10 mM [
22]. Furthermore, the liver produces acetate under normal physiological conditions as well as large amounts of acetic acid under certain conditions, such as high alcohol consumption [
37], starvation, or diabetes [
38]. Moreover, certain bacteria, such as
Staphylococcus aureus, produce acetate during substrate-level phosphorylation [
21]. Thus, in the event of a bacterial infection, the accumulated neutrophils will respond to high localized concentrations, possibly activating NETosis.
When NETosis increases, various diseases are exacerbated. Therefore, enhancing NETosis with sodium acetate may aggravate the pathological conditions. However, in many cases, these immunostimulatory events alleviate subsequent diseases. Schlatterer et al. reported that enhanced neutrophil chemotaxis, ROS generation, cytokine production, and phagocytosis via acetic acid alleviated the pathology of sepsis caused by bacterial infection in mice [
21]. Therefore, increasing the acetic acid concentration in the blood through dietary intake is advantageous for the human body owing to its immunostimulatory effect and enhancement of NETosis and innate immunity.
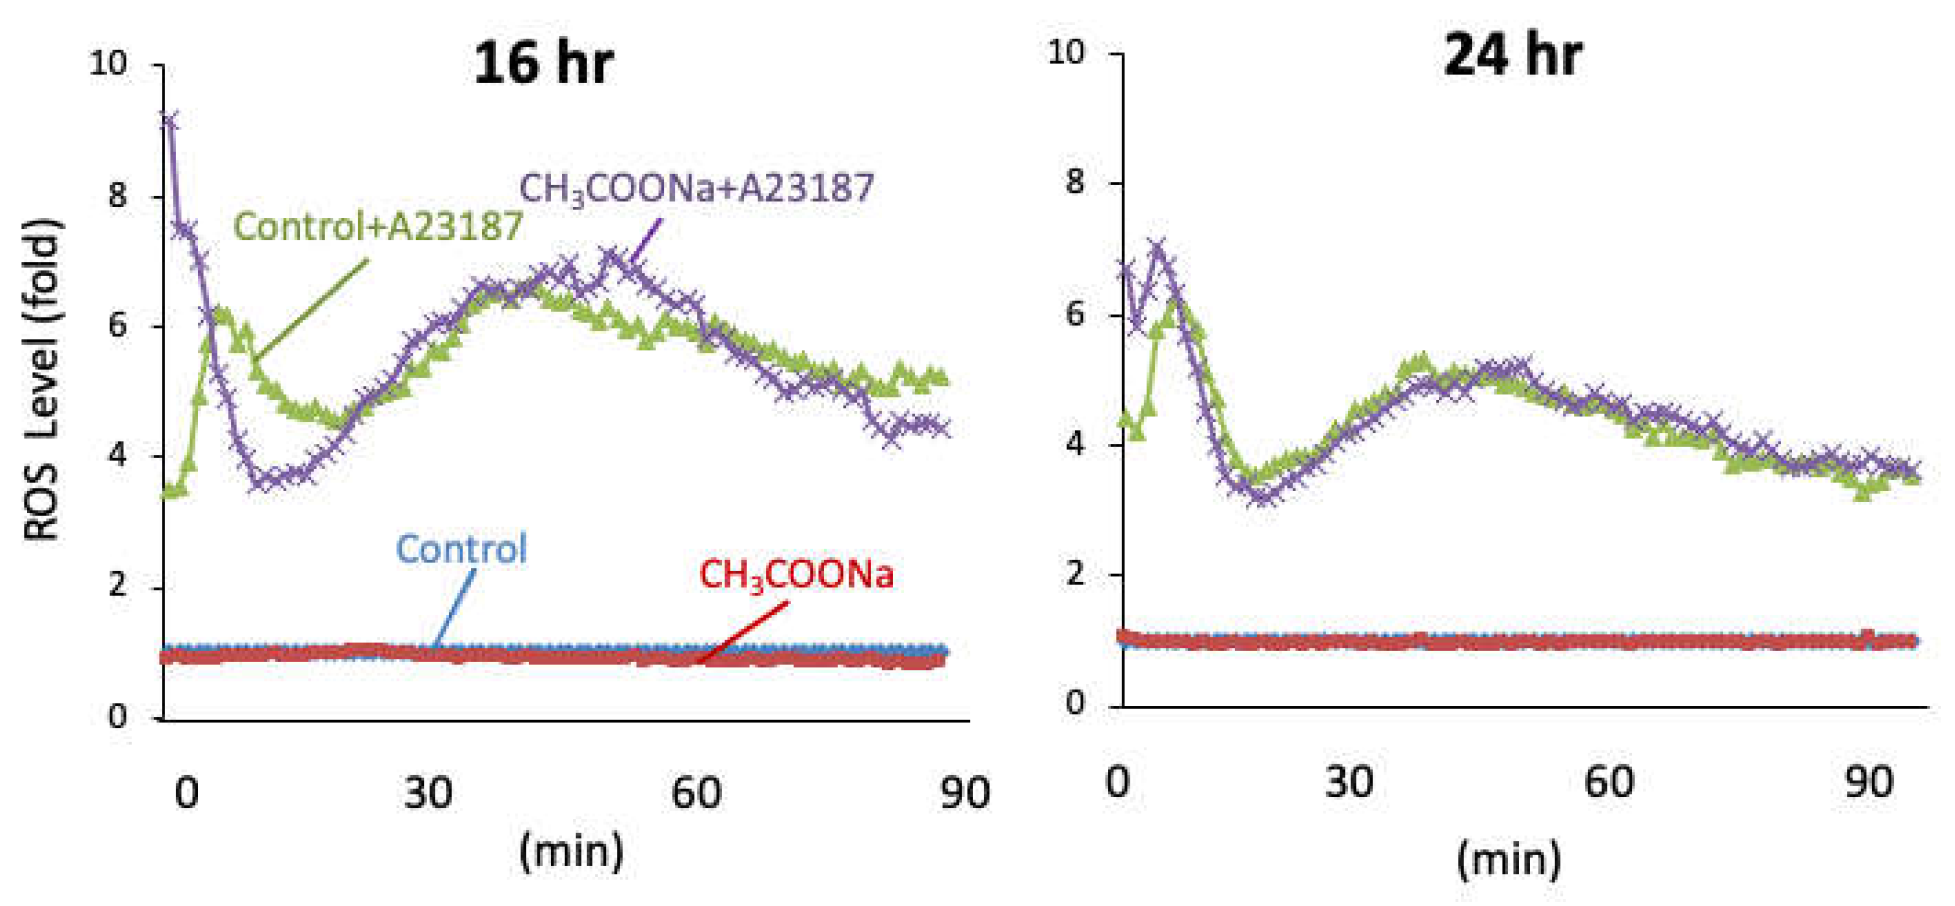
In conclusion, the results of this study indicated that A23187-induced NETosis in nHL-60 cells was enhanced by treatment with sodium acetate via histone acetylation during histone citrullination. Additionally, the regulation of sodium acetate-induced NETosis was independent of NOX-derived ROS production. This study provides a foundation for future studies investigating the significance of NET formation in the innate immune response.
4. Materials and Methods
4.1. Cell Culture
HL-60, a human promyelocytic leukemia cell line (RCB3683; RIKEN BioResource Center, Ibaraki, Japan), was cultured in an RPMI 1640 medium (Nacalai, Kyoto, Japan) containing 10% (v/v) inactivated fetal bovine serum and 1% penicillin/streptomycin (Fujifium-Wako, Osaka, Japan) [
39]. The cells were maintained at 37 ℃ in a humidified incubator (5% CO
2), and the culture medium was replaced every 2 d. To differentiate HL-60 cells into neutrophil-like cells, the cells were cultured with 1.25% DMSO for 3 d [
40].
4.2. Preparation of Sodium Acetate
A 200 mM stock solution of acetate was prepared using sodium acetate (Fujifilm-Wako, Osaka, Japan) in phosphate-buffered saline (PBS), and the pH was adjusted to 7.4 using NaOH. This neutral acetate solution was then filtered using a 0.22 μm syringe filter.
4.3. SYTOX Green NETosis Assay
NETosis was analyzed using SYTOX green fluorophotometry (Invitrogen, Tokyo, Japan) fluorophotometry [
41]. The nHL-60 cells, either untreated or treated with 10 mM sodium acetate for 24 h, were seeded with SYTOX green, a cell-impermeable nucleic acid dye, in 96-well plates at a density of 5 × 10
4 cells/well. The plates were divided into four different groups: one group was treated with 10 mM sodium acetate, another was treated with 10 μM A23187 (Fujifilm-Wako, Osaka, Japan), the third was treated with 10 μM A23187 and 10 mM sodium acetate, and the fourth was the control group (n = 6 per group) treated with 10 mM NaCl for comparison with osmolarity changes found in treatment with 10 mM sodium acetate. After adding 10 μM of A23187 to two of the groups, changes in green fluorescence in all the groups were measured every 1 h using a SpectraMax® (485 nm excitation, 525 nm emission; Molecular Devices Japan, Tokyo, Japan). To determine the total DNA concentration, nHL-60 cells were lysed with 1% (v/v) Triton X-100 (Fujifilm-Wako, Osaka, Japan), and changes in fluorescence were recorded. All values were standardized using the total DNA concentration in each experiment.
4.4. NET Visualization
To induce NET formation, the nHL-60 cells, untreated or treated with 10 mM sodium acetate for 24 h, were seeded at 2 × 10⁴ cells in flexiPERM® (pore size: 1.8 cm2) (Sarstedt, Tokyo, Japan) on slide grass, and then incubated with 10 μM A23187. SYTOX green (5 μM) was then added, and the cells were further incubated for 5 min. Changes in fluorescence were observed using a confocal microscope (OLYMPAS, Tokyo, Japan).
4.5. ROS Measurement
The nHL-60 cells, untreated or treated with 10 mM sodium acetate for 24 h, were seeded at 4 × 10³ cells per 200 μL of PBS and incubated at 37 ℃ with 500 μM L-012 (Fujifilm-Wako, Osaka, Japan). In groups with or without 10 μM A23187, chemiluminescence was measured post-treatment using a Microplate Luminometer (Orion II; Roche Diagnostics K.K., Tokyo, Japan).
4.6. Quantification of Extracellular DNA
Briefly, nHL-60 cells treated with or without sodium acetate for 24 h were seeded at a density of 1 × 10⁶ cells/mL in 96-well plates. After the addition of 10 μM A23187 for 3 h, the cells were treated with 20 U/mL Micrococcal Nuclease (MNase, New England Biolabs Japan, Tokyo, Japan) for 20 min at 37 °C. The supernatants including DNA were collected after centrifugation at 200 × g for 8 min at 4 °C. The extracellular DNA was quantified using SYTOX Green.
4.7. Total Cell Protein Extraction
Total cell protein was extracted as described previously [
12]. Briefly, cells were gently suspended in a lysis buffer (20 mM HEPES-NaOH, pH 7.8, containing 15 mM KCl, 2 mM MgCl
2, 0.5% NP-40, and a protease inhibitor cocktail). After centrifugation at 15,000 ×
g for 20 min, the supernatant was collected and protein concentrations were estimated using a BCA protein assay.
4.8. Histone Extraction
Histones were extracted as previously described [
42]. First, the cells were lysed in an extraction buffer (containing 0.1 M tris-HCl, pH 7.5, 0.15 M NaCl, 1.5 mM MgCl
2, 0.65% NP-40, and a protease inhibitor cocktail (Nakarai-Tesque, Kyoto, Japan)). After centrifugation at 13,200 × g for 10 s, the pellets obtained were mixed with 0.2 M H
2SO
4 and further centrifuged at 13,200 × g for 20 min. The resulting supernatant was mixed with 100% trichloroacetic acid and centrifuged at 13,200 g for 20 min. The pellets were washed with acetone, centrifuged again at 13,200 × g for 5 min, and then dissolved in 0.45 M tris-HCl (pH 8.8) containing 2% SDS, 6% 2-mercaptoethanol, and 0.01% bromophenol blue.
4.9. Western Blotting
Nuclear extracts (20 μg) were mixed with a sample buffer solution (containing 62.5 mM tris-HCl, pH 6.8, 2% SDS, 5% glycerol, 0.8% 2-mercaptoethanol, and 0.012% bromophenol blue) and native histone extracts. The resultant mixture was boiled for 5 min and then separated via SDS-PAGE on 12.5%w/v polyacrylamide gels. The separated proteins were electrophoretically transferred to PVDF and nitrocellulose membranes. Nonspecific binding was blocked using a solution of 5% skim milk in TBST (containing 20 mM Tris-HCl, pH 7.5, 0.15 M NaCl, and 0.05% Tween 20). The membranes were then incubated with primary antibodies against ACSS2 (Proteintech, cat 16087-1-AP, 1:1000), MCT-1(Proteintech, cat 20139-1-AP, 1:1000), MCT-4 (Proteintech, cat 22787-1-AP, 1:1000), Acetylated Lysine (Cell Signaling Technology, cat #9441, 1:1000), Acetyl-Histone H3 (Lys9) (Cell Signaling Technology, cat #9649, 1:1000), Acetyl-Histone H3 (Lys14) (Cell Signaling Technology, cat #7627, 1:1000), Acetyl-Histone H3 (Lys18) (Cell Signaling Technology, cat #13998, 1:1000), Acetyl-Histone H3 (Lys27) (Cell Signaling Technology, cat #8173, 1:1000), Histone H3 (citrulline R2+R8+R17) (Abcam, cat ab5103, 1:1000), and PAD4 (Abcam, cat ab50332, 1:1000). After washing with TBST, the membranes were incubated with anti-rabbit or anti-mouse IgG-peroxidase antibodies (1:3,000). The protein bands were detected using an ImmunoStar® Zeta (Wako Pure Chemical Industries, Ltd., Osaka, Japan) and visualized using Amersham Imager 600 (GE Healthcare Life Sciences, Tokyo, Japan).
4.10. Statistical Analysis
The data from the experiments are presented as mean ± SD. Statistical analysis was performed using Student’s t-test or two-way analysis of variance (ANOVA) with Tukey-Kramer post-hoc comparisons. Statistical significance was set at p < 0.05.
Figure 1.
Sodium acetate increases A23187-induced neutrophil extracellular trap formation (NETosis) (NOX-independent NETosis). (a) After treatment with or without 10 mM sodium acetate during differentiation, NETosis levels in nHL-60 cells treated with (+) or without (-) 10 μM A23187 for 4 h were analyzed through a SYTOX green assay. (b) After treatment with or without 10 mM sodium acetate during differentiation, NETosis images were obtained using confocal microscopy of SYTOX green (DNA) stained nHL-60 cells treated with (+) or without (-) 10 μM A23187 for 2 h.
Figure 2.
Sodium acetate treatment did not increase ROS production in nHL-60 cells. After treatment with or without 10 mM sodium acetate during differentiation. Quantitative chemiluminescence analysis of ROS production in the nHL-60 cell culture incubated with or without 10 μM A23187 for 90 min was performed. Data are shown as the mean ± SD (n = 3).
Figure 3.
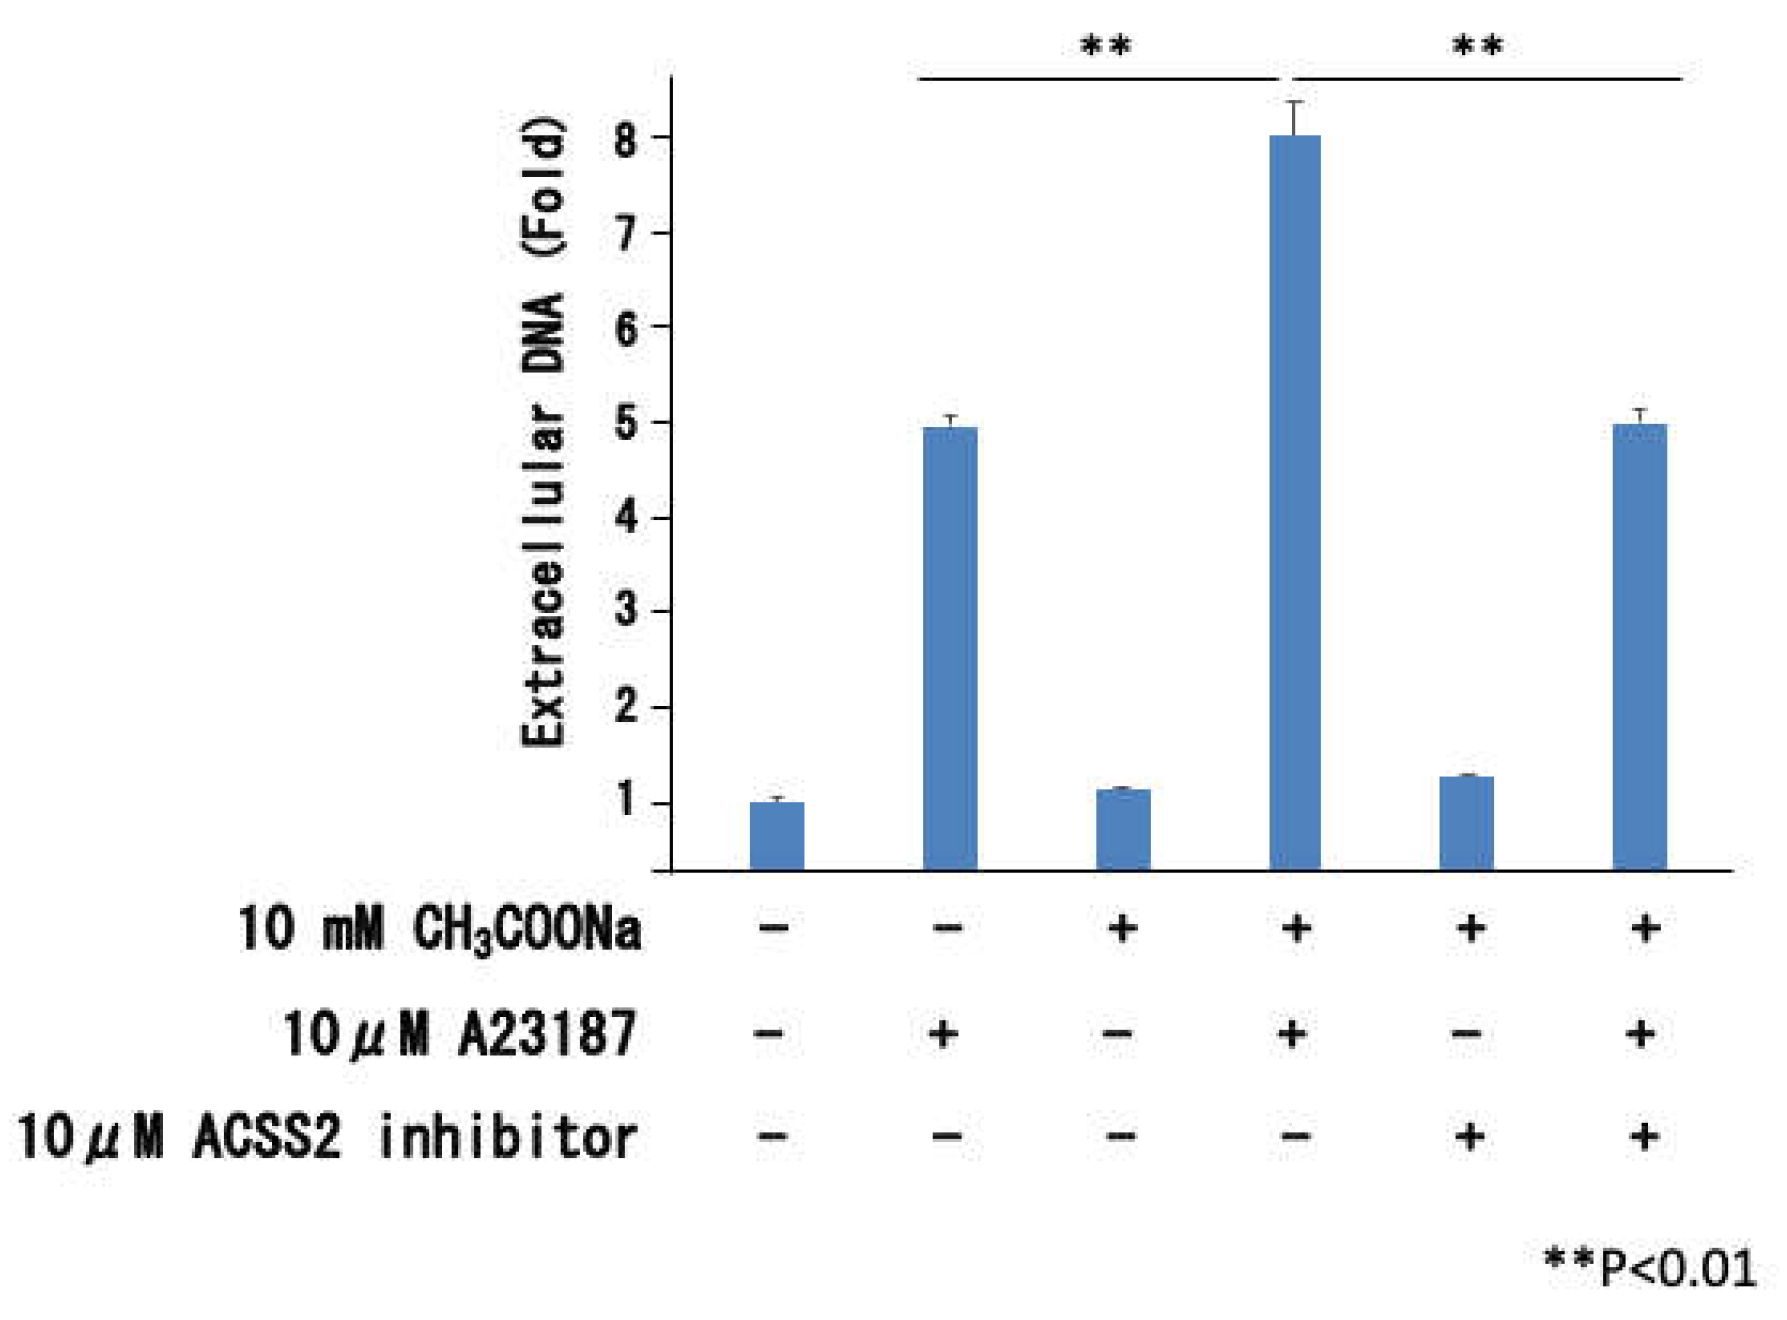
Effect of ACSS2 inhibitor to release of extracellular DNA. After treating nHL-60 cells with or without 10 μ M ACSS2 inhibitor during sodium acetate treatment, extracellular DNA was isolated and measured by performing an extracellular DNA quantification assay. Data are shown as the mean ± SD (n = 3). (**p < 0.01).
Figure 4.
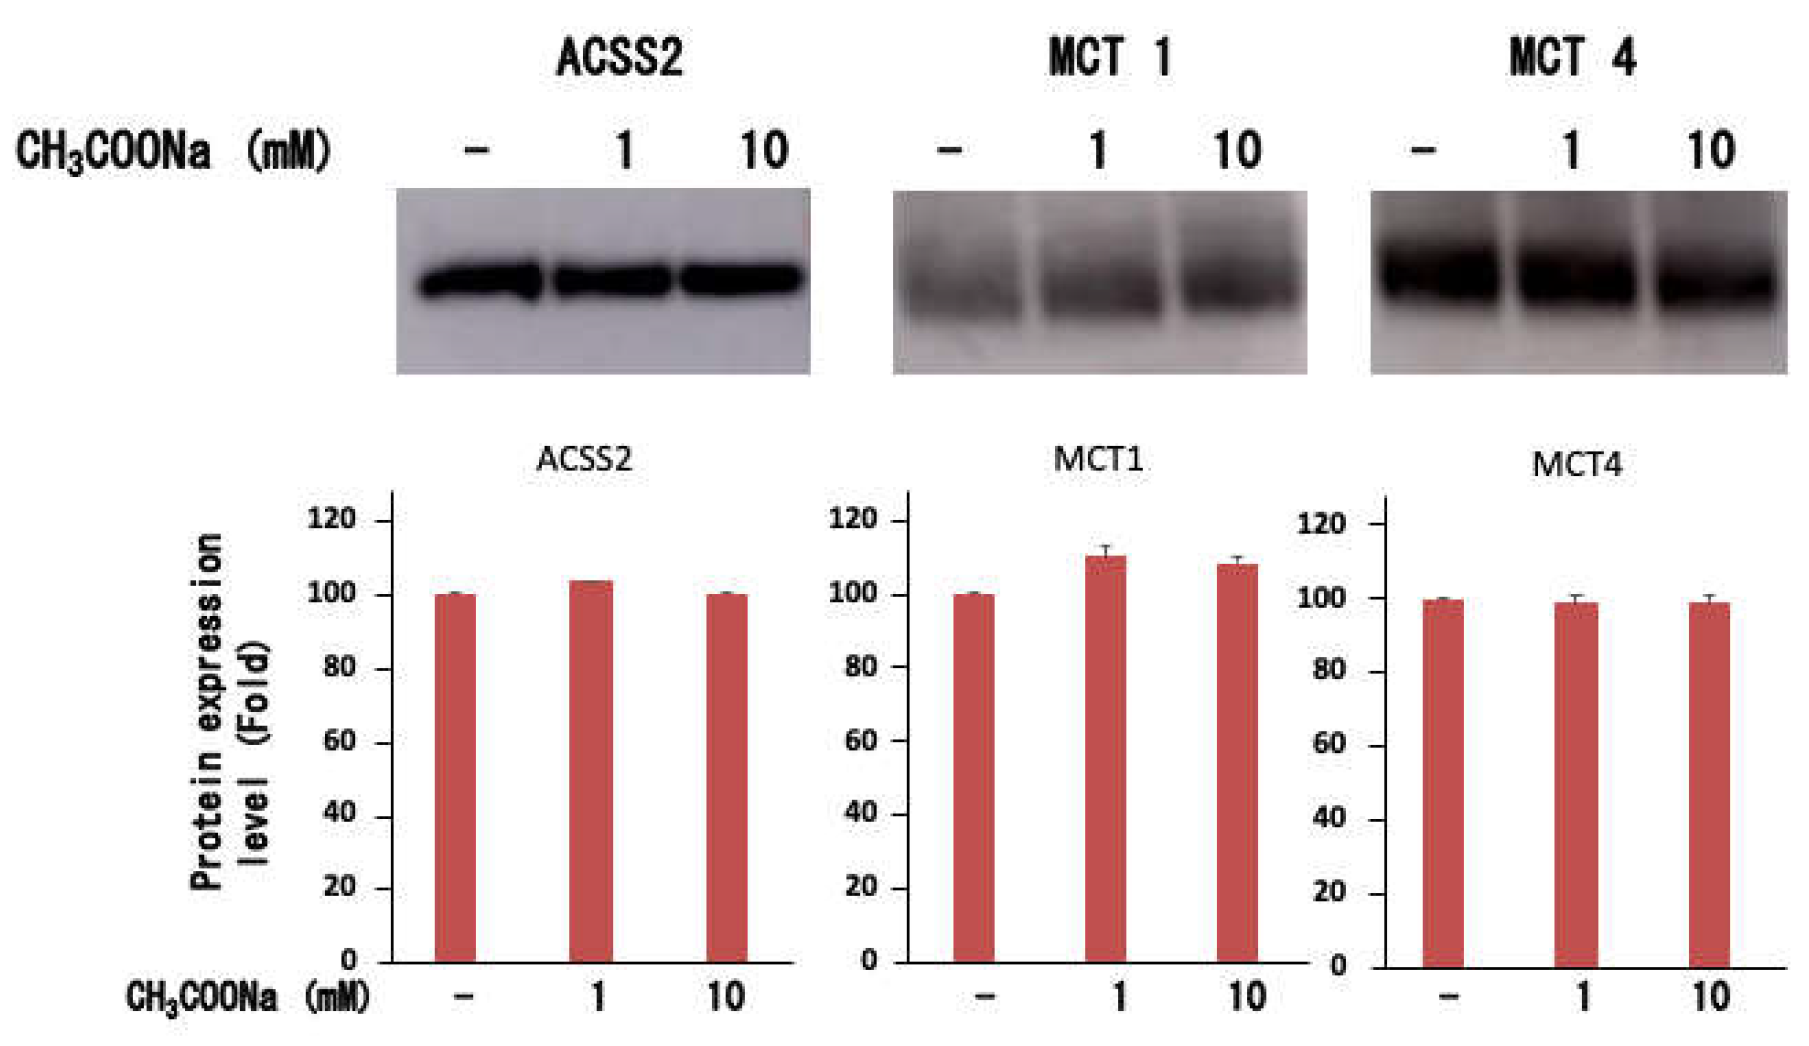
Expression of ACSS2, MCT-1, and MCT-4 in nHL-60 cells. After treatment with or without sodium acetate (1 or 10 mM) for 24 h, the ACSS2, MCT-1, and MCT-4 expression levels in nHL-60 cells were analyzed using western blotting. Data are shown as the mean ± SD (n = 3).
Figure 4.
Expression of ACSS2, MCT-1, and MCT-4 in nHL-60 cells. After treatment with or without sodium acetate (1 or 10 mM) for 24 h, the ACSS2, MCT-1, and MCT-4 expression levels in nHL-60 cells were analyzed using western blotting. Data are shown as the mean ± SD (n = 3).
Figure 5.
Sodium acetate enhanced histone acetylation. The nHL-60 cells were incubated with or without sodium acetate for 1 or 24 h. Following histone extraction, histone acetylation levels were analyzed using western blotting. Loading of histones was monitored using Coomassie staining (denoted as CBB). The data are shown as mean ± SD (n = 3). (*p < 0.05).
Figure 6.
Histone H3 acetylation in nHL-60 cells. The nHL-60 cells were incubated with or without sodium acetate for 24 h. Following histone extraction, histone acetylation (denoted as H3K9ace, H3K14ace, H3K18ace, and H3K27ace) levels were analyzed by western blotting using specific antibodies. Loading of histones was monitored using Coomassie staining (denoted as CBB). The data are shown as mean ± SD (n = 3). (*p < 0.05 , **p < 0.01).
Figure 7.
Histone acetylation levels before and after A23187 stimulation. The nHL-60 cells were incubated with or without 10 mM sodium acetate for 24 h. Then, the cells were stimulated with 10 μM A23187. Following histone extraction, histone acetylation levels were analyzed by western blotting. Loading of histones was monitored using Coomassie staining (denoted as CBB). The data are shown as mean ± SD (n = 3). (**p < 0.01).
Figure 8.
Sodium acetate enhanced histone citrullination but not PAD4 expression. (a) nHL-60 cells (treated with or without 10 mM sodium acetate) were treated with or without 10 μM A23187 for 3 h. Following histone extraction, citrullinated histone H3 (denoted as citH3) protein levels were analyzed via western blotting. Loading of histones was monitored using Coomassie staining (denoted as CBB). (b) The nHL-60 cells were incubated with or without 10 mM sodium acetate. After cell extraction, the PAD4 expression was determined through western blotting. The data are shown as mean ± SD (n = 3). (**p < 0.01).
