Submitted:
02 July 2024
Posted:
03 July 2024
You are already at the latest version
Abstract
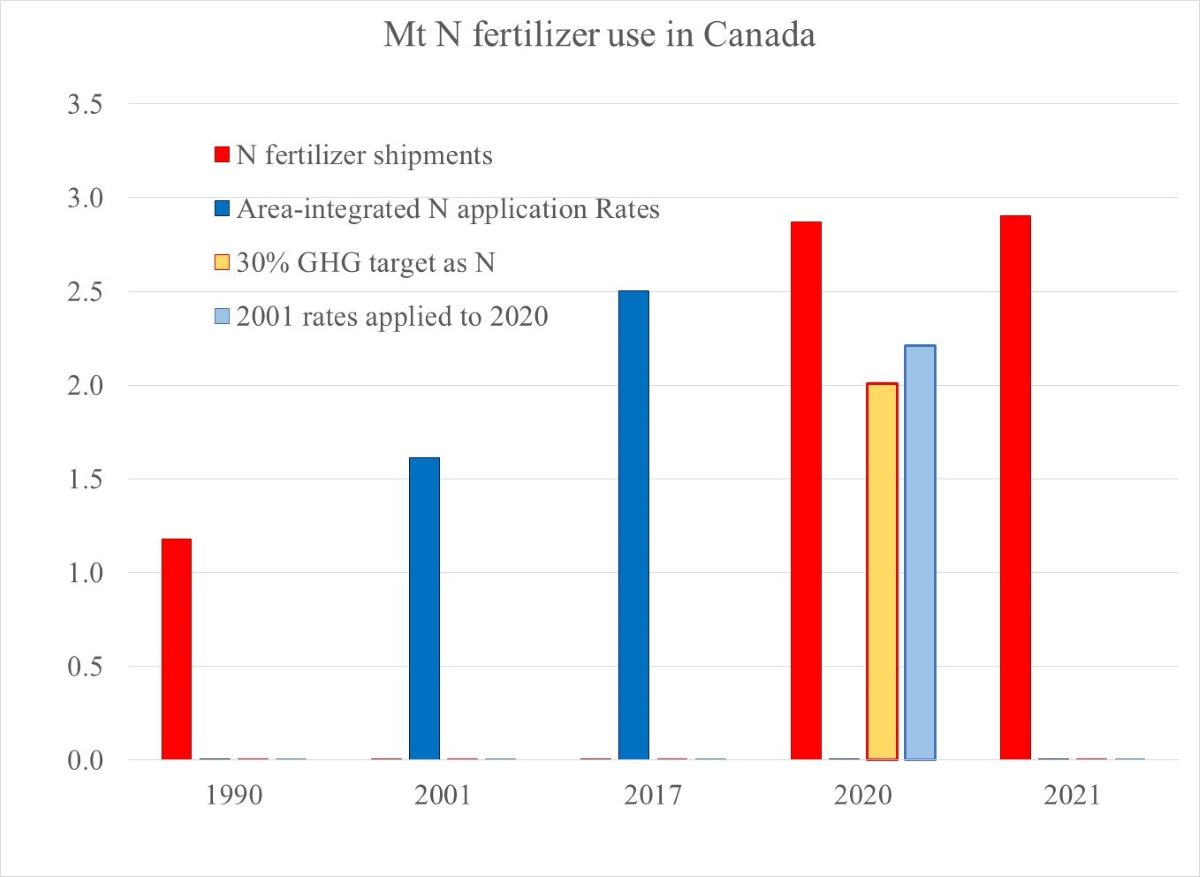
Because Canadian Nitrogen (N) fertilizer use has more than doubled since 1990 (1.2 to 2.9 MtN by 2021), a better understanding of this trend is needed. A comprehensive set of Recommended N Rates (RNR) that agreed with fertilizer sales data from 1996 and 2001 was compared with the Fertilizer Use Survey (FUS). The FUS was conducted from 2014 to 2021, with 2017 being the most representative year for these data. Using non-parametric statistics, confidence intervals were derived from the histograms used to present the FUS data. N application rates from the RNR for Canola, Spring and Duram wheat, and Oats in the west were all below their respective FUS confidence intervals, whereas N application rates for Grain corn showed almost no difference in N use between the RNR and FUS. Crop-specific N application rates interpolated from the RNR and FUS were integrated over their respective crop areas and plotted against national fertilizer sales records from 1990 to 2021. The rapid increase in N use between 2001 and 2017 (0.89 MtN), 90% of it (0.80 MtN) in Western Canada, was primarily due to increased application rates per crop, rather than crop area changes. The FUS-RNR interpolations were a good approximation of N sales records and could improve farm GHG emissions modelling. The economically important crops in Western Canada should be the main focus for N-related GHG reduction measures, but production losses need to be avoided.
Keywords:
Nitrogen fertilizer rates
; Fertiliizer use surveys
; Survey histograms
; Non-parametric deviation estimates
; Crop area integrations
; GHG emissions
Introduction
There has been a rapid increase in Nitrogen (N) fertilizer use in Canada over the last four decades (Qualman, 2019). The national records of fertilizer shipments (Statistics Canada, 2023), here after referred to as fertilizer sales, have shown that N fertilizer use has tripled since 1981. This increase is part of a global trend (Statista, 2024). After levelling off between 1996 and 2006, sales increased steadily until 2021. The Fertilizer Use Survey (FUS) provides the first opportunity in 20 years to evaluate this change. The N application rates reported by the FUS were derived from a series of surveys conducted between 2014 and 2021 (Fertilizer Canada, 2022).
This rapid increase has major implications for two of the terms of Canada’s agricultural carbon footprint. N fertilizer is the largest source of N2O emissions (Dyer et al., 2018; Janzen et al. 2006; Pulse Canada, 2011) and N fertilizer supply is the largest user of fossil fuel in the farm energy budget (Dyer and Desjardins, 2009; Dyer et al., 2018). The N fertilizer that leaches into ground water, or is lost with surface runoff, has a major impact on the biodiversity of downstream habitats (Brune et al., 2022; NFU, 2022; Philpott, 2013; Simpson, 2009), and drinking water (Quinte Conservation, 2014). However, the world would not be able to meet its food production needs without chemical fertilizers (Erisman et al., 2008; Roberts, 1999; Simpson, 2009; Thakur, 2021); the largest share of which is nitrogen (Statista, 2024).
Canada has committed to reduce current GHG emissions from fertilizer by 30% below 2020 levels by 2030 (Government of Canada, 2022; NFU, 2022), with almost all of this reduction projected to come from improved fertilizer management (Fertilizer Canada, 2022). Given these changes and the importance of N fertilizer, there is a need to better understand the historical trend of these essential farm inputs (Huffman et al., 2005).
Early N fertilizer Recommendations:
In this analysis the recent fertilizer use data from the FUS were compared with the Recommended N Rates (RNR) from Yang et al. (2006). The N fertilizer rates from that paper were reported to have agreed well with national fertilizer sales data from 1996 and 2001. Prior to the FUS, numerous Canadian GHG budget studies relied on the RNR estimates (Dyer et al., 2018; Karimi et al., 2020; NFU, 2022; Vergé et al. 2007; 2008; 2009a&b). Without an update on these RNR, it was not possible in these assessments to determine the cause of this trend in Canadian fertilizer use or to identify crops with the biggest increase in N fertilizer use. Instead, the industry-wide trend in fertilizer sales had to be used as a “one size fits all” index calculation (Huffman et al., 2005). Used together, these two data sets could show how much of this trend was due to changes in crop types, if there is a general increase in N rates for all crops, or if the shift was towards crops that require more N fertilizer.
The Fertilizer Use Survey
The FUS covered 13 crops in five Canadian provinces from 2014 to 2021 (Fertilizer Canada, 2022). However, only two of the 13 crops in the FUS (Canola for the three Prairie Provinces and Grain corn in Ontario) were surveyed in all eight years of the FUS. It did not include any surveys in British Columbia or the Atlantic Provinces and many crops were not surveyed in all of the provinces where they are grown. Two crops, Sunflower and flaxseed, were only surveyed in Manitoba. The sampling for Quebec Winter wheat was found to be inadequate. Most of the spatial gaps occurred because most major field crops are region-specific in Canada. For example, Grain corn, Soybeans and Winter wheat are not grown to any extent in the west. Due to limited resources and expense of large scale surveys, the FUS database has numerous temporal data gaps. In spite of these weaknesses, the FUS provides the only up to date data on Canadian N fertilizer use.
If the FUS is to have a role in an improved trend analysis, then whether the N fertilizer application rates derived from the FUS were significantly different from the RNR needs to be determined. Finding a significant difference could help to explain the rapid increase in N fertilizer consumption. A quantitative answer to this question depended on a measure of the dispersion of observed application rates from the FUS. This paper will analyse the RNR-FUS relationship and integrate it over the 21 field crops used in the Sustainability Metrics (SM) program in Canada (Dyer et al., 2018; McConkey et al., 2017). These 21 SM crops are all listed in the Annual Crop Inventory (AAFC, 2016) and they account for all but five of the field crops monitored by this inventory. The five exclusions, Potatoes, Canary seed, Ginseng, Buckwheat and Triticale, are all considered either minor crops in Canada or horticultural, rather than agronomic, crops.
Methodology
Deriving the Mean Deviations
Because the FUS was subject to confidentiality restrictions, the recorded data from the FUS were only available as histograms (Fertilizer Canada, 2022). The FUS only provided sufficient data to generate histograms for 11 of the 21 SM crops. In spite of this data access constraint, it was possible to estimate mean N fertilizer application rates and a measure of dispersion for each rate from these histograms. This data access constraint required non-parametric statistical methodology to quantify this dispersion. Arkin & Colton (1973) provided a non-parametric technique for estimating the Mean Deviation (MD) from histograms.
Mean Deviation (MD) Calculations
MD = (1/Ƞ) × ∑n(f × │d│)
MD = mean deviation
Mn = arithmetic mean
v = mid-point value of each frequency class, n
f = frequency (%) of records in each class
Ƞ = total number of all frequencies over all classes (∑nf)
d = difference of each value (v) from the mean
dn = (Mn - vn)
and
∑ = cumulative (integration)
│d│ = mode (sign ignored) value of (d)
Since MD is a function of Mn, a non-parametric calculation of Mn was computed as:
Mn = ∑n (v × f) / ∑nf
The Mn and MD values derived from the FUS histograms for each available crop, province and year are listed in Appendix 1. The crop-province averages over all available years for Mn and MD are also shown in Appendix 1.
N Application Rate Confidence Intervals
Figure 1 compares the RNR with the FUS Mn rates and Confidence Intervals (CI). Upper and lower CIs for each of the 23 crop-province cases are defined by Mn plus or minus MD derived by Equations 1 and 2. Each case in Figure 1 is represented by only the one average rate from Appendix 1, regardless of how many years each crop was sampled in that province. The tops of the grey bars in Figure 1 show the upper CIs and the tops of the white bars show the lower CIs for the 23 crop-province cases. Figure 1 shows whether the RNR (grey line) are within or outside their respective CI intervals. RNRs that are within their respective CIs, are identified by overlaps with the grey bars. These overlaps suggest a lack of significant difference in N use rates between the FUS and RNR for each case. The Mn rates (Equation 2) are shown by the black line that evenly divides each grey bar. If the grey RNR line is above the black line then that RNR value exceeds the Mn value.
However, because the measure of dispersion, MD, used in this analysis was non-parametric, the informal CI estimates in Figure 1 were not meant to be a substitute for rigorous confidence interval computations by parametric methods using quadratic means and standard deviations. The latter methodology would be essential to determine the true significance of the CIs, or whether or not a future set of surveys would statistically replicate the FUS. But such rigour cannot be applied to histograms. The main purpose of the CIs in Figure 1 was to highlight the relative Mn to RNR differences among the crop-province cases included in the 2021 FUS. Regardless of those differences, there was no reason not to apply all of the Mn-RNR differences to a trend analysis.
Centralizing the FUS to a Single Year
In order to minimize any skewness in the trend analysis (described below), an objective estimate of a year that would best represent all of the data in Appendix 1 was needed. Towards this estimate, the crop-province combinations (cp) with data in each year were counted. Then each year’s Count (C) was multiplied by the year (Y) of that count. As shown in Equation 3, these year-count products were summed over all eight years and divided by the total number of counts of cp cases with survey histograms in Appendix 1. The FUS Median Year (Ymed) was found to be a third into 2017, rounded to 2017.
Ymed = ∑y (Yy × Cy) / ∑y,cp Cy,cp
A further correction following Equation 3 was for the effect that temporal differences of the FUS N use rates (S) due to the sequence of cp survey histograms within the eight years of the FUS. This correction linked the N use difference to the difference between Ycp and Ymed. The Ycp to Ymed shift was indexed to the period (years) between the RNR (2001) and the FUS (2017). This index, calculated using Equation 4, is a dimensionless temporal shift factor (Z) that is distributed about one. To cover cp cases with more than one year of survey, Ycp was replaced by the average Ycp of those years (Ycp,ave).
Zcp = 1 + ((Ycp,ave - Ymed) / (Ymed - YRNR) )
The corrected N fertilizer rate from the FUS (S'cp) is computed using Equation 5 from Zcp and the respective cp N fertilizer application rates from the FUS and the RNR. In Equation 5, Z is only applied to the difference between the FUS and RNR N rates for each FUS-RNR pair.
S'FUS,cp = SRNR,cp + Zcp × (SFUS,cp - SRNR,cp)
All of the four cp combinations with histograms in all eight years exhibited some change over the eight years of the FUS. Although these four rates of change may not be statistically significant, they reflect the change in N use between the RNR and the FUS. To assess this potential impact, these four 8-year time series were plotted with provincial N sales records from the respective provinces over the same eight years in Figure 2. In order for FUS N use and N sales to have comparable scales in each sub-figure, the data in all eight series were normalised to their respective 8 year averages. Therefore, although the FUS time series are per-ha rates and the N sales time series are integral N totals, their slopes are still comparable because they are both sets of dimensionless numbers distributed about one.
FUS to RNR Differences for Crops with No CI
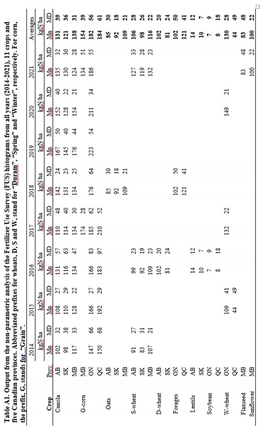
Table 1 pairs the mean application rates for 15 of the 21 SM crops with the respective RNR rates. As well as the 11 crops in Figure 1, Table 1 shows four additional crops (Barley, Dry peas, Chick peas and Dry beans) for which recent data on their application rates were available. For the five crops for which CI intervals could not be calculated in one or more provinces, those provinces are shown in italics and grey. With an unreliable histogram, Quebec Winter wheat was also shown in grey and italics. For Dry peas and Barley, and Soybeans in Manitoba, the FUS provided mean values, but no histograms.
N application rates for Chick peas and Dry beans were taken from online extension publications by Manitoba Pulse and Soybean Growers (n.d.) and Saskatchewan Pulse Growers (n.d.). Average rates for Chick peas in Alberta and Saskatchewan came from the Saskatchewan Pulse Growers website. Since Dry beans (including both white and coloured beans) are poor N-fixers, the Manitoba Pulse and Soybean Growers website recommended that Dry beans be treated like non-legumes. Hence, for Dry beans in Alberta, Manitoba and Ontario application rates recommended by unidentified provincial experts, were used in Table 1. While the sources for these two crops were subjective, both crops are very minor in Canada.
The cp cases surveyed in the FUS accounted for 93% of the land that supported the 21 SM field crops in 2017 (calculation not shown). However, only 39 of the 75 possible cp combinations in Table 1 (not counting the Atlantic Province or British Columbia) are filled with N use rates. The reason that those 39 FUS N rates could account for so much farm land was, first, the FUS targeted the most economically important crops, and second, most of the 21 SM crops, particularly the dominant ones, are concentrated in climatically homogeneous regions. For example, Spring wheat and Canola are almost all grown in the Prairies and Grain corn is mostly grown in Ontario and Quebec.
Nevertheless, a national N use estimate from the FUS must include all areas growing each crop, even if they were not included in the FUS. The two minor crops not covered by the FUS and the limited production of the 13 FUS crops in other provinces account for small amounts of additional N fertilizer use. Hence, N application rates from the FUS were extrapolated to the non-FUS crop-province cases. The rates of FUS crops that are in provinces not covered by the FUS were assigned the FUS-RNR average rate from each respective crop. For crops with more than one province with a FUS N rate (expressed as percentages of their respective RNR rates), an area-weighted average rate was calculated. Given the indexing of FUS rates to RNR rates, the rates in the non-FUS provinces are (by default) all 100% (of RNR). Thus, each non-FUS default rate was replaced by the midpoint (average) of the area-weighted FUS average rate (expressed as %) and RNR (expressed as 100%).
The six SM crops not shown in Table 1 include Fall Rye, Sugar beets, Mustard seed, Silage corn, Alfalfa and Other small grains (treated as one crop). For five of these crops, the rate from the most closely related crop in the FUS was used as a proxy. Yang et al. (2006) suggested that all small grain cereal crops are statistically much the same. Therefore, Barley was the proxy for Fall Rye, Other small grains and Sugar beets. Canola was used for Mustard seed and Grain corn was used for Silage corn. Due to inadequate sampling, the Quebec Winter wheat rate was replaced with the Winter wheat rate from Ontario. The Ontario and Quebec forage rates from the FUS were not considered good proxies for Tame hay in the other provinces, nor for Alfalfa in any province. Therefore, Tame hay outside of these two provinces and all Alfalfa retained their RNR rates.
Historical N Fertilizer Use Trends
Figure 3 shows two trend lines for the total weights of N fertilizer use in Canada from 1990 to 2021. The dashed red line shows the national N fertilizer sales. The integrated N from the FUS and RNR interpolations is shown in solid blue. These annual integrations were done over all of the SM crop areas and cp cases. The smoother blue line shows a derived time series of total national N fertilizer applications. The weights of N for the FUS and RNR nodal years (2001 and 2017) are represented in Figure 3 by two short horizontal black lines. Since the interpolated time line was derived from these two short lines, this precise intersection of the blue line and the two short black lines at 2001 and 2017, respectively, was expected.
Since the integrated N based on the N application rates from Yang et al. (2006) agreed closely with the fertilizer sales records for the census years 1996 and 2001, this short horizontal line, shown in black in Figure 3, covers all four inter-census years. For the FUS, the horizontal black line covered 2014 to 2021, the FUS survey period. The fertilizer sales data (Statistics Canada, 2023), shown in Figure 3 by the dashed red line, initially showed a lot of fluctuations. So instead of just the raw annual N sales (I) from each year (y), a binomial computation of N sales (I') was generated to smooth the curve for I as follows:
I'y = (Iy-1 + 2 × Iy + Iy+1) / 4
In spite of this binomial smoothing, the national fertilizer sales data (red) trend line in Figure 3 is still quite non-linear, especially after 1996.
The Interpolation of N Fertilizer Use Estimates
The interpolated N fertilizer rate (B) was calculated for each cp and year (Y). Because (as described above) the FUS was represented as a percent of RNR, then RNR in all cases becomes 1 (always 100%) and each FUS rate is a percent of the respective RNR rate. The interpolation process depends on the time between RNR and FUS (∆Y), defined as:
∆Y = YFUS – YRNR
The flatness of the N sales curve just before 2001, the RNR nodal year, in Figure 3 means that B will not be very sensitive to the year representing the RNR (YRNR). But Figure 2 showed that B was sensitive to the year representing the FUS (YFUS), thus requiring Equation 3. The RNR to FUS interpolation of B (blue) was:
Bcp,y = BRNR,cp + ((Y - YRNR) / ∆Y) × (BFUS,cp - BRNR,cp)
For the nodal years, 2001 and 2017, the Bcp estimates replicate their respective N rates as reported by Yang et al. (2006) and shown by the two short flat lines in Figure 3. The calculated percentages for B must be multiplied by the N fertilizer rate from Yang et al. (2006) to apply this interpolation to each cp and to give actual N application rates.
Equation 8 was extrapolated backward from 2001 to 1990, the Kyoto baseline year (United Nations, 1998). There was a boundary condition placed on the extrapolations to the years before 2001 that before 2001 B was not allowed to go below 40% of R. Where the RNR exceeded the FUS rates (eg. Lentils), B for the pre-2001 years was not allowed to exceed 160% of the RNR rates. These arbitrary boundary conditions only applied occasionally to the pre-RNR extrapolations. For extrapolating forward from 2017 to 2021, no boundary conditions were applied.
Integrating Fertilizer Applications over Crop Areas
To get from B to the national N use shown in Figure 3, each Bcp must be integrated over its respective crop area. The national N consumption (F) was calculated annually by multiplying each B by its crop area (A) from each year (y) for each cp case and integrating the set of B and A products over all cp cases, as:
Fy = Ʃcp Bcp,y × Acp,y
The difference between the one size fits all approach and the interpolation process is illustrated in Figure 3 by the six black dots from 1996 to 2006 which overlap the years for which the fixed (black) RNR line applies. The vertical difference between these dots and the RNR baseline approximates the amount N fertilizer that is accounted for by the RNR-FUS interpolations (blue) curve. The change in F over ∆Y for each cp is the alternative to one size fits all indexing either the RNR or FUS data directly to N fertilizer sales records.
Secondary Trend Line Corrections
The interpolated rates still required a partial one size fits all correction in order to fully simulate the fertilizer sales. This secondary correction to B (B') used the ratio of the fertilizer sales data (I) to F, with each ratio being specific to each year. Equation 9 was then recalculated with the set of corrected B. The new set of B (B') was generated as follows:
B'cp,y = (Iy/Fy) × Bcp,y
To understand the secondary correction, consider 2006, the census year with the biggest sales-interpolations difference. This illustration assumes that the dots extending from the 2017 FUS baseline to the 2006 N sales in Figure 3 represent the totally uncorrected fertilizer use based solely on the FUS. The gap between the dots and 2006 N sales (red) also represents the total required correction to the FUS for 2006. Instead of correcting the FUS N total by 0.97 MtN (in the absence of the interpolations), the secondary correction for 2006 (between the blue to red lines) would only require a 0.38 MtN reduction.
The interpolation for 2006 only reduced the necessary one size fits all correction to 63% of the required correction without the interpolation. However, for most of the 32 years in Figure 3 the required secondary correction was much smaller. Because the curve for the secondary correction would be exactly the same as the sales curve, that curve is not shown in Figure 3. Instead, the red sales curve in Figure 3 represents both the N sales data and the secondarily corrected RNR-FUS interpolations.
Regional Demonstration of the Interpolation Process
Although Figure 3 presented the interpolation process on a national scale over all crops, the actual calculations were done provincially for each crop, which matches the operating scale of the Field Print Calculator model (Buttenham, 2019; Serecon, 2023). It is useful to examine the Canadian N fertilizer industry on a semi-national basis, given the distinct agro-climatic and farming system differences between Eastern and Western Canada (Dyer et al., 2011).
Figure 4 gives the interpolations and the sales records of N fertilizer for both the east and the west over the same time series as Figure 3. The two N sales curves in Figure 4 are shown by dashed red lines and the two interpolated curves are shown by solid blue lines. As in Figure 3, the red curves also represent the secondary correction of the interpolations. Also shown in Figure 4 are two flat black lines from 1996 to 2001, the RNR baseline. Because the N use changes in Figure 3 and Figure 4 were integrated over their respective SM crop areas, these graphs do not differentiate the impacts of N application rate changes from land use changes.
To isolate the impact of land use change, Figure 5 shows the possible changes in total N fertilizer use when the N application rates are fixed at the 2001 baseline RNR. As in Figure 4, Figure 5 shows an east-west breakdown of N fertilizer use, as well as the simulated national weight of N fertilizer use (as in Figure 3). Figure 5 focusses on just the truly interpolative years (2001 to 2017) of Figure 3 and Figure 4 between RNR and FUS. The Eastern Canada curve is green, the Western Canada curve is yellow and the Canada curve is blue. The N fertilizer weights associated with the RNR rates for east, west and Canada are indicated by the short dotted black bars at 2000 and 2001 at the start of each curve. These three baseline bars in Figure 5 equate to the east and west RNR bars in Figure 4 and the RNR bar in Figure 3, respectively.
Results
Figure 1: Except for the two cases for Lentils, the RNR were all below their respective Mn rates derived from the FUS histograms. The RNR (grey) line intersects the lower (white) parts of the CI bars in almost all of the cp cases in the west. The RNR for Canola, all three wheats, Oats in Manitoba and Saskatchewan, and Sunflower were all below their respective CIs. Oats in Alberta only marginally intersected its lower CI. Flaxseed in Manitoba had an RNR value well within its CI, while the RNR for Manitoba Sunflower seed was only just into its CI. In contrast, the RNR for Grain corn were all well within their respective CIs, including Manitoba. The RNR for the perennial forage crop in Ontario was just within its CI, whereas the RNR for Quebec Forage (with a slightly smaller CI than Ontario) was well below its CI. Winter wheat in Ontario was well below its CI. But due to its inadequate sample size, Winter wheat in Quebec was not included in Figure 1. For most of the crops in Figure 1 the widths of grey bars compared to the white bars were quite consistent. The exceptions included the two pulses (which require very little N fertilizer), Flaxseed (a minor crop with only one histogram) and forages.
Table 1: The FUS/RNR ratios for Barley were quite similar to the FUS/RNR ratios for the three wheat crops, except for winter wheat in Quebec. N rate recommendations for Chick peas and Dry beans have substantially increased since the RNR. As well as having quite low application rates, Ontario Soybeans did not show any substantial change since 2001. The RNR for Winter wheat in Quebec was inexplicably high (hence, deemed unreliable), whereas the RNR for this crop in Ontario behaved similarly to Barley and the other two wheats relative to the RNRs. Table 1 also provided some guidance for the crops without any MD estimates and excluded from Figure 1. MD/Mn ratios that can be computed from Table 1 reflect the relative CI widths described for Figure 1. When the exceptional cases noted for Figure 1 were excluded, the range among the MD/Mn ratios in Table 1 was from 19% to 36%, resulting in a Relative Standard Deviation for MD/Mn of 21%.
Figure 2: In Sub-figures B and C there is a close fit between the FUS and N sales for most years. This was because in Manitoba (Sub-figure B) and Saskatchewan (Sub-figure C) Canola is the dominant land user. In Alberta Canola is less dominant, which is reflected by the poor agreement in Sub-figure D. For Grain corn in Sub-figure A there was a moderately good agreement between the FUS and the N sales. The N sales and FUS N curves in Sub-figures A, B and C all appear to have similar slopes, which suggests that three of the four 8-year cp cases in the FUS captured a portion of the increase in N use between the RNR and the FUS. Sub-figure D, however, illustrates the potential for error when extrapolating crop-specific N use based on the one size fits all N sales trend. The moderate slopes apparent in all four sub-figures was also justification for the temporal centralizing of the FUS data by Equations 3 to 5.
Figure 3: The interpolation process was in most need of the secondary correction between 2005 and 2012. The best fit of the interpolated N use curve was (not surprisingly) near the two nodal years (RNR and FUS). Normalizing the set of Mn from the FUS to Ymed (Equation 3) contributed to the close fit, especially after 2015. Figure 3 shows that by 2021 Canadian N fertilizer use has more than doubled since 1990 (1.2 to 2.9 MtN). Figure 3 also shows that the steepest increase in N fertilizer sales was between 2006 and 2014. The weight of N that the cp interpolation process accounted for was demonstrated in Figure 3 by the vertical difference between the RNR black bar and the black dots from 1996 to 2006. This difference indicates a 0.96 MtN increase between 2001 and 2017. The difference over that period for the N sales curve (red) was 0.89 MtN.
Figure 4: The difference in the two pairs of curves over the whole time series in Figure 4 shows that most of the N fertilizer use by 2021 (83%) was in the west. More importantly, 90% of the change in Canada’s N use between 2001 and 2017 (0.80 MtN, red curves) was also in the west. In the east the N sales (red curve) was flat until 2017, while the interpolated N use (blue curve) went down slightly. This would make the 2017 western share of N use change based on interpolation (blue curves) even higher than 90%.
The 0.80 MtN increase in Western Canada (red curve) between the RNR and the FUS accounts for 28% of the 2.9 MtN that was sold to Canadian farmers in 2020 (Figure 3), the threshold year for Canada’s N-related GHG reduction goal (Government of Canada, 2022). In both the east and west the uncorrected interpolation estimates were reasonably close to the N sales curve, particularly after 2013. The decreased rate of change after 2013 in the west is consistent with the modest slopes seen for the FUS years in Figure 2. Whereas in the east the agreement between the interpolations and N sales was consistent from 1990 to 2013, for the west this relationship showed much the same reversal in 2002 as was seen in Figure 3.
Figure 5: All three curves in Figure 5 were much flatter than the curves in Figure 3 and Figure 4. In the east (green curve), Figure 5 held steady from the 2001 RNR baseline rate, dropping by only 0.09 MtN by 2017, but decreased slightly faster after 2012. This decline closely mimics the eastern blue curve in Figure 4. But the Eastern N sales (red) curve in Figure 4 increased slightly after 2016. Thus, the impact of changes in N fertilizer application rates is almost non-existent in Eastern Canada. However, Figure 5 showed a modest increase in the west (yellow) which peaked at 2012. This change was only 0.20 MtN since 2001. By 2017 this change had decreased to 0.15 MtN. The N rate increases attributable to crop area changes were only 16% and 12% of the overall increase in N use in the west for 2012 and 2021, respectively.
The 0.80 MtN change in the western N sales curve (Figure 4, upper red) was an increase of 61% by 2017 over 2001. With the 12% impact of crop area changes in the west (figure 5), this 61% change is reduced to the portion attributed to just the increased N application rate. With this adjustment for crop areas, the western RNR-FUS increase by 2017 over 2001 is 49%. The western RNR-FUS change due solely to increased N application rates, and after the secondary correction was reduced to 0.61 MtN. With this adjustment, the 28% of the total 2.9 MtN of sales in Canada in 2020, is down to just 23%.
Discussion
Figure 3 and Figure 4 revealed a Crop Specific N use Interpolations (CSNI) model. Rather than treating the FUS rates as replacements for the RNR rates, the real value of the FUS was to use it in conjunction with the RNR to interpolate N use in any other year. The CSNI model limited reliance on the one size fits all indexing to N sales to just the secondary correction (Equation 10). The advantage of CSNI over total reliance on one size fits all is that each cp time series of N application rates has its own trend line. The one size fits all approach can introduce significant errors in many crops. Crops for which N rates changed very little, too much N would be added, whereas crops for which N rates underwent a big increase would not be assigned enough increase in N use.
The CSNI model’s sensitivity to crop diversity has implications for Canada’s agricultural GHG emissions budget. This sensitivity involves the fossil energy for fertilizer manufacture (Dyer and Desjardins, 2009) and chemical fertilizer N2O emissions (Janzen et al., 2006; Dyer et al., 2018). With food production systems typically having unique crop complexes (Dyer et al., 2011), crop-related N use differences can, in turn, have appreciable impacts on commodity GHG budget comparisons. Although the uncorrected F (Equation 9) did not provide a perfect fit to the sales curves, it ran in close parallel with N sales curve over most years. With the secondary correction, the CSNI model fits the sales data exactly, while still capturing the crop-specific changes. For most applications the CSNI model must include the secondary correction. This close agreement with N sales data (Figure 3 and Figure 4) also suggests that the selected 21 SM crops for this analysis adequately accounted for Canada’s agronomic land base.
The close relationship shown nationally in Figure 3 mostly holds true on an east-west basis (Figure 4), especially in the west. The close relationship of the 1996 to 2001 sales data with the RNR, as stated by Yang et al (2006), appears to involve an error compensation, with the N sales curve in the east being below the black RNR bar and above the black RNR bar in the west. However, these differences are small compared to the change in N rates between 2001 and 2017, and over the entire 1990-2021 period. Figure 4 also illustrates (by both the sales and interpolations curves) that almost all of the growth in fertilizers use in Canada has taken place in the west.
The dramatic east-west difference in slopes in both the interpolated and sales curves in Figure 4 is supported by the crop-specific differences in Figure 1. With nearly all of the cp cases with RNR rates below their respective CIs also being in the west, the steepness of the two western curves in Figure 4 was to be expected. Additionally, most of these wide RNR to FUS differences were for the most economically important crops in the west. Conversely in Figure 1, the closeness of the FUS mean and RNR for Grain corn and Soybean, the most economically important crops in the east, explains the flatness of the two eastern curves in Figure 4. This correlation between Figure 1 and Figure 4 further demonstrates the effectiveness of the CSNI model.
Figure 5 clarified the overwhelming impact that per-crop N application rate increases had on N use compared to land use changes among crops. The uncorrected N application rate interpolations (Equation 9) were close to linear from 2001 to 2017. However, the slight upward bend at 2012 in both blue curves in Figure 4 could be related to the slight upward distortions in the green and yellow curves in Figure 5, since Equation 9 is sensitive to crop area integrations.
This analysis benefited from the timing of the RNR when fertilizer use was stable (the flattest five years in Figure 3). While N application rate data between 2002 and 2012 would have benefited this analysis, the timing of the FUS, which required eight years, was also fortuitous. While not flat, the N sales slope was similar to the average slope of the CSNI trend line in Figure 3. So the impact of the changing rates (slopes) visible for the four 8-year cp cases (Figure 2) were much more modest than they would have been if the recording of these N use data had started ten years earlier.
Only one useable data point was available from the FUS for each cp case, regardless of how many years of survey contributed to that case. Similarly, the RNR is restricted to a single temporal data point. Therefore, the question remains as to why in Figure 3 (red curve) the national fertilizer sales levelled off between 2002 and 2006. Since Figure 5 suggests that crop area change is not an explanation, a supply issue, such as N fertilizer price might better explain the dip in the S curves.
Nevertheless, except for the 2002 to 2011 dip in N sales, the uncorrected CSNI model was a reasonable first approximation of the N sales curve, given that it was derived independently from those national sales data and that there was no data comparable to either the FUS or the RNR in that 2002 to 2011 gap. Although the RNR to FUS application rate changes in the west were only 23% of the total Canadian N consumption in 2020, that 23% shift in the west equates to 77% of Canada’s goal of reducing GHG emissions from fertilizer use by 30% (Government of Canada, 2022; NFU, 2022).
Conclusions
Most of the increased N use in Canada is linked to a few economically important crops in the west, whereas land use changes among the major crops is far less important. While there were wide CIs around the crop-specific N use rates in the FUS, most of these increases since the 2001 appear to be significant (at least by the non-parametric assessment in Figure 1). Combined with the secondary correction, the CSNI model is well suited to both historical and predictive N fertilizer applications. Figure 3 and Figure 4 suggest that, even without the secondary correction, the interpolation process would still be a reasonably accurate N use model in Canada if no N sales data were available. With the secondary correction, it is a definite improvement on the decades of N use estimates based solely on one size fits all indexing crop-specific N use to fertilizer sales data.
Although there were considerable extrapolations in this analysis, mainly from the crops covered in the FUS to the crops that were not covered, the FUS was surprisingly representative of the eight years of N sales records surrounding 2017. Conversely, the RNR rates were based on information gleaned from provincial agricultural extension publications and from soil and crop advisers (Yang et al., 2006). But (as shown by Figure 3 and Figure 4), they still adequately represent the 1996-2001 period, as claimed by the RNR authors. Seen in this light, the FUS should not be viewed as a replacement for the RNR: each was shown to be valid for the periods in which they were derived. Similarly, while the FUS rates represent current N use rates, the FUS should not be taken as recommendations or guidelines for current crop production.
The CSNI approach, instead of one size fits all, identified the crops where the greatest attention to changing N application rates is most warranted. However, since they include two economically important export crops, this approach could prove to be a major policy challenge. In spite of being the heaviest user of N fertilizer of all the FUS crops, Grain corn (at least from 2001 onward) did not contribute appreciably to the national N use increase over the last three decades.
The RNR suggests that N use in Canada should be well below the FUS rates. As shown above, a 23% reduction in just the actual per-crop N application rates in the west could theoretically achieve 77% of the Canada’s N fertilizer-related GHG emissions target (Government of Canada, 2022; NFU, 2022). Caution is needed, though, that this is likely not possible without at least some corresponding declines in crop yields. However, while improved fertilizer management (Fertilizer Canada, 2022) represents the essential alternative, this analysis identified where and for what crops these improvements might be most effective.
The final consideration in this paper is for the next step. The follow-up need is to determine what the Canadian food production system has been getting from the increased N applications. Are crop yields going up? If so, are such yield increases driven by the increase in N fertilizer use? Is the increased N use a consequence (or necessity) of higher yielding varieties? While arguably some statistics are available to examine this correlation, it was enough beyond the scope of this paper that new studies of the N use-productivity interactions are needed.
Author Contributions
Conceptualization, J.A.D. and A.P.; methodology, J.A.D.; formal analysis, J.A.D.; resources, A.P. and R.L.D.; writing—original draft preparation, J.A.D.; writing—review and editing, R.L.D.; funding acquisition, A.P. and R.L.D.
Acknowledgements
The authors acknowledge the support of Serecon Inc. for funding the analysis described in this paper and to Fertilizer Canada and Serecon Inc. for providing access to the Fertilizer Use Survey histograms. We are grateful to Devon Worth, Science and Technology Branch, AAFC, for making the national records of fertilizer shipments available for this analysis and for reviewing an early draft of this paper. We acknowledge the Science and Technology Branch, AAFC, for their ongoing support and encouragement for this work and for funding much of the background work under the Sustainability Metrics leading up to this project.
Appendix 1
the content.
References
- AAFC, 2016. Annual Crop Inventory. Government of Canada, Agriculture and Agri-Food Canada (AAFC), Science and Technology Branch. Ottawa, Canada. https://open.canada.ca/data/en/dataset/ba2645d5-4458-414d-b196-6303ac06c1c9.
- Arkin, H. and R.C. Colton, 1967. Statistical Methods as Applied to Economics, Business, Psychology, Education and Biology. 4th edition. LCCCN: 55-8987. 273 pp.
- Brune, D., S.C. Killpack and D. Buchholz. 2002. Nitrogen in the Environment: How Nitrogen Enters Groundwater. Univ. Missouri Extension Factsheet. https://extension.missouri.edu/publications/wq256.
- Buttenham, Michael, 2019. Canadian Field Print Initiative. Ontario Grain Farmer Magazine, April, 2019. https://ontariograinfarmer.ca/2019/04/01/canadian-field-print-initiative/.
- Dyer, J.A. and R.L. Desjardins, 2009. A review and evaluation of fossil energy and carbon dioxide emissions in Canadian agriculture. Journal of Sustainable Agriculture. 33(2):210-228. [CrossRef]
- Dyer, J.A., X.P.C. Vergé, S.N. Kulshreshtha, R.L. Desjardins, and B.G. McConkey, 2011. Areas and greenhouse gas emissions from feed crops not used in Canadian livestock production in 2001. Journal of Sustainable Agriculture 35(7):780-803. [CrossRef]
- Dyer, J.A., X.P.C. Vergé, R.L. Desjardins and D.E. Worth, 2018. District Scale GHG Emission Indicators for Canadian Field Crop and Livestock Production. Agronomy 2018, 8(9), 190. [CrossRef]
- Erisman, J., M. Sutton, J. Galloway, Z. Klimont and W. Winiwarter, 2008. How a century of ammonia synthesis changed the world. Nature Geosci. 1: 636–639. [CrossRef]
- Fertilizer Canada, 2022. A summary of the fertilizer use survey conducted from 2014 to 2021: 4R Nutrient Stewardship, Grower Adoption across Canada.
- https://fertilizercanada.ca/wp-content/uploads/2022/08/SPARK-FERTILIZER-USE-IN-CANADA-REPORT-2022-VF_08_04_2022.pdf.
- Government of Canada, 2022. Discussion document: Reducing emissions arising from the application of fertilizer in Canada's agriculture sector. https://agriculture.canada.ca/en/department/transparency/public-opinion-research-consultations/share-ideas-fertilizer-emissions-reduction-target/discussion. Accessed 9 May 2024.
- Huffman,T., R. Ogston, T. Fisette, B. Daneshfar, P-Y. Gasser, L. White, M. Maloley, and R. Chenier, 2006. Canadian agricultural land-use and land management data for Kyoto reporting. Can. J. Soil Sci. 86: 431–439.
- Janzen, H.H., D.A. Angers, M. Boehm, M. Bolinder, R.L. Desjardins, J. Dyer, B.H. Ellert, D.J. Gibb, E.G. Gregorich, B.L. Helgason, R. Lemke, D. Massé, S.M. McGinn, T.A. McAllister, N. Newlands, E. Pattey, P. Rochette, W. Smith, A.J. Vanden Bygaart, and H. Wang, 2006. A proposed approach to estimate and reduce net greenhouse gas emissions from whole farms. Canadian Journal of Soil Science. 86(3): 401-418.
- Karimi, R., S.J. Pogue, R. Kröbel, K.A. Beauchemin, T. Schwinghamer, H.H. Janzen, 2020. An updated nitrogen budget for Canadian agroecosystems. Agriculture, Ecosystems & Environment. 304. 107046. [CrossRef]
- MacDonald, K.B., 2000. Risk of water contamination by nitrogen. Pages 117–123 in McRae et al., eds. Environmental sustainability of Canadian agriculture: Report of the Agri-Environmental Indicator Project, Agriculture and Agri-Food Canada, Ottawa, ON.
- Manitoba Pulse and Soybean Growers. n.d. Crop Nutrition Factsheet. https://www.manitobapulse.ca/production/dry-bean-production/crop-nutrition/#:~:text=The%20majority%20of%20dry%20bean,about%2090%20lbs%20N%2Fac.
- McConkey, B., D. Lee, T. Martin, D. Cerkowniak, A. Thiagarajan, L. Lenton, T. Jamieson, 2017. AAFC Sustainability Metrics Project. Agriculture and Agri-food Canada. https://sustainablecrops.ca/images/pdf/AAFC_SustainabilityMetricsProject_NOV23_2107.pdf.
- NFU, 2022. Agricultural Greenhouse Gas Emissions in Canada: A New, Comprehensive Assessment. National Farmers Union (NFU). https://www.nfu.ca/publications/a-new-comprehensive-assessment-ghg-emissions-canada-2022/.
- Philpott, T., 2013. A Brief History of Our Deadly Addiction to Nitrogen Fertilizer. Mother Jones. https://www.motherjones.com/food/2013/04/history-nitrogen-fertilizer-ammonium-nitrate/.
- Pulse Canada, 2011. Application of Sustainable Agriculture Metrics to Selected Western Canadian Field Crops, Final Report. https://www.serecon.ca/public/download/documents/6679.
- Qualman, Darrin, 2019. Tackling the Farm Crisis and the Climate Crisis: A Transformative Strategy for Canadian Farms and Food Systems, discussion document. In collaboration with the National Farmers Union (NFU). 102 pages. Copyright NFU and the author.
- Quinte Conservation, 2014. Drinking water source protection. Factsheet . https://www.quinteconservation.ca/en/watershed-management/resources/Documents/commercial_fertilizer.pdf.
- Roberts, T.L., 1999. The role of fertilizer in growing the world’s food. TopCrop Manager Factsheet. https://www.topcropmanager.com/the-role-of-fertilizer-in-growing-the-worlds-food-10387/.
- Saskatchewan Pulse Growers (n.d.), https://saskpulse.com/growing-pulses/chickpeas/seeding/.
- Serecon, 2023. The Canadian Field Print Calculator. https://fieldtomarket.ca/our-program/fieldprint-calculator/, https://www.serecon.ca/resources/calculator. Accessed 31 March 2023.
- Simpson, S., 2009. Nitrogen Fertilizer: Agricultural Breakthrough-And Environmental Bane. https://www.scientificamerican.com/article/nitrogen-fertilizer-anniversary/.
- Statista, 2024. Global consumption of agricultural fertilizer from 1965 to 2021, by nutrient (in million metric tons). https://www.statista.com/statistics/438967/fertilizer-consumption-globally-by-nutrient/. Accessed 21 May 2024.
- Statistics Canada, 2023. Fertilizer shipments to Canadian agriculture markets, by nutrient content and fertilizer year, Cumulative data (x 1,000) Table: 32-10-0039-01 (formerly CANSIM 001-0069). Release date: 2023-02-21.
- Thakur, N., 2021. Food Security, Safety and Environmental Concerns: Restoring Long-term Agricultural Sustainability. Academia Letters, Article 888. [CrossRef]
- United Nations, 1998. Kyoto Protocol to the United Nations Framework Convention on Climate Change. https://unfccc.int/resource/docs/convkp/kpeng.pdf.
- Vergé, X.P.C., J.A. Dyer, R.L., Desjardins and D. Worth. 2009. Long Term trends in greenhouse gas emissions from the Canadian poultry industry. Journal of Applied Poultry Research 18: 210–222. [CrossRef]
- Vergé, X.P.C., J.A. Dyer, R.L. Desjardins and D. Worth, 2009. Greenhouse gas emissions from the Canadian pork industry. Livestock Science 121:92-101. [CrossRef]
- Vergé, X.P.C., J.A. Dyer, R.L. Desjardins and D. Worth. 2008. Greenhouse gas emissions from the Canadian beef industry. Agricultural Systems 98(2):126–134. [CrossRef]
- Vergé, X.P.C., J.A. Dyer, R.L. Desjardins and D. Worth. 2007. Greenhouse gas emissions from the Canadian dairy industry during 2001. Agricultural Systems 94(3):683-693. [CrossRef]
- Yang, J. Y., R. De Jong, C. F. Drury, E. Huffman, V. Kirkwood, and X. M. Yang, 2006. Development of a Canadian agricultural nitrogen budget model (CANB v2.0): Simulation of the nitrogen indicators and integrated modelling for policy scenarios. Can. J. Soil Sci. 87:153–165.
Figure 1.
Comparing estimates of national N fertilizer use from the Fertilizer Use Survey (FUS) with the Recommended Fertilizer Rates (RNR) from Yang et al. (2006) by crop and province. Abbreviated prefixes for wheats, D, S and W, stand for “Duram”, “Spring” and “Winter”, respectively. The abbreviated prefix, G, for corn stands for “Grain” and “Forages” refers to hay from perennial grass.
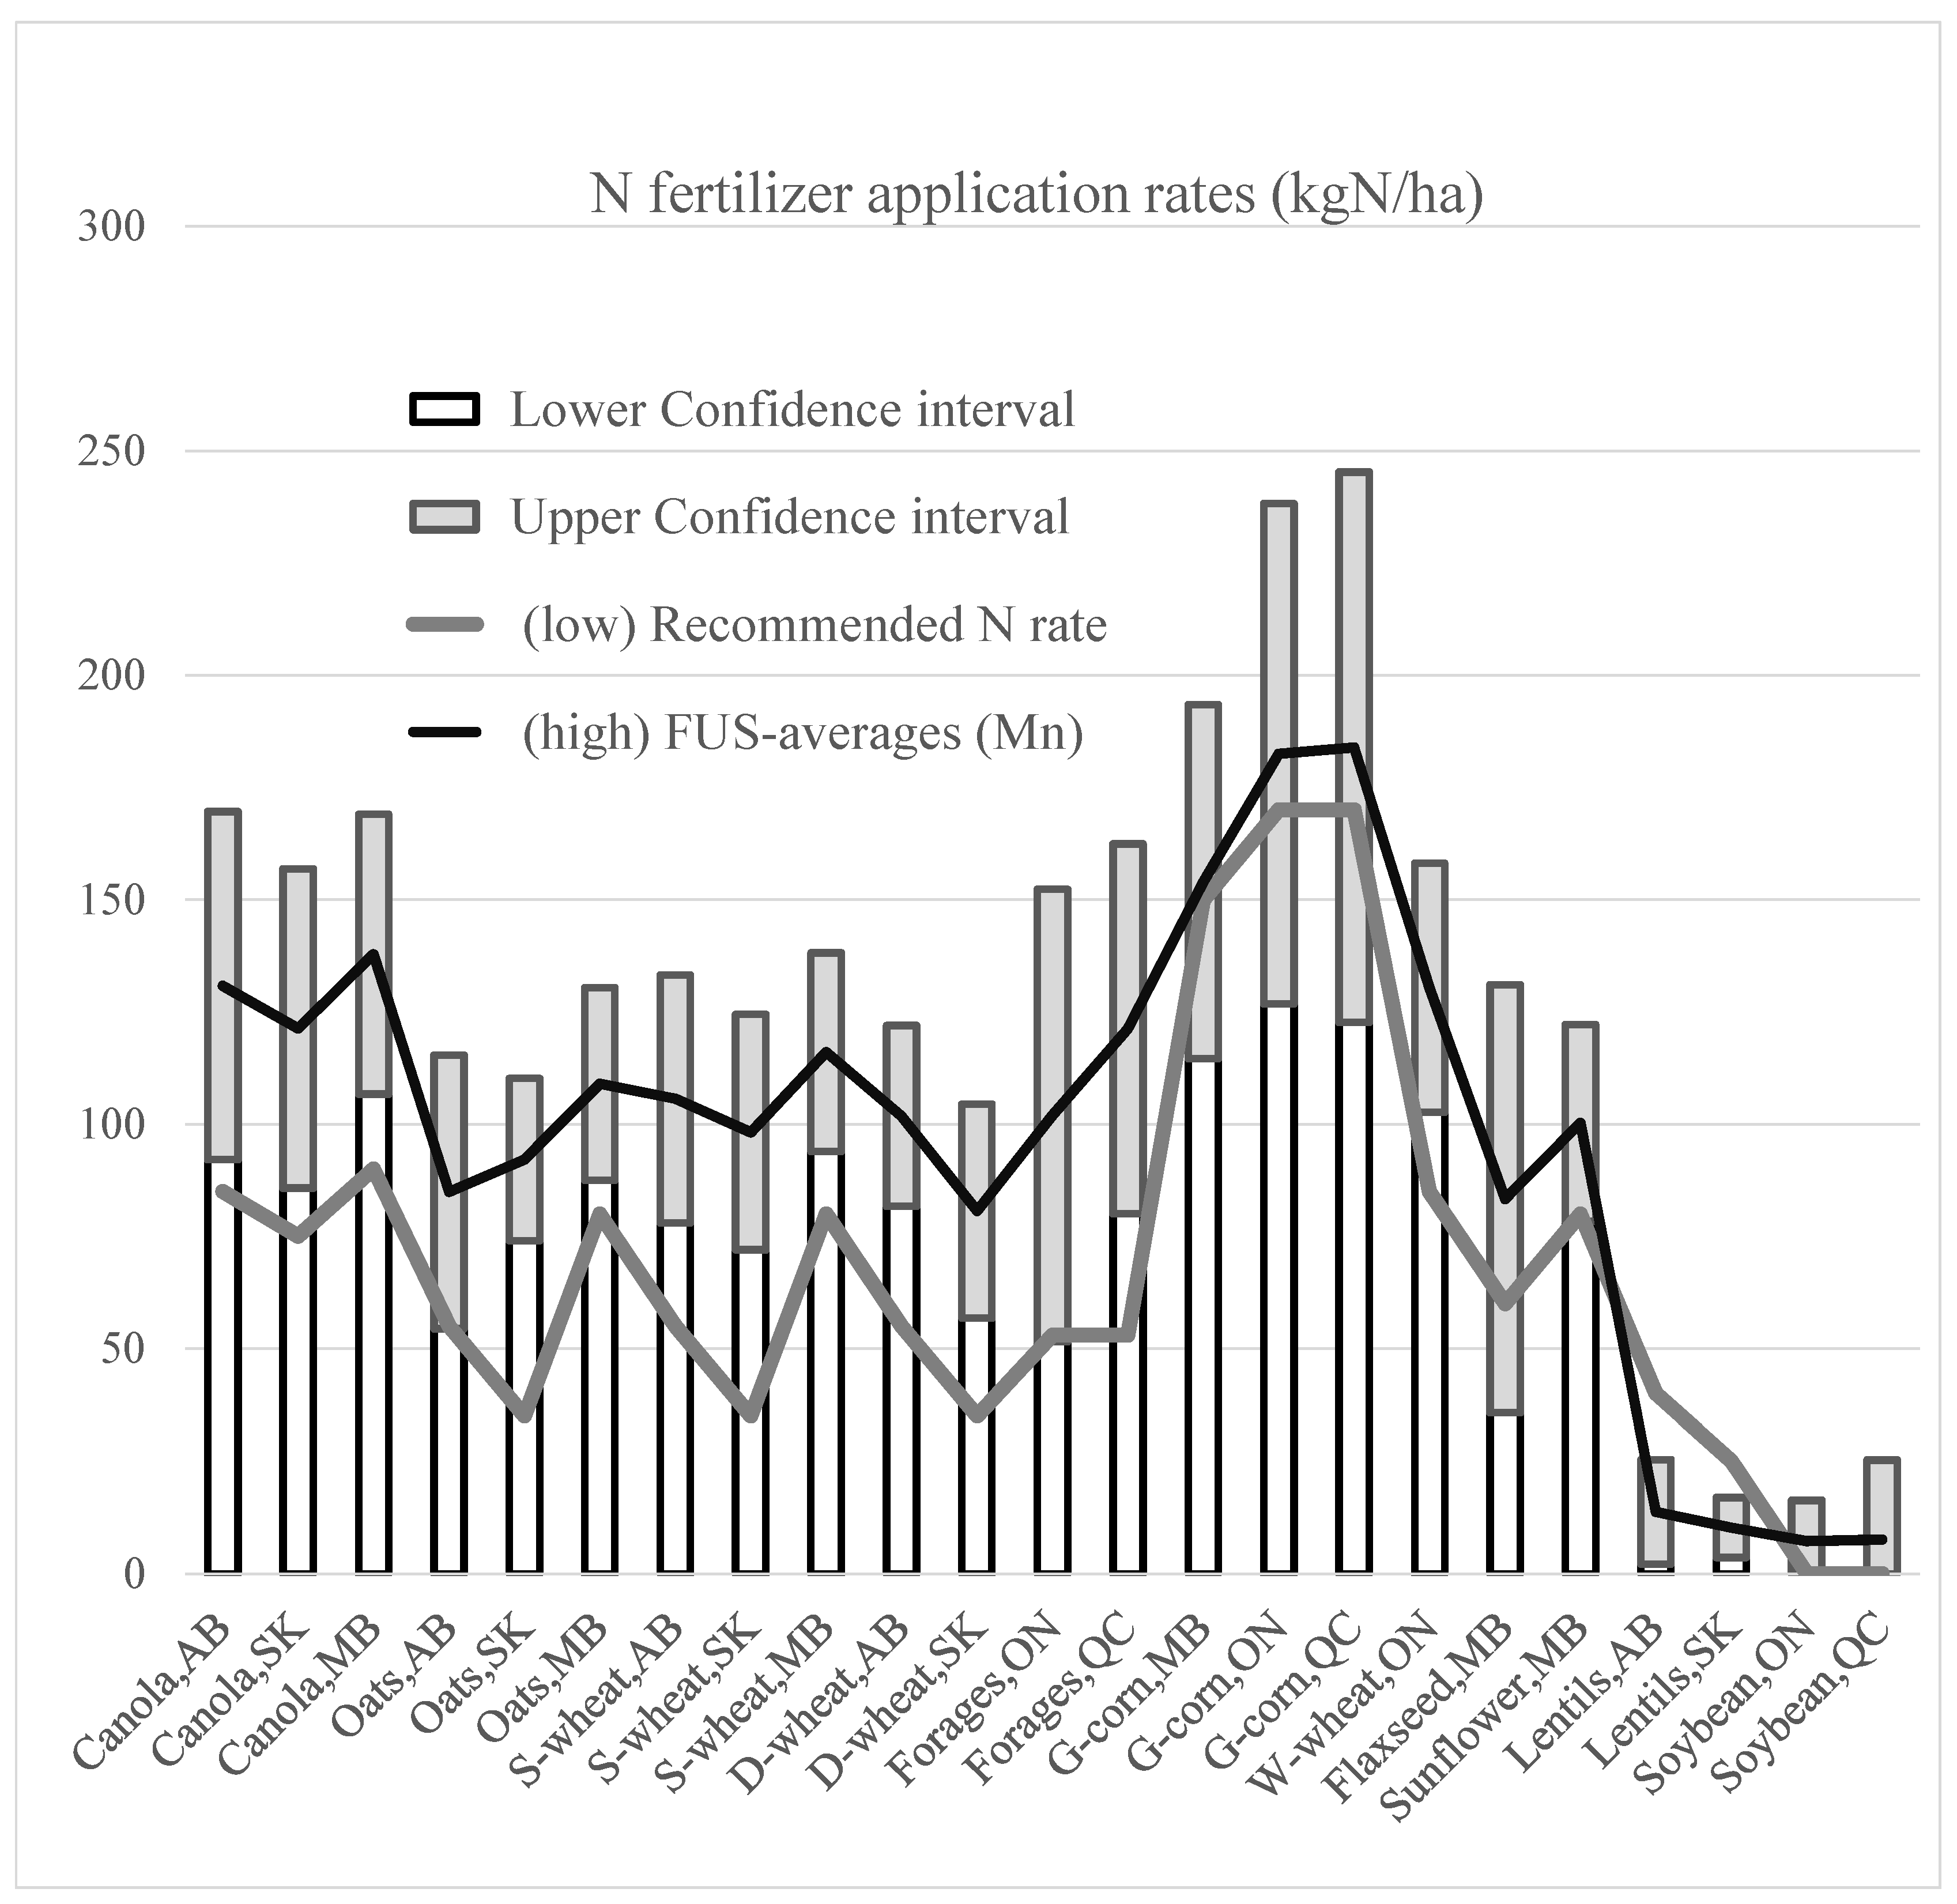
Figure 2.
Plots of N fertilizer use for Grain corn in Ontario (A) and Canola in Manitoba (B), Saskatchewan (C) and Alberta (D) with N fertilizer sales records for these four provinces over the eight years of the Fertilizer Use Survey (FUS), where fertilizer use rates and N sales data were normalised to their respective 8 year averages.
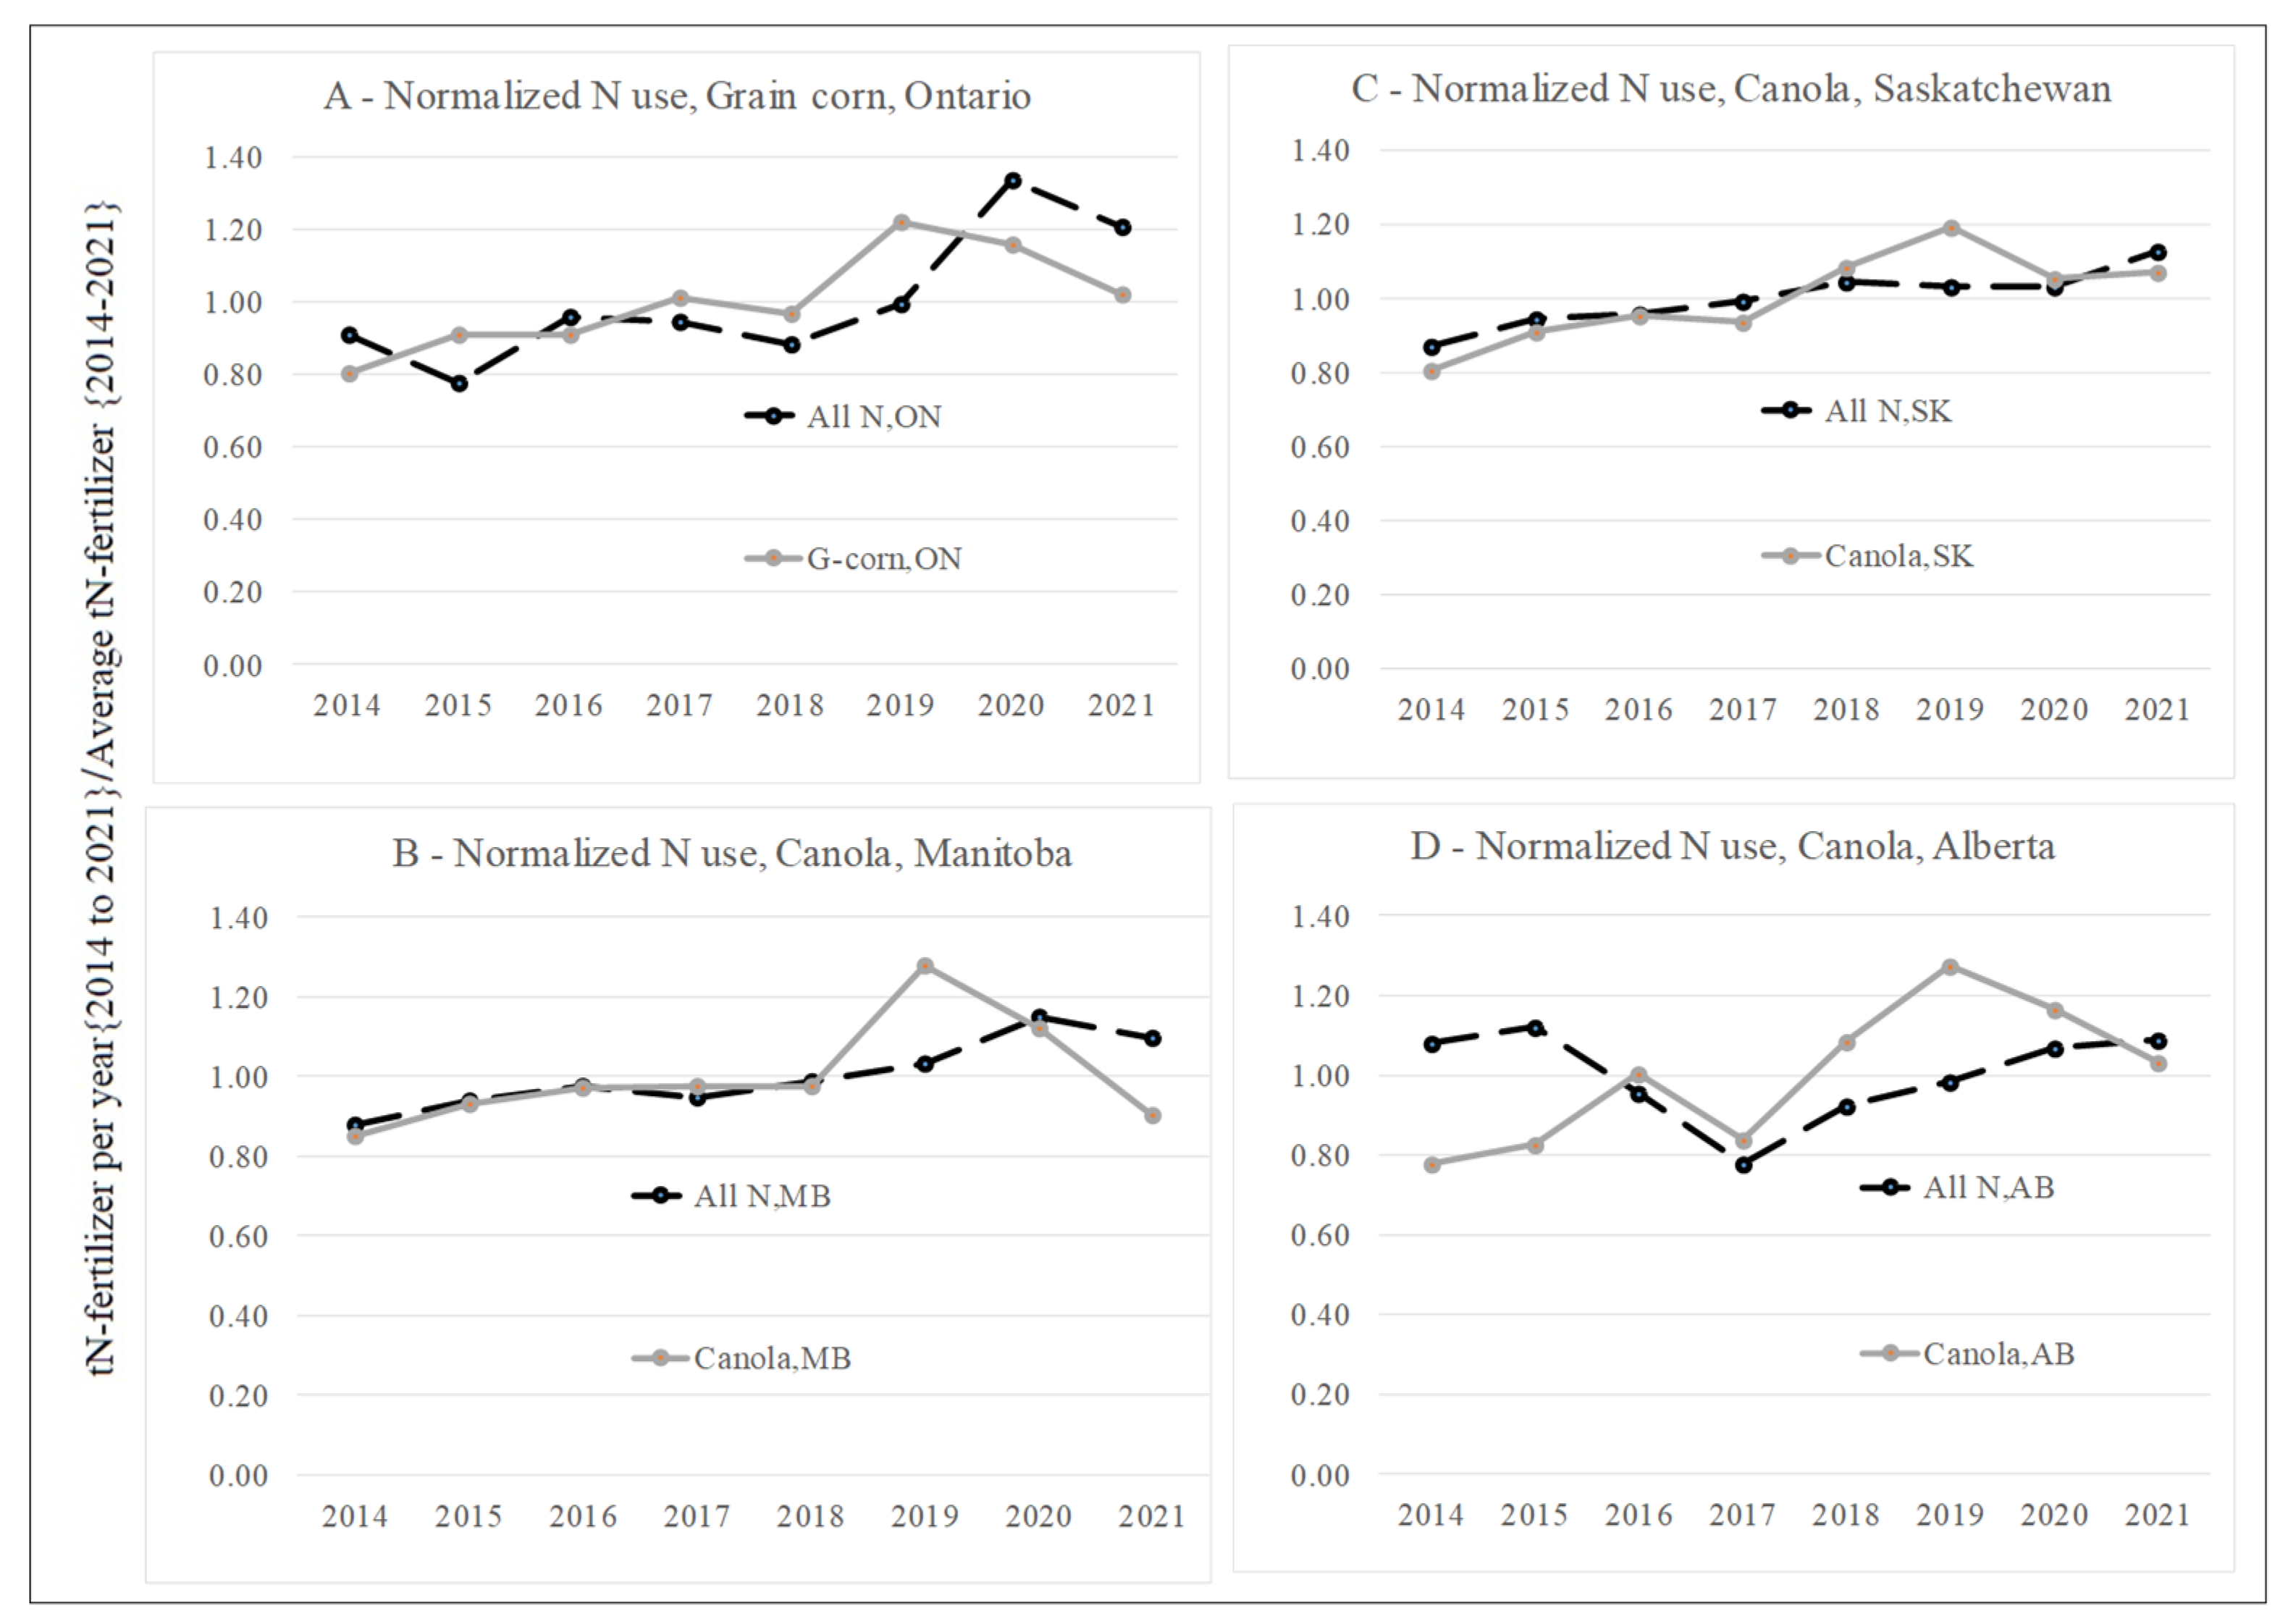
Figure 3.
Time series comparison of N fertilizer use for 21 field crops in Canada estimated from the FUS and RNR (blue) with reported N fertilizer sales in Canada (red) from 1990 to 2021.
Figure 3.
Time series comparison of N fertilizer use for 21 field crops in Canada estimated from the FUS and RNR (blue) with reported N fertilizer sales in Canada (red) from 1990 to 2021.

Figure 4.
Time series comparison of N fertilizer use for SM field crops in Eastern (the lower pair) and Western (the higher pair) Canada estimated from the FUS and RNR (blue) with reported N fertilizer sales (red) in Canada from 1990 to 2021.
Figure 4.
Time series comparison of N fertilizer use for SM field crops in Eastern (the lower pair) and Western (the higher pair) Canada estimated from the FUS and RNR (blue) with reported N fertilizer sales (red) in Canada from 1990 to 2021.
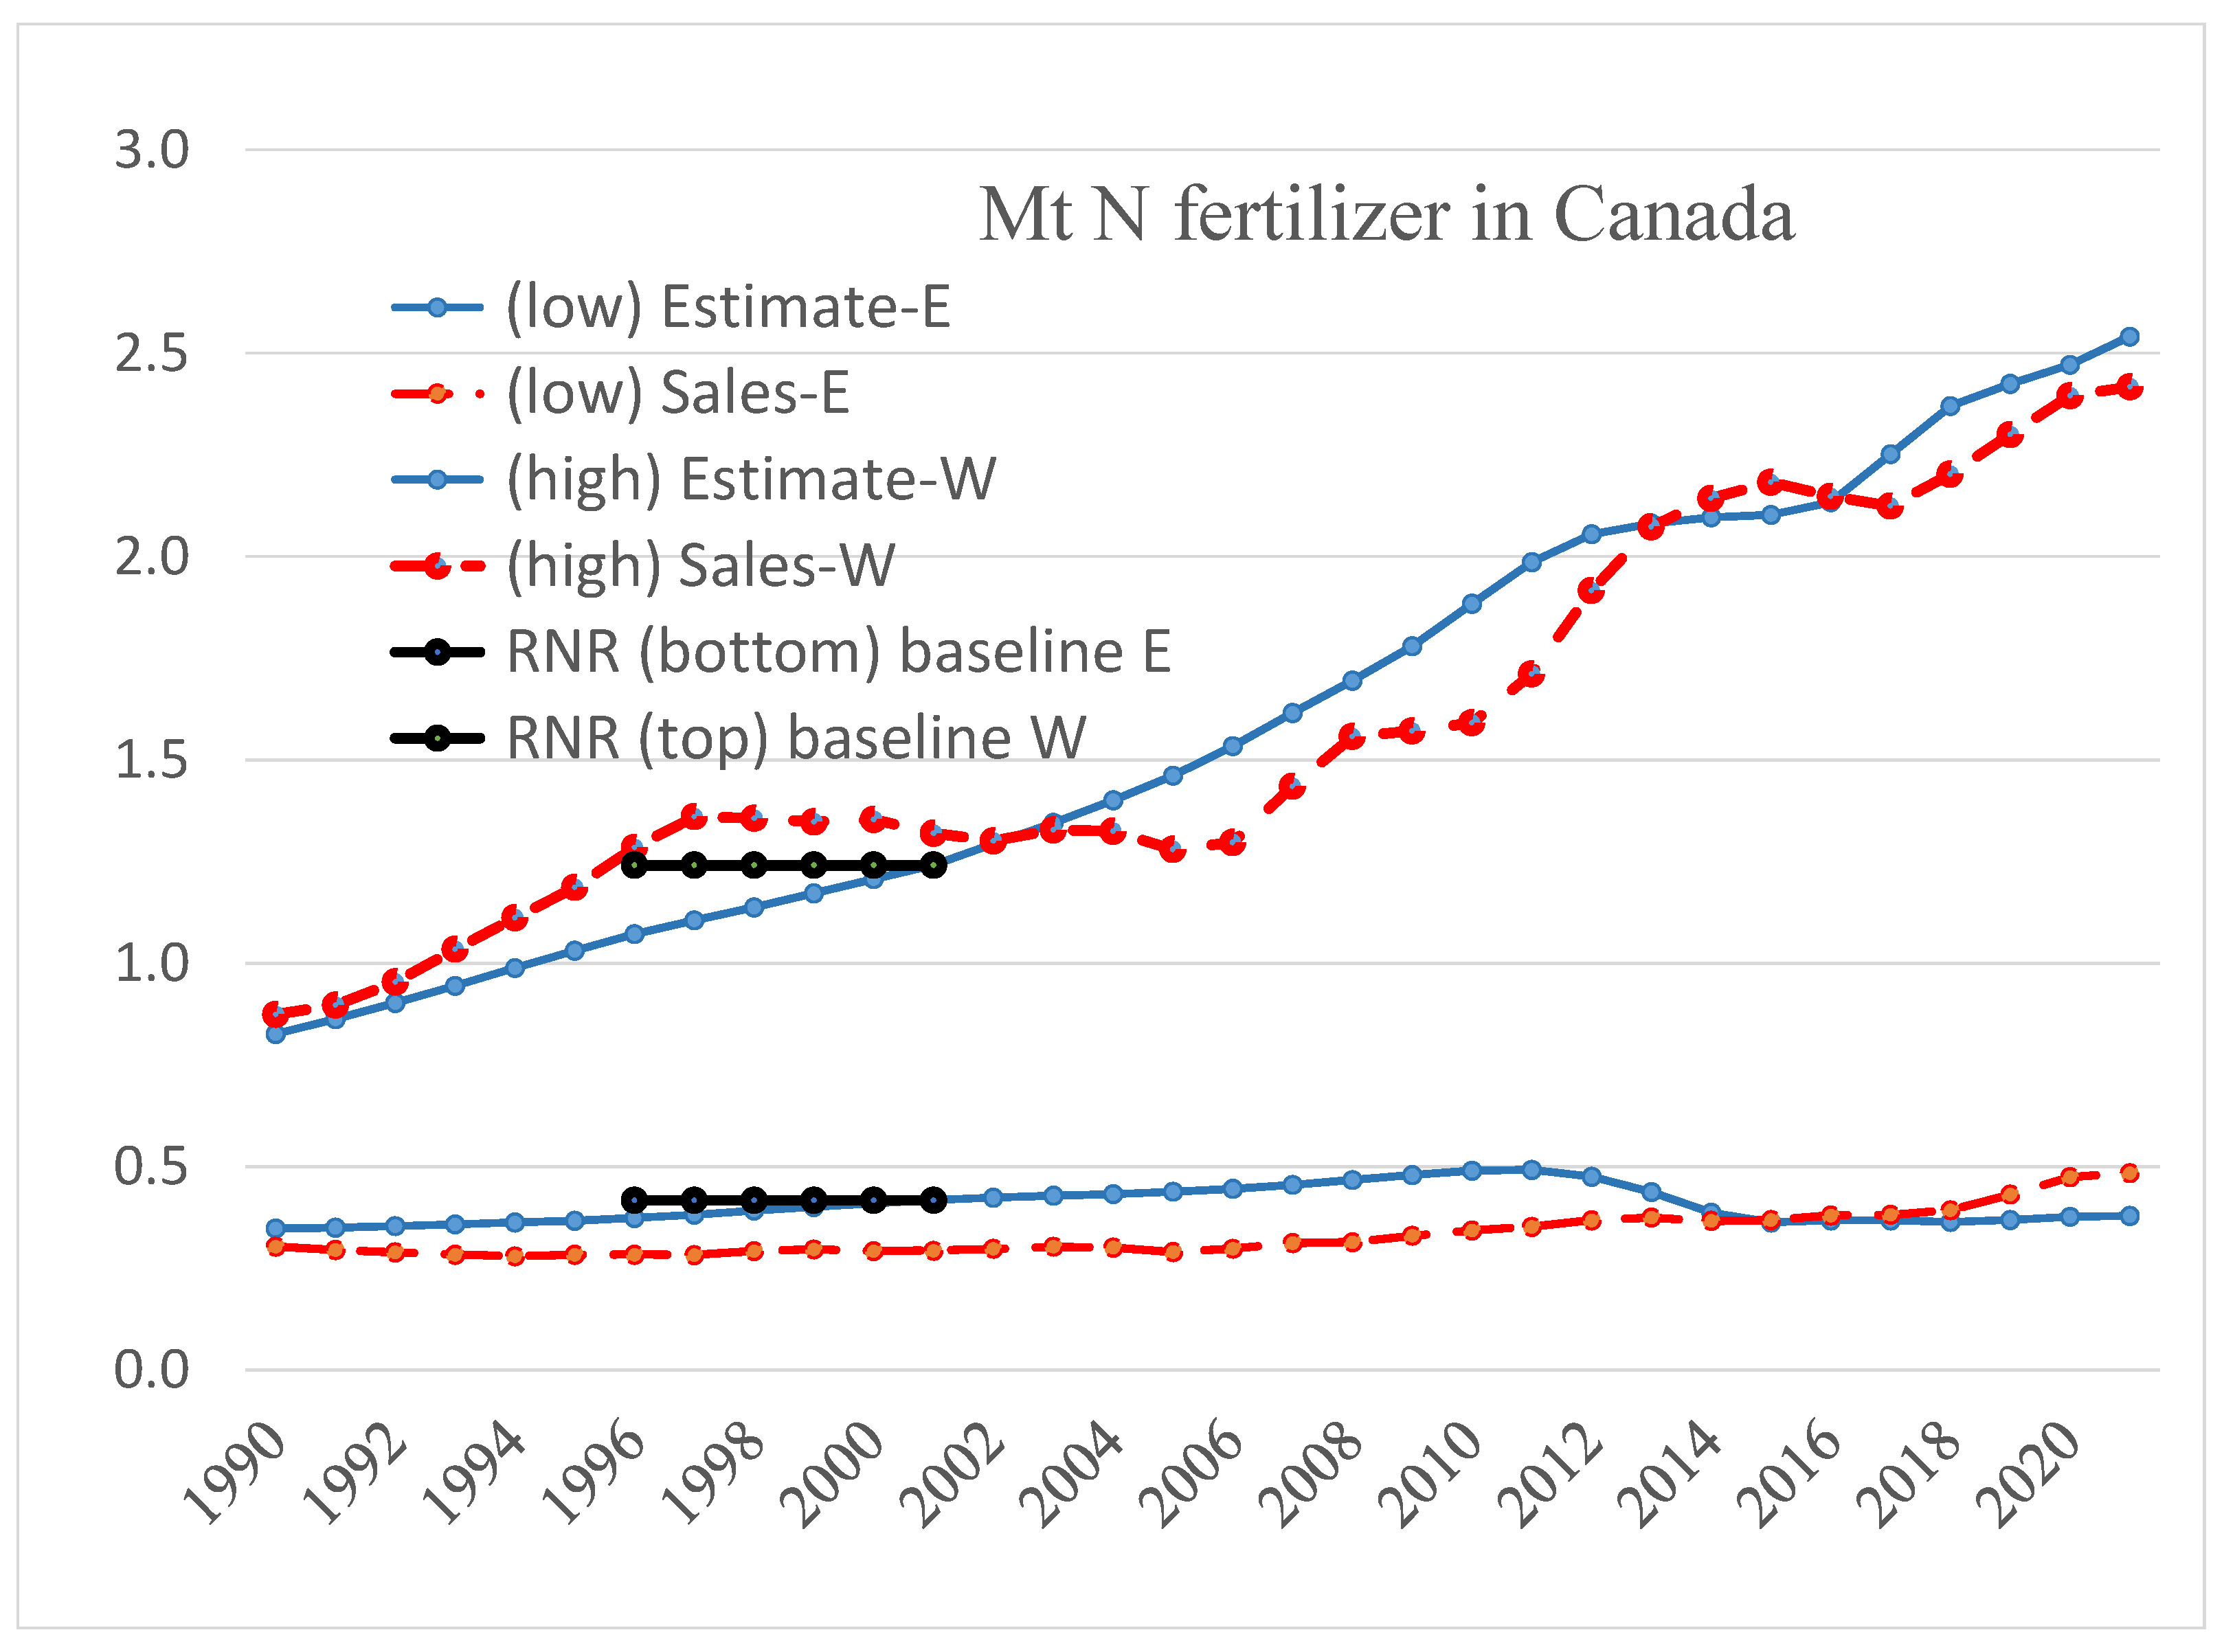
Figure 5.
Theoretical time series of N fertilizer use for 21 field crops in Eastern (green/bottom) and Western (yellow/middle) Canada, and Canada (blue/top) where N application rates are fixed at the 2001 RNR rates.
Figure 5.
Theoretical time series of N fertilizer use for 21 field crops in Eastern (green/bottom) and Western (yellow/middle) Canada, and Canada (blue/top) where N application rates are fixed at the 2001 RNR rates.
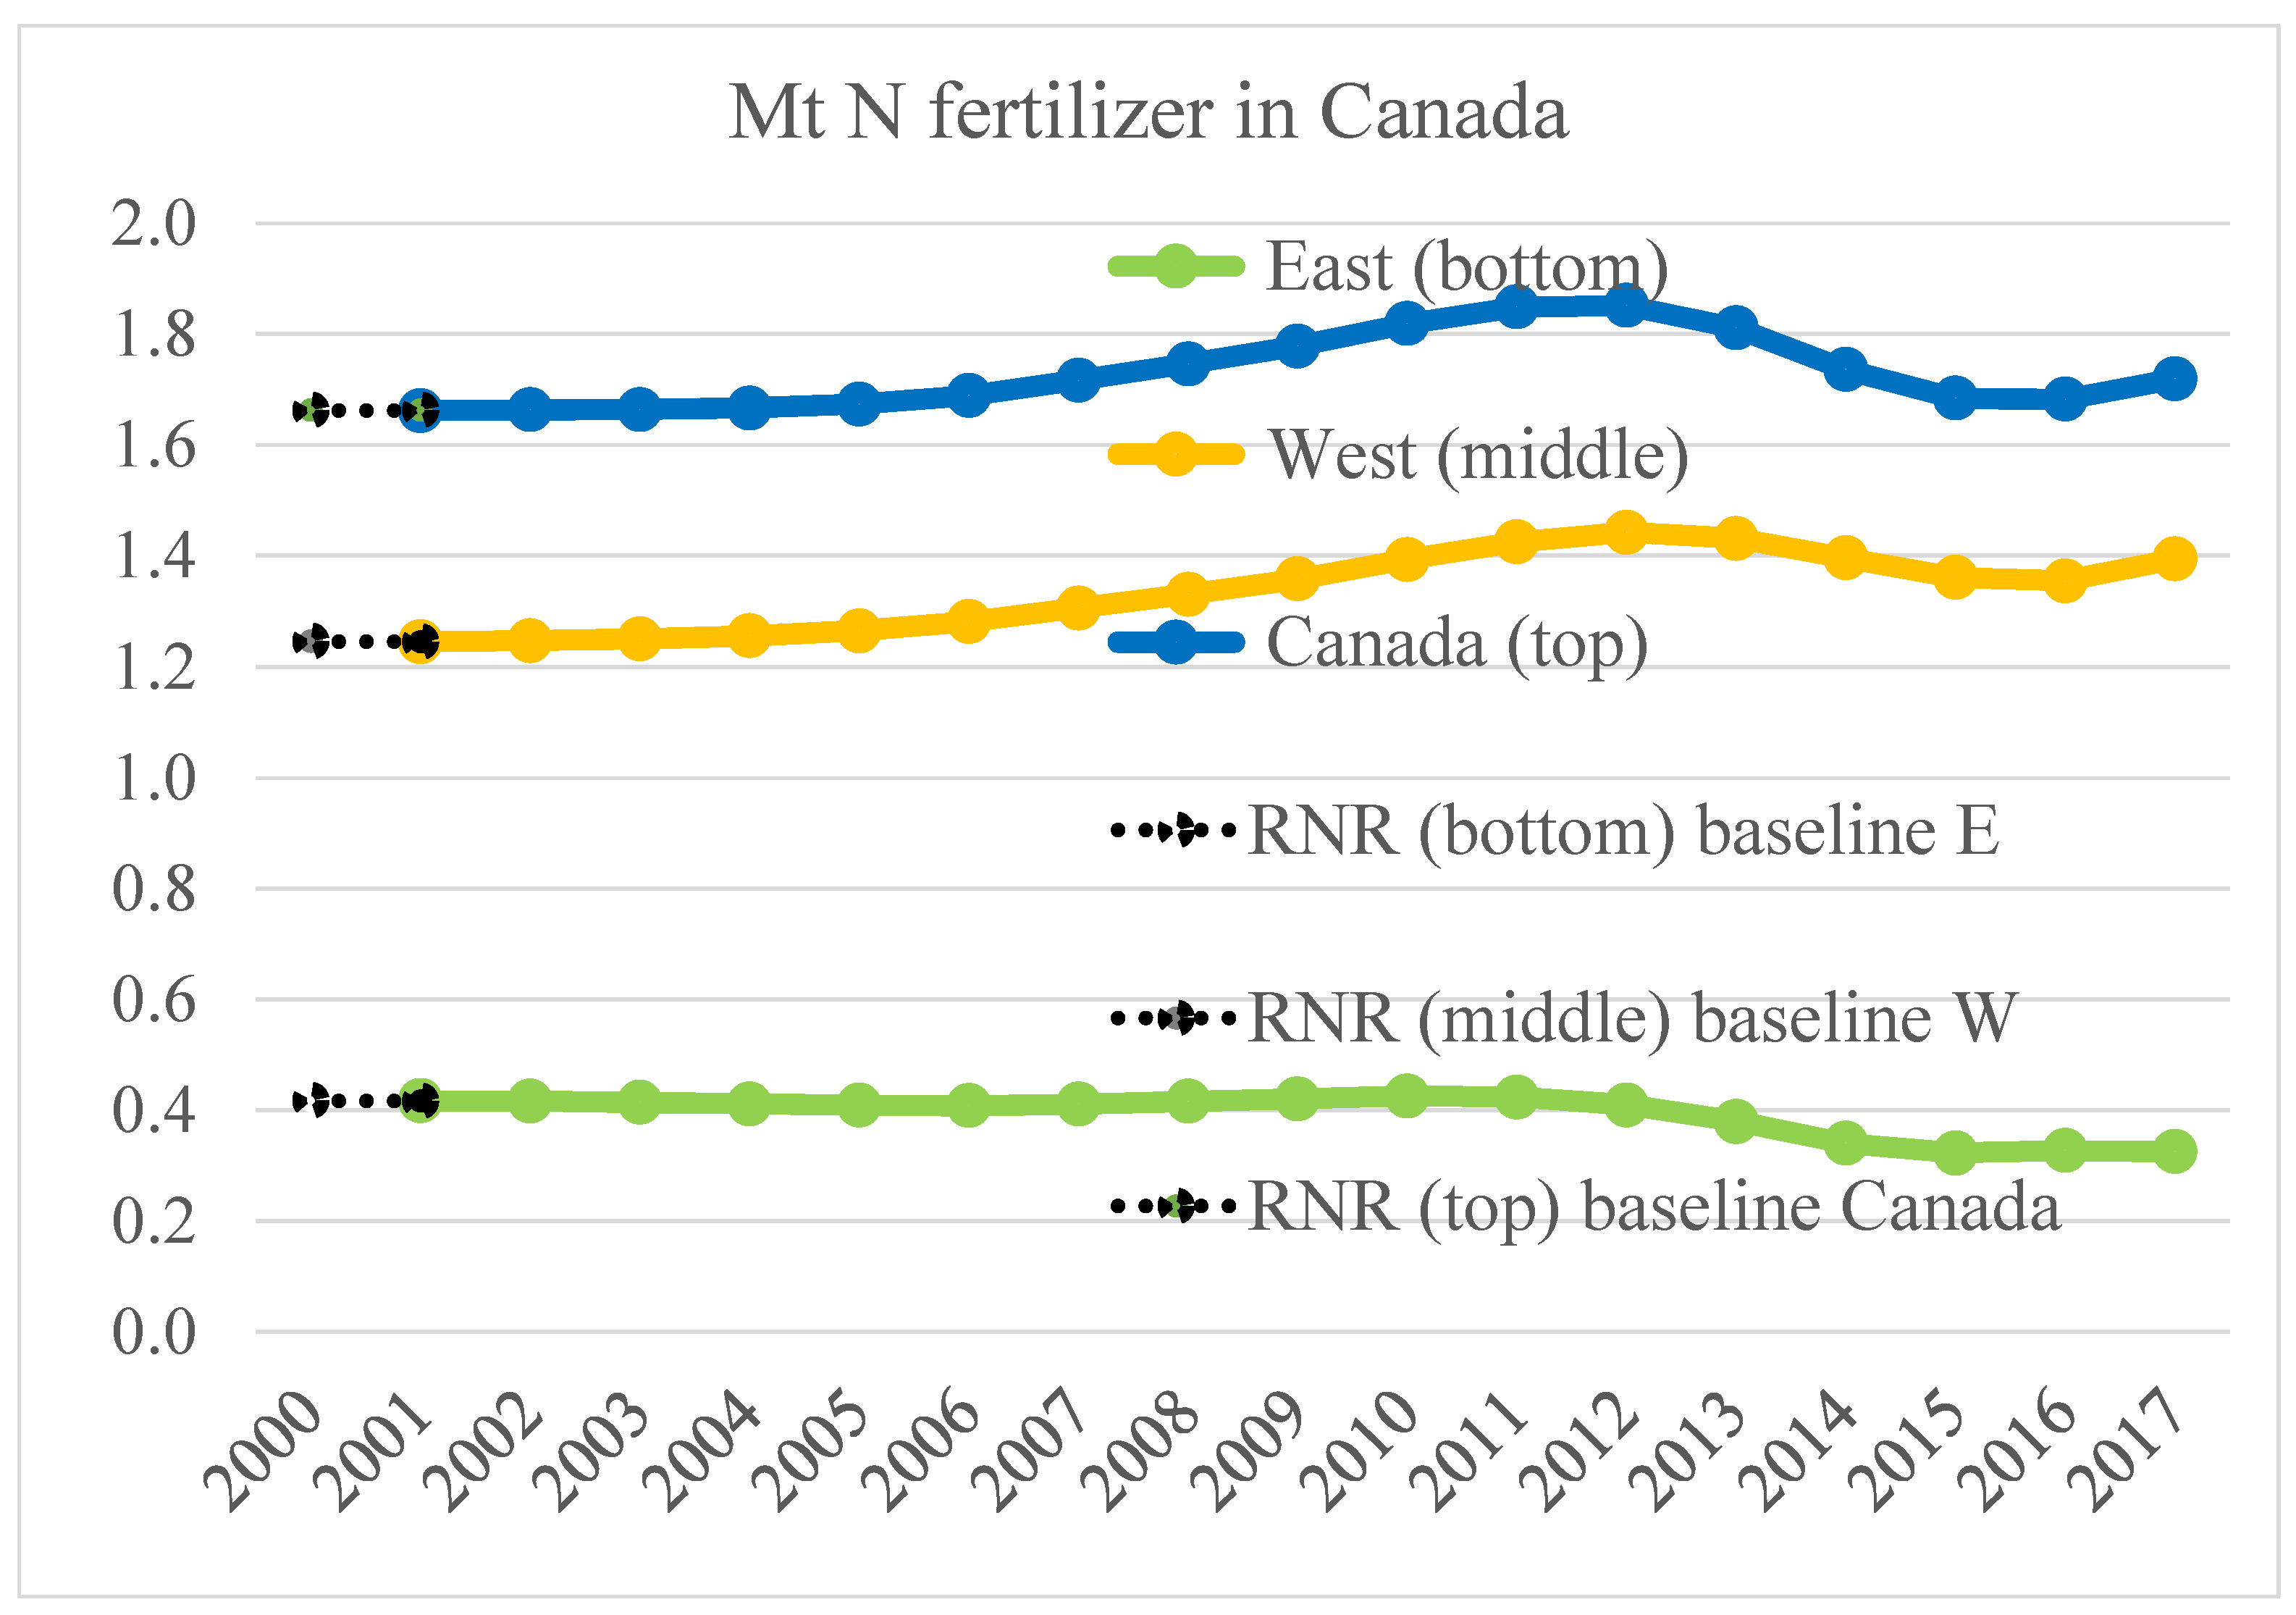

Table 1.
Fifteen crops included in the Sustainability Metrics analysis, with both a recent and a 2001 provincial N fertilizer rate estimate was available. For the 13 pairs shown as shaded and in italics histograms were either not available or not reliable.
Table 1.
Fifteen crops included in the Sustainability Metrics analysis, with both a recent and a 2001 provincial N fertilizer rate estimate was available. For the 13 pairs shown as shaded and in italics histograms were either not available or not reliable.
| Alberta | Saskatchewan | Manitoba | Ontario | Quebec | ||||||
| FUS1 | RNR2 | FUS | RNR | FUS | RNR | FUS | RNR | FUS | RNR | |
| Crop | kgN/ha | kgN/ha | kgN/ha | kgN/ha | kgN/ha | |||||
| Barley | 84 | 55 | 45 | 35 | 77 | 75 | ||||
| Canola | 131 | 85 | 121 | 75 | 138 | 90 | ||||
| Oats | 85 | 55 | 92 | 35 | 109 | 80 | ||||
| S-wheat | 106 | 55 | 98 | 35 | 116 | 80 | ||||
| D-wheat | 102 | 55 | 81 | 35 | ||||||
| Lentils | 14 | 40 | 10 | 25 | ||||||
| Forages | 102 | 53 | 121 | 53 | ||||||
| G-corn | 154 | 150 | 182 | 170 | 184 | 170 | ||||
| W-wheat | 130 | 85 | 44 | 85 | ||||||
| Flax | 83 | 60 | ||||||||
| Sunflower | 100 | 80 | ||||||||
| Soybean | 4 | 0 | 7 | 0 | 8 | 0 | ||||
| Chick peas3 | 42 | 40 | 42 | 25 | ||||||
| Dry beans3 | 71 | 40 | 39 | 15 | 64 | 25 | ||||
| Dry peas | 10 | 10 | 3 | 9 | 9 | 10 | ||||
| 1, FUS = Fertilizer Use Survey (See Appendix 1 for deviation estimates). | ||||||||||
| 2, RNR = Recommended Nitrogen [application] Rates. | ||||||||||
| 3, Two pulse crops in the FUS columns use N rates from other sources. | ||||||||||
Disclaimer/Publisher’s Note: The statements, opinions and data contained in all publications are solely those of the individual author(s) and contributor(s) and not of MDPI and/or the editor(s). MDPI and/or the editor(s) disclaim responsibility for any injury to people or property resulting from any ideas, methods, instructions or products referred to in the content. |
© 2024 by the authors. Licensee MDPI, Basel, Switzerland. This article is an open access article distributed under the terms and conditions of the Creative Commons Attribution (CC BY) license (http://creativecommons.org/licenses/by/4.0/).
Copyright: This open access article is published under a Creative Commons CC BY 4.0 license, which permit the free download, distribution, and reuse, provided that the author and preprint are cited in any reuse.


