Submitted:
02 July 2024
Posted:
04 July 2024
You are already at the latest version
Abstract
Keywords:
1. Introduction
1.1. Background and Significance of Research on Eucalypt Leaf Blight
1.2. About Eucalyptus pellita
1.3. Varieties Improvement is the Way to Solve Disease Problems
2. Materials and Methods
2.1. Genetic Material
2.2. Transcriptome Sequencing and Analysis
3. Results
3.1. Quality Control of Sequence Data (QC)
3.1.1. Sequencing Data Quality
3.1.2. Mapping Sequencing Information to E. grandis Reference Genome and Its Regional Distribution
3.2. Quantitative Analysis of the Genes Sequenced
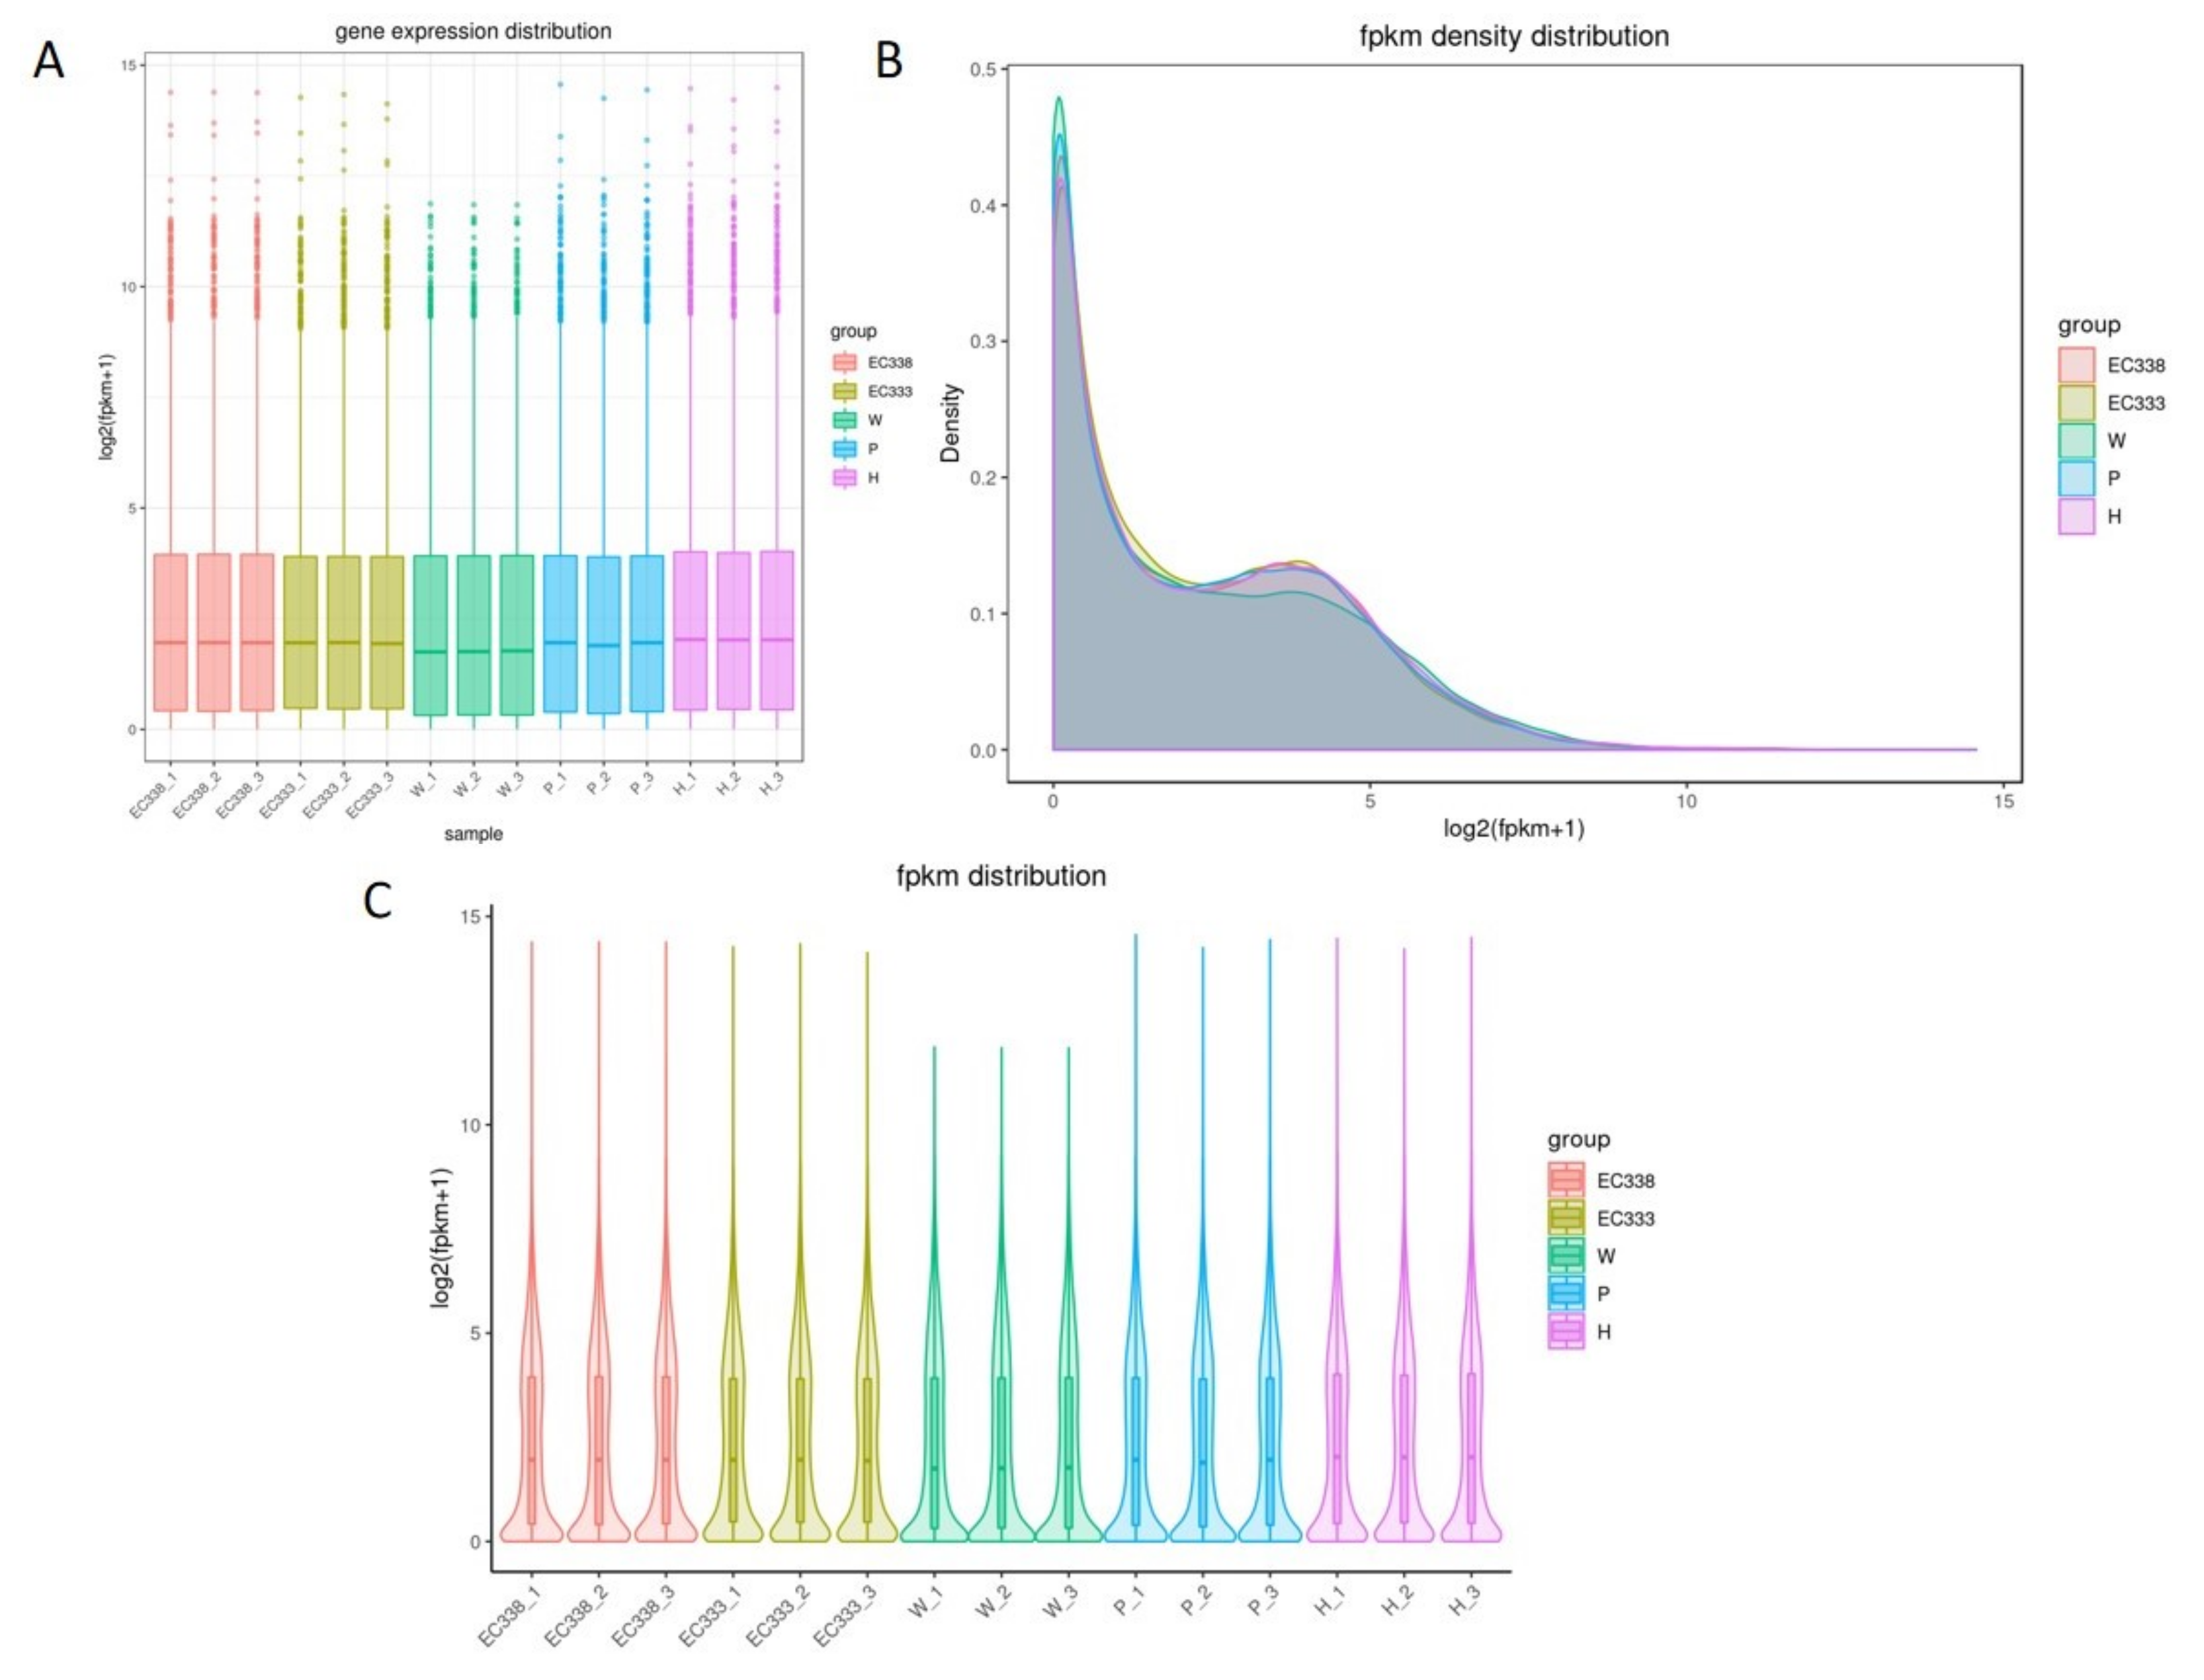
3.2.1. Detection of Expression Distribution of Genes Sequenced in Different Eucalypt Genotypes
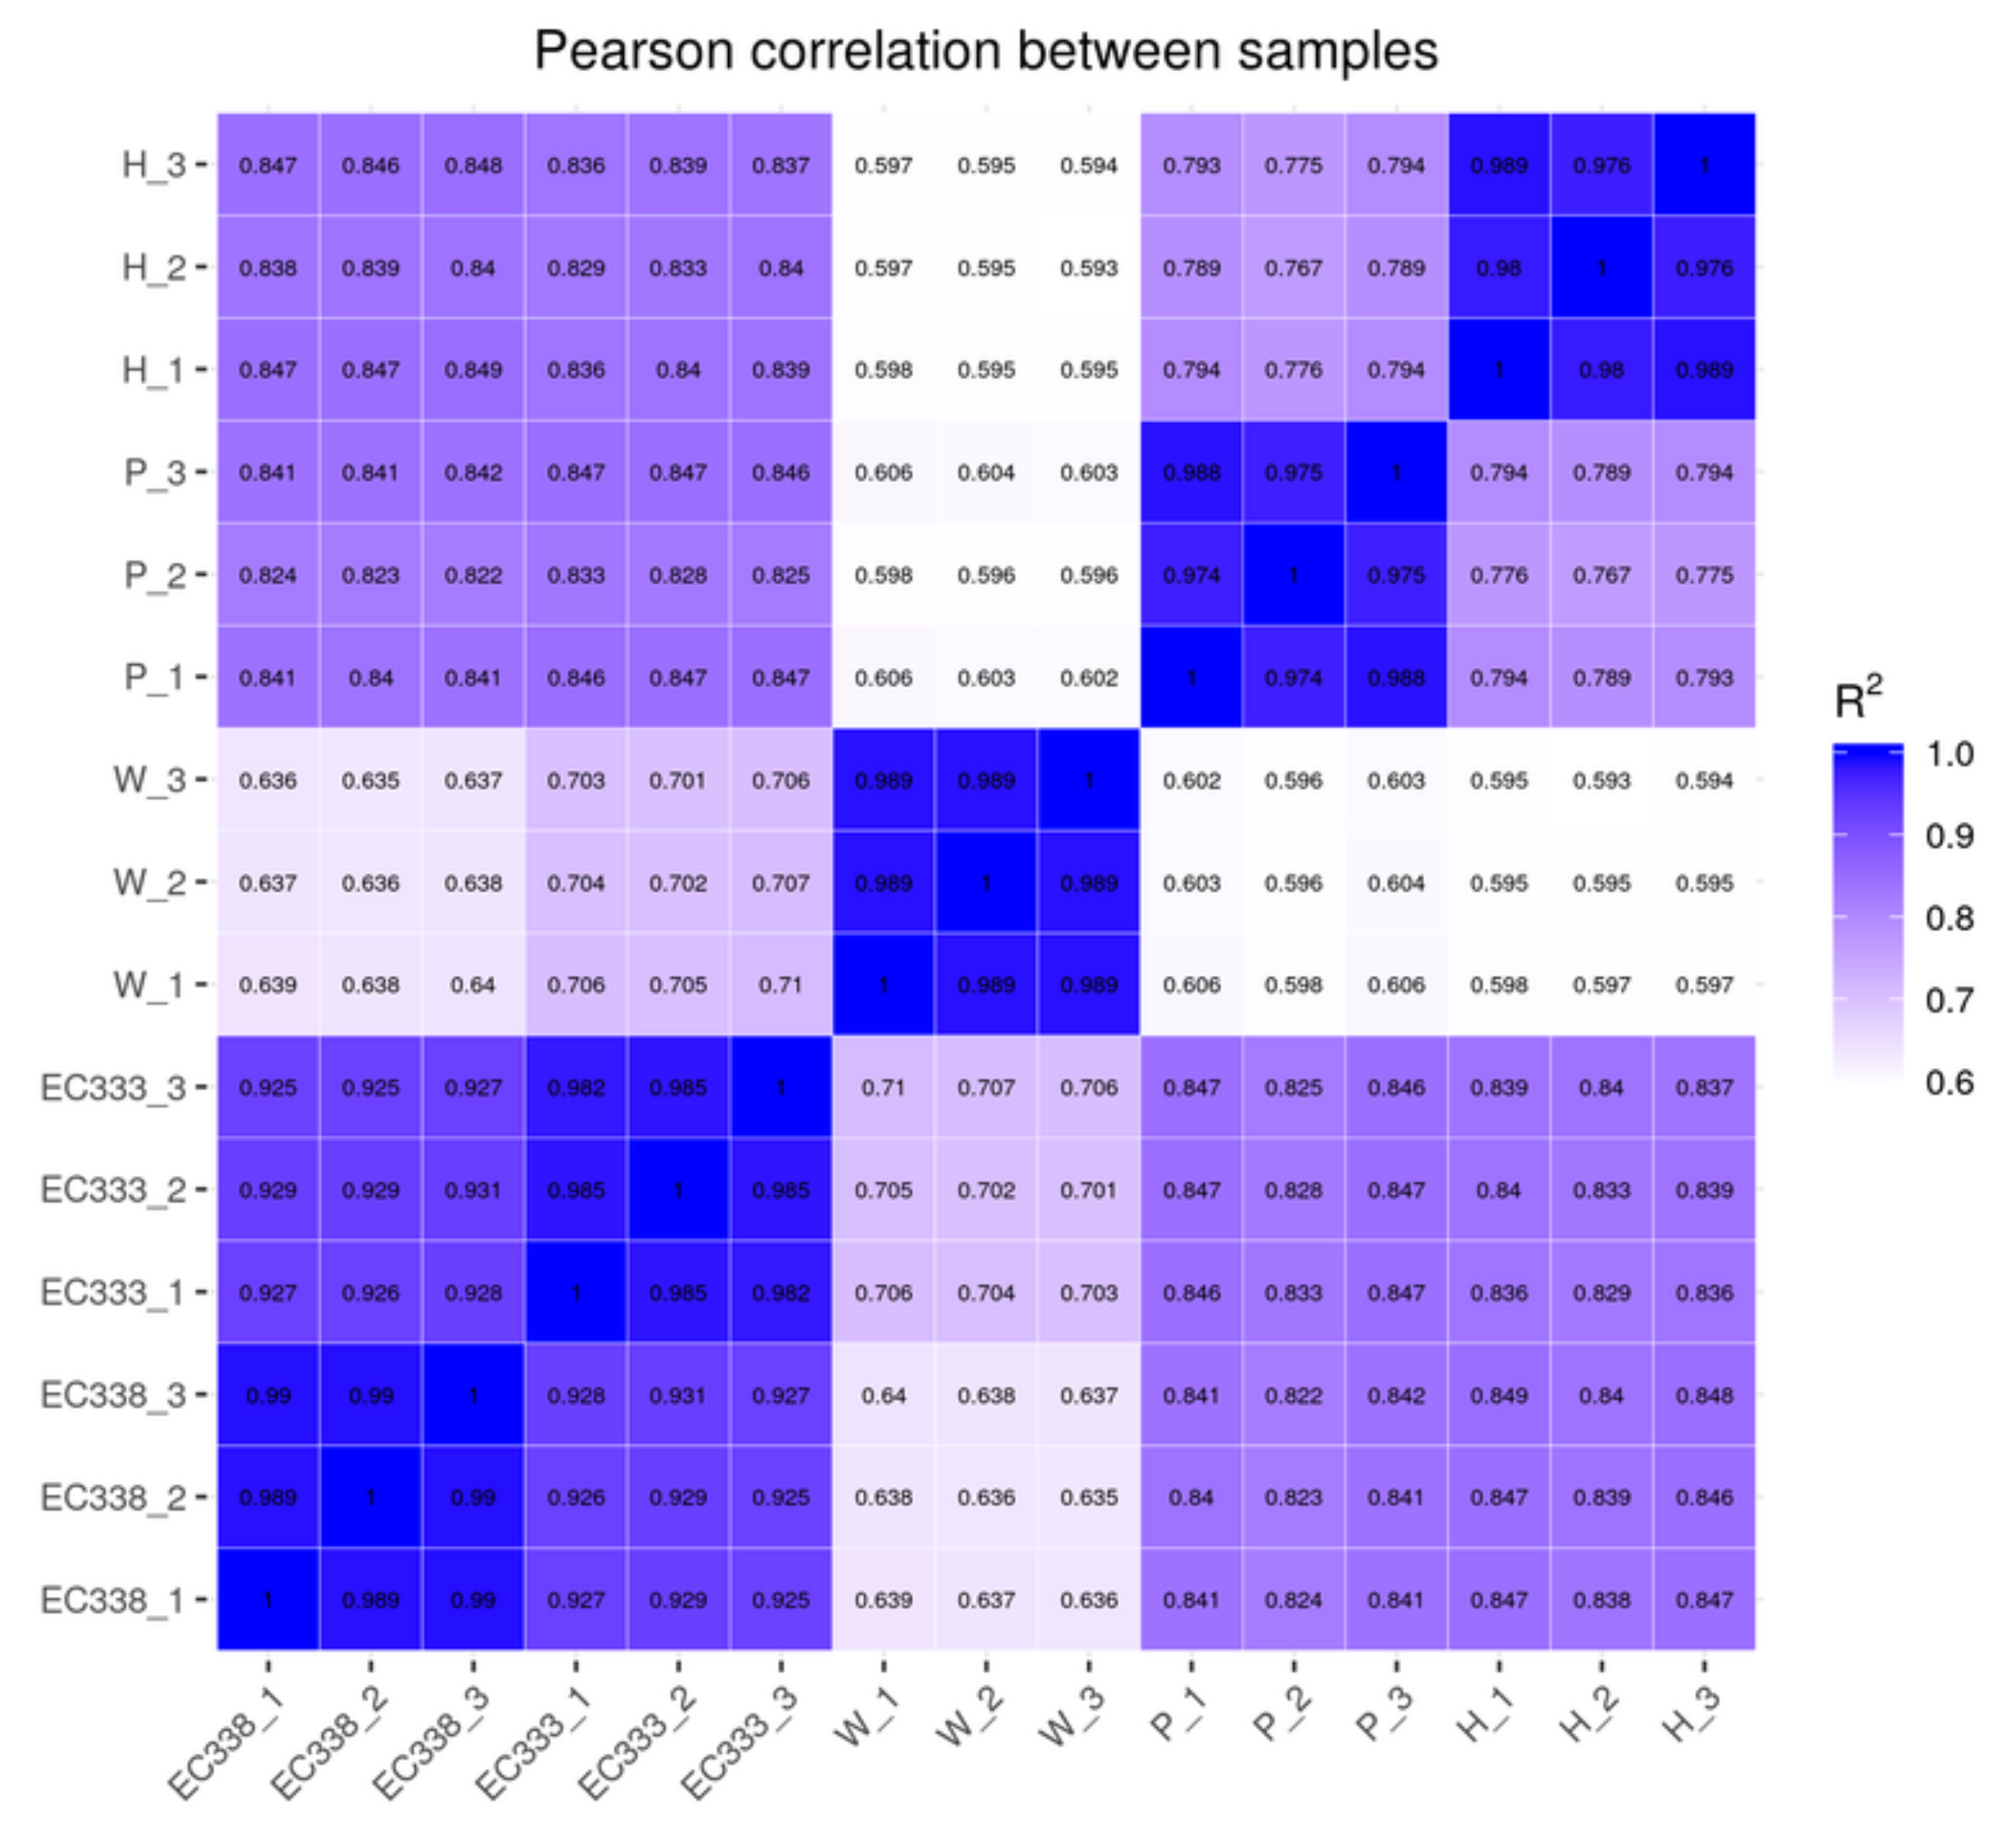
3.2.2. The Correlation of Gene Expression of Eucalypt Genotypes Sequenced
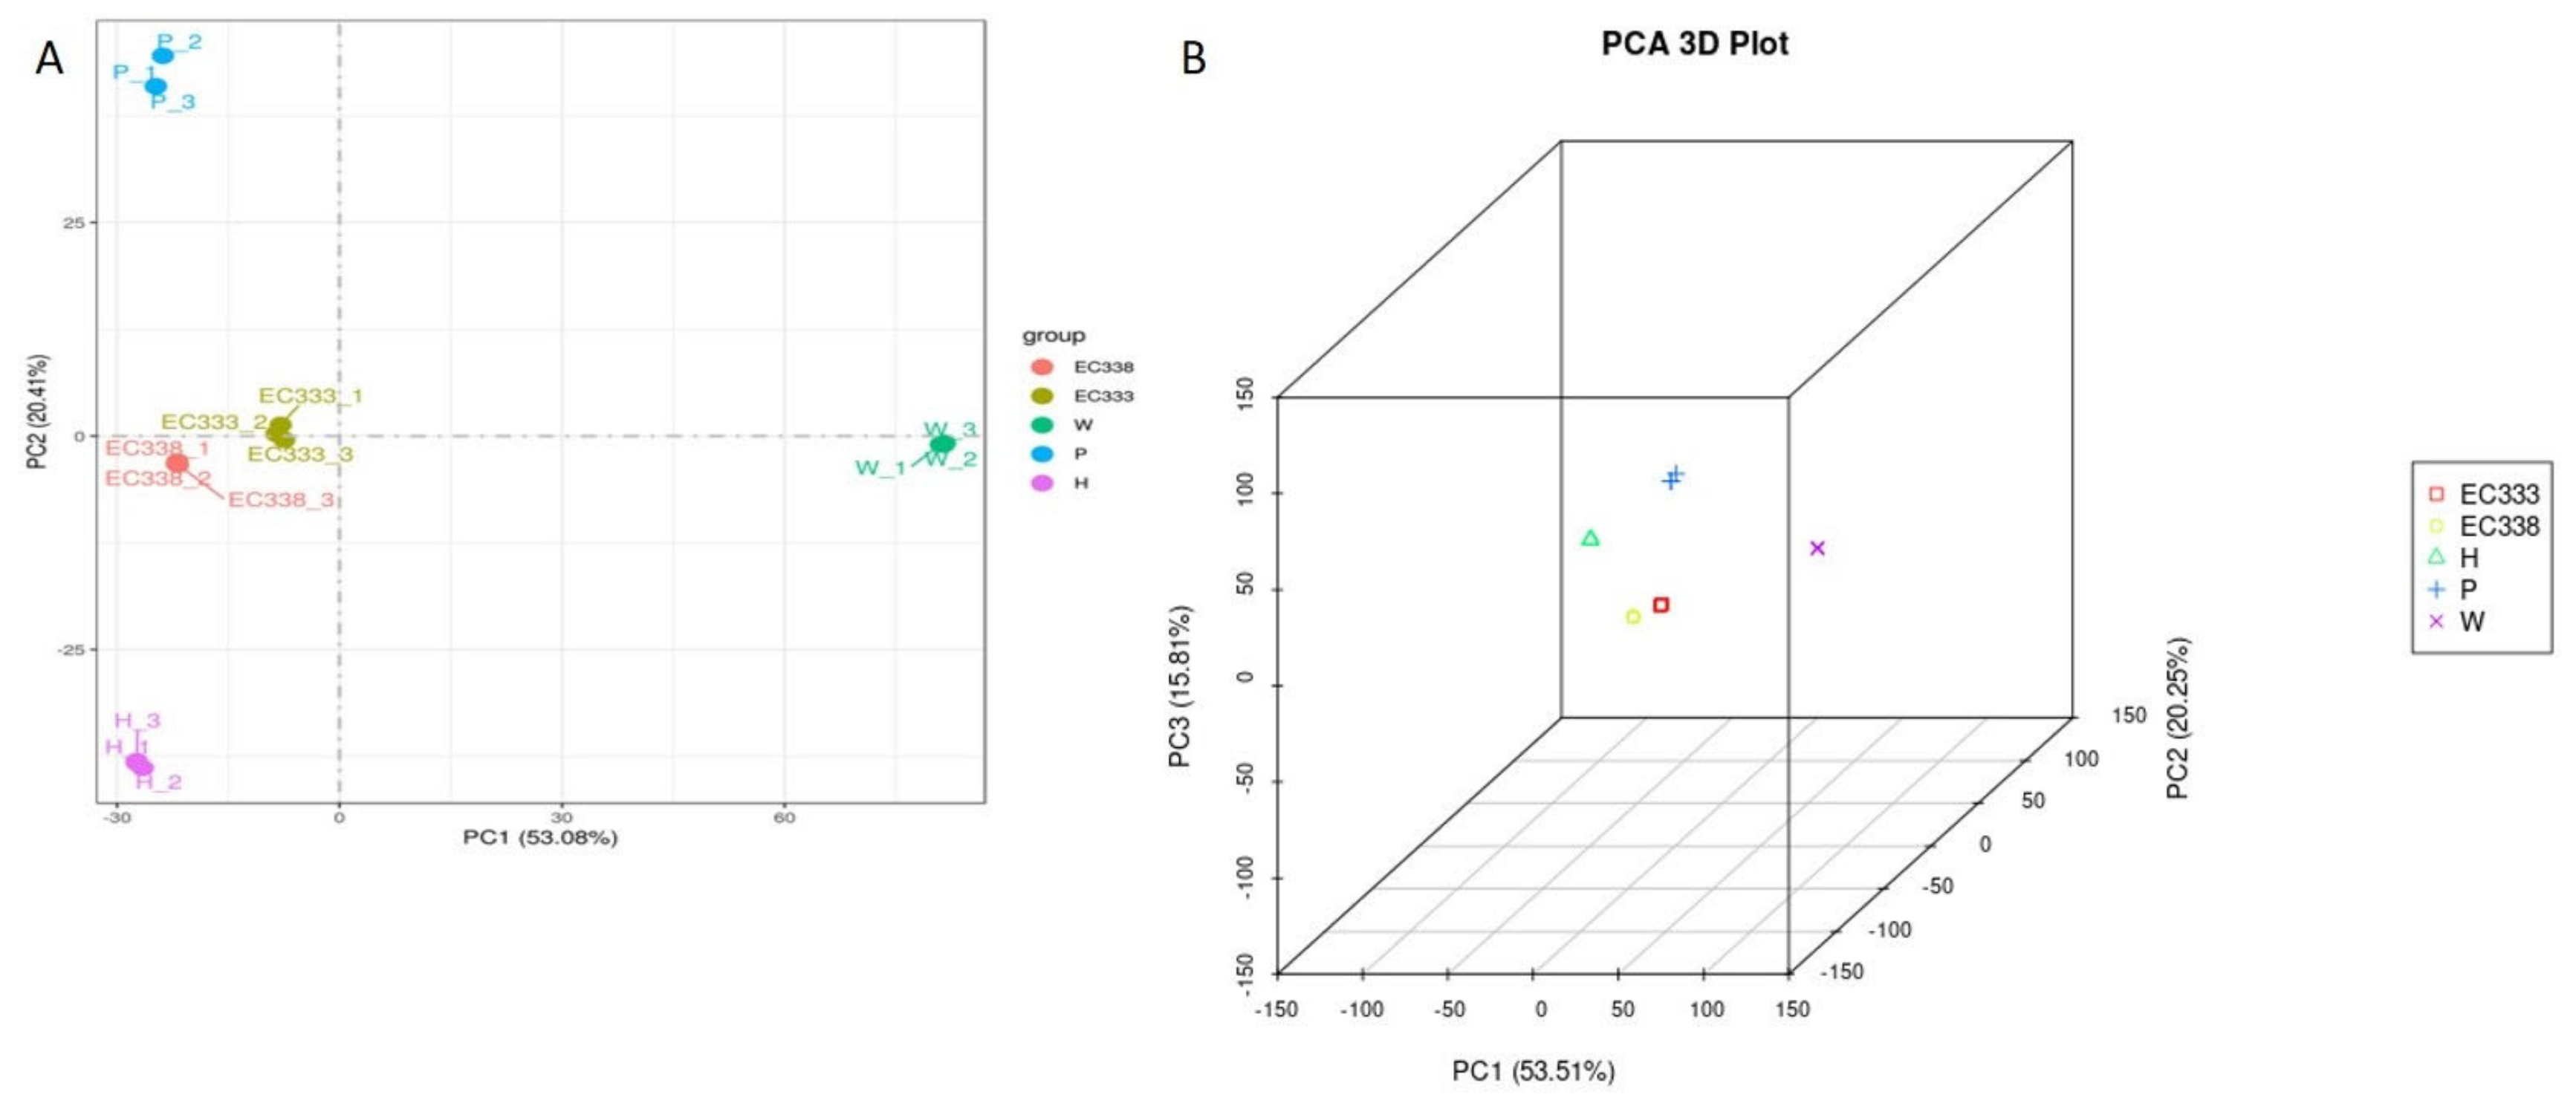
3.2.3. Principal Component Analysis of Gene Expression
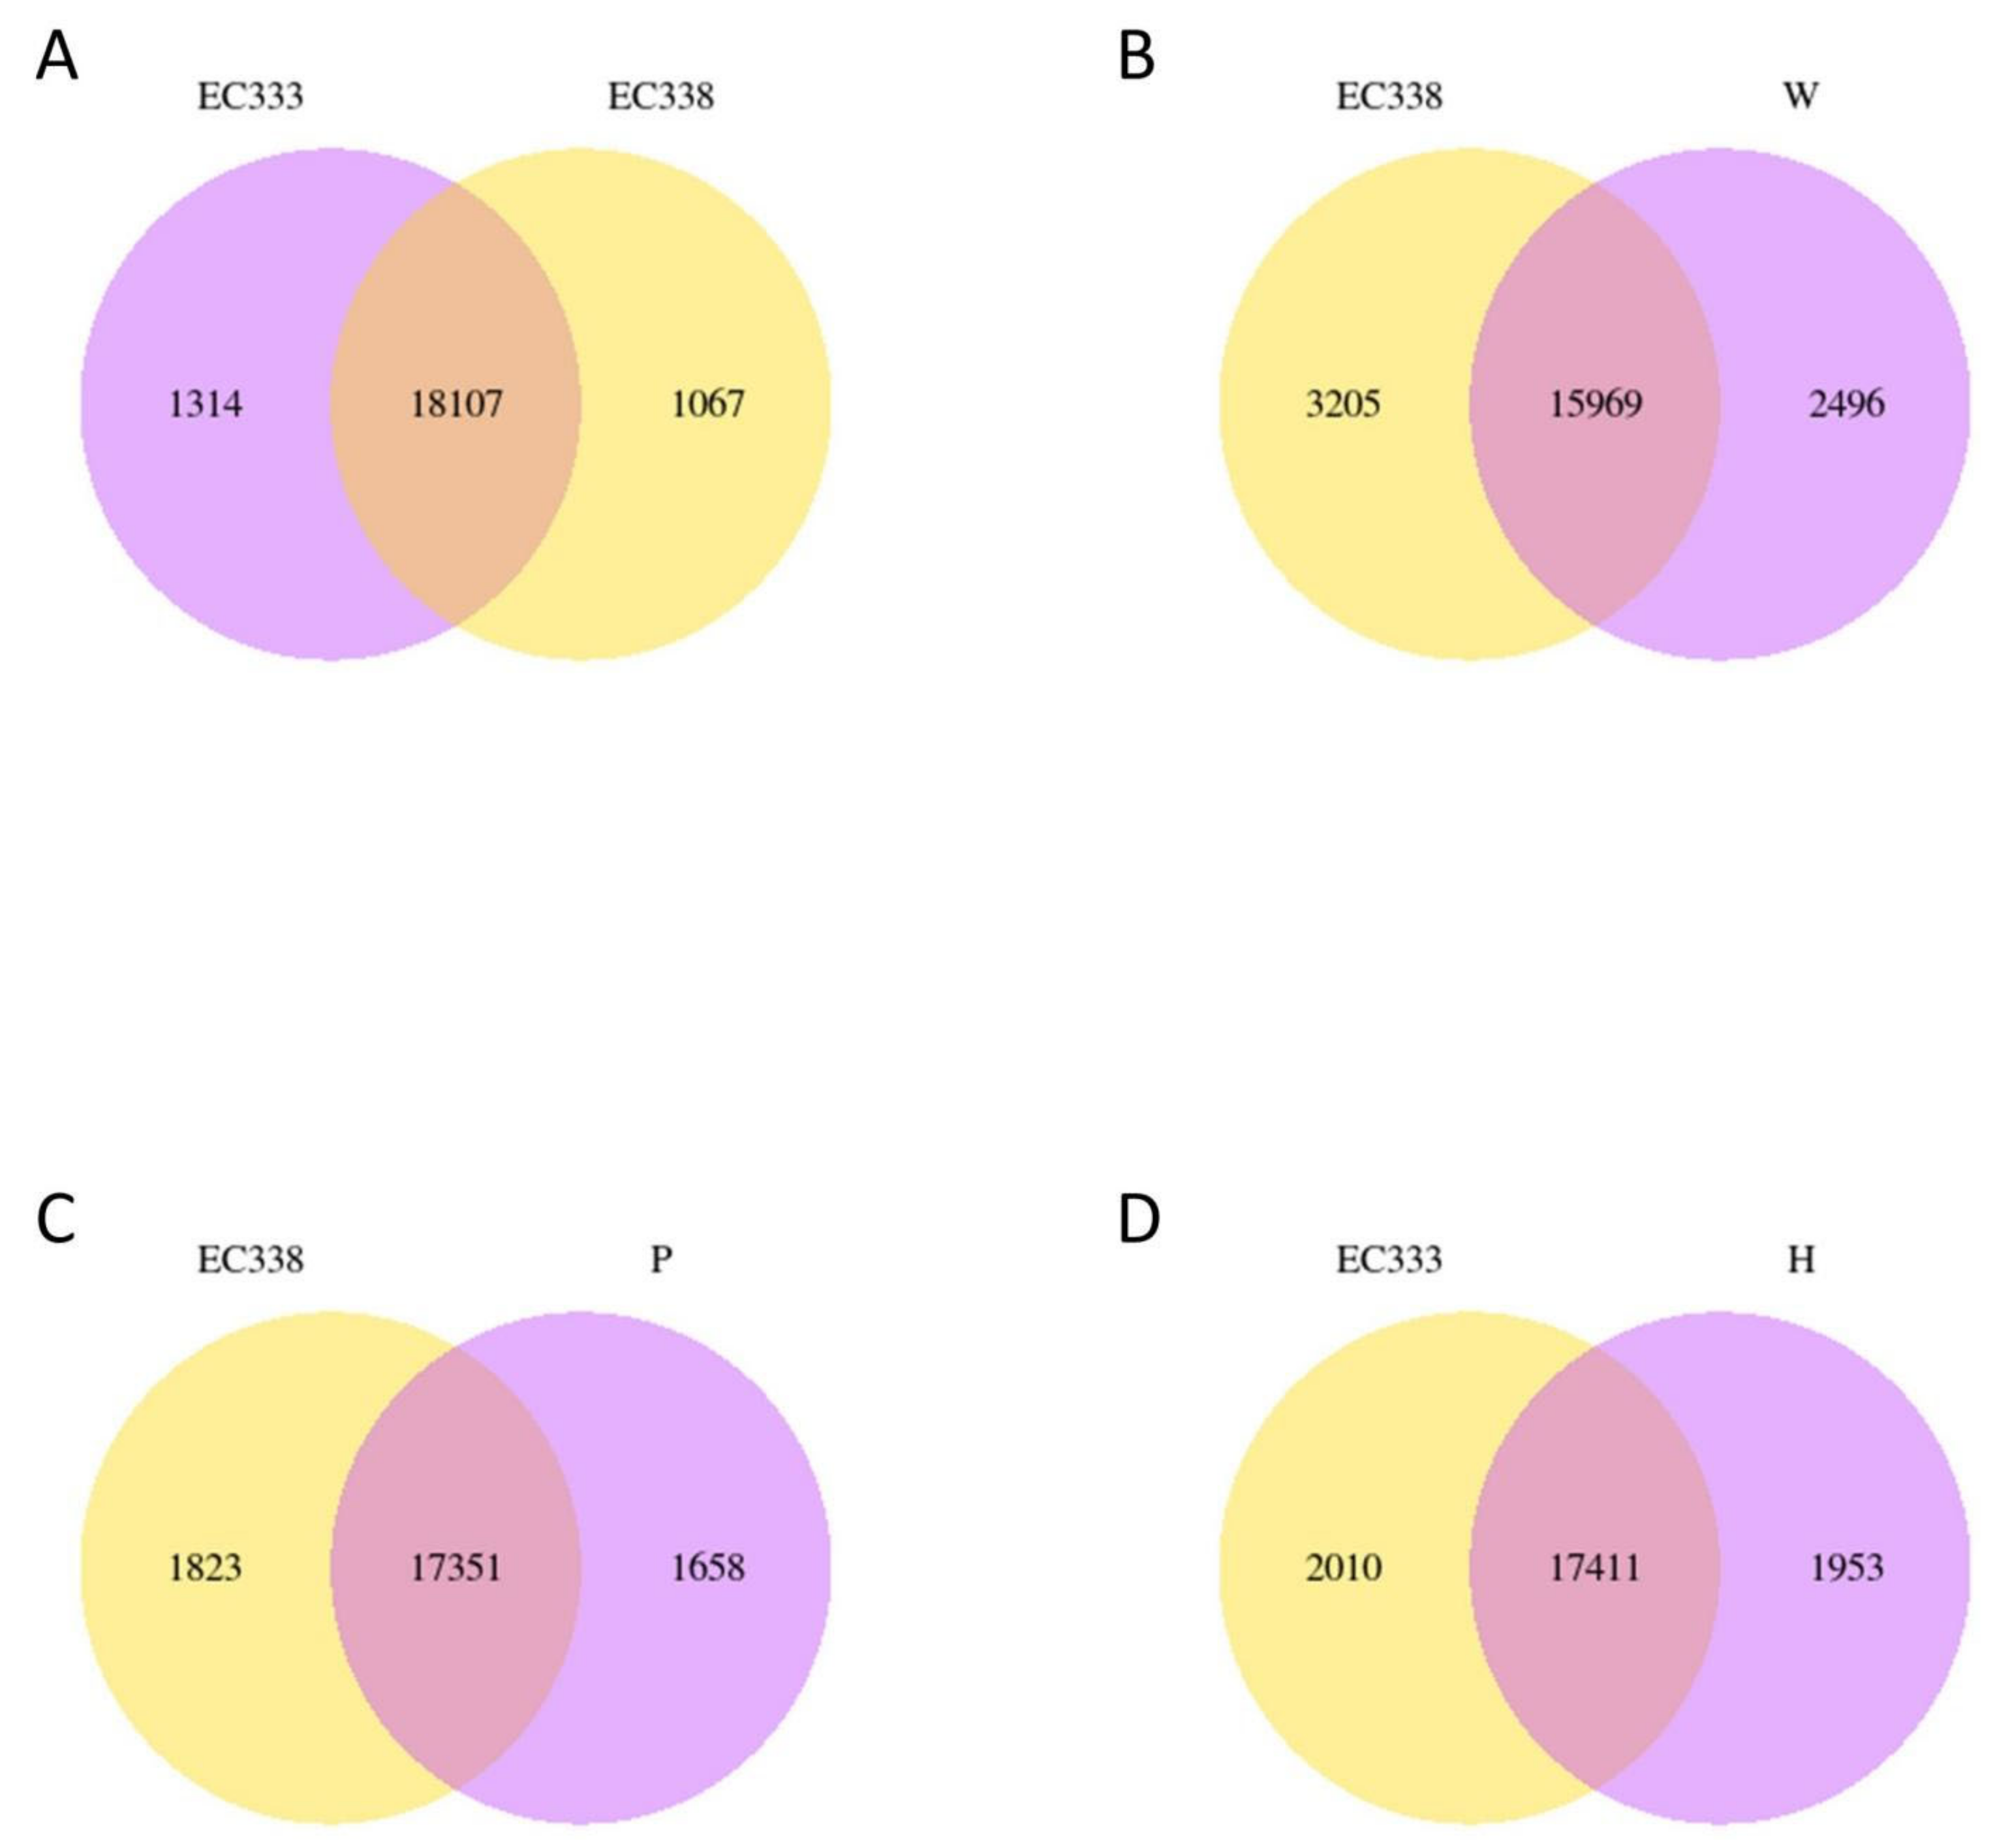
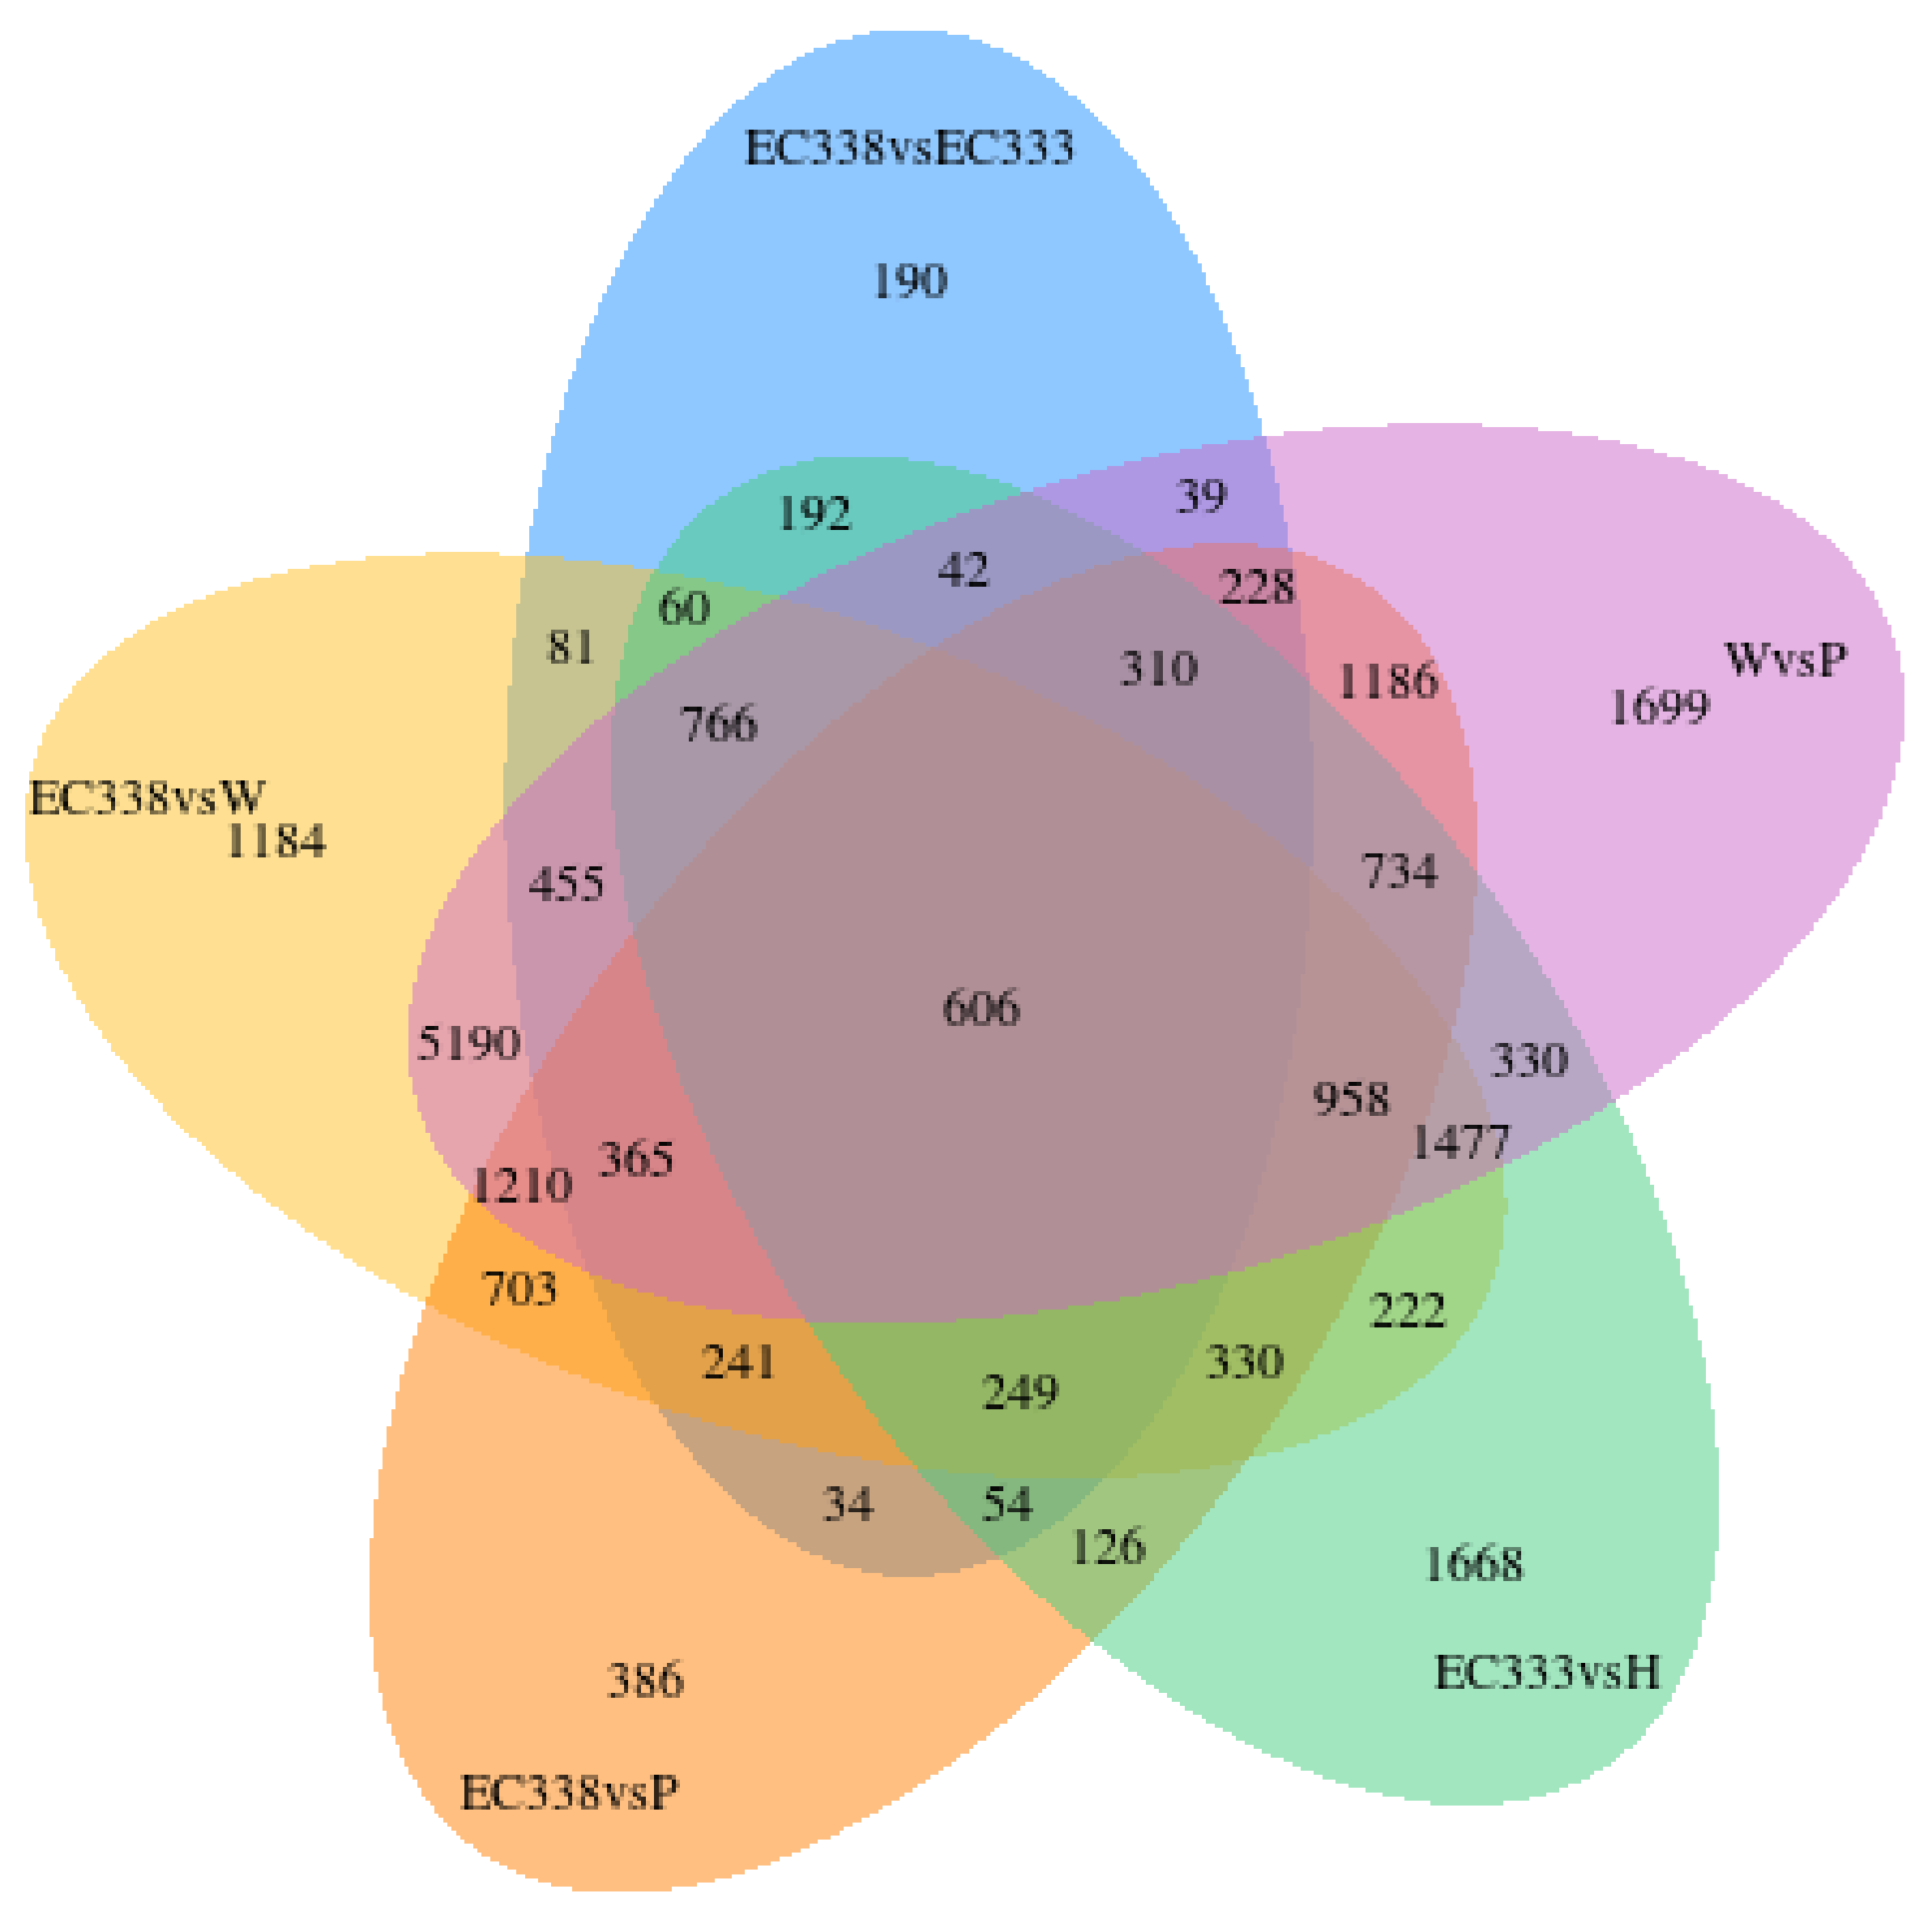
3.3. Gene Co-Expression Venn Diagram and Differential Gene Venn Diagram
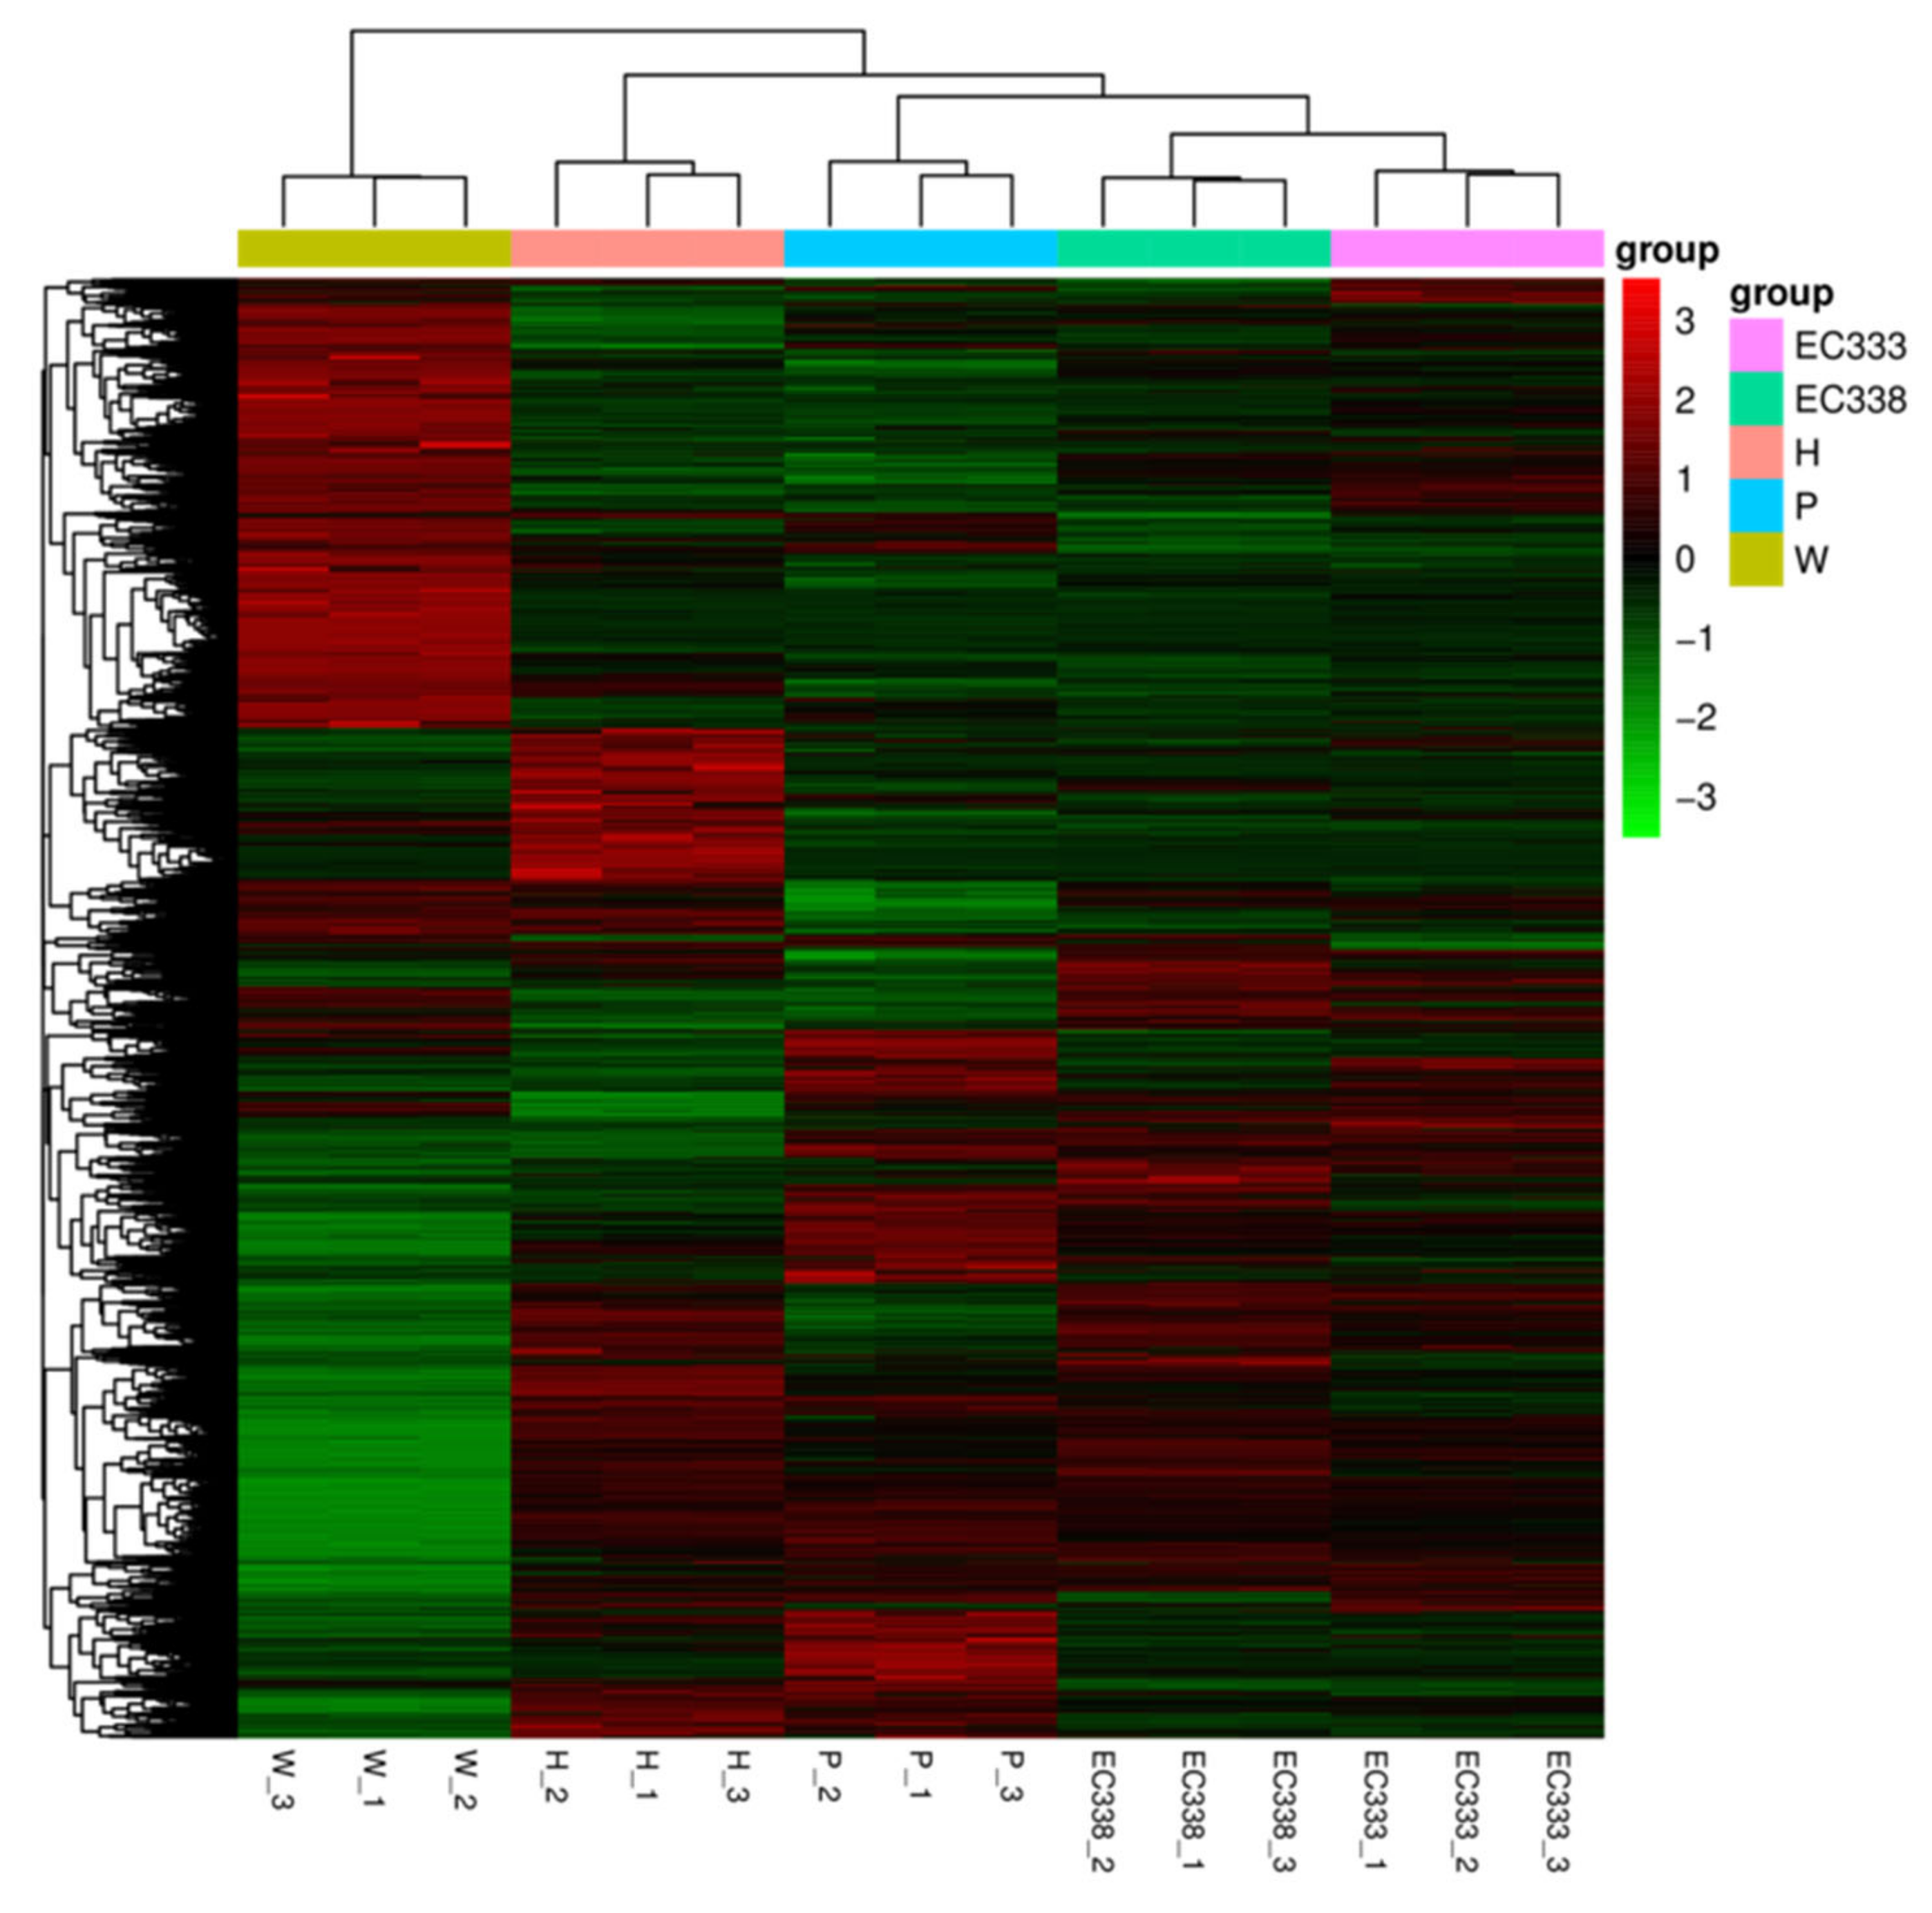
3.4. Gene Expression Analysis (Differential Gene Screening and Clustering)
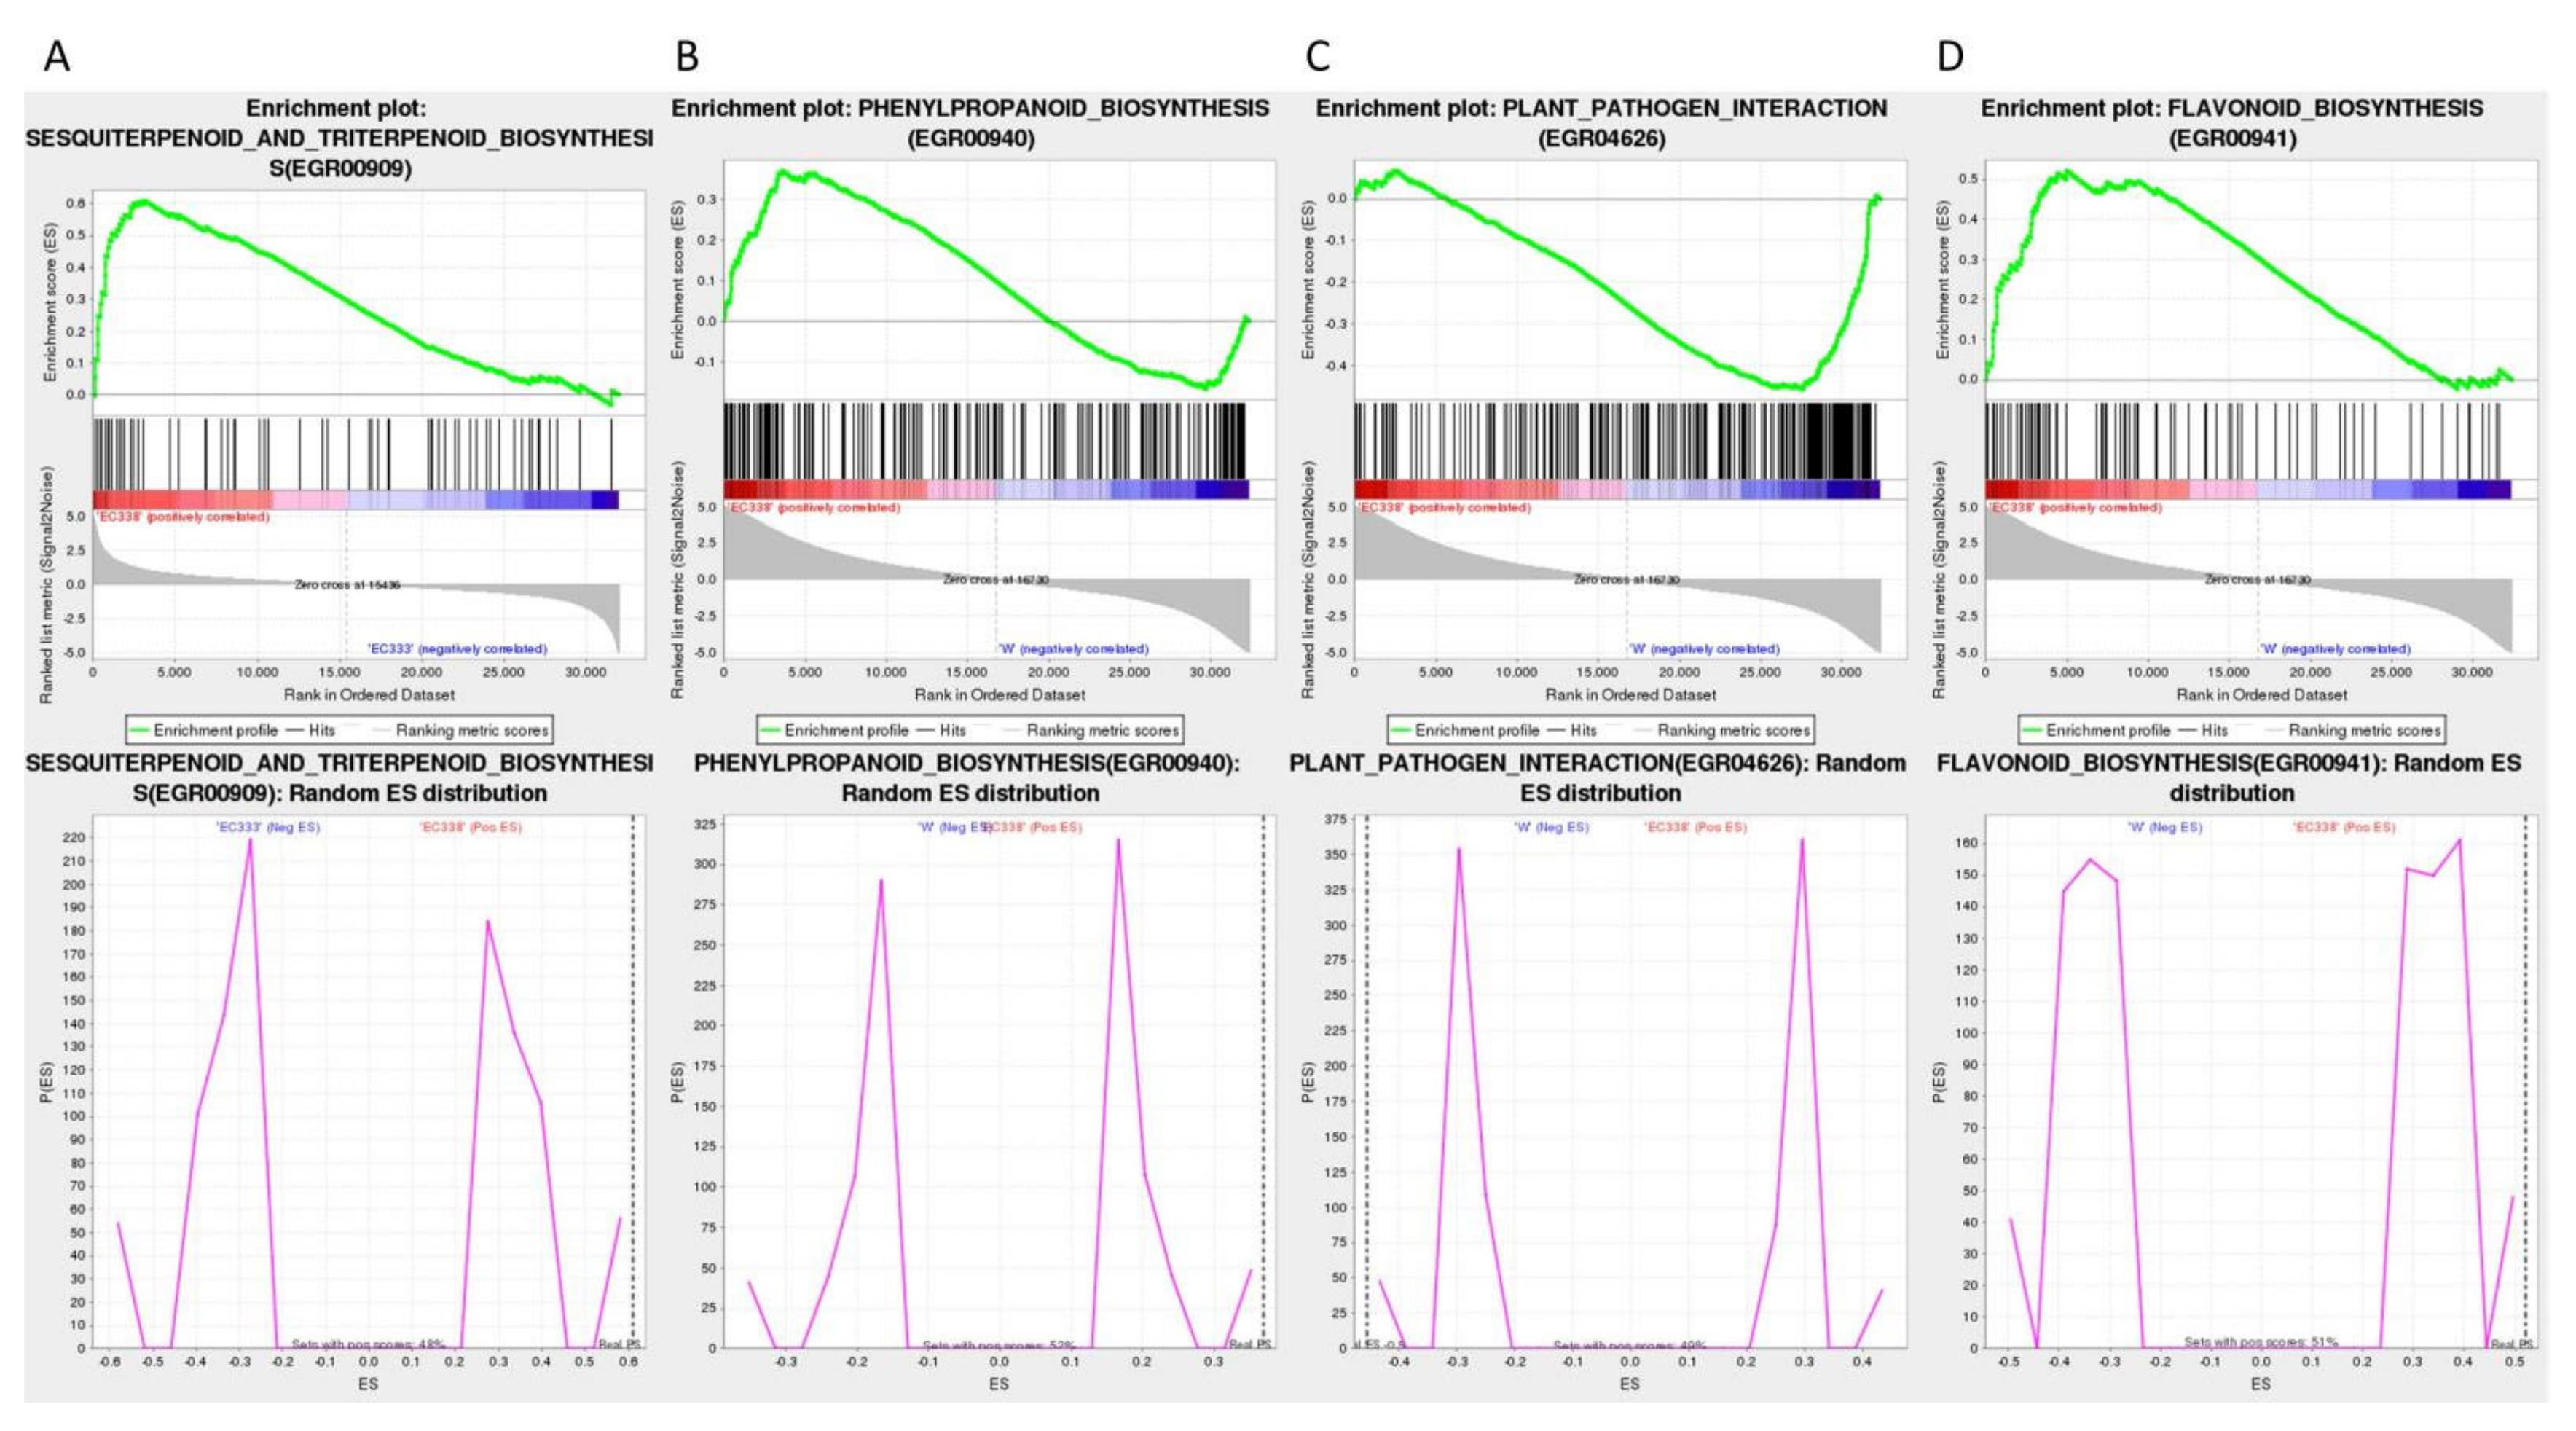
3.5. Enrichment Analysis of Differential Genes in Comparison Groups
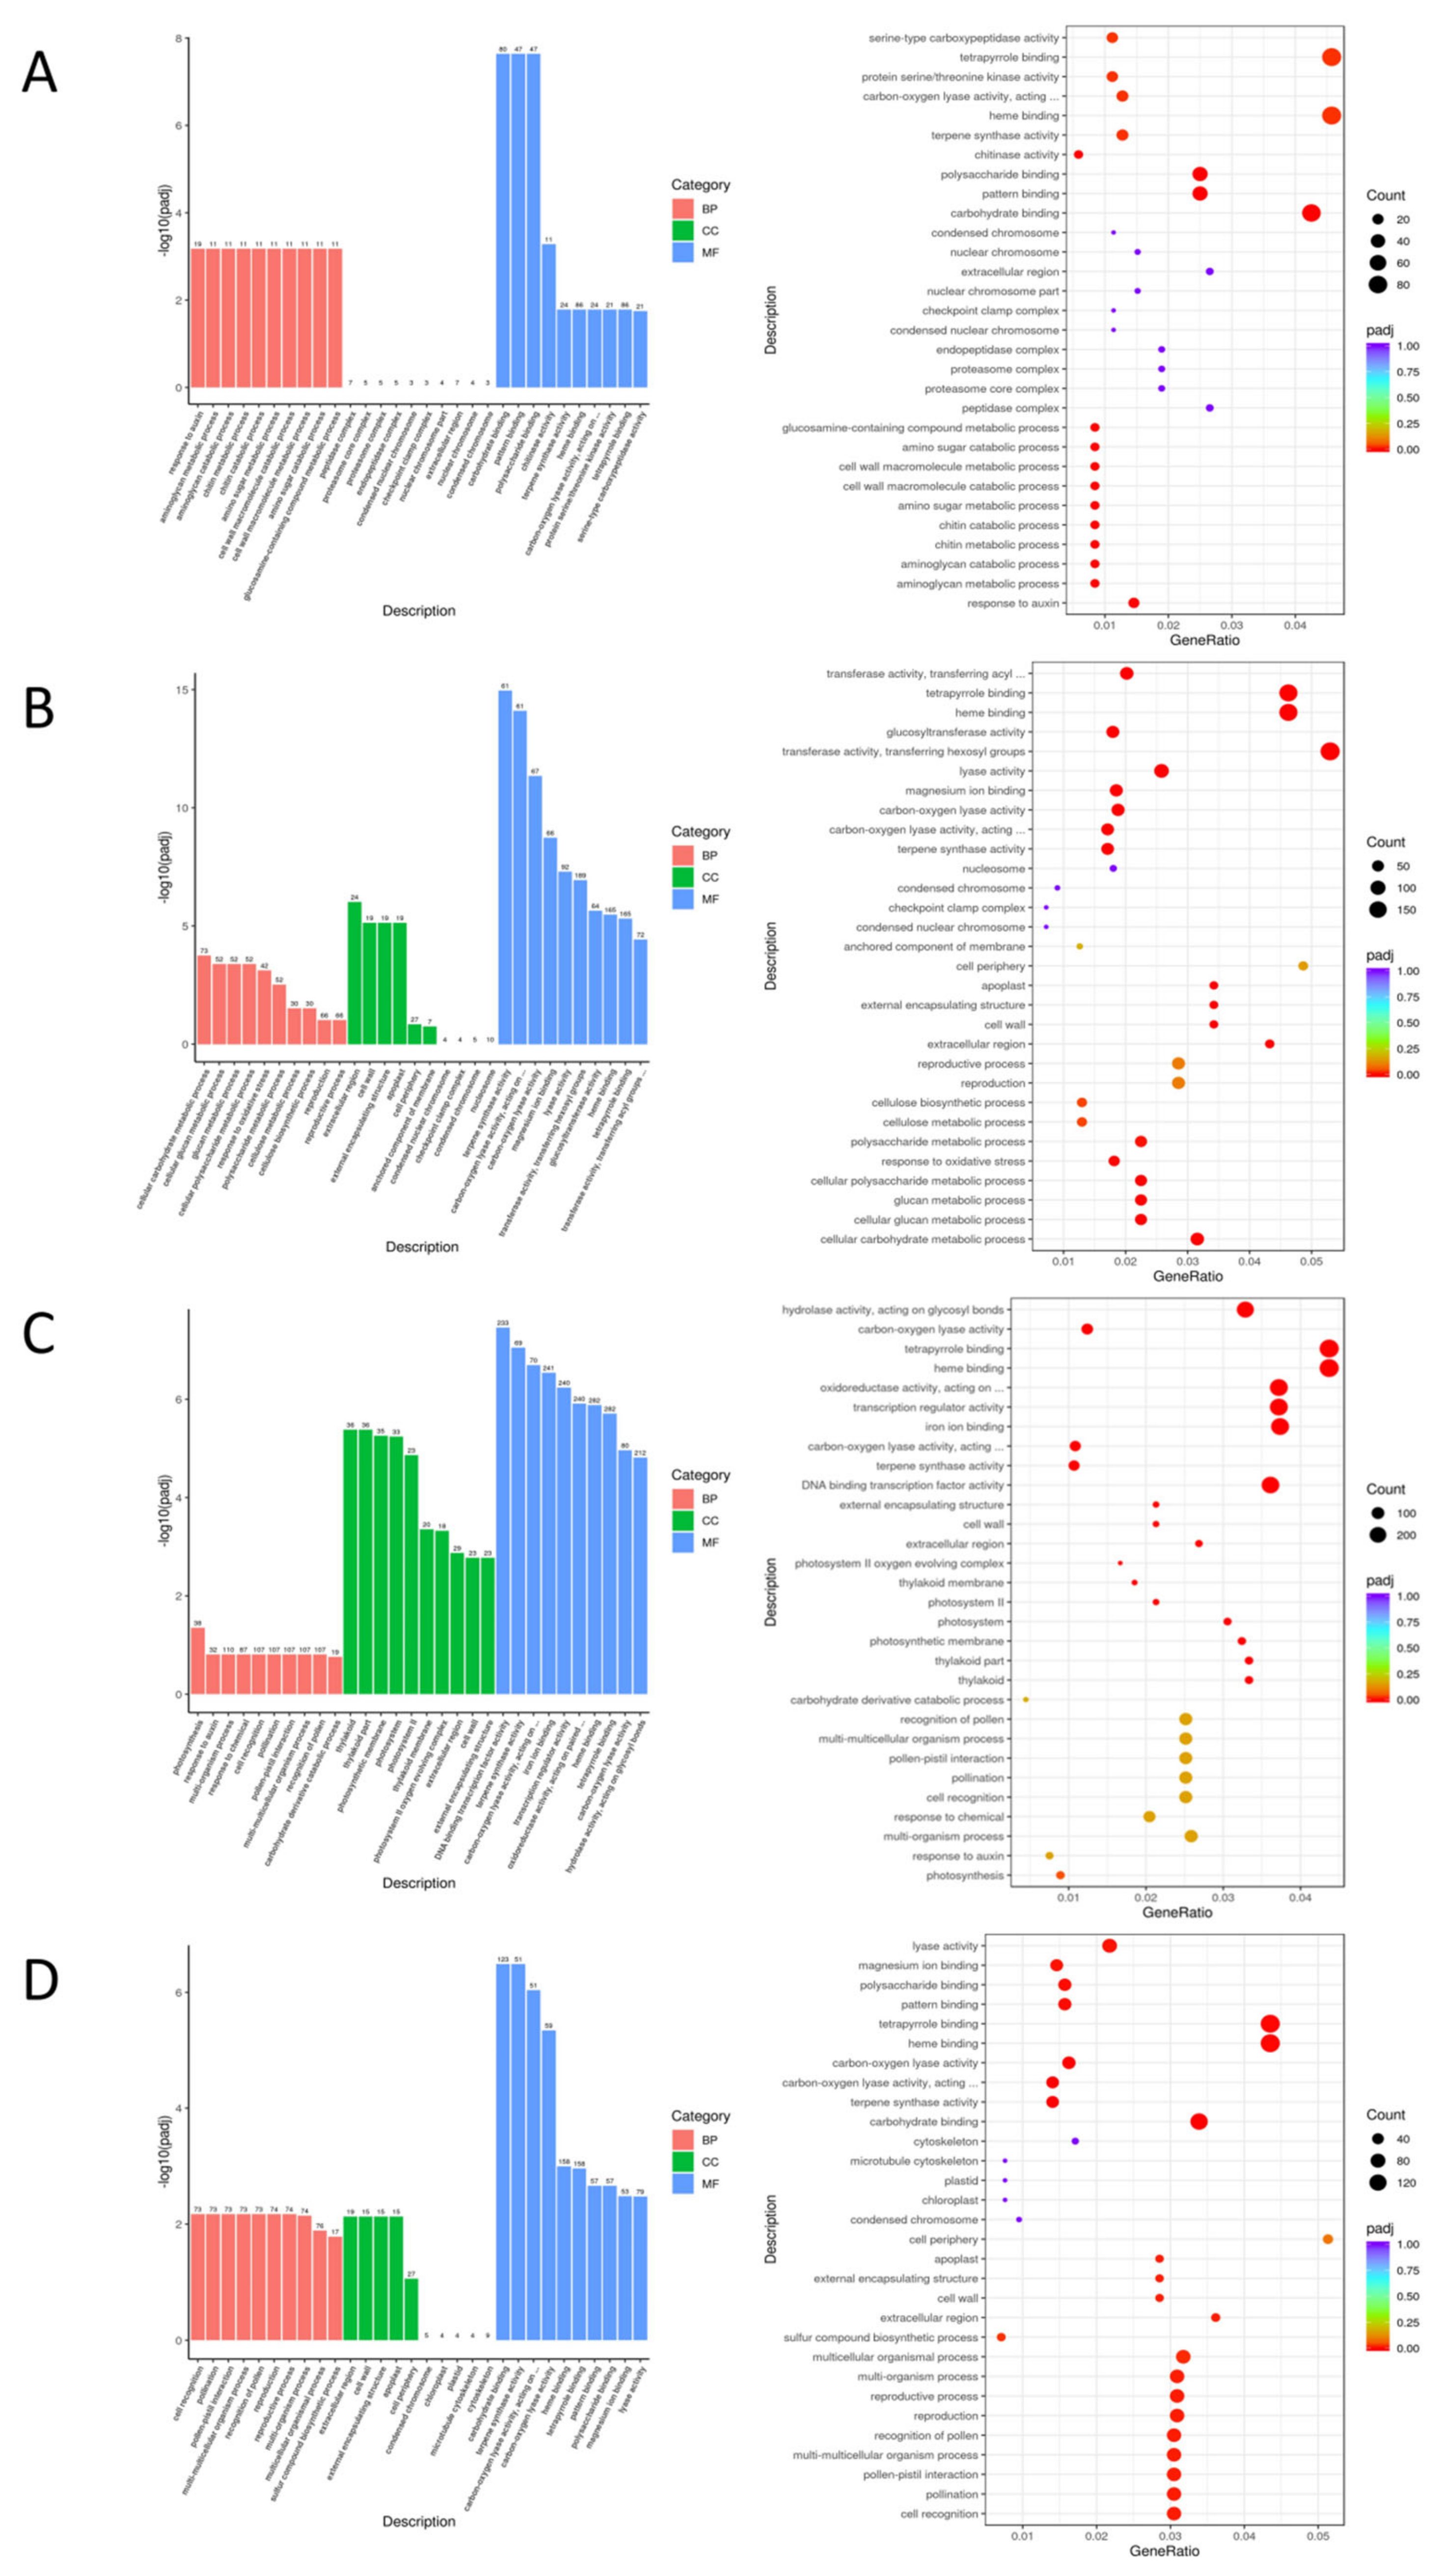
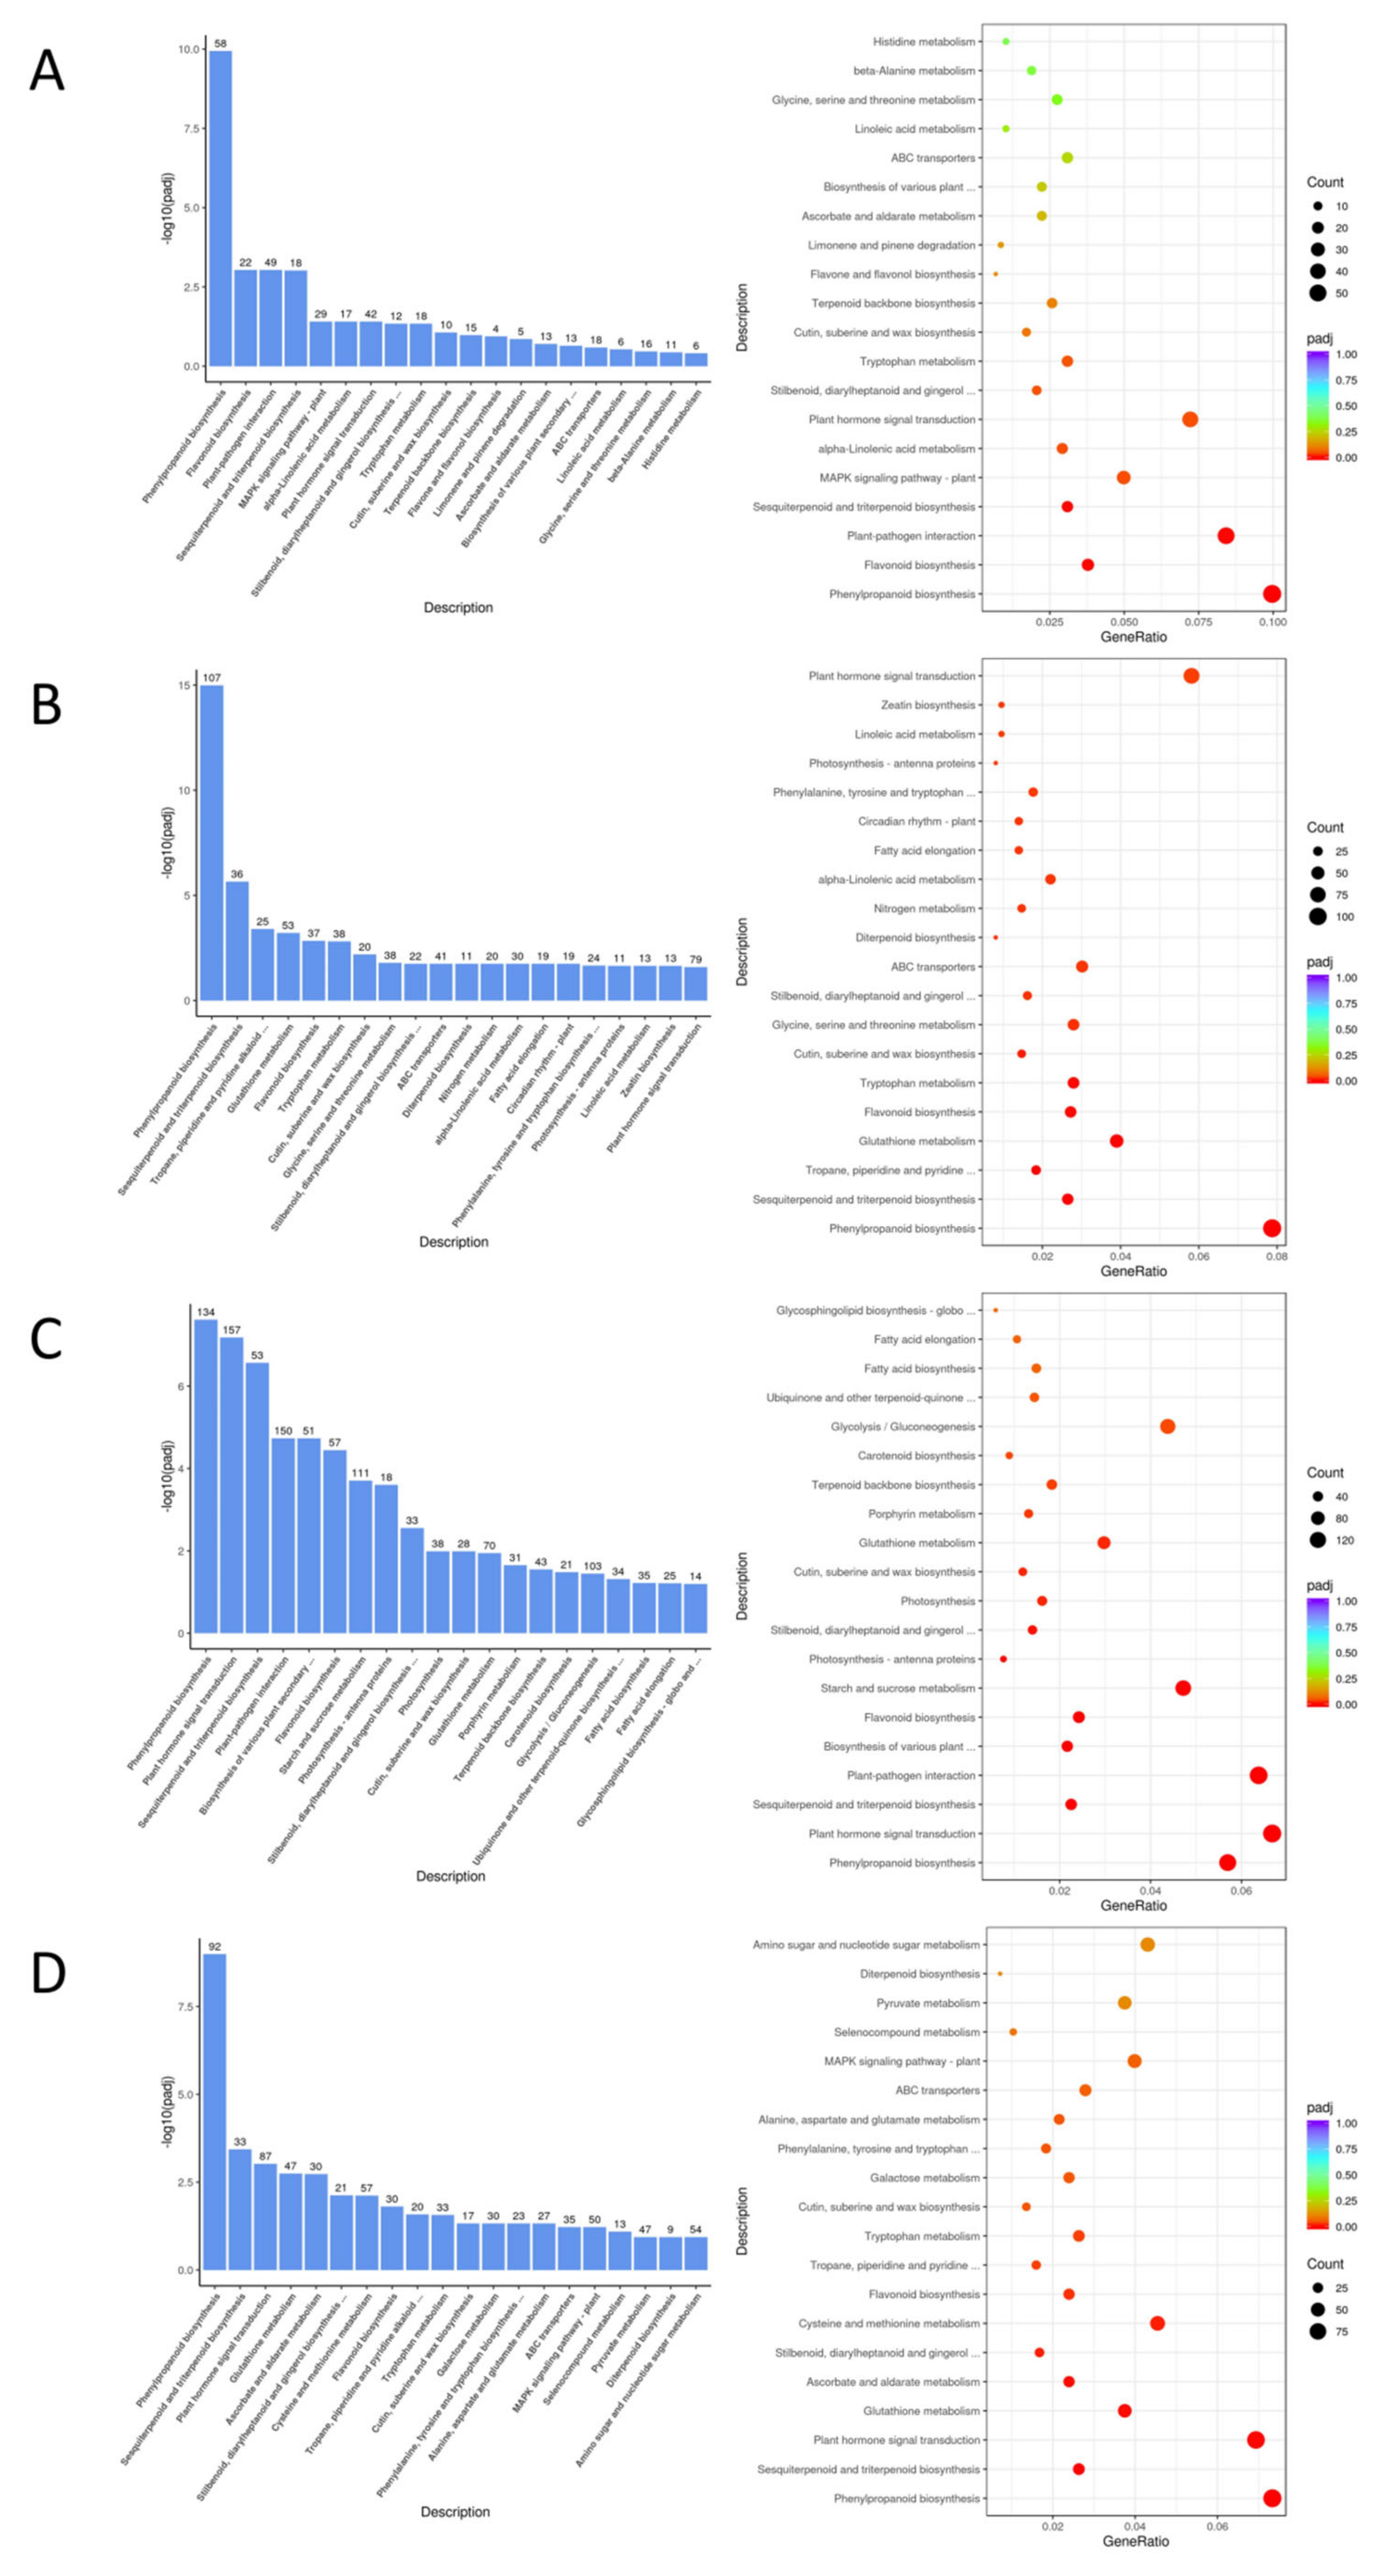
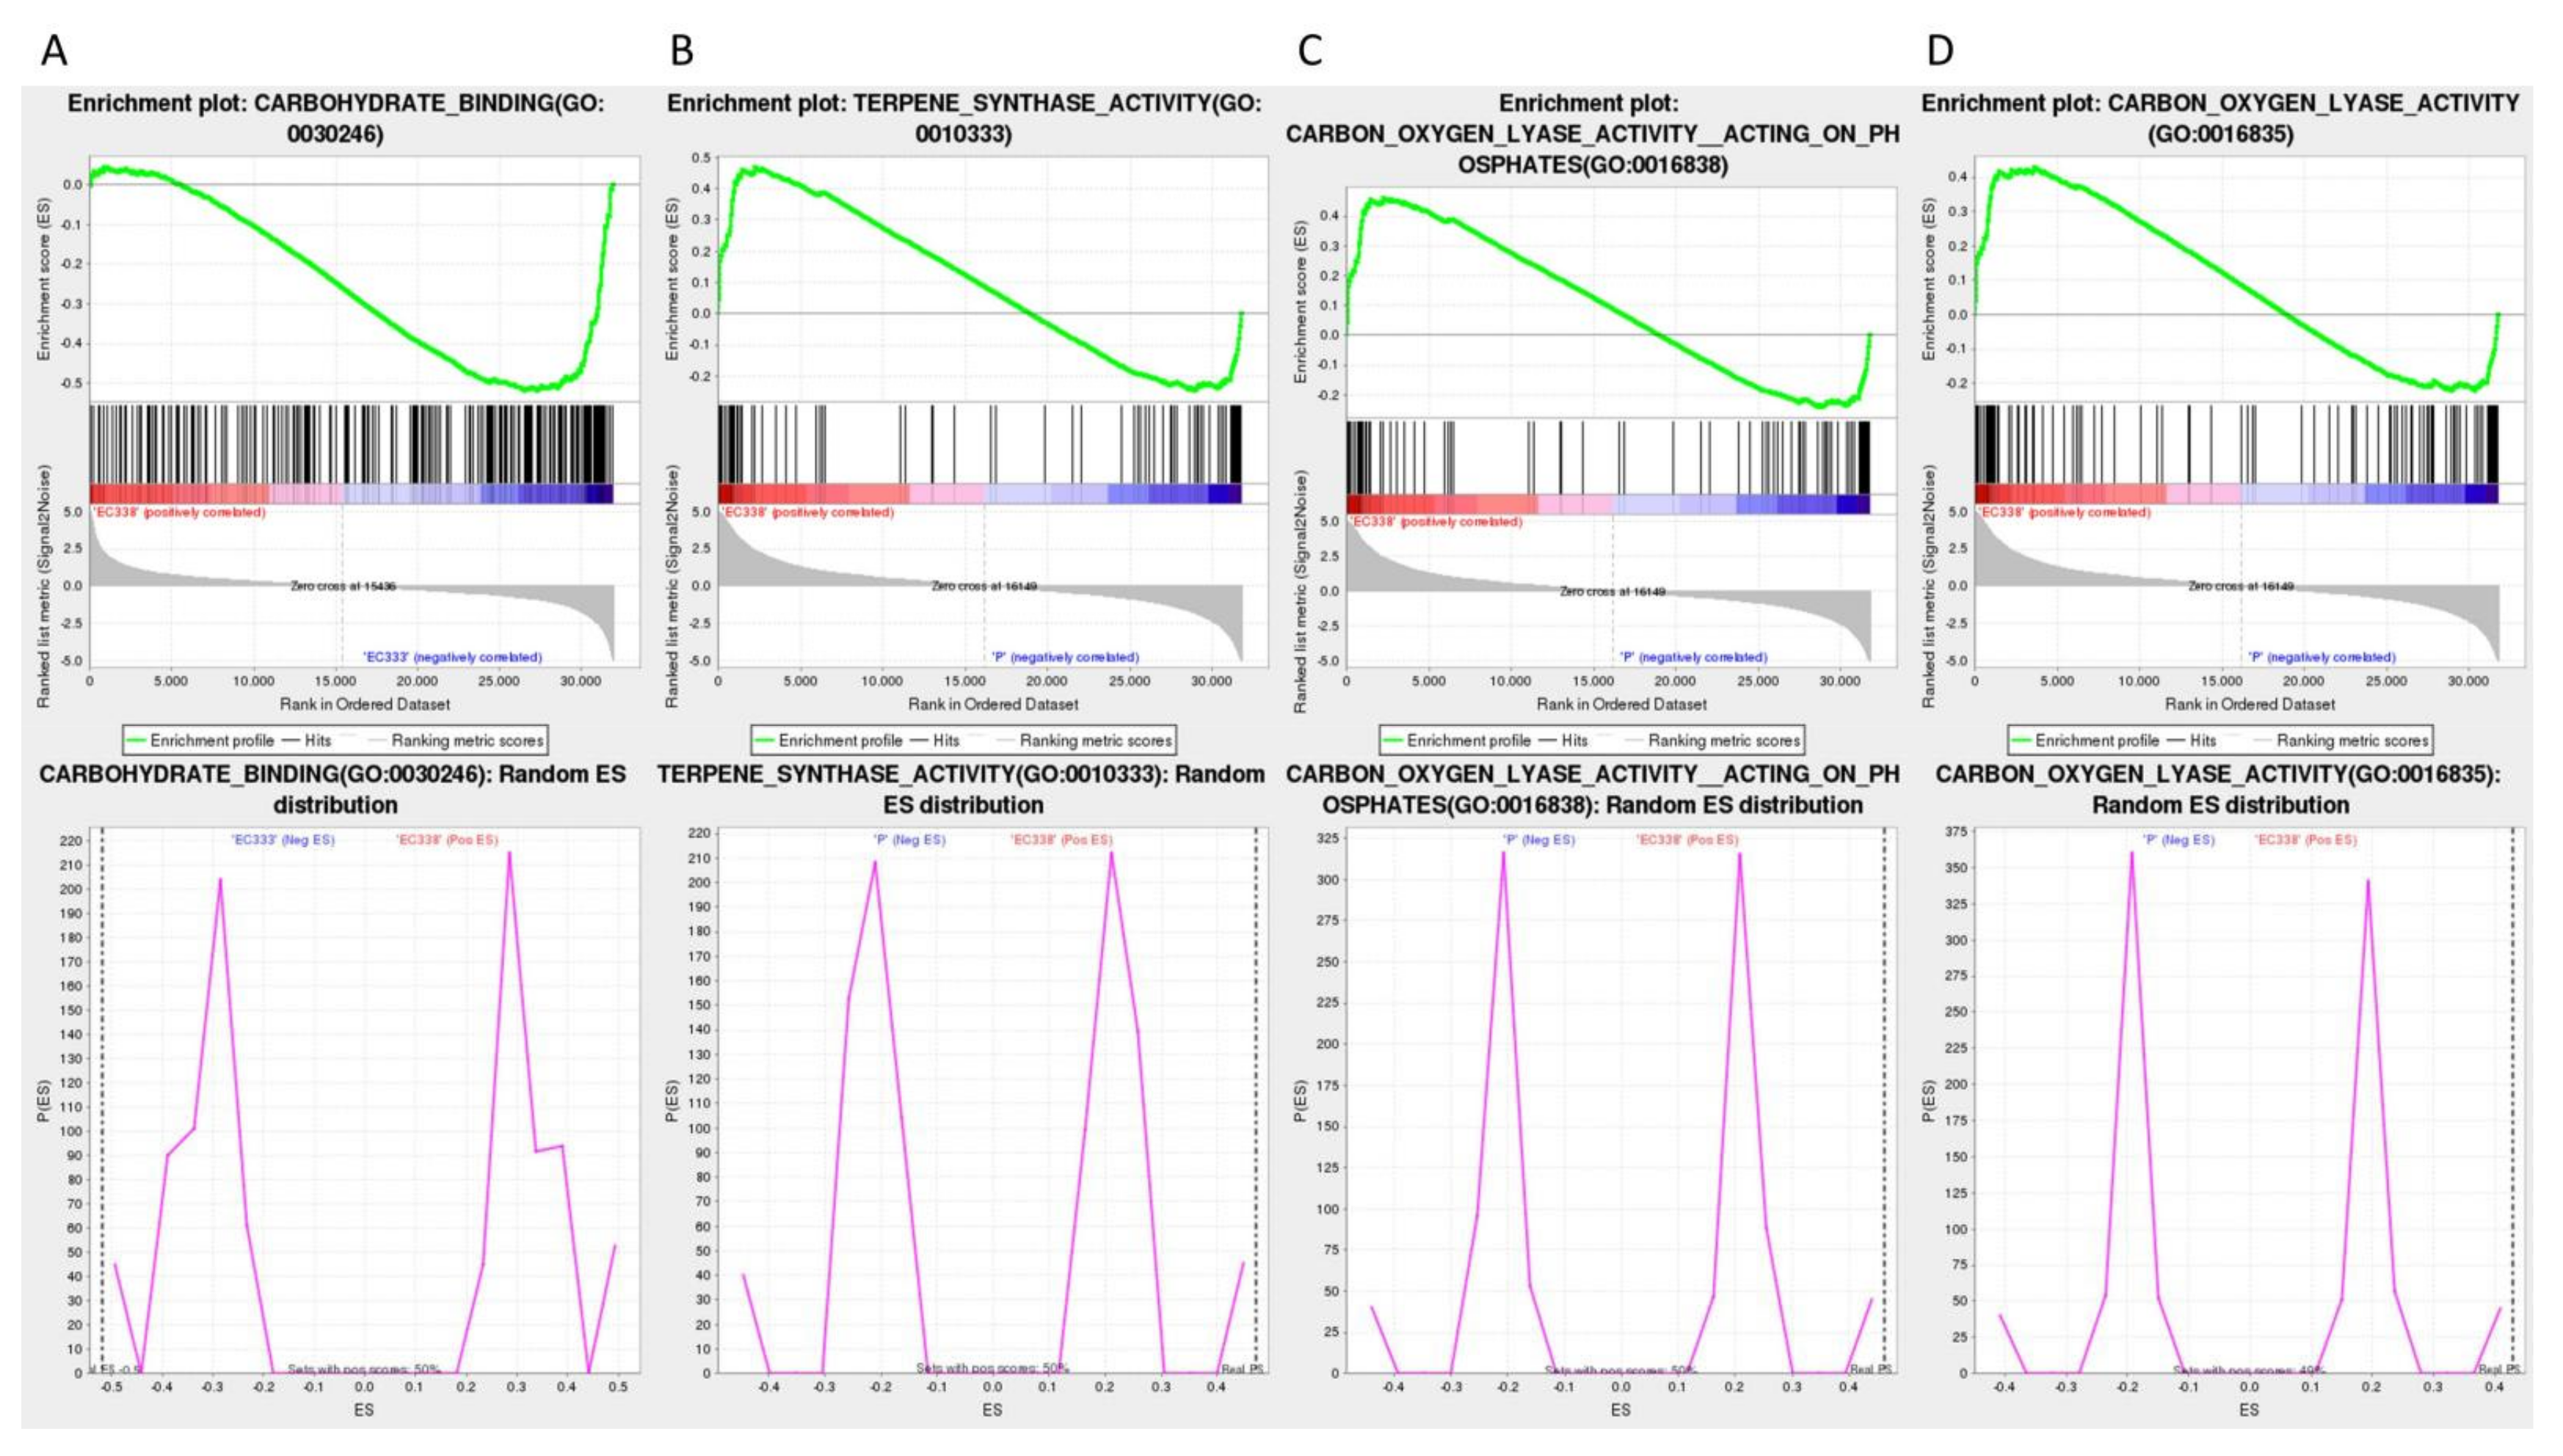
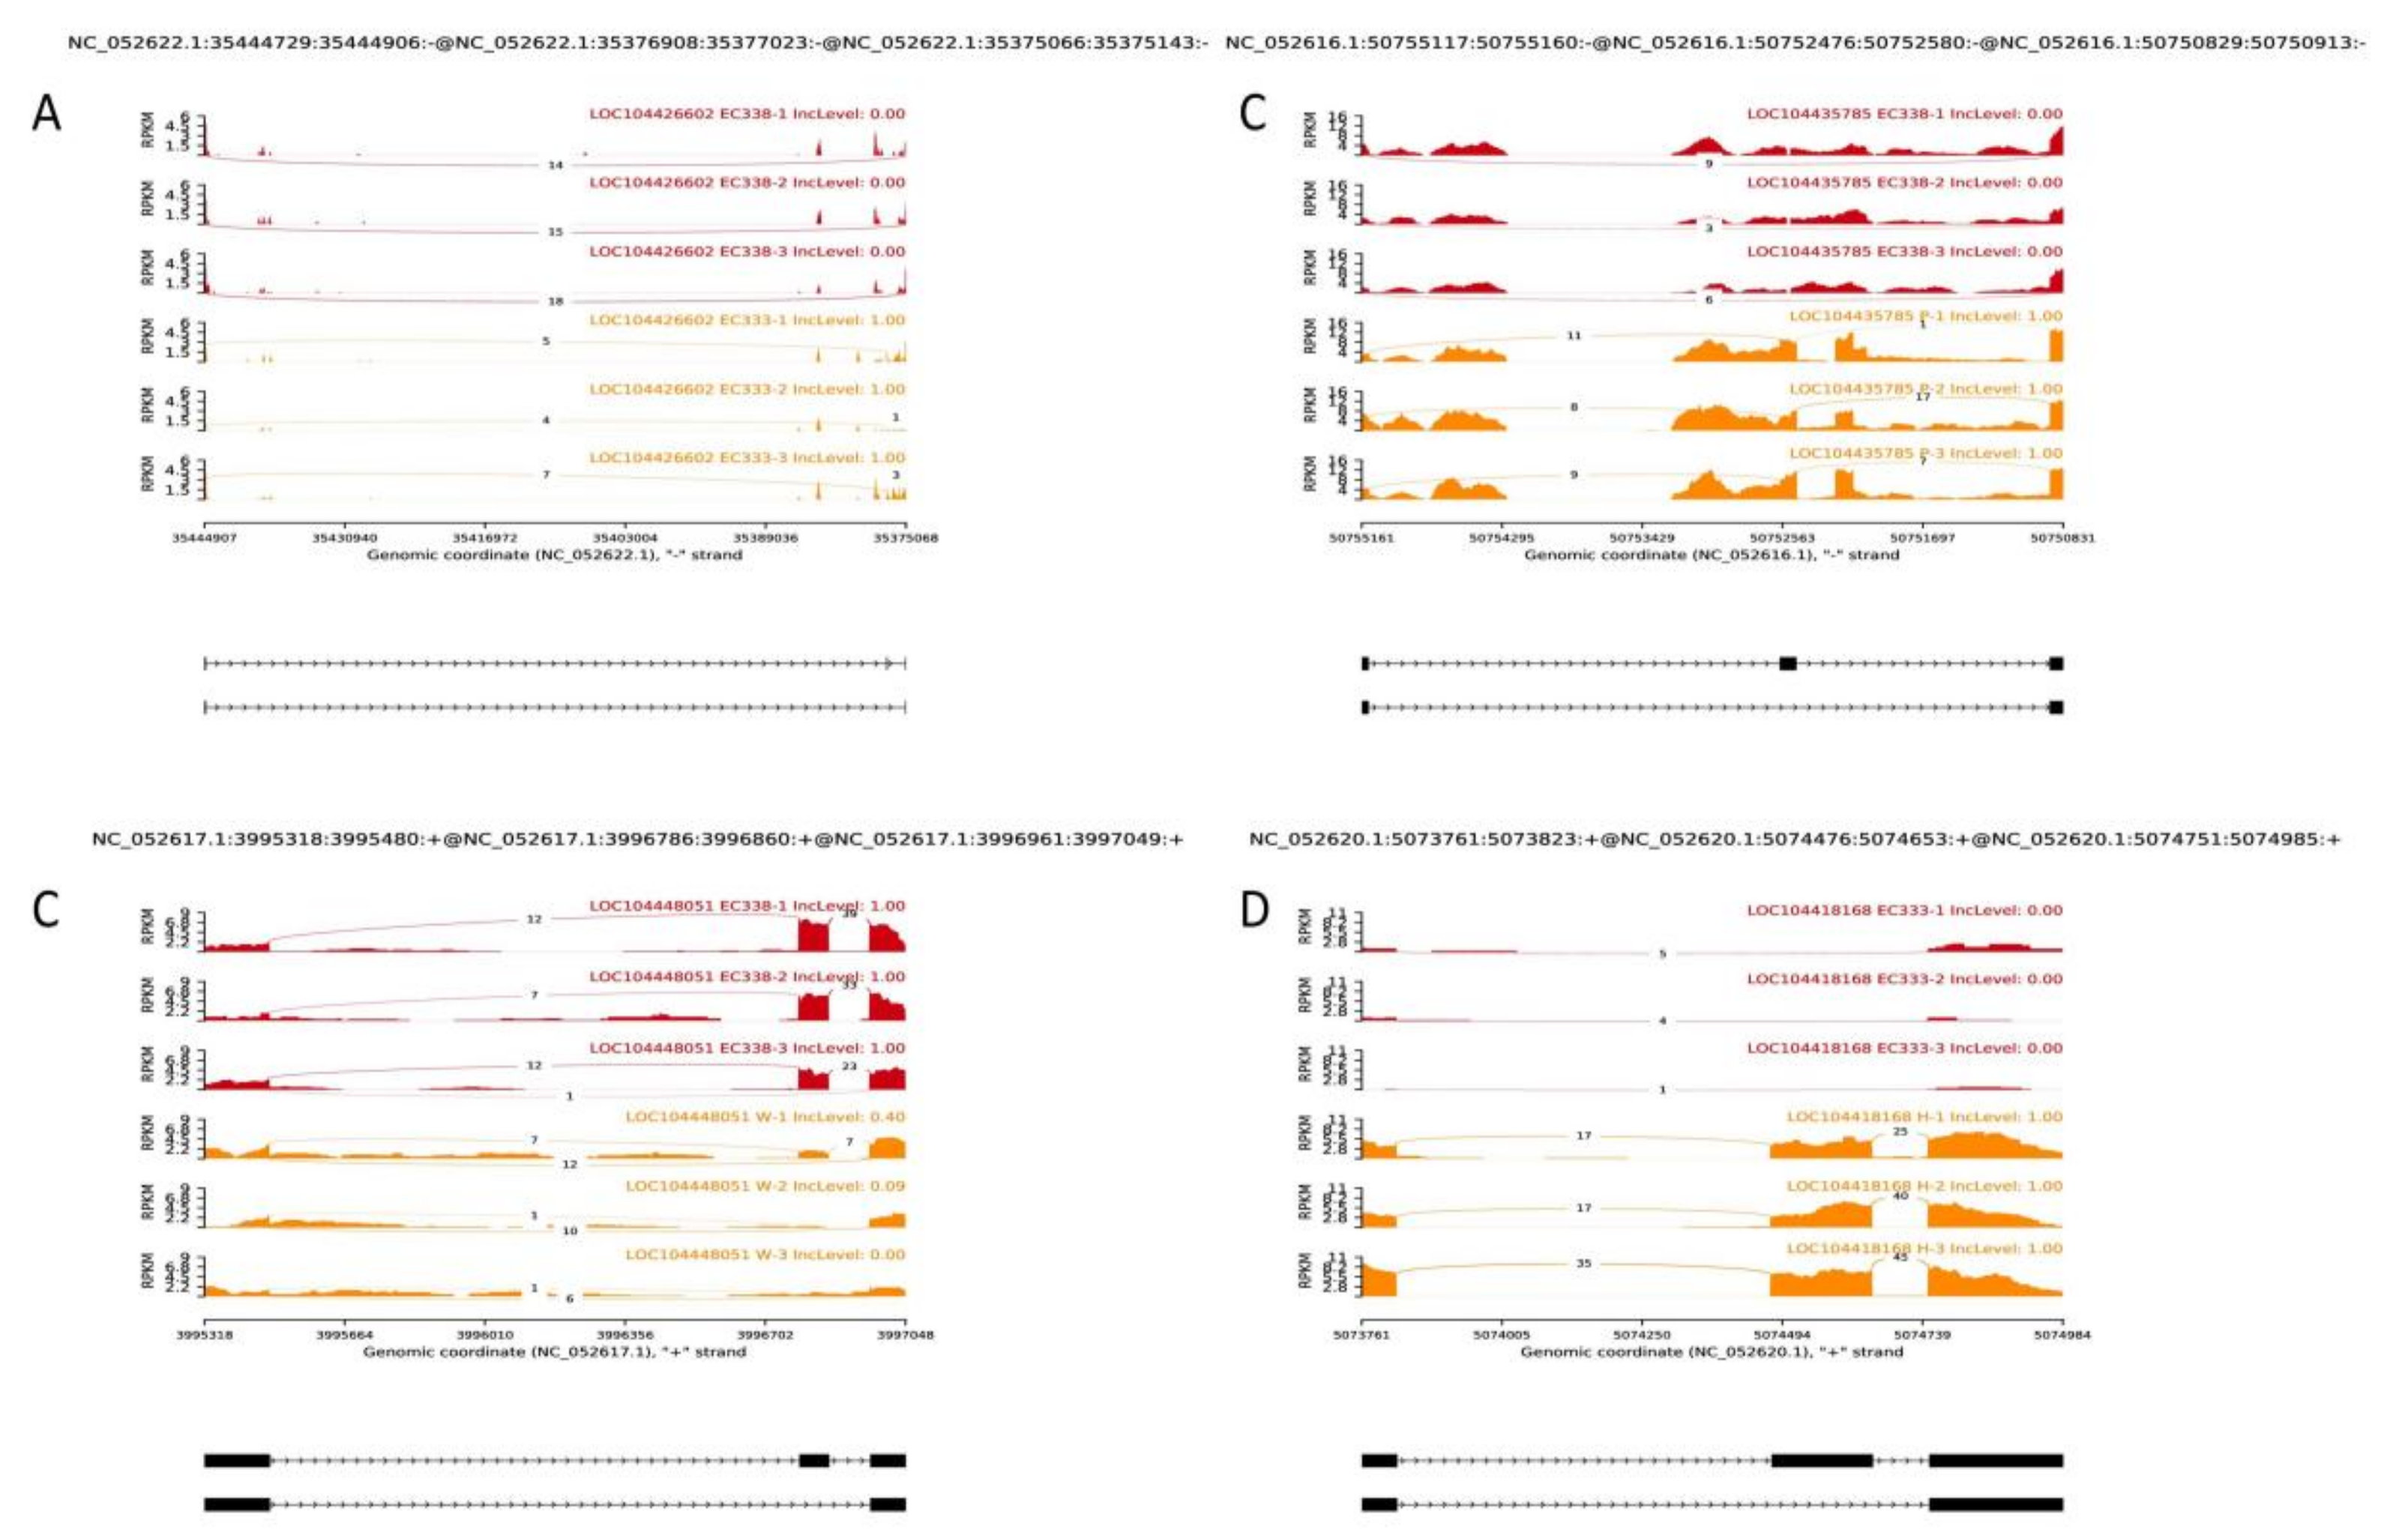
3.6. Alternative Splicing Event Analysis
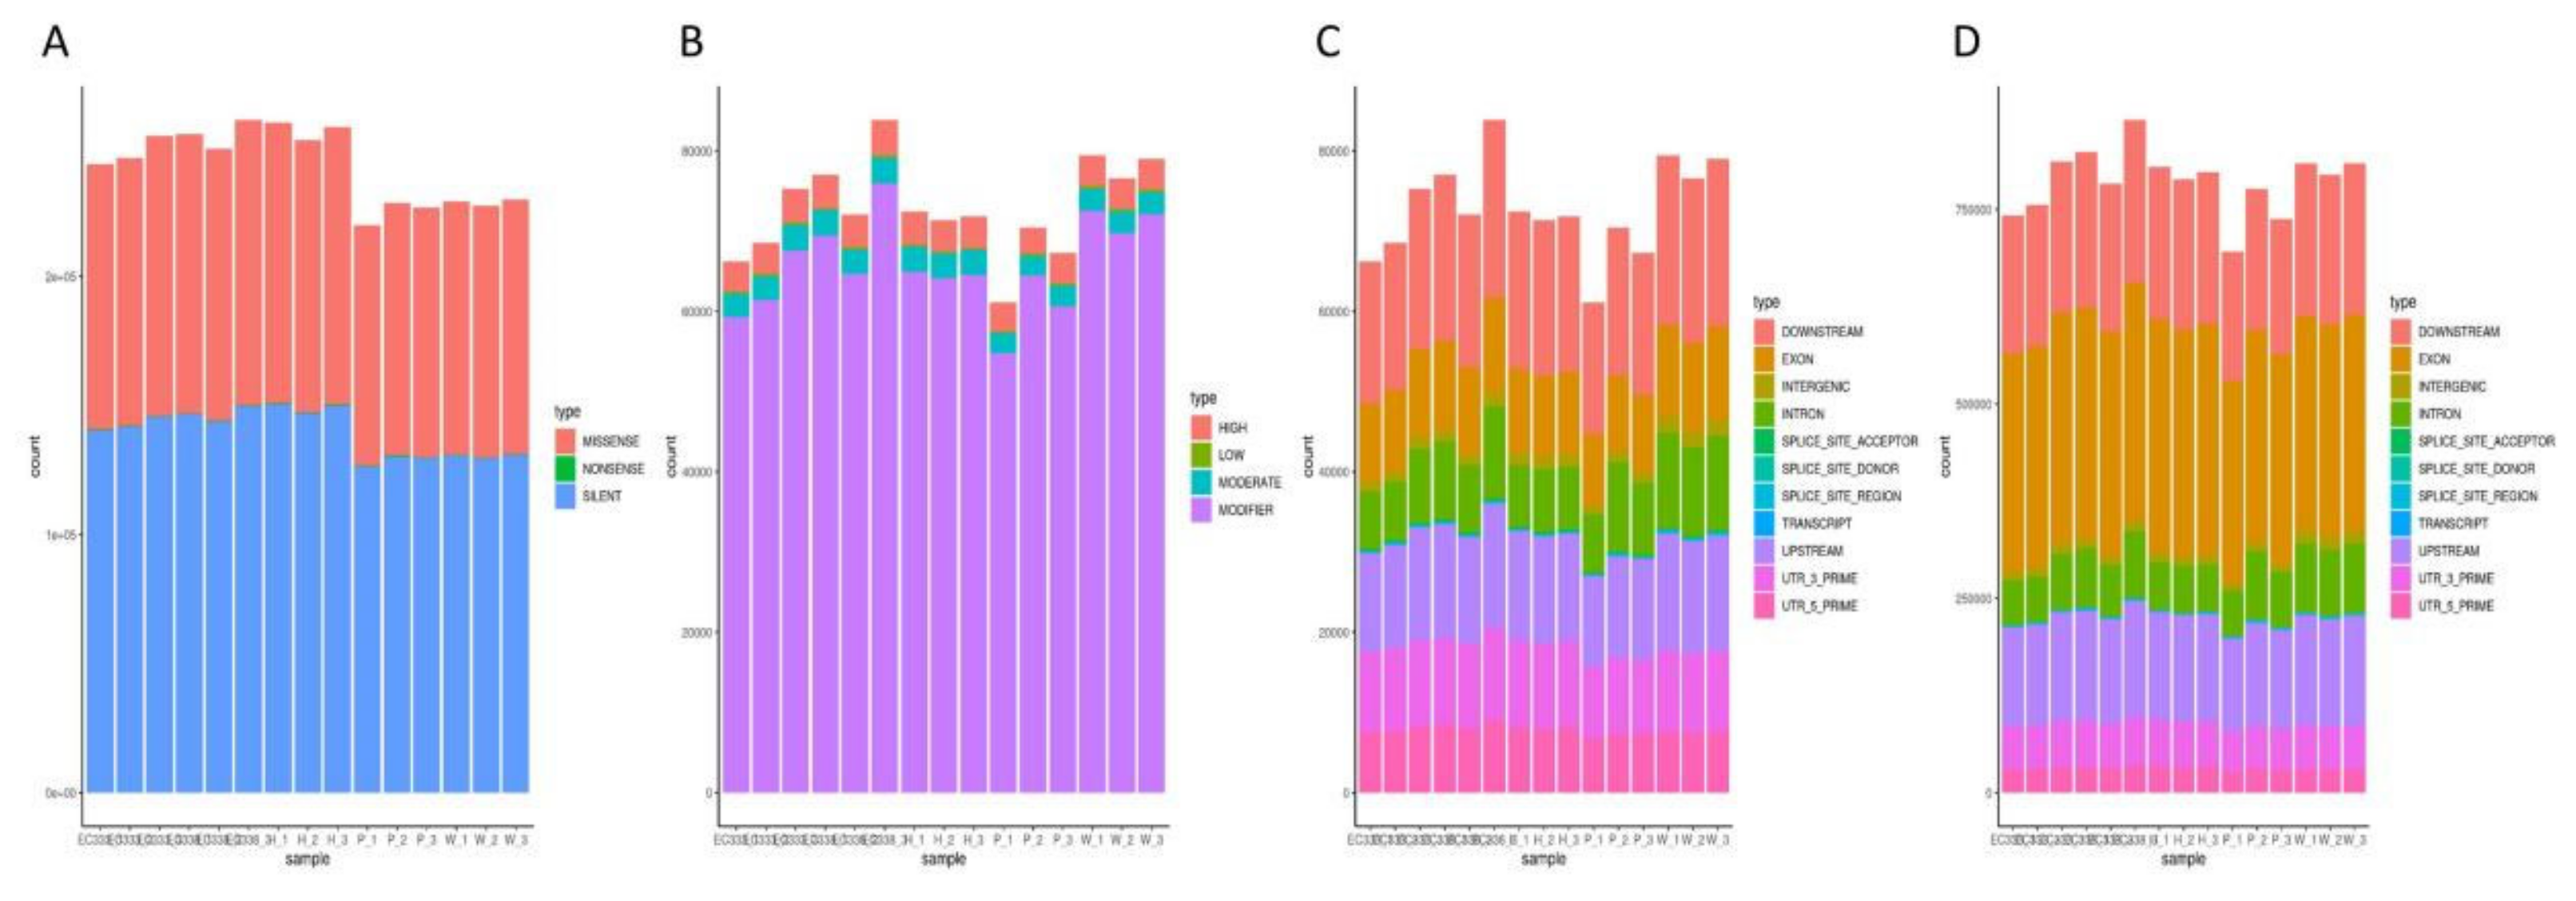
3.7. SNP Variation Loci Analysis
3.8. Weighted Gene Co-Expression Network Analysis
4. Discussion
Supplementary Materials
Author Contributions
Funding
Data Availability Statement
Acknowledgments
Conflicts of Interest
References
- Li, G.Q.; Chen, S.F.; Wu, Z.H.; Zhou, X.D.; Xie, Y.J. Preliminary analyses on diversity and pathogenicity of Calonectria spp. on eucalyptus in China. Chinese Journal of Tropical Crops 2014, 35, 1183–1191. (in Chinese). [Google Scholar]
- Chen, S.F.; Lombard, L.; Roux, J.; Xie, Y.J.; Wingfield, M.J.; Zhou, X.D. Novel species of Calonectria associated with eucalyptus leaf blight in southeast China. Persoonia 2011, 26, 1–12. [Google Scholar] [CrossRef] [PubMed]
- Zhu, J.H.; Guo, W.S.; Chen, H.M.; Wu, J.Q.; Chen, Q.Z.; Meng, X.M. Loss estimation of eucalyptus growth caused by of eucalyptus dieback. Forest Pest and Disease 2011, 30, 6–10. (in Chinese). [Google Scholar]
- Liu, Q.L.; Chen, S.F. Two novel species of Calonectria isolated from soil in a natural forest in China. Mycokeys 2017, 26, 25–60. [Google Scholar] [CrossRef]
- Wang, Q.C.; Chen, S.F. Calonectria pentaseptata causes severe leaf disease of cultivated eucalyptus on the Leizhou peninsula of southern China. Plant Dis. 2020, 104, 493–509. [Google Scholar] [CrossRef] [PubMed]
- Li, G.Q.; Liu, F.F.; Li, J.Q.; Liu, Q.L.; Chen, S.F. Botryosphaeriaceae from eucalyptus plantations and adjacent plants in China. Persoonia 2018, 40, 63–95. [Google Scholar] [CrossRef] [PubMed]
- Wang, C.B.; Lan, J.; Wang, J.Z.; He, W.L.; Lu, W.H.; Lin, Y.; Luo, J.Z. Population structure and genetic diversity in Eucalyptus pellita based on SNP markers. Front. Plant Sci. 2023, 14, 1278427. [Google Scholar] [CrossRef]
- 8. Harwood, C.E.; Nikles, D.G.; Pomroy, P.C.; et al. Genetic improvement of Eucalyptus pellita in north Queensland, Australia. IUFRO Conference on Siliviculture and Improvement of Eucalypt. BAAPA, Salvador 1997, 1, 219–226.
- Poubel, D.S.; Garcia, R.A.; Latorraca, J.V.F.; Carvalho, A.M. Estrutura Anatômica e Propriedades Físicas da Madeira de Eucalyptus pellita F. Muell (Anatomical structure and physical properties of Eucalyptus pellita F. Muell Wood). Floresta e Ambiente 2011, 18, 117–126. [Google Scholar] [CrossRef]
- Leksono, B.; Kurinobu, S.; Ide, Y. Optimum age for selection based on a time trend of genetic parameters related to diameter growth in seedling seed orchards of Eucalyptus pellita, in Indonesia. J. Forest RES-JPN. 2006, 11, 359–364. [Google Scholar] [CrossRef]
- Qin, L.; Zhao, Y.K.; Huang, R.F.; Lu, J.X.; Luo, J.Z. Genetic variation of growth strains and growth of 8-year-old Eucalyptus pellita. Journal of Central South University of Forestry & Technology (in Chinese). 2008, 28, 58–63(in Chinese).
- Nirsatmanto, A.; Leksono, B.; Kurinobu, S.; Shiraishi, S. Realized genetic gain observed in second-generation seedling seed orchards of Acacia mangium, in South Kalimantan, Indonesia. J. Forest RES-JPN. 2004, 9, 265–269. [Google Scholar] [CrossRef]
- Leksono B, Kurinobu S. Trend of within family-plot selection practised in three seedling seed orchards of Eucalyptus pellita in Indonesia. J. TROP. FOR. SCI. 2005, 18, 121–126.
- Brawner, J.T.; Bush, D.J.; Macdonell, P.F.; Warburton, P.M.; Clegg, P.A. Genetic parameters of red mahogany breeding populations grown in the tropics. AUST. FORESTRY 2010, 73, 177–183. [Google Scholar] [CrossRef]
- Liu, X.H.; Luo, J.Z.; Lu, W.H.; Lin, Y.; Wang, C.B.; Qi, J. Genetic characteristics of 2 consecutive Eucalyptus pellita generations in growth and typhoon resistance. Molecular Plant Breeding 2017, 15, 5103–5111. (in Chinese). [Google Scholar]
- Shang, L.G.; Gao, Z.Y. Qian, Q. Progress in understanding the genetic basis of heterosis in crops. Chin. Bull. Bot. 2017, 52, 10–18. (in Chinese). [Google Scholar]
- Alisoltani, A.; Fallahi, H.; Shiran, B.; Alisoltani, A.; Ebrahimie, E. RNA-Seq SSRs and small RNA-Seq SSRs: New approaches in cancer biomarker discovery. Gene 2015, 560, 34–43. [Google Scholar] [CrossRef]
- Feng, M.F.; Zhao, J.H.; Li, S.C.; Wei, N.; Kuang, B.W.; Yang, X.P. Molecular genetic mechanisms of heterosis in sugarcane cultivars using a comparative transcriptome analysis of hybrids and ancestral parents. Agron. 2023, 13, 348. [Google Scholar] [CrossRef]
- Fang, Z.D. Research methods for plant diseases. China Agriculture Press. 1998. (in Chinese)
- Liang, X.Y.; Lin, Y.; Lu, W.H. Resistance of 14 eucalypt genotypes to Calonectria leaf blight. Eucalypt Science & Technology 2023, 40, 1–10. (in Chinese). [Google Scholar]
- Anders, S.; Huber, W. Differential expression analysis for sequence count data. Genome biol. 2010, 11, R106. [Google Scholar] [CrossRef]
- Garber, M.; Grabherr, M.G.; Guttman, M.; Trapnell, C. Computational methods for transcriptome annotation and quantification using RNA-seq. Nat. Methods 2011, 8, 469–477. [Google Scholar] [CrossRef] [PubMed]
- Goldstein, L.D.; Cao, Y.; Pau, G.; Lawrence, M.; Wu, T.D.; Seshagiri, S.; Gentleman, R. Prediction and Quantification of Splice Events from RNA-Seq Data. Plos. One 2016, 11, e0156132. [Google Scholar] [CrossRef] [PubMed]
- He, Z.J.; Zhao, X.; Lu, Z.Y.; Wang, H.F.; Liu, P.F.; Zeng, F.Q.; Zhang, Y.J. Comparative transcriptome and gene co-expression network analysis reveal genes and signaling pathways adaptively responsive to varied adverse stresses in the insect fungal pathogen, Beauveria bassiana. J. Invertebr. Pathol. 2018, 151, 169–181.
- Katz, Y.; Wang, E.T.; Airoldi, E.M.; Burge, C.B. Analysis and design of RNA sequencing experiments for identifying isoform regulation. Nat. Methods 2010, 7, 1009–1015. [Google Scholar] [CrossRef] [PubMed]
- Pertea, M.; Pertea, G.M.; Antonescu, C.M.; Chang, T.C.; Mendell, J.T.; Salzberg, S.L. StringTie enables improved reconstruction of a transcriptome from RNA-seq reads. Nat. Biotechnol 2015, 33, 290–295. [Google Scholar] [CrossRef]
- Liao, Y.; Smyth, G.K.; Shi, W. featureCounts: an efficient general purpose program for assigning sequence reads to genomicfeatures. CCF TCBI 2014, 30, 923–930. [Google Scholar] [CrossRef] [PubMed]
- Love, M.I.; Huber, W.; Anders, S. Moderated estimation of fold change and dispersion for RNA-seq data with DESeq2. Genome biol. 2014, 15, 550. [Google Scholar] [CrossRef] [PubMed]
- Kanehisa, M.; Goto, S. KEGG: kyoto encyclopedia of genes and genomes. NAR 2000, 28, 27–30. [Google Scholar] [CrossRef] [PubMed]
- McKenna, A.; Hanna, M.; Banks, E.; Sivachenko, A.; Cibulskis, K.; Kernytsky, A.; Garimella, K.; Altshuler, D.; Gabriel, S.; Daly, M.; et al. The Genome Analysis Toolkit: a MapReduce framework for analyzing next-generation DNA sequencing data. Genome Res. 2010, 20, 1297–1303. [Google Scholar] [CrossRef] [PubMed]
- Myburg, A.A.; Grattapaglia, D.; Tuskan, G.A. Hellsten, U.; Hayes, R.D.; Grimwood, J.; et al. The genome of Eucalyptus grandis. Nature 2014, 510, 356–362.
- Xiong, Z.Q.; Fan, Y.Z.; Song, X.; Xia, Y.J.; Zhang, H.; Ai, L.Z. Z. Short communication: Genome-wide identification of new reference genes for reverse-transcription quantitative PCR in Streptococcus thermophilus based on RNA-sequencing analysis. J. Dairy Sci. 2020, 103, 10001–10005. [Google Scholar] [CrossRef] [PubMed]
- Guo, T.T.; Yang, N.; Tong, H.; Pan, Q.C.; Yang, X.H.; Tang, J.H.; Wang, J.K.; Li, J.S.; Yan, J.B. Genetic basis of grain yield heterosis in an “immortalized F2” maize population. Theor. Appl. Genet. 2014, 127, 2149–2158. [Google Scholar] [CrossRef] [PubMed]
- Zhou, G.; Chen, Y.; Yao, W.; Zhang, C.J.; Xie, W.B.; Hua, J.P.; Xing, Y.Z.; Xiao, J.H.; Zhang, Q.F. Genetic composition of yield heterosis in an elite rice hybrid. PNAS 2012, 109, 15847–15852. [Google Scholar] [CrossRef] [PubMed]
- Keadtidumrongkul, P.; Suttangkakul, A.; Pinmanee, P.; Pattana, K.; Kittiwongwattana, C.; Apisitwanich, S.; Vuttipongchaikij, S. Growth modulation effects of CBM2a under the control of AtEXP4 and CaMV35S promoters in Arabidopsis thaliana, Nicotiana tabacum and Eucalyptus camaldulensis. Transgenic Res. 2017, 26, 447–463. [Google Scholar] [CrossRef] [PubMed]
- Obembe, O.O.; Jacobsen, E.; Timmers, J.; Gilbert, H.; Blake, A.W.; Knox, J.P.; Visser, R.G.F.; Vincken, J.P. Promiscuous, non-catalytic, tandem carbohydrate-binding modules modulate the cell-wall structure and development of transgenic tobacco (Nicotiana tabacum) plants. J. Plant Res. 2007, 120, 605–617. [Google Scholar] [CrossRef] [PubMed]
- Peter, G.F. Breeding and Engineering Trees to Accumulate High Levels of Terpene Metabolites for Plant Defense and Renewable Chemicals. Front. Plant Sci. 2018, 9. [Google Scholar] [CrossRef] [PubMed]
- Franceschi, V.R.; Krokene, P.; Christiansen, E.; Krekling, T. Anatomical and chemical defenses of conifer bark against bark beetles and other pests. New Phytol. 2005, 167, 353–375. [Google Scholar] [CrossRef]
- King, D.J.; Gleadow, R.M.; Woodrow, I.E. Regulation of oil accumulation in single glands of Eucalyptus polybractea. New Phytol. 2006, 172, 440–451. [Google Scholar] [CrossRef]
- Naidoo, S.; Kulheim, C.; Zwart, L.; Mangwanda, R.; Oates, C.N.; Visser, E.A. Uncovering the defence responses of eucalyptus to pests and pathogens in the genomics age. Tree Physiol. 2014, 34, 931–943. [Google Scholar] [CrossRef]
- Trapp, S.; Croteau, R. Defensive resin biosynthesis in conifers. Annu. Rev. Plant Physiol. Plant Mol. Biol. 2001, 52, 689–724. [Google Scholar] [CrossRef]
- Hodges, J.D.; Nebeker, T.E.; Deangelis, J.D.; Karr, B.L.; Blanche, C.A. Host resistance and mortality: a hypothesis based on southern pine beetle-microorganism-host interactions. Bull. Entomol. Soc. Am. 1985, 31, 31–35. [Google Scholar] [CrossRef]
- Strom, B.L.; Goyer, R.A.; Ingram, L.L.; Boyd, G.D.L.; Lott, L.H. Oleoresin characteristics of progeny of loblolly pines that escaped attack by the southern pine beetle. For. Ecol. Manag. 2002, 158, 169–178. [Google Scholar] [CrossRef]
- Klepzig, K.D.; Robison, D.J.; Fowler, G.; Minchin, P.R.; Hain, F.P.; Allen, H.L. Effects of mass inoculation on induced oleoresin response in intensively managed loblolly pine. Tree Physiol. 2005, 25, 681–688. [Google Scholar] [CrossRef] [PubMed]
- Zhang, Q.Y.; Li, Y.; Sun, L.; Chu, S.Y.; Xu, H.W.; Zhou, X.F. Integration of transcriptomic and proteomic analyses of Rhododendron chrysanthum Pall. in response to cold stress in the Changbai Mountains. Mol. Biol. Rep. 2023, 50, 3607–3616. [Google Scholar] [CrossRef] [PubMed]
- Volkov, A.; Liavonchanka, A.; Kamneva, O.; Fiedler, T.; Goebel, C.; Kreikemeyer, B.; Feussner, I. Myosin Cross-reactive Antigen of Streptococcus pyogenes M49 Encodes a Fatty Acid Double Bond Hydratase that plays a role in oleic acid detoxification and bacterial virulence. J. Biol. Chem. 2010, 285, 10353–10361. [Google Scholar] [CrossRef]
- Ma, S.S.; Sun, C.Z.; Su, W.N.; Zhao, W.J.; Zhang, S.; Su, S.Y.; Xie, B.Y.; Kong, L.J.; Zheng, J.S. Transcriptomic and physiological analysis of atractylodes chinensis in response to drought stress reveals the putative genes related to sesquiterpenoid biosynthesis. BMC Plant Biol. 2024, 24, 91. [Google Scholar] [CrossRef]
- Singh, P.P.; Joshi, R.; Kumar, R.; Kumar, A.; Sharma, U. Comparative phytochemical analysis of Ferula assa-foetida with Ferula jaeschkeana and commercial oleo-gum resins using GC-MS and UHPLC-PDA-QTOF-IMS. Food Res. Int. 2023, 164, 112434. [Google Scholar] [CrossRef] [PubMed]
- Xu, J.R.; Du, R.Y.; Wang, Y.; Chen, J.H. RNA-Sequencing reveals the involvement of sesquiterpene biosynthesis genes and transcription factors during an early response to mechanical wounding of aquilaria sinensis. Genes. 2023, 14, 464. [Google Scholar] [CrossRef] [PubMed]
- Gan, T.T.; Lin, Z.W.; Bao, L.J.; Hui, T.; Cui, X.P.; Huang, Y.Z.; Wang, H.X.; Su, C.; Jiao, F.; Zhang, M.J.; et al. Comparative proteomic analysis of tolerant and sensitive varieties reveals that phenylpropanoid biosynthesis contributes to salt tolerance in mulberry. Int. J. Mol. Sci. 2021, 22, 9402. [Google Scholar] [CrossRef] [PubMed]
- Chen, Q.L.; Zhang, R.Z.; Li, D.L.; Wang, F. Transcriptomic and coexpression network analyses revealed pine chalcone synthase genes associated with pine wood nematode infection. Int. J. Mol. Sci. 2021, 22, 11195. [Google Scholar] [CrossRef]
- Li, J.B.; Ai, M.T.; Hou, J.; Zhu, P.Q. Cui, X.M.; Yang, Q. Plant-pathogen interaction with root rot of panax notoginseng as a model: Insight into pathogen pathogenesis, plant defence response and biological control. Mol. Plant Pathol. 2024, 25, e13427. [Google Scholar] [CrossRef]
- Ngou, B.P.M.; Ahn, H.K.; Ding, P.T.; Jones, J.D.G. Mutual potentiation of plant immunity by cell-surface and intracellular receptors. Nature 2021, 592, 110–115. [Google Scholar] [CrossRef] [PubMed]
- Yuan, M.H.; Jiang, Z.Y.; Bi, G.Z.; Nomura, K.Y.; Liu, M.H.; Wang, Y.P.; Cai, B.Y.; Zhou, J.M.; He, S.Y.; Xin, X.F. Pattern-recognition receptors are required for NLR-mediated plant immunity. Nature 2021, 592, 105–109. [Google Scholar] [CrossRef] [PubMed]
- Gorshkov, V.; Tsers, I. Plant susceptible responses: the underestimated side of plant-pathogen interactions. Biol. Rev. Camb. Philos. Soc. 2022, 97, 45–66. [Google Scholar] [CrossRef] [PubMed]
- Seybold, H.; Demetrowitsch, T.J.; Hassani, M.A.; Szymczak, S.; Reim, E.; Haueisen, J.; Lübbers, L.; Rühlemann, M.; Franke, A.; Schwarz, K.; et al. A fungal pathogen induces systemic susceptibility and systemic shifts in wheat metabolome and microbiome composition. Nat. Commun. 2020, 11, 1910. [Google Scholar] [CrossRef] [PubMed]
- Bonora, F.S.; Nahrung, H.F.; Hayes, R.A.; Scharaschkin, T.; Pegg, G.; Lee, D.J. Changes in leaf chemistry and anatomy of Corymbia citriodora subsp. variegata (Myrtaceae) in response to native and exotic pathogens. Australas. Plant Path. 2020, 49, 641–653. [Google Scholar] [CrossRef]
- Wang, R.; Li, G.; Li, Y. Effects of inducers on relevant resistant substance in colored cotton. Cotton Science. 2005, 17, 107–111 (in Chinese). (in Chinese). [Google Scholar]
- Yin, Y.Q.; Qi, F.; Gao, L.; Rao, S.; Yang, Z.; Fang, W. iTRAQ-based quantitativeproteomic analysis of dark-germinated soybeans in responseto salt stress. RSC Advances. 2018, 8, 17905–17913. [Google Scholar] [CrossRef] [PubMed]
- Yang, Q.; Li, J.B.; Sun, J.L.; Cui, X.M. Comparative transcriptomic and proteomic analyses to determine the lignin synthesis pathway involved in the fungal stress response in panax notoginseng. Physiol. Mol. Plant P. 2022, 119, 101814. [Google Scholar] [CrossRef]
| Hybrids | Susceptibility | Female | Species | Male | Species |
|---|---|---|---|---|---|
| EC338 | resistant | W1767 | E. Wetarensis | P9060 | E. pellita |
| EC333 | susceptible | H1522 | E. urophylla × E. pellita | Unknown | E. urophylla |
| Comparisons | GO | KEGG |
|---|---|---|
| EC338 VS EC333 | Carbohydrate binding, Pattern binding, Polysaccharide binding (−log10(padj)>6) | Phenylpropanoid biosynthesis, Flavonoid biosynthesis, Plant-pathogen interaction, Sesquiterpenoid and triterpenoid biosynthesis (−log10(padj)>2.5) |
| EC338 VS P9060 | Terpene synthase activity, Carbon-oxygen lyase activity, acting on phosphates, Carbon−oxygen lyase activity (−log10(padj)>10) | Phenylpropanoid biosynthesis, Sesquiterpenoid and triterpenoid biosynthesis (−log10(padj)>5) |
| EC338 VS W1767 | DNA binding transcription factor activity, Terpene synthase activity, Carbon-oxygen lyase activity, acting on phosphates, Iron ion binding, Tanscription regulator activity (−log10(padj)>6) | Phenylpropanoid biosynthesis, Plant hormone signal transduction, Sesquiterpenoid and triterpenoid biosynthesis, Plant-pathogen interaction, Biosynthesis of various plant secondary …, Flavonoid biosynthesis (−log10(padj)>4) |
| EC333 VS H1522 | Carbohydrate binding, Terpene synthase activity, Carbon-oxygen lyase activity, acting on phosphates, Carbon-oxygen lyase activity (−log10(padj)>4) |
Phenylpropanoid biosynthesis (−log10(padj)>7.5) |
| Differential genotypes | Genotypes | Name | Size | ES | NES | NOM p-val |
FDR q-val | FWER p-val | Rank at max | Leading edge |
|---|---|---|---|---|---|---|---|---|---|---|
| EC338 VS EC333 | EC333 | Carbohydrate binding (GO:0030246) | 286 | -0.519 | -1.580 | 0 | 0.171 | 0.75 | 5450 | tags=40%, list=17%, signal=48% |
| EC338 VS P9060 | EC338 | Terpene synthase activity (GO:0010333) | 86 | 0.469 | 1.952 | 0 | 0.201 | 0.188 | 2191 | tags=36%, list=7%, signal=39% |
| EC338 | Carbon-oxygen lyase activity, acting on phosphates (GO:0016838) | 89 | 0.462 | 1.939 | 0 | 0.149 | 0.188 | 2191 | tags=35%, list=7%, signal=37% |
|
| EC338 | Carbon-oxygen lyase activity (GO:0016835) | 112 | 0.429 | 2.024 | 0 | 0.098 | 0.047 | 3561 | tags=35%, list=11%, signal=39% |
| Differential genotypes | Genotypes | Name | Size | ES | NES | NOM p-val | FDR q-val | FWER p-val | Rank at max | Leading edge |
|---|---|---|---|---|---|---|---|---|---|---|
| EC338 VS EC333 | EC338 | Sesquiterpenoid and triterpenoid biosynthesis (EGR00909) | 65 | 0.610 | 1.714 | 0 | 0.066 | 0.093 | 3071 | tags=35%, list=10%, signal=39% |
| EC338 VS W1767 | EC338 | Phenylpropanoid biosynthesis (EGR00940) | 224 | 0.369 | 1.900 | 0 | 0.048 | 0.048 | 3594 | tags=27%, list=11%, signal=30% |
| W1767 | Plant-pathogen interaction (EGR04626) | 281 | -0.455 | -1.501 | 0 | 0.178 | 0.599 | 4752 | tags=37%, list=15%, signal=43% | |
| EC338 | Flavonoid biosynthesis (EGR00941) | 89 | 0.521 | 1.455 | 0 | 0.103 | 0.760 | 4985 | tags=42%, list=15%, signal=49% |
Disclaimer/Publisher’s Note: The statements, opinions and data contained in all publications are solely those of the individual author(s) and contributor(s) and not of MDPI and/or the editor(s). MDPI and/or the editor(s) disclaim responsibility for any injury to people or property resulting from any ideas, methods, instructions or products referred to in the content. |
© 2024 by the authors. Licensee MDPI, Basel, Switzerland. This article is an open access article distributed under the terms and conditions of the Creative Commons Attribution (CC BY) license (http://creativecommons.org/licenses/by/4.0/).


