Submitted:
22 August 2024
Posted:
23 August 2024
You are already at the latest version
Abstract
Keywords:
1. Introduction
2. Materials and Methods
2.1. Data
2.2. Measures
3. Results
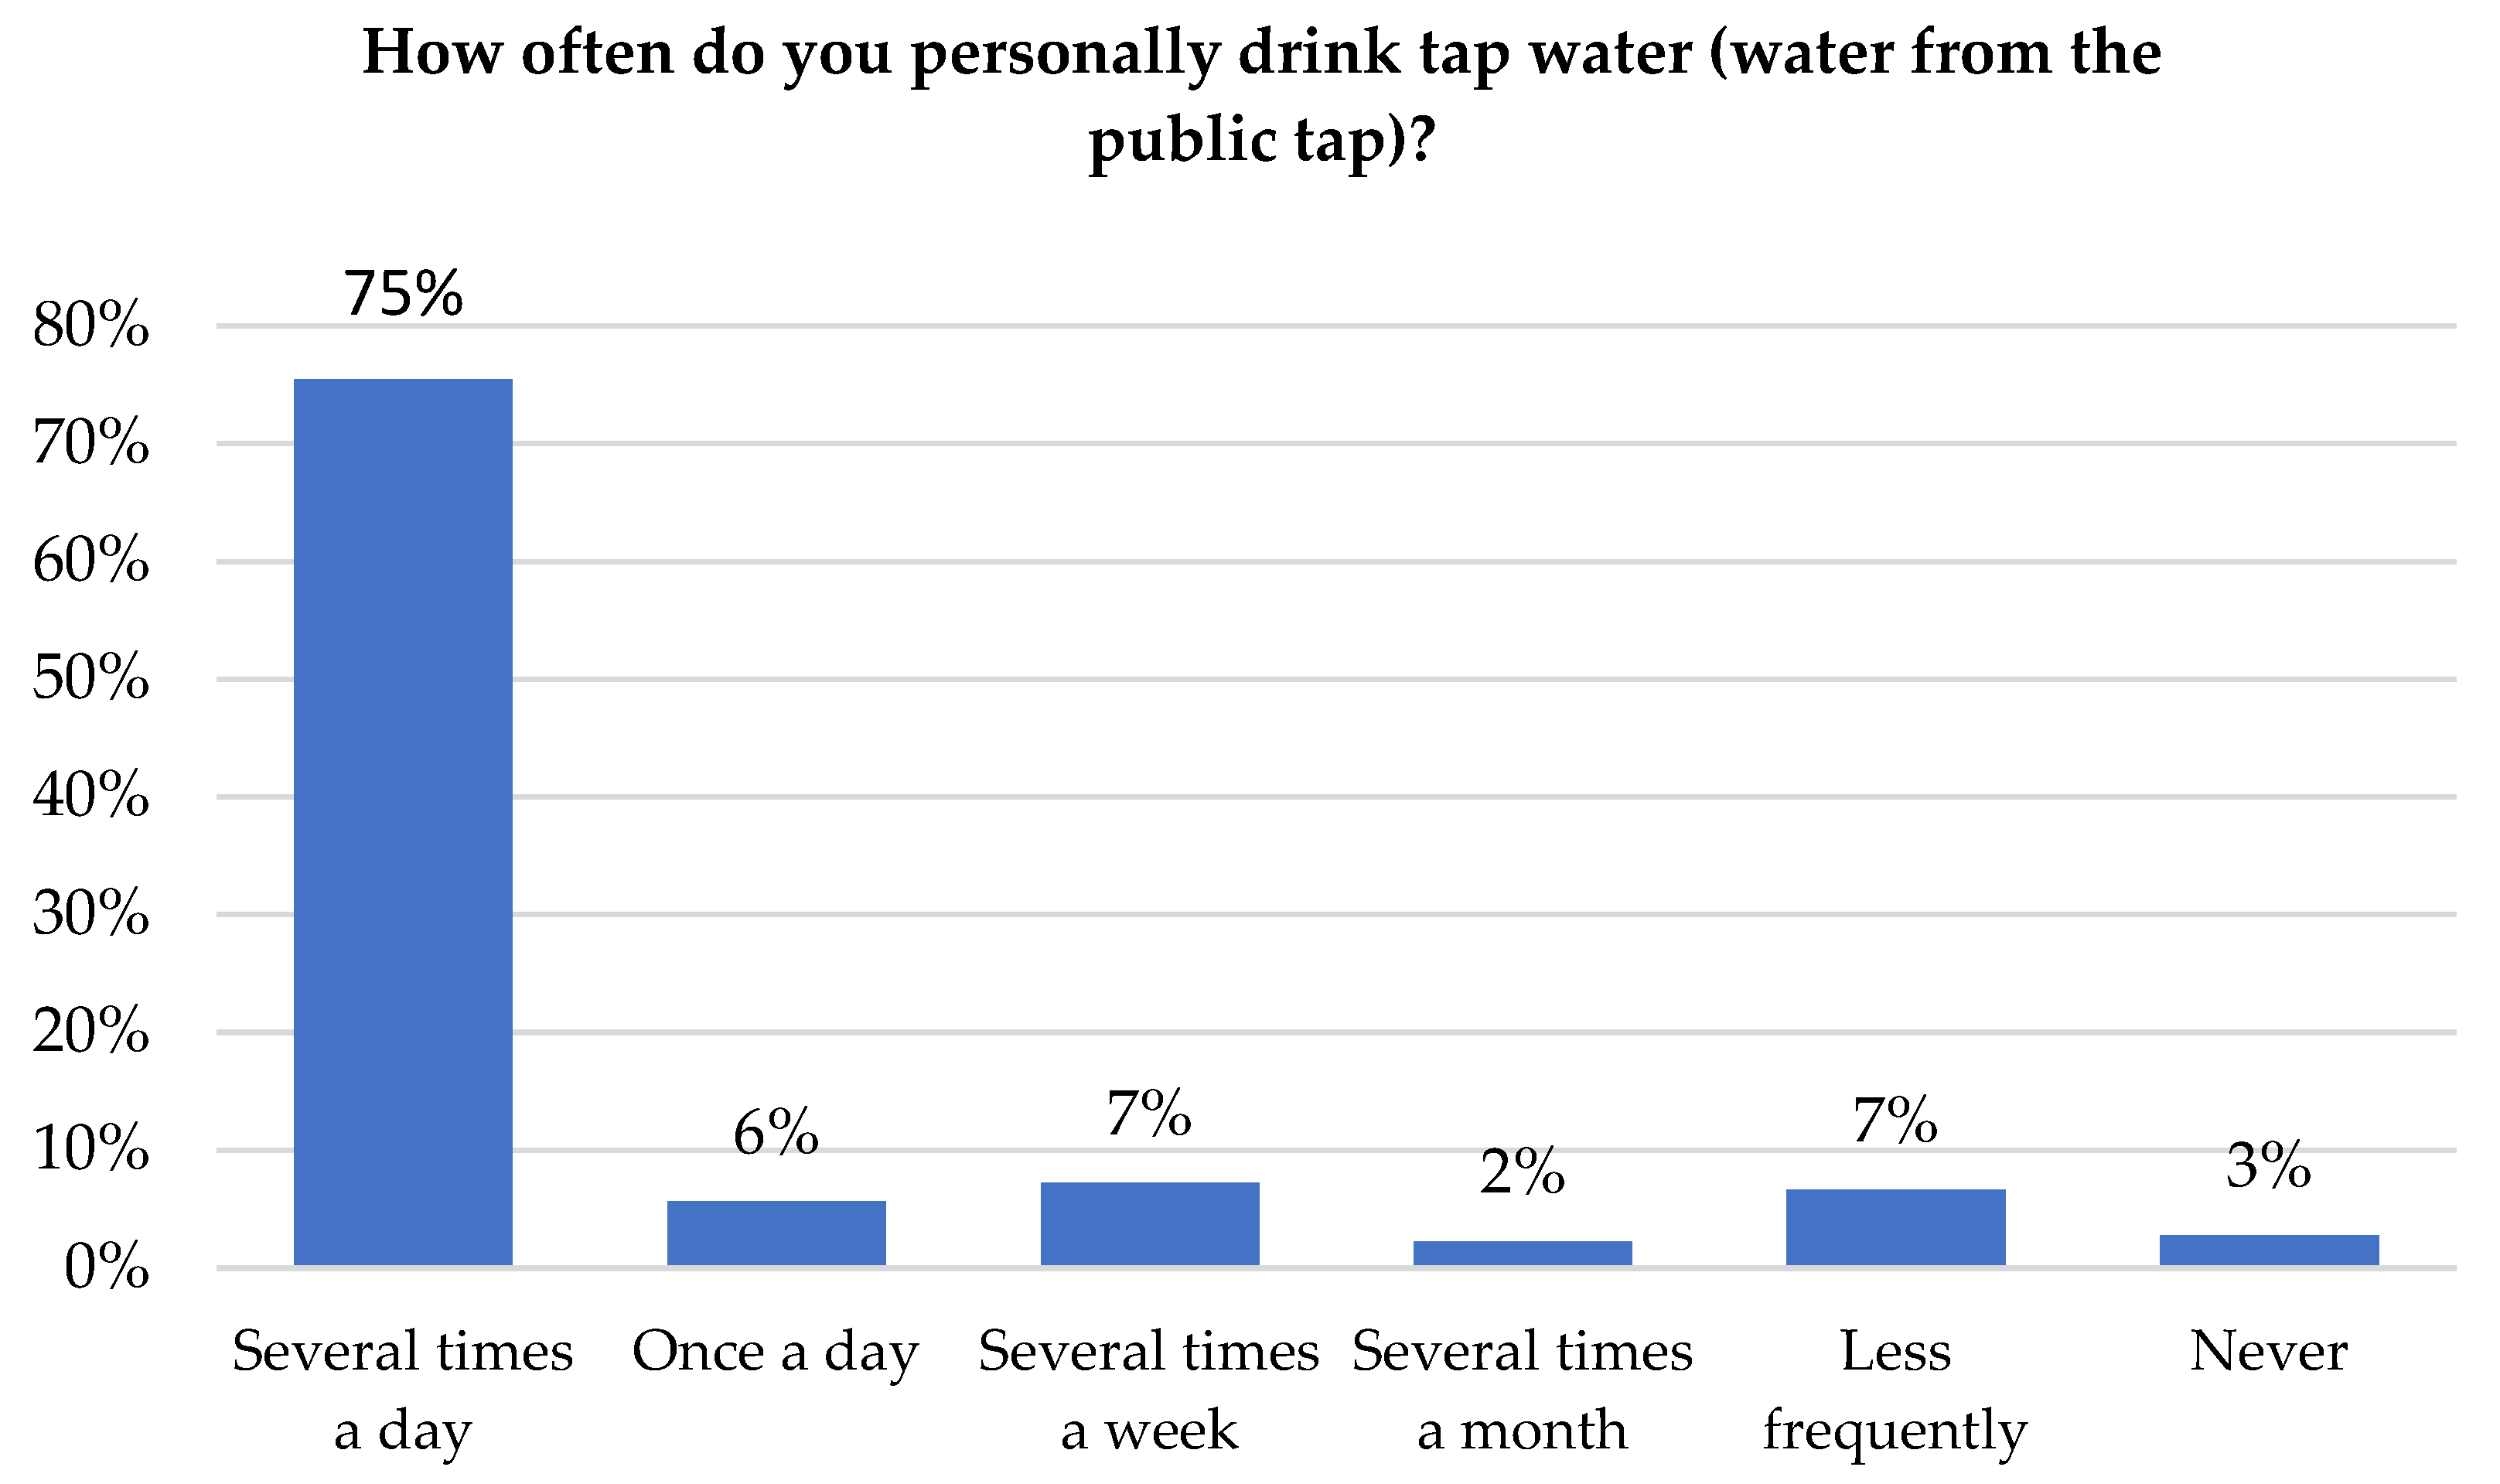
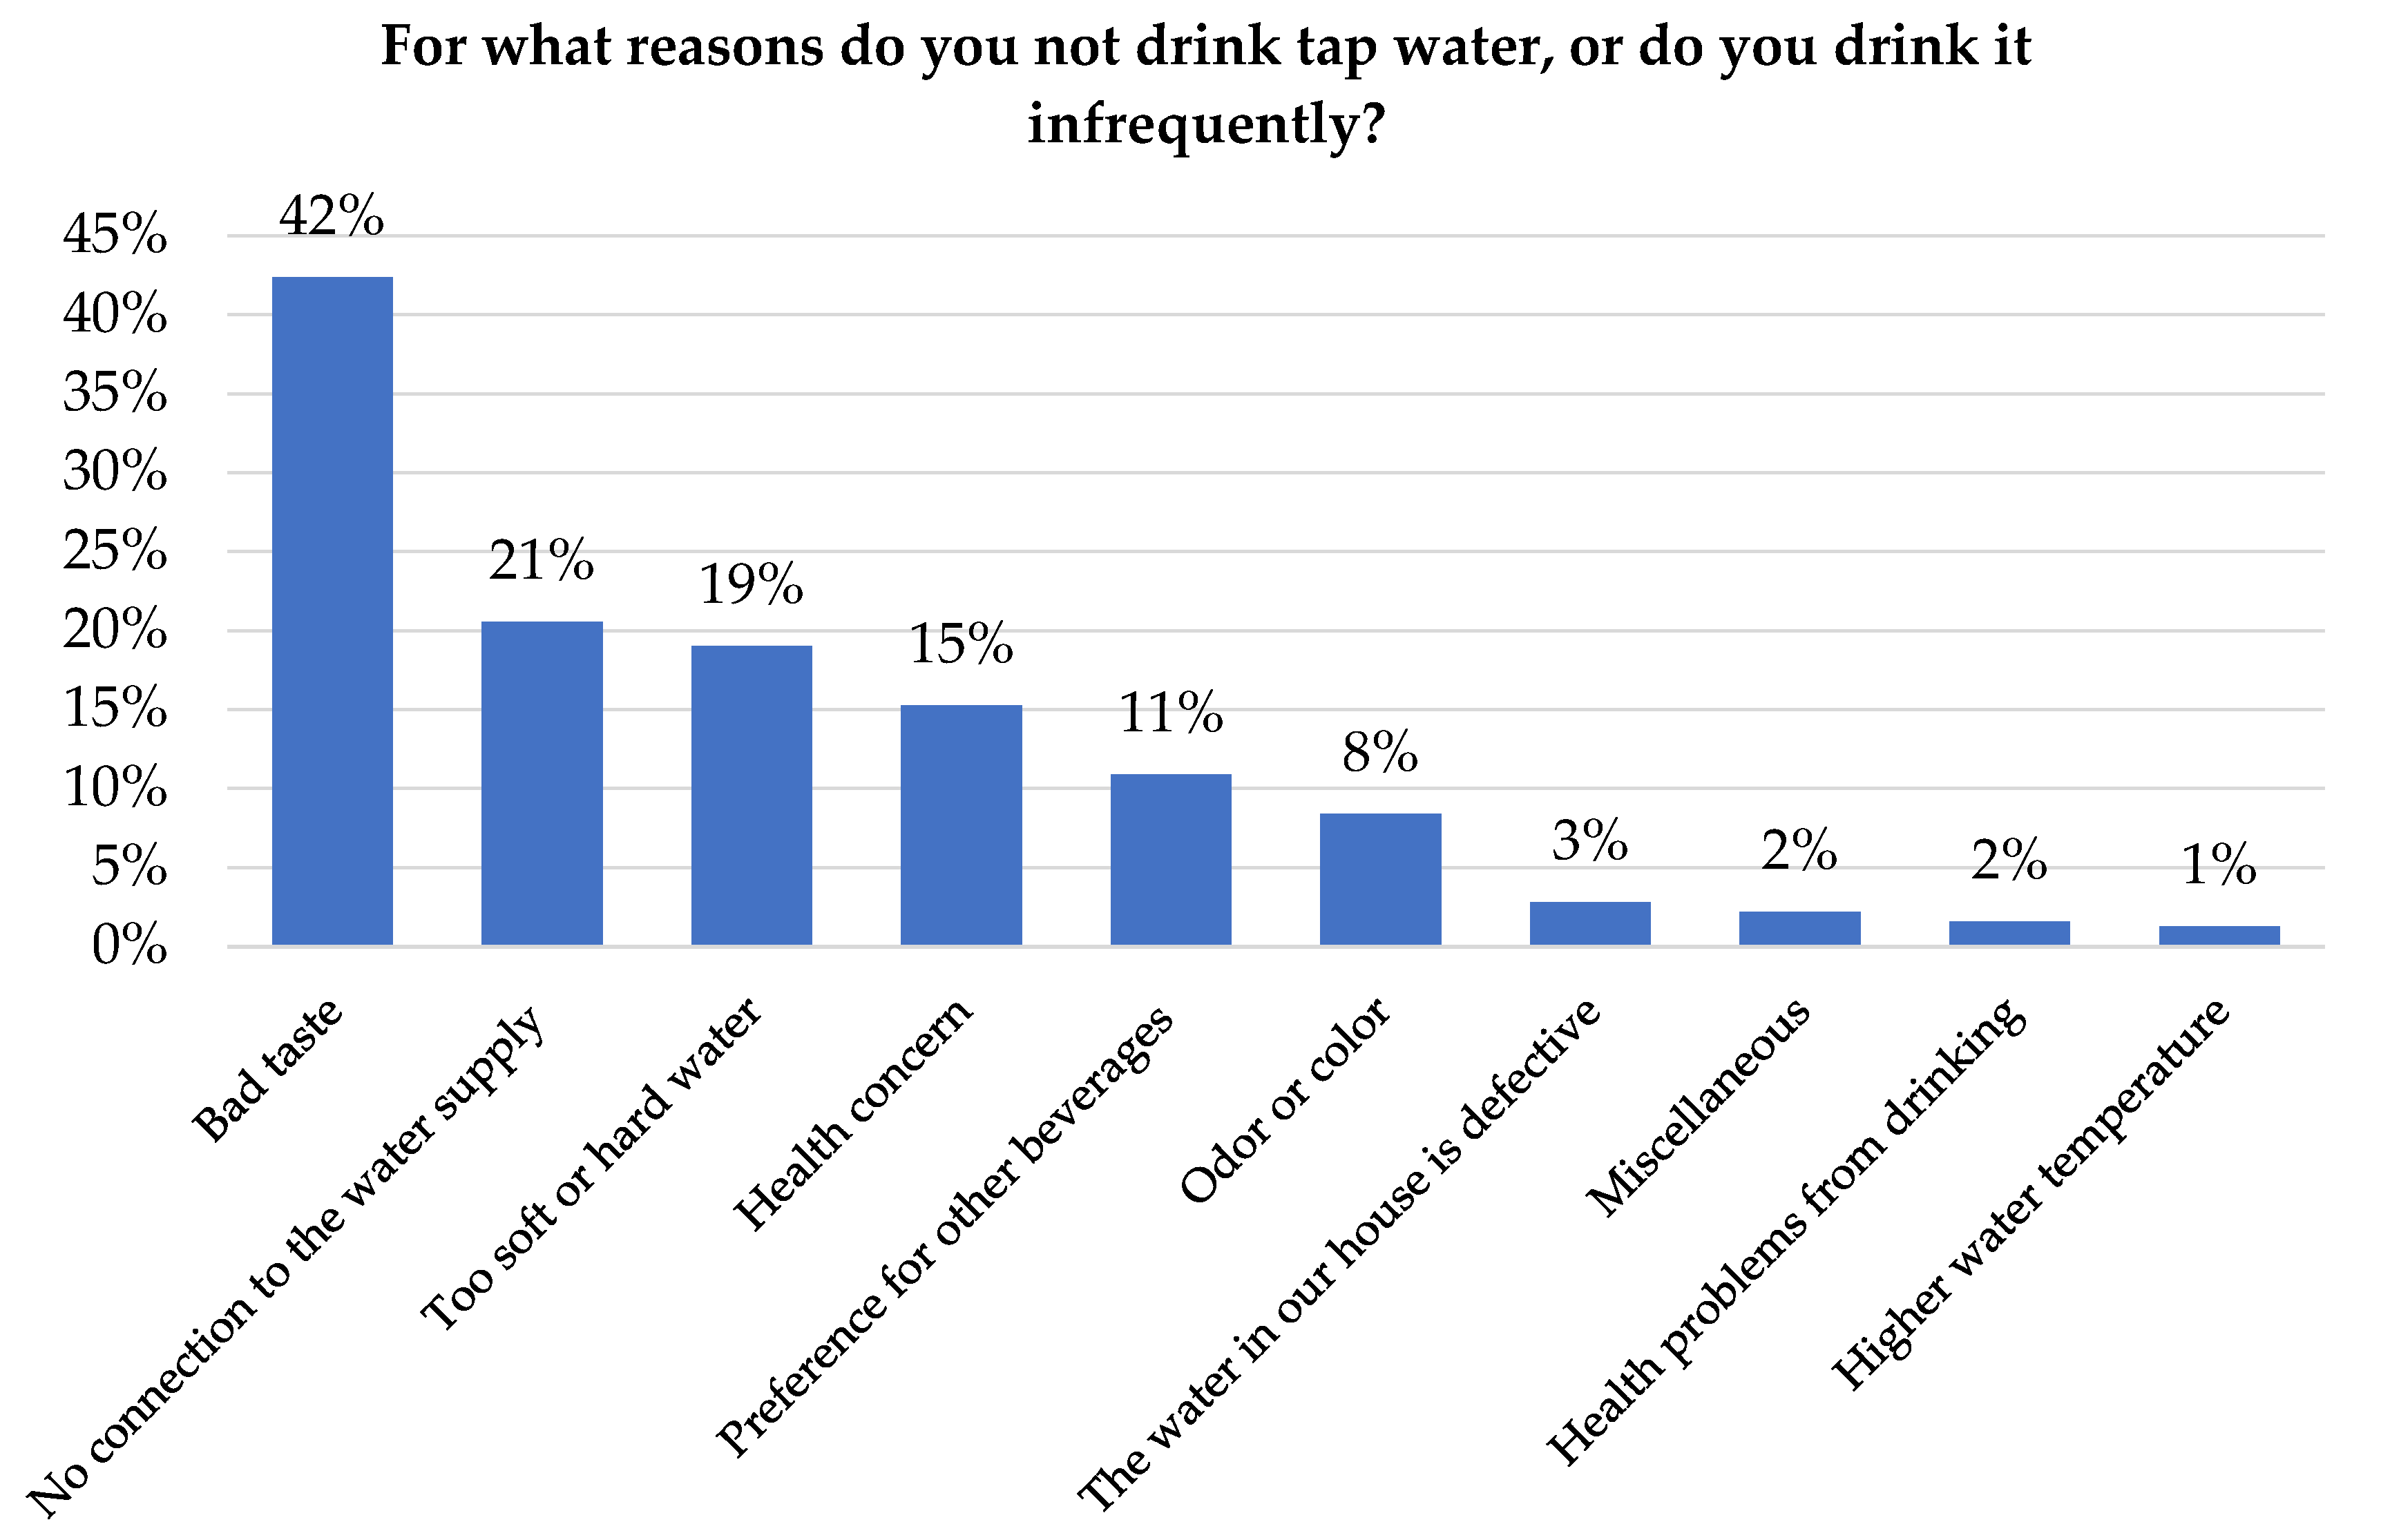
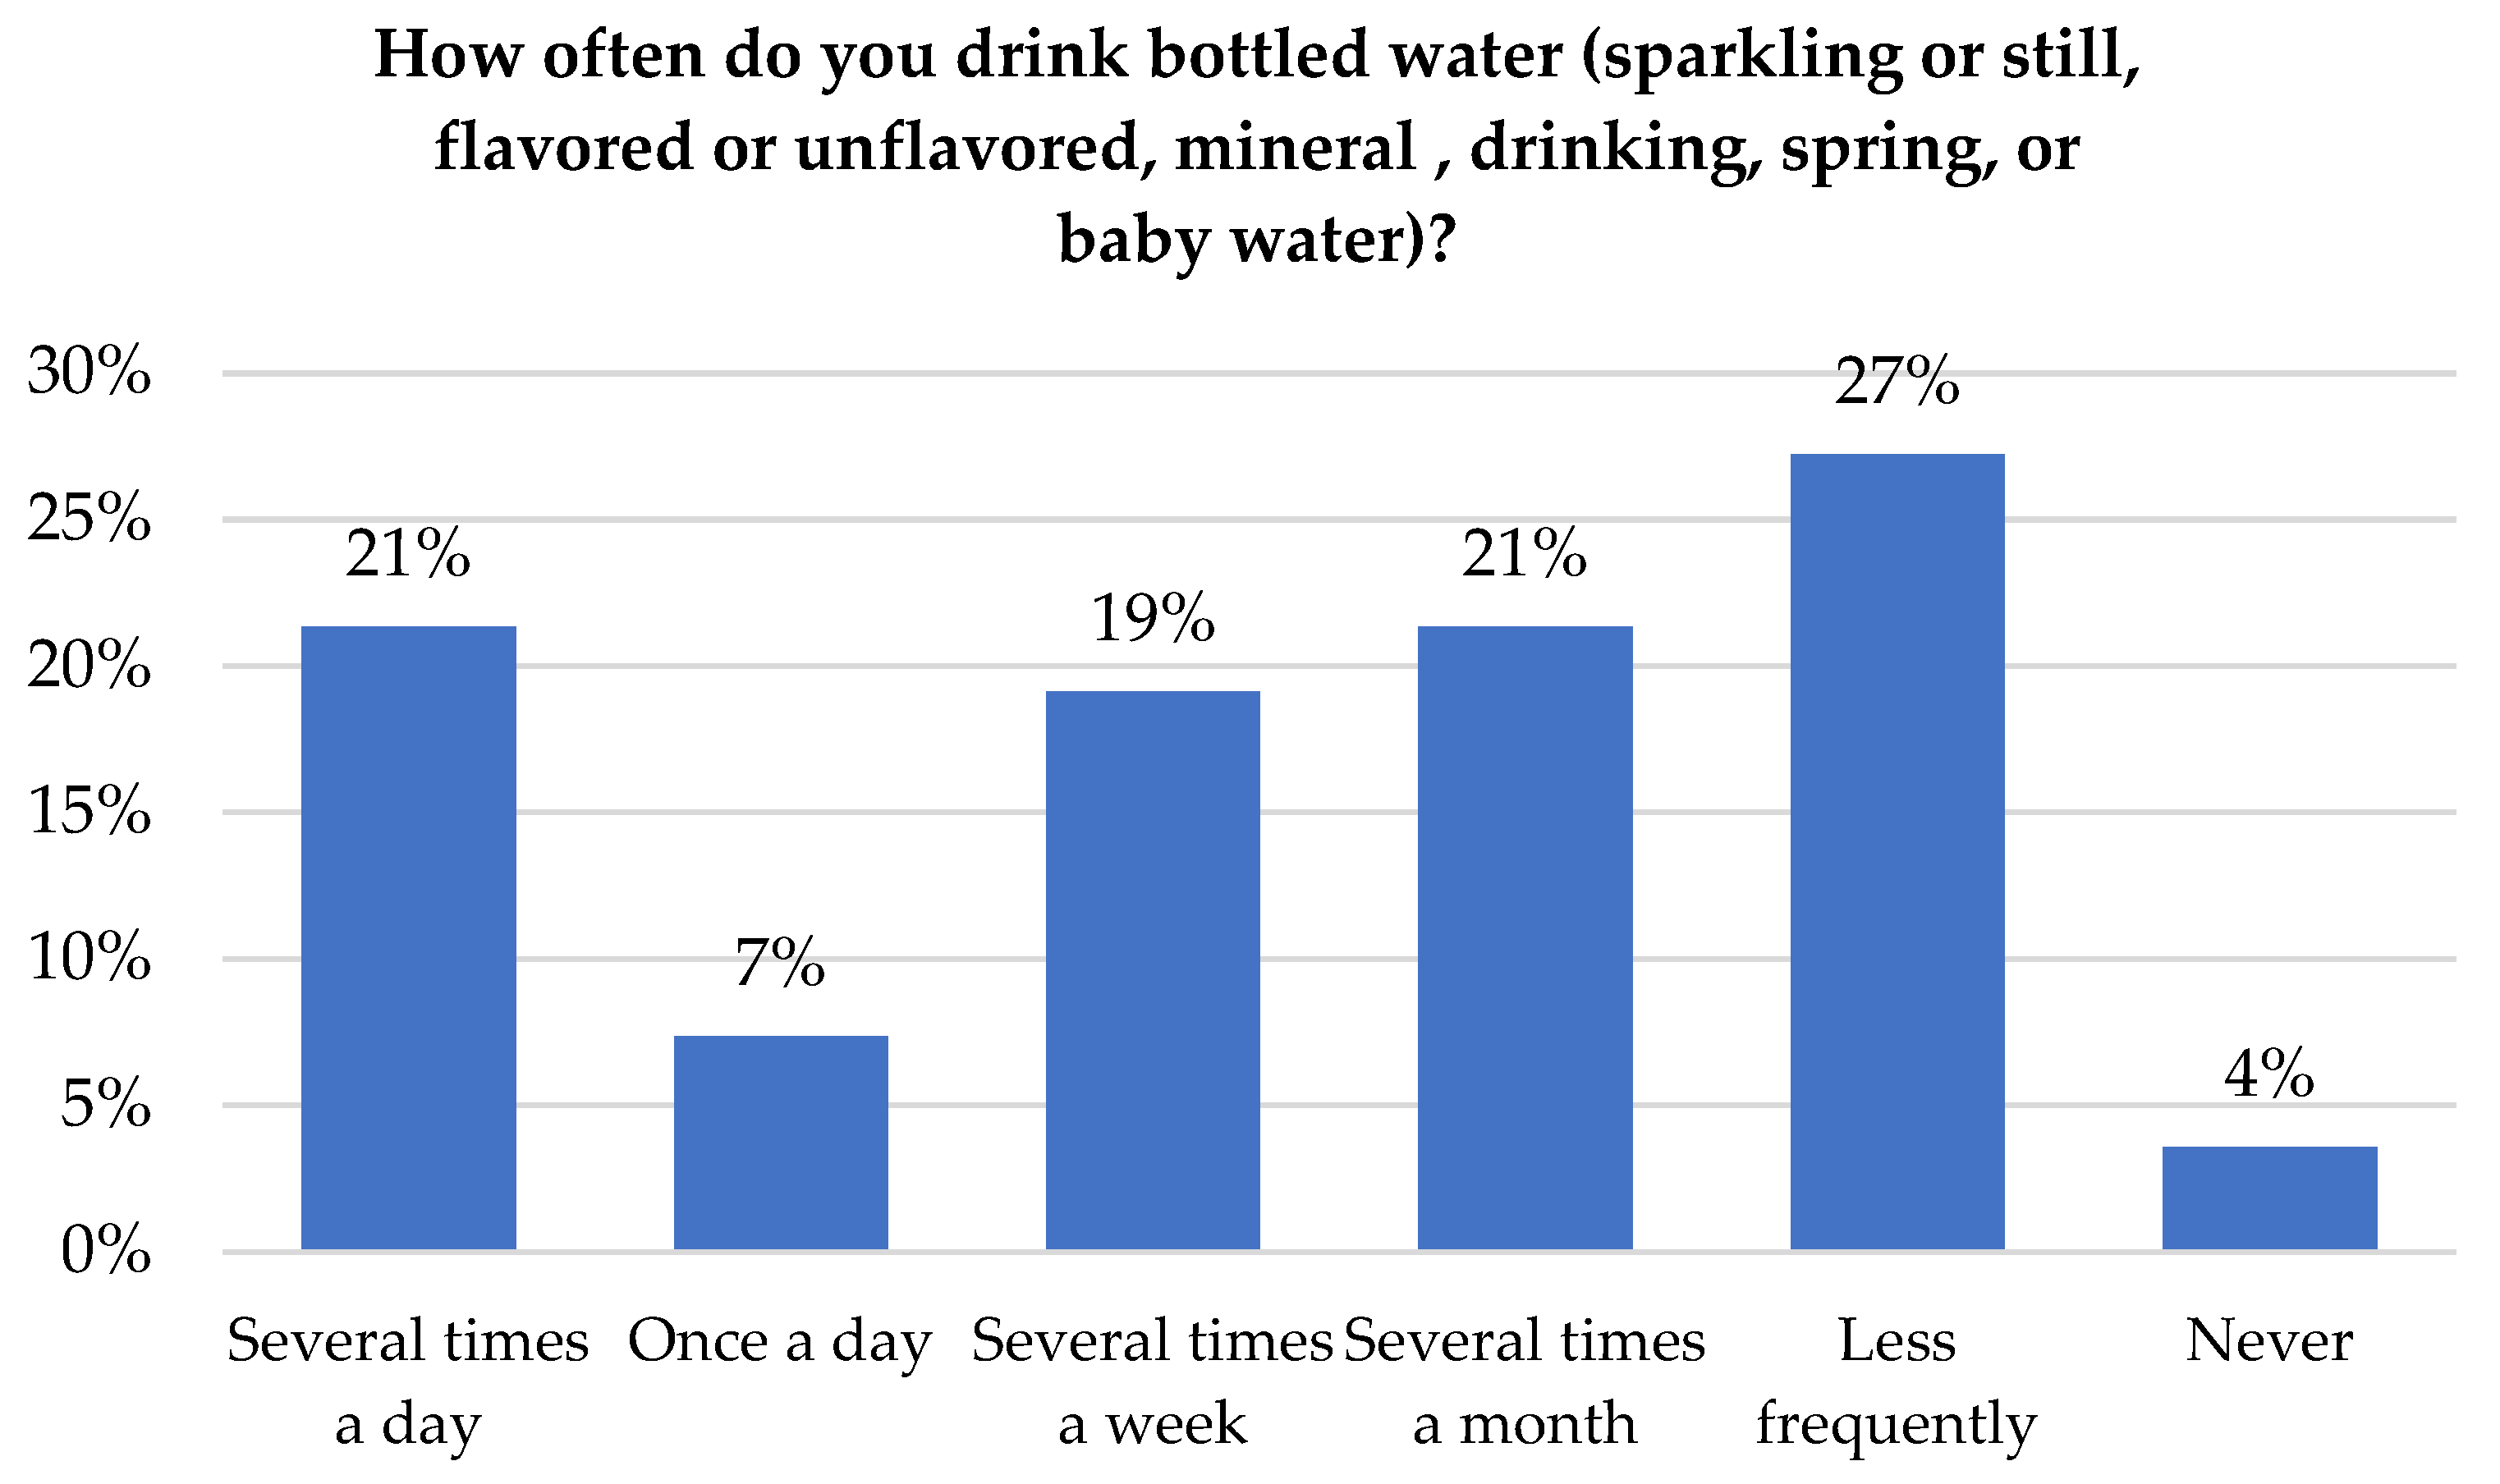
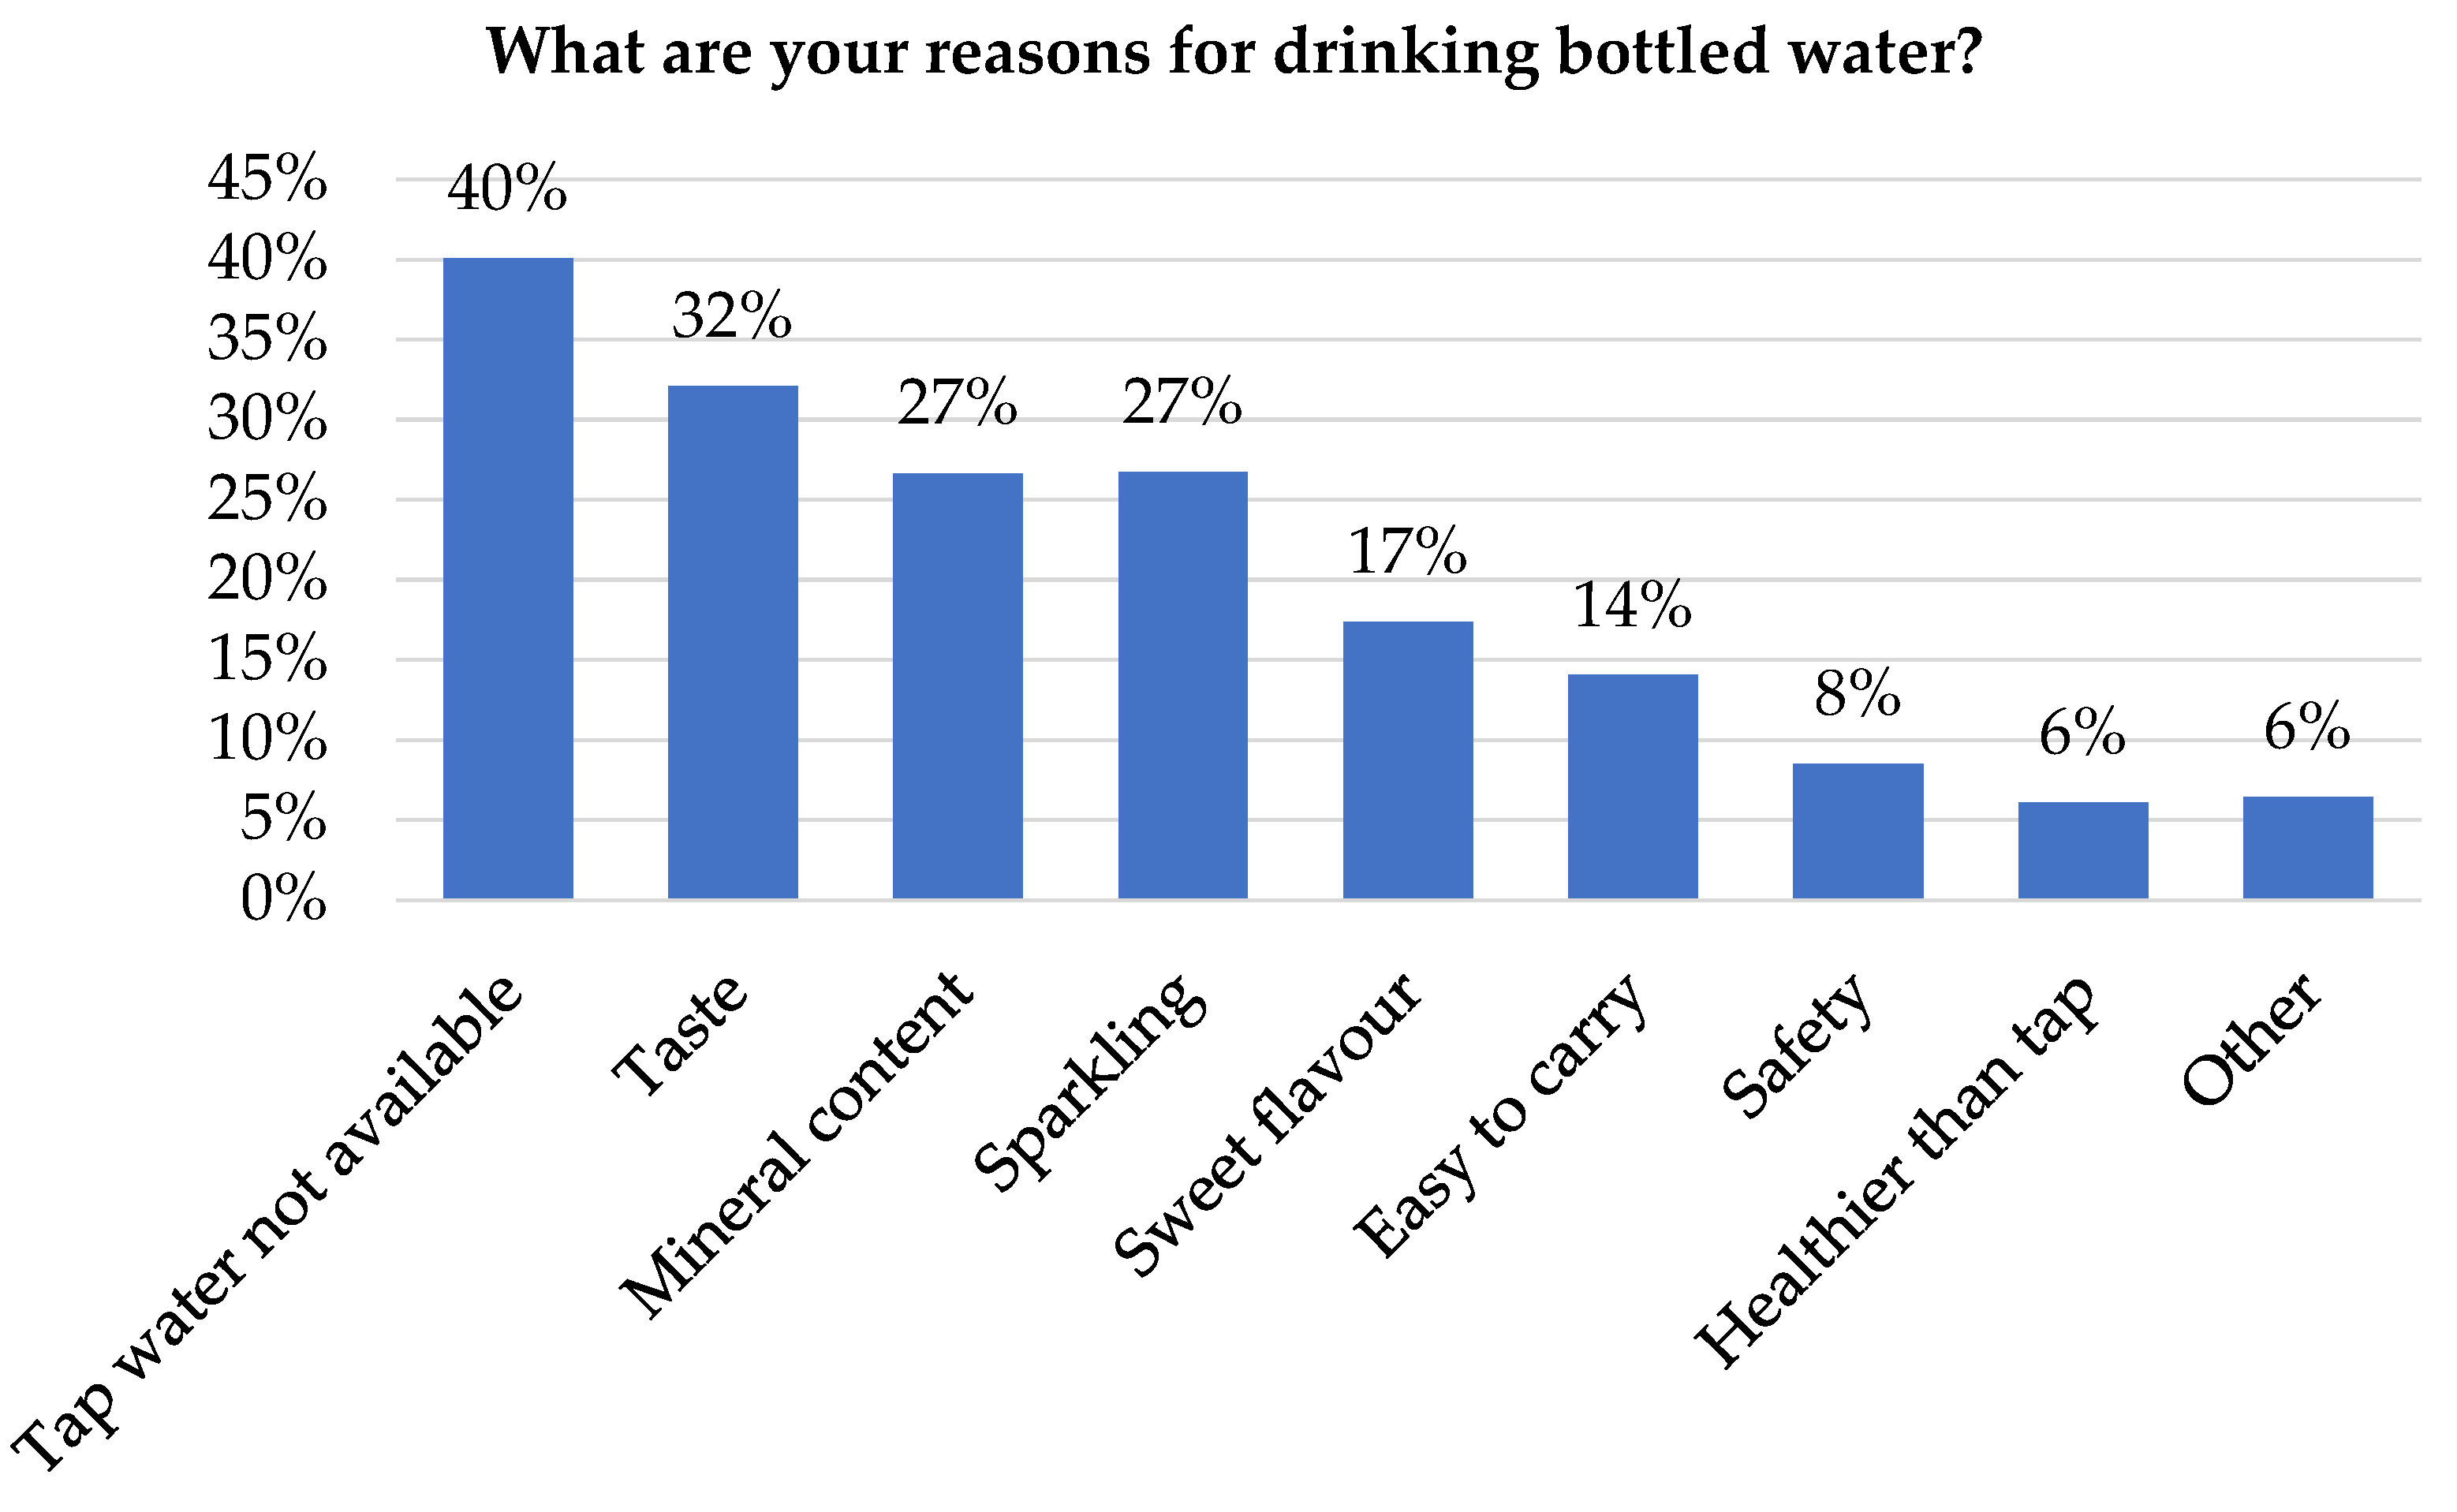
3.1. Frequency and Reasons for Drinking Tap and Bottled Water
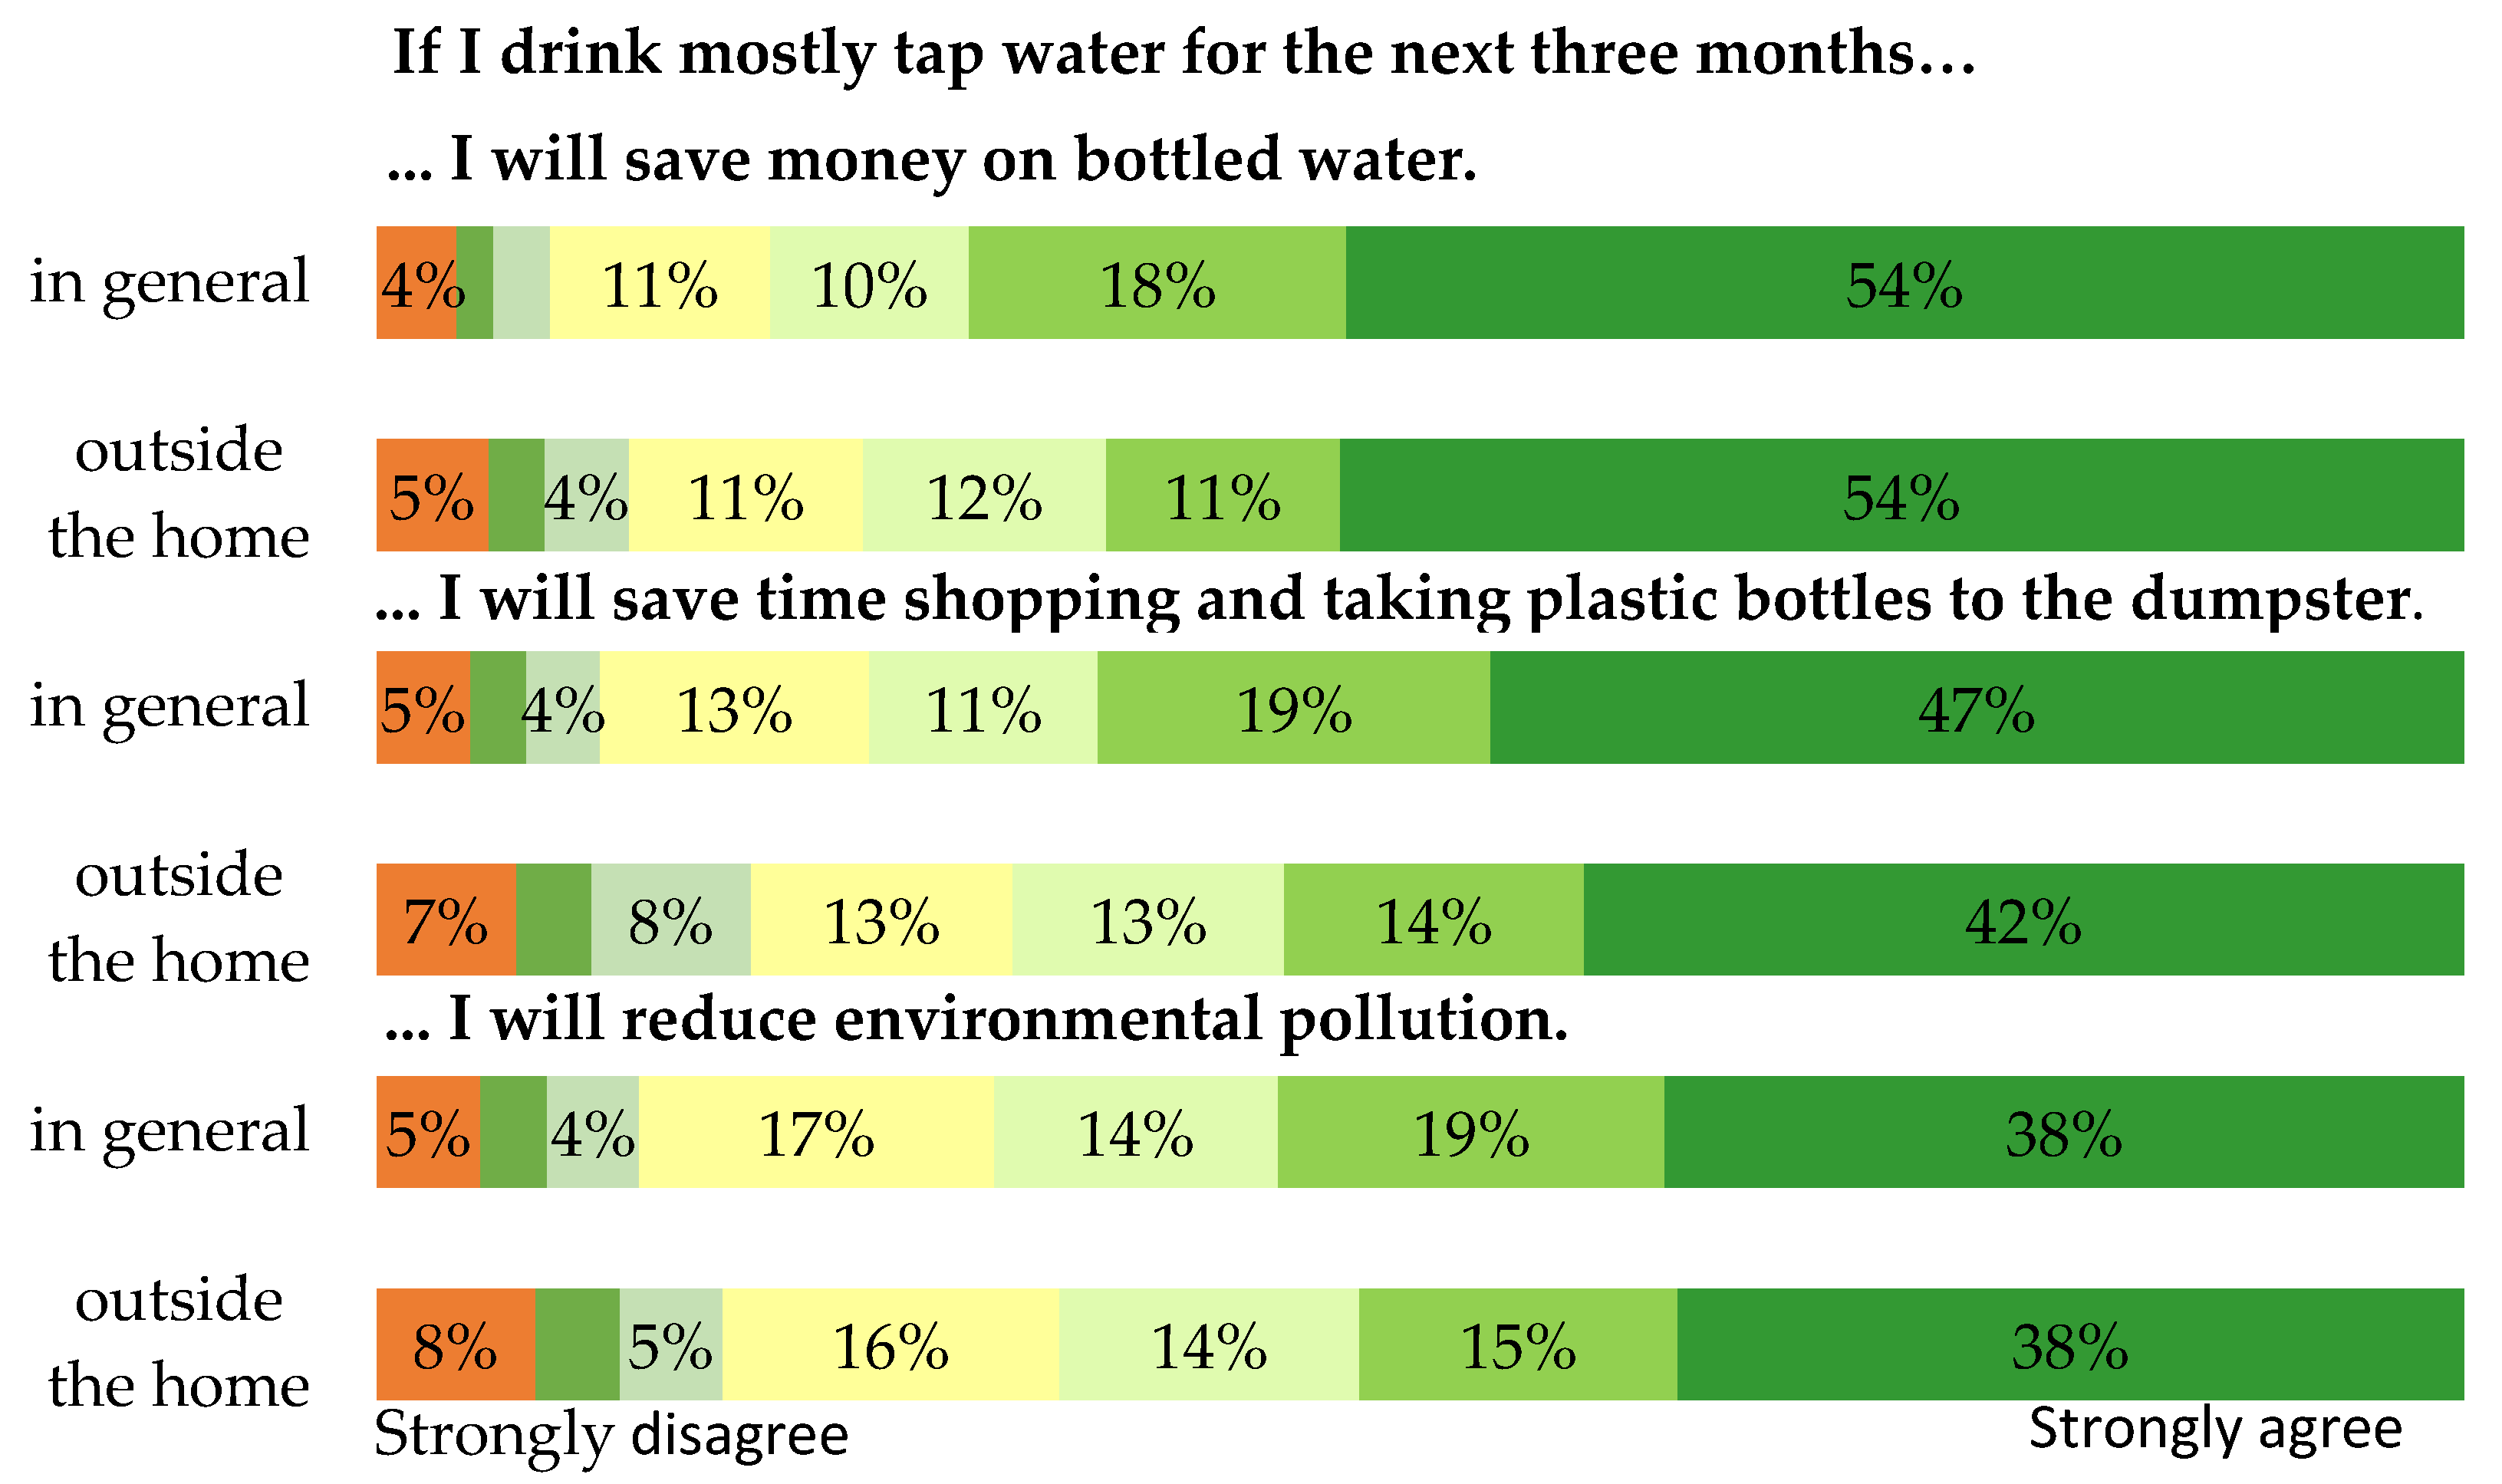
3.2. Habit, Normative, Behavioural and control Beliefs in Relation to Drinking Tap Water
Habit
Normative Beliefs
Behavioural Beliefs
Control Beliefs
Household Connection to Public Water Supply
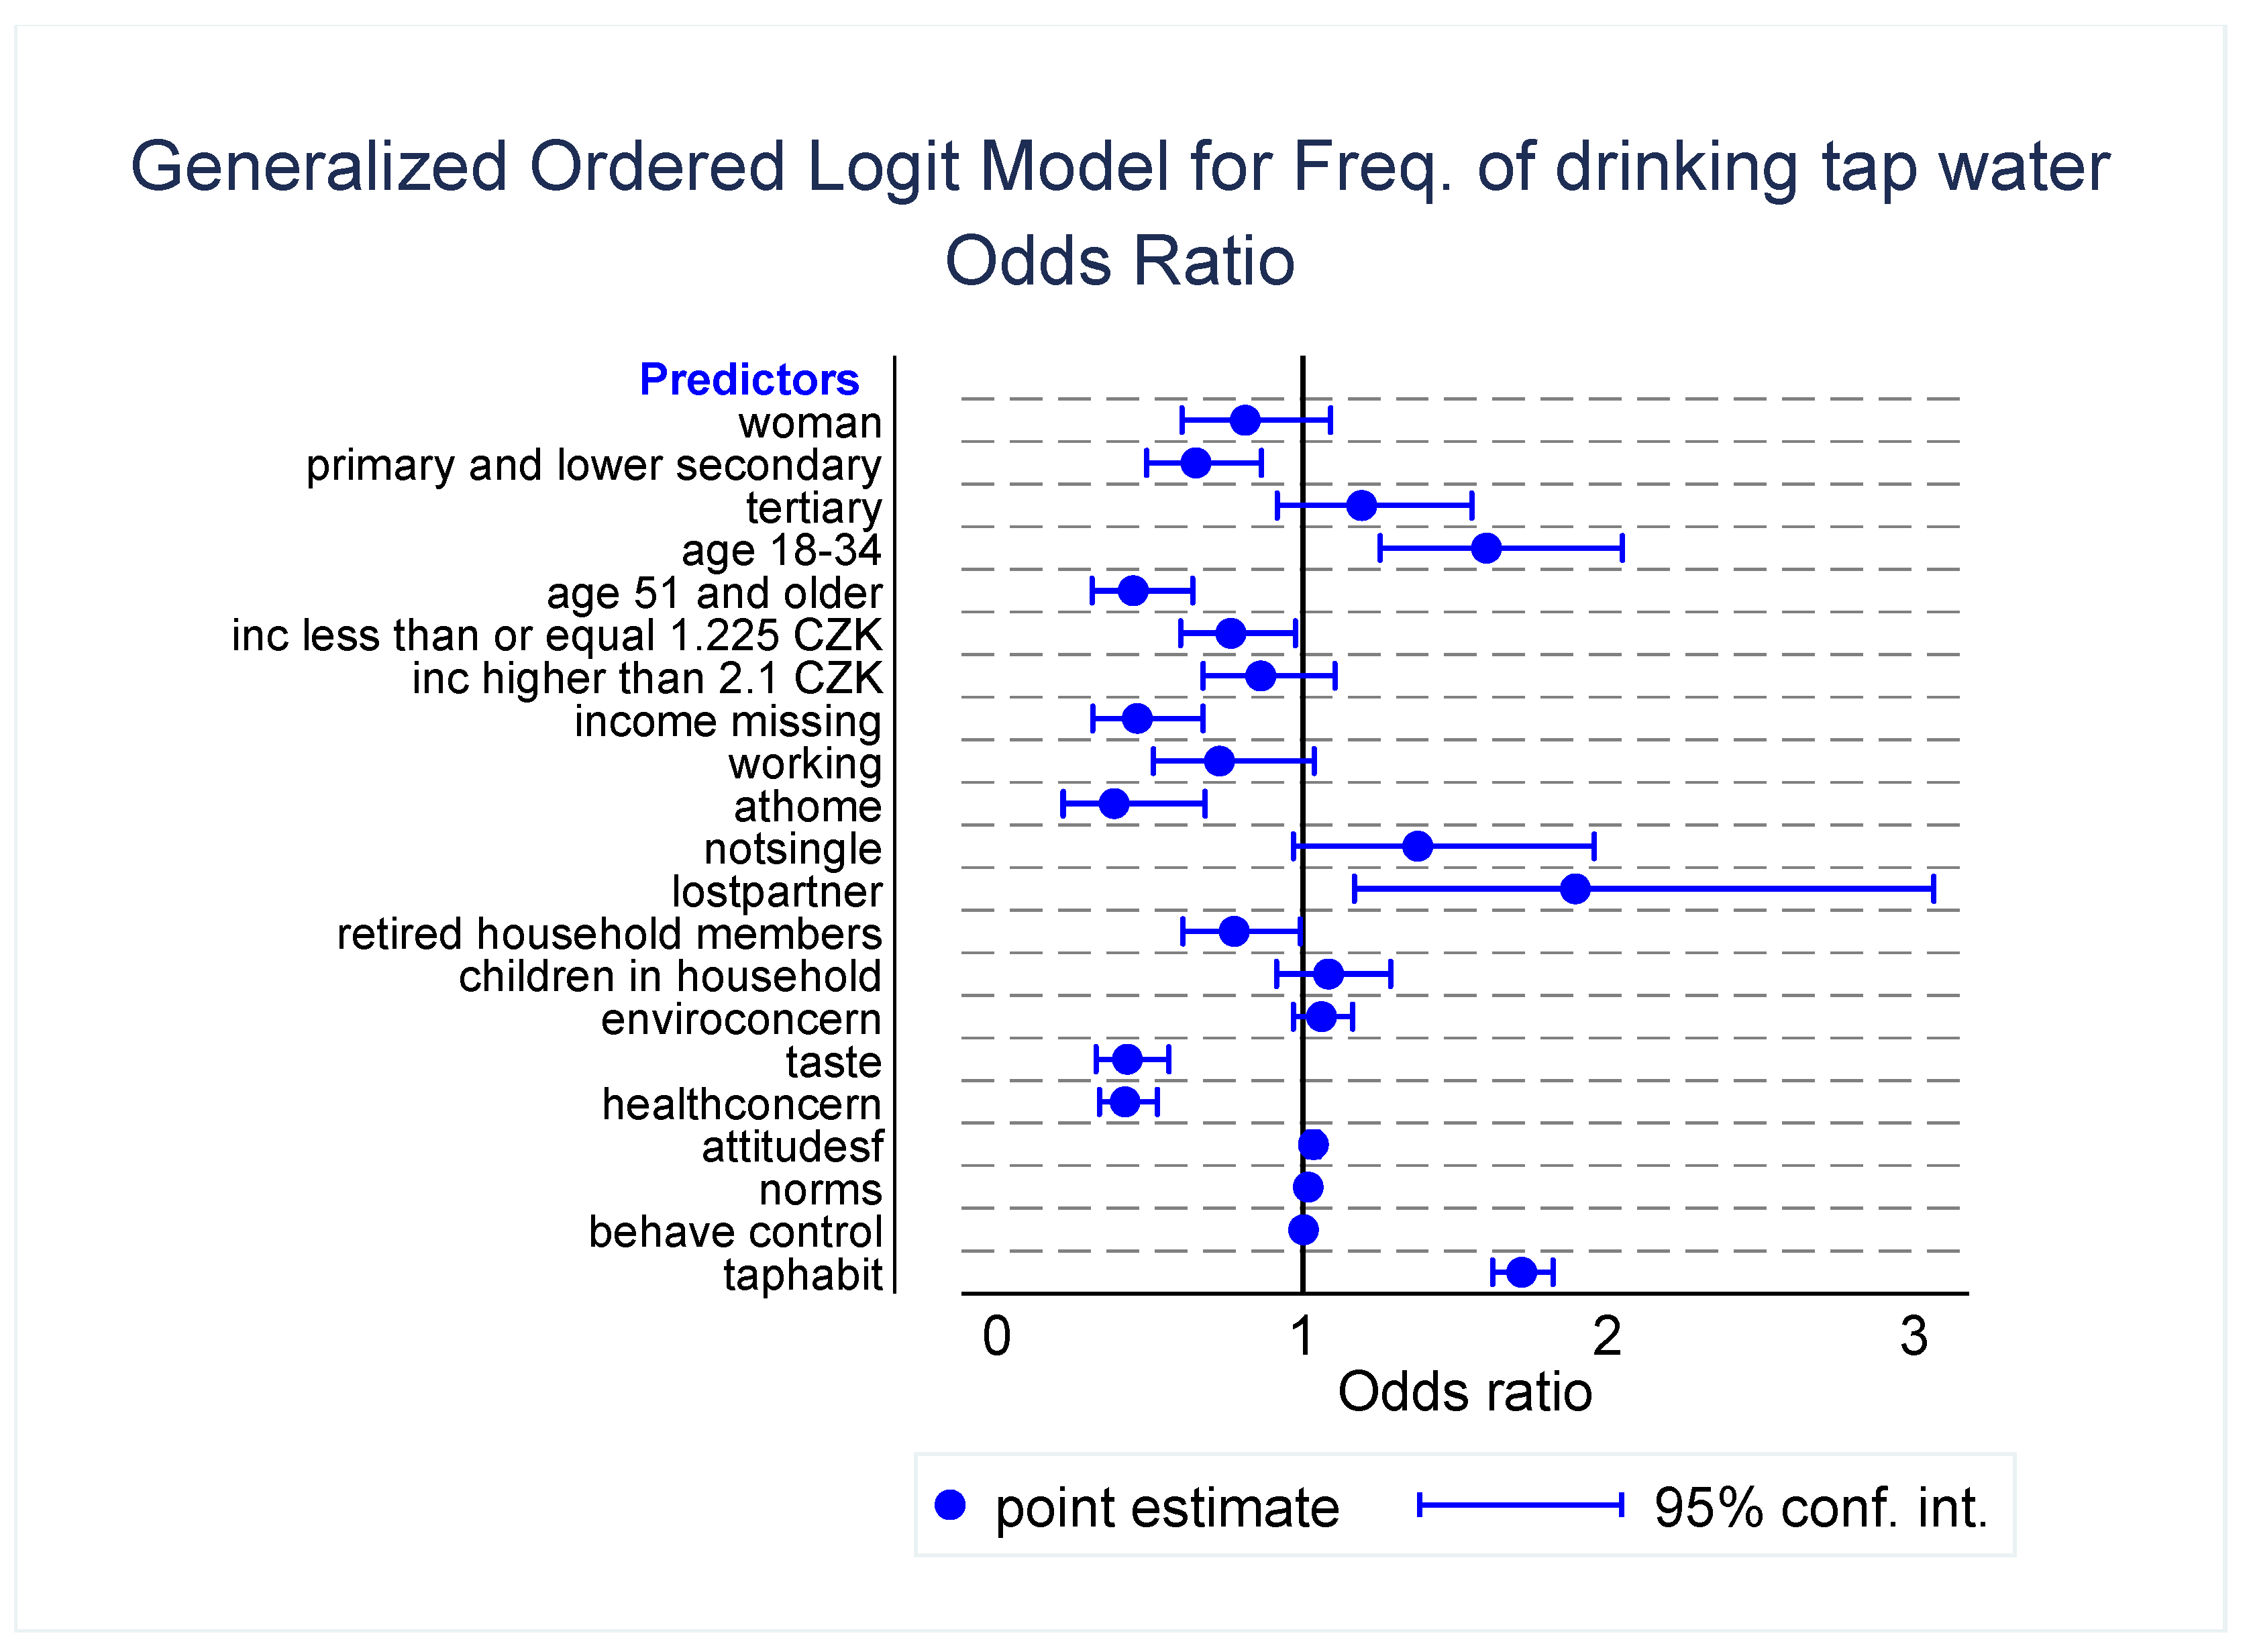
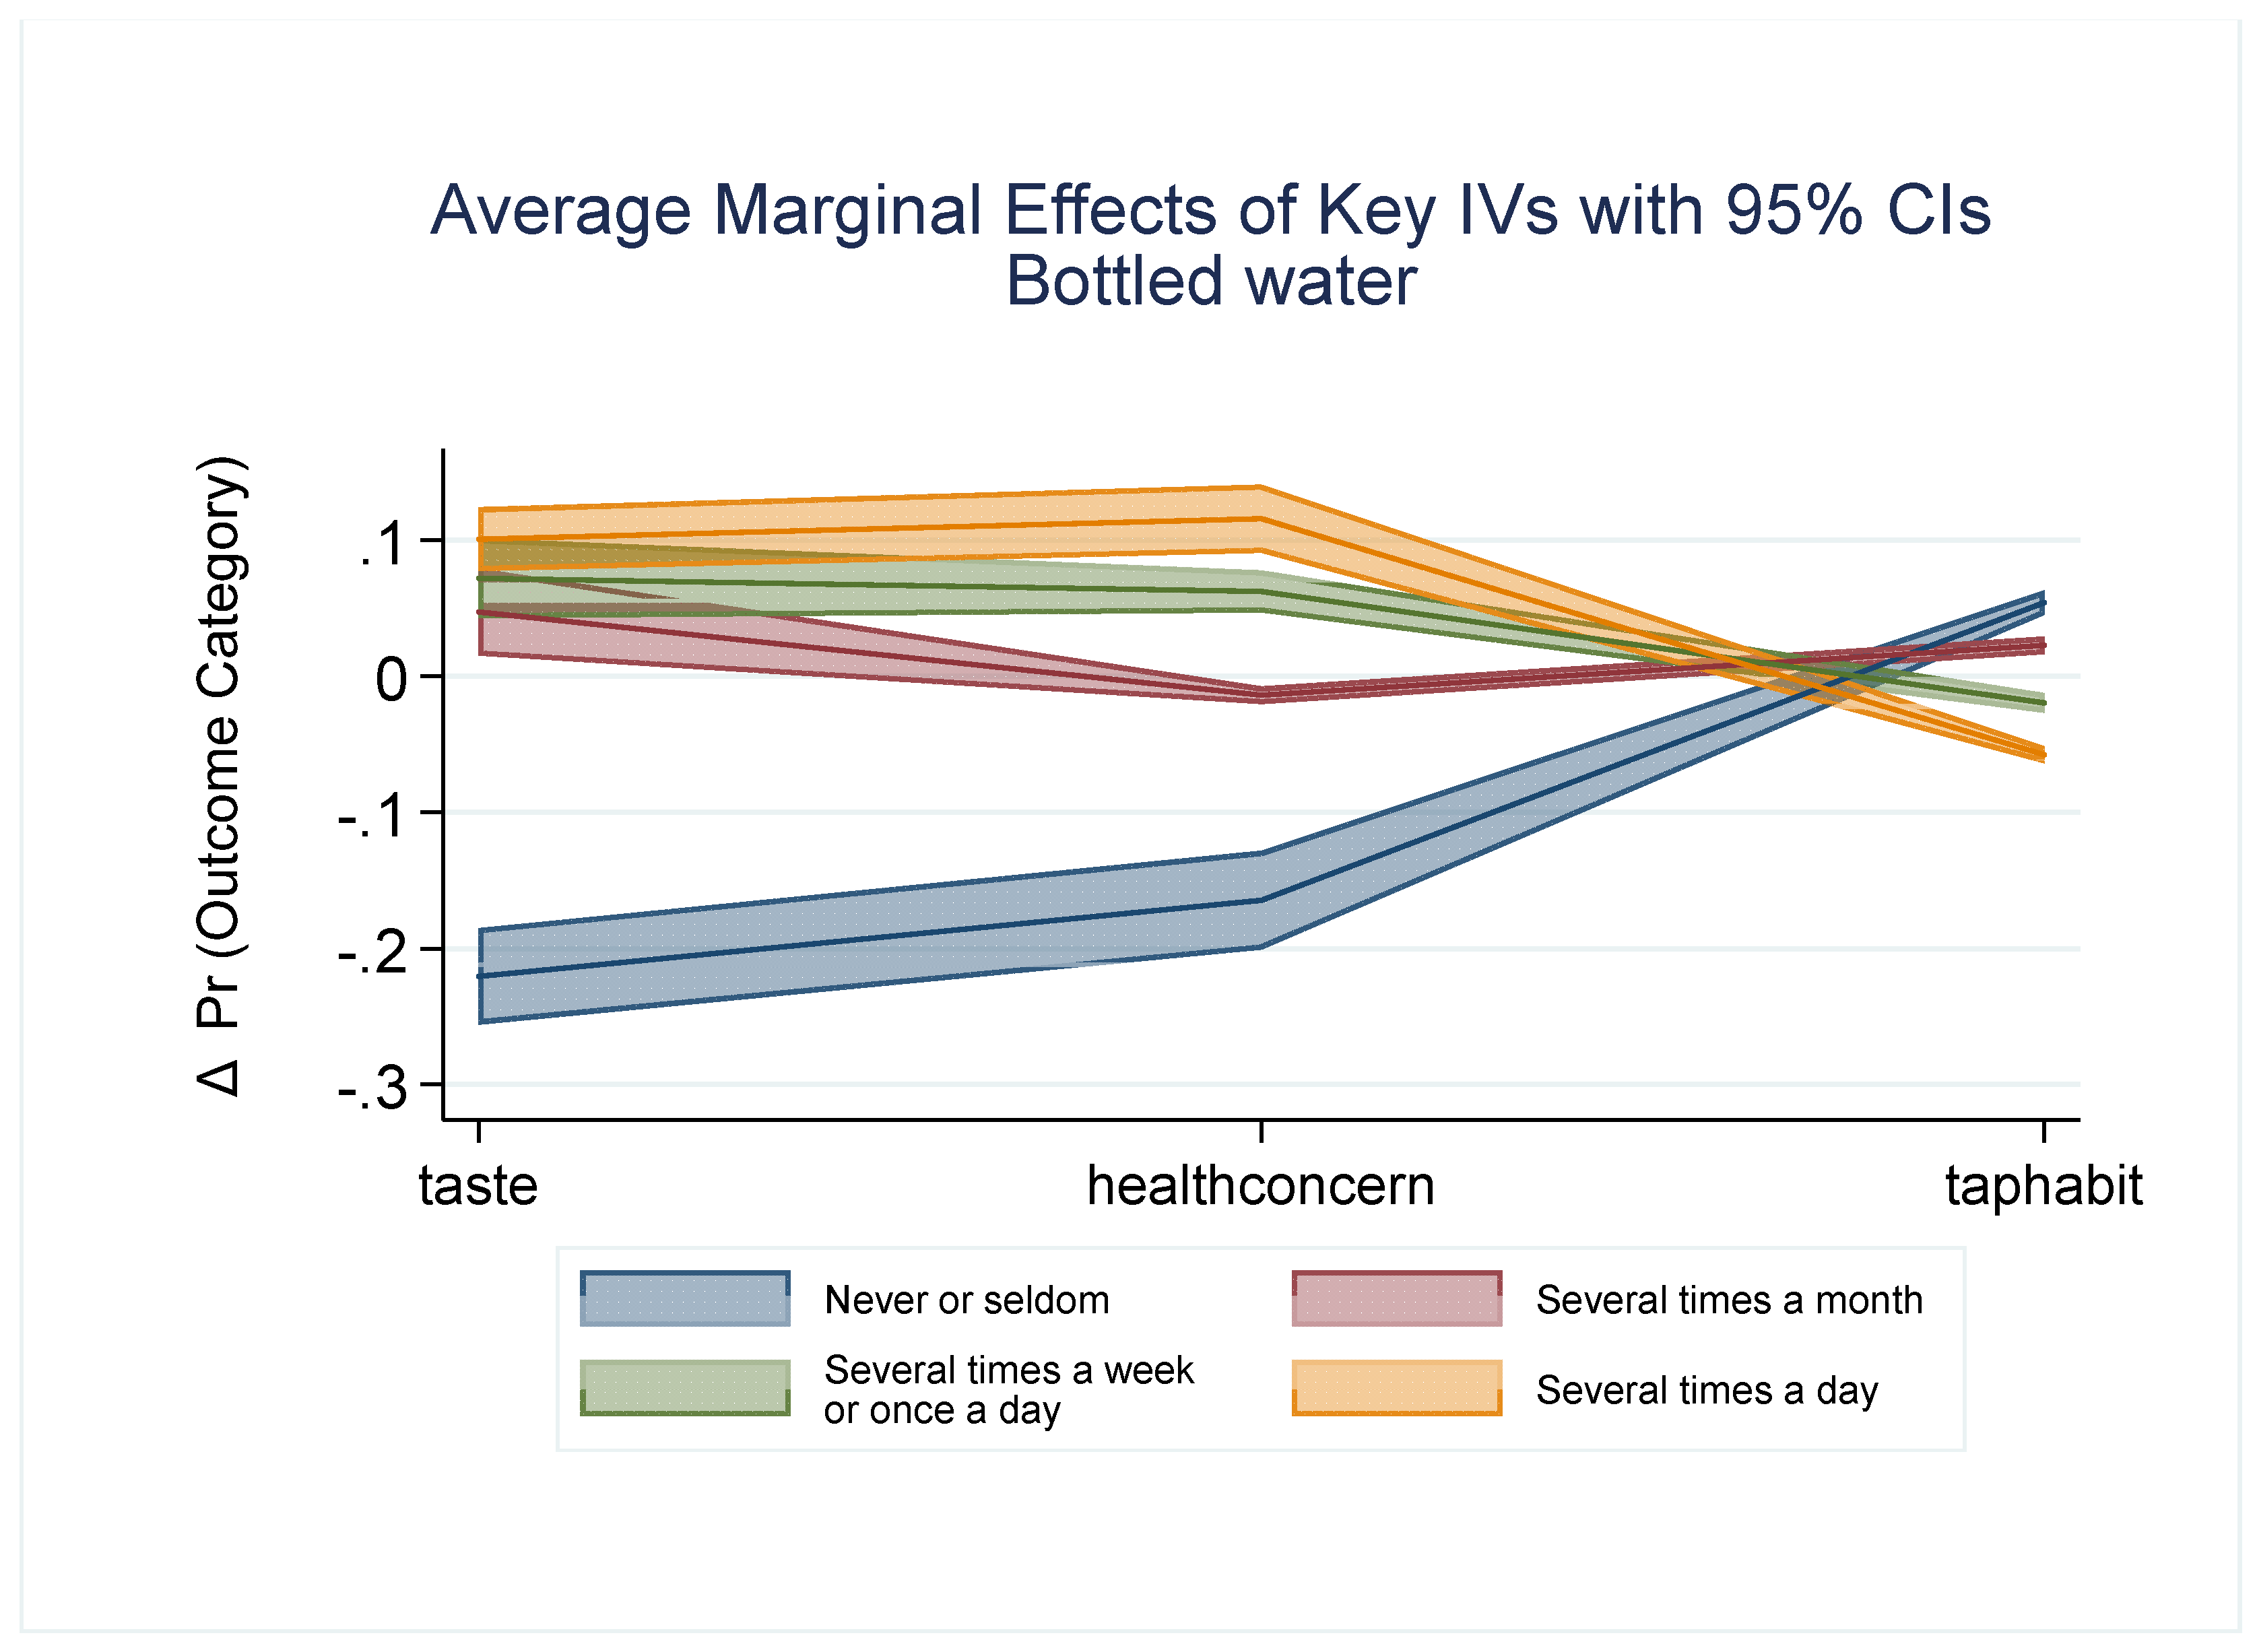
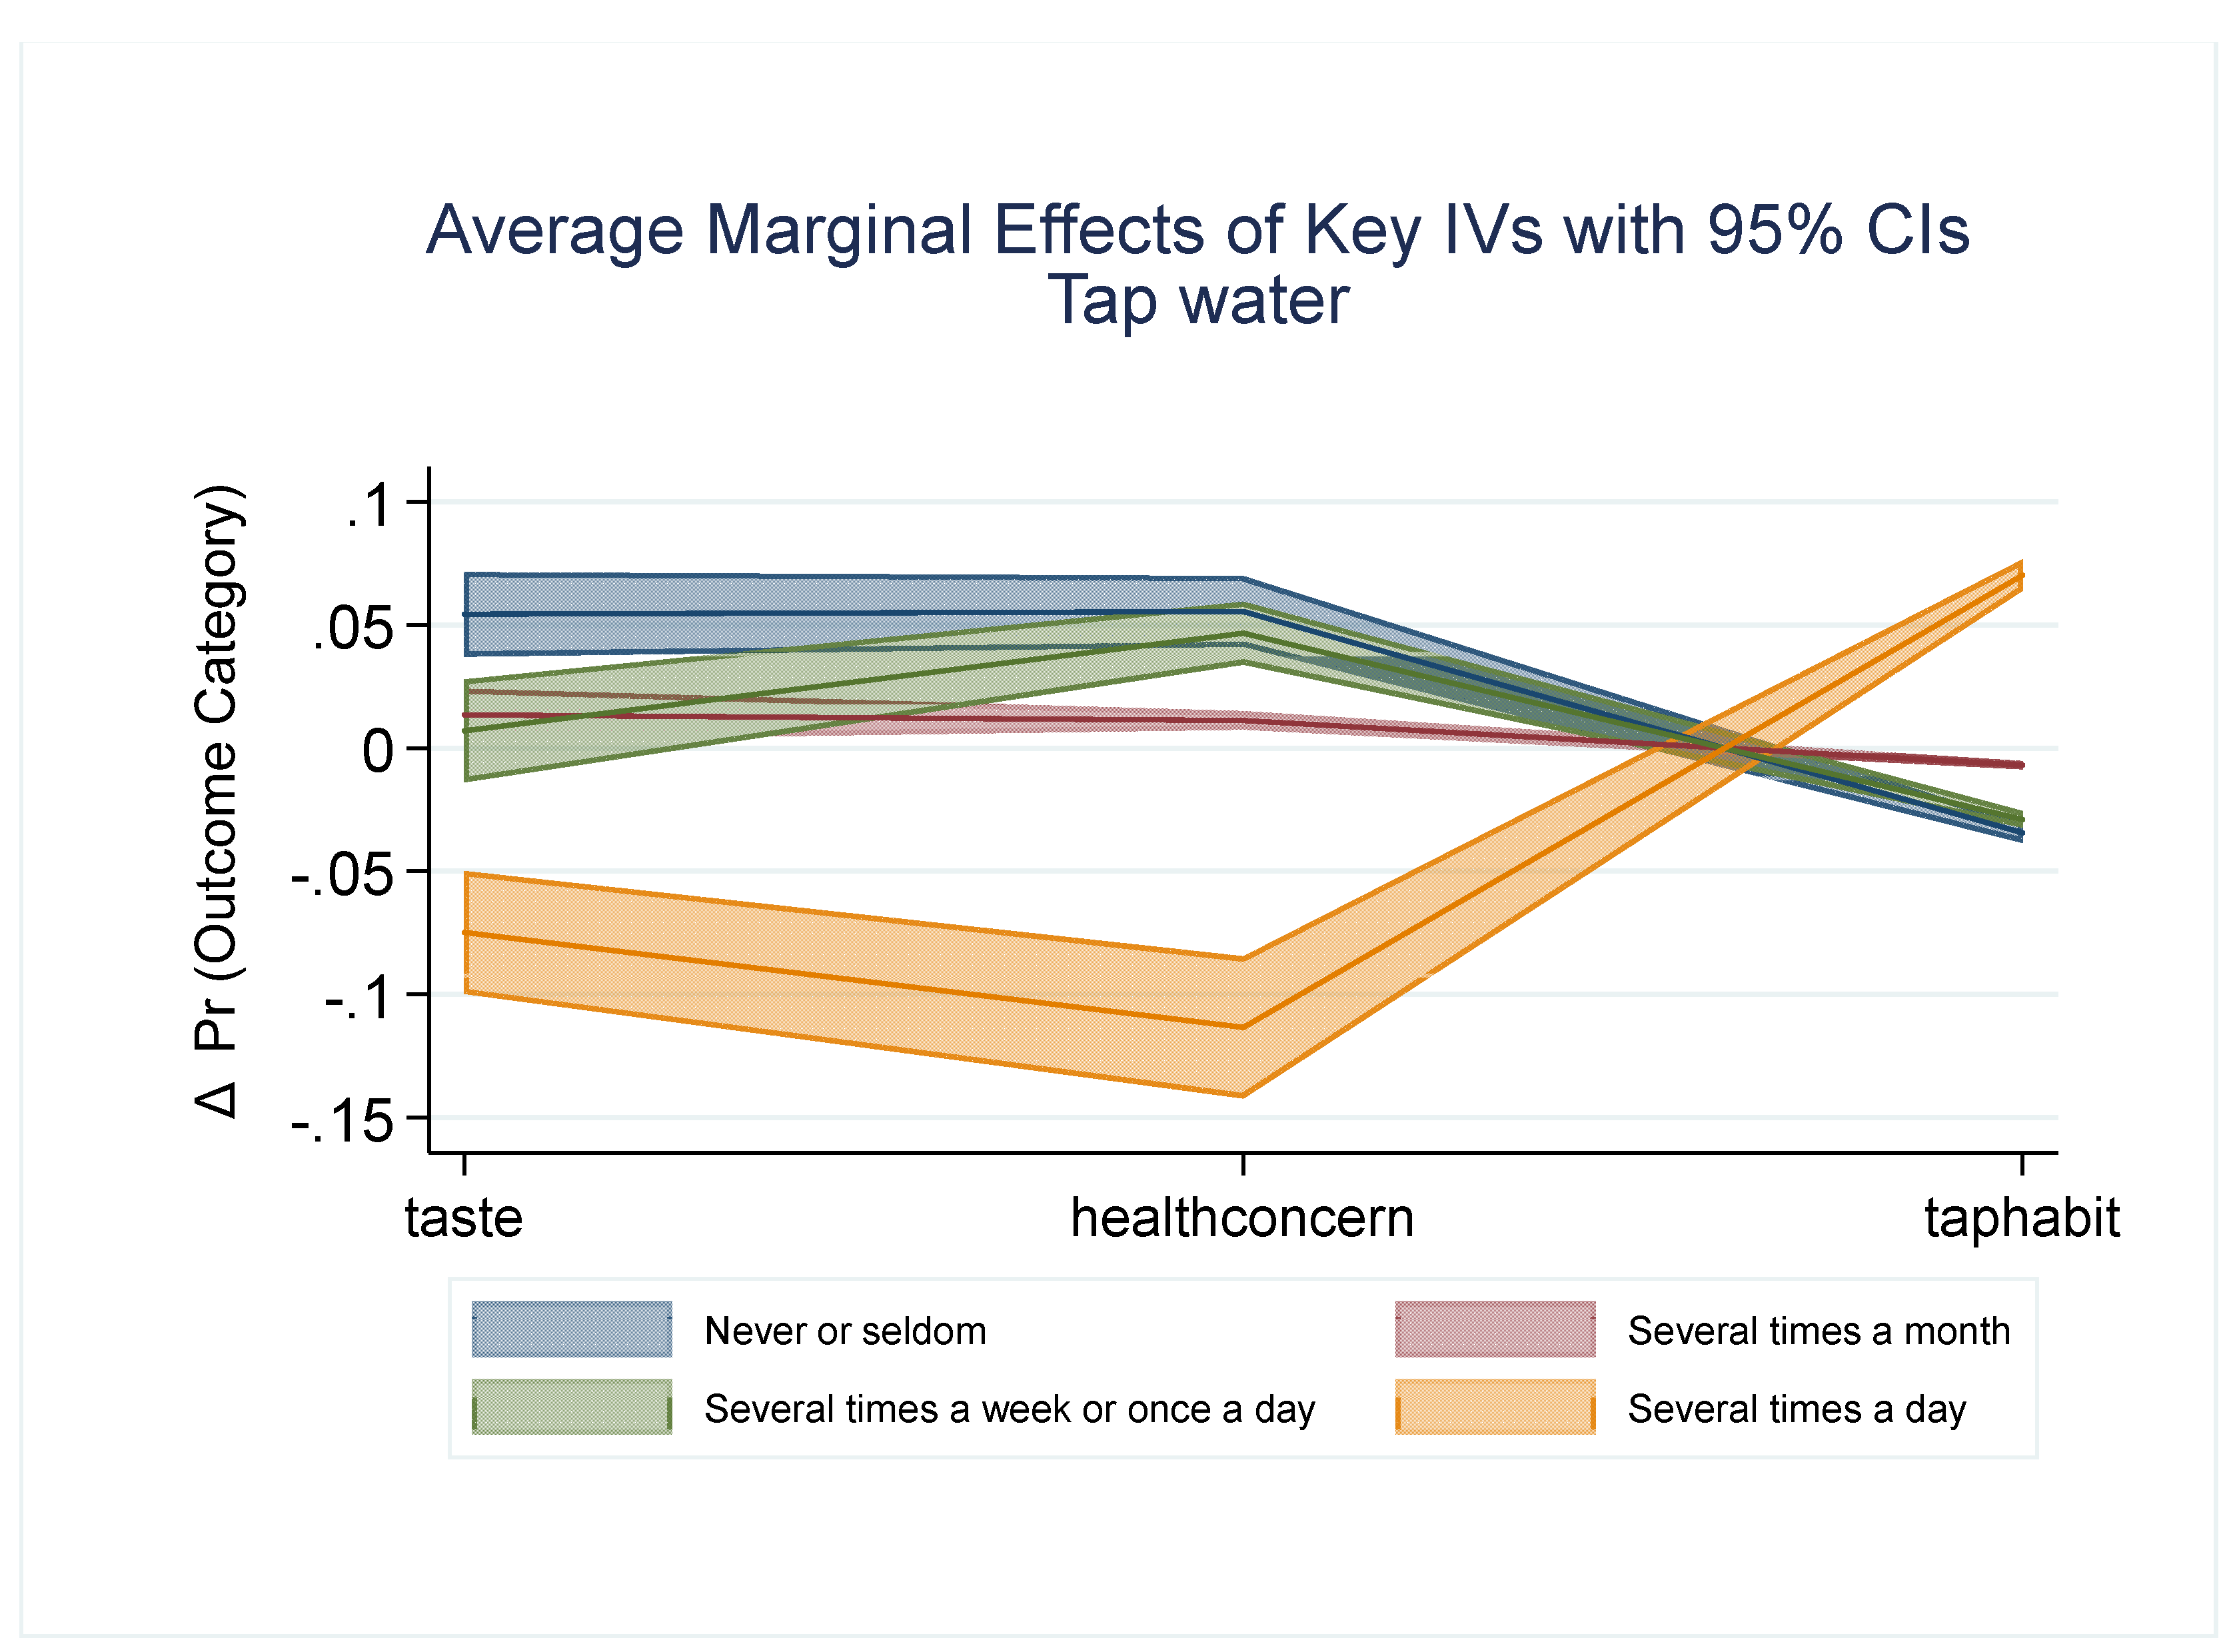
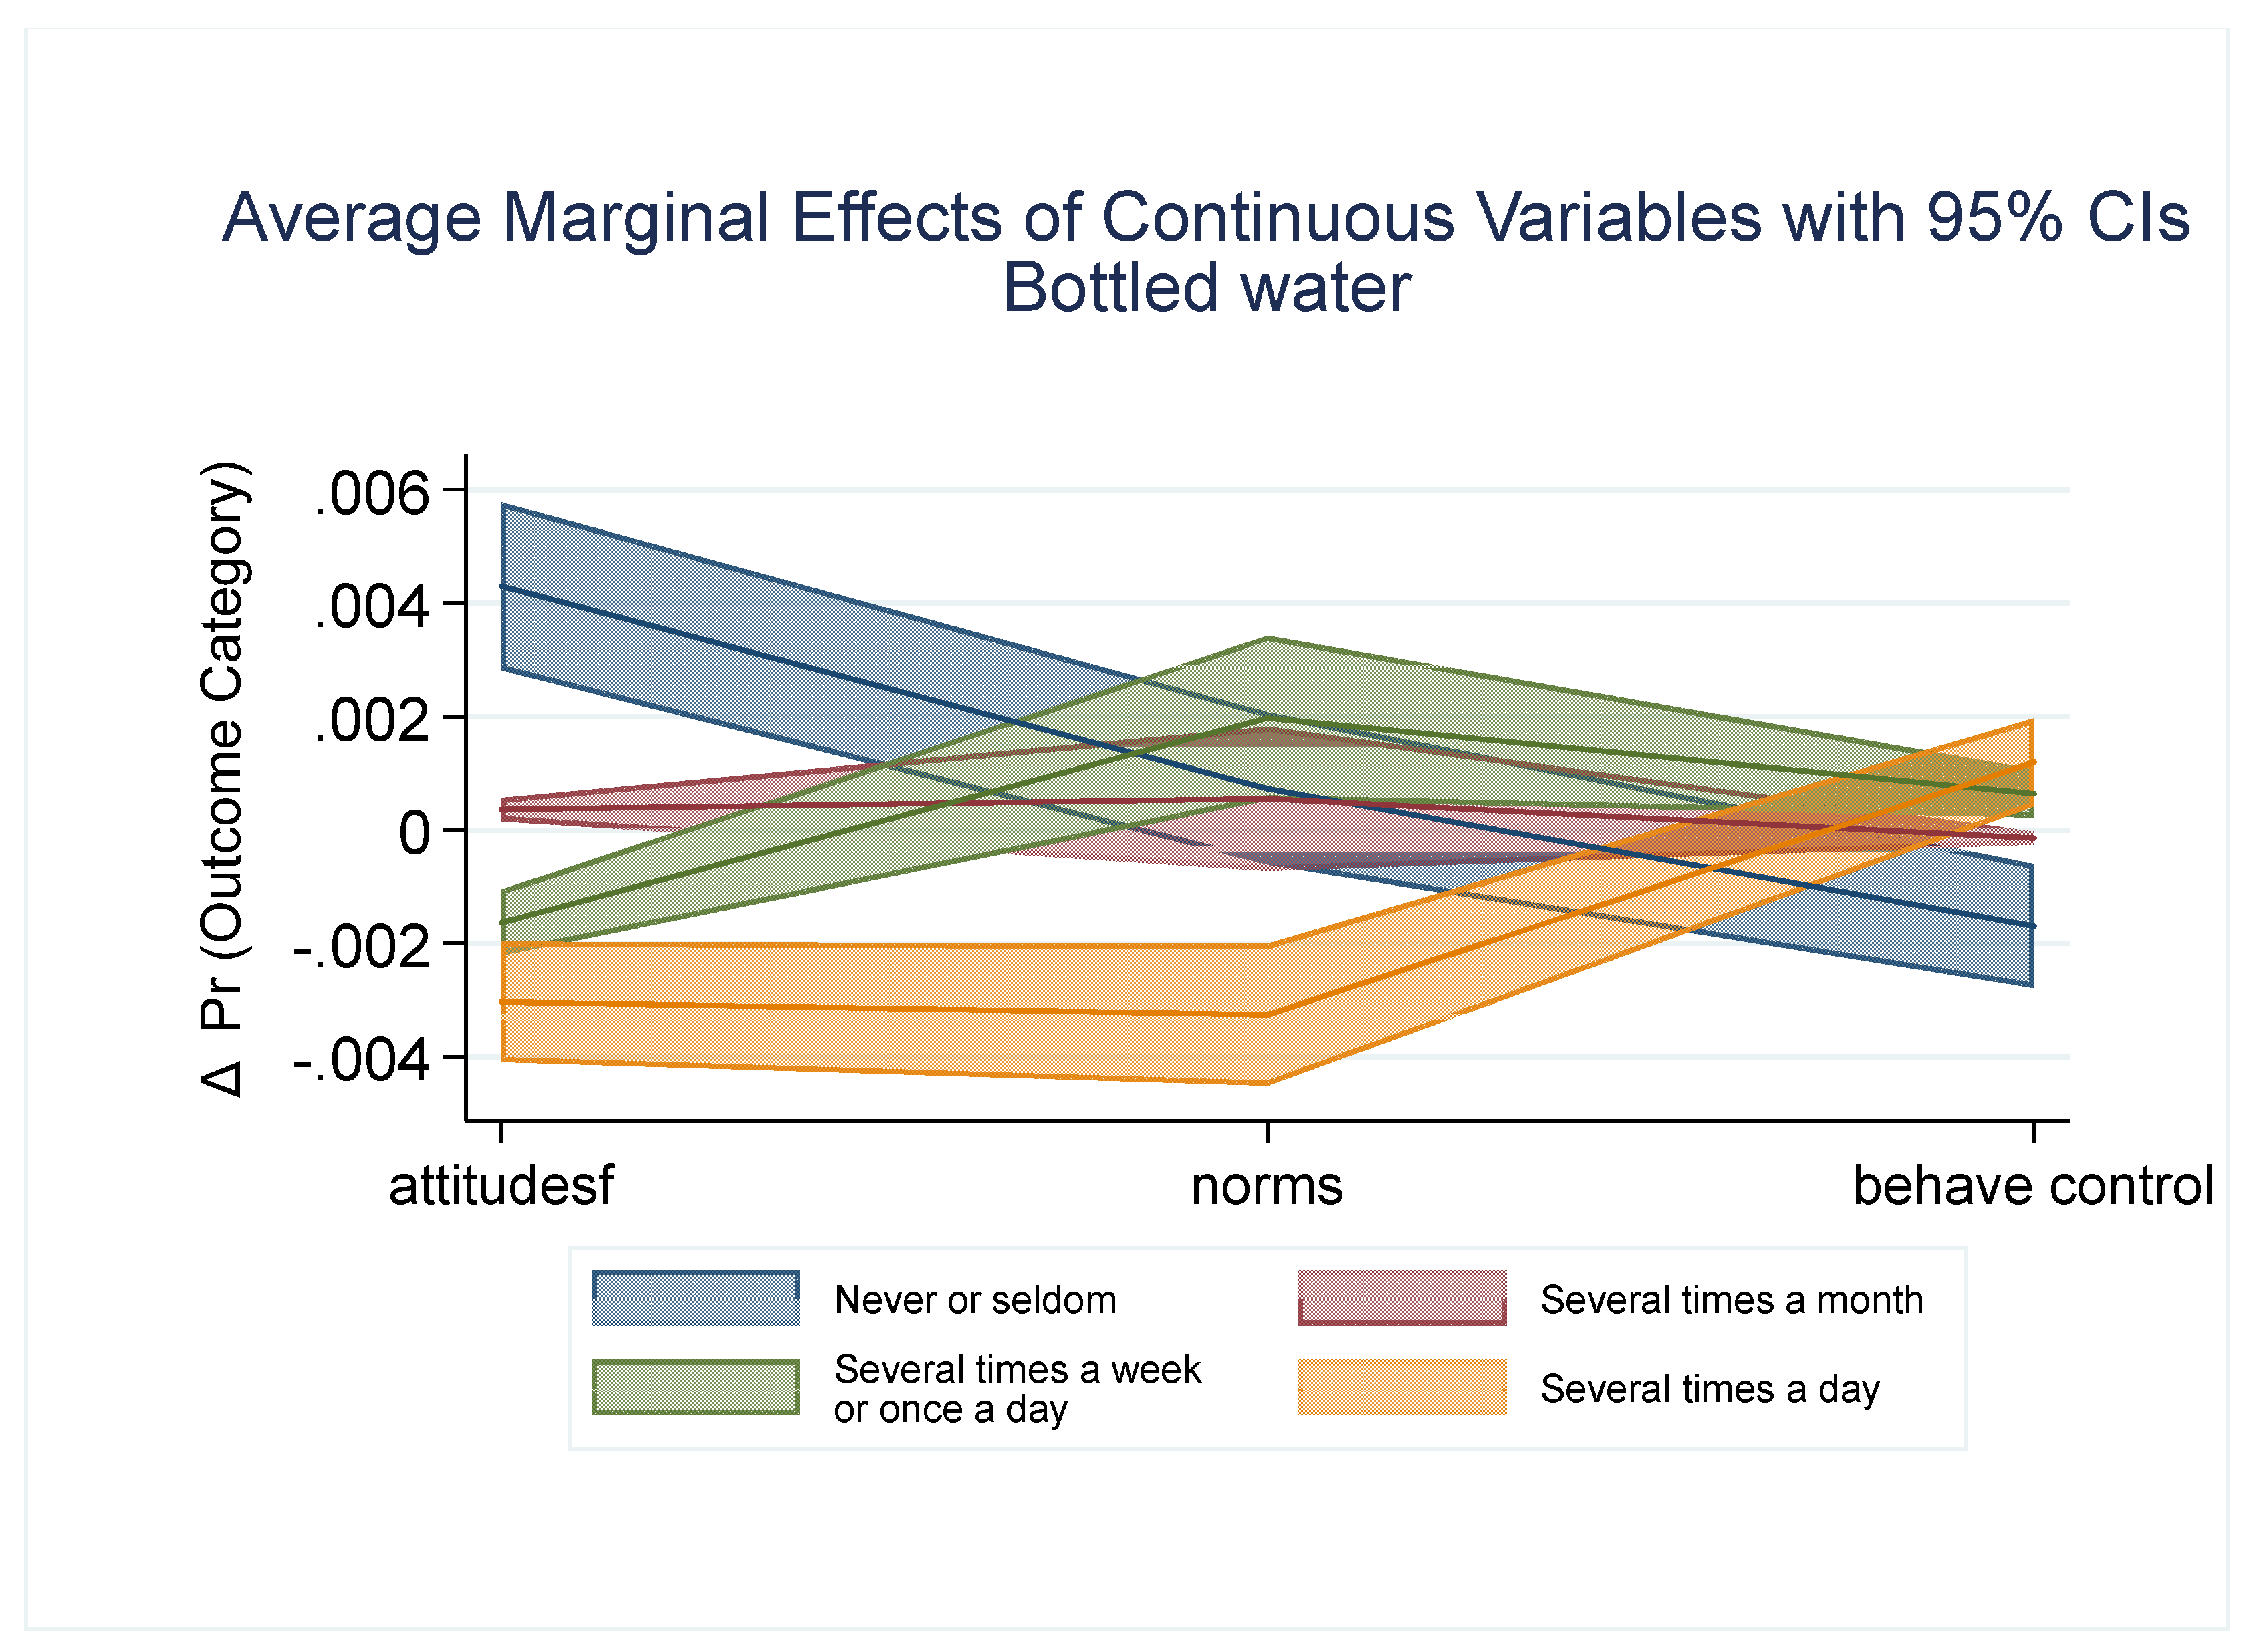
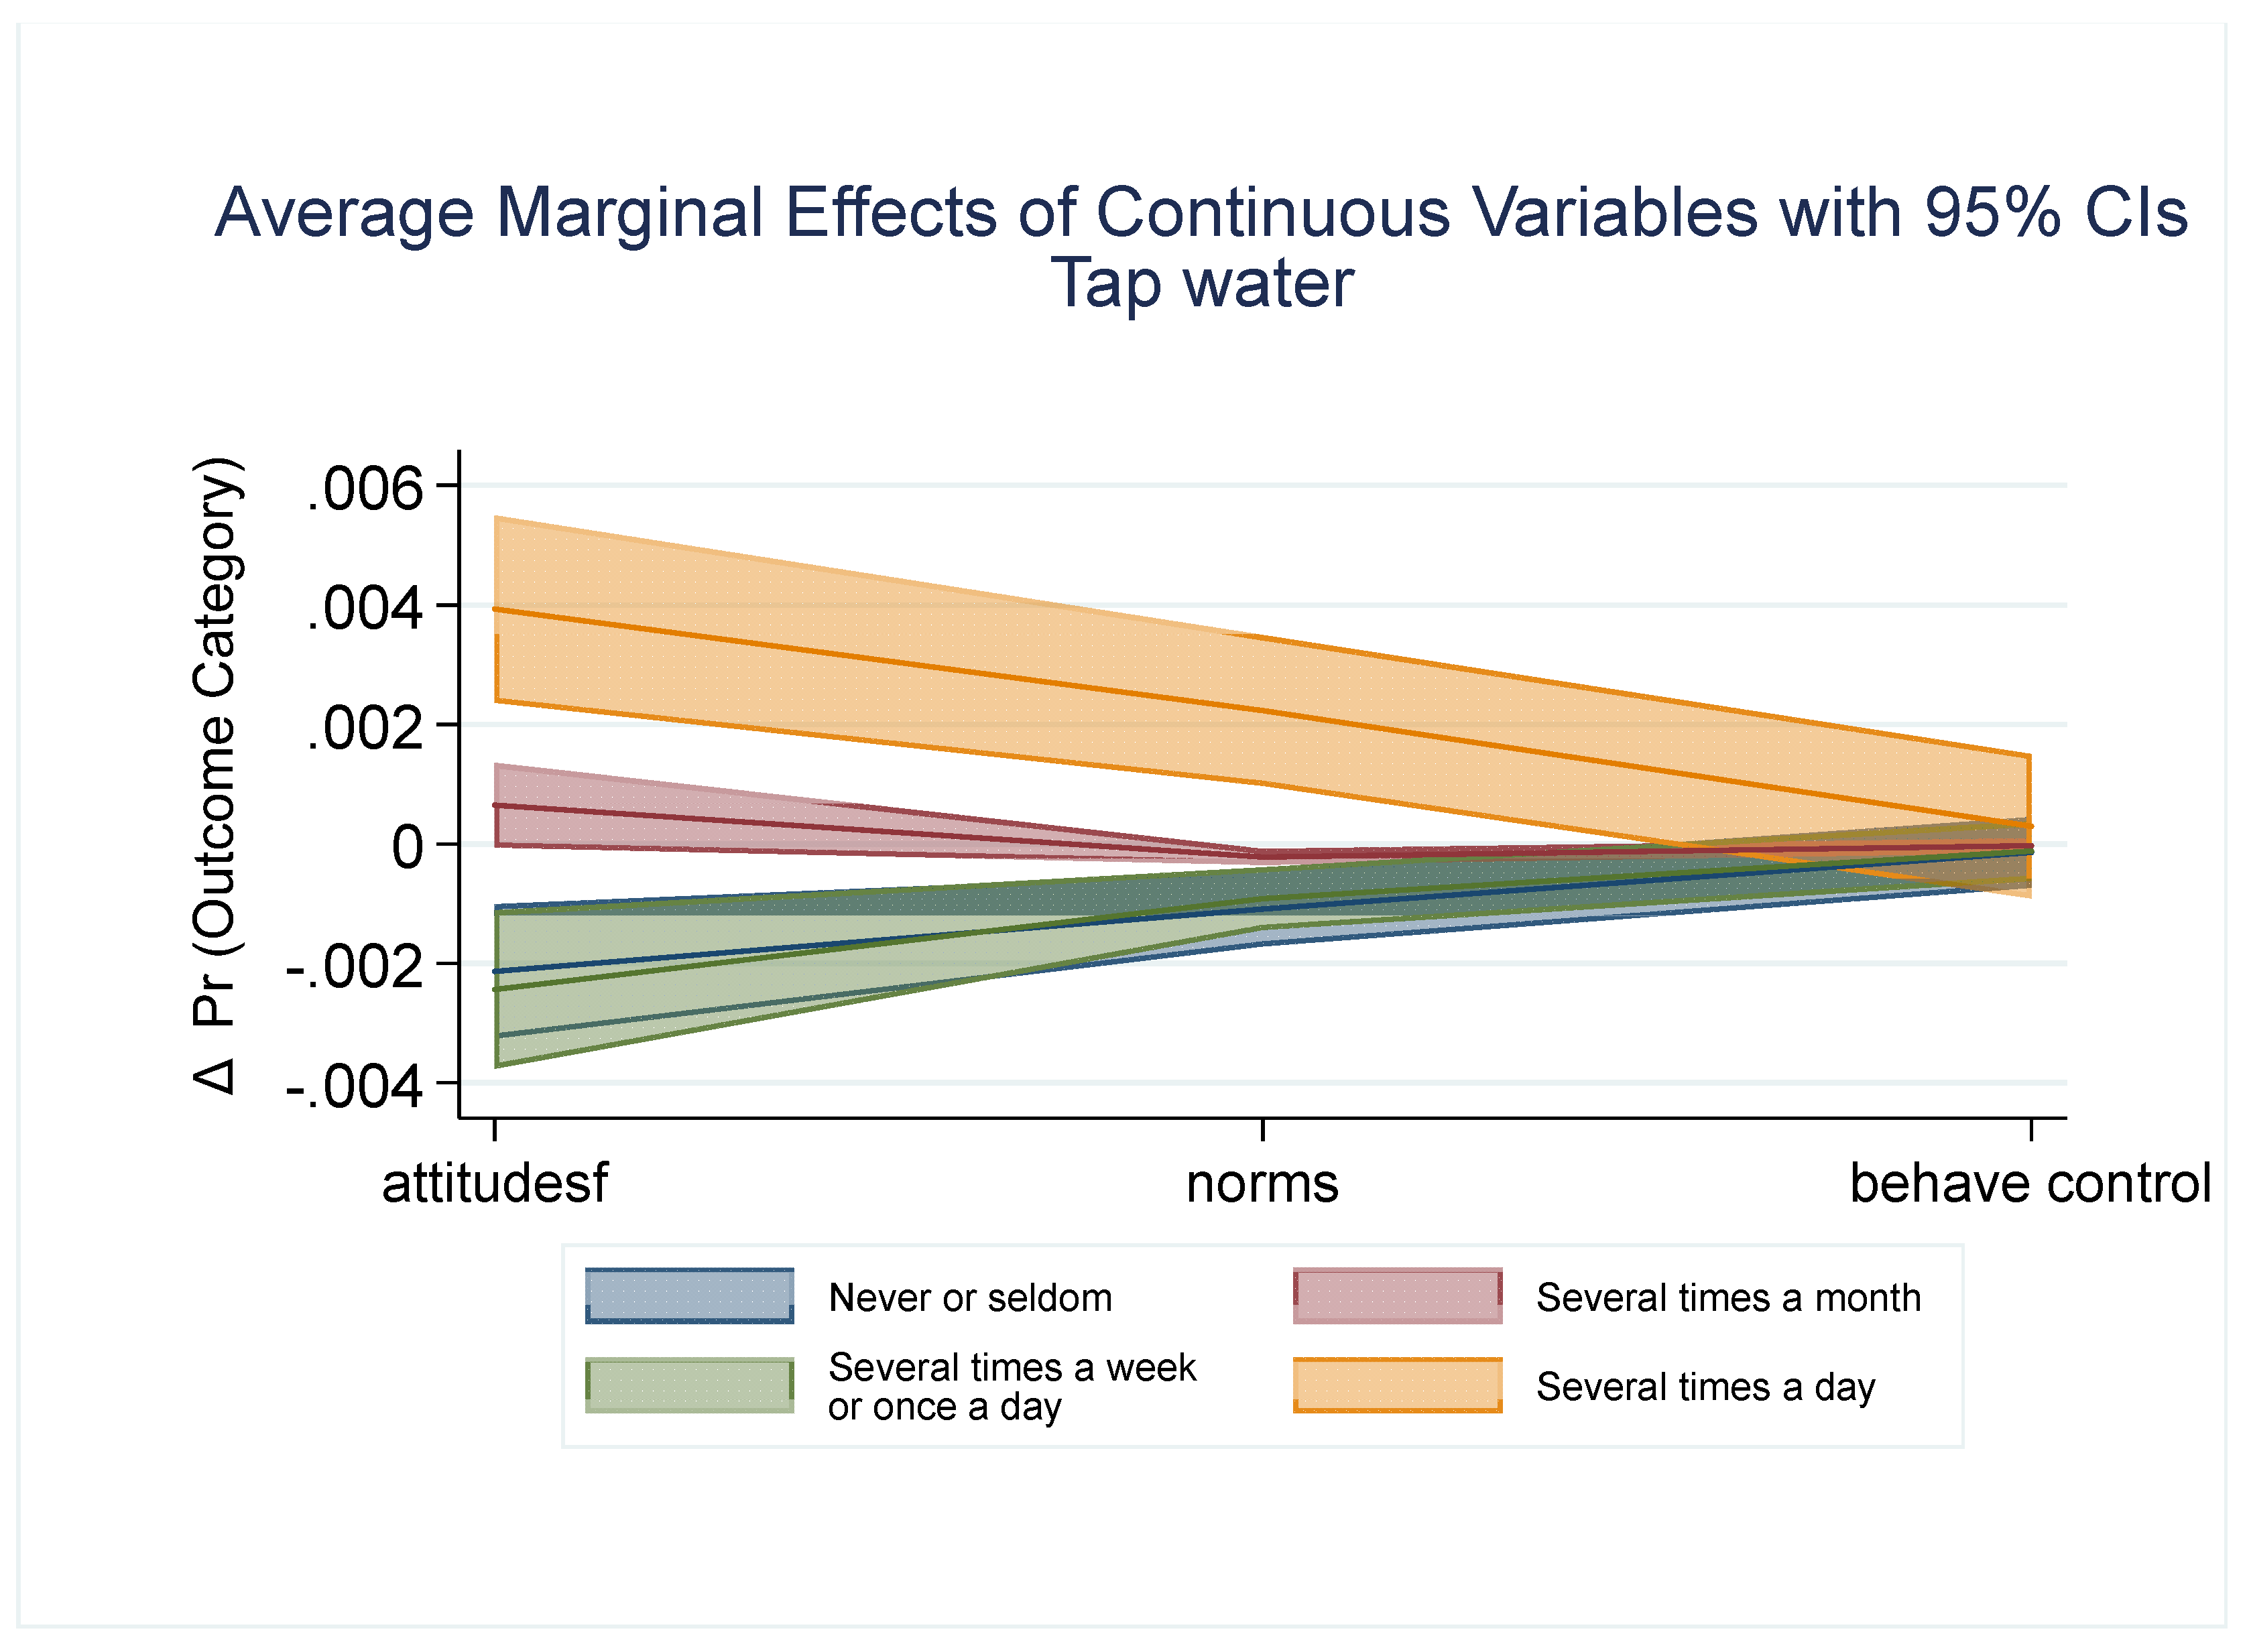
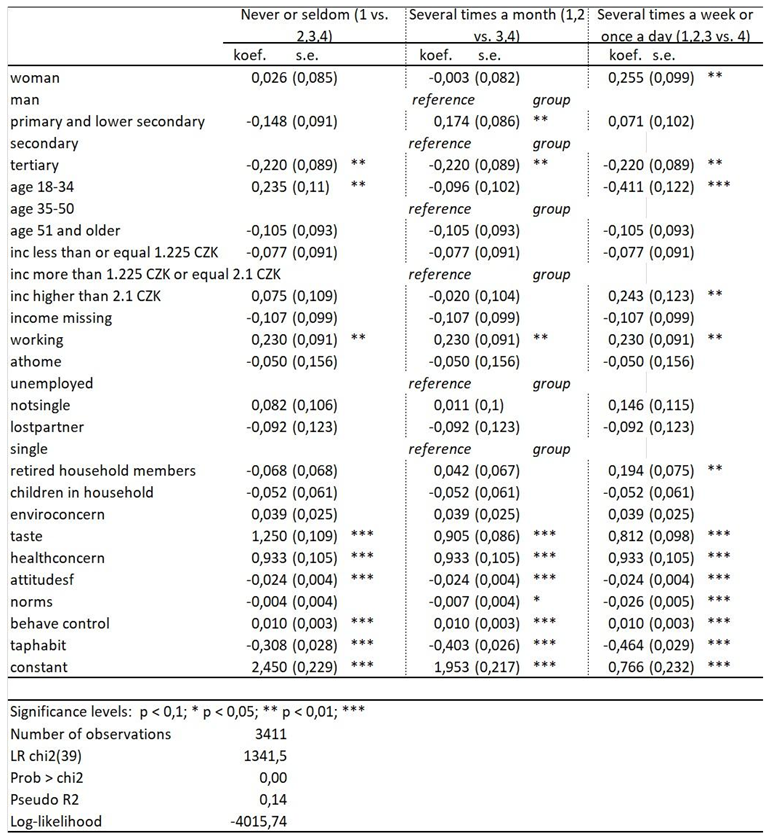
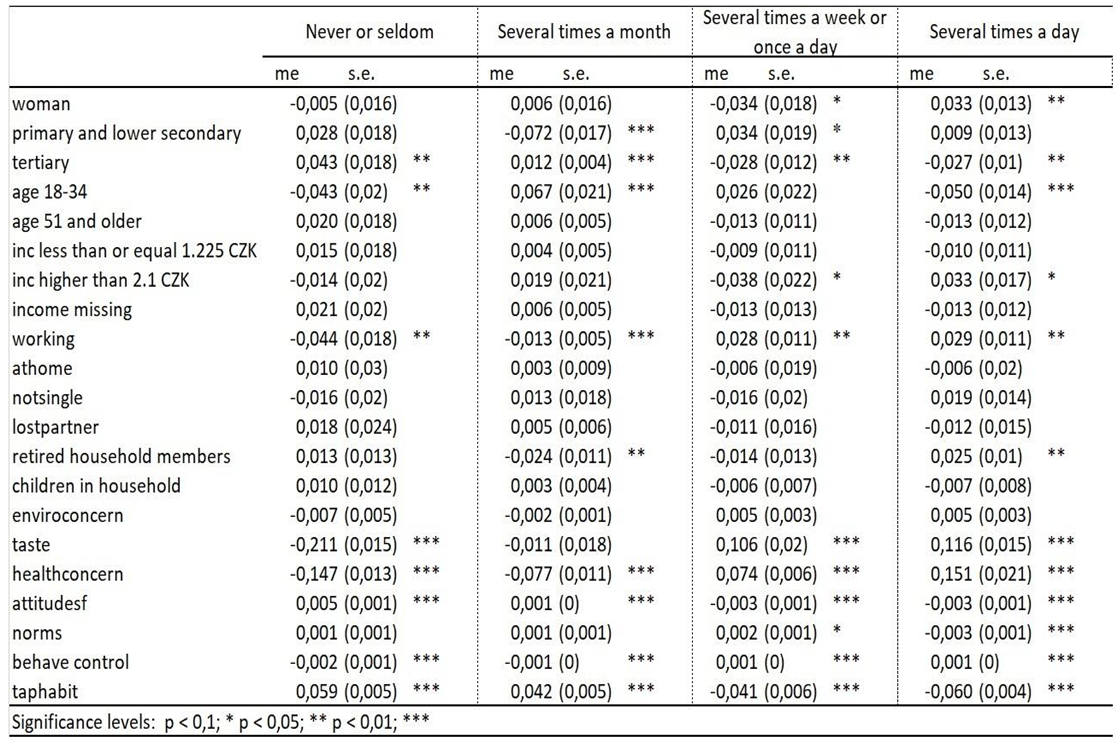
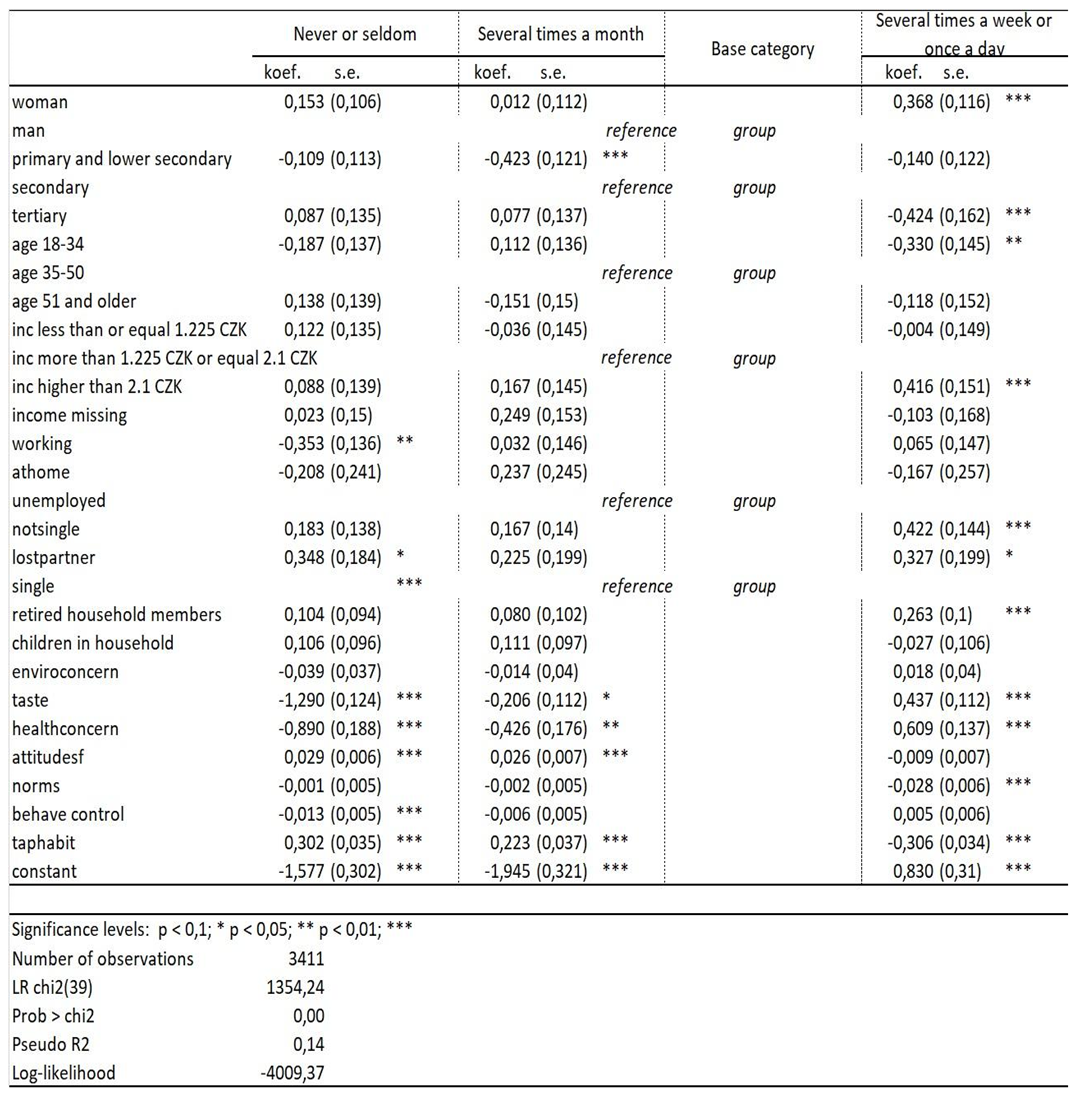
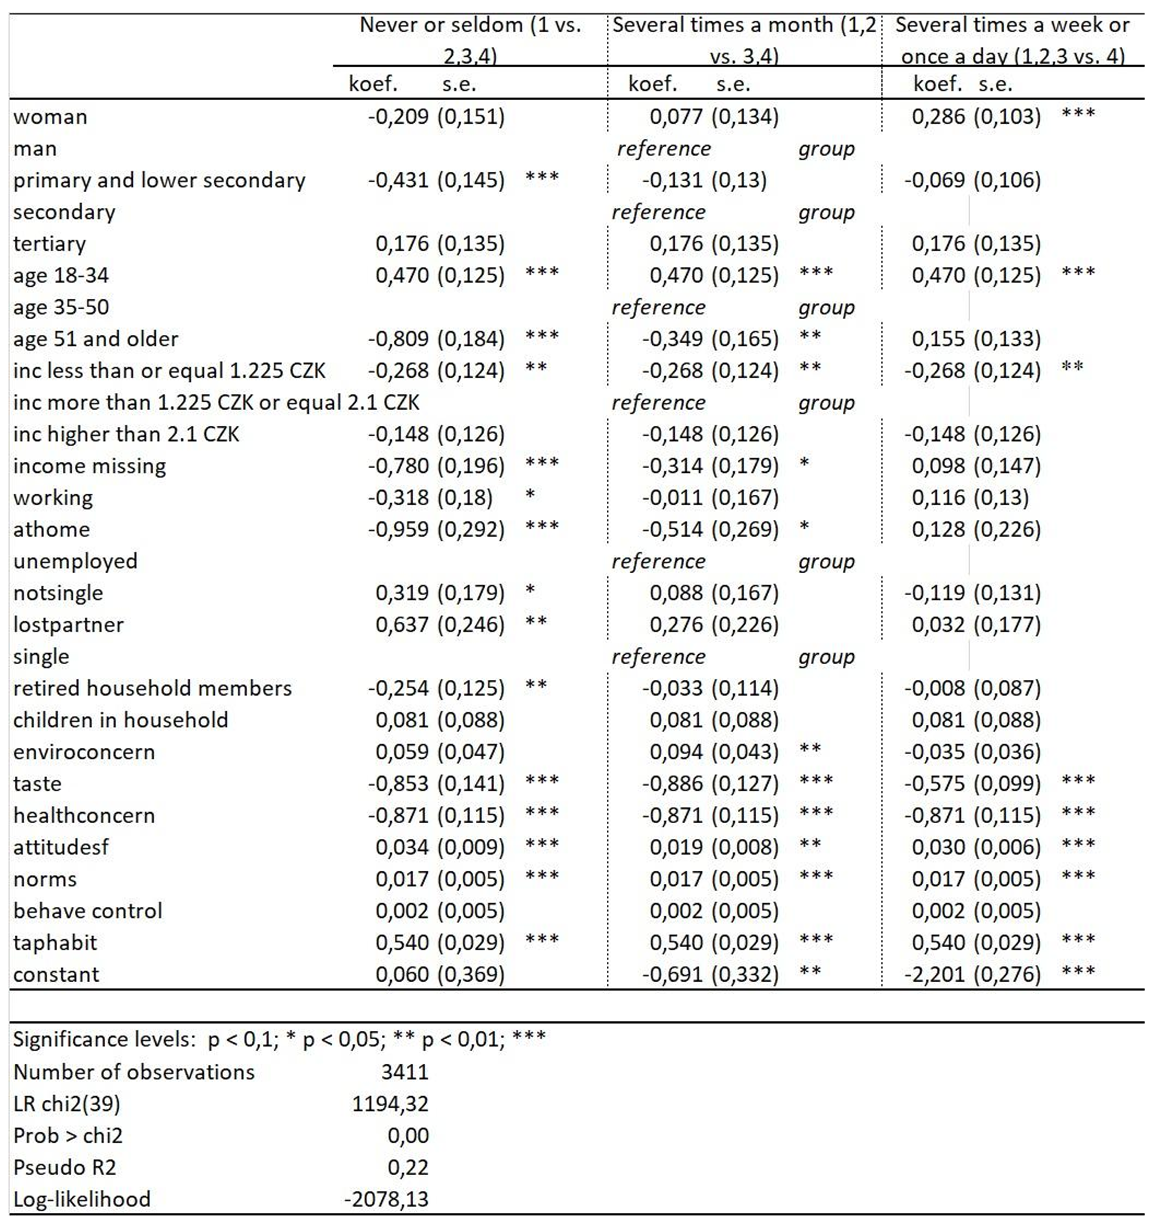
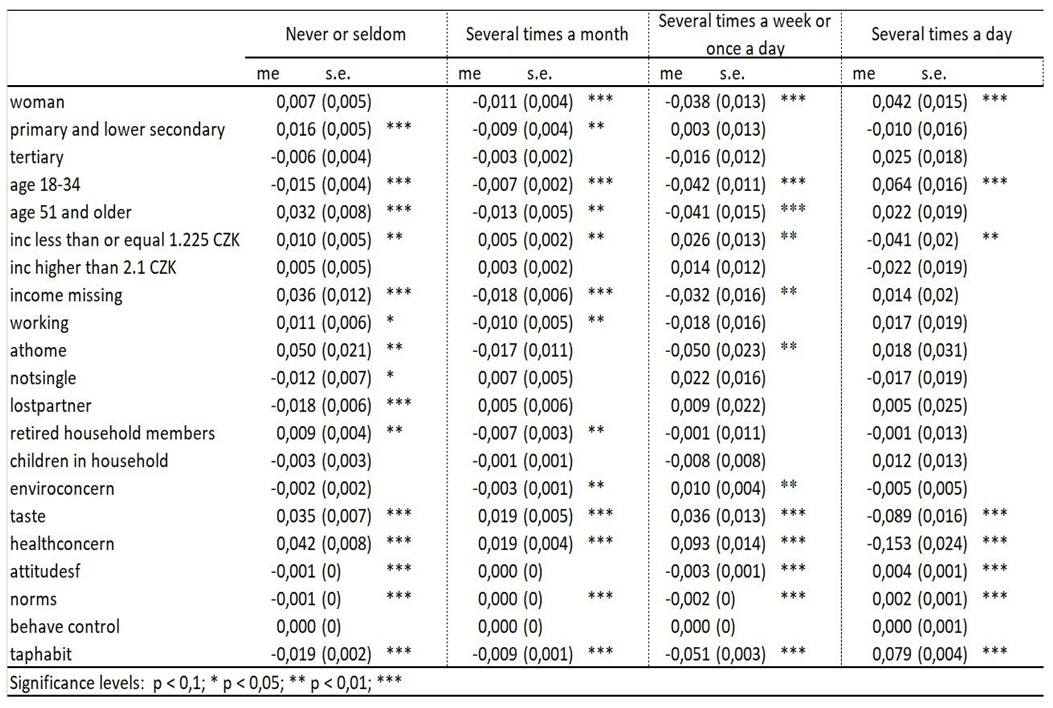
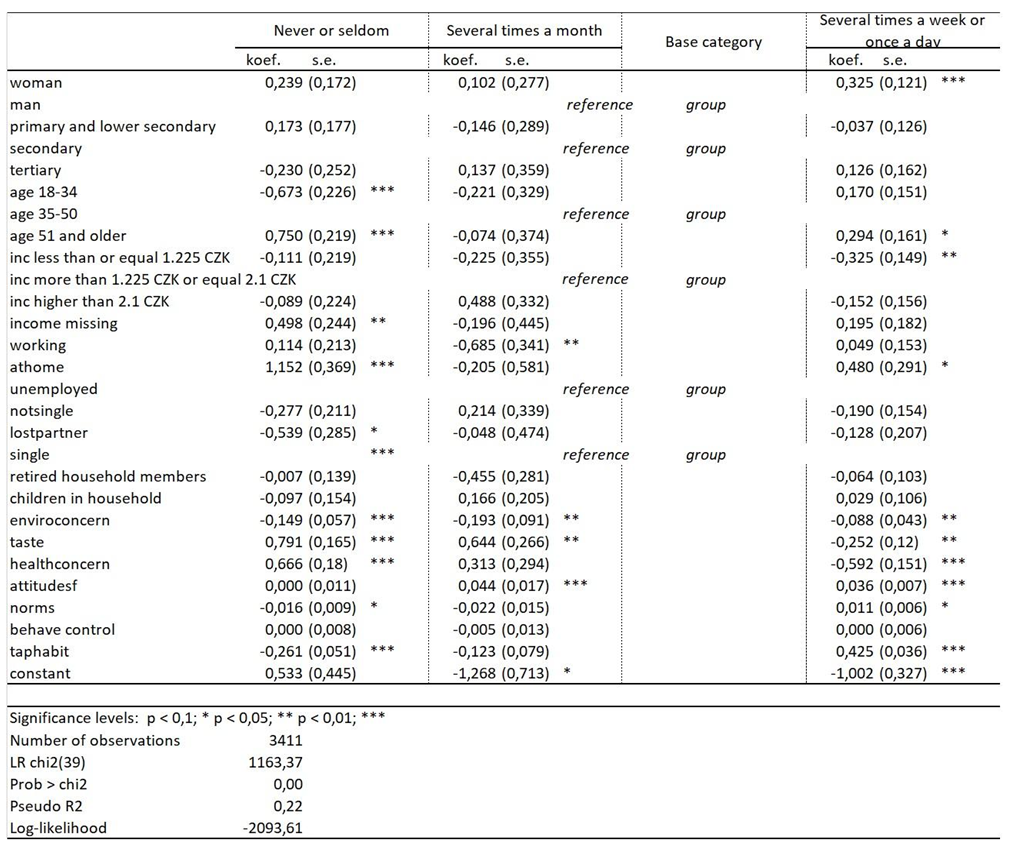
3.3. Factors Explaining Bottled and Tap Water Drinking
4. Discussion and Conclusions
Author Contributions
Funding
Data Availability Statement
Acknowledgments
Conflicts of Interest
References
- Villanueva, C.M.; Garfí, M.; Milà, C.; Olmos, S.; Ferrer, I.; Tonne, C. Health and Environmental Impacts of Drinking Water Choices in Barcelona, Spain: A Modelling Study. Sci. Total Environ. 2021, 795, 148884. [Google Scholar] [CrossRef] [PubMed]
- Gleick, P.H.; Cooley, H.S. Energy Implications of Bottled Water. Environ. Res. Lett. 2009, 4, 014009. [Google Scholar] [CrossRef]
- Free, C.M.; Jensen, O.P.; Mason, S.A.; Eriksen, M.; Williamson, N.J.; Boldgiv, B. High-Levels of Microplastic Pollution in a Large, Remote, Mountain Lake. Mar. Pollut. Bull. 2014, 85, 156–163. [Google Scholar] [CrossRef]
- The EU and the United Nations - Common Goals for a Sustainable Future. Available online: https://commission.europa.eu/strategy-and-policy/sustainable-development-goals/eu-and-united-nations-common-goals-sustainable-future_en (accessed on 24 July 2024).
- Drinking Water. Available online: https://environment.ec.europa.eu/topics/water/drinking-water_en (accessed on 24 July 2024).
- Circular Czechia - Ministry of the Environment of the Czech Republic. Available online: https://www.mzp.cz/cz/cirkularni_cesko (accessed on 24 July 2024).
- Debbeler, L.J.; Gamp, M.; Blumenschein, M.; Keim, D.; Renner, B. Polarized but Illusory Beliefs about Tap and Bottled Water: A Product- and Consumer-Oriented Survey and Blind Tasting Experiment. Sci. Total Environ. 2018, 643, 1400–1410. [Google Scholar] [CrossRef]
- Grupper, M.A.; Schreiber, M.E.; Sorice, M.G. How Perceptions of Trust, Risk, Tap Water Quality, and Salience Characterize Drinking Water Choices. Hydrology 2021, 8, 49. [Google Scholar] [CrossRef]
- Levêque, J.G.; Burns, R.C. Predicting Water Filter and Bottled Water Use in Appalachia: A Community-Scale Case Study. J. Water Health 2017, 15, 451–461. [Google Scholar] [CrossRef]
- Delpla, I.; Legay, C.; Proulx, F.; Rodriguez, M.J. Perception of Tap Water Quality: Assessment of the Factors Modifying the Links between Satisfaction and Water Consumption Behaviour. Sci. Total Environ. 2020, 722, 137786. [Google Scholar] [CrossRef]
- Ober, J.; Karwot, J.; Rusakov, S. Tap Water Quality and Habits of Its Use: A Comparative Analysis in Poland and Ukraine. Energies 2022, 15, 981. [Google Scholar] [CrossRef]
- Romano, G.; Masserini, L. Factors Affecting Customers’ Satisfaction with Tap Water Quality: Does Privatisation Matter in Italy? J. Clean. Prod. 2020, 258, 120593. [Google Scholar] [CrossRef]
- Aslani, H.; Pashmtab, P.; Shaghaghi, A.; Mohammadpoorasl, A.; Taghipour, H.; Zarei, M. Tendencies towards Bottled Drinking Water Consumption: Challenges Ahead of Polyethylene Terephthalate (PET) Waste Management. Health Promot. Perspect. 2021, 11, 60–68. [Google Scholar] [CrossRef]
- Bass, D.A.; McFadden, B.R.; Costanigro, M.; Messer, K.D. Implicit and Explicit Biases for Recycled Water and Tap Water. Water Resour. Res. 2022, 58, e2021WR030712. [Google Scholar] [CrossRef]
- March, H.; Garcia, X.; Domene, E.; Sauri, D. Tap Water, Bottled Water or In-Home Water Treatment Systems: Insights on Household Perceptions and Choices. Water 2020, 12, 1310. [Google Scholar] [CrossRef]
- Bethurem, M.; Choate, B.; Bramwell, S. Stop Piling on: Assessing Efforts to Reduce Single-Use Water Bottles at Allegheny College. Sustainability 2021, 13, 8864. [Google Scholar] [CrossRef]
- Jones, A.Q.; Dewey, C.E.; Doré, K.; Majowicz, S.E.; McEwen, S.A.; Waltner-Toews, D.; Henson, S.J.; Mathews, E. A Qualitative Exploration of the Public Perception of Municipal Drinking Water. Water Policy 2007, 9, 425–438. [Google Scholar] [CrossRef]
- Qian, N. Bottled Water or Tap Water? A Comparative Study of Drinking Water Choices on University Campuses. Water 2018, 10, 59. [Google Scholar] [CrossRef]
- Viscusi, W.K.; Huber, J.; Bell, J. The Private Rationality of Bottled Water Drinking. Contemp. Econ. Policy 2015, 33, 450–467. [Google Scholar] [CrossRef]
- Cohen, A.; Ray, I. The Global Risks of Increasing Reliance on Bottled Water. Nat. Sustain. 2018, 1, 327–329. [Google Scholar] [CrossRef]
- Borusiak, B.; Szymkowiak, A.; Pierański, B.; Szalonka, K. The Impact of Environmental Concern on Intention to Reduce Consumption of Single-Use Bottled Water. Energies 2021, 14, 1985. [Google Scholar] [CrossRef]
- Gambino, I.; Bagordo, F.; Coluccia, B.; Grassi, T.; Filippis, G.D.; Piscitelli, P.; Galante, B.; Leo, F.D. PET-Bottled Water Consumption in View of a Circular Economy: The Case Study of Salento (South Italy). Sustainability 2020, 12, 7988. [Google Scholar] [CrossRef]
- Geerts, R.; Vandermoere, F.; Van Winckel, T.; Halet, D.; Joos, P.; Van Den Steen, K.; Van Meenen, E.; Blust, R.; Borregán-Ochando, E.; Vlaeminck, S.E. Bottle or Tap? Toward an Integrated Approach to Water Type Consumption. Water Res. 2020, 173, 115578. [Google Scholar] [CrossRef]
- Ajzen, I. The Theory of Planned Behaviour. Organ. Behav. Hum. Decis. Process. 1991, 50, 179–211. [Google Scholar] [CrossRef]
- Saefi, M.; Fauzi, A.; Kristiana, E.; Adi, W.C.; Islami, N.N.; Ikhsan, M.A.; Ramadhani, M.; Ningrum, D.E.A.F.; Setiawan, M.E.; Muchson, M. Theory of Planned Behaviour to Analyze Students’ Intentions in Consuming Tap Water. Eurasia J. Math. Sci. Technol. Educ. 2023, 19, em2236. [Google Scholar] [CrossRef] [PubMed]
- Mir Mohamad Tabar, S.A.; Brewis, A.; Sohrabi, M. Status, Social Norms, or Safety? Understanding Intended and Reported Bottled Water Use in Urban Mashhad, Iran. J. Water Health 2023, 21, 81–93. [Google Scholar] [CrossRef] [PubMed]
- Vaske, J.J. Survey Research and Analysis: Applications in Parks, Recreation and Human Dimensions; Venture Pub: State College, Pa, 2008; ISBN 978-1-892132-79-6. [Google Scholar]
- Report on the State of Water Management in the Czech Republic in 2020; Ministry of Agriculture and Ministry of the Environment of the Czech Republic: Prague, 2021; ISBN 978-80-7434-626-2.
- Verplanken, B.; Orbell, S. Reflections on Past Behavior: A Self-Report Index of Habit Strength. Journal of Applied Social Psychology 2003, 33, 1313–1330. [Google Scholar] [CrossRef]
- de Groot, J.I.M.; Steg, L. Value Orientations to Explain Beliefs Related to Environmental Significant Behavior: How to Measure Egoistic, Altruistic, and Biospheric Value Orientations. Environment and Behavior 2007, 40, 330–354. [Google Scholar] [CrossRef]
- Schwartz, S.H. Universalism Values and the Inclusiveness of Our Moral Universe. Journal of Cross-Cultural Psychology 2007, 38, 711, 728. [Google Scholar] [CrossRef]
- Durmaz, A.; Dursun, İ.; Kabadayi, E.T. Mitigating the Effects of Social Desirability Bias in Self-Report Surveys; 2020.

| Set up quotas (%) |
Proportion in the sample (%) | Chi-square test | |
| Gender | |||
| male | 51 | 51 | 0.908 |
| female | 49 | 49 | |
| other | - | 0 | |
| Age | |||
| 18-34 y.o. | 28 | 27 | 0.168 |
| 35-50 y.o. | 37 | 37 | |
| 51-69 y.o. | 35 | 36 | |
| Region | |||
| Prague | 13 | 13 | 1.000 |
| Central Bohemia | 13 | 13 | |
| South Bohemia | 6 | 6 | |
| Pilsen | 6 | 6 | |
| Karlovy Vary | 3 | 3 | |
| Ústí nad Labem | 7 | 7 | |
| Liberec | 4 | 4 | |
| Hradec Králové | 5 | 5 | |
| Pardubice | 5 | 5 | |
| Vysočina | 5 | 5 | |
| South Moravian | 11 | 11 | |
| Olomouc | 6 | 6 | |
| Zlín | 5 | 5 | |
| Moravian-Silesian | 11 | 11 | |
| Education | |||
| primary and lower secondary | 42 | 41 | 0.747 |
| upper secondary | 37 | 37 | |
| tertiary | 21 | 21 | |
| Size of place of residence | |||
| Up to 4 999 | 40 | 40 | 0.930 |
| 5 000 - 49 999 | 30 | 30 | |
| Over 50 000 | 30 | 30 |
Disclaimer/Publisher’s Note: The statements, opinions and data contained in all publications are solely those of the individual author(s) and contributor(s) and not of MDPI and/or the editor(s). MDPI and/or the editor(s) disclaim responsibility for any injury to people or property resulting from any ideas, methods, instructions or products referred to in the content. |
© 2024 by the authors. Licensee MDPI, Basel, Switzerland. This article is an open access article distributed under the terms and conditions of the Creative Commons Attribution (CC BY) license (http://creativecommons.org/licenses/by/4.0/).


