Preprint
Article

Regulated ICP-OES Detectible Elements in Utah Lake: Characterization and Discussion

Altmetrics

Downloads

130

Views

32

Comments

0

A peer-reviewed article of this preprint also exists.

Submitted:

02 July 2024

Posted:

04 July 2024

You are already at the latest version

Alerts
Abstract
During 2021 and 2022 summers, we measured the total and dissolved (< 0.45 mm) concentration of 25 elements in Utah Lake using Inductively Coupled Plasma Optical Emission Spectrometry (ICP-OES). Utah regulates twelve of these elements. ICP-OES sensitivity is at the ppb-level but is not the approved regulatory method. All regulations are for dissolved concentrations; except aluminum (Al) and phosphorus (P) which are for total recovery. We found total Al concentrations above allowable, but dissolved concentrations were well below allowable concentrations. We attribute high total concentrations to suspended clays. Dissolved copper (Cu) concentrations were below regulatory levels in 2021, but some samples were above regulatory levels in 2022. This could be related to the use of Cu-based algaecide treatments, or from other sources. Lead (Pb) data were inconclusive; dissolved Pb concentrations were well below the acute (1-hour average) limit, but the chronic concentration limit (4-hour average) is below the ICP-OES minimal detection limit. Arsenic (As) concentrations exhibit a seasonal trend that we attribute to groundwater inflows. This ppb-level study provides insight into regulated elements in Utah Lake previously not available due to the high sensitivity of the method and measurements of both total and dissolved concentrations.
Keywords: 
Subject: Environmental and Earth Sciences  -   Water Science and Technology

1. Introduction

1.1. Study Overview

Utah Lake (UL) is approximately 40 km by 21 km, with a surface area of 390 km2 at maximum fill and is in north-central Utah in the United States. UL waters are characteristically turbid and unstratified because of wave action and bioturbation, and are near the solubility limit of calcite, with calcite precipitation commonly occurring [1].
There is a significant body of published research on UL. Early published UL research from 1931 [2] addresses algae, with additional work on phytoplankton communities published in the 1960s through the present [3,4,5,6,7,8,9,10,11,12]. Numerous studies on nutrients have been published [13,14,15,16,17,18,19,20,21] with studies on the local geology which contains formations that are elevated in phosphorus (P) [21,22,23]. Early remote sensing studies from the 1970s used UL in some of the first papers from NASA’s Landsat satellite [24,25]. Other early remote sensing studies from the 1980s demonstrated the Heat Capacity Mapping Mission (HCMM) [26] and AVHRR sensor [27] on UL. Recent studies using remote sensing data address long-term trends and variability in algal blooms [28,29,30,31,32,33,34,35,36,37,38].
With the exception of P, there has been little published work on regulated elements in UL water [39]. A 2014 study focused on compliance with EPA standards and identifying pollution sources for arsenic (As) and other heavy metals in Utah Lake and its tributaries [40]. Despite the lack of studies on regulated elements in UL, their concentrations are a concern as excessive or deficient amounts of these elements can have damaging effects on aquatic life [41,42,43] and affect biogeochemical processes [44]. The impacts of trace elements in aquatic systems have been studied worldwide [45,46] demonstrating that in most ecosystems, nutrients are the limiting factor in algal growth, though sometimes other trace elements limit growth. [ayer,etal.[47] studied Lake Hayes in New Zealand in regard to the importance of macro- and micronutrients. They reported on nitrogen (N), P, copper (Cu), iron (Fe), boron (B), molybdenum (Mo), zinc (Zn), and silicon (Si) and found that the limiting factors for phytoplankton growth in Lake Hayes were N, Zn, and B—rather than P. [engg,etal.[48] evaluated the trace elements of manganese (Mn), cobalt (Co), Fe, Zn, and Mo in the waters of the Taupo Volcanic Zone (TVZ) in New Zealand and found that Fe was a colimiting micronutrient for cyanobacteria. Studies in southeastern Australia showed that trace micronutrients are “an important regulator of the severity of cyanobacterial blooms” [49,50]. This research shows that understanding trace micronutrients is required to effectively manage algal blooms as these trace elements may control ecological processes. Our study starts to provide these data for UL.
We provide data on regulated elements that can be detected using Inductively Coupled Plasma Optical Emission Spectrometry (ICP-OES). We selected ICP-OES for this study for two reasons, 1) it measures 25 elements per sample providing a comprehensive data set, and 2) it has very low part-per-billions (ppb) detection limits for these elements. These regulated detectible elements (DE) include heavy metal and nonmetal elements in UL. Over two summers, we measured both dissolved and suspended concentrations of DEs in UL. For this manuscript we evaluated the 12 regulated elements that are detected by ICP-OES. For five of these elements which are well under regulatory levels of concern we provide only a minimal discussion. We provide a more detailed discussion on the seven elements more likely to be of concern, either from toxic excess or deficiency. We did not follow regulatory methods for the elements presented in this analysis as we used a standard ICP-OES method – ICP-OES is not generally stated for most standard methods as it is complex and expensive and for most elements the low detection levels are not required. Also, ICP-OES measures elemental concentrations, while many regulations are based on ionic or molecular forms. Our analysis of this large range of elemental concentrations (25) at the very low ppb detection level for both total and dissolved concentrations provides insight into UL conditions and potential elements of concern, from both toxic excess and toxic deficiency levels. It characterizes if the elements are in the dissolved state, and thus more biologically available, or associated with suspended solids. This analysis is not meant to determine if UL waters are out of compliance with Utah regulatory standards, but rather to provide important information about conditions on the lake and facilitate future research.

1.2. ICP-OES Detectable Elements in aquatic systems

1.2.1. Ecological Impacts of Detectable Elements

Trace metals and other elements are natural and present in all ecosystems and water concentrations are influenced by geology, land use, erosion, ecology, and geochemistry. Ecological processes also affect concentrations as aquatic biota ingest and absorb metals. These organisms are affected in both beneficial and adverse ways by the concentrations of these elements. These trace elements typically have no visible indicators in surface waters, although at toxic or deficient levels can cause visual impacts on the ecology [51]. The toxicity of trace elements is a particular concern for UL as it hosts a large migratory bird population along with the endemic and threatened June Sucker fish species. All metals are toxic at certain thresholds [52] and impair the survival, reproduction, and behavior of aquatic life.
Some common toxic DE in lakes and reservoirs, including metals, found at concentrations which can cause detrimental impacts include arsenic (As), cadmium (Cd), chromium (Cr), lead (Pb), nickel (Ni), selenium (Se), copper (Cu), and zinc (Zn) [51]. Even at non-toxic concentrations, As, Cd, and Pb, can affect mobility, feeding, and navigation behaviors of invertebrates [53,54,55]. These effects cascade through aquatic ecosystems [56,57]. In larger organisms such as fish, Pb, Cd, Ni, and Cr can impact growth rates, biological processes, and reproductive health [58,59]. Impacts of aluminum (Al), Cd, Cu, Zn, Pb, Ni, As, and Se on birds include behavioral impairments and reduced reproductive success [60,61,62].
Some metals are toxic at excess levels and also harmful when deficient. Zn, Cu, and Ni, negatively impact biological activity if they are present in excess levels as well as if they are missing or below toxic deficit concentrations [41,42,43,56,57,63]. Some elements, such as boron (B), iron (Fe), manganese (Mn), and molybdenum (Mo), are beneficial at certain concentrations and act as micronutrients that are essential for aquatic life. Micronutrients have been found to be limiting or colimiting factors for algal growth [47,64,65,66,67]. In 2008, Downs, et al. [43] conducted a review of micronutrients in 56 freshwater lakes and found that “the proportion of the lakes analyzed in which micronutrient limitation was found was 76% for molybdenum; 74% for iron; 67% for boron, 67% for cobalt, and 20% for copper.” Similar to the effects of toxicity, nutrient deficiencies for algae and phytoplankton affect the entire biota of lake systems, including invertebrates, migratory birds, fish, and other organisms [56,57].
The US Environmental Protection Agency (EPA) states that sources and activities “such as mines, smelters, firing ranges, municipal wastewater treatment outfalls, industrial point sources, urban runoff, landfills, and junkyards are potential sources for heavy metals and other harmful elements that can cause impairment” [51]. Other sources include combustion of fossil fuels, phosphate fertilizers, metallo-pesticides, and road salts [52,68]. All of these sources are currently or have historically been present within the UL watershed. The Geneva Steel plant operated from 1944 to 2002 on the northeastern shore of UL. This plant produced steel using “coal-derived coke,” with effluent drains near the lake that served as a substantial source of metals to UL [39,69,70]. Anthropogenic nutrient sources include seven wastewater treatment plants (WWTP) that discharge into the lake [71] while the southern end of UL is surrounded by agricultural land, and the western side has active gravel mines. The population in the last 40 years has nearly tripled, increasing from ~220,000 in 1980 to ~640,000 in 2020 [72].
In addition to the potentially toxic DE, ICP-OES measures several other elements that have important functions or impacts on aquatic ecosystems, including barium (Ba), calcium (Ca), potassium (K), sodium (Na), sulfur (S), B, silicon (Si) and P.
B and S are naturally present in aquatic environments and serve as essential nutrients. However, human activities can lead to elevated concentrations, potentially reaching toxic levels [73,74,75]. Toxic S concentrations are typically rare in surface waters unless there is a direct source of pollution. B is also influenced by human activities, and the range between toxic deficit and excess B concentrations is relatively small compared to other nutrients [76].
Ba occurs naturally and is also released by industrial processes primarily in the form of airborne particles that can eventually settle in nearby surface waters. UL is particularly susceptible to capturing atmospherically deposited dust due to its location and large surface area [16,17,18,20,21]. Ba usually exists in a precipitated form in aqueous systems, with alkaline environments, such as UL, further limiting its solubility [77].
K and P are essential nutrients for aquatic primary production. Since plants require less K than P, K is not usually a limiting nutrient. Neither element becomes toxic at the concentrations typically found in surface waters. Although high concentrations of P can lead to eutrophication, which negatively impacts water quality. Natural P and K [78] sources include weathering of geologic formations. In the UL watershed, the Delle Phosphatic and Meade Peak geologic formations contribute large amounts of P to the lake [1,19,79,80].
Na is a key component of salinity and can severely degrade freshwater systems if present in high concentrations. It enters surface waters through natural weathering, but also from road salts [81].
The impacts of Se are not well understood in freshwater systems due to the complexity of its geochemical interactions and cycling. However, it is toxic at very low concentrations and can degrade aquatic systems when it enters surface waters through anthropogenic activity [82]. While Se is necessary for aquatic biota, there is a very narrow concentration window in which Se turns from beneficial to toxic [83].
These discussions on the origins and impacts of DE on the UL ecosystem are not comprehensive. We included this review to demonstrate the potential impacts and functions of these DE in the UL ecosystem and illustrate the importance of understanding their ambient concentrations and behaviors.

1.3. Regulated DE Water Quality Standards Applicable to UL

We analyzed 25 elements detectable by ICP-OES, 12 of which are regulated by water quality standards promulgated by the Division of Water Quality of the Utah Department of Environmental Quality in compliance with the Clean Water Act [84,85,86]. To contextualize our discussion of water column concentrations, we outline the relevant standards.
The publication “Standards of Quality for Waters of the State” [84,85,86] categorizes waterbodies according to their use and significance and prescribes different standards for each category. UL is classified as:
2A:
“Protected for frequent primary contact recreation where there is a high likelihood of ingestion of water or a high degree of bodily contact with the water” (swimming, kayaking, diving, water skiing, etc.);
2B:
“Protected for infrequent primary contact recreation. Also protected for secondary contact recreation where there is a low likelihood of ingestion of water or a low degree of bodily contact with water” (e.g. boating, wading, etc.) [86];
3B:
“Protected for warm-water species of game fish and other warm water aquatic life, including the necessary aquatic organisms in their food chain;”
3D:
“Protected for waterfowl, shore birds, and other water-oriented wildlife not included in Classes 3A, 3B, or 3C, including the necessary aquatic organisms in their food chain;”
4:
“Protected for agricultural uses including irrigation of crops and stock watering”[84,85,86].
For the 3B and 3D standards, the regulations are for dissolved elements in units of µg/L. For class 4 standards, regulations are for dissolved elements in units of mg/L. We converted the 3B and 3D standards to units of mg/L to match our data units. Table 1 lists the most stringent acute (1-hr average) and chronic (4-day average) standards for the 12 regulated DE analytes [84].
The standards for Al, Cd, Cr, Cu, Ni, Pb, and Zn depend on water hardness. Typically, the adjustment factor for these “hardness dependencies” would be determined using the hardness level detected in each sample; however, our samples were not tested for hardness, so we used a representative average hardness level for the lake. Using data from the Utah Ambient Water Quality Management System (AWQMS) collected from 1978 to 2015, we found the mean hardness of UL water is 197.4 mg/L as CaCO3 with a range from 123 to 291 mg/L. We used the mean value to calculate a refence concentration for elements with hardness dependencies for discussions. For Cd, Cr, Pb, and Zn, the conversion is a natural log equation based on the hardness of the water with a specified conversion factor [84]. Cr standards are for hexavalent chromium, a toxic ion. We measured elemental Cr, which provides an upper bound, but does not measure hexavalent Cr. Again, we want to stress that our analytical methods do not follow required regulatory methods. Instead, we determined elemental concentrations using ICP-OES which has sensitivity in the few parts-per-billion range, depending on the element, and uses either filtration for dissolved concentrations or digestion for total concentration.
The standards for Al depend on pH and hardness. Since the pH of UL water is nearly always greater than 7.0 and the hardness is greater than 50 mg/L as CaCO3, we use the acute Al criterion of 750 µg/L (expressed as total recoverable Al) for our discussion. The Utah Department of Water Quality (UDWQ) is currently in the process of adopting the EPA’s recommended Al criteria, which depends on dissolved organic carbon (DOC), hardness, and pH. We were told in conversations with representatives of UDWQ that the current value of 750 µg/L is acceptable as a reference point [87]. Al and P are the only regulated elements with a standard for total recoverable concentration—all other elements require analysis of dissolved concentrations. As discussed below, we performed a complete digestion of unfiltered water samples for our total concentration measurements.
Total elemental Al concentrations can be misleading, as clay minerals, which make up a significant fraction of suspended solids, have high Al concentrations, and are captured by a total digestion approach. However, the Al found in clay minerals is not bioavailable or reactive and is of less concern than dissolved Al. For this study we analyzed filtered and unfiltered samples to show the impact of suspended solids on elemental concentrations. We performed a complete digestion of the unfiltered samples, which includes the suspended clay minerals in the sample. The filtered samples only measured dissolved elements. For Al concentrations, we did not attempt to follow UDWQ analysis methods but assumed that “total recoverable Al” required unfiltered lake water to be analyzed after aggressive acid digestion, which would include the nonreactive Al bound up in clay particles. The regulatory methods under consideration use a less aggressive digestion.

2. Materials and Methods

2.1. Field Study
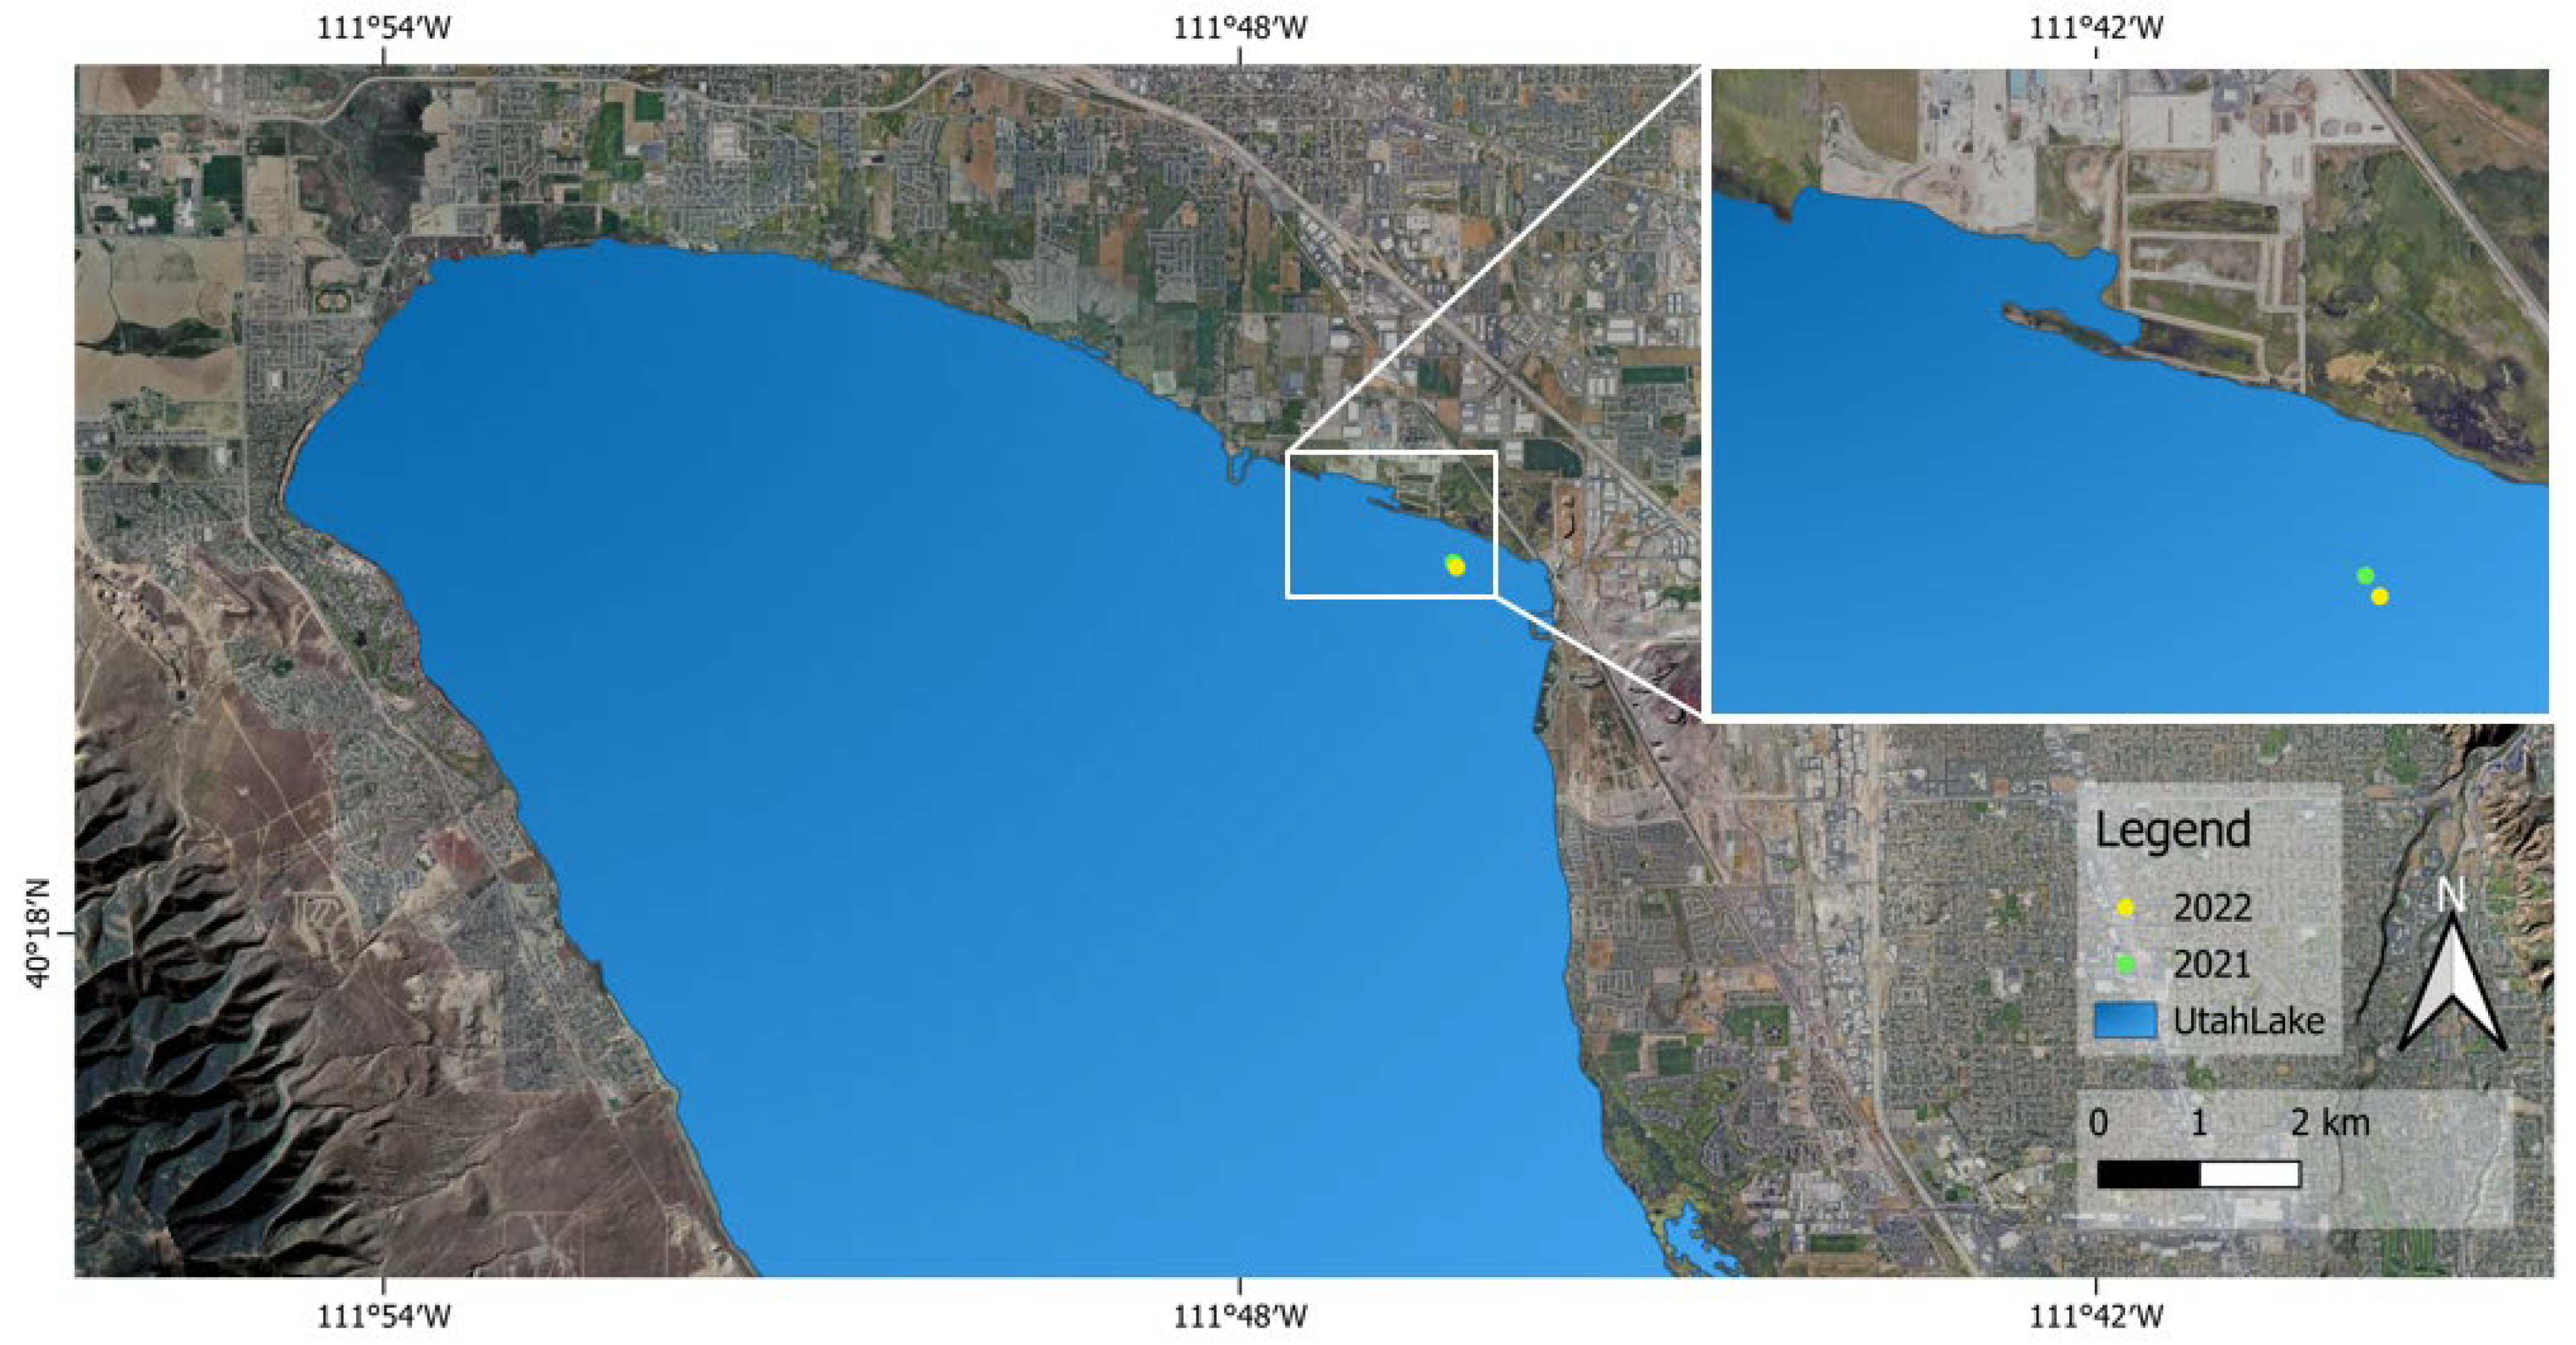
We collected UL water samples approximately once per week over two sampling seasons: June–October 2021 and May-August 2022 [88,89]. We collected lake background samples roughly 400 m offshore.
At the beginning of the 2021 and 2022 sampling seasons, the depth of the water column was 2.5 m at the sample location, which is a typical depth for the lake at that distance from shore. By the end of the season, the depth was 1.5 m as the lake levels decreased due to evaporation and outflow through the Jordan River. The seasonal pattern of drawdown and refill is also typical for the lake. We analyzed the samples using ICP-OES analysis on a Thermo-Scientific iCAP7400 for both dissolved (filtered on a 0.45 µm filter) and total (unfiltered and digested) samples.
This is a unique and comprehensive longitudinal dataset for UL, with near-weekly samples collected on 28 days over two summer sampling campaigns. While spatially limited to the northeastern corner of the lake, we assume these data characterize general conditions in UL, though an area likely to be impacted by human activities.
The purpose of our study is to begin to characterize and understand the presence and behaviors of ICP-OES regulated DE in UL. The sample locations are near the largest WWTP outfall and the former site of the Geneva Steel Plant, and consequently represent an area more likely to have higher DE concentrations than other areas of the lake.
Figure 1. Study locations: 0.4 km (0.25 mi) offshore, northwest of Lindon marina.
Preprints 111049 g001

2.2. Sample Collection

Over the two sampling seasons, weather permitting, we collected water samples approximately weekly from June to October in 2021 (n = 15) and from May to August in 2022 (n = 13). We followed sampling procedures from the “Standard Operating Procedure for Lake Water Sampling and Data Collection” from the UDEQ [37]. We used 1-L dip samplers that were triple rinsed in lake water at the sample location prior to collecting the sample. After the triple rinse, we inverted the dip sampler and submerged it to approximately elbow depth. We then inverted the sample cup to fill it with water. This reduced potential contamination from surface particles. We used the collected water to triple rinse a new, pre-labeled, opaque 250-mL plastic sample bottle, then filled the bottles, leaving no headspace, and immediately placed the sample on ice in a cooler. Samples were either analyzed or frozen within a few hours of collection.
Coincident with water samples, we used YSI ProDSS water quality sondes (probes) to collect data on chlorophyll-a and phycocyanin. For these measurements we fully submerged the probes and logged the sensor data at a depth of ~30 cm.

2.3. Analysis Methods

2.3.1. Laboratory Analysis

We split each water sample for ICP-OES analysis for dissolved (particles < 0.45 µm) and total concentrations. For dissolved concentrations, we filtered each sample using a new 0.45 µm membrane filter. For total concentrations, we performed microwave-assisted acid digestion using EPA 3015A method. Table 2 summarizes the methods used for the laboratory analysis of the water samples.
Table 3 lists the minimum detection limits (MDL) for our ICP-OES method. MDLs vary by element but are approximately in the range of a few µg/L or part-per-billion (ppb) level. Se has the highest MDL of 7.36 ppb while Ca has the lowest MDL at 0.02 ppb or 20.0 ppt. We selected ICP-OES for sample analysis because it is highly sensitive and allows us to easily analyze multiple trace elements in the UL water column.
Additionally, water samples were tested for volatile suspended solids and total suspended solids. These results were correlated with ICP-OES measurements to further contextualize if total DE concentrations that are associated with suspended sediments.

2.3.2. Filtration

Dissolved particles are often defined as smaller than 0.45 µm, while suspended particles are larger than 0.45 µm [51,90]. To separate dissolved from suspended samples, we used Nyaflo® Membrane Disc Filters with 0.45 µm pores. For this study, we used the terms dissolved and filtered interchangeably, and the terms total and unfiltered interchangeably. Total or unfiltered concentrations includes both the suspended and dissolved fractions.
We found through our quality assurance analyses that trace elements on the filters contaminated our samples for As, B, K, Mg, Na, S, and Zn. We used the same brand of 0.45 µm filters on all samples though due to the number of samples we analyzed using the same filter batch was not possible. Overall, we found that the level of contamination in the filtered samples was small. In this study, we assumed that all samples were equally impacted by filter contaminants, which allowed us to make comparisons and observe trends based on the sample results, which would still be accurate, even if specific concentrations for these elements amounts are not.

2.4. Data Cleaning

Prior to analysis, we replaced measurements with concentrations below the MDL (Table 3) with a value of half of the MDL to preserve the detection of the element for analysis. The final dataset contained 28 samples collected over the 2021 and 2022 sampling periods (June through October and May through August, respectively) for which we analyzed 50 DE analytes, comprising 25 filtered and 25 unfiltered elements. The 2021 sampling season has a sampling gap from late July through late August due to equipment challenges but resumed in September and October. The 2022 sampling was more consistent during the sampling season but shorter, ending in August.

3. Results and Discussion: Regulation Levels

3.1. MDL Analysis

We analyzed how often a detection for an element was below the MDL. This analysis showed how often a sample contained the element at or below detection limits. Figure 2 shows the percentage of DE measurements that were above the MDL for both unfiltered and filtered samples by element. If every sample for both the unfiltered and filtered samples was above the MDL, we excluded that DE from the graph for simplification. Forty percent of the Des — Ba, Ca, K, Mg, Mo, Na, S, Si, Sr, and V — had all measurements above the MDL and are not included in the graph.
Co and Se concentrations fluctuate around the MDL in UL with less than 20% of filtered or unfiltered samples Co and Se concentrations above the MDL, and the remainder had concentrations only slightly above the MDL. These elements are present in UL, but in trace amounts.
Ti, Cr, Ni, and Pb were above MDLs in less than 20% of filtered samples but were over MDLs in unfiltered samples. These elements are mainly associated with suspended solids, with very low dissolved concentrations. Ti and Cr were above MDLs in 100% of the unfiltered samples, but only 20% of the filtered samples. From this we can infer that these metals are mainly contained in the suspended solids and sediments of UL and are not present as dissolved particles.
Unfiltered Ni and Pb were above MDLs about 75% and 45%, respectively. These elements similarly show that they are prevalent within the water column more in the unfiltered than the filtered state.
One metal, Zn, had more filtered samples over the MDL than unfiltered samples. This was caused by contamination from the filters which consequently only affected the dissolved samples. We assume that although the dissolved Zn values are not accurate, the changes and trends in concentration are still relatively correct. As Zn is regulated and a vital micronutrient, we included the filtered results in this study. The unfiltered results are not contaminated because they did not come into contact with the filter and are therefore representative of our samples.

3.2. Specific Element Selection

We highlight eight ICP-OES elements—Cu, Zn, Ni, Al, Pb, P, Ba, and As—that were close to or over the most stringent applicable standards or exhibited interesting characteristics. The other five regulated DEs—B, Cd, Cr, Fe, and Se—are well below regulatory limits and we do not discuss or present them in this study.
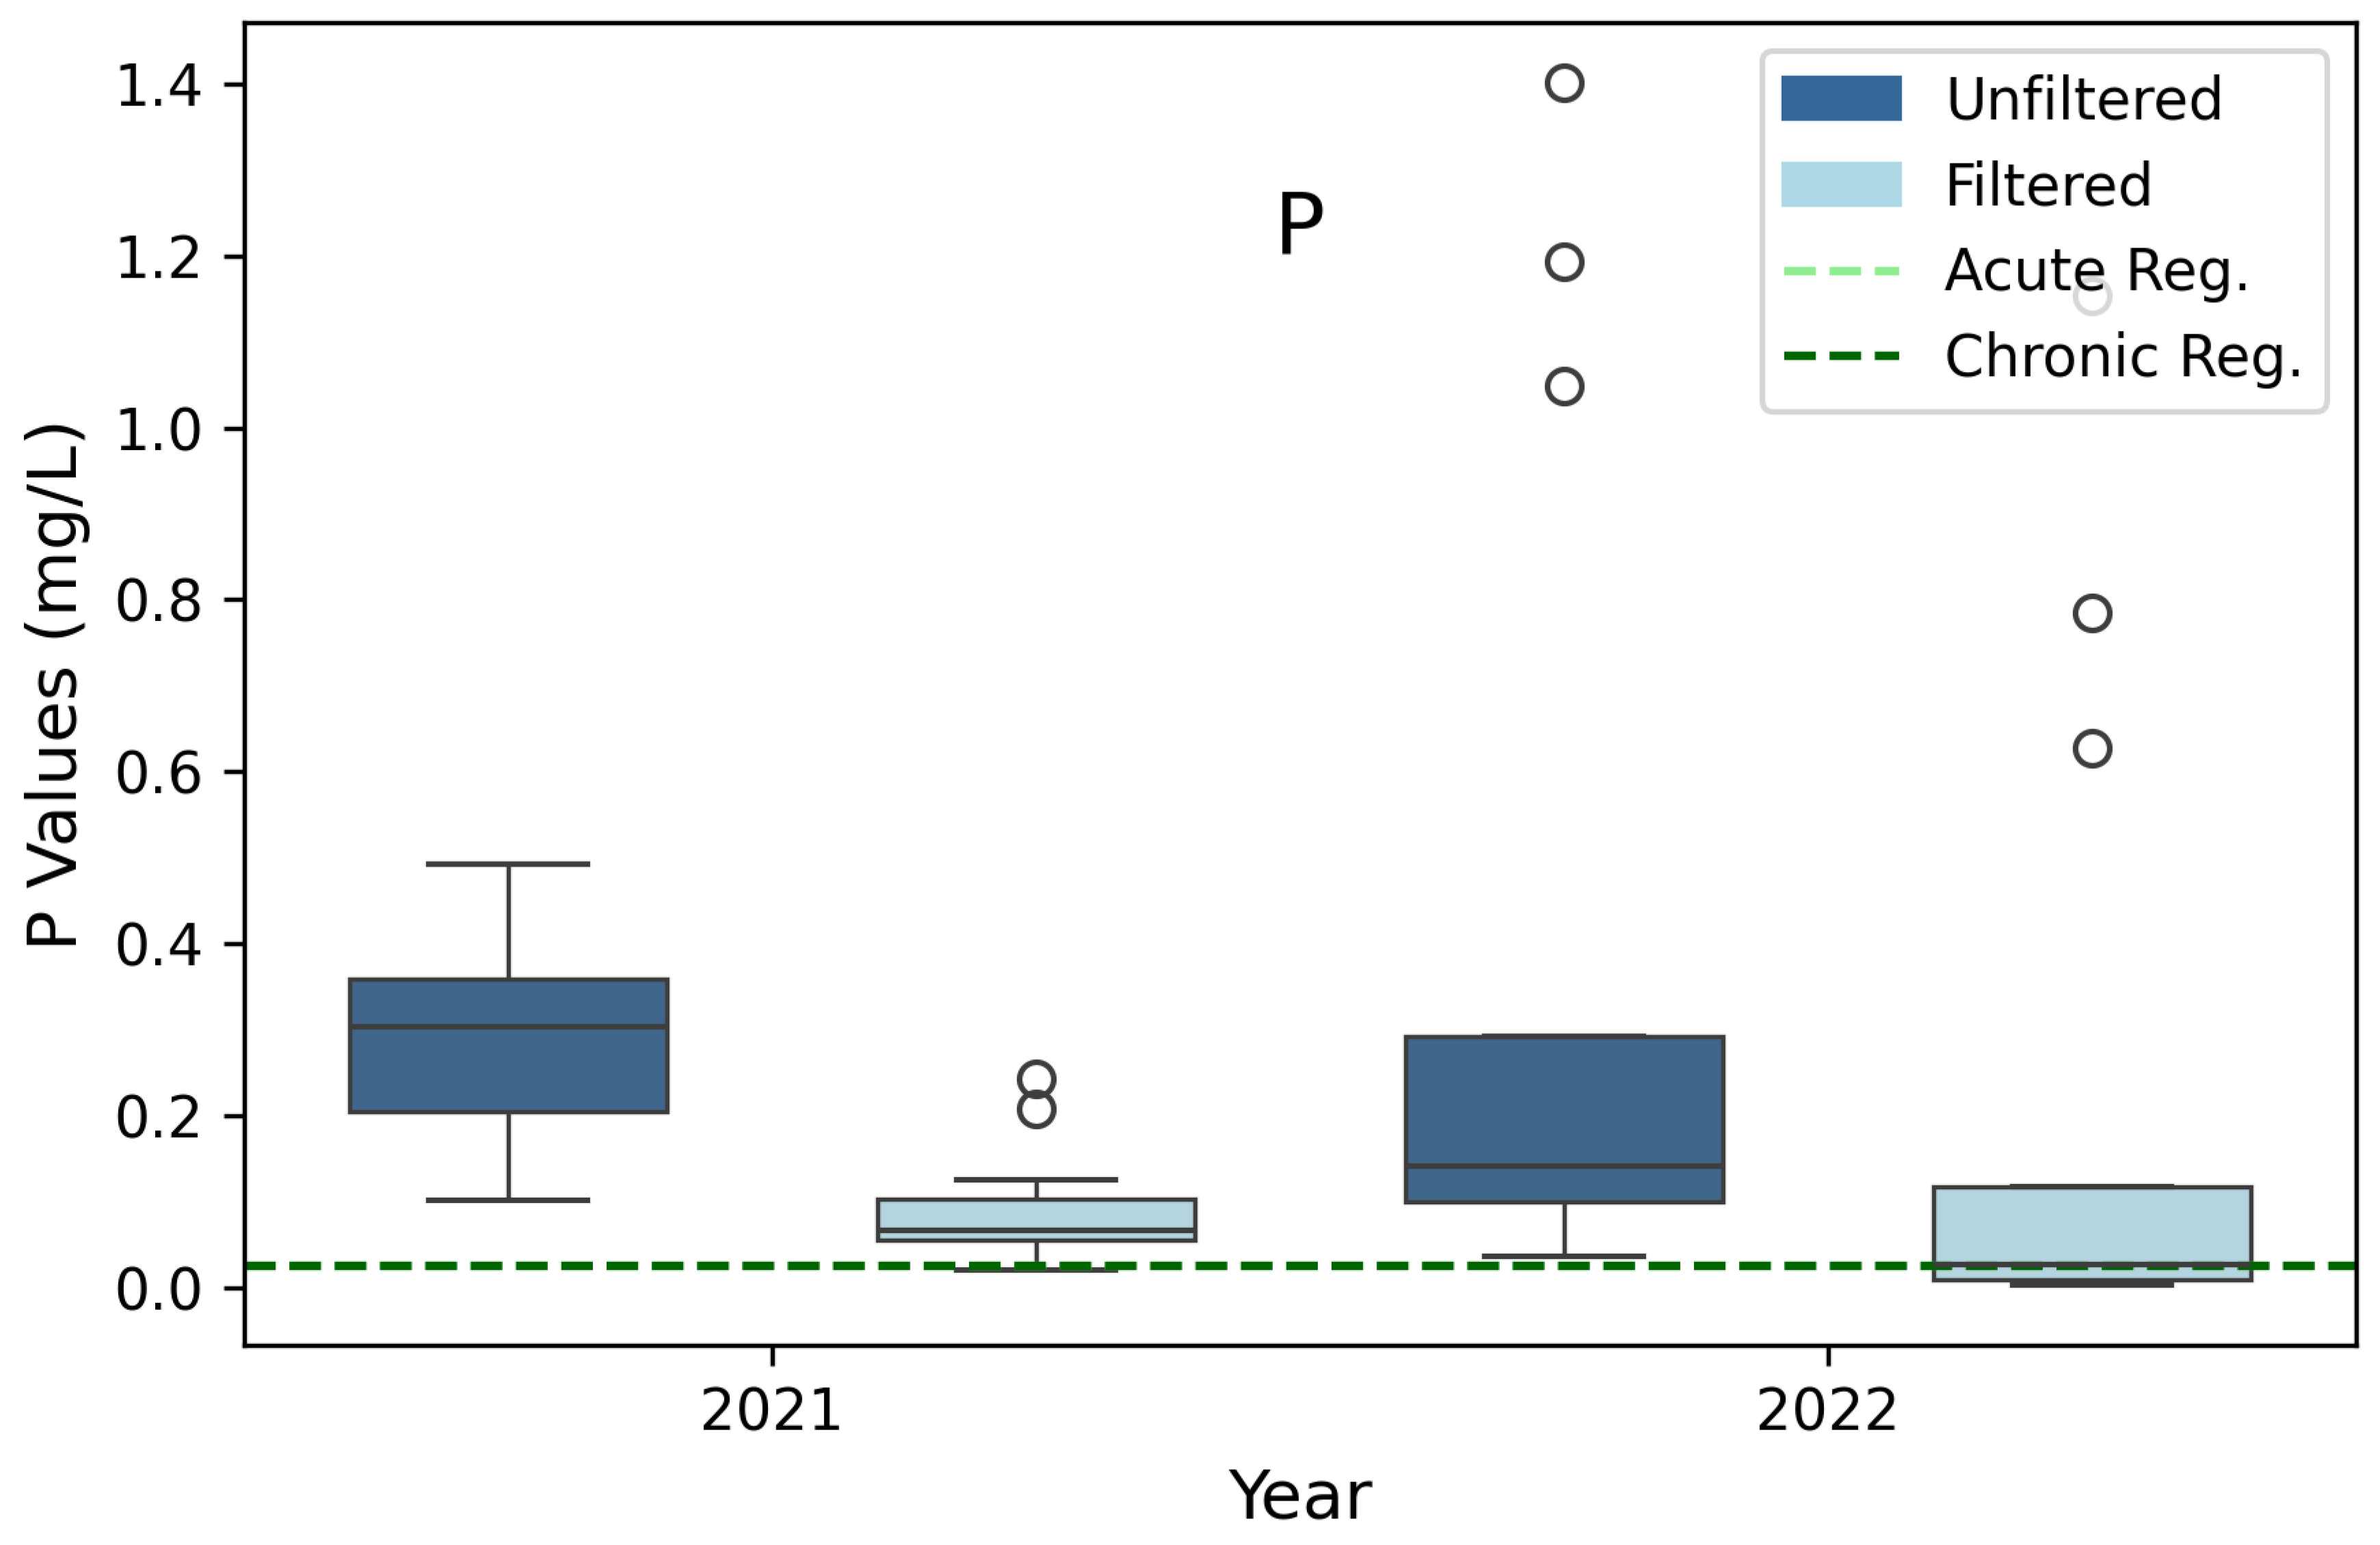
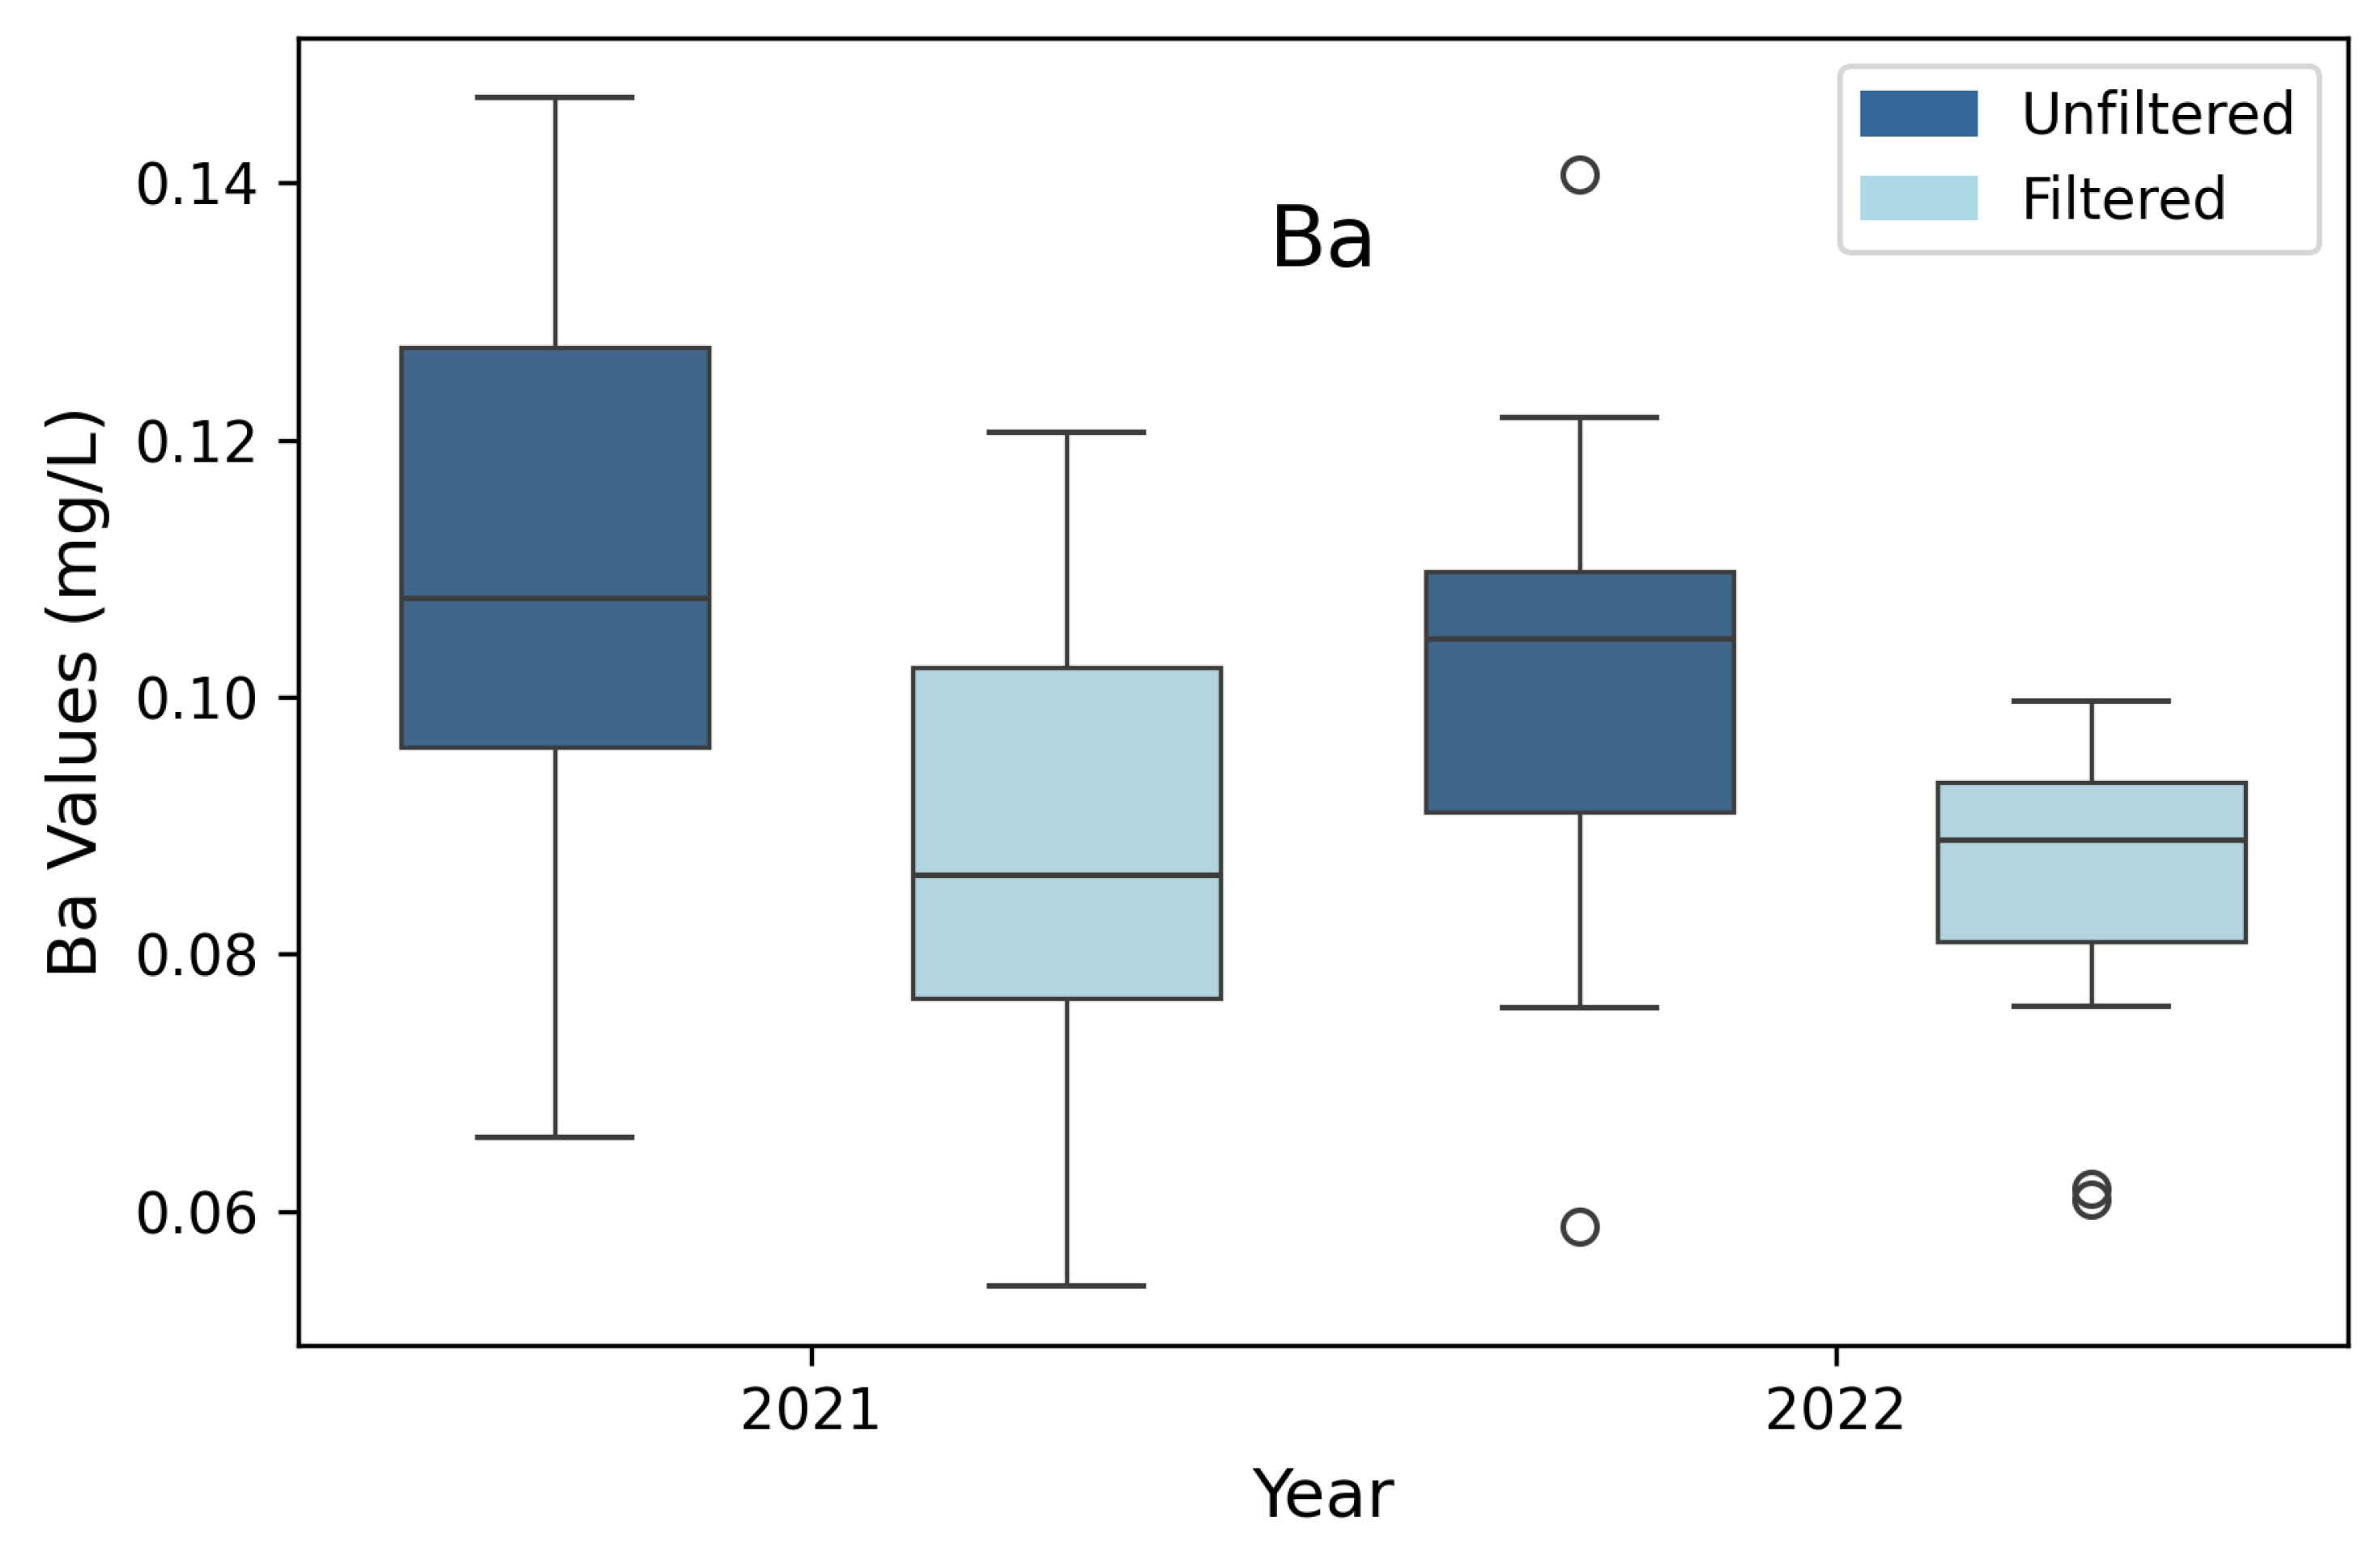
We analyzed the distributions as box-and-whisker plots grouped by year (2021, n=15; 2022, n=13) and phase (filtered and unfiltered). In these plots the line in the middle of the box is the median concentration, the box ends are the 25th and 75th percentiles, and the whiskers represent 1.5 times the interquartile range (1.5xIQR). Outliers, or values outside 1.5xIQR, are shown as dots.
We included lines on each boxplot indicating the most stringent acute (1-hour average) and chronic (4-day average) standards (Table 1). All regulations are for dissolved (filtered) concentrations except Al and P, which are based on the total (unfiltered) concentration.
We did not follow State-approved methods of analysis. Consequently, our findings cannot be used to determine or indicate the impairment status of UL; we include the regulatory criteria only in order to provide context.
In the following figures, the dark blue boxplots represent unfiltered data, and the light blue boxplots represent filtered data. The dark green dotted horizontal line represents the most stringent chronic standard and the light green line represents the most stringent acute standard. In a few cases where the acute and chronic regulations are the same, only the dark green line is visible.

3.3. Copper (Cu)

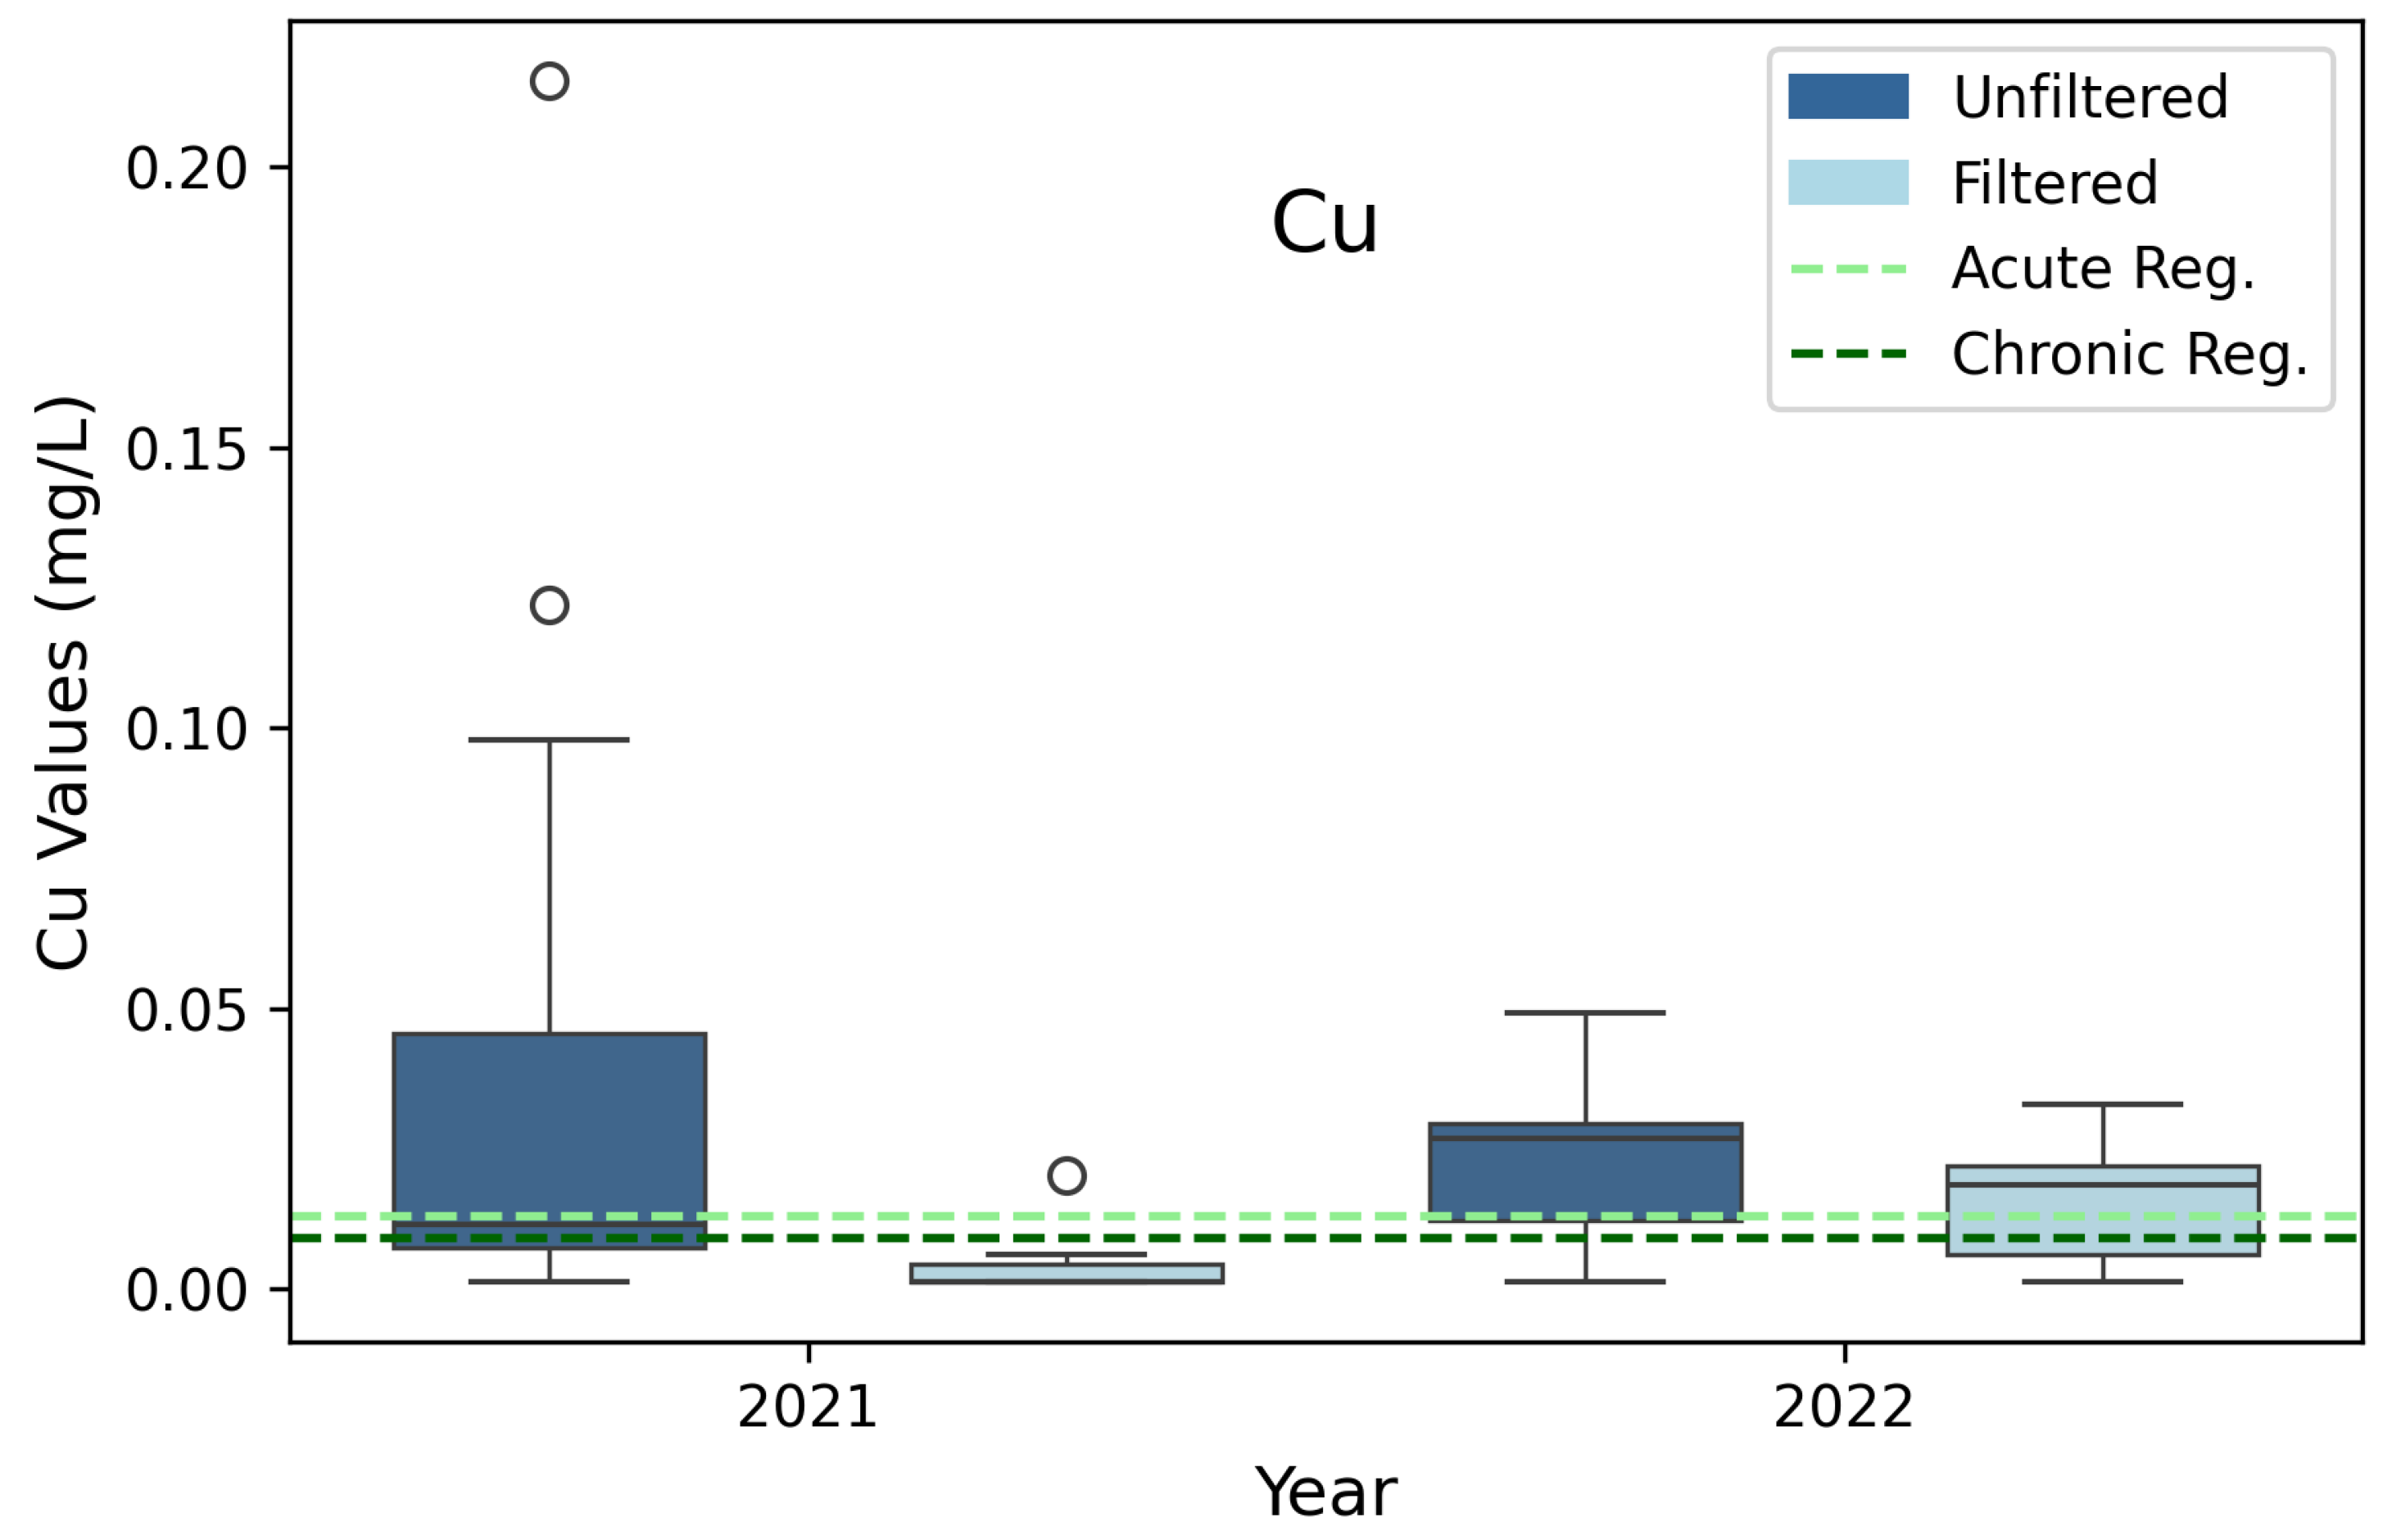
Cu (Figure 3) has harmful effects from both excess and deficient concentrations. It is a micronutrient vital for a healthy ecosystem. For the unfiltered Cu concentrations, the median concentration for both years is above or close to the regulatory criterion, with concentrations more varied in 2021 (n = 15 in 2021, and n = 13 in 2022). Median filtered Cu concentrations are below the criteria in 2021, but above in 2022.
For both the total and dissolved measurements, over 70% of the water samples contained concentrations of Cu over the MDL. Only dissolved Cu is regulated. All the filtered Cu samples in the 2021 sampling season, except one, were below both the acute and chronic regulatory criteria (Figure 3). However, in the 2022 sampling season (Figure 3), 7 of the 13 samples were above 0.013 mg/L, which is the acute standard. The highest concentration was 0.0329 mg/L. The state regulations for Cu are only applicable to the filtered samples, but for context, unfiltered Cu was above regulatory levels during both sampling seasons. For reference, the UL sediments on average contain 19.5 mg/kg of Cu. We found that unfiltered Cu concentrations are strongly correlated with unfiltered Ni and Fe, with Pearson correlation coefficients (PCC) of 0.901 and 0.752 respectively. This might indicate mineral forms in the suspended solids.
The elevated levels of Cu may also be related to the use of copper sulfate-based algaecide which the State began using to treat intense algal blooms in marinas in 2020 [91,92]. Our study location is located less than 1 km (0.6 miles) from Lindon Marina and 2 km (1.25 miles) from American Fork Marina. The Utah Department of Environmental Quality (UDEQ) released an interim report on UL marina HAB treatments in which they found that “copper concentration increased considerably” in the days following treatment but returned to below toxic levels within a week [91]. The higher concentrations of dissolved Cu in 2022 relative to 2021 may also be due to the lower lake levels during the 2022 sampling season. On average, the lake had about 49 million cubic meters (39,700 ac-ft) less volume in 2022 than in 2021, which may have increased the water column concentrations of several elements [93]. Although the use of algaecide and low lake levels are one potential cause of the elevated levels of Cu observed in both years, they may not be the actual drivers.
Additional research is needed to identify and characterize the source and behavior of these metals. This is important as our results show that levels of dissolved Cu in the lake could be approaching harmful concentrations.

3.4. Zinc (Zn)

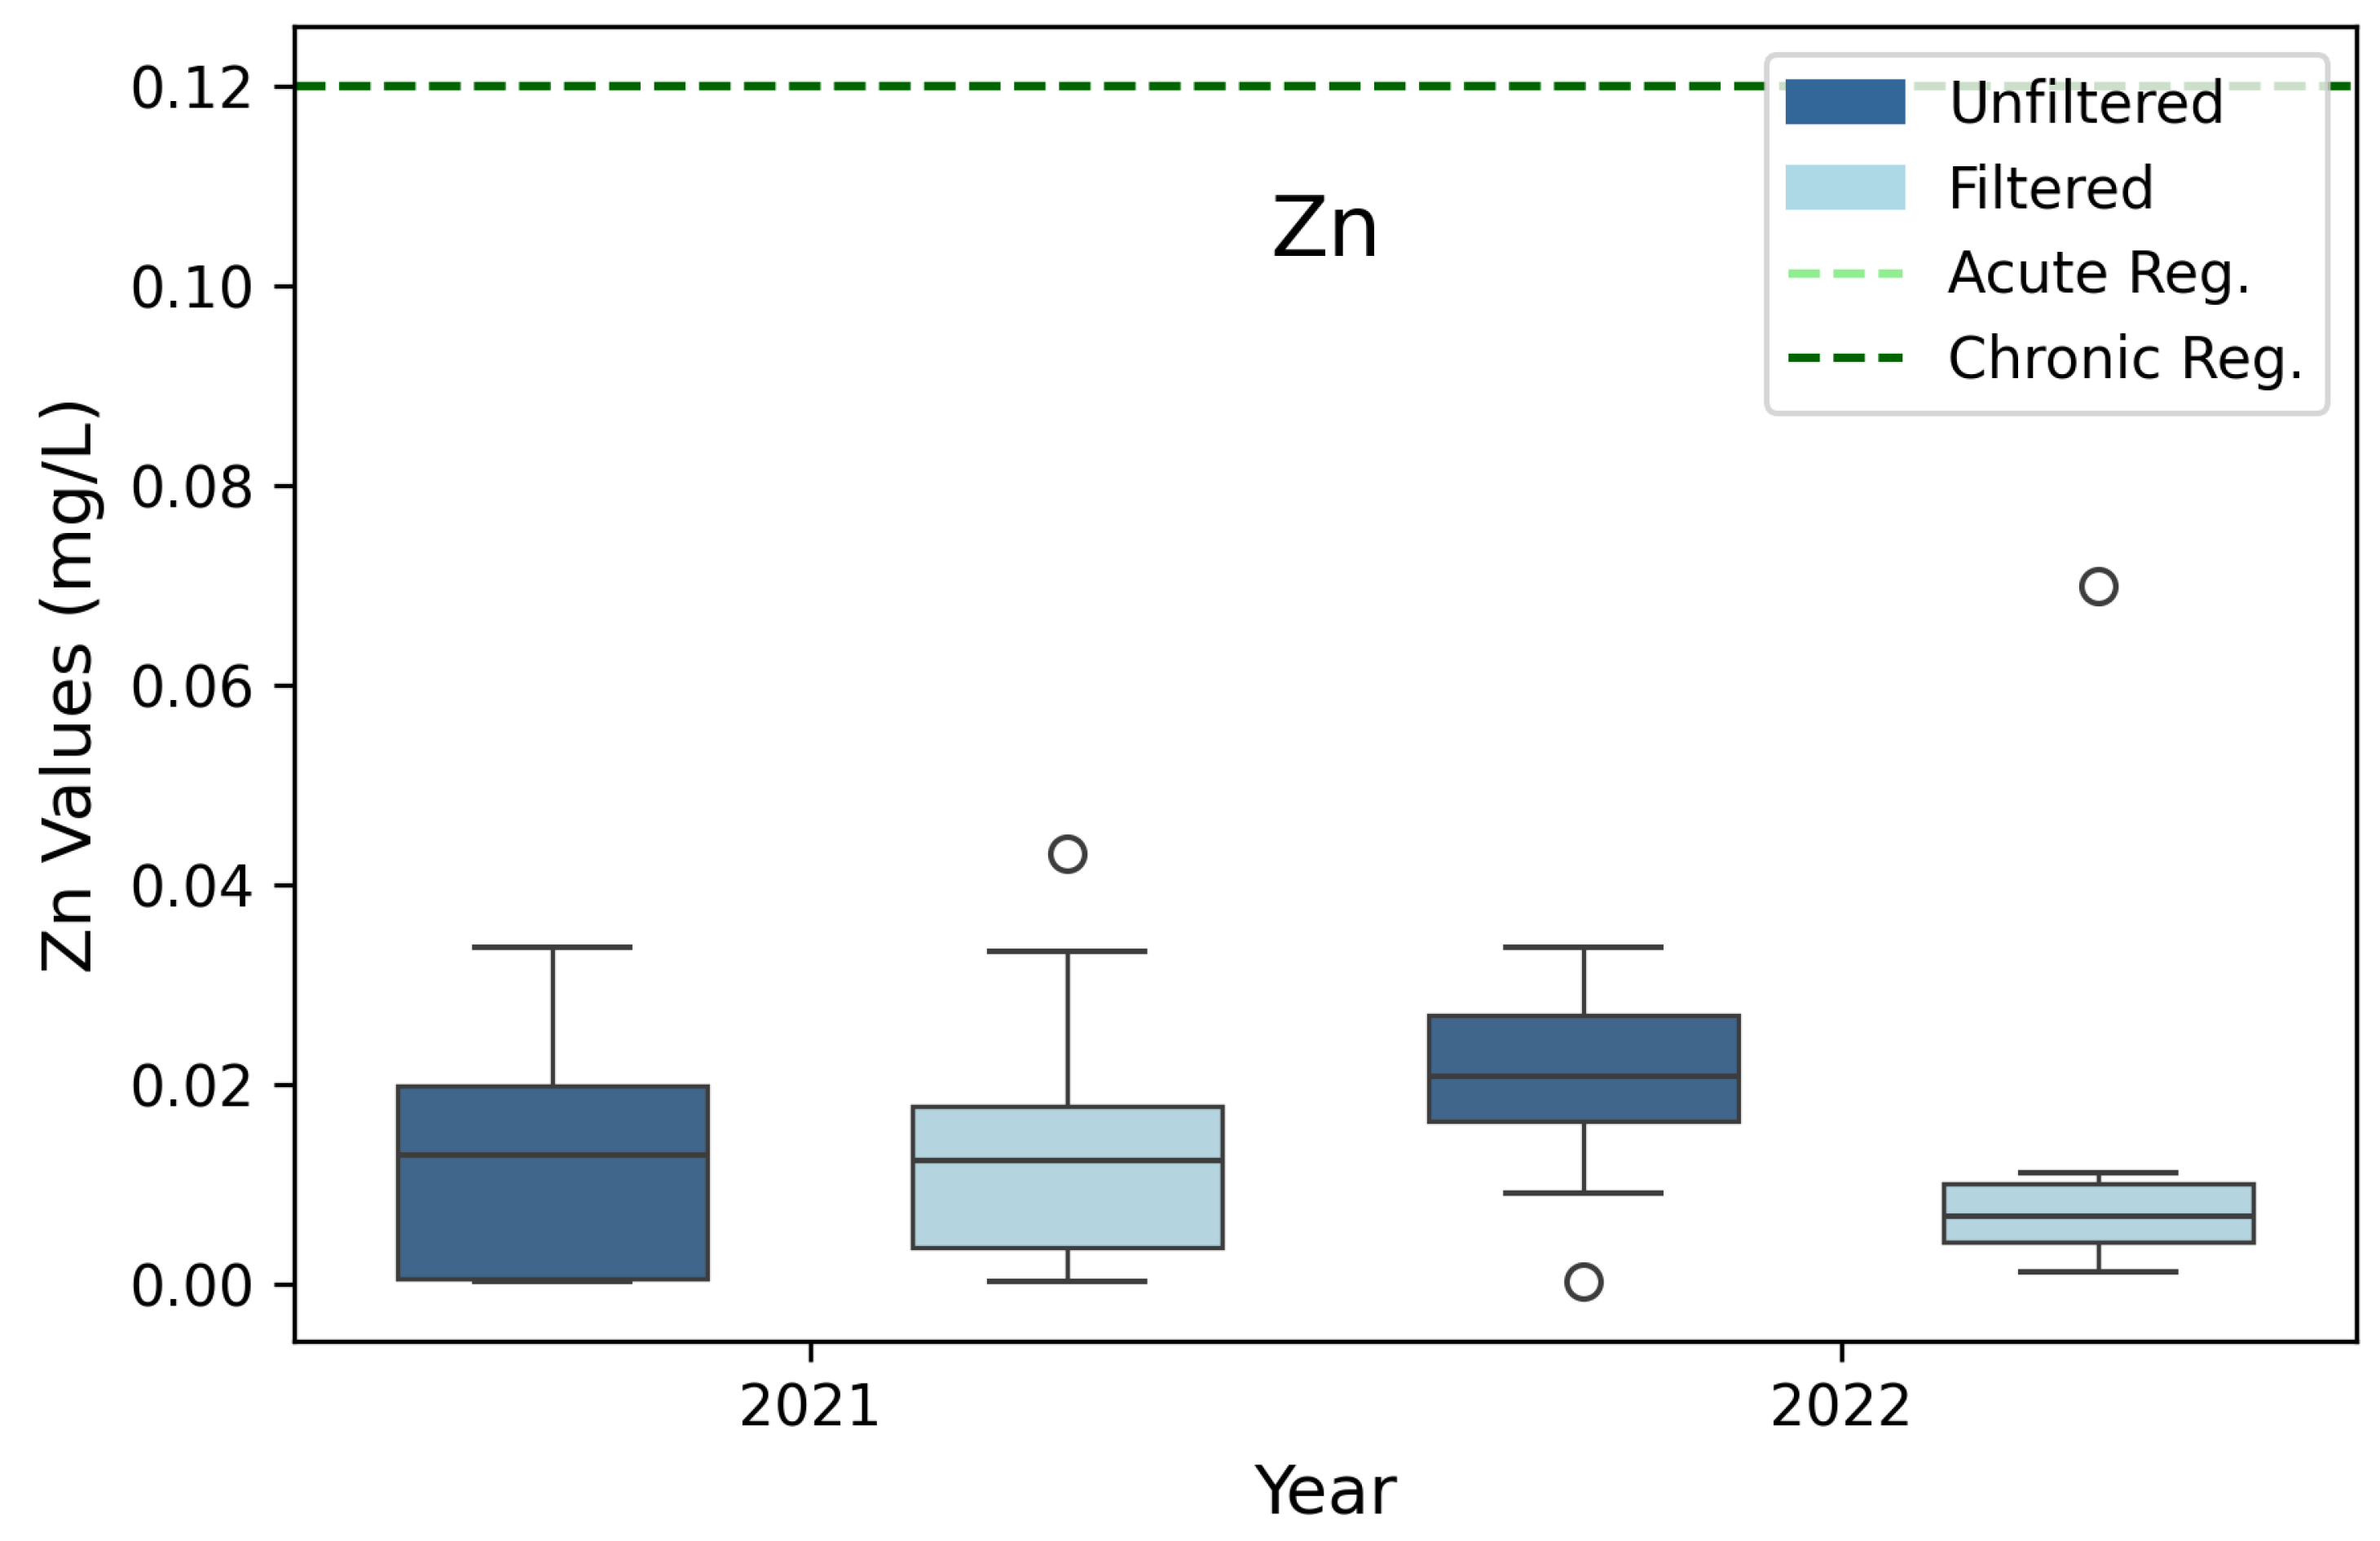
Zn (Figure 4) has both toxic effects from both excess and deficient concentrations. It is a micronutrient vital for a healthy ecosystem. Although filter contamination slightly increased concentrations of our filtered Zn samples, both filtered and unfiltered concentrations of Zn were well below the most stringent regulatory standard. More than 80% of Zn samples, both the filtered and unfiltered, measured above the MDL (Figure 2). In 2022, the difference between the total and the dissolved Zn was larger than in 2021, but they remained low. Filtered Zn concentrations, which are lower than shown because of contamination from the filter, are low enough that it is more likely to be a limiting or colimiting nutrient for algal growth in UL because of deficient concentrations than a toxin due to high concentrations. For reference, Zn concentrations average 145.5 mg/kg in our UL sediment samples.

3.5. Nickel (Ni)

Ni (Figure 5) has adverse effects from both excess and deficient concentrations. It is a micronutrient vital for a healthy ecosystem. Both total and dissolved Ni concentrations in 2021 and 2022 were well below acute regulations, and just below chronic state regulations. Most of the Ni in UL appears to be associated with suspended solids rather than being dissolved in the water column. This matches Figure 2, which showed ~70% of the unfiltered Ni measurements were over the MDL, compared to only ~20% of the dissolved measurements over the MDL. These low Ni concentrations suggest that, like Zn, Ni is more likely to be a limiting or colimiting micronutrient because of deficient concentrations than a toxin in UL. Unfiltered Ni is correlated with unfiltered Cu and Fe with PCCs of 0.901 and 0.735 respectively. This suggests a mineral phase in the suspended solids. For reference, our UL sediments samples average 11.5 mg/kg of Ni.

3.6. Aluminum (Al)

Al is a nonessential metal that is toxic at high concentrations [60,61,62,94]. State regulations state the Al concentrations are based on total recoverable Al, not dissolved. We assume that our unfiltered, digested samples represent total recoverable Al in UL water.
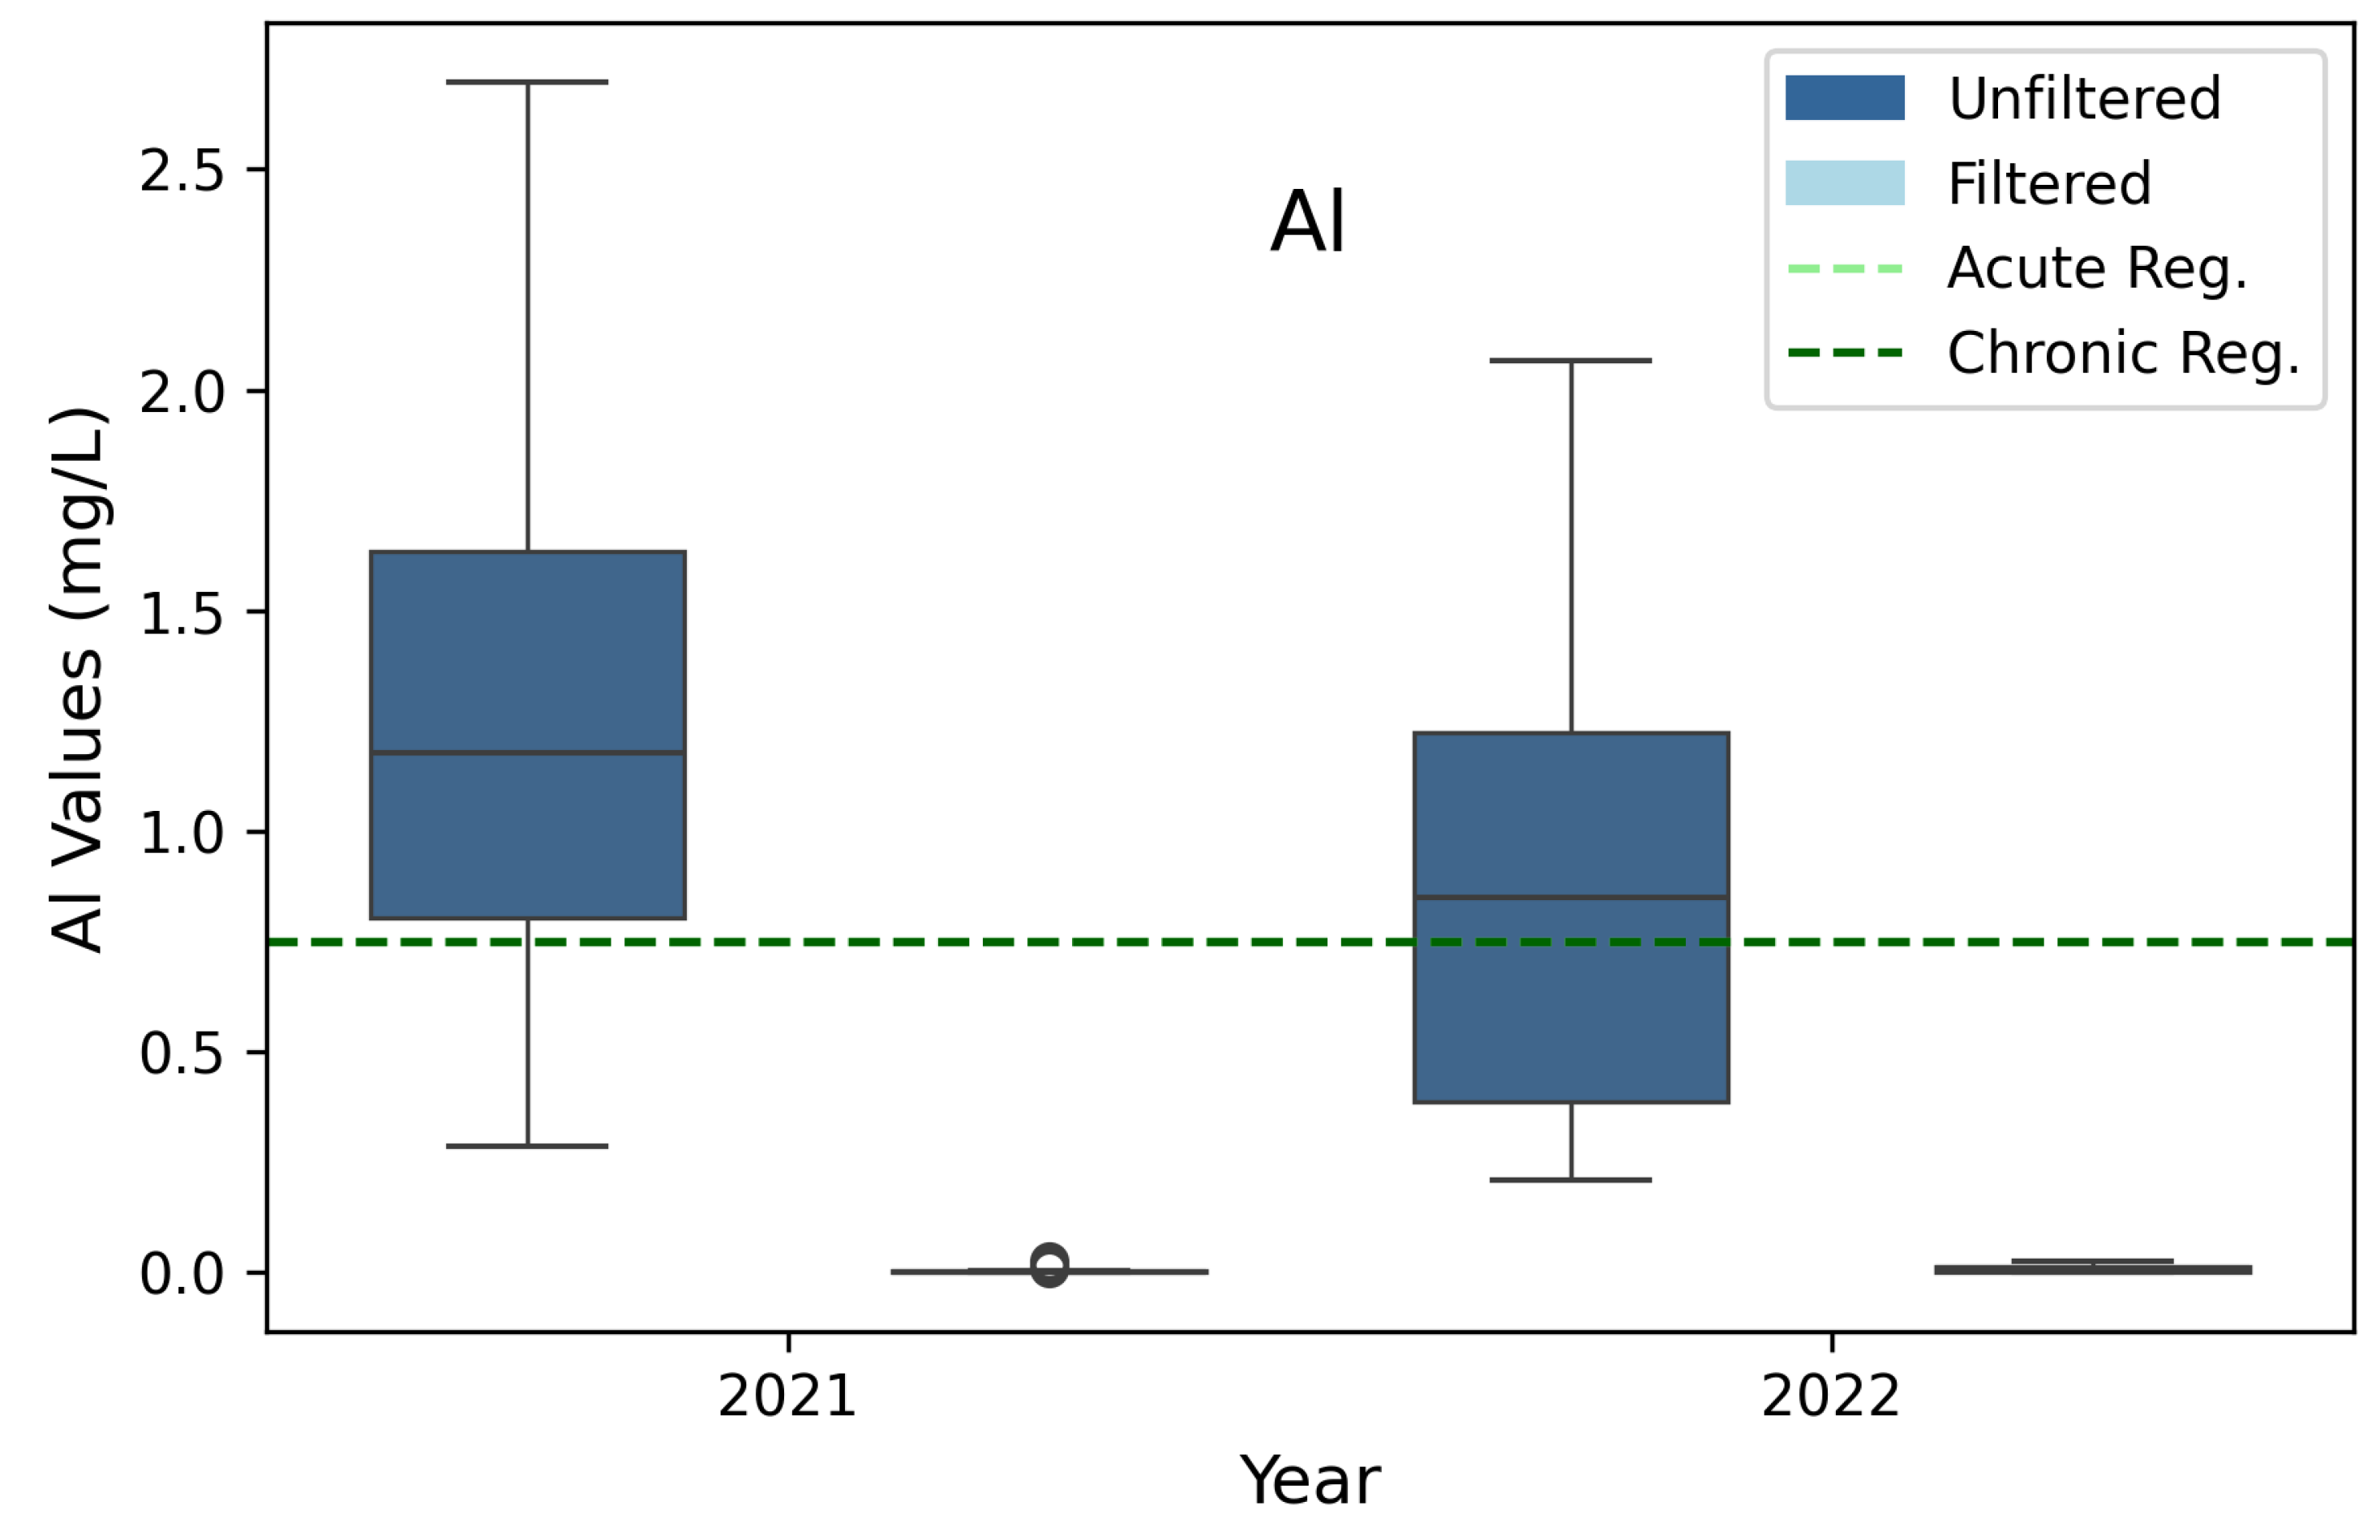
Unfiltered (total) Al median measurements are above both the acute and chronic criteria (Figure 6). Dissolved Al concentrations, however, are well below the criteria. Over 100% and 60% of the unfiltered and filtered Al measurements, respectively, were above the Al MDL (Figure 2).
The large difference between filtered and unfiltered concentrations indicates Al is associated with suspended solids in the UL water column. The unfiltered concentrations represent a total digestion of all suspended solids, including clay minerals. Al and Si ratios in the samples are consistent with Al and Mg clay minerals, providing evidence that high Al concentrations are related to suspended clays. We attribute the high total Al concentrations to suspended clay particles in the water column.
As noted earlier, we did not follow regulatory analysis methods. State water quality regulations require measurements of dissolved (filtered) concentrations of elements except for Al and P. For Al, the state regulations require “total recoverable” concentrations, which we took to mean unfiltered samples, but we did not use the State-approved method for Al analysis. Figure 6 shows that the unfiltered Al samples, when measured using full-digestion and ICP-OES, exceeds regulatory criteria in both the 2021 and 2022 seasons for both the acute and chronic regulations. The filtered (dissolved) samples, however, are well below the state regulations for both sampling periods. Our results show dissolved Al concentrations, the phase likely to be bioavailable, are well below levels of concern. While unfiltered concentrations are above levels of concern, they are likely caused by suspended clays.
For reference, the average concentration of Al in the sediment is 8,975.8 mg/kg or almost 0.9% by mass. This concentration of Al is an order of magnitude higher than the amount of Zn and two orders of magnitude greater than the concentrations of Cu and Ni in the sediments.
Unfiltered Al was strongly correlated with unfiltered Ti, Mn, volatile suspended solids, and total suspended solids with PCCs of 0.916, 0.750, 0.745, and 0.737 respectively.

3.7. Lead (Pb)

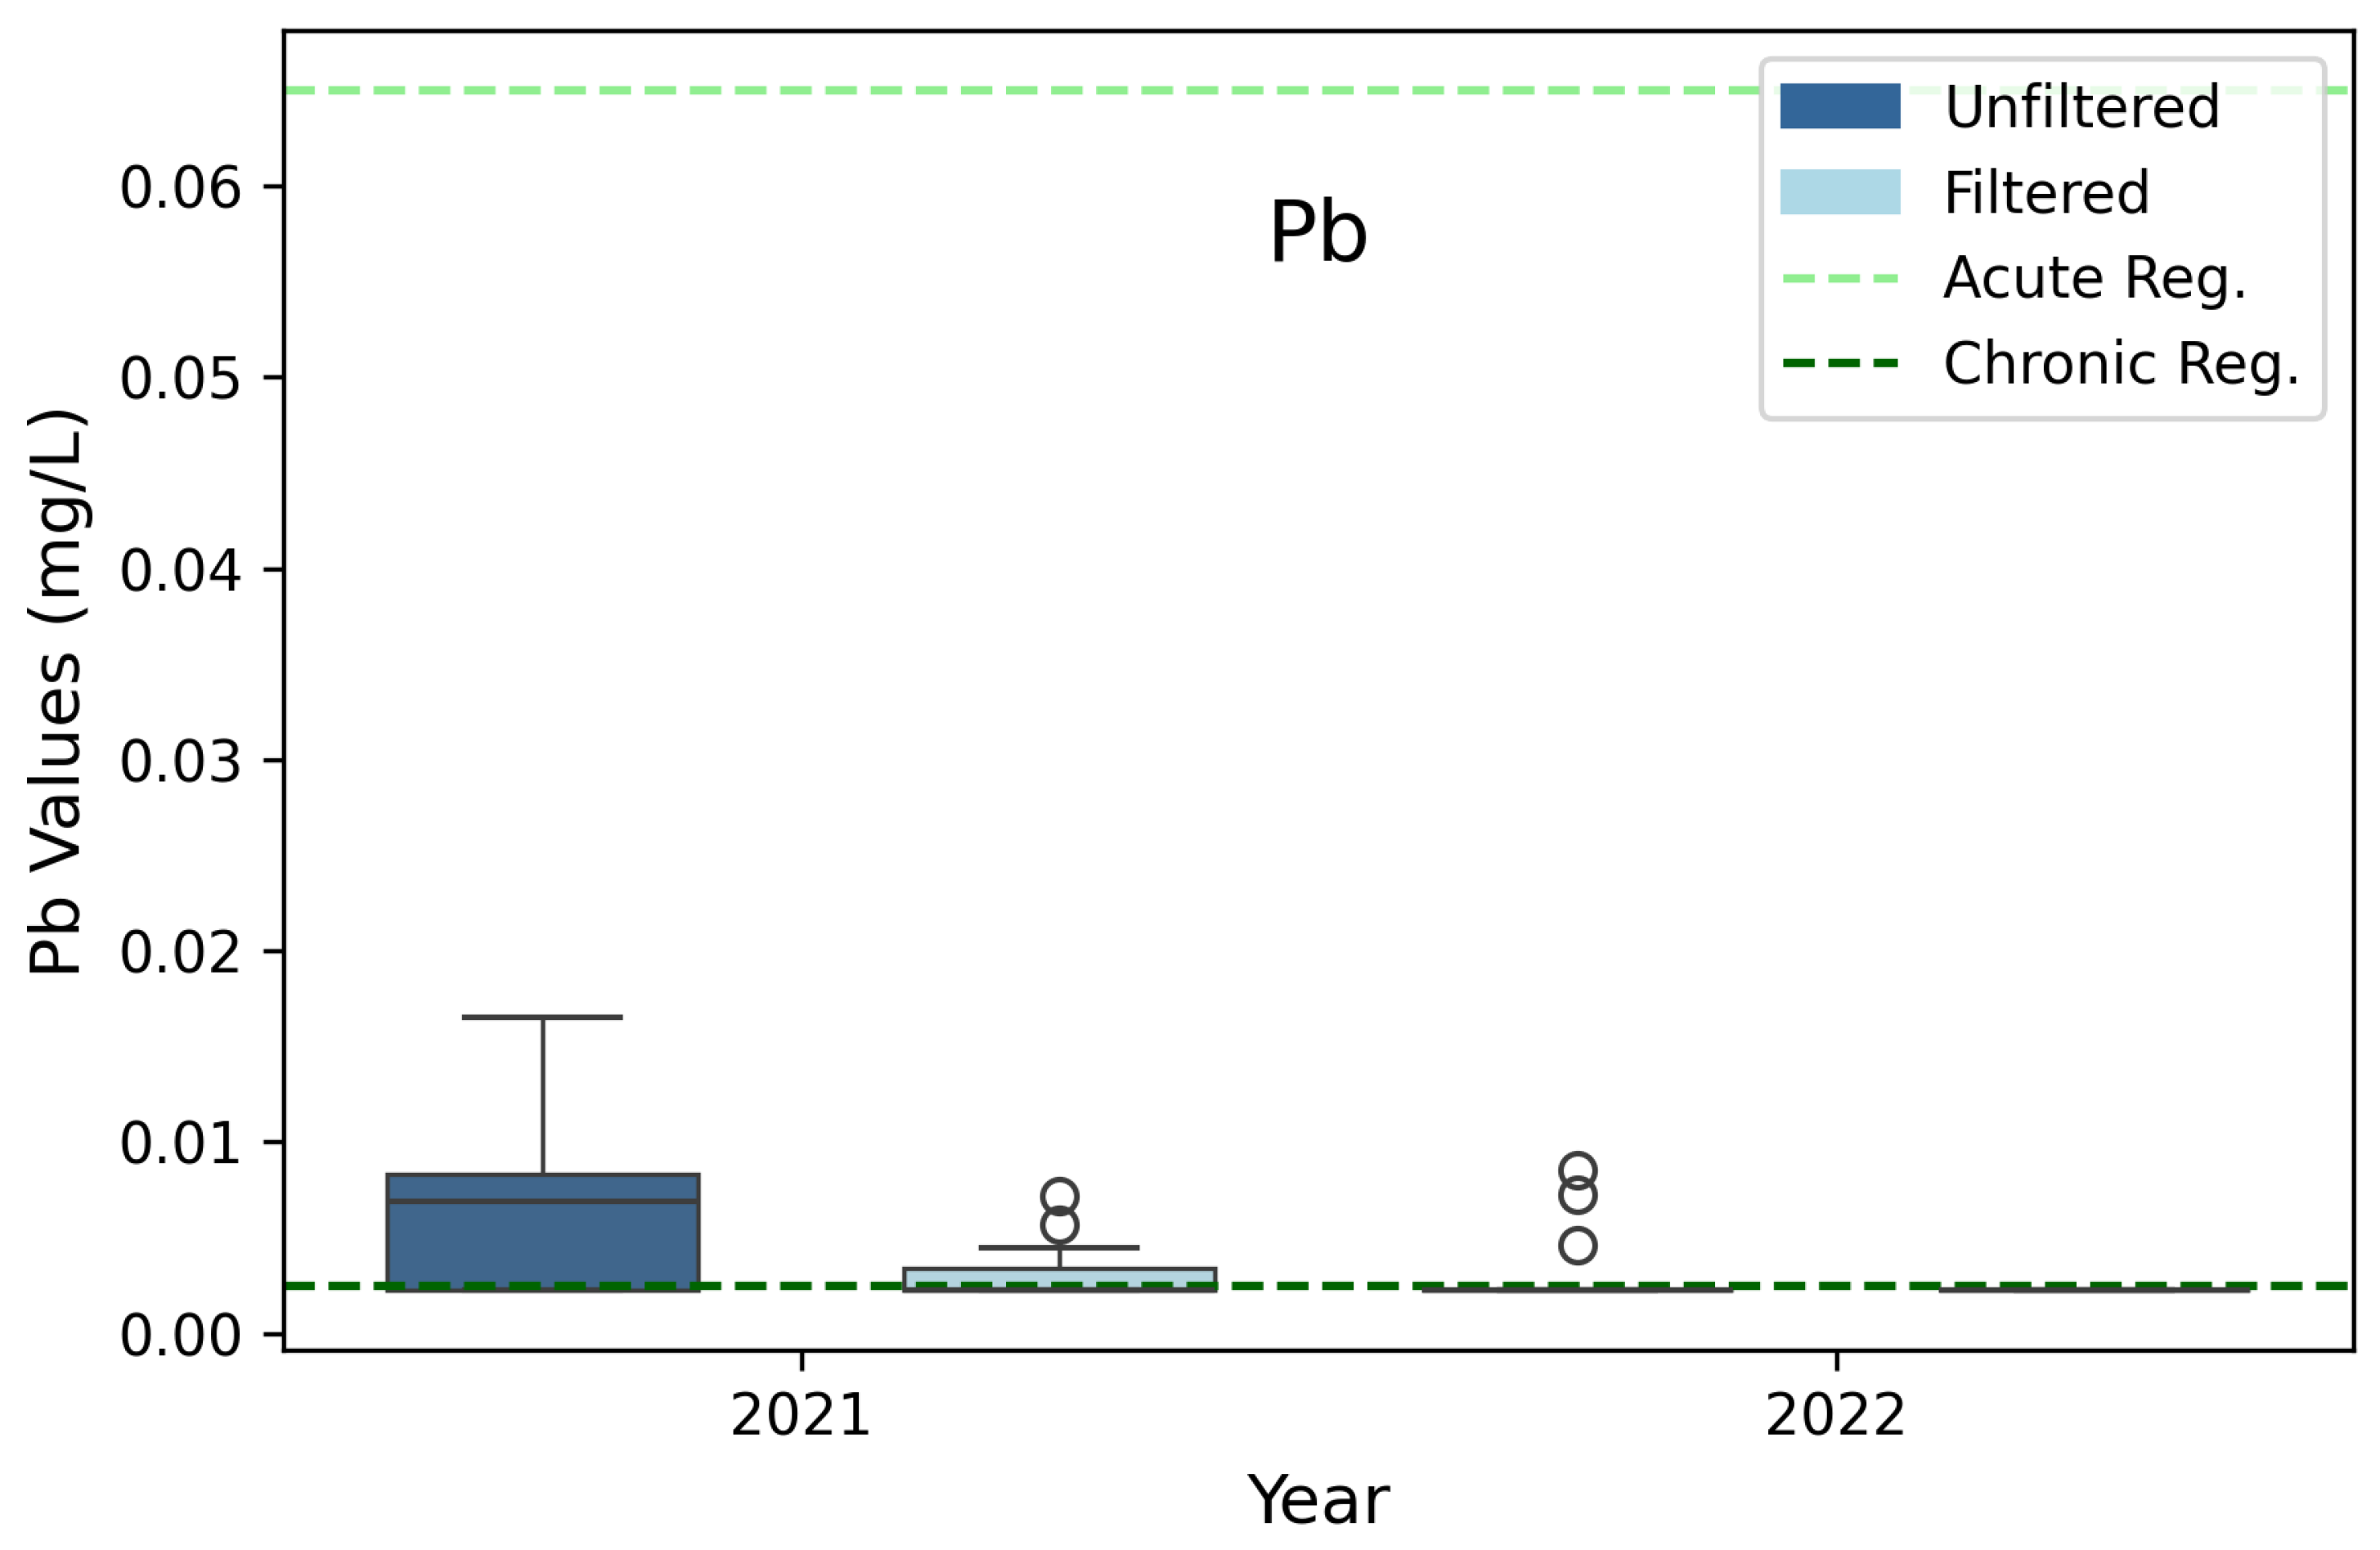
Pb is a nonessential metal that is toxic at high concentrations [60,61,62,94]. In our samples, dissolved Pb distributions had median values well below the acute standard for both filtered and unfiltered samples. However, the median values were often near or above their chronic state regulations level (Figure 6). These results are misleading, however, as the acute Pb standard is below the ICP-OES method MDL for Pb. The bottom panel of Figure 7 shows that four dissolved Pb samples were above or at the acute standard with two samples having values of 0.0072 and 0.0057 and two at the MDL of 0.0045. The remaining data were below the MDL and were set to one-half the MDL to generate the plots and statistics. All the samples were well below the chronic standard. In 2021 and 2022, ten and three of the unfiltered samples were above the acute standards, respectively. The remaining samples, five and ten samples for 2021 and 2022, respectively were below MDL. Actual dissolved Pb concentrations could be lower (or higher) than this value. This is a limitation of our study caused by the lack of sensitivity of the ICP-OES compared to the regulatory standard. The EPA standard for Pb analysis uses a more sensitive ICP-MS method, which we did not use.
The Pb chronic regulation concentrations is half of the ICP-OES MDL for Pb. Since we replaced 90% of measurements that were below the MDL with half the MDL, most of the dissolved Pb measurements are exactly at the chronic regulation. Our data cannot be used to evaluate Pb concentrations relative to the chronic standard.
Figure 2 showed that except for two samples, all the samples with Pb concentrations over the MDL were for unfiltered samples, indicating the Pb is associated with suspended solids. Both the filtered and unfiltered Pb distributions exhibit large differences between 2021 and 2022, with 2022 exhibiting significantly lower concentrations. We are unaware of any specific cause for this, although it’s possible that higher levels of spring runoff in 2021 in comparison to 2022 lead to greater inputs of Pb to the lake in 2021.

3.8. Phosphorus (P)

P is a limiting macronutrient in many freshwater lakes [95], but if sufficient P is available, other factors, such as micronutrients or light, can become limiting factors. Both total and dissolved P distributions are above the acute and chronic State regulations at the 25th percentile, with the exception of filtered samples in 2022 where the median is above the limits, but the 25th percentile is below (Figure 8). UL is listed as impaired due to high P concentrations, and the State has begun the process of developing a total maximum daily load (TMDL) for the lake [96]. Our data agree and show that P concentrations in both the filtered and unfiltered samples are above the regulatory levels. The MDL analysis further emphasizes the presence of P with over 80% of the filtered and all the unfiltered samples over the MDL (Figure 2).
Filtered and unfiltered P concentrations are strongly correlated, with a PCC of 0.949, but neither filtered nor unfiltered P correlates strongly with any other parameters we measured. The strong correlation between unfiltered and filtered P concentrations indicate they are dependent on each other. That is, when unfiltered concentrations increase, due to higher turbidity or sediment resuspension, filtered or dissolved concentrations increase as well. These data support the idea that dissolved P concentrations in UL are governed by a sorption process which keeps sorbed (unfiltered) and dissolved (filtered) P in a constant ratio [1]. Because of the large reservoir of P in the UL sediments, water column concentrations are relatively stable as was shown by Taggart, et al. [1]
Dissolved P concentrations were not correlated with either probe measurements of chlorophyll or phycocyanin, both of which indicate phytoplankton growth. This suggests that phytoplankton growth is not responding directly to bioavailable P concentrations—meaning dissolved P is not a limiting factor for algal growth in the UL water column. This analysis indicated that P concentrations, both filtered and unfiltered, are independent of other processes, which is again consistent with P in UL acting within a sorption-based system, where water column concentrations are in equilibrium with P-rich sediments of geologic origin [1].

3.9. Barium (Ba)

Ba is a potentially toxic metal that is not currently regulated in Utah [84]. Ba occurs naturally and is released by industrial processes where it becomes mobilized as airborne particles that could enter UL through atmospheric deposition [77]. UL is susceptible to atmospheric deposition as indicated by several studies [16,20,97]. Based on this, we have chosen to include a discussion on Ba. Figure 9 shows the Ba distributions for both filtered and unfiltered measurements. The Ba distributions for 2021 and 2022 sampling seasons are consistent and emphasize the presence of Ba within the UL ecosystem. There is a difference, but not a large one, between the unfiltered and filtered distributions. This indicates that a significant portion of Ba is dissolved, with some portion associated with suspended solids. About half the Ba in UL is present in the dissolved phase.
The U.S. EPA released a factsheet on Ba [98] in which they estimate that between the years of 1987 and 1993, 680 kg (1,500 pounds) of Ba was released into the waters of Utah, including UL. The MDL analysis (Section 3.1 and Figure 2) revealed that Ba measurements for both unfiltered and filtered samples were over MDL 100% of the time. Sediment samples show that there is an average of 179.5 mg/kg in the UL sediments. The Ba boxplot (Figure 9) shows that the median unfiltered and filtered samples for Ba are about the same in both the 2021 and 2022 sampling seasons.
Short-term health effects of Ba include gastrointestinal disturbances and muscular weakness, with long-term effects including high blood pressure for levels above the maximum contaminant limit (MCL) [98]. The U.S. EPA MCL for Ba is 2 mg/L for drinking water, nearly 2 orders of magnitude higher than any of our measured values in UL [98,99]. Within the state of Utah, Ba is only regulated for the designated use of 1C or “Domestic Source” (which does not apply to Utah Lake) at a maximum dissolved limit of 1 mg/L [84]. The Ba distribution plot (Figure 9) shows that both the unfiltered and filtered measurements are well below the EPA MCL of 2 mg/L for drinking water and the 1 mg/L Utah 1C regulation for domestic source water.

3.10. Arsenic (As)

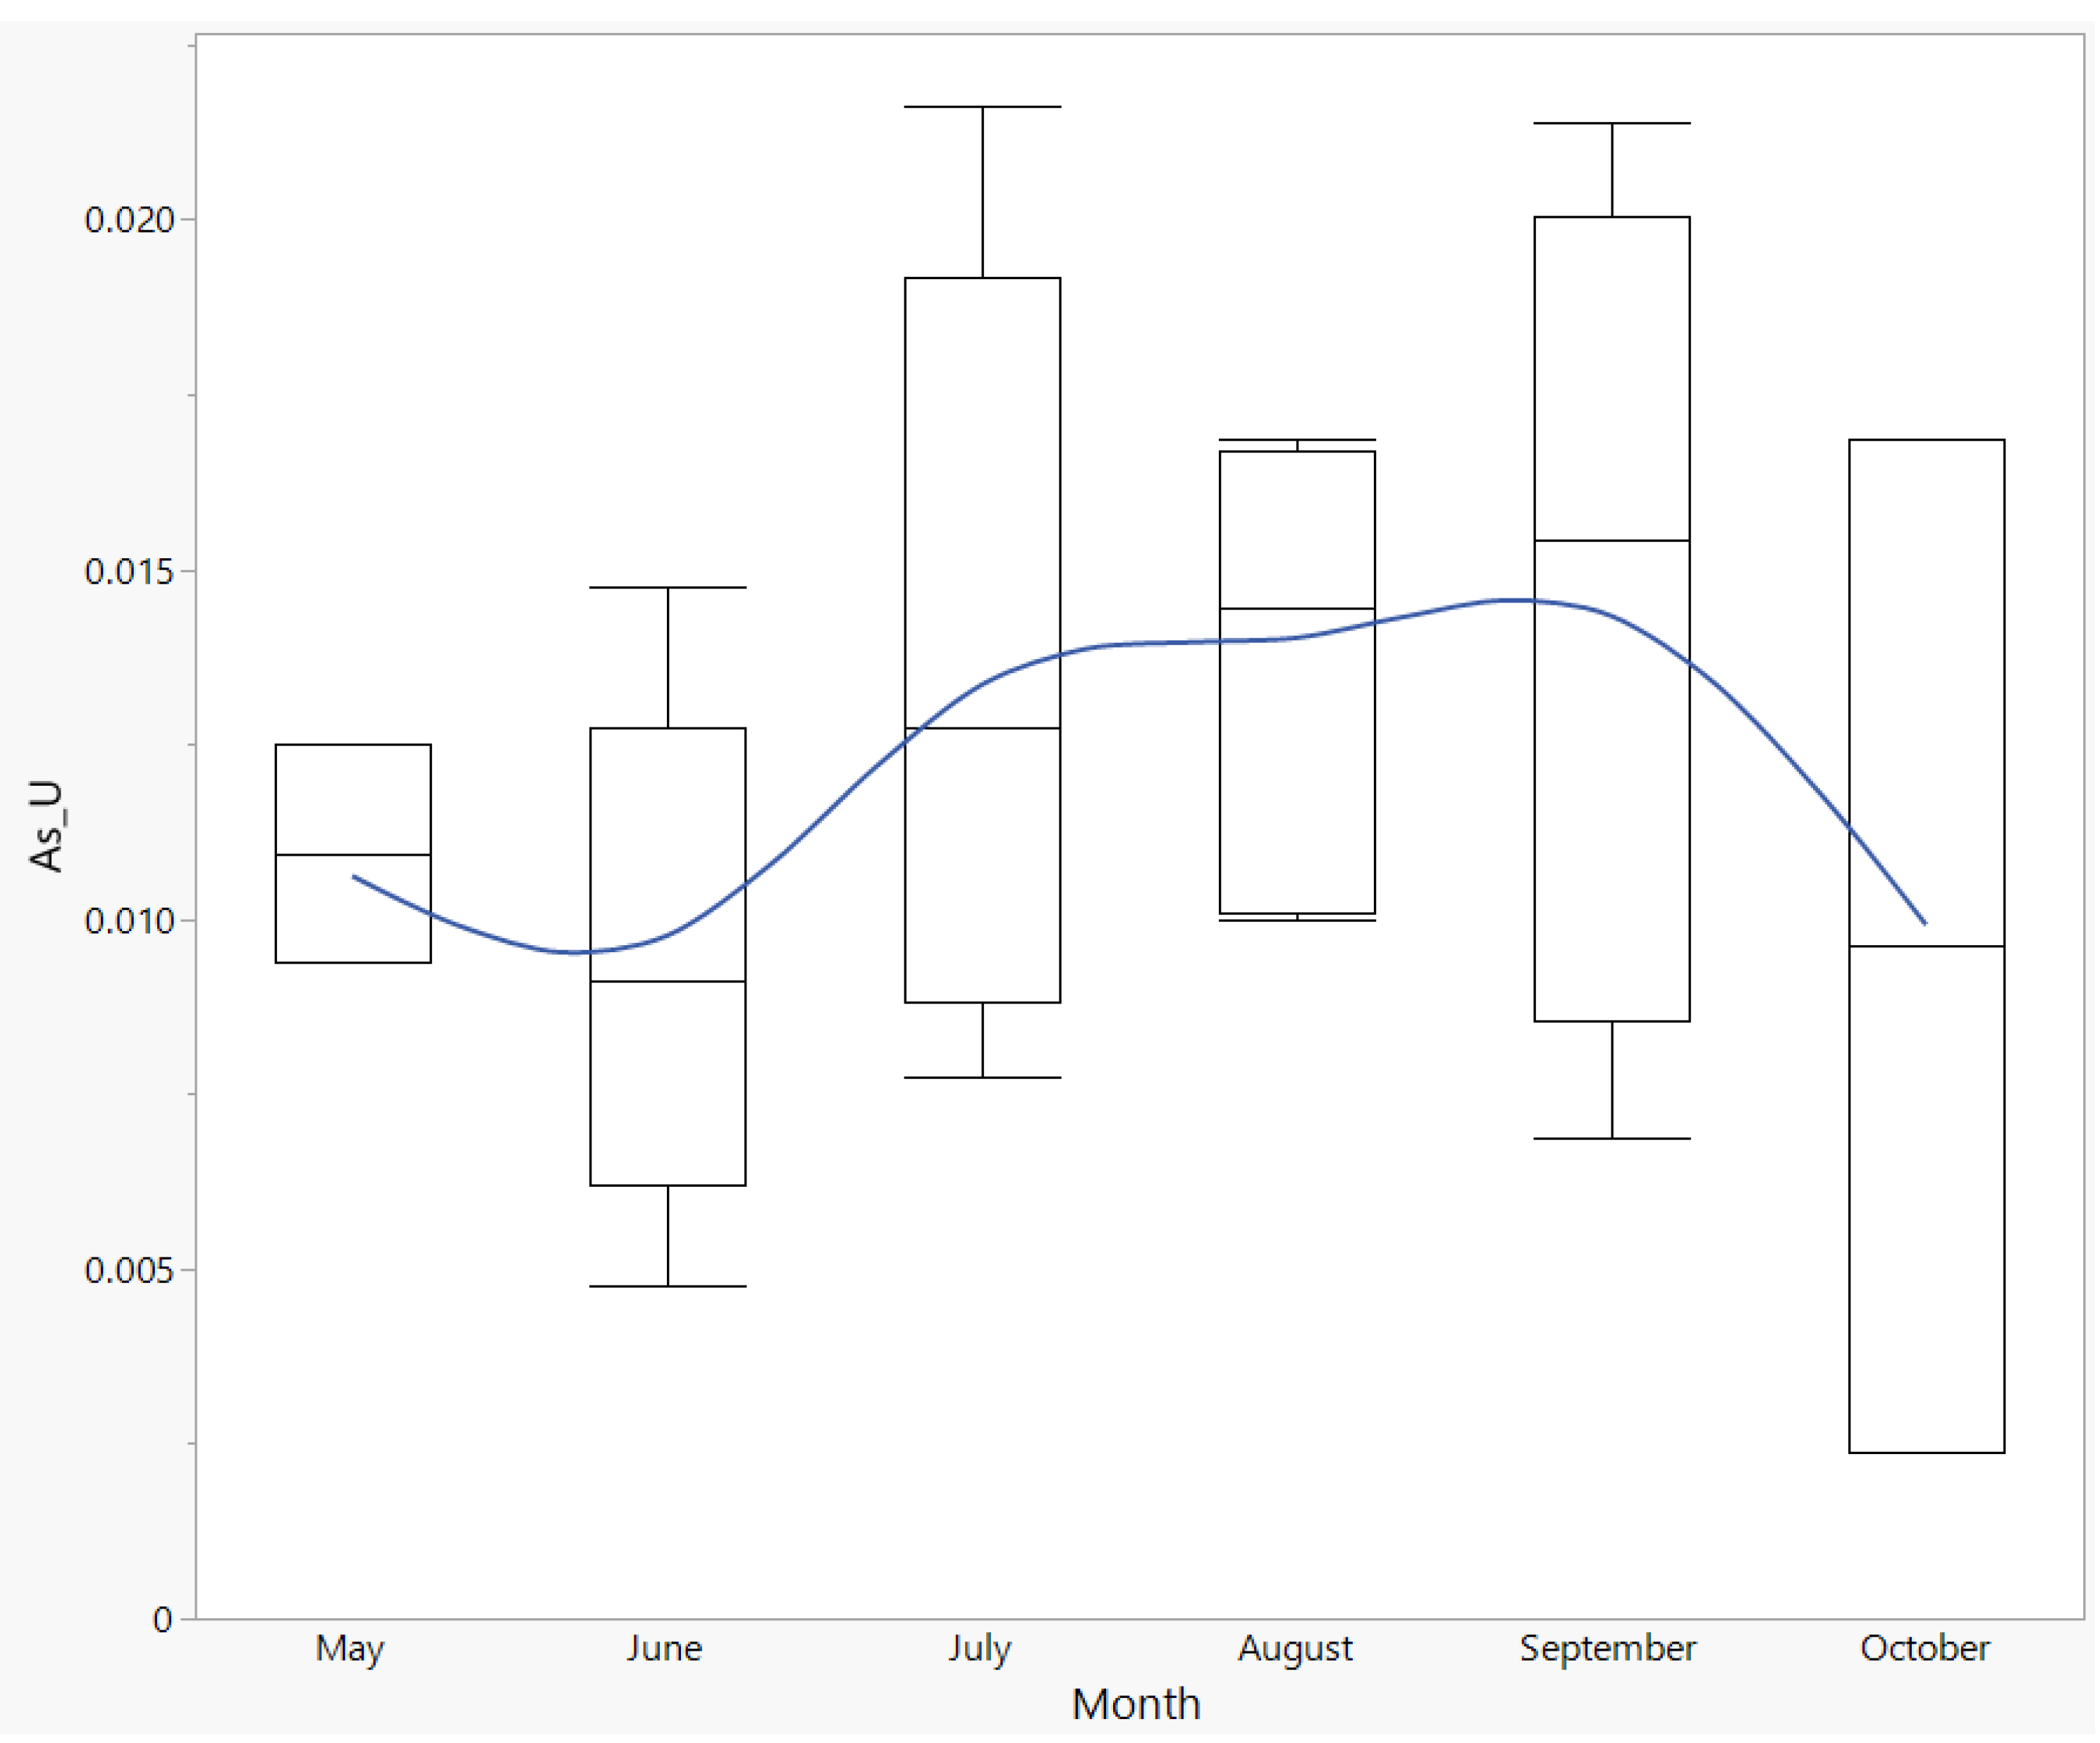
As exhibited a seasonal trend in both years of our data (Figure 10). We postulate that As increases in late summer because groundwater inflows with higher concentrations of As becomes a larger portion of lake inflows at that time of year [100,101]. As is positively correlated with phycocyanin probe measurements and inversely correlated with filtered Al concentrations. We believe these correlations are spurious and are only present because all three variables have seasonal variation. These variations, however, are due to different processes related to seasonal changes, not chemical or ecological processes involving all three parameters. We could not identify any likely physical process that would drive this correlation.

4. Conclusions

In this study we used ICP-OES to examine elements in UL water at a ppb-level. We found that total recoverable concentrations of Al in UL exceeded regulatory criteria when using our analytical methods, although we attribute these elevated levels to nonreactive, clay-dominated suspended sediment. Concentrations of dissolved Al, which would be bioavailable and have the potential to be toxic, were well below regulatory criteria. We consistently measured concentrations of Cu and P above or very close to regulatory limits. The high concentrations of P in UL are well known, but the elevated levels of Cu are not widely recognized, and as these elements have the potential to impair the beneficial uses of UL, further studies should be conducted. Cu especially should be considered because of an ongoing program using Cu-based algaecide to treat intense algal blooms in UL.
Concentrations of other regulated elements remained well below regulatory criteria, which was interesting because anthropogenic inputs of these elements to UL have been and may still be large—the low concentrations we observed demonstrate the lake’s high capacity for absorbing, degrading, and removing pollutants. Additionally, we found no regulations regarding Ba for UL’s designated beneficial uses; however, concentrations of Ba are below drinking water limits despite nearby anthropogenic sources.
We found a strong correlation between unfiltered (total) and filtered (dissolved) P, indicating that constant resuspension of P-rich lakebed sediments acts as a source of bioavailable P in the water column. This relationship indicates that dissolved P in the water column is in equilibrium with P sorbed onto lakebed sediments and suspended sediments in a sorption-dominated system.
Considering UL except for Al and P, is well within compliance for all regulated DE elements associated with its designated uses, it may be beneficial for the State to create a separate designated use category for UL as has been done with the Great Salt Lake. The DE standards drive many regulatory decisions for point sources around UL and as such could be further considered with the uniqueness of UL.

Author Contributions

Conceptualization, R.A.V, K.B.T. and G.P.W.; methodology, R.A.V. and G.P.W.; software, R.A.V.; validation, J.B.T., R.L.R., A.C.C., A.W.M. and R.B.S.; resources, A.W.M. and G.P.W.; data curation, R.A.C., K.B.T, and A.C.C.; writing—original draft preparation, R.A.V.; writing—review and editing, R.A.V, K.B.T., J.B.T., R.L.R., A.C.C. G.P.W., A.W.M, and R.B.S.; visualization, R.A.V. and G.P.W.; supervision, G.P.W.; project administration, R.A.V, K.B.T., and G.P.W.; funding acquisition, A.W.M and G.P.W. All authors have read and agreed to the published version of the manuscript.

Funding

This research was funded by Timpanogos Special Service District (TSSD), American Fork, UT.

Data Availability Statement

The data presented in this study are available on request from the corresponding author due to contractual restrictions on data distribution.

Acknowledgments

We acknowledge TSSD management and staff in their support in this work.

Conflicts of Interest

The funders had no role in the collection, analyses, or interpretation of data or in the decision to publish the results.

References

  1. Taggart, J.B.; Ryan, R.L.; Williams, G.P.; Miller, A.W.; Valek, R.A.; Tanner, K.B.; Cardall, A.C. Historical Phosphorus Mass and Concentrations in Utah Lake: A Case Study with Implications for Nutrient Load Management in a Sorption-Dominated Shallow Lake. Water 2024, 16, 933. [Google Scholar] [CrossRef]
  2. Snow, E. A preliminary study of the algae of Utah Lake: Master's thesis. Brigham Young University, Provo, Utah, 84p 1931.
  3. Harding, W.J. The algae of Utah Lake. Part II. The Great Basin Naturalist 1971, 31, 125–134. [Google Scholar]
  4. Rushforth, S.R.; Squires, L.E. New records and comprehensive list of the algal taxa of Utah Lake, Utah, USA. The Great Basin Naturalist 1985, 237–254. [Google Scholar]
  5. Squires, L.E.; Rushforth, S.R. Winter phytoplankton communities of Utah Lake, Utah, USA. Hydrobiologia 1986, 131, 235–248. [Google Scholar] [CrossRef]
  6. Whiting, M.C.; Brotherson, J.D.; Rushforth, S.R. Environmental interaction in summer algal communities of Utah Lake. The Great Basin Naturalist 1978, 31–41. [Google Scholar]
  7. Harding, W.J. A preliminary report on the algal species presently found in Utah Lake. The Great Basin Naturalist 1970, 30, 99–105. [Google Scholar]
  8. Rushforth, S.R.; St. Clair, L.L.; Grimes, J.A.; Whiting, M.C. Phytoplankton of Utah Lake. Great Basin Naturalist Memoirs 1981, 85–100. [Google Scholar]
  9. Squires, L.E.; Whiting, M.C.; Brotherson, J.D.; Rushforth, S.R. Competitive displacement as a factor influencing phytoplankton distribution in Utah Lake, Utah. The Great Basin Naturalist 1979, 245–252. [Google Scholar]
  10. Carozzi, A.V. Observations on algal biostromes in the Great Salt Lake, Utah. The Journal of Geology 1962, 70, 246–252. [Google Scholar] [CrossRef]
  11. Rushforth, S.R.; Merkley, G.S. Comprehensive list by habitat of the algae of Utah, USA. The Great Basin Naturalist 1988, 154–179. [Google Scholar]
  12. Davis, R.; Panja, P.; McLennan, J. Integrated workflow for interpretation of satellite imageries using machine learning to assess and monitor algal blooms in Utah Lake, USA. Ecological Informatics 2023, 102033. [Google Scholar] [CrossRef]
  13. Tanner, K.B.; Cardall, A.C.; Williams, G.P. A Spatial Long-Term Trend Analysis of Estimated Chlorophyll-a Concentrations in Utah Lake Using Earth Observation Data. Remote Sensing 2022, 14, 3664. [Google Scholar] [CrossRef]
  14. Hansen, C.H.; Burian, S.J.; Dennison, P.E.; Williams, G.P. Evaluating historical trends and influences of meteorological and seasonal climate conditions on lake chlorophyll a using remote sensing. Lake and Reservoir Management 2020, 36, 45–63. [Google Scholar] [CrossRef]
  15. Hansen, C.H.; Williams, G.P.; Adjei, Z.; Barlow, A.; Nelson, E.J.; Miller, A.W. Reservoir water quality monitoring using remote sensing with seasonal models: case study of five central-Utah reservoirs. Lake and Reservoir Management 2015, 31, 225–240. [Google Scholar] [CrossRef]
  16. Barrus, S.M.; Williams, G.P.; Miller, A.W.; Borup, M.B.; Merritt, L.B.; Richards, D.C.; Miller, T.G. Nutrient Atmospheric Deposition on Utah Lake: A Comparison of Sampling and Analytical Methods. Hydrology 2021, 8, 123. [Google Scholar] [CrossRef]
  17. Telfer, J.T.; Brown, M.M.; Williams, G.P.; Tanner, K.B.; Miller, A.W.; Sowby, R.B.; Miller, T.G. Source Attribution of Atmospheric Dust Deposition to Utah Lake. In Hydrology 2023, Vol. 10.
  18. Reidhead, J.G. Significance of the Rates of Atmospheric Deposition Around Utah Lake and Phosphorus-Fractionation of Local Soils; Brigham Young University: 2019.
  19. Abu-Hmeidan, H.Y.; Williams, G.P.; Miller, A.W. Characterizing Total Phosphorus in Current and Geologic Utah Lake Sediments: Implications for Water Quality Management Issues. Hydrology 2018, 5, 8. [Google Scholar] [CrossRef]
  20. Brown, M.M.; Telfer, J.T.; Williams, G.P.; Miller, A.W.; Sowby, R.B.; Hales, R.C.; Tanner, K.B. Nutrient Loadings to Utah Lake from Precipitation-Related Atmospheric Deposition. Hydrology 2023, 10, 200. [Google Scholar] [CrossRef]
  21. Olsen, J.M.; Williams, G.P.; Miller, A.W.; Merritt, L. Measuring and Calculating Current Atmospheric Phosphorous and Nitrogen Loadings to Utah Lake Using Field Samples and Geostatistical Analysis. Hydrology 2018, 5, 45. [Google Scholar] [CrossRef]
  22. Bradshaw, J.; Sundrud, R.; White, D.; Barton, J.; Fuhriman, D.; Loveridge, E.; Pratt, D. Chemical response of Utah Lake to nutrient inflow. Journal (Water Pollution Control Federation) 1973, 880–887. [Google Scholar]
  23. Zanazzi, A.; Wang, W.; Peterson, H.; Emerman, S.H. Using Stable Isotopes to Determine the Water Balance of Utah Lake (Utah, USA). Hydrology 2020, 7, 88. [Google Scholar] [CrossRef]
  24. Strong, A.E. Remote sensing of algal blooms by aircraft and satellite in Lake Erie and Utah Lake. Remote sensing of Environment 1974, 3, 99–107. [Google Scholar] [CrossRef]
  25. Strong, A. ERTS-1 observes algal blooms in Lake Erie and Utah Lake. In Proceedings of NASA. Goddard Space Flight Center Symp. on Significant Results obtained from the ERTS-1, Vol. 1, Sect. A. and B.
  26. Miller, W.; Rango, A. Using heat capacity mapping mission (hcmm) data to assess lake water quality 1. JAWRA Journal of the American Water Resources Association 1984, 20, 493–501. [Google Scholar] [CrossRef]
  27. Schneider, S.R.; McGinnis, D.F.; Gatlin, J.A. Use of NOAA/AVHRR visible and near-infrared data for land remote sensing; US Department of Commerce, National Oceanic and Atmospheric Administration …: 1981; Vol. 84.
  28. Hansen, C.H.; Williams, G.P. Evaluating remote sensing model specification methods for estimating water quality in optically diverse lakes throughout the growing season. Hydrology 2018, 5, 62. [Google Scholar] [CrossRef]
  29. Hansen, C.H.; Burian, S.J.; Dennison, P.E.; Williams, G.P. Spatiotemporal variability of lake water quality in the context of remote sensing models. Remote Sensing 2017, 9, 409. [Google Scholar] [CrossRef]
  30. Rivera, S.; Landom, K.; Crowl, T. Monitoring macrophytes cover and taxa in Utah Lake by using 2009-2011 Landsat digital imagery. Revista de Teledetección 2013, 39, 106–115. [Google Scholar]
  31. Han, Q.; Niu, Z. Construction of the long-term global surface water extent dataset based on water-NDVI spatio-temporal parameter set. Remote Sensing 2020, 12, 2675. [Google Scholar] [CrossRef]
  32. Seegers, B.N.; Werdell, P.J.; Vandermeulen, R.A.; Salls, W.; Stumpf, R.P.; Schaeffer, B.A.; Owens, T.J.; Bailey, S.W.; Scott, J.P.; Loftin, K.A. Satellites for long-term monitoring of inland US lakes: The MERIS time series and application for chlorophyll-a. Remote sensing of environment 2021, 266, 112685. [Google Scholar] [CrossRef] [PubMed]
  33. Zhu, W.; Zhang, Z.; Yang, Z.; Pang, S.; Chen, J.; Cheng, Q. Spectral probability distribution of closed connected water and remote sensing statistical inference for yellow substance. Photogrammetric Engineering & Remote Sensing 2021, 87, 807–819. [Google Scholar]
  34. Hansen, C.H.; Dennison, P.; Burian, S.; Barber, M.; Williams, G. Hindcasting water quality in an optically complex system. WIT Transactions on Ecology and the Environment 2016, 209, 35–44. [Google Scholar]
  35. Page, B.P.; Kumar, A.; Mishra, D.R. A novel cross-satellite based assessment of the spatio-temporal development of a cyanobacterial harmful algal bloom. International journal of applied earth observation and geoinformation 2018, 66, 69–81. [Google Scholar] [CrossRef]
  36. Ramsey, R.D.; Falconer, A.; Jensen, J.R. The relationship between NOAA-AVHRR NDVI and ecoregions in Utah. Remote Sensing of Environment 1995, 53, 188–198. [Google Scholar] [CrossRef]
  37. Hansen, C.; Swain, N.; Munson, K.; Adjei, Z.; Williams, G.P.; Miller, W. Development of sub-seasonal remote sensing chlorophyll-a detection models. American Journal of Plant Sciences 2013, 2013. [Google Scholar] [CrossRef]
  38. Cardall, A.C.; Hales, R.C.; Tanner, K.B.; Williams, G.P.; Markert, K.N. LASSO (L1) Regularization for Development of Sparse Remote-Sensing Models with Applications in Optically Complex Waters Using GEE Tools. Remote Sensing 2023, 15, 1670. [Google Scholar] [CrossRef]
  39. Williams, R.; Nelson, S.; Rushforth, S.; Rey, K.; Carling, G.; Bickmore, B.; Heathcote, A.; Miller, T.; Meyers, L. Human-Driven Trophic Changes in a Large, Shallow Urban Lake: Changes in Utah Lake, Utah from Pre-European Settlement to the Present. Water, Air, & Soil Pollution 2023, 234, 218. [Google Scholar] [CrossRef]
  40. Nofchissey, S.; Roberts, S.; Hopkinson, J.; McDonald, J.; Emerman, S. Arsenic and other heavy metals in Utah Lake and its tributaries. 2014.
  41. Zhang, X.; Li, B.; Xu, H.; Wells, M.; Tefsen, B.; Qin, B. Effect of micronutrients on algae in different regions of Taihu, a large, spatially diverse, hypereutrophic lake. Water Research 2019, 151, 500–514. [Google Scholar] [CrossRef] [PubMed]
  42. Andersen, R.A. Algal culturing techniques; Elsevier: 2005.
  43. Downs, T.M.; Schallenberg, M.; Burns, C.W. Responses of lake phytoplankton to micronutrient enrichment: a study in two New Zealand lakes and an analysis of published data. Aquatic Sciences 2008, 70, 347–360. [Google Scholar] [CrossRef]
  44. Norman, L.; Cabanesa, D.J.E.; Blanco-Ameijeiras, S.; Moisset, S.A.M.; Hassler, C.S. Iron Biogeochemistry in Aquatic Systems: From Source to Bioavailability. CHIMIA 2014, 68, 764. [Google Scholar] [CrossRef] [PubMed]
  45. Krivokapić, M. Study on the Evaluation of (Heavy) Metals in Water and Sediment of Skadar Lake (Montenegro), with BCF Assessment and Translocation Ability (TA) by Trapa natans and a Review of SDGs. Water 2021, 13, 876. [Google Scholar] [CrossRef]
  46. Rueter, J.G.; Petersen, R.R. Micronutrient effects on cyanobacterial growth and physiology. New Zealand Journal of Marine and Freshwater Research 1987, 21, 435–445. [Google Scholar] [CrossRef]
  47. Bayer, T.K.; Schallenberg, M.; Martin, C.E. Investigation of nutrient limitation status and nutrient pathways in Lake Hayes, Otago, New Zealand: a case study for integrated lake assessment. New Zealand Journal of Marine and Freshwater Research 2008, 42, 285–295. [Google Scholar] [CrossRef]
  48. Dengg, M.; Stirling, C.H.; Reid, M.R.; Verburg, P.; Armstrong, E.; Kelly, L.T.; Wood, S.A. Growth at the limits: comparing trace metal limitation of a freshwater cyanobacterium (Dolichospermum lemmermannii) and a freshwater diatom (Fragilaria crotonensis). Scientific Reports 2022, 12, 467. [Google Scholar] [CrossRef] [PubMed]
  49. Facey, J.A.; Rogers, T.A.; Apte, S.C.; Mitrovic, S.M. Micronutrients as growth limiting factors in cyanobacterial blooms; a survey of freshwaters in South East Australia. Aquatic Sciences 2021, 83, 28. [Google Scholar] [CrossRef]
  50. Facey, J.A.; Apte, S.C.; Mitrovic, S.M. A Review of the Effect of Trace Metals on Freshwater Cyanobacterial Growth and Toxin Production. Toxins 2019, 11, 643. [Google Scholar] [CrossRef] [PubMed]
  51. Shaw-Allen, P.; Sutlerm, G.W. Metals. Availabe online: https://www.epa.gov/caddis-vol2/metals (accessed on June 2, 2024).
  52. Schuler, M.S.; Relyea, R.A. A Review of the Combined Threats of Road Salts and Heavy Metals to Freshwater Systems. BioScience 2018, 68, 327–335. [Google Scholar] [CrossRef]
  53. Monchanin, C.; Devaud, J.-M.; Barron, A.B.; Lihoreau, M. Current permissible levels of metal pollutants harm terrestrial invertebrates. Science of The Total Environment 2021, 779, 146398. [Google Scholar] [CrossRef]
  54. Mogren, C.L.; Trumble, J.T. The impacts of metals and metalloids on insect behavior. Entomologia Experimentalis et Applicata 2010, 135, 1–17. [Google Scholar] [CrossRef]
  55. Rainbow, P.S. Trace metal concentrations in aquatic invertebrates: why and so what? Environmental Pollution 2002, 120, 497–507. [Google Scholar] [CrossRef] [PubMed]
  56. Marschner, H. Marschner's mineral nutrition of higher plants; Academic press: 2011.
  57. Gall, J.E.; Boyd, R.S.; Rajakaruna, N. Transfer of heavy metals through terrestrial food webs: a review. Environmental Monitoring and Assessment 2015, 187, 201. [Google Scholar] [CrossRef] [PubMed]
  58. Ali, A.S.; US SA, A.R. Effect of different heavy metal pollution on fish. Res. J. Chem. Environ. Sci 2014, 2, 74–79. [Google Scholar]
  59. Amundsen, P.A.; Staldvik, F.J.; Lukin, A.A.; Kashulin, N.A.; Popova, O.A.; Reshetnikov, Y.S. Heavy metal contamination in freshwater fish from the border region between Norway and Russia. Sci Total Environ 1997, 201, 211–224. [Google Scholar] [CrossRef]
  60. Lucia, M.; André, J.-M.; Gontier, K.; Diot, N.; Veiga, J.; Davail, S. Trace element concentrations (mercury, cadmium, copper, zinc, lead, aluminium, nickel, arsenic, and selenium) in some aquatic birds of the Southwest Atlantic Coast of France. Archives of Environmental Contamination and Toxicology 2010, 58, 844–853. [Google Scholar] [CrossRef] [PubMed]
  61. Burger, J.; Gochfeld, M. Behavioral impairments of lead-injected young herring gulls in nature. Toxicological sciences 1994, 23, 553–561. [Google Scholar] [CrossRef]
  62. Scheuhammer, A. The chronic toxicity of aluminium, cadmium, mercury, and lead in birds: a review. Environmental Pollution 1987, 46, 263–295. [Google Scholar] [CrossRef]
  63. Epstein, E.; Bloom, A.J. Mineral nutrition of plants: principles and perspectives; Sinauer: 1853.
  64. Cavet, J.S.; Borrelly, G.P.; Robinson, N.J. ; Zn, Cu and Co in cyanobacteria: selective control of metal availability. FEMS Microbiology Reviews 2003, 27, 165–181. [Google Scholar] [CrossRef] [PubMed]
  65. Chakraborty, P.; Babu, P.R.; Acharyya, T.; Bandyopadhyay, D. Stress and toxicity of biologically important transition metals (Co, Ni, Cu and Zn) on phytoplankton in a tropical freshwater system: An investigation with pigment analysis by HPLC. Chemosphere 2010, 80, 548–553. [Google Scholar] [CrossRef] [PubMed]
  66. Moreno-Vivián, C.; Cabello, P.n.; Martínez-Luque, M.; Blasco, R.; Castillo, F. Prokaryotic nitrate reduction: molecular properties and functional distinction among bacterial nitrate reductases. Journal of bacteriology 1999, 181, 6573–6584. [Google Scholar] [CrossRef] [PubMed]
  67. Axler, R.; Gersberg, R.; Goldman, C. Stimulation of nitrate uptake and photosynthesis by molybdenum in Castle Lake, California. Canadian journal of fisheries and aquatic sciences 1980, 37, 707–712. [Google Scholar] [CrossRef]
  68. Ali, H.; Khan, E.; Ilahi, I. Environmental Chemistry and Ecotoxicology of Hazardous Heavy Metals: Environmental Persistence, Toxicity, and Bioaccumulation. Journal of Chemistry 2019, 2019, 6730305. [Google Scholar] [CrossRef]
  69. Whetten, C.L. “This strange enterprise”: Geneva steel and the American west. M.A., The University of Utah, United States -- Utah, 2011.
  70. Fuhriman, D.K.; Merritt, L.B.; Miller, A.W.; Stock, H.S. Hydrology and Water Quality of Utah Lake. Great Basin Naturalist Memoirs 1981, 43–67. [Google Scholar]
  71. Merritt, L.; Miller, W. Nutrient loading to Utah Lake. Utah Lake Studies 2016. [Google Scholar]
  72. Bureau, U.S.C. US Census Bureau Publications - Census of Population and Housing. Availabe online: https://www.census.gov/prod/www/decennial.html (accessed on October, 2021).
  73. Schoderboeck, L.; Mühlegger, S.; Losert, A.; Gausterer, C.; Hornek, R. Effects assessment: Boron compounds in the aquatic environment. Chemosphere 2011, 82, 483–487. [Google Scholar] [CrossRef] [PubMed]
  74. Norici, A.; Hell, R.; Giordano, M. Sulfur and primary production in aquatic environments: an ecological perspective. Photosynthesis Research 2005, 86, 409–417. [Google Scholar] [CrossRef] [PubMed]
  75. Karjalainen, J.; Hu, X.; Mäkinen, M.; Karjalainen, A.; Järvistö, J.; Järvenpää, K.; Sepponen, M.; Leppänen, M.T. Sulfate sensitivity of aquatic organism in soft freshwaters explored by toxicity tests and species sensitivity distribution. Ecotoxicology and Environmental Safety 2023, 258, 114984. [Google Scholar] [CrossRef] [PubMed]
  76. Bodzek, M. The removal of boron from the aquatic environment–state of the art. Desalination and Water Treatment 2016, 57, 1107–1131. [Google Scholar] [CrossRef]
  77. Gad, S.C. Barium. In Encyclopedia of Toxicology (Third Edition), Wexler, P., Ed. Academic Press: Oxford, 2014; https://doi.org/10.1016/B978-0-12-386454-3.00819-8pp. 368-370. O. [CrossRef]
  78. Casbeer, W.; Williams, G.P.; Borup, M.B. Phosphorus Distribution in Delta Sediments: A Unique Data Set from Deer Creek Reservoir. Hydrology 2018, 5, 58. [Google Scholar] [CrossRef]
  79. Constenius, K.N.; Clark, D.L.; King, J.K.; Ehler, J.B. Utah Geological Survey,: Salt Lake City, UT, USA, 2011.
  80. Hintze, L.F.; Kowallis, B.J. Geologic History of Utah: A Field Guide to Utah's Rocks, Special Publications 9 ed.; Department of Geological Sciences, Brigham Young University: Provo, UT, USA, 2009. [Google Scholar]
  81. Szklarek, S.; Górecka, A.; Wojtal-Frankiewicz, A. The effects of road salt on freshwater ecosystems and solutions for mitigating chloride pollution - A review. Science of The Total Environment 2022, 805, 150289. [Google Scholar] [CrossRef] [PubMed]
  82. Maier, K.J.; Knight, A.W. Ecotoxicology of selenium in freshwater systems.
  83. Diaz, X.; Johnson, W.P.; Naftz, D.L. Selenium mass balance in the Great Salt Lake, Utah. Science of the Total Environment 2008, 407, 2333–2341. [Google Scholar] [CrossRef] [PubMed]
  84. Utah Department of Environmental Quality. Standards of Quality for Waters of the State. Availabe online: https://documents.deq.utah.gov/water-quality/standards-technical-services/DWQ-2021-017555.
  85. Utah Department of Environmental Quality Division of Water Quality. Water Quality Standards - Utah Department of Environmental Quality. Availabe online: https://deq.utah.gov/water-quality/water-quality-standards (accessed on .
  86. Quality, U.D.o.E. Water Qulaity Assessment and Analysis: Utah Lake Water Quality Study Availabe online: https://deq.utah.gov/water-quality/water-quality-assessment-and-analysis-utah-lake (accessed on.
  87. Laan, J.V. Question about interpreting R317-2 water quality standards Tanner, K., Ed. 2022.
  88. Valek, R.; Walmer, E.; Dorrett, C.; Tanner, K.; Cardall, A.; Williams, G. Utah Lake Nutrient Cycling Studies: Limnnocorral Usage and Experiments. In Proceedings of Intermountain Engineering, Technology, and Computing (IETC), Orem, UT, USA.
  89. Dorrett, C.; Cardall, A.; Tanner, K.; Valek, R.; Williams, G. Data Collection Methods for Utah Lake Nutrient Cycling Study. American Water Works Association Intermountain Section IMS-AWWA Annual Conference, 2021.
  90. Horowitz, A.J.; Elrick, K.A.; Colberg, M.R. The effect of membrane filtration artifacts on dissolved trace element concentrations. Water Research 1992, 26, 753–763. [Google Scholar] [CrossRef]
  91. Holcomb, B. Utah Lake Marina HAB Treatments Evaluation of Treatment Effectiveness 2021 Interim Report Quality, U.D.o.E., Ed. 2021.
  92. The Utah Lake Authority. Utah Lake Authority FY 2023 Annual Monitoring Report 2023.
  93. United States, B.O.R. Historic Data. Availabe online: https://www.usbr.gov/rsvrWater/HistoricalApp.html (accessed on 1/15).
  94. EPA. 2018 Final Aquatic Life Criteria for Aluminum in Freshwater. US EPA 2022.
  95. Correll, D.L. The role of phosphorus in the eutrophication of receiving waters: A review. Journal of environmental quality 1998, 27, 261–266. [Google Scholar] [CrossRef]
  96. PSOMAS. Utah Lake TMDL: Pollutant Loading Assessment & Designated Beneficial Use Impairment Assessment; Department of Environmental Quality 2007.
  97. Telfer, J.T.; Brown, M.M.; Williams, G.P.; Tanner, K.B.; Miller, A.W.; Sowby, R.B.; Miller, T.G. Source Attribution of Atmospheric Dust Deposition to Utah Lake. Hydrology 2023, 10, 210. [Google Scholar] [CrossRef]
  98. US EPA. Consumer Factsheet on: Barium .
  99. US EPA. National Primary Drinking Water Regulations Availabe online: https://www.epa.gov/ground-water-and-drinking-water/national-primary-drinking-water-regulations (accessed on.
  100. Welch, A.H.; Westjohn, D.; Helsel, D.R.; Wanty, R.B. Arsenic in ground water of the United States: occurrence and geochemistry. Groundwater 2000, 38, 589–604. [Google Scholar] [CrossRef]
  101. Korte, M.S., N. E.; Fernando Ph.D., Q. A review of arsenic (III) in groundwater. Critical Reviews in Environmental Control 1991, 21, 1–39. [Google Scholar] [CrossRef]
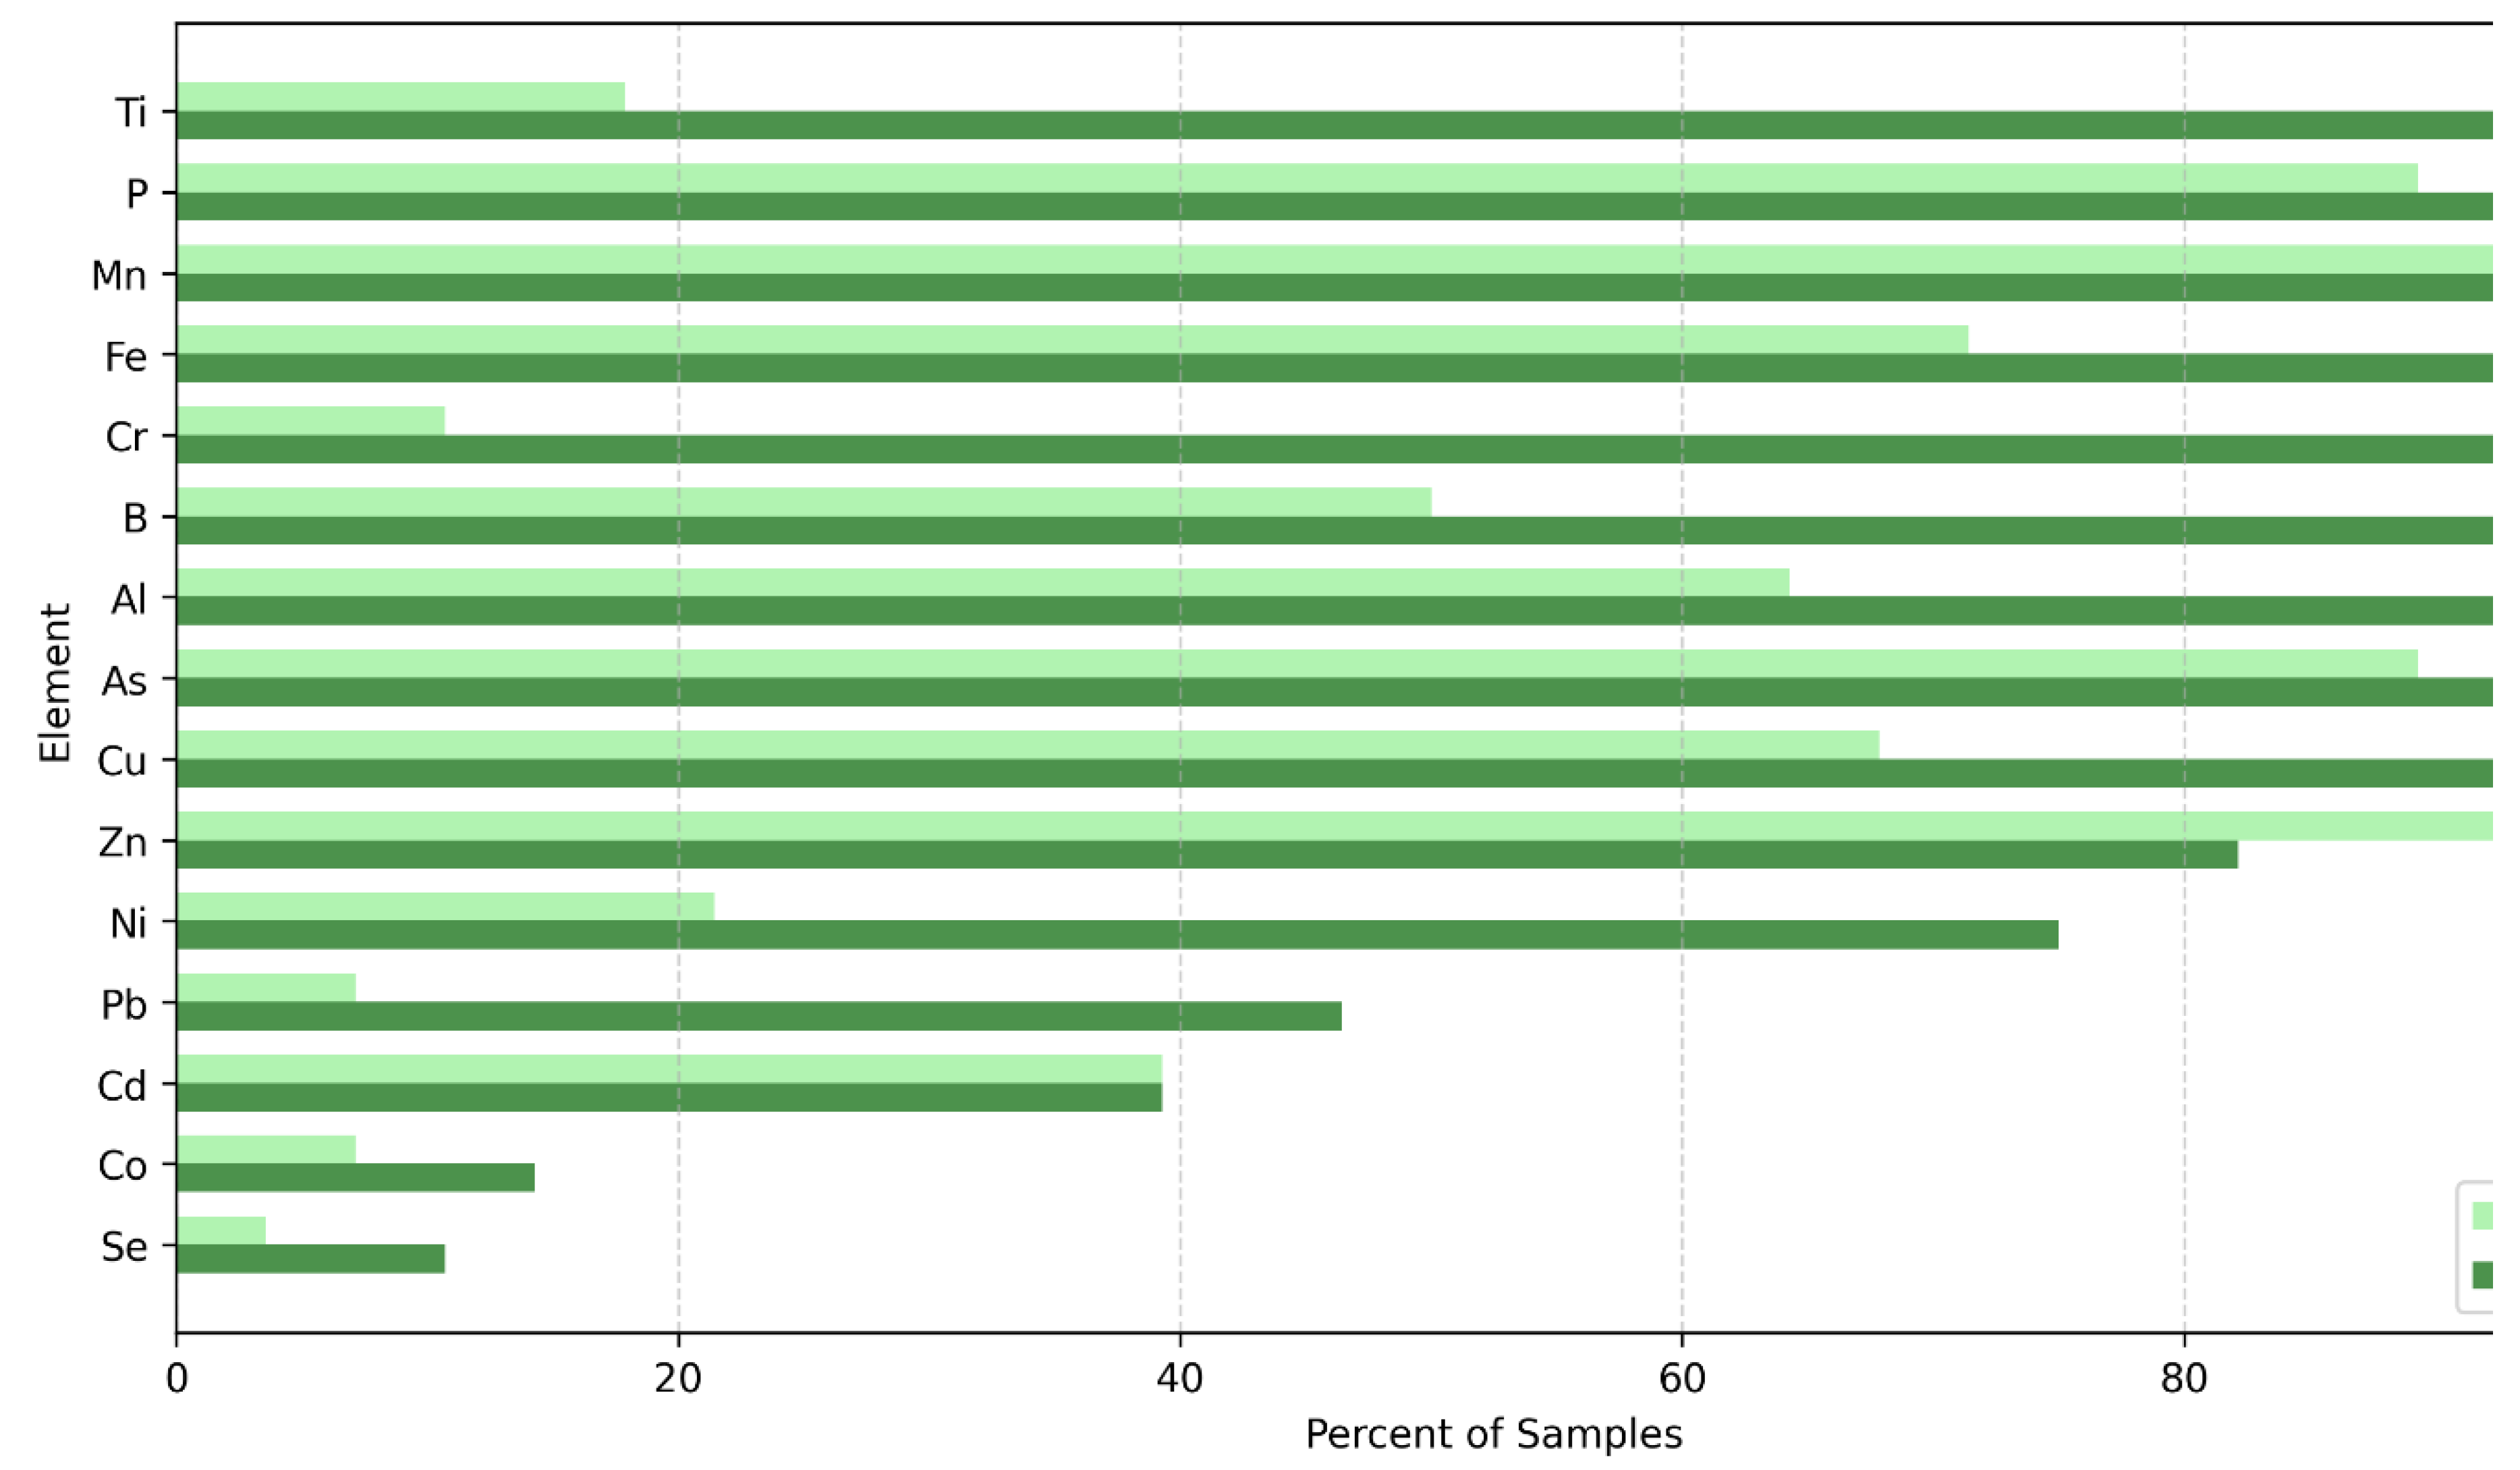
Figure 2. Percentage of samples for each ICP-OES analyte with measured concentrations above the MDL. Analytes with 100% detection in both filtered and unfiltered samples are excluded from the plot.
Preprints 111049 g002
Figure 3. Distributions of Cu grouped by year, 2021 (n=15) and 2022 (n=13); and phase, unfiltered (dark blue) and filtered (light blue). The plot includes reference lines for 0.013 mg/L (acute light green) and 0.009 (chronic dark green) regulatory values.
Preprints 111049 g003
Figure 4. Distributions of Zn grouped by year, 2021 (n=15) and 2022 (n=13); and phase, unfiltered (dark blue) and filtered (light blue). The plot includes reference lines for 0.12 mg/L (acute light green) and 0.12 mg/L (chronic dark green) regulatory values. The acute and chronic standards for Zn are the same.
Preprints 111049 g004
Figure 5. Distributions of Ni grouped by year, 2021 (n=15) and 2022 (n=13); and phase, unfiltered (dark blue) and filtered (light blue). The plot includes reference lines for 0.468 mg/L (acute light green) and 0.052 mg/L (chronic dark green) regulatory values.
Preprints 111049 g005
Figure 6. Distributions of Al grouped by year, 2021 and 2022; and phase, unfiltered (dark blue) and filtered (light blue) with reference lines for 0.75 mg/L (acute) and 0.75 mg/L (chronic) regulatory levels.
Preprints 111049 g006
Figure 7. Distributions of Pb grouped by year (Top Panel), 2021 (n=15) and 2022 (n=13); and phase, unfiltered (dark blue) and filtered (light blue) with reference lines for 0.065 mg/L (acute) and 0.0025 mg/L (chronic) regulatory levels; Pb data, grouped by year (Bottom Panel) with lines for the detection limit, the chronic regulatory level, and ½ the detection limit. There are only 2 data points above detection limits, with 2 at detection limits.
Preprints 111049 g007
Figure 8. Distributions of P grouped by year, 2021 and 2022; and phase, unfiltered (dark blue) and filtered (light blue) with reference lines for 0.025 mg/L (acute) and 0.025 mg/L (chronic) regulatory levels.
Preprints 111049 g008
Figure 9. Distributions of Ba grouped by year, 2021 and 2022; and phase, unfiltered (dark blue) and filtered (light blue).
Preprints 111049 g009
Figure 10. Annual trend in unfiltered (total) arsenic (As).
Preprints 111049 g010
Table 1. Most stringent applicable standard for each regulated element in UL.
DE Acute Standard
(mg/L)
Chronic Standard (mg/L) Designated Use
*Aluminum (Al) 0.75 0.75 3B, 3D
**Arsenic (As) 0.10 0.10 4
**Boron (B) 0.75 0.75 4
Cadmium (Cd) 0.0018 0.00072 3B, 3D
***Chromium (Cr) (Hexavalent) 0.016 0.011 3B, 3D
Copper (Cu) 0.013 0.009 3B, 3D
**Iron (Fe) 1 1 3B, 3D
Nickel (Ni) 0.468 0.052 3B,3D
*Phosphorus (P) 0.025 0.025 3B
Lead (Pb) 0.065 0.0025 3B, 3D
Selenium (Se) 0.0184 0.0046 3B, 3D
Zinc (Zn) 0.12 0.12 3B, 3D
* Concentration based on total recovery criteria
**Measured as maximum not acute and chronic
***We measured elemental Cr, not hexavalent
Table 2. Lab analytes and methods.
Analyte Model/Method Equipment
DE Total (digested) EPA 3015A Thermo Scientific™ 7400 ICP-OES
DE Dissolved (filtered) 0.45 µ filter Thermo Scientific™ 7400 ICP-OES
Table 3. ICP-OES minimum detection limits (MDLs).
Analyte Detection Limit (µg/L) Analyte Detection Limit (µg/L)
Aluminum (Al) 1.51 Molybdenum (Mo) 1.11
Arsenic (As) 4.74 Sodium (Na) 1.80
Boron (B) 1.26 Nickel (Ni) 2.29
Barium (Ba) 0.17 Phosphorus (P) 5.66
Calcium (Ca) 0.02 Lead (Pb) 4.50
Cadmium (Cd) 0.19 Sulfur (S) 2.22
Cobalt (Co) 1.16 Selenium (Se) 7.36
Chromium (Cr) 0.85 Silicon (Si) 7.20
Copper (Cu) 2.36 Strontium (Sr) 0.04
Iron (Fe) 0.80 Titanium (Ti) 0.58
Potassium (K) 5.10 Vanadium (V) 0.80
Magnesium (Mg) 0.04 Zinc (Zn) 0.60
Manganese (Mn) 0.21
Disclaimer/Publisher’s Note: The statements, opinions and data contained in all publications are solely those of the individual author(s) and contributor(s) and not of MDPI and/or the editor(s). MDPI and/or the editor(s) disclaim responsibility for any injury to people or property resulting from any ideas, methods, instructions or products referred to in the content.
Copyright: This open access article is published under a Creative Commons CC BY 4.0 license, which permit the free download, distribution, and reuse, provided that the author and preprint are cited in any reuse.
Prerpints.org logo

Preprints.org is a free preprint server supported by MDPI in Basel, Switzerland.

Subscribe

© 2024 MDPI (Basel, Switzerland) unless otherwise stated