Submitted:
03 July 2024
Posted:
04 July 2024
You are already at the latest version
Abstract
Keywords:
1. Introduction
2. Materials and Methods
2.1. Podocyte Culture and Treatment
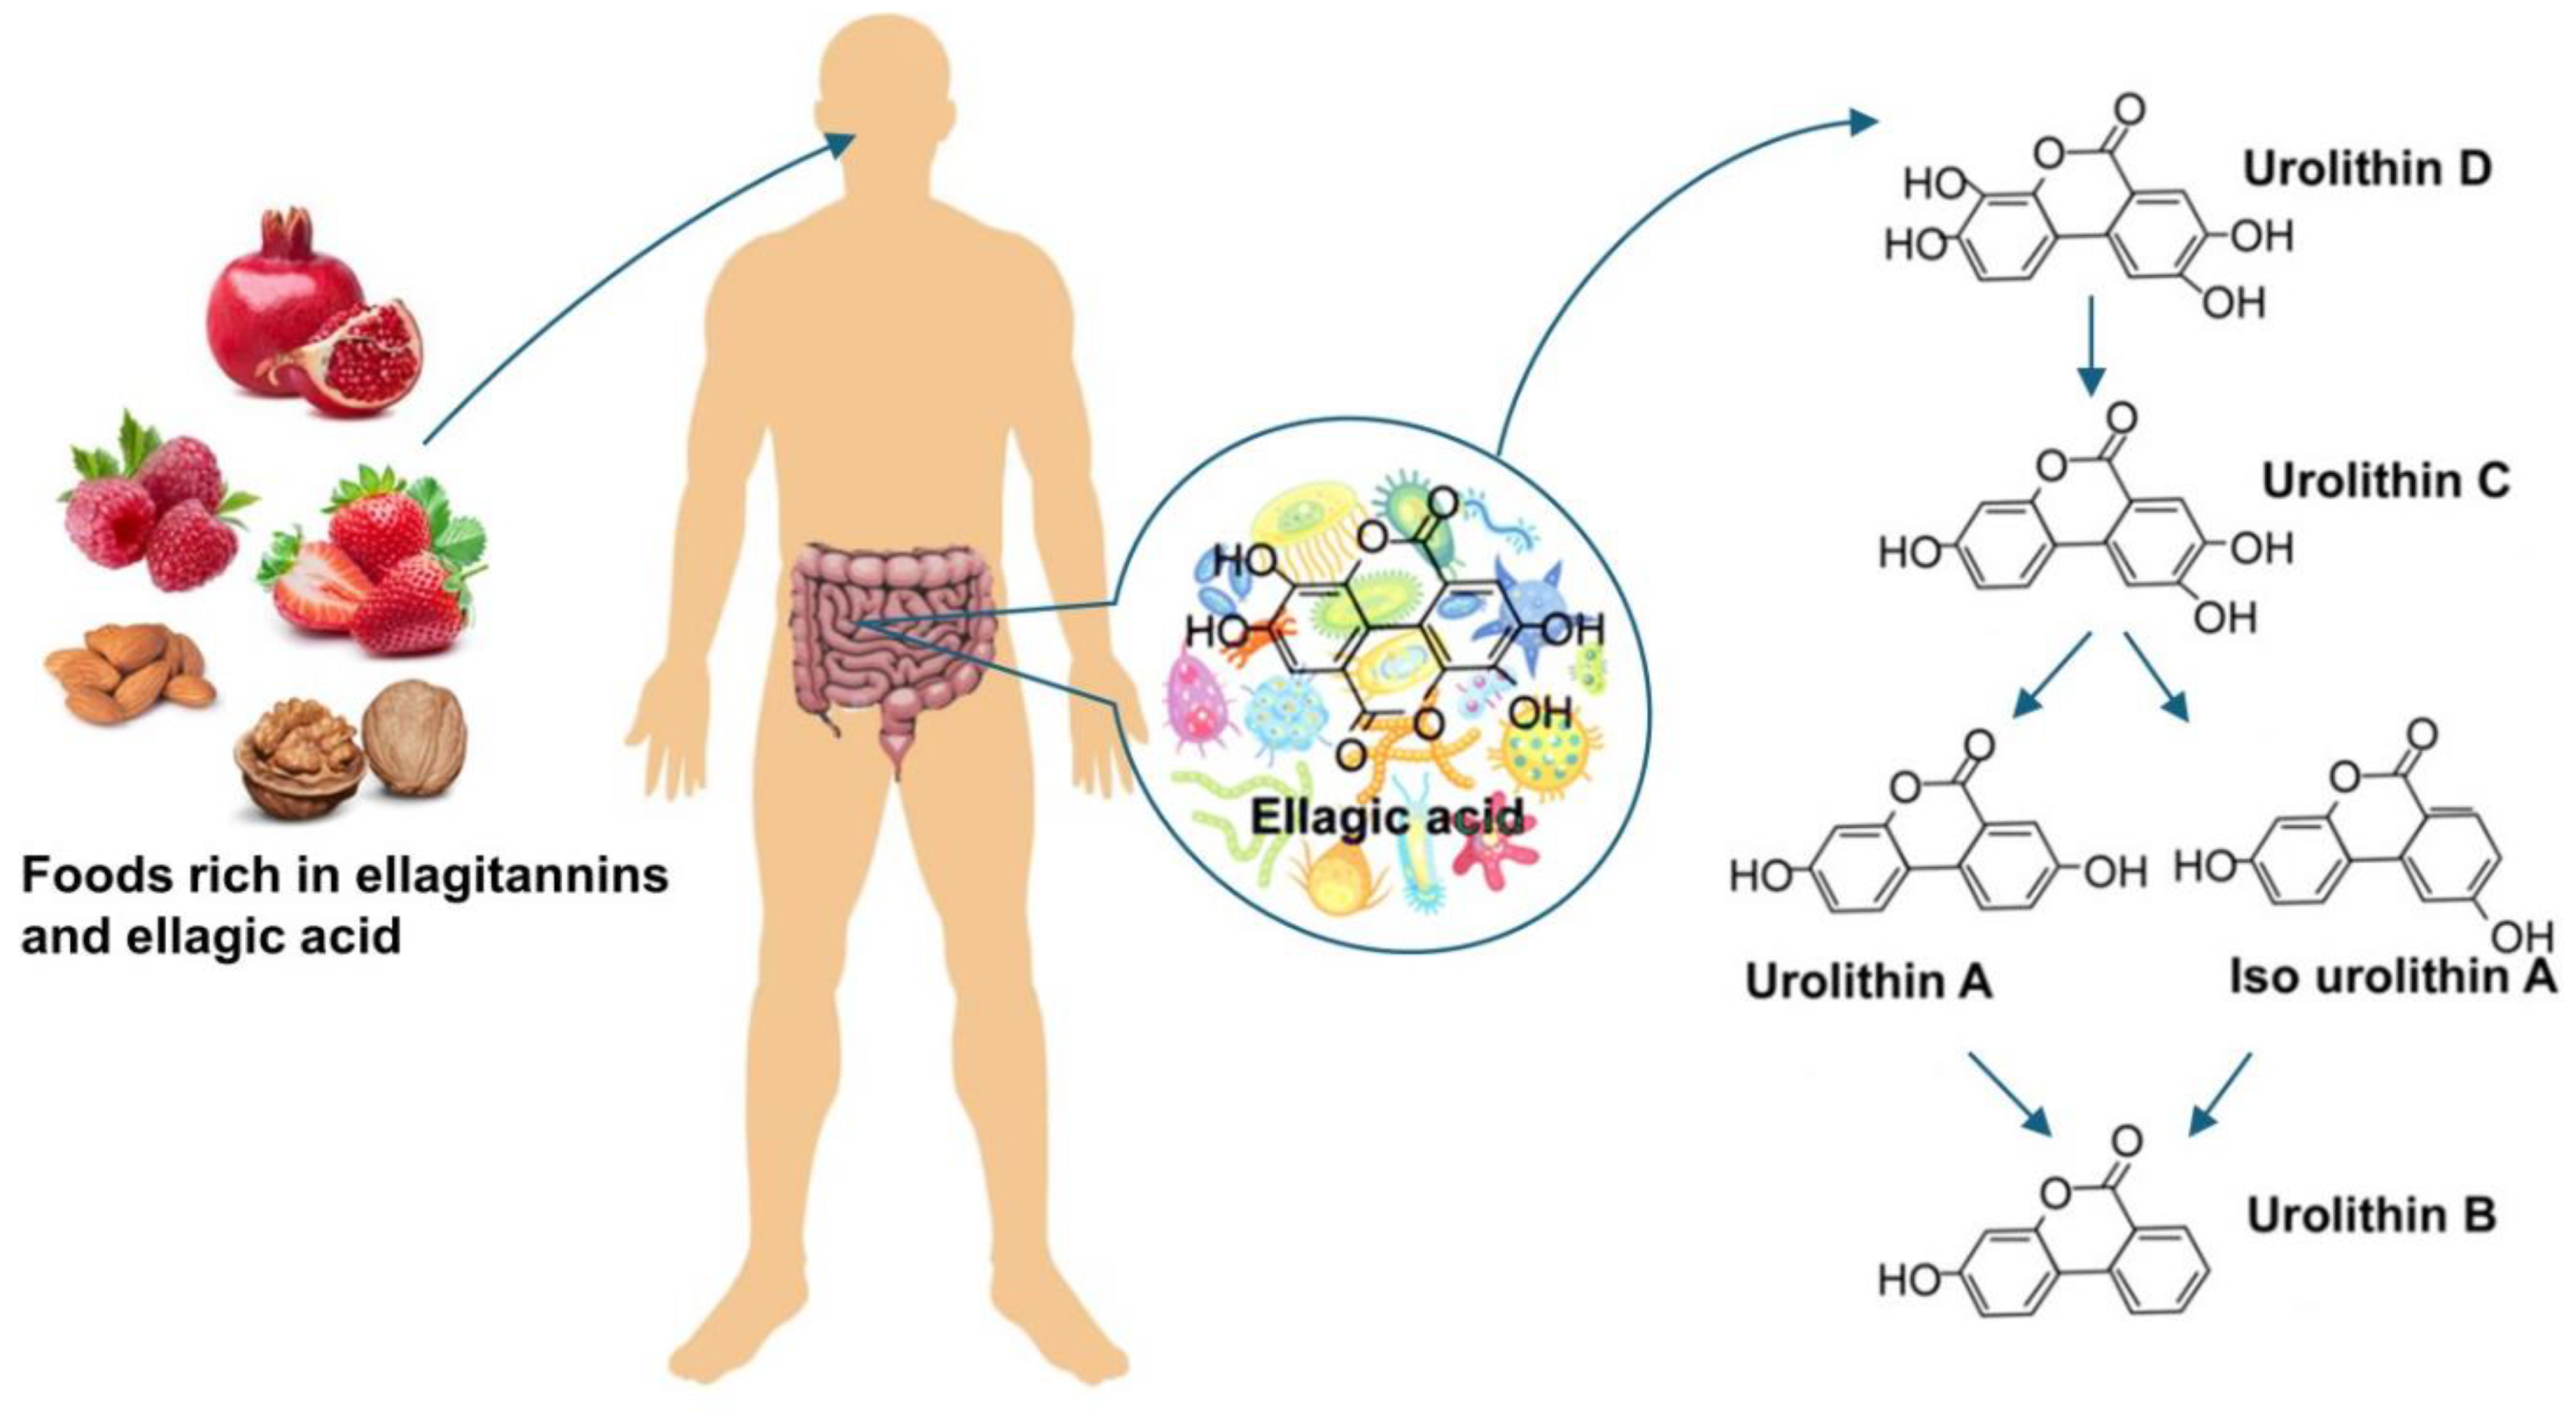
2.2. Urolithin A
2.3. Podocyte Migration Assay
2.4. Immunofluorescence Staining and Confocal Microscopy
2.5. RNA isolation and Reverse Transcription-Quantitative Polymerase Chain Reaction (RT-qPCR)
2.6. Protein Extraction and Western Blot Analysis
2.7. Flow Cytometry Analysis
2.8. Statistical Analyses
3. Results
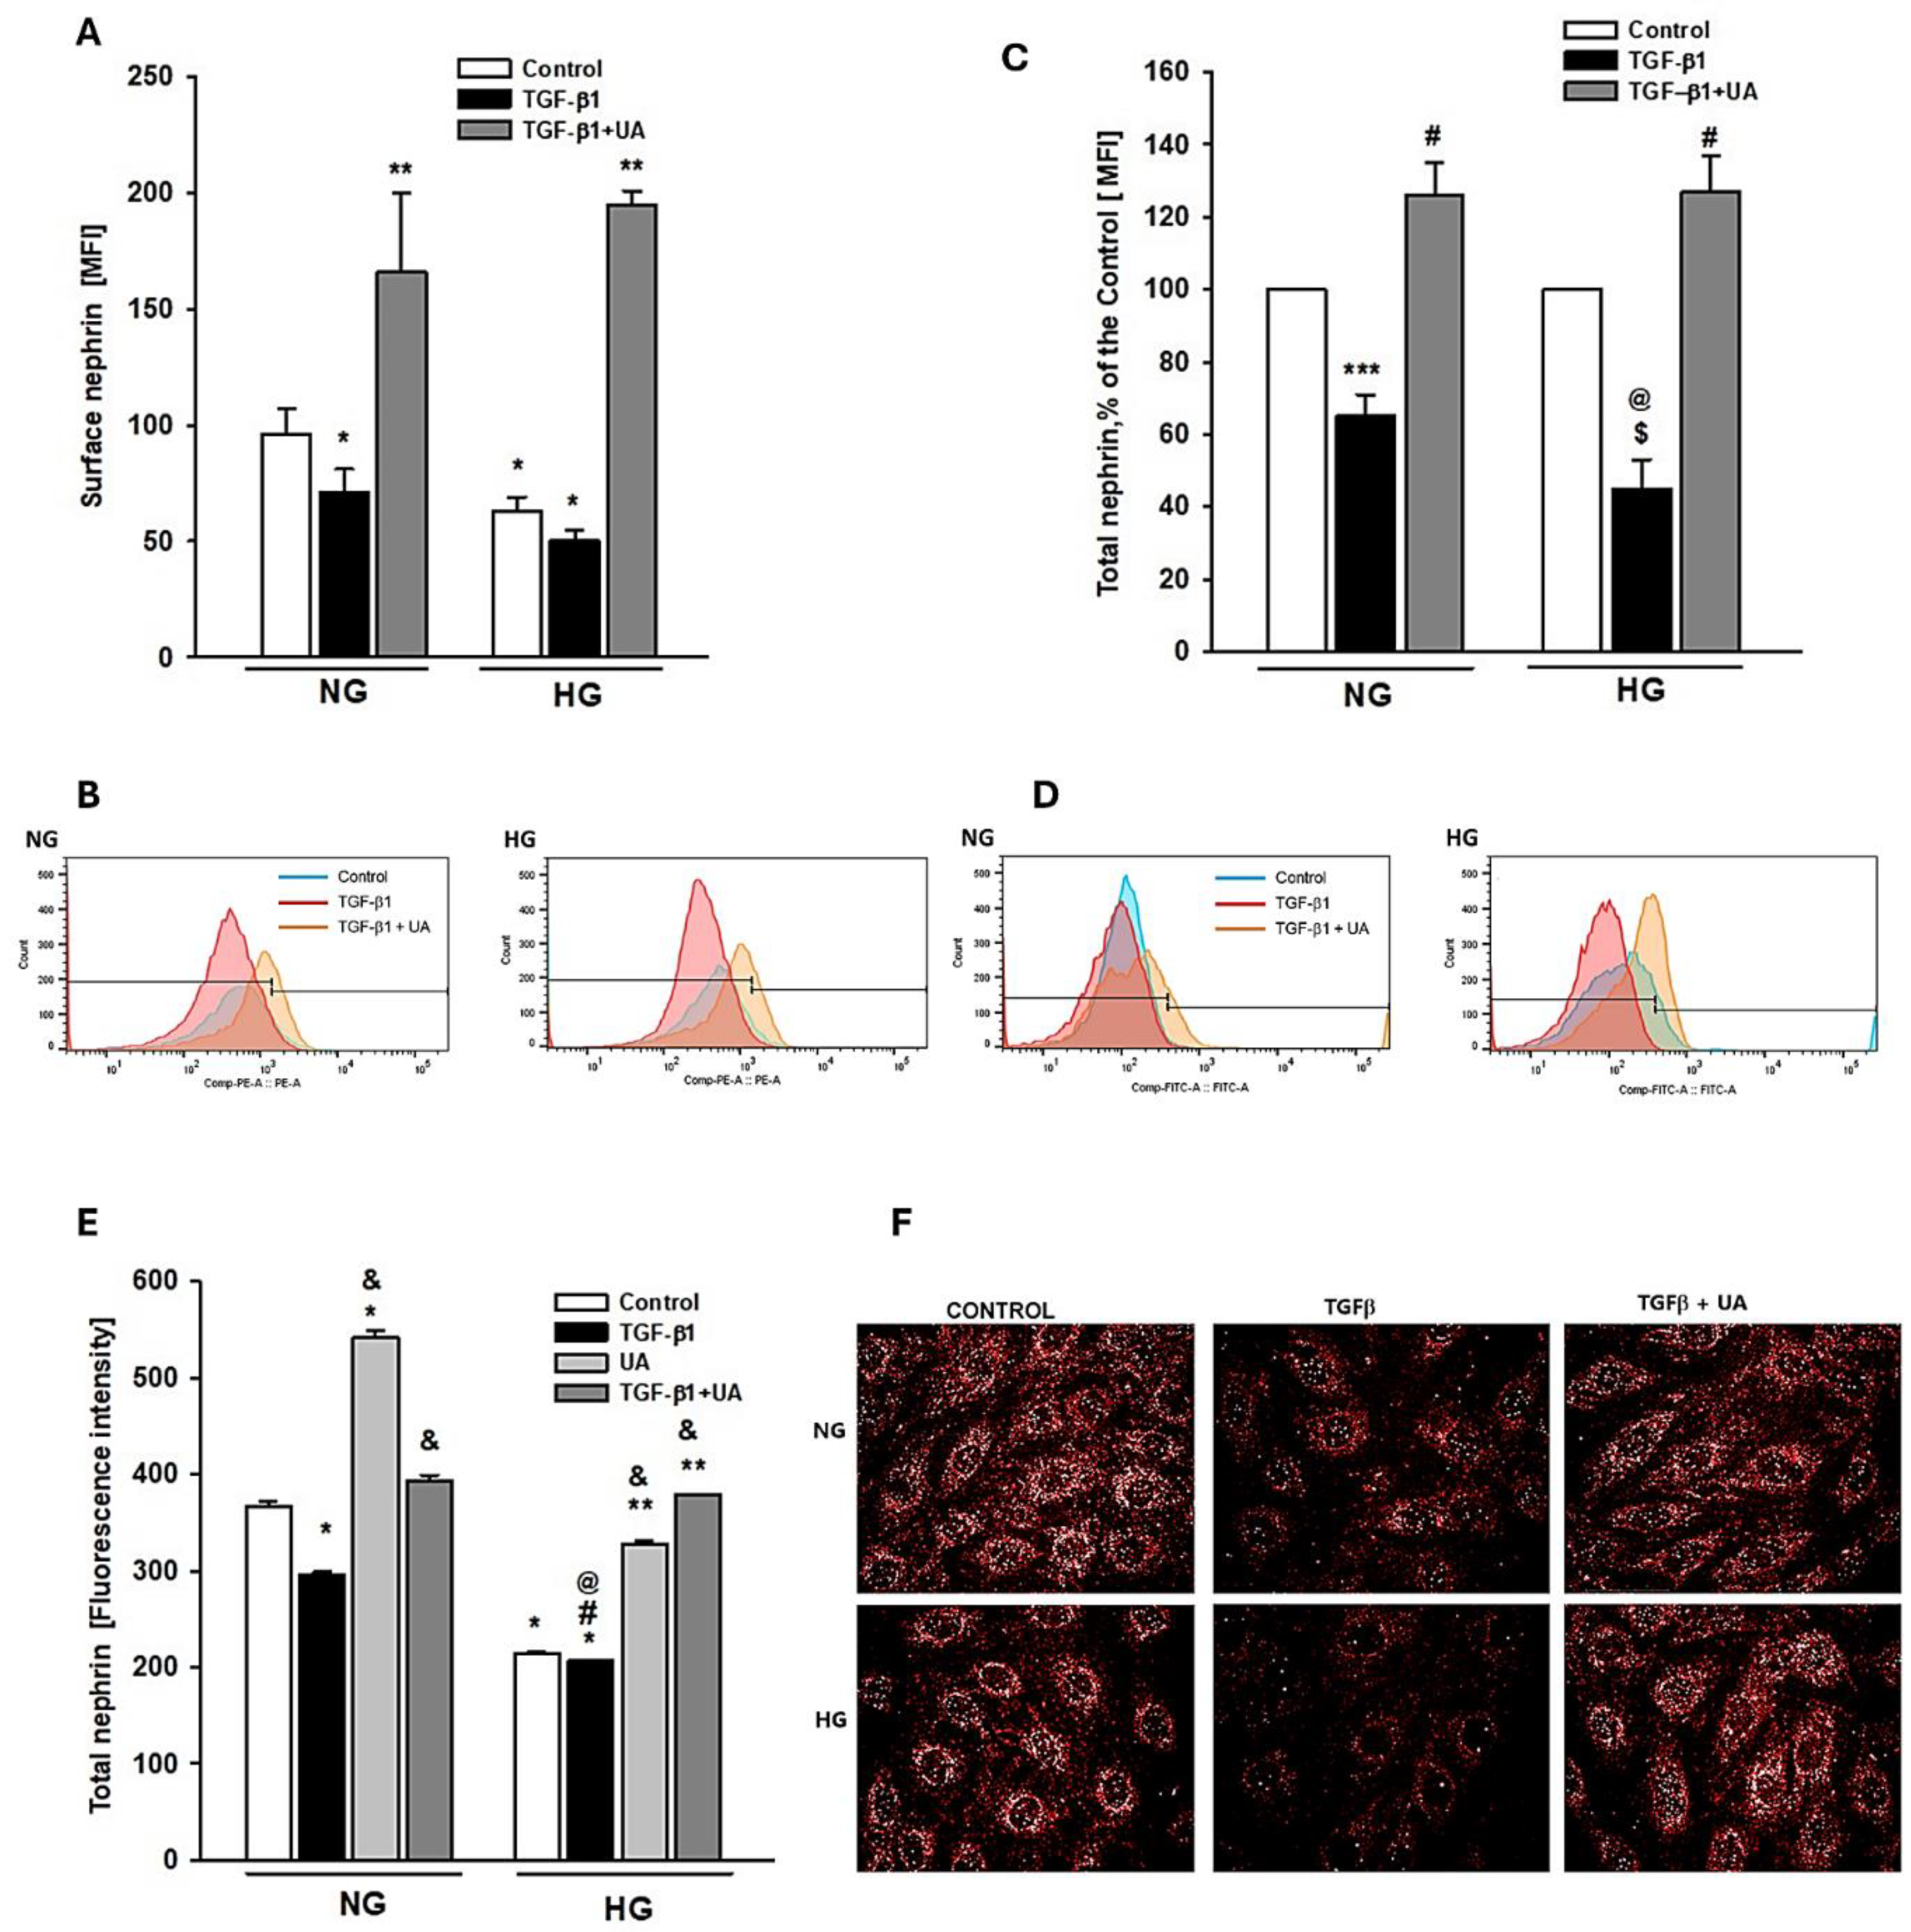
3.1. Urolithin A Inhibits the TGF-β1 -Induced Downregulation of Nephrin
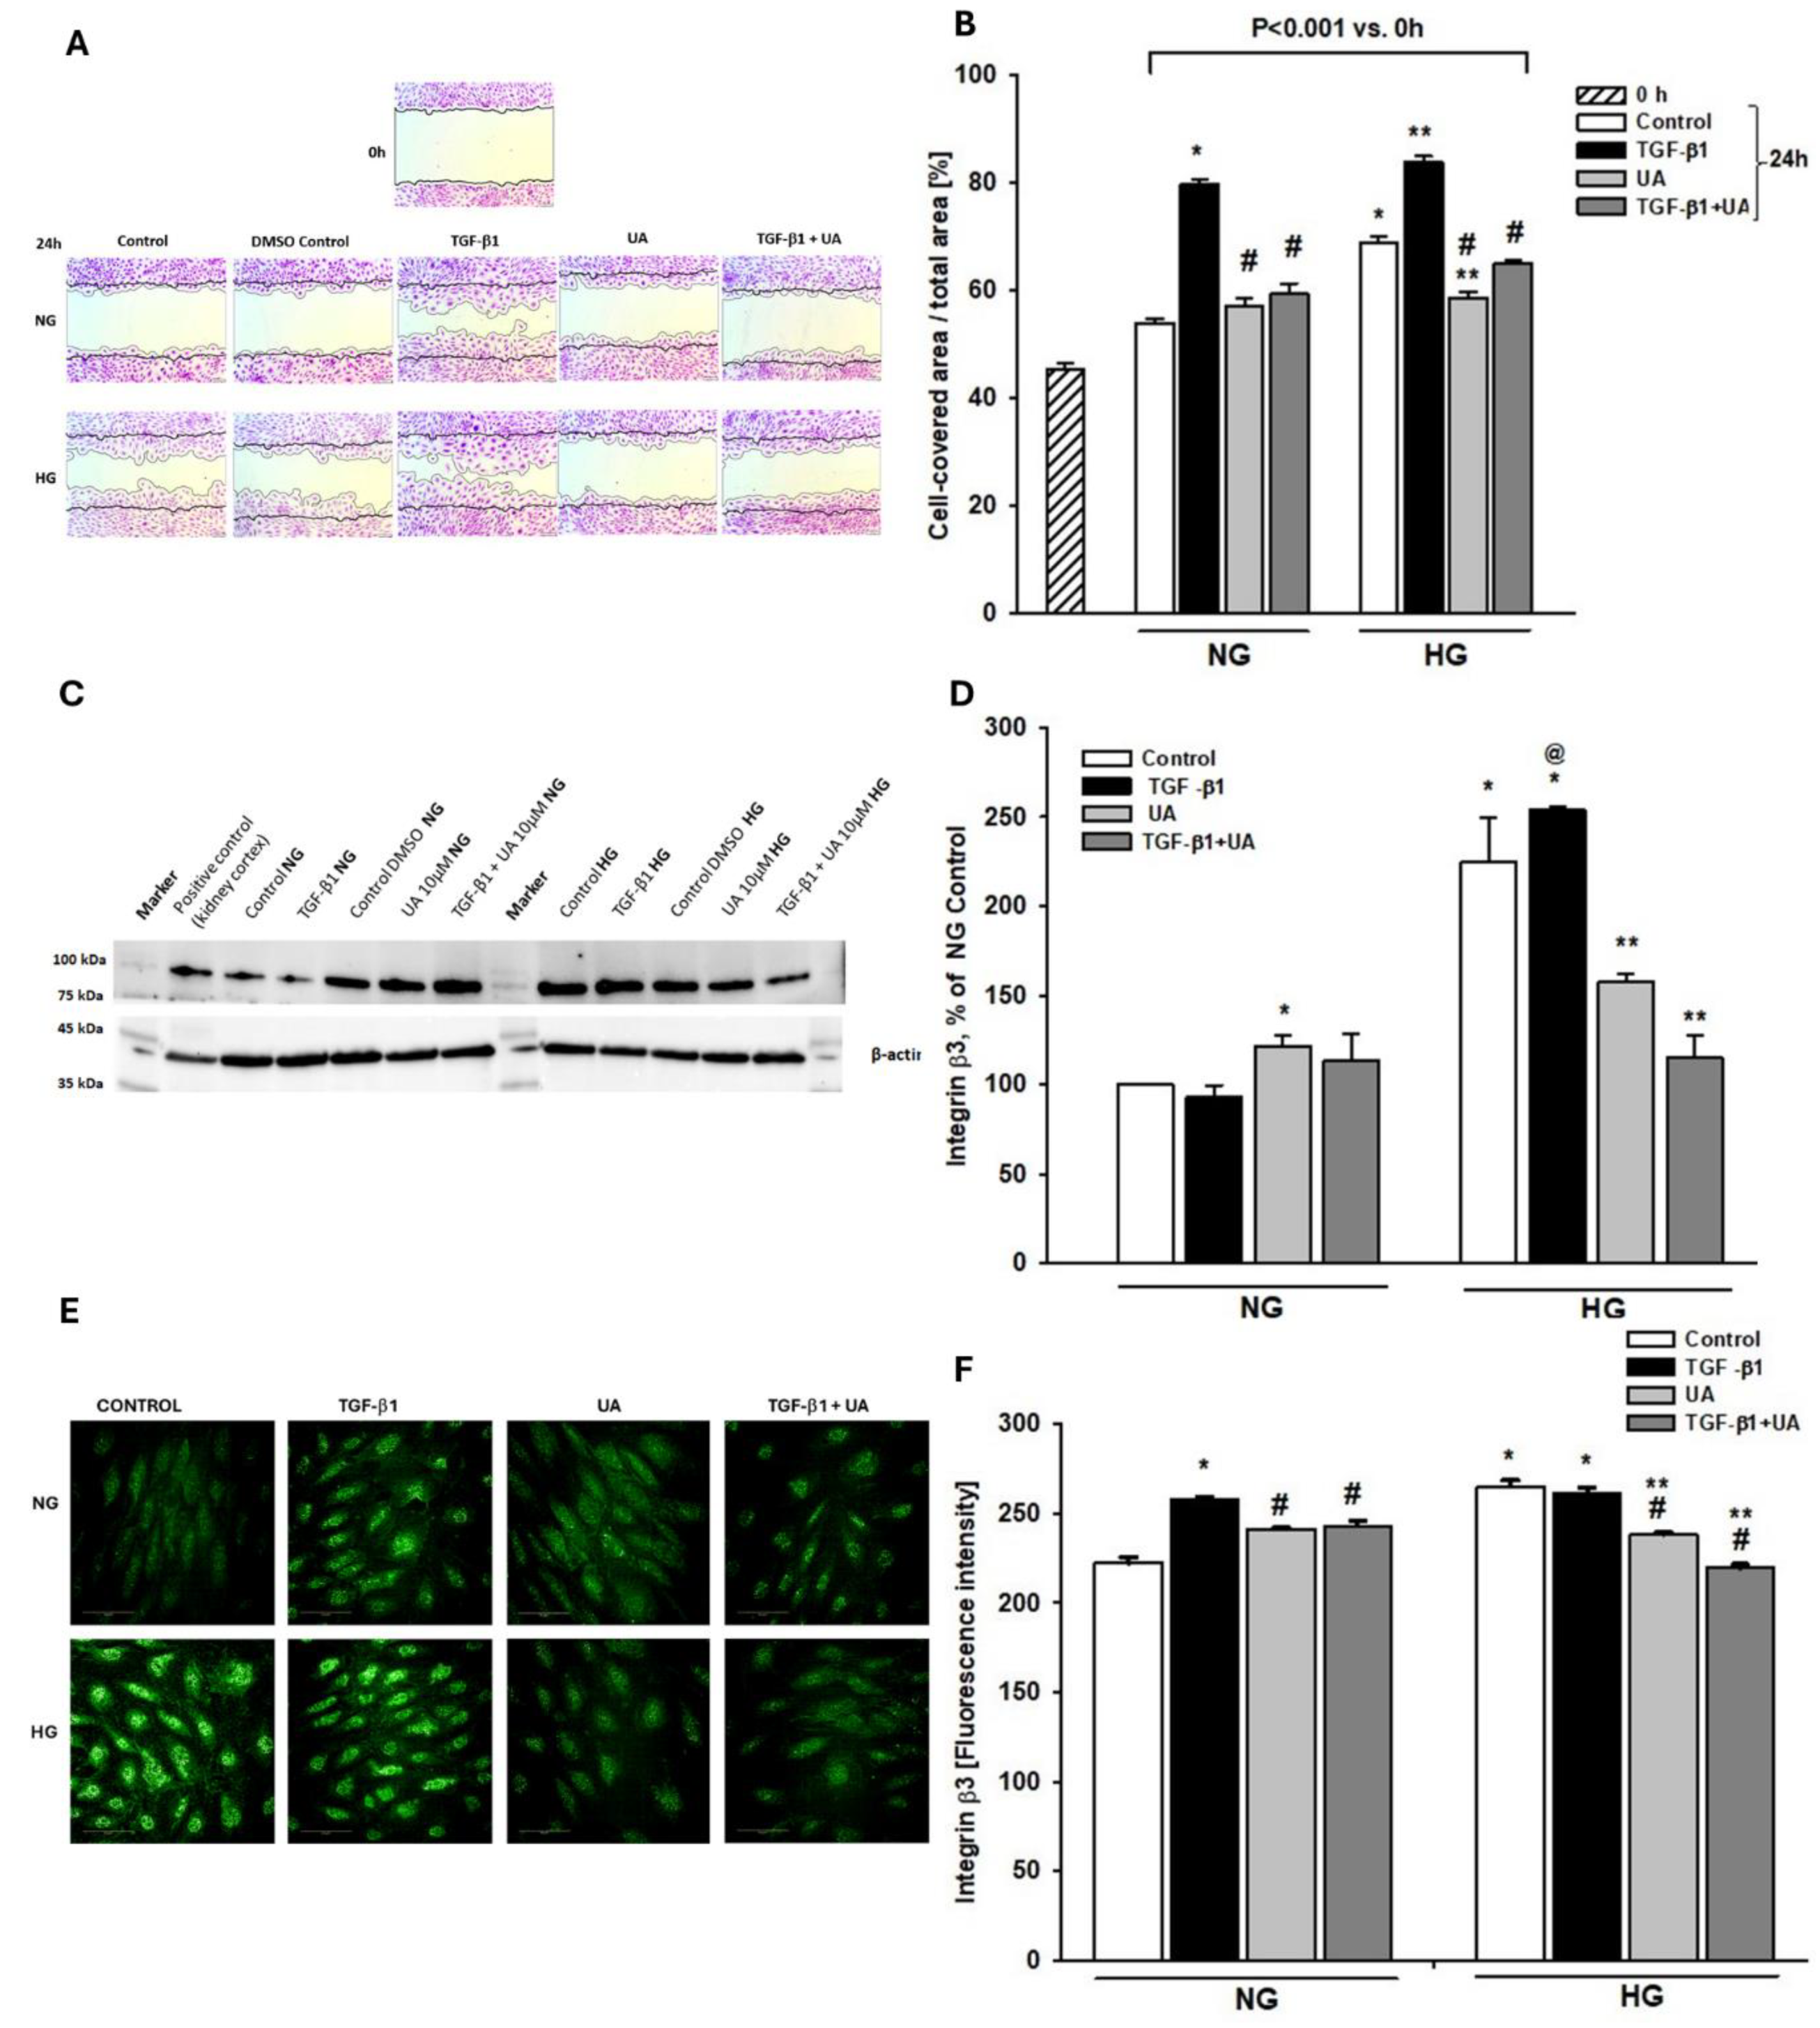
3.2. Urolithin A Inhibits Induced by High Glucose and TGF-β1 Migration of Podocytes
3.3. Integrin β3 Expression is Modulated by Urolithin A
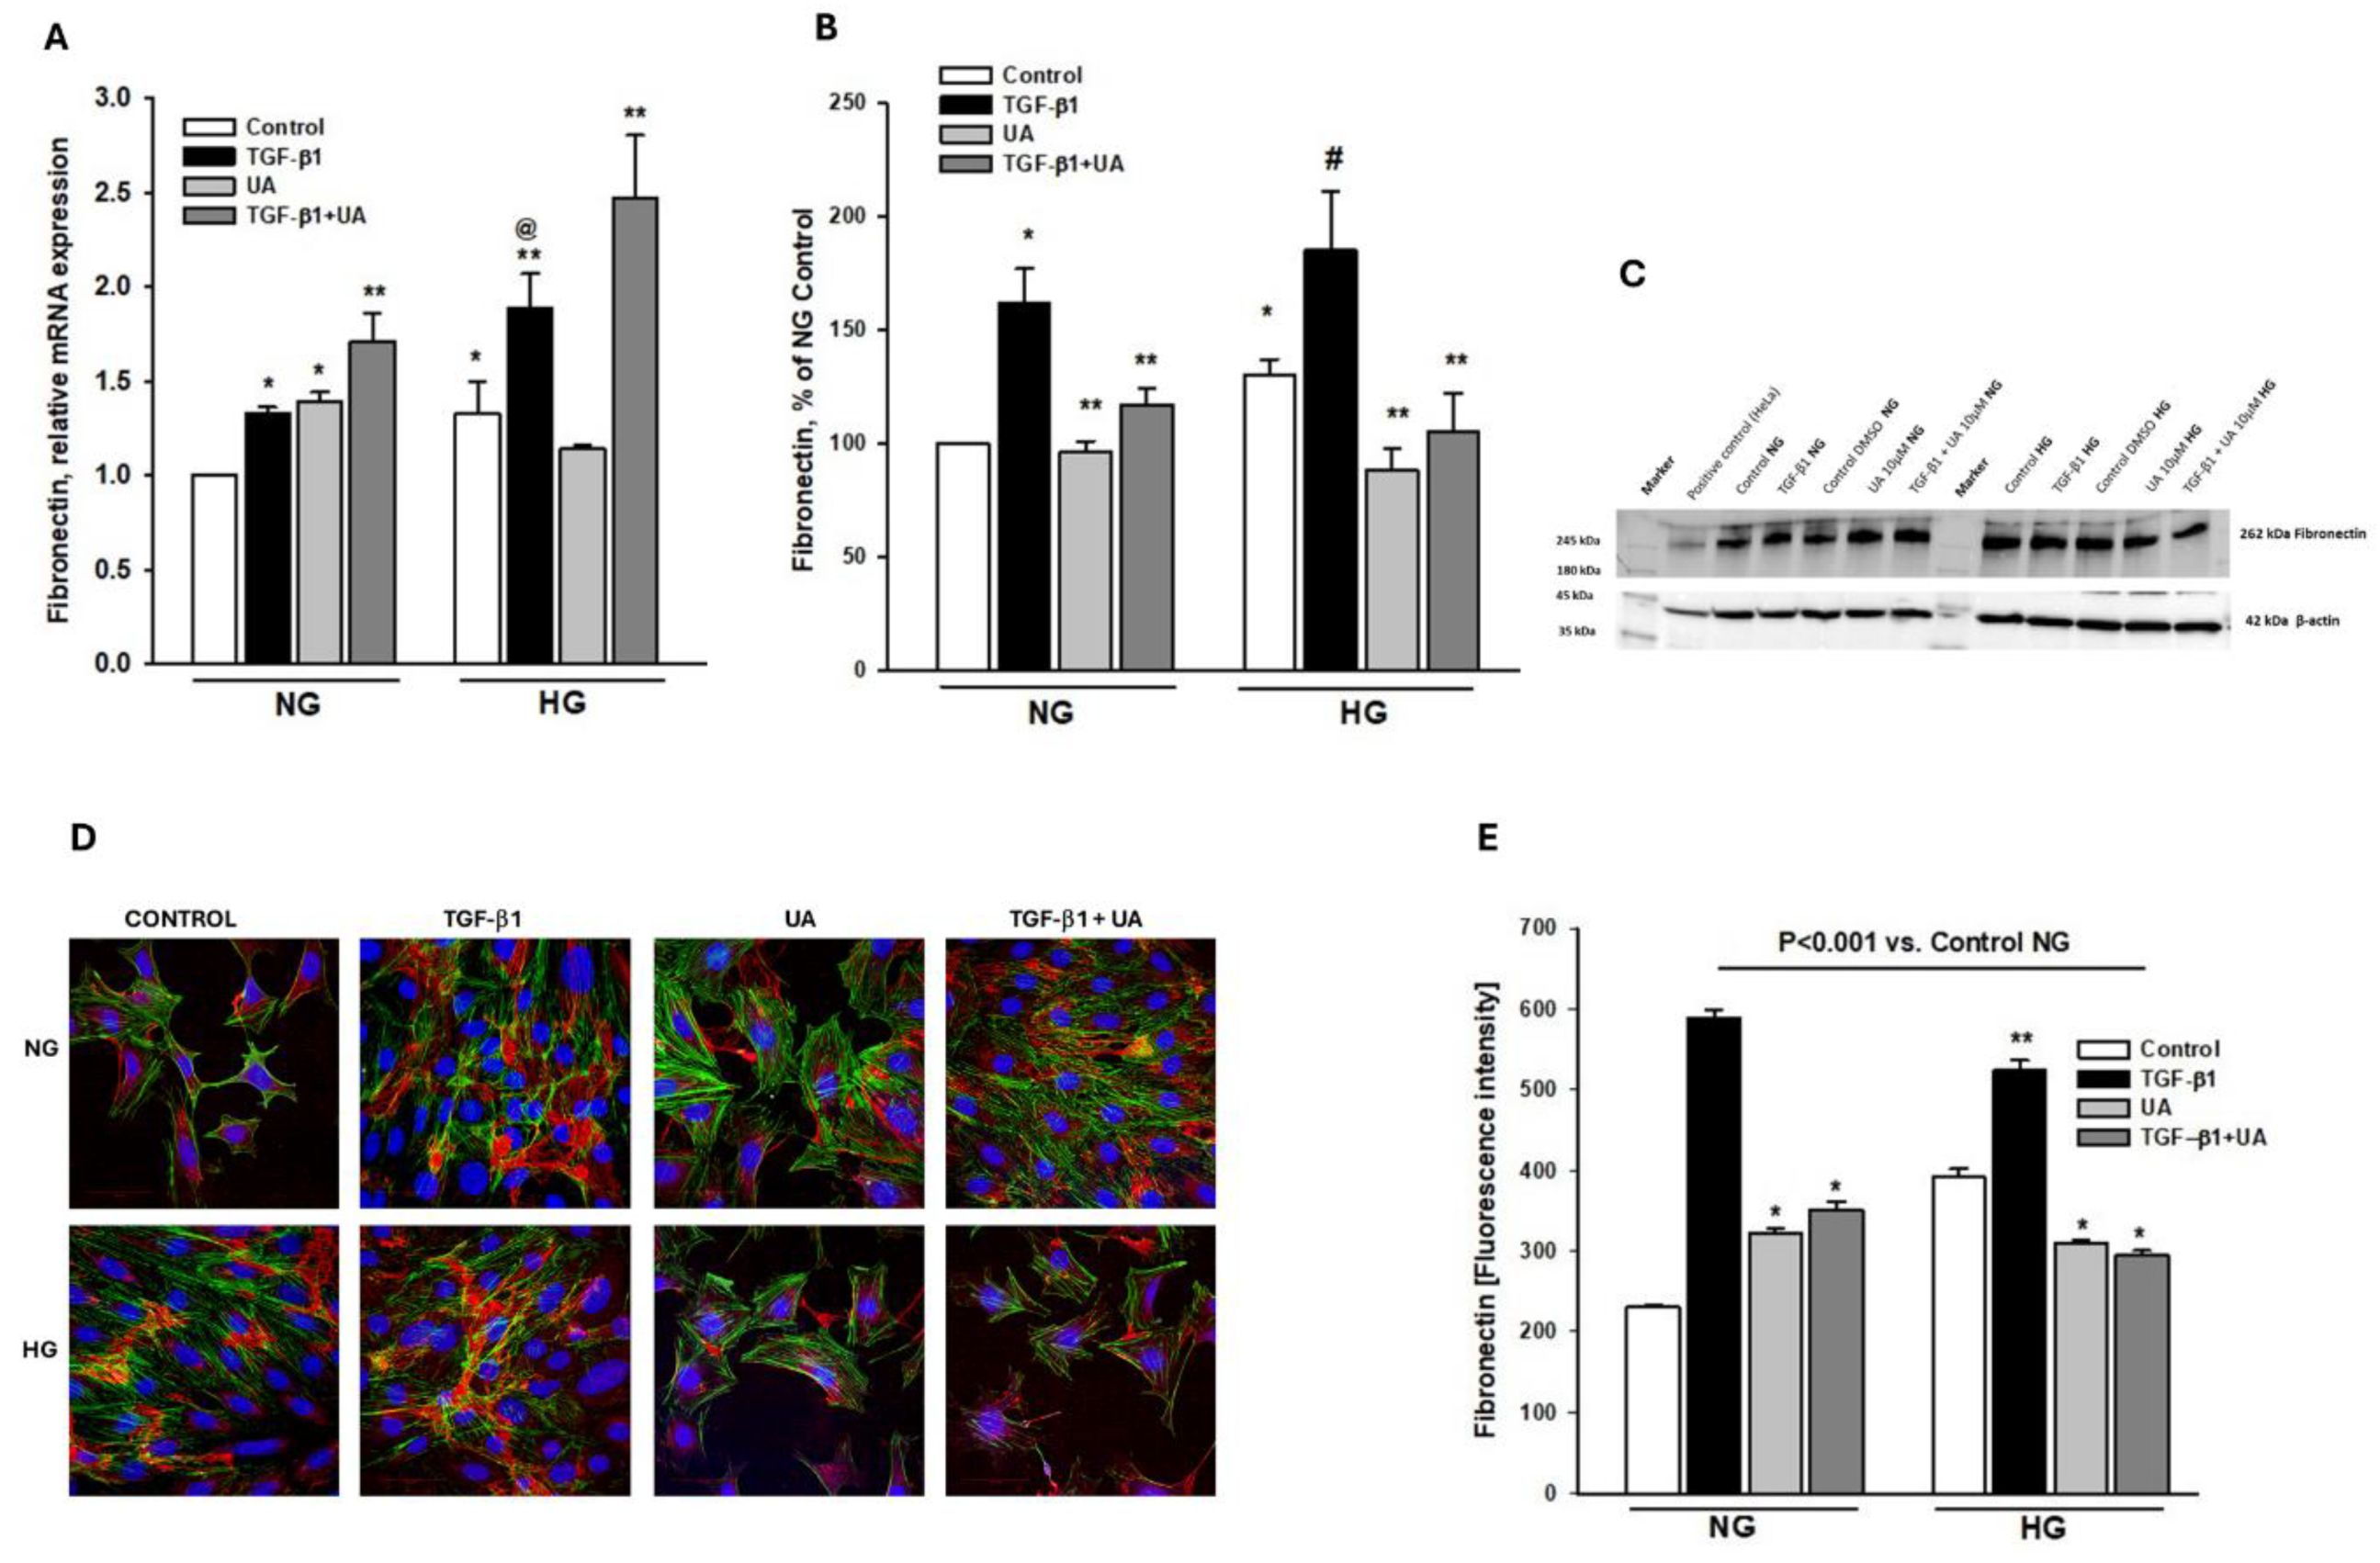
3.4. Urolithin A Modulates Fibronectin Expression
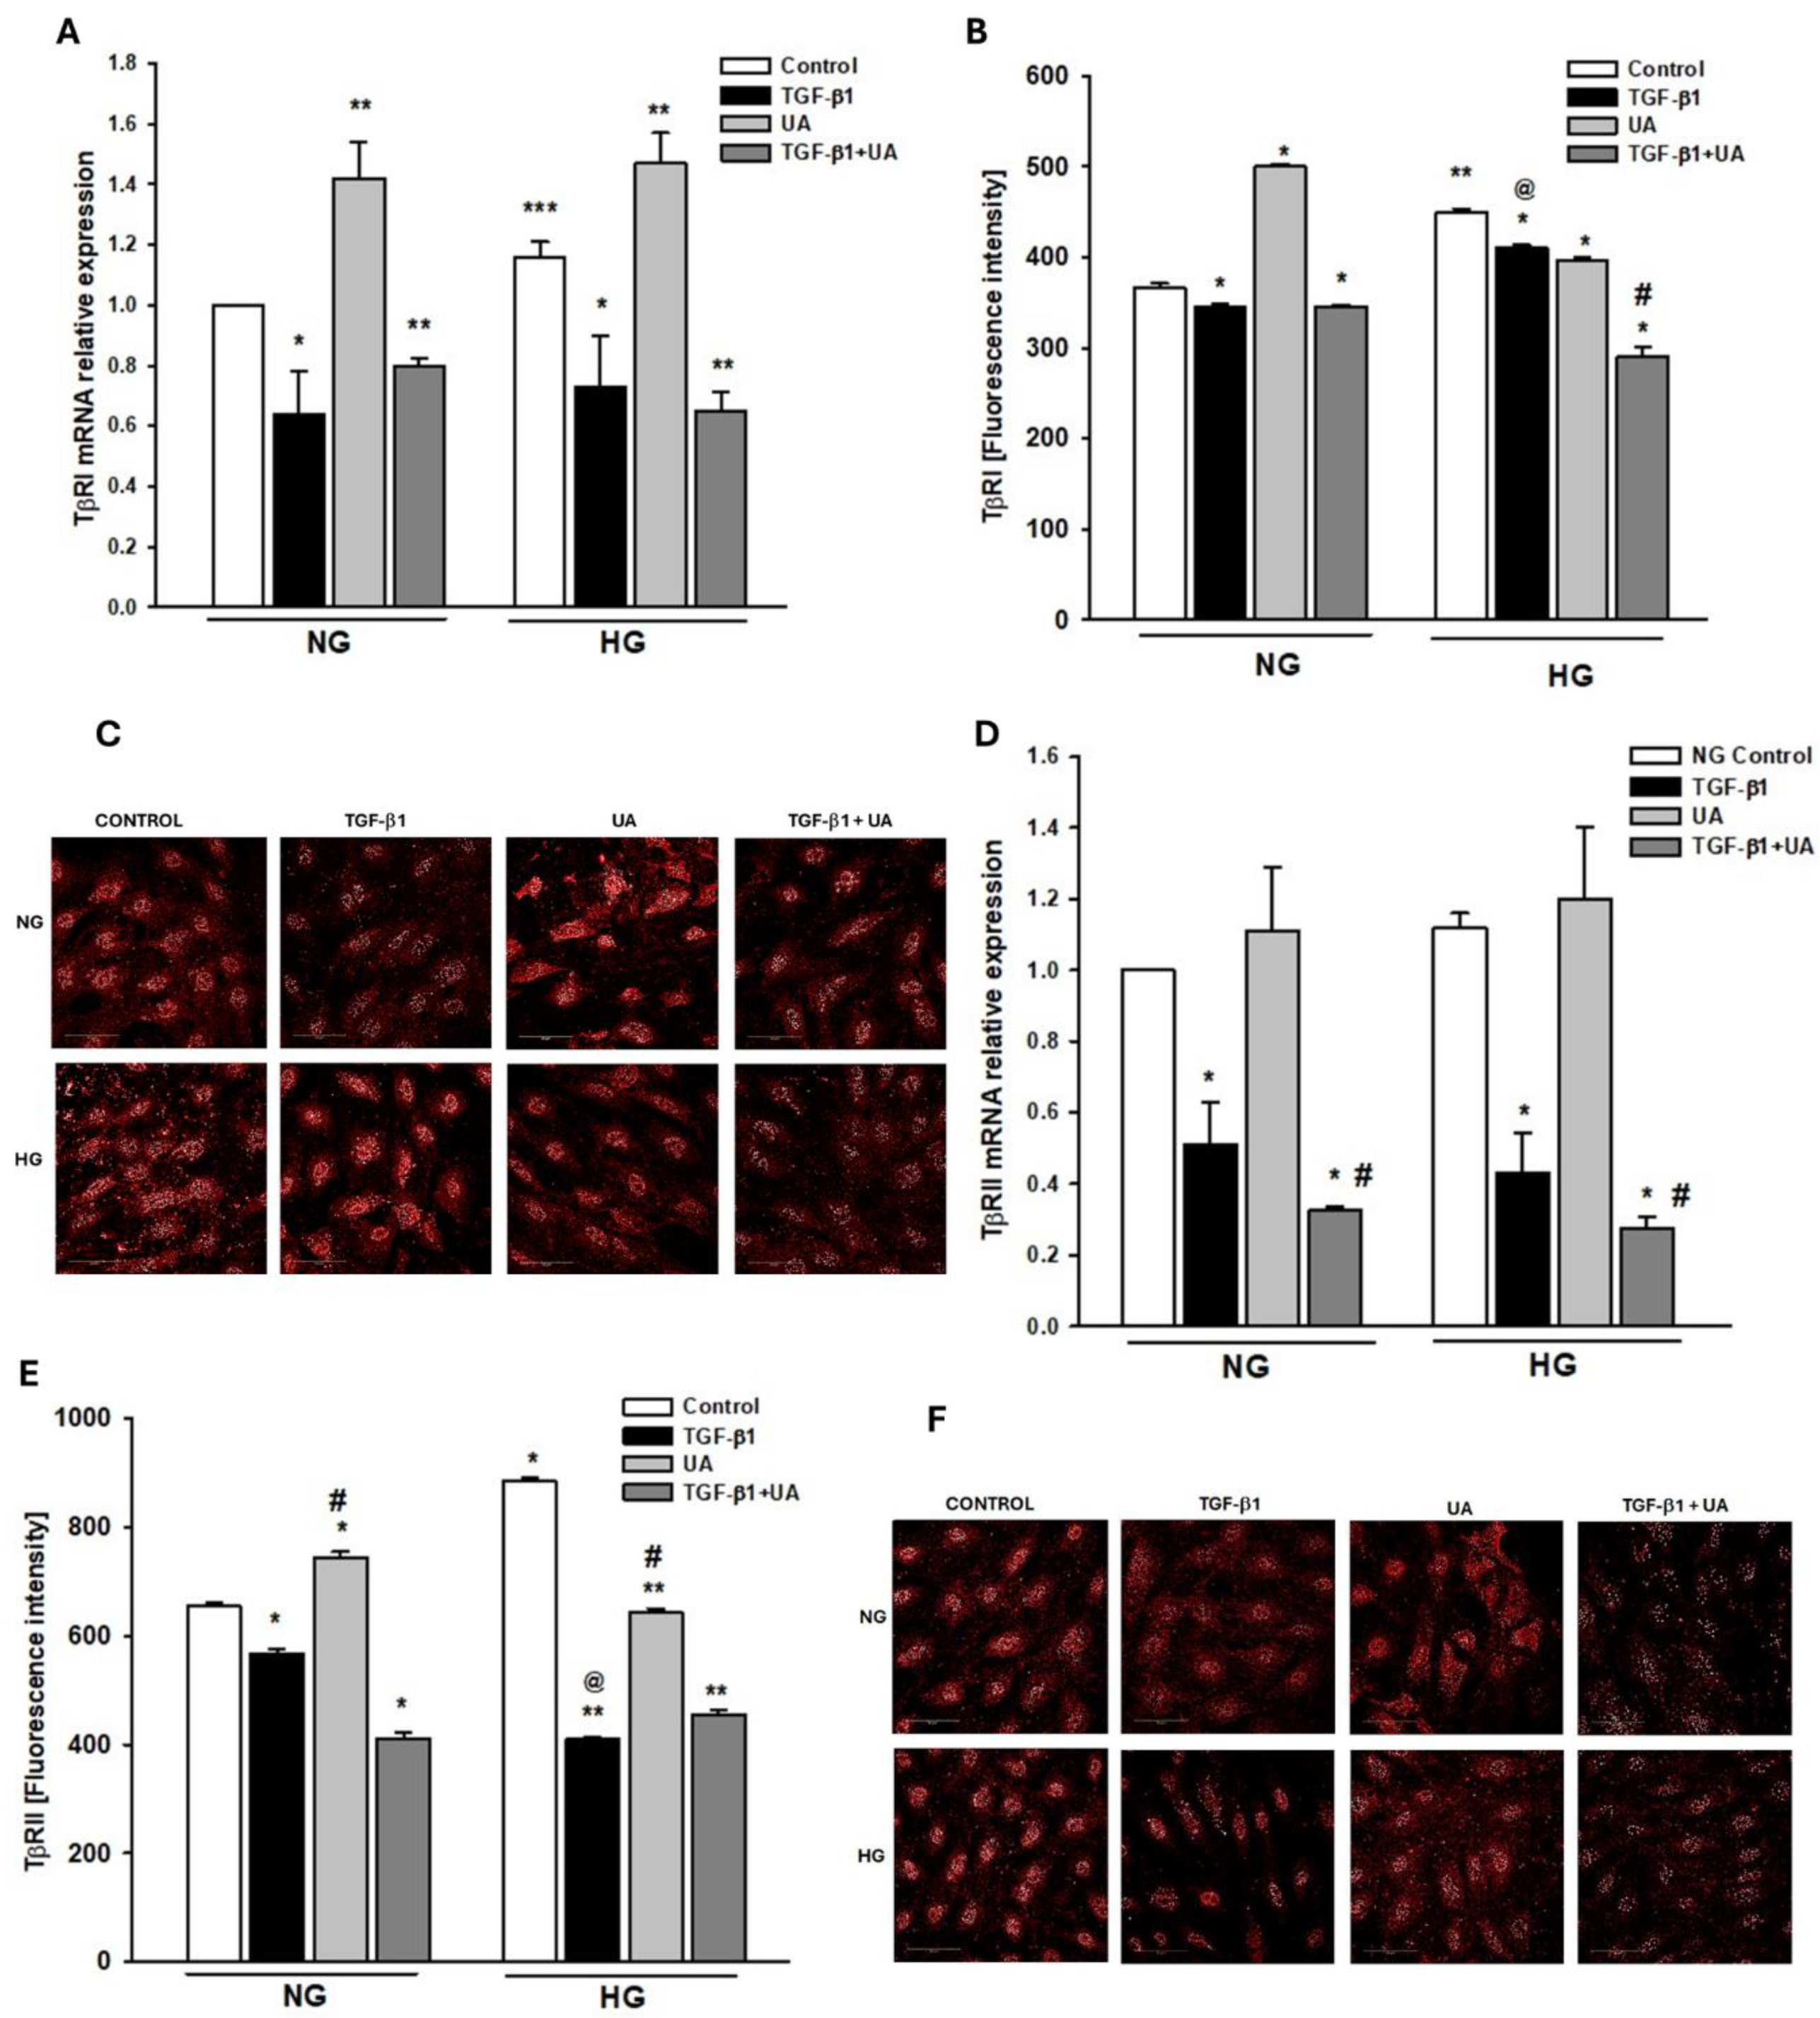
3.5. Urolithin A Affects the Expression of TGF-β Receptors
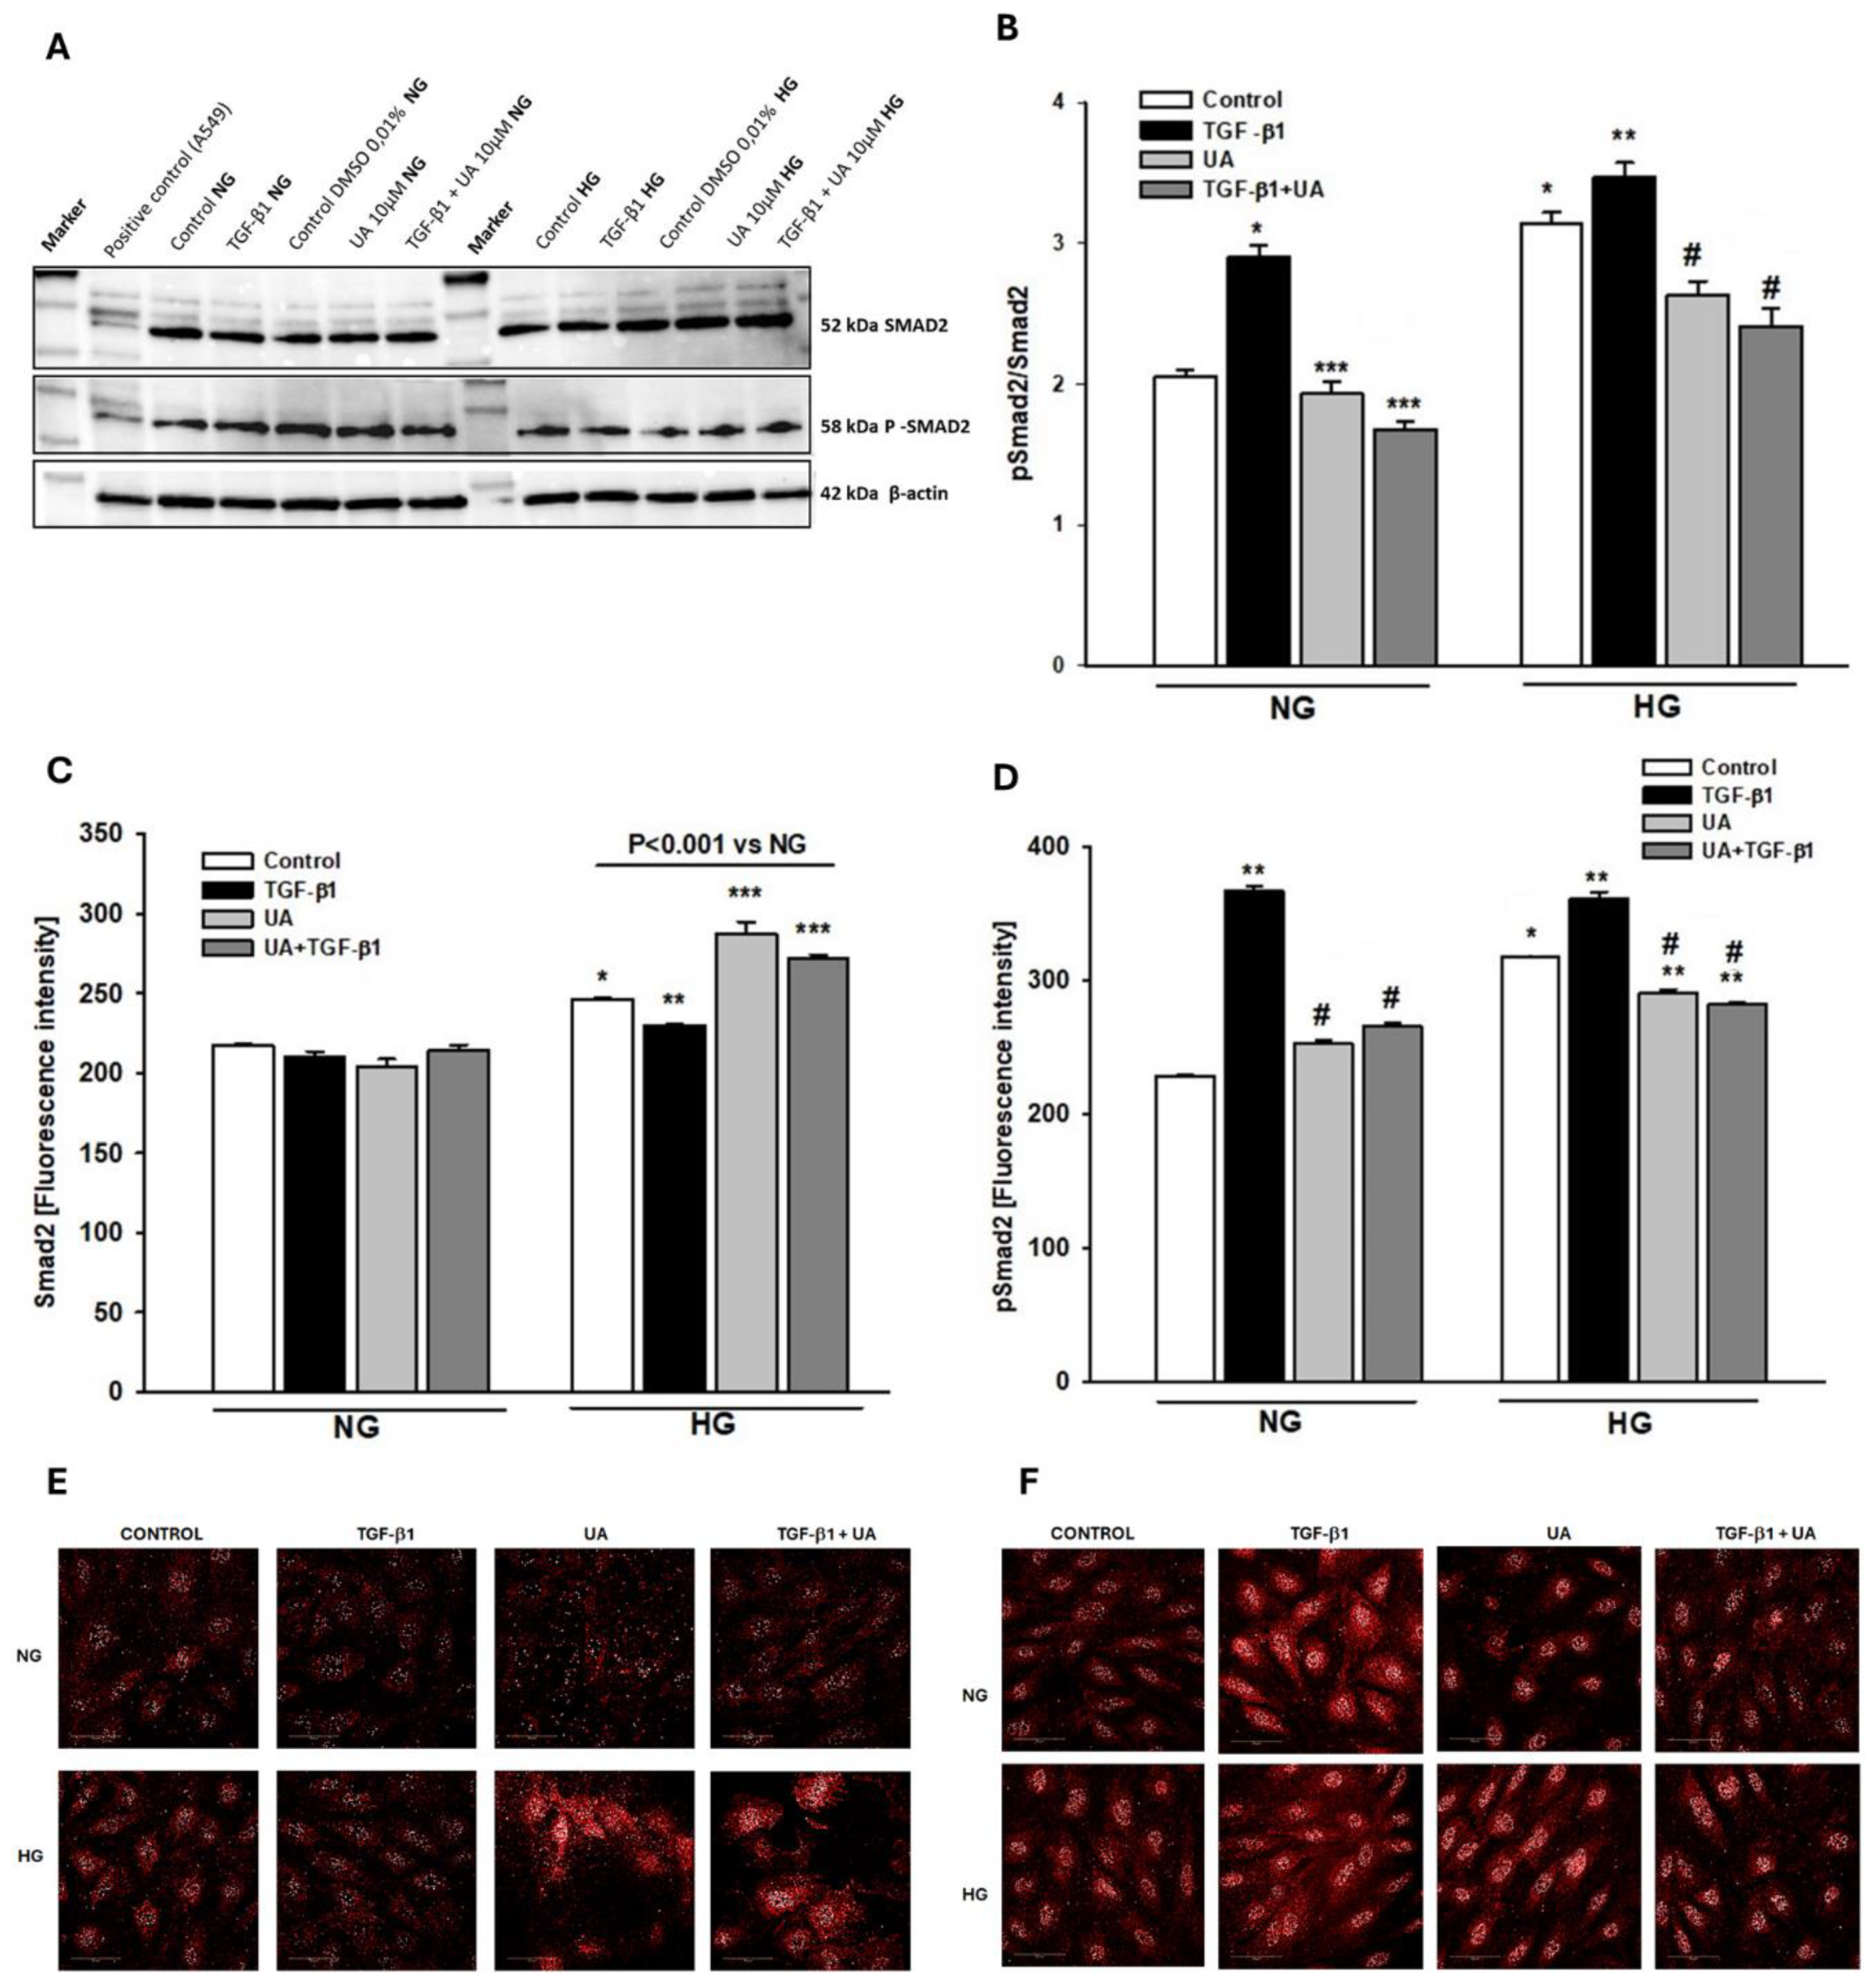
3.6. Urolithin A Reduces the TGF-β1-Dependent Smad2 Activation
4. Discussion
5. Conclusion
Supplementary Materials
Author Contributions
Funding
Institutional Review Board Statement
Data Availability Statement
Acknowledgments
Conflicts of Interest
References
- Jefferson, J.A.; Shankland, S.J.; Pichler, R.H. Proteinuria in Diabetic Kidney Disease: A Mechanistic Viewpoint. Kidney Int. 2008, 74, 22–36. [Google Scholar] [CrossRef] [PubMed]
- Diez-Sampedro, A.; Lenz, O.; Fornoni, A. Podocytopathy in Diabetes: A Metabolic and Endocrine Disorder. Am. J. Kidney Dis. 2011, 58, 637–646. [Google Scholar] [CrossRef] [PubMed]
- Ziyadeh, F.; Wolf, G. Pathogenesis of the Podocytopathy and Proteinuria in Diabetic Glomerulopathy. Curr. Diabetes Rev. 2008, 4, 39–45. [Google Scholar] [CrossRef] [PubMed]
- Menzel, S.; Moeller, M.J. Role of the Podocyte in Proteinuria. Pediatr. Nephrol. 2011, 26, 1775–1780. [Google Scholar] [CrossRef] [PubMed]
- Conti, S.; Perico, N.; Novelli, R.; Carrara, C.; Benigni, A.; Remuzzi, G. Early and Late Scanning Electron Microscopy Findings in Diabetic Kidney Disease. Sci. Rep. 2018, 8. [Google Scholar] [CrossRef] [PubMed]
- Li, X.; Zhang, Y.; Xing, X.; Li, M.; Liu, Y.; Xu, A.; Zhang, J. Podocyte Injury of Diabetic Nephropathy: Novel Mechanism Discovery and Therapeutic Prospects. Biomed. Pharmacother. 2023, 168, 115670. [Google Scholar] [CrossRef] [PubMed]
- Garg, P. A Review of Podocyte Biology. Am. J. Nephrol. 2018, 47, 3–13. [Google Scholar] [CrossRef] [PubMed]
- Greka, A.; Mundel, P. Cell Biology and Pathology of Podocytes. Annu. Rev. Physiol. 2012, 74, 299–323. [Google Scholar] [CrossRef] [PubMed]
- Abrahamson, D.R. Role of the Podocyte (and Glomerular Endothelium) in Building the GBM. Semin. Nephrol. 2012, 32, 342–349. [Google Scholar] [CrossRef]
- Kawachi, H.; Fukusumi, Y. New Insight into Podocyte Slit Diaphragm, a Therapeutic Target of Proteinuria. Clin. Exp. Nephrol. 2020, 24, 193–204. [Google Scholar] [CrossRef]
- Wiggins, R.-C. The Spectrum of Podocytopathies: A Unifying View of Glomerular Diseases. Kidney Int. 2007, 71, 1205–1214. [Google Scholar] [CrossRef] [PubMed]
- Kriz, W. Podocyte Loss as a Common Pathway to Chronic Kidney Disease. In Oxford Textbook of Clinical Nephrology: Three-Volume Pack (4 edn) Editor Goldsmith, D.J. Oxford University Press, 2015; Volume 1, pp. 1118–1125.
- Tang, P.C.-T.; Chan, A.S.-W.; Zhang, C.-B.; García Córdoba, C.A.; Zhang, Y.-Y.; To, K.-F.; Leung, K.-T.; Lan, H.-Y.; Tang, P.M.-K. TGF-Β1 Signaling: Immune Dynamics of Chronic Kidney Diseases. Front. Med. 2021, 8. [Google Scholar] [CrossRef] [PubMed]
- Gu, Y.Y.; Liu, X.S.; Huang, X.R.; Yu, X.Q.; Lan, H.Y. Diverse Role of TGF-β in Kidney Disease. Front. Cell Dev. Biol. 2020, 8. [Google Scholar] [CrossRef] [PubMed]
- Massagué, J.; Sheppard, D. TGF-β Signaling in Health and Disease. Cell 2023, 186, 4007–4037. [Google Scholar] [CrossRef] [PubMed]
- Chen, P.-Y.; Qin, L.; Simons, M. TGFβ Signaling Pathways in Human Health and Disease. Front. Mol. Biosci. 2023, 10. [Google Scholar] [CrossRef] [PubMed]
- Sureshbabu, A.; Muhsin, S.A.; Choi, M.E. TGF-β Signaling in the Kidney: Profibrotic and Protective Effects. Am. J. Physiol. Physiol. 2016, 310, F596–F606. [Google Scholar] [CrossRef] [PubMed]
- Tominaga, K.; Suzuki, H.I. TGF-β Signaling in Cellular Senescence and Aging-Related Pathology. Int. J. Mol. Sci. 2019, 20, 5002. [Google Scholar] [CrossRef]
- Wang, L.; Wang, H.; Lan, H. TGF-β Signaling in Diabetic Nephropathy: An Update. Diabet. Nephrop. 2022, 2, 7–16. [Google Scholar] [CrossRef]
- Schnaper, H. . W. TGF-Beta Signal Transduction in Chronic Kidney Disease. Front. Biosci. 2009, Volume, 2448. [Google Scholar] [CrossRef]
- Lee, H.S. Mechanisms and Consequences of TGF-ß Overexpression by Podocytes in Progressive Podocyte Disease. Cell Tissue Res. 2012, 347, 129–140. [Google Scholar] [CrossRef]
- Herman-Edelstein, M.; Weinstein, T.; Gafter, U. TGFβ1-Dependent Podocyte Dysfunction. Curr. Opin. Nephrol. Hypertens. 2013, 22, 93–99. [Google Scholar] [CrossRef] [PubMed]
- Zhang, L.; Wen, Z.; Han, L.; Zheng, Y.; Wei, Y.; Wang, X.; Wang, Q.; Fang, X.; Zhao, L.; Tong, X. Research Progress on the Pathological Mechanisms of Podocytes in Diabetic Nephropathy. J. Diabetes Res. 2020, 2020, 1–15. [Google Scholar] [CrossRef] [PubMed]
- Espín, J.C.; Larrosa, M.; García-Conesa, M.T.; Tomás-Barberán, F. Biological Significance of Urolithins, the Gut Microbial Ellagic Acid-Derived Metabolites: The Evidence so Far. Evidence-based Complement. Altern. Med. 2013, 2013. [Google Scholar] [CrossRef] [PubMed]
- García-Villalba, R.; Giménez-Bastida, J.A.; Cortés-Martín, A.; Ávila-Gálvez, M.Á.; Tomás-Barberán, F.A.; Selma, M.V.; Espín, J.C.; González-Sarrías, A. Urolithins: A Comprehensive Update on Their Metabolism, Bioactivity, and Associated Gut Microbiota. Mol. Nutr. Food Res. 2022, 66. [Google Scholar] [CrossRef] [PubMed]
- Vini, R.; Azeez, J.M.; Remadevi, V.; Susmi, T.R.; Ayswarya, R.S.; Sujatha, A.S.; Muraleedharan, P.; Lathika, L.M.; Sreeharshan, S. Urolithins: The Colon Microbiota Metabolites as Endocrine Modulators: Prospects and Perspectives. Front. Nutr. 2022, 8. [Google Scholar] [CrossRef] [PubMed]
- Hasheminezhad, S.H.; Boozari, M.; Iranshahi, M.; Yazarlu, O.; Sahebkar, A.; Hasanpour, M.; Iranshahy, M. A Mechanistic Insight into the Biological Activities of Urolithins as Gut Microbial Metabolites of Ellagitannins. Phyther. Res. 2022, 36, 112–146. [Google Scholar] [CrossRef] [PubMed]
- Kotewicz, M.; Krauze-Baranowska, M.; Daca, A.; Płoska, A.; Godlewska, S.; Kalinowski, L.; Lewko, B. Urolithins Modulate the Viability, Autophagy, Apoptosis, and Nephrin Turnover in Podocytes Exposed to High Glucose. Cells 2022, 11. [Google Scholar] [CrossRef] [PubMed]
- Kotewicz, M.; Lewko, B. Urolithins and Their Possible Implications for Diabetic Kidney. Eur. J. Transl. Clin. Med. 2022, 5, 53–63. [Google Scholar] [CrossRef]
- Kobayashi, N.; Reiser, J.; Schwarz, K.; Sakai, T.; Kriz, W.; Mundel, P. Process Formation of Podocytes: Morphogenetic Activity of Microtubules and Regulation by Protein Serine/Threonine Phosphatase PP2A. Histochem. Cell Biol. 2001, 115, 255–266. [Google Scholar] [CrossRef]
- Bialonska, D.; Kasimsetty, S.G.; Khan, S.I.; Ferreira, D. Urolithins, Intestinal Microbial Metabolites of Pomegranate Ellagitannins, Exhibit Potent Antioxidant Activity in a Cell-Based Assay. J. Agric. Food Chem. 2009, 57, 10181–10186. [Google Scholar] [CrossRef]
- Suarez-Arnedo, A.; Torres Figueroa, F.; Clavijo, C.; Arbeláez, P.; Cruz, J.C.; Muñoz-Camargo, C. An Image J Plugin for the High Throughput Image Analysis of in Vitro Scratch Wound Healing Assays. PLoS One 2020, 15, e0232565. [Google Scholar] [CrossRef] [PubMed]
- Endlich, N.; Schordan, E.; Cohen, C.D.; Kretzler, M.; Lewko, B.; Welsch, T.; Kriz, W.; Otey, C.A.; Endlich, K. Palladin Is a Dynamic Actin-Associated Protein in Podocytes. Kidney Int. 2009, 75, 214–226. [Google Scholar] [CrossRef] [PubMed]
- Wu, T.; Ding, L.; Andoh, V.; Zhang, J.; Chen, L. The Mechanism of Hyperglycemia-Induced Renal Cell Injury in Diabetic Nephropathy Disease: An Update. Life 2023, 13. [Google Scholar] [CrossRef] [PubMed]
- Doublier, S.; Salvidio, G.; Lupia, E.; Ruotsalainen, V.; Verzola, D.; Deferrari, G.; Camussi, G. Nephrin Expression Is Reduced in Human Diabetic Nephropathy. Diabetes 2003, 52, 1023–1030. [Google Scholar] [CrossRef] [PubMed]
- Herman-Edelstein, M.; Thomas, M.C.; Thallas-Bonke, V.; Saleem, M.; Cooper, M.E.; Kantharidis, P. Dedifferentiation of Immortalized Human Podocytes in Response to Transforming Growth Factor-β: A Model for Diabetic Podocytopathy. Diabetes 2011, 60, 1779–1788. [Google Scholar] [CrossRef] [PubMed]
- Hathaway, C.K.; Gasim, A.M.H.; Grant, R.; Chang, A.S.; Kim, H.S.; Madden, V.J.; Bagnell, C.R.; Jennette, J.C.; Smithies, O.; Kakoki, M. Low TGFβ1 Expression Prevents and High Expression Exacerbates Diabetic Nephropathy in Mice. Proc. Natl. Acad. Sci. U. S. A. 2015, 112, 5815–5820. [Google Scholar] [CrossRef] [PubMed]
- Gao, F.; He, X.; Liang, S.; Liu, S.; Liu, H.; He, Q.; Chen, L.; Jiang, H.; Zhang, Y. Quercetin Ameliorates Podocyte Injury via Inhibition of Oxidative Stress and the TGF-Β1/Smad Pathway in DN Rats. RSC Adv. 2018, 8, 35413–35421. [Google Scholar] [CrossRef] [PubMed]
- Venkatareddy, M.; Cook, L.; Abuarquob, K.; Verma, R.; Garg, P. Nephrin Regulates Lamellipodia Formation by Assembling a Protein Complex That Includes Ship2, Filamin and Lamellipodin. PLoS One 2011, 6. [Google Scholar] [CrossRef] [PubMed]
- Lv, Z.; Hu, M.; Ren, X.; Fan, M.; Zhen, J.; Chen, L.; Lin, J.; Ding, N.; Wang, Q.; Wang, R. Fyn Mediates High Glucose-Induced Actin Cytoskeleton Reorganization of Podocytes via Promoting ROCK Activation in Vitro. J. Diabetes Res. 2016, 2016. [Google Scholar] [CrossRef]
- Lee, E.Y.; Chung, C.H.; Khoury, C.C.; Yeo, T.K.; Pyagay, P.E.; Wang, A.; Chen, S. The Monocyte Chemoattractant Protein-1/CCR2 Loop, Inducible by TGF-, Increases Podocyte Motility and Albumin Permeability. Am J Physiol Ren. Physiol 2009, 297, 85–94. [Google Scholar] [CrossRef]
- Murakami, T.; Abe, H.; Nagai, K.; Tominaga, T.; Takamatsu, N.; Araoka, T.; Kishi, S.; Takahashi, T.; Mima, A.; Takai, Y.; et al. Trophoblast Glycoprotein: Possible Candidate Mediating Podocyte Injuries in Glomerulonephritis. Am. J. Nephrol. 2010, 32, 505–521. [Google Scholar] [CrossRef]
- Wei, C.; Möller, C.C.; Altintas, M.M.; Li, J.; Schwarz, K.; Zacchigna, S.; Xie, L.; Henger, A.; Schmid, H.; Rastaldi, M.P.; et al. Modification of Kidney Barrier Function by the Urokinase Receptor. Nat. Med. 2008, 14, 55–63. [Google Scholar] [CrossRef] [PubMed]
- Lin, Y.; Rao, J.; Zha, X.L.; Xu, H. Angiopoietin-like 3 Induces Podocyte f-Actin Rearrangement through Integrin α v β 3 /FAK/PI3K Pathway-Mediated Rac1 Activation. Biomed Res. Int. 2013, 2013. [Google Scholar] [CrossRef]
- Li, Z.; Zhang, L.; Shi, W.; Chen, Y.; Zhang, H.; Liu, S.; Liang, X.; Ling, T.; Yu, C.; Huang, Z.; et al. Spironolactone Inhibits Podocyte Motility via Decreasing Integrin Β1 and Increasing Integrin Β3 in Podocytes under High-Glucose Conditions. Mol. Med. Rep. 2015, 12, 6849–6854. [Google Scholar] [CrossRef] [PubMed]
- Kitsiou, P. V.; Tzinia, A.K.; Stetler-Stevenson, W.G.; Michael, A.F.; Fan, W.-W.; Zhou, B.; Tsilibary, E.C. Glucose-Induced Changes in Integrins and Matrix-Related Functions in Cultured Human Glomerular Epithelial Cells. Am. J. Physiol. Physiol. 2003, 284, F671–F679. [Google Scholar] [CrossRef] [PubMed]
- Li, X.; Chuang, P.Y.; D’Agati, V.D.; Dai, Y.; Yacoub, R.; Fu, J.; Xu, J.; Taku, O.; Premsrirut, P.K.; Holzman, L.B.; et al. Nephrin Preserves Podocyte Viability and Glomerular Structure and Function in Adult Kidneys. J. Am. Soc. Nephrol. 2015, 26, 2361–2377. [Google Scholar] [CrossRef]
- Chen, C.A.; Chang, J.M.; Chang, E.E.; Chen, H.C.; Yang, Y.L. TGF-Β1 Modulates Podocyte Migration by Regulating the Expression of Integrin-Β1 and -Β3 through Different Signaling Pathways. Biomed. Pharmacother. 2018, 105, 974–980. [Google Scholar] [CrossRef]
- Ling, L.; Chen, L.; Zhang, C.; Gui, S.; Zhao, H.; Li, Z. High Glucose Induces Podocyte Epithelial-to-Mesenchymal Transition by Demethylation-Mediated Enhancement of MMP9 Expression. Mol. Med. Rep. 2018, 17, 5642–5651. [Google Scholar] [CrossRef]
- Li, Y.; Kang, Y.S.; Dai, C.; Kiss, L.P.; Wen, X.; Liu, Y. Epithelial-to-Mesenchymal Transition Is a Potential Pathway Leading to Podocyte Dysfunction and Proteinuria. Am. J. Pathol. 2008, 172, 299–308. [Google Scholar] [CrossRef]
- Reidy, K.; Susztak, K. Epithelial-Mesenchymal Transition and Podocyte Loss in Diabetic Kidney Disease. Am. J. Kidney Dis. 2009, 54, 590–593. [Google Scholar] [CrossRef]
- Zeisberg, M.; Neilson, E.G. Biomarkers for Epithelial-Mesenchymal Transitions. J. Clin. Invest. 2009, 119, 1429–1437. [Google Scholar] [CrossRef] [PubMed]
- Tzavlaki, K.; Moustakas, A. TGF-Β Signaling. Biomolecules 2020, 10.
- Chen, S.; Kasama, Y.; Lee, J.S.; Jim, B.; Marin, M.; Ziyadeh, F.N. Podocyte-Derived Vascular Endothelial Growth Factor Mediates the Stimulation of 3(IV) Collagen Production by Transforming Growth Factor-1 in Mouse Podocytes; 2004.
- Sakairi, T.; Abe, Y.; Kopp, J.B. TGF-Beta1 Reduces Wilms’ Tumor Suppressor Gene Expression in Podocytes. Nephrol. Dial. Transplant. 2011, 26, 2746–2752. [Google Scholar] [CrossRef] [PubMed]
- Mao, X.; Xu, Z.; Xu, X.; Zeng, M.; Zhao, Z.; Zhang, Z.; Ding, X.; Wu, H. TGF-Β1 Inhibits the Autophagy of Podocytes by Activating MTORC1 in IgA Nephropathy. Exp. Cell Res. 2019, 385. [Google Scholar] [CrossRef] [PubMed]
- Weil, E.J.; Lemley, K. V.; Mason, C.C.; Yee, B.; Jones, L.I.; Blouch, K.; Lovato, T.; Richardson, M.; Myers, B.D.; Nelson, R.G. Podocyte Detachment and Reduced Glomerular Capillary Endothelial Fenestration Promote Kidney Disease in Type 2 Diabetic Nephropathy. Kidney Int. 2012, 82, 1010–1017. [Google Scholar] [CrossRef] [PubMed]
- Lin, J.S.; Susztak, K. Podocytes: The Weakest Link in Diabetic Kidney Disease? Curr. Diab. Rep. 2016, 16, 45. [Google Scholar] [CrossRef] [PubMed]
- Wolf, G.; Ziyadeh, F.N. Cellular and Molecular Mechanisms of Proteinuria in Diabetic Nephropathy. Nephron Physiol. 2007, 106, p26–p31. [Google Scholar] [CrossRef] [PubMed]
- Yamaguchi, Y.; Iwano, M.; Suzuki, D.; Nakatani, K.; Kimura, K.; Harada, K.; Kubo, A.; Akai, Y.; Toyoda, M.; Kanauchi, M.; et al. Epithelial-Mesenchymal Transition as a Potential Explanation for Podocyte Depletion in Diabetic Nephropathy. Am. J. Kidney Dis. 2009, 54, 653–664. [Google Scholar] [CrossRef]
- Tharaux, P.-L.; Huber, T.B. How Many Ways Can a Podocyte Die? Semin. Nephrol. 2012, 32, 394–404. [Google Scholar] [CrossRef] [PubMed]
- Perez-Hernandez, J.; Olivares, M.D.; Forner, M.J.; Chaves, F.J.; Cortes, R.; Redon, J. Urinary Dedifferentiated Podocytes as a Non-Invasive Biomarker of Lupus Nephritis. Nephrol. Dial. Transplant. 2016, 31, 780–789. [Google Scholar] [CrossRef]
- Singh, B.M.K.; Mathew, M. Epithelial-Mesenchymal Transition and Its Role in Renal Fibrogenesis. Brazilian Arch. Biol. Technol. 2022, 65. [Google Scholar] [CrossRef]
- Dan Hu, Q.; Wang, H.; Liu, J.; He, T.; Tan, R.; Zhang, Q.; Su, H.; Kantawong, F.; Lan, H.; Wang, L. Btg2 Promotes Focal Segmental Glomerulosclerosis via Smad3-Dependent Podocyte-Mesenchymal Transition. Adv. Sci. 2023, 10. [Google Scholar] [CrossRef] [PubMed]
- Anil Kumar, P.; Welsh, G.I.; Saleem, M.A.; Menon, R.K. Molecular and Cellular Events Mediating Glomerular Podocyte Dysfunction and Depletion in Diabetes Mellitus. Front. Endocrinol. (Lausanne). 2014, 5. [Google Scholar] [CrossRef] [PubMed]
- Loeffler, I.; Wolf, G. Epithelial-to-Mesenchymal Transition in Diabetic Nephropathy: Fact or Fiction? Cells 2015, 4, 631–652. [Google Scholar] [CrossRef] [PubMed]
- May, C.J.; Saleem, M.; Welsh, G.I. Podocyte Dedifferentiation: A Specialized Process for a Specialized Cell. Front. Endocrinol. (Lausanne). 2014, 5. [Google Scholar] [CrossRef] [PubMed]
- Wang, L.; Wang, H.L.; Liu, T.T.; Lan, H.Y. TGF-beta as a Master Regulator of Diabetic Nephropathy. Int. J. Mol. Sci. 2021, 22. [Google Scholar] [CrossRef] [PubMed]
- Dai, H.; Liu, Q.; Liu, B. Research Progress on Mechanism of Podocyte Depletion in Diabetic Nephropathy. J. Diabetes Res. 2017, 2017, 1–10. [Google Scholar] [CrossRef] [PubMed]
- Guo, J.; Xia, N.; Yang, L.; Zhou, S.; Zhang, Q.; Qiao, Y.; Liu, Z. GSK-3� and Vitamin D Receptor Are Involved in �-Catenin and Snail Signaling in High Glucose-Induced Epithelial-Mesenchymal Transition of Mouse Podocytes. Cell. Physiol. Biochem. 2014, 33, 1087–1096. [Google Scholar] [CrossRef] [PubMed]
- Ying, Q.; Wu, G. Molecular Mechanisms Involved in Podocyte EMT and Concomitant Diabetic Kidney Diseases: An Update. Ren. Fail. 2017, 39, 474–483. [Google Scholar] [CrossRef]
- Zhang, J.; Zhang, Y.; Zhang, Q.; Feng, Y.; Deng, X.; Deng, F.; Chen, B.; Hu, J. High Glucose Promotes Podocyte Movement: From the Perspective of Single Cell Motility Assay. Cell Biol. Int. 2023, 47, 823–830. [Google Scholar] [CrossRef]
- Ziyadeh, F.N. Mediators of Diabetic Renal Disease. J. Am. Soc. Nephrol. 2004, 15, S55–S57. [Google Scholar] [CrossRef]
- Hu, S.; Hang, X.; Wei, Y.; Wang, H.; Zhang, L.; Zhao, L. Crosstalk among Podocytes, Glomerular Endothelial Cells and Mesangial Cells in Diabetic Kidney Disease: An Updated Review. Cell Commun. Signal. 2024, 22. [Google Scholar] [CrossRef] [PubMed]
- Abbate, M.; Zoja, C.; Morigi, M.; Rottoli, D.; Angioletti, S.; Tomasoni, S.; Zanchi, C.; Longaretti, L.; Donadelli, R.; Remuzzi, G. Transforming Growth Factor-Β1 Is Up-Regulated by Podocytes in Response to Excess Intraglomerular Passage of Proteins. Am. J. Pathol. 2002, 161, 2179–2193. [Google Scholar] [CrossRef]
- Wu, D.T.; Bitzer, M.; Ju, W.; Mundel, P.; Böttinger, E.P. TGF-β Concentration Specifies Differential Signaling Profiles of Growth Arrest/Differentiation and Apoptosis in Podocytes. J. Am. Soc. Nephrol. 2005, 16, 3211–3221. [Google Scholar] [CrossRef]
- Mukhi, D.; Kolligundla, L.P.; Maruvada, S.; Nishad, R.; Pasupulati, A.K. Growth Hormone Induces Transforming Growth Factor-Β1 in Podocytes: Implications in Podocytopathy and Proteinuria. Biochim. Biophys. Acta - Mol. Cell Res. 2023, 1870, 119391. [Google Scholar] [CrossRef]
- Schordan, S.; Schordan, E.; Endlich, K.; Endlich, N. α V -Integrins Mediate the Mechanoprotective Action of Osteopontin in Podocytes. Am. J. Physiol. Physiol. 2011, 300, F119–F132. [Google Scholar] [CrossRef]
- Kistler, A.D.; Altintas, M.M.; Reiser, J. Podocyte GTPases Regulate Kidney Filter Dynamics. Kidney Int. 2012, 81, 1053–1055. [Google Scholar] [CrossRef]
- Ding, W.Y.; Saleem, M.A. Current Concepts of the Podocyte in Nephrotic Syndrome. Kidney Res. Clin. Pract. 2012, 31, 87–93. [Google Scholar] [CrossRef] [PubMed]
- Lindschau, C.; Quass, P.; Menne, J.; Güler, F.; Fiebeler, A.; Leitges, M.; Luft, F.C.; Haller, H. Glucose-Induced TGF-Β1 and TGF-β Receptor-1 Expression in Vascular Smooth Muscle Cells Is Mediated by Protein Kinase C-α. Hypertension 2003, 42, 335–341. [Google Scholar] [CrossRef] [PubMed]
- Iglesias-de la Cruz, M.C.; Ziyadeh, F.N.; Isono, M.; Kouahou, M.; Han, D.C.; Kalluri, R.; Mundel, P.; Chen, S. Effects of High Glucose and TGF-Β1 on the Expression of Collagen IV and Vascular Endothelial Growth Factor in Mouse Podocytes. Kidney Int. 2002, 62, 901–913. [Google Scholar] [CrossRef]
- Ghasempour, G.; Mohammadi, A.; Zamani-Garmsiri, F.; Soleimani, A.A.; Najafi, M. Upregulation of TGF-β Type II Receptor in High Glucose-Induced Vascular Smooth Muscle Cells. Mol. Biol. Rep. 2022, 49, 2869–2875. [Google Scholar] [CrossRef]
- Liu, Y.; Beyer, A.; Aebersold, R. On the Dependency of Cellular Protein Levels on MRNA Abundance. Cell 2016, 165, 535–550. [Google Scholar] [CrossRef] [PubMed]
- Duan, D.; Derynck, R. Transforming Growth Factor–β (TGF-β)–Induced up-Regulation of TGF-β Receptors at the Cell Surface Amplifies the TGF-β Response. J. Biol. Chem. 2019, 294, 8490–8504. [Google Scholar] [CrossRef] [PubMed]
- Kucuksayan, H.; Akgun, S.; Ozes, O.N.; Alikanoglu, A.S.; Yildiz, M.; Dal, E.; Akca, H. TGF-β–SMAD–MiR-520e Axis Regulates NSCLC Metastasis through a TGFBR2-Mediated Negative-Feedback Loop. Carcinogenesis 2019, 40, 695–705. [Google Scholar] [CrossRef]
- Baugé, C.; Cauvard, O.; Leclercq, S.; Galéra, P.; Boumédiene, K. Modulation of Transforming Growth Factor Beta Signalling Pathway Genes by Transforming Growth Factor Beta in Human Osteoarthritic Chondrocytes: Involvement of Sp1 in Both Early and Late Response Cells to Transforming Growth Factor Beta. Arthritis Res. Ther. 2011, 13. [Google Scholar] [CrossRef]
- Shi, S.; Yu, L.; Zhang, T.; Qi, H.; Xavier, S.; Ju, W.; Bottinger, E. Smad2-Dependent Downregulation of MiR-30 Is Required for TGF-β-Induced Apoptosis in Podocytes. PLoS One 2013, 8, e75572. [Google Scholar] [CrossRef] [PubMed]
- Zhao, H.; Song, G.; Zhu, H.; Qian, H.; Pan, X.; Song, X.; Xie, Y.; Liu, C. Pharmacological Effects of Urolithin A and Its Role in Muscle Health and Performance: Current Knowledge and Prospects. Nutrients 2023, 15, 4441. [Google Scholar] [CrossRef] [PubMed]
- Cheng, F.; Dou, J.; Zhang, Y.; Wang, X.; Wei, H.; Zhang, Z.; Cao, Y.; Wu, Z. Urolithin A Inhibits Epithelial–Mesenchymal Transition in Lung Cancer Cells via P53-Mdm2-Snail Pathway. Onco. Targets. Ther. 2021, Volume 14, 3199–3208. [Google Scholar] [CrossRef]
- Yang, Y.; Ren, Z.-Z.; Wei, W.-J.; He, Z.-L.; Deng, Y.-L.; Wang, Z.; Fan, Y.-C.; Zhou, J.; Jiang, L.-H. Study on the Biological Mechanism of Urolithin a on Nasopharyngeal Carcinoma in Vitro. Pharm. Biol. 2022, 60, 1566–1577. [Google Scholar] [CrossRef] [PubMed]
- Chappell, M.C.; Pingue, G.; Pirro, N.; Tallant, A.; Gallagher, P. The Microbiome Product Urolithin A Abolishes TGFβ-Dependent Stimulation of PAI-1 in Renal Epithelial Cells. FASEB J. 2019, 33. [Google Scholar] [CrossRef]
- Loeffler, I.; Wolf, G. Transforming Growth Factor- and the Progression of Renal Disease. Nephrol. Dial. Transplant. 2014, 29, i37–i45. [Google Scholar] [CrossRef]
- Gewin, L.S. Transforming Growth Factor-β in the Acute Kidney Injury to Chronic Kidney Disease Transition. Nephron 2019, 143, 154–157. [Google Scholar] [CrossRef] [PubMed]
- “FDA GRAS notice GRN No. 791: urolithin A”. US Food and Drug Administration. 20 December 2018. Retrieved 25 August 2020. Available online: https://www.cfsanappsexternal.fda.gov/scripts/fdcc/index.cfm?set=GRASNotices&id=791.
Disclaimer/Publisher’s Note: The statements, opinions and data contained in all publications are solely those of the individual author(s) and contributor(s) and not of MDPI and/or the editor(s). MDPI and/or the editor(s) disclaim responsibility for any injury to people or property resulting from any ideas, methods, instructions or products referred to in the content. |
© 2024 by the authors. Licensee MDPI, Basel, Switzerland. This article is an open access article distributed under the terms and conditions of the Creative Commons Attribution (CC BY) license (http://creativecommons.org/licenses/by/4.0/).


