Preprint
Article

Enhanced Brain-to-Brain Communication Security via Adversarial Neural Network Training

Altmetrics

Downloads

167

Views

66

Comments

0

Submitted:

03 July 2024

Posted:

04 July 2024

You are already at the latest version

Alerts
Abstract
Brain-to-brain communication (B2B-C) is rapidly expanding, integrating communication technology and neuroscience to enable direct neural data transfer between people. Nonetheless, because neural data is susceptible to noise, interference, and hostile attacks, guaranteeing the security and resilience of B2B-C systems continues to be difficult. This work aims to use Adversarial Neural Network Training (ANNT) to improve the security of B2B-C systems by using Steady-State Visually Evoked Potentials (SSVEP) EEG data. We use two large SSVEP datasets for a thorough analysis: Lee2019_SSVEP and Nakanishi2015. We use the Fast Gradient Sign Method (FGSM) to create adversarial instances and ANNT to train the model on clean and adversarially perturbed data. The system's accuracy and resilience are significantly improved by ANNT, as seen by the up to 17% increase in adversarial accuracy and the average 0.03 point improvement in the Area Under the Curve (AUC). This work demonstrates how ANNT may strengthen B2B-C systems against advanced cyberattacks, opening the door for dependable and safe neural communication technologies.
Keywords: 
Subject: Engineering  -   Bioengineering

1. Introduction

Brain-to-Brain Communication (B2B-C) is an emerging field at the intersection of neuroscience and communication technology. It proposes a revolutionary shift in how information can be transferred between individuals. This field, still in its nascent stages, aims to enable direct brain-to-brain interaction, bypassing traditional forms of communication like speech and text. Such advancements can transform numerous domains, including healthcare, education, and everyday social interactions [1]. The complexity of B2B-C arises from the need to interpret and transmit neural signals between brains accurately [2]. The human brain is an incredibly intricate organ consisting of approximately 86 billion neurons, each forming thousands of synaptic connections. Translating the electrochemical signals from one brain into meaningful information that can be received and understood by another is a task fraught with challenges, requiring sophisticated technology and a deep understanding of neuroscience and signal processing [3].
Electroencephalography (EEG) signals are pivotal in this era of brain research due to their non-invasive nature and ability to provide real-time monitoring of brain activity. EEG captures the brain’s electrical activity using sensors placed on the scalp, offering a window into the neural processes underlying cognition, perception, and motor functions. The complexity of EEG data lies in its low amplitude, high dimensionality, and noise, which necessitates advanced methods for effective data analysis and interpretation [4].
High-density EEG, in particular, offers a rich dataset analogous to a series of images evolving over time [5]. These data can be processed using methods from medical image analysis and deep learning to extract meaningful patterns and insights. Techniques commonly used in image processing have proven effective in handling EEG data’s high dimensionality and complexity, enhancing the robustness and accuracy of B2B-C systems [6].
Integrating these advanced methodologies into EEG analysis opens new possibilities for improving the performance and security of B2B-C systems. For example, by employing deep learning techniques, researchers have significantly advanced the accuracy of EEG signal classification, contributing to more reliable and secure communication channels [7]. Furthermore, medical image analysis techniques have been adapted to process high-density EEG data, allowing for the detailed exploration of brain activity and its applications in various domains [8].
Given the high complexity of EEG data, dimensionality reduction techniques are often employed to distill the data into a more manageable form without losing critical information [9]. Within the realm of EEG, Steady-State Visually Evoked Potentials (SSVEPs) stand out for their robustness and reliability in various applications, including B2B-C [10]. SSVEPs are elicited by visual stimuli flickering at specific frequencies, producing brain responses that are relatively easy to detect and analyze [11]. This makes SSVEPs particularly useful for B2B-C, as they can provide consistent and high-quality signals that facilitate accurate interpretation and communication between brains [12].
Ensuring the security and robustness of B2B-C systems, particularly when transmitting EEG signals, is paramount due to the sensitive nature of neural data [13]. While offering a non-invasive and real-time glimpse into brain activity, EEG signals are highly susceptible to noise, interference, and malicious attacks [14]. The integrity of the transmitted data is critical; any compromise can lead to significant errors in interpretation and potentially harmful consequences. One of the main challenges lies in protecting these signals from adversarial attacks that can subtly alter the data, leading to miscommunication or data breaches [15]. Robustness must be built into the system to ensure that it can withstand such perturbations and continue to function accurately. This requires advanced machine learning techniques, such as Adversarial Neural Network Training (ANNT), which can develop models to recognize and resist these adversarial patterns. Additionally, secure transmission protocols must be developed to safeguard the data as it travels through wireless channels, preventing unauthorized access and ensuring the privacy and integrity of the communication [16]. As B2B-C technology evolves, addressing these security and robustness challenges will be essential to realizing its full potential and maintaining trust in its applications across healthcare, education, and other fields.
Enormous studies have been conducted on EEG analysis, particularly within Brain-Computer Interface (BCI) technology, significantly advancing our understanding and application. One extraordinary work is by Donchin and colleagues, who developed the P300-based BCI, a system that allows individuals to communicate without muscle activity by detecting the P300 wave, a component of EEG that occurs in response to decision-making processes [17]. Another notable study is by Wolpaw et al., who created the sensorimotor rhythm-based BCI, enabling users to control external devices by modulation of sensorimotor rhythms in their EEG signals [18]. Furthermore, Buzsáki’s research on using EEG for understanding the brain’s oscillatory activity has provided profound insights into how different brain waves are associated with various cognitive functions and states of consciousness [19]. In [20], a novel ensemble model was introduced, significantly enhancing motor imagery EEG classification by integrating multiple machine learning (ML) classifiers through a weighted stacking approach. Additionally, their study on the Weighted and Stacked Adaptive Integrated Ensemble Classifier (WS-AIEC) has shown superior performance in EEG signal classification, achieving exceptional accuracy and reliability across multiple datasets [21]. These outstanding works, among many others, highlight the versatility and potential of EEG analysis in advancing both theoretical neuroscience and practical applications in neurotechnology.
Despite the extensive research on various aspects of EEG signal analysis, studies focusing on using EEG in direct B2B-C remain relatively scarce. Even fewer investigations have addressed this context’s critical security and robustness issues. The challenge is further compounded when considering integrating interdisciplinary fields such as wireless communication, neuroscience, and artificial intelligence. This interdisciplinary approach is crucial for developing a comprehensive and secure B2B-C system, yet it is an area that has not been extensively explored. For instance, authors in [1] and [22] have done valuable foundational work in B2B-C but didn’t discuss its critical aspect: security. On the other hand, studies like [23] and [24] have emphasized the need for security but have not ventured into applying ANNT, particularly in conjunction with EEG, for fortifying B2B-C systems. This gap underscores the importance of advancing research in this specific intersection to realize the full potential of B2B-C technology.
In our previous work [25], we aimed to enhance the robustness and security of B2B-C systems against adversarial attacks using Event-Related Potentials (ERP) EEG data through ANNT. By focusing on ERP and employing eight diverse datasets, our objectives were to rigorously evaluate the model’s defense mechanisms against adversarial manipulations and optimize trial durations and sampling rates for maximum security. The results signified a notable advancement in system defense, evidenced by an average increase in adversarial accuracy by 17% and an improvement in the Area Under the Curve (AUC) by 0.12 points, demonstrating the effectiveness of our approach in strengthening B2B-C systems against sophisticated cyber threats.
This work extends our previous efforts by focusing on SSVEP EEG data. This extension will allow us to explore the robustness and security of B2B-C systems in a different and highly reliable EEG paradigm, further enhancing such systems’ practical applicability and resilience against adversarial attacks.
Our contribution to this field lies in leveraging ANNT to improve the robustness and security of B2B-C systems based on SSVEP EEG data. By focusing on SSVEP, which provides robust and reliable signals, we aim to enhance the resilience of B2B-C systems against adversarial attacks. Our approach involves a detailed analysis of key factors such as sampling rate, trial duration, and the number of classes, which are critical in optimizing the performance and security of B2B-C systems. By systematically varying these parameters, we aim to identify the optimal conditions under which the ANNT can most effectively enhance the security and robustness of SSVEP-based B2B-C systems. Our findings are expected to provide valuable insights into developing more secure and reliable neural communication technologies, paving the way for practical and trustworthy B2B-C applications.
The organization of this paper is structured to provide a comprehensive overview of our research methodology, findings, and implications. Following this Introduction, the Methodology section details the data description, signal processing techniques, and algorithms used in our study, highlighting the specific methods employed to preprocess and analyze SSVEP EEG data. In the Results section, we present our experimental findings, including the impact of various parameters on the performance and security of the B2B-C system. The Discussion section discusses and interprets our results, offering insights into our research’s practical implications and potential applications. Finally, the Conclusion summarizes our study, emphasizing the significance of our contributions and outlining potential future research directions.

2. Methodology

2.1. Datasets

This study utilized two SSVEP EEG datasets: Nakanishi2015 [26] and Lee2019_SSVEP [27]. Both datasets offer comprehensive EEG recordings but differ in the number of subjects, channels, classes, and sampling rates, providing a robust basis for evaluating our methods.
The Nakanishi2015 dataset consists of EEG data collected from 9 subjects, with recordings taken from 8 channels. The dataset includes 12 classes (events = "9.25": 1, "11.25": 2, "13.25": 3, "9.75": 4, "11.75": 5, "13.75": 6, "10.25": 7, "12.25": 8, "14.25": 9, "10.75": 10, "12.75": 11, "14.75": 12), each corresponding to different flicker frequencies used to elicit SSVEP responses. Each class contains 15 trials, with each trial lasting 4.15 seconds. The data were sampled at 256 Hz. The dataset is particularly valuable for evaluating the performance of BCI systems as it provides a structured environment to test various SSVEP detection algorithms. The signals were acquired to estimate online BCI performance, making it relevant for real-time applications. The EEG data in this dataset are preprocessed by de-meaning and concatenating the trials with a buffer to create continuous data. The channels used for recording include PO7, PO3, POz, PO4, PO8, O1, Oz, and O2, with an additional stimulation channel. The data was collected as part of a study comparing canonical correlation analysis-based methods for detecting SSVEPs, providing a benchmark for assessing the efficacy of different analytical techniques [26].
The Lee2019_SSVEP dataset features EEG recordings from 54 subjects using 62 channels, significantly increasing the spatial resolution of the data compared to the Nakanishi2015 dataset. The dataset comprises 4 classes corresponding to flicker frequencies of 5.45, 6.67, 8.57, and 12 Hz, each presented in different spatial positions on a monitor (down, right, left, and up). Each class contains 50 trials, with each trial lasting 4 seconds, and the data were sampled at an impressive 1000 Hz. The EEG signals were recorded using a BrainAmp amplifier with electrodes referenced to the nasion and grounded to AFz. The experimental setup included additional electromyography (EMG) electrodes to record data from the flexor digitorum profundus muscles, though these channels were primarily used for other BCI paradigms in the same dataset. The high sampling rate and the large number of trials and subjects make this dataset particularly suitable for training deep learning models, offering rich feature extraction and analysis data. The structured paradigm of the SSVEP stimuli, coupled with many subjects, provides a comprehensive dataset for evaluating the robustness and generalizability of SSVEP-based BCI systems [27].

2.2. Preprocessing

The preprocessing of EEG data is crucial for ensuring the accuracy and effectiveness of our B2B-C system. SSVEP EEG data is a great candidate for B2B-C systems due to its high quality; however, handling and managing this data requires careful consideration, especially in preparation and preprocessing. Therefore, we have implemented rigorous preprocessing steps to ensure the data is clean, standardized, and formatted for advanced analysis. The following steps outline the detailed process for preparing the SSVEP EEG data for our analysis.
  • Loading the Dataset: The first step involves loading the datasets. This is done by accessing the data files containing the EEG recordings, metadata, and necessary labels. For both the Nakanishi2015 and Lee2019_SSVEP datasets, we use appropriate functions to load the data into our working environment.
  • Fetching Data: Once the datasets are loaded, we fetch the raw EEG data, associated labels, and metadata. This includes extracting the dataset’s EEG signal values, trial information, and class labels.
  • Creating MNE Info Structure: Using the MNE-Python library, we create an info structure that contains metadata about the EEG data, such as the names of the channels, the sampling rate, and the type of data (e.g., EEG, stim). This info structure is essential for further processing and analysis using MNE functions.
  • Reshaping Data for MNE RawArray: The EEG data is reshaped to fit the format required by the MNE RawArray object. This involves organizing the data into a 2D array where each row represents a channel, and each column represents a time point.
  • Setting Montage: We set the montage, which defines the spatial arrangement of the EEG electrodes on the scalp. The standard 10-20 system ensures accurate spatial representation of the EEG data.
  • Setting Common Average Reference: A common average reference (CAR) is applied to the EEG data. This involves re-referencing the data by subtracting the average of all channels from each channel. CAR helps reduce the influence of common noise and improve signal quality.
  • Applying Bandpass Filter: A bandpass filter is applied to the EEG data to retain only the frequencies of interest. For SSVEP data, this typically involves filtering the data to keep frequencies within the range of the SSVEP stimuli (4-16 Hz). This step helps in removing noise and irrelevant frequency components.
  • Normalizing the EEG Data: Normalization is performed to standardize the EEG data, ensuring all signals have a mean of zero and a standard deviation of one. This step reduces variability due to different measurement scales and improves the performance of subsequent analysis methods. While it is acknowledged that this process may lead to the loss of information regarding possible differences in EEG amplitude distribution on the scalp, the benefits of normalization, such as improved comparability and enhanced performance of ML algorithms, outweigh this limitation. Furthermore, advanced techniques could be explored in future work to preserve some amplitude distribution information while still achieving the desired standardization.
  • Creating Event Array: An event array is created to mark specific events in the EEG data, such as the onset of a stimulus. This array is essential for segmenting the continuous EEG data into epochs corresponding to individual trials.
  • Creating Epochs: The continuous EEG data is segmented into epochs, time-locked segments around the events of interest (the presentation of SSVEP stimuli). Each epoch corresponds to a single trial and contains the EEG data from a specified time window around the event.
  • Creating Reference Signals: Reference signals for the SSVEP stimuli are created based on the known flicker frequencies. These reference signals are used for subsequent analysis and classification of the SSVEP responses.
  • Reshaping Data for CNN: The EEG data epochs are reshaped into a format suitable for input to a Convolutional Neural Network (CNN). This typically involves organizing the data into 3D arrays where each dimension represents time points, channels, and epochs.
  • Mapping Frequency Labels to Numerical Indices: The frequency labels associated with the SSVEP stimuli are mapped to numerical indices to facilitate their use in Deep Learning (DL) algorithms. Each unique frequency is assigned a distinct numerical index.
  • Converting Labels to One-Hot Encoding: The numerical labels are converted to one-hot encoding, a binary representation of categorical data. This step is necessary for training the CNN, allowing the network to output probabilities for each class.
  • Splitting Data into Training and Testing Sets: Finally, the preprocessed data is split into training (80%) and testing (20%) sets. This ensures that the model can be trained on one subset of the data and evaluated on another unseen subset, enabling an unbiased assessment of its performance.
Following these preprocessing steps ensures that the EEG data is clean, standardized, and formatted correctly for analysis using advanced DL techniques. This thorough preprocessing pipeline is crucial for achieving high accuracy and robustness in our B2B-C system. In the next section, we describe the method used in this paper, which is an adaptation to SSVEP of the method applied in our previous work [25].

2.3. System Model

In this study, we adopt the same system model as our previous work, illustrated in Figure 1. This model is designed to enhance the robustness and security of B2B-C systems against adversarial attacks, now focusing on SSVEP instead of ERP. To achieve this, the system model encompasses several key components and steps.
  • Data Acquisition and Preprocessing:
    We start by loading the SSVEP EEG data from our chosen datasets, Nakanishi2015 and Lee2019_SSVEP.
    Data preprocessing is done as described in the previous section.
  • Convolutional Neural Network (CNN):
    The first layer is a Conv2D layer with 32 filters and a (3x3) kernel size, followed by a ReLU activation function.
    This is followed by a MaxPooling2D layer with a (2x2) pool size to reduce the spatial dimensions.
    Another Conv2D layer with 64 filters and a (3x3) kernel size, again with ReLU activation, is applied to extract more complex features.
  • Temporal Convolutional Network (TCN): The reshaped data is passed through a TCN layer with 64 filters and a (3x3) kernel size, focusing on capturing the temporal dependencies in the EEG signals.
  • Dense Layer: Finally, a Dense layer with a number of units equal to the number of classes (12 for Nakanishi2015 and 4 for Lee2019_SSVEP) and a softmax activation function is used for classification.
  • Evaluation: The model’s robustness is tested across three scenarios: classification of clean data, classification of adversarially attacked data, and classification of attacked data using ANNT.
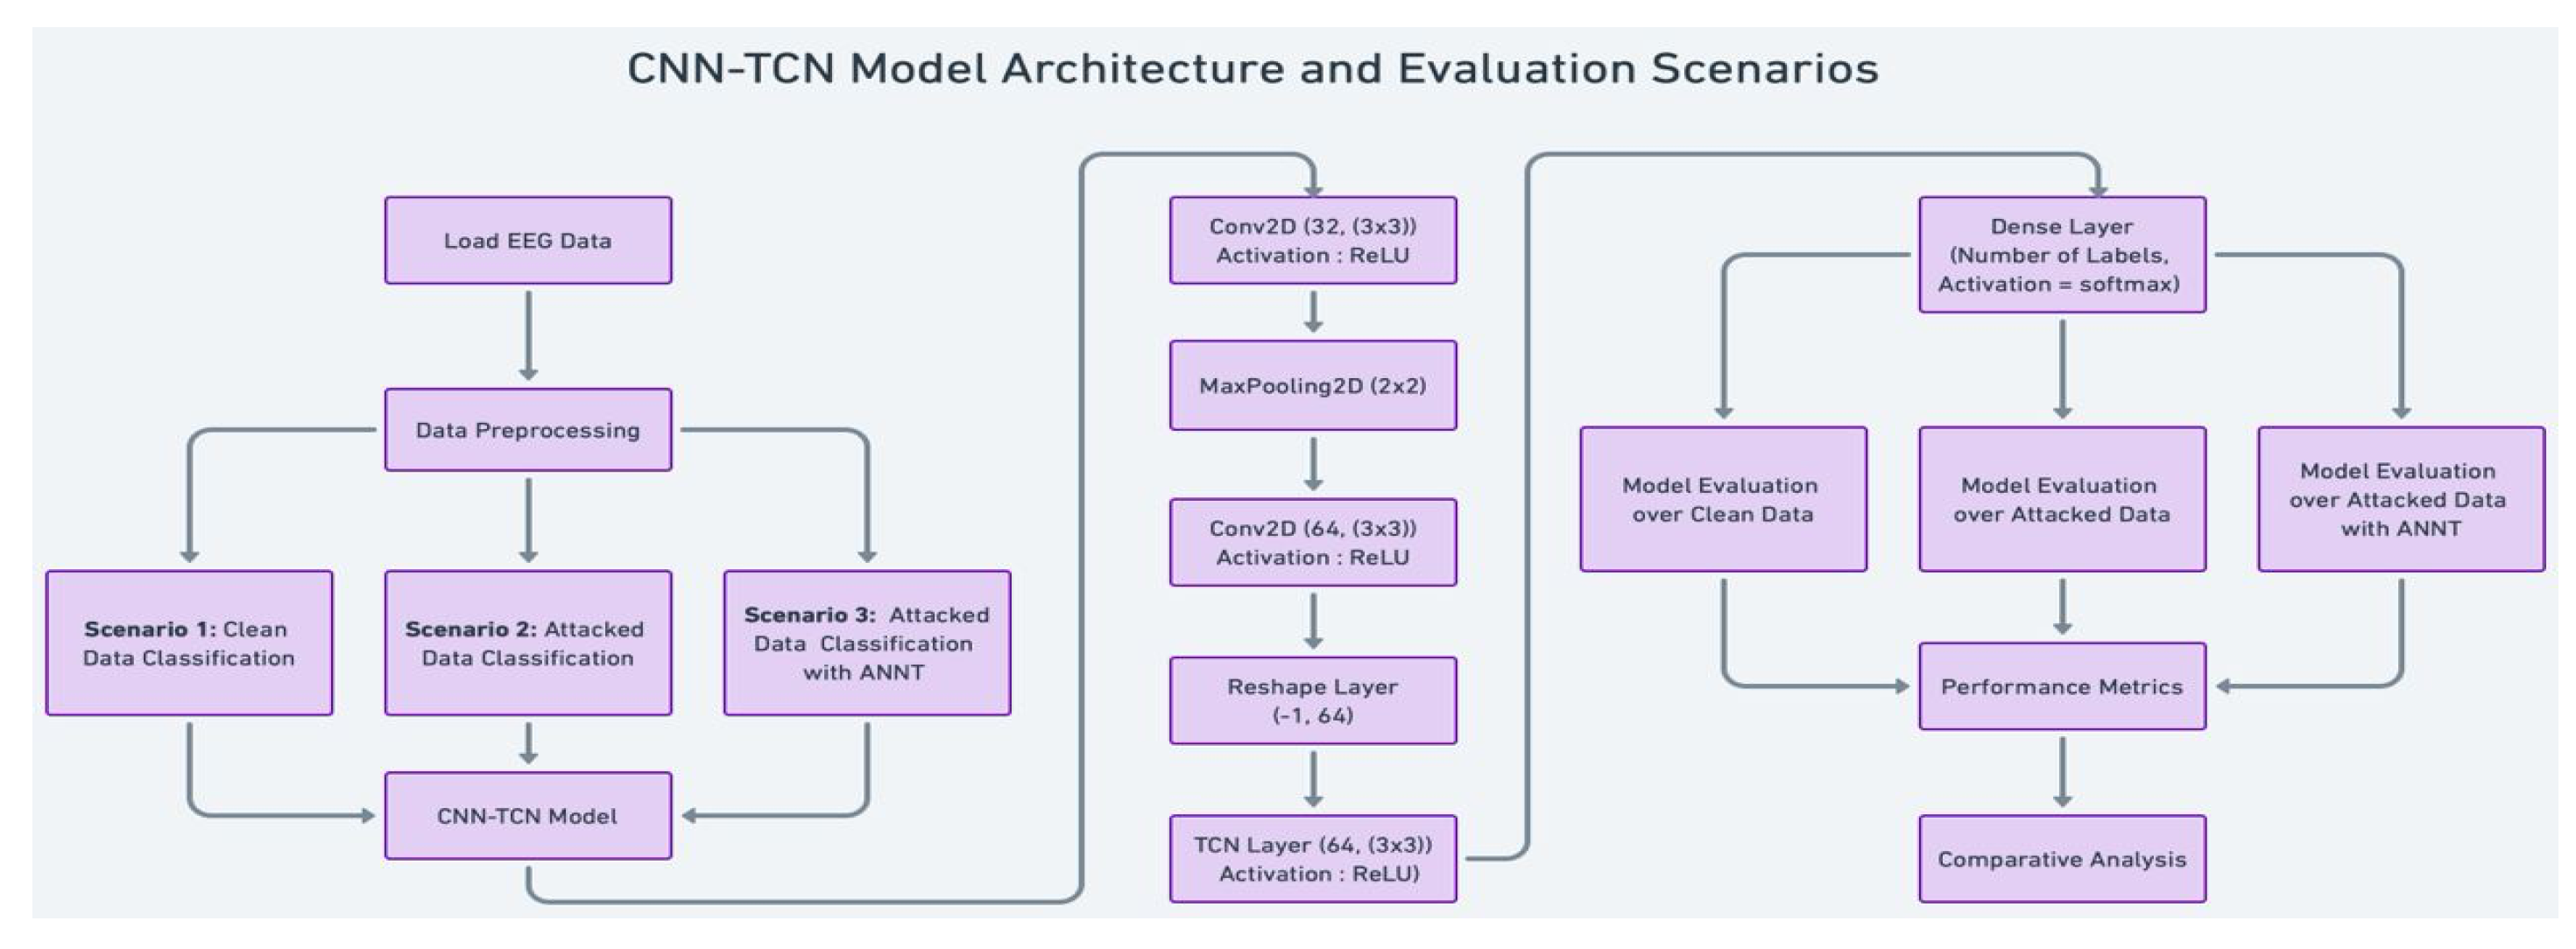
Figure 1. CNN-TCN Model Architecture and Evaluation Scenarios. This figure outlines the overall model architecture, showing the flow from loading EEG data, preprocessing, and CNN-TCN model layers to evaluating clean and attacked data scenarios, with and without ANNT [25].
Preprints 111131 g001

2.4. System Flow Process

The system flow process, depicted in Figure 2, follows the same comprehensive workflow from data acquisition to model evaluation as our previous work, ensuring the robustness and security of the B2B-C system using SSVEP data. The process consists of several crucial steps, which are outlined below.
  • Data Extraction: EEG data is extracted from Brain 1, capturing the neural responses to visual stimuli flickering at specific frequencies.
  • Preprocessing: The raw EEG data undergoes preprocessing steps, including normalization and filtering, to retain the relevant frequency components associated with SSVEP.
  • Label Vector Creation: Labels corresponding to the SSVEP stimuli are created and encoded for model training.
  • Feature Extraction:
    The preprocessed EEG data is split into training and evaluation sets.
    The CNN layers extract spatial features from the clean and attacked data.
    The TCN layers capture temporal dependencies in the EEG signals.
  • Adversarial Training:
    Adversarial examples are generated using the FGSM to simulate potential attacks, a method chosen for its effectiveness in challenging the model’s resilience, thereby evaluating its robustness against potential threats.
    The model is trained on clean and adversarially perturbed data using ANNT, enhancing its ability to recognize and resist adversarial patterns.
  • Classification and Model Output:
    The Dense layer classifies the EEG signals into the respective classes based on the extracted features.
    The model’s performance is evaluated using accuracy and AUC under clean and attacked scenarios.
  • Comparison and Analysis:
    The model’s performance is compared across different scenarios, with and without ANNT, to assess its robustness and security.
    The results are analyzed to identify the optimal conditions under which ANNT enhances the security and robustness of SSVEP-based B2B-C systems.
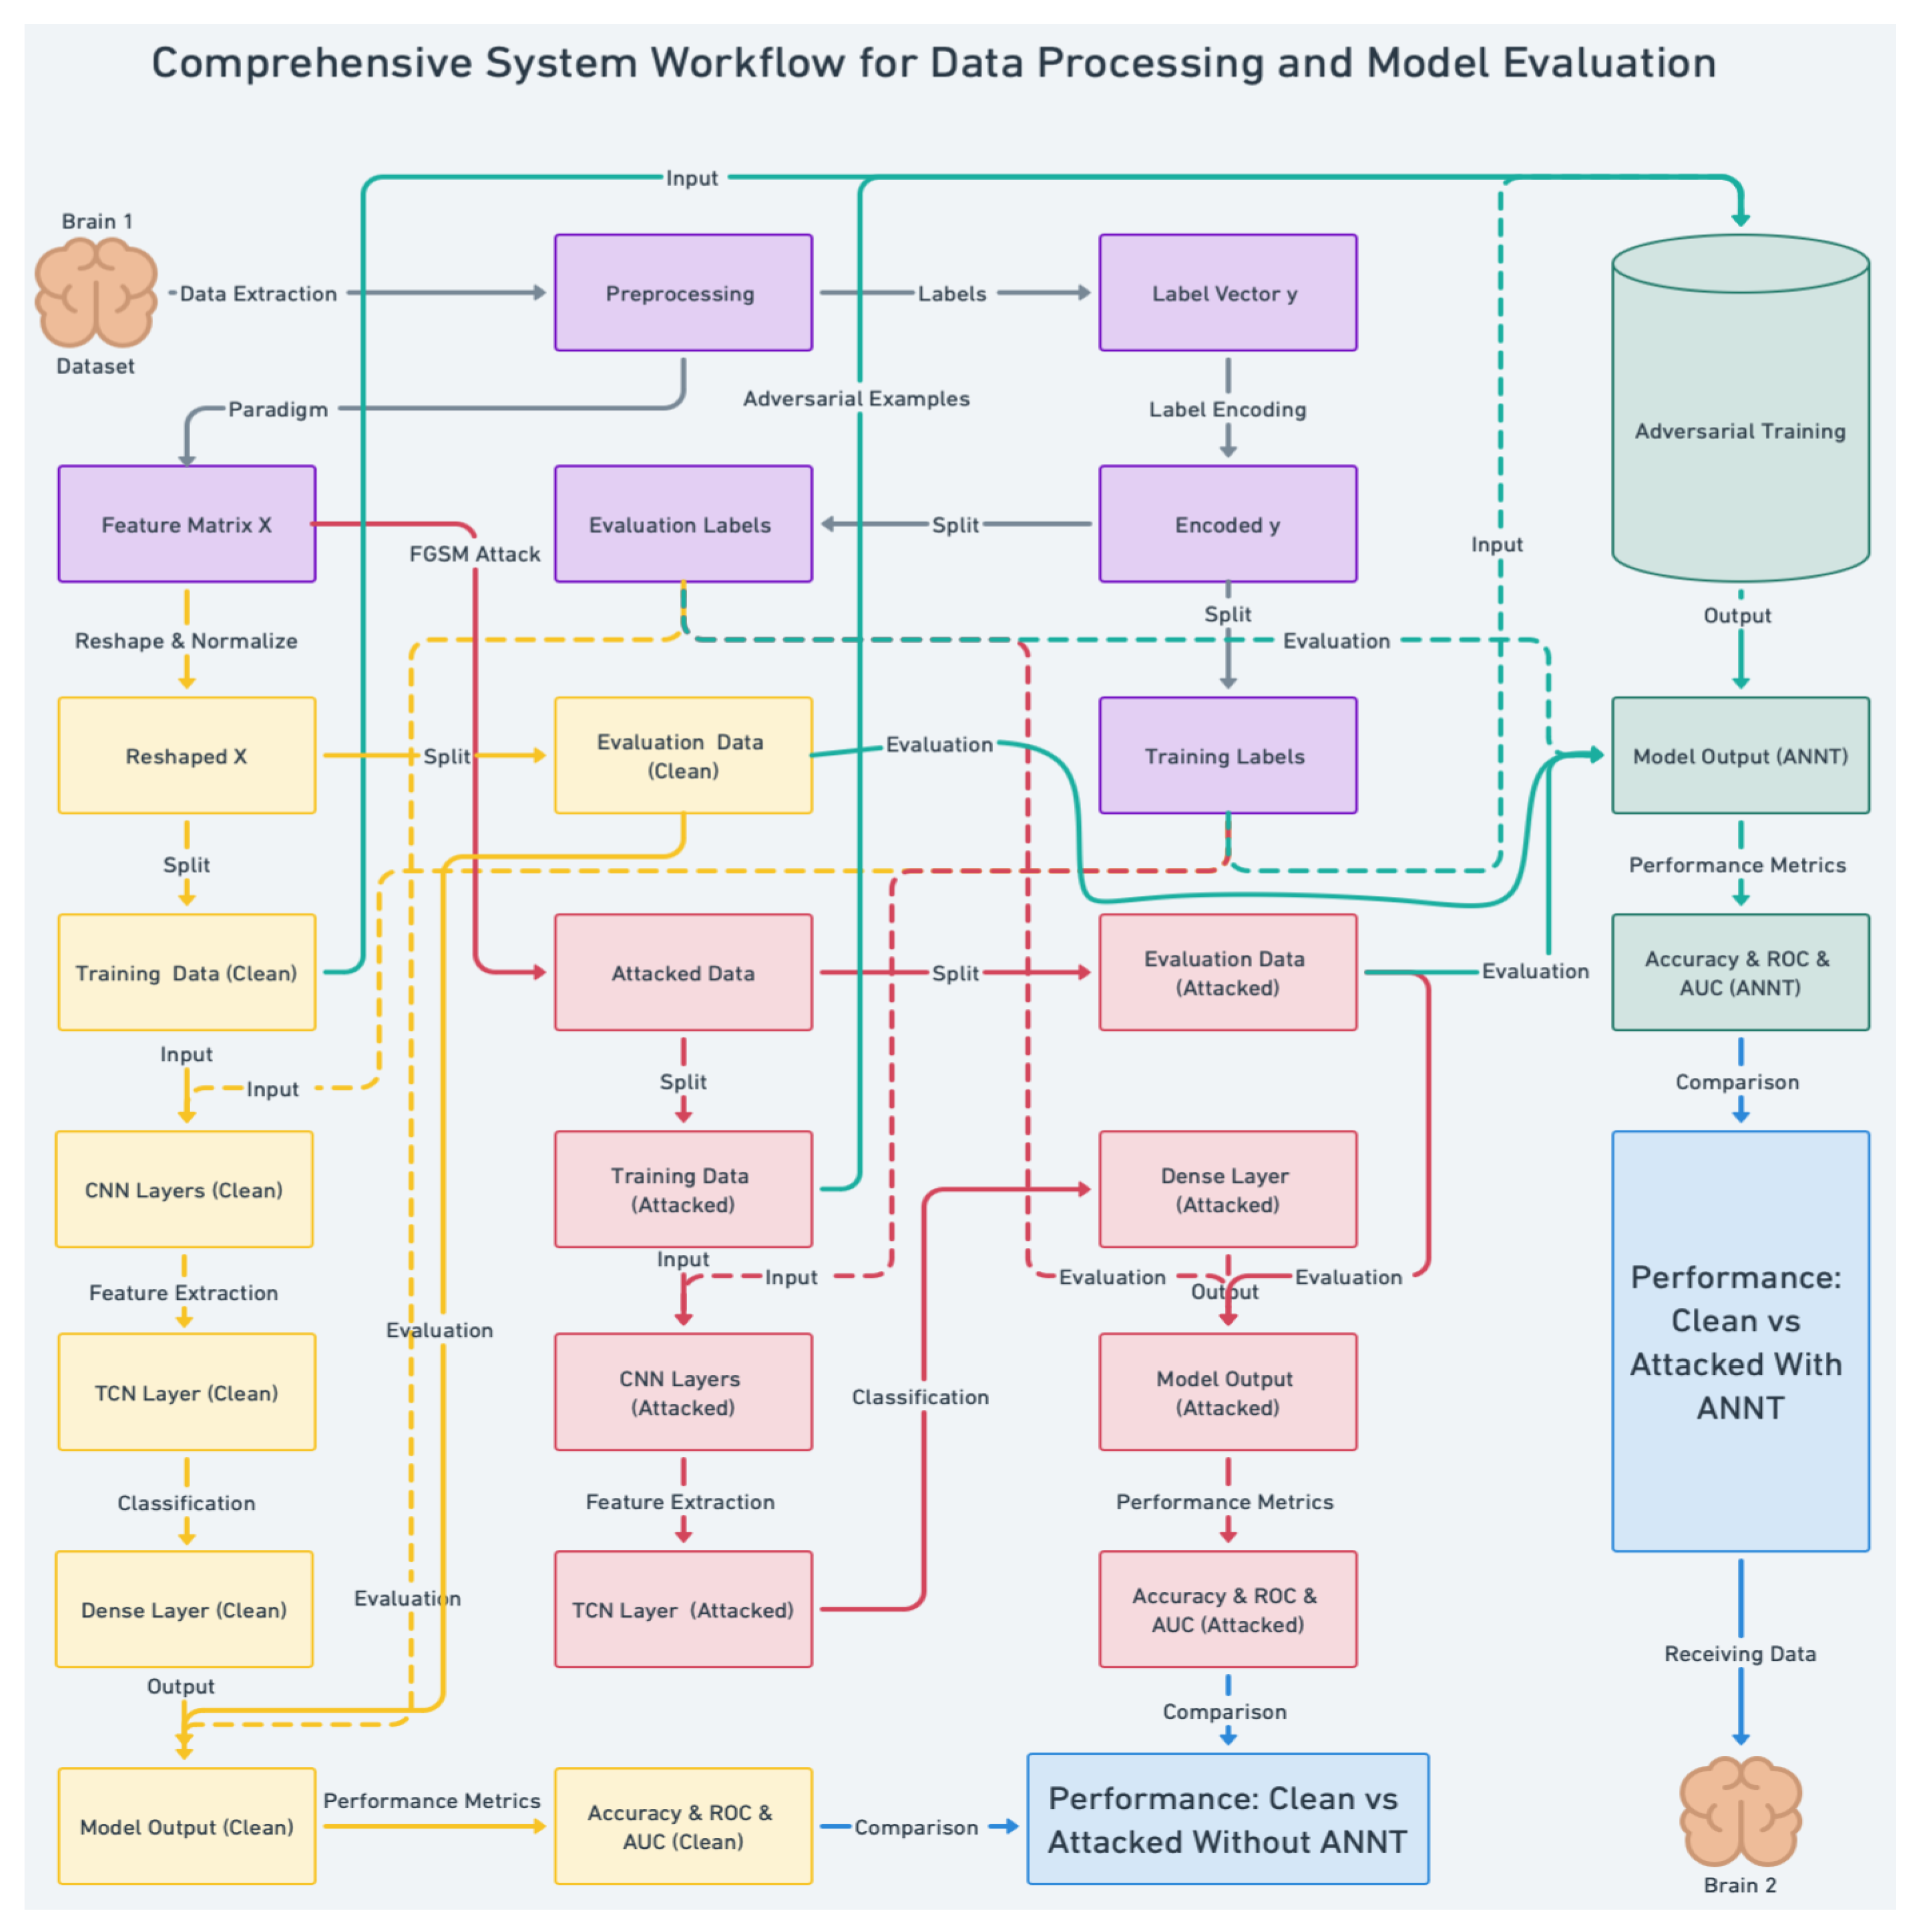
This detailed workflow ensures a thorough analysis and evaluation of the model’s performance, focusing on maintaining the integrity and security of B2B-C systems under adversarial conditions. Each phase of the workflow is delineated by distinctive color codes, illustrating the transition from preprocessing (highlighted in purple) to adversarial example generation and evaluation (in red) and from training with clean data (in yellow) to the comprehensive evaluation of the model performance with ANNT (in green). This visual demarcation aids in understanding the workflow’s complexity and the strategic interplay of various components aimed at securing a robust B2B-C framework. Furthermore, using dashed and straight lines distinguishes between the flow of evaluation and training labels and the progression of data processing steps. More details about this methodology can be found in our earlier publication [25].
Figure 2. Comprehensive Workflow of Data Processing and Model Evaluation: systematic progression from EEG data acquisition to model assessment. The workflow includes preprocessing (purple), the generation of adversarial examples and their evaluation (red), training with clean data (yellow), and the evaluation of model performance with ANNT (green). Each color highlights a specific phase in the process, detailing steps such as adversarial perturbation, feature extraction, classification, and the robustness conferred by ANNT. Dashed lines represent the flow of evaluation and training labels, while straight lines indicate the progression of data processing steps. The workflow compares clean vs attacked performance metrics with and without ANNT (blue) [25].
Preprints 111131 g002

3. Results

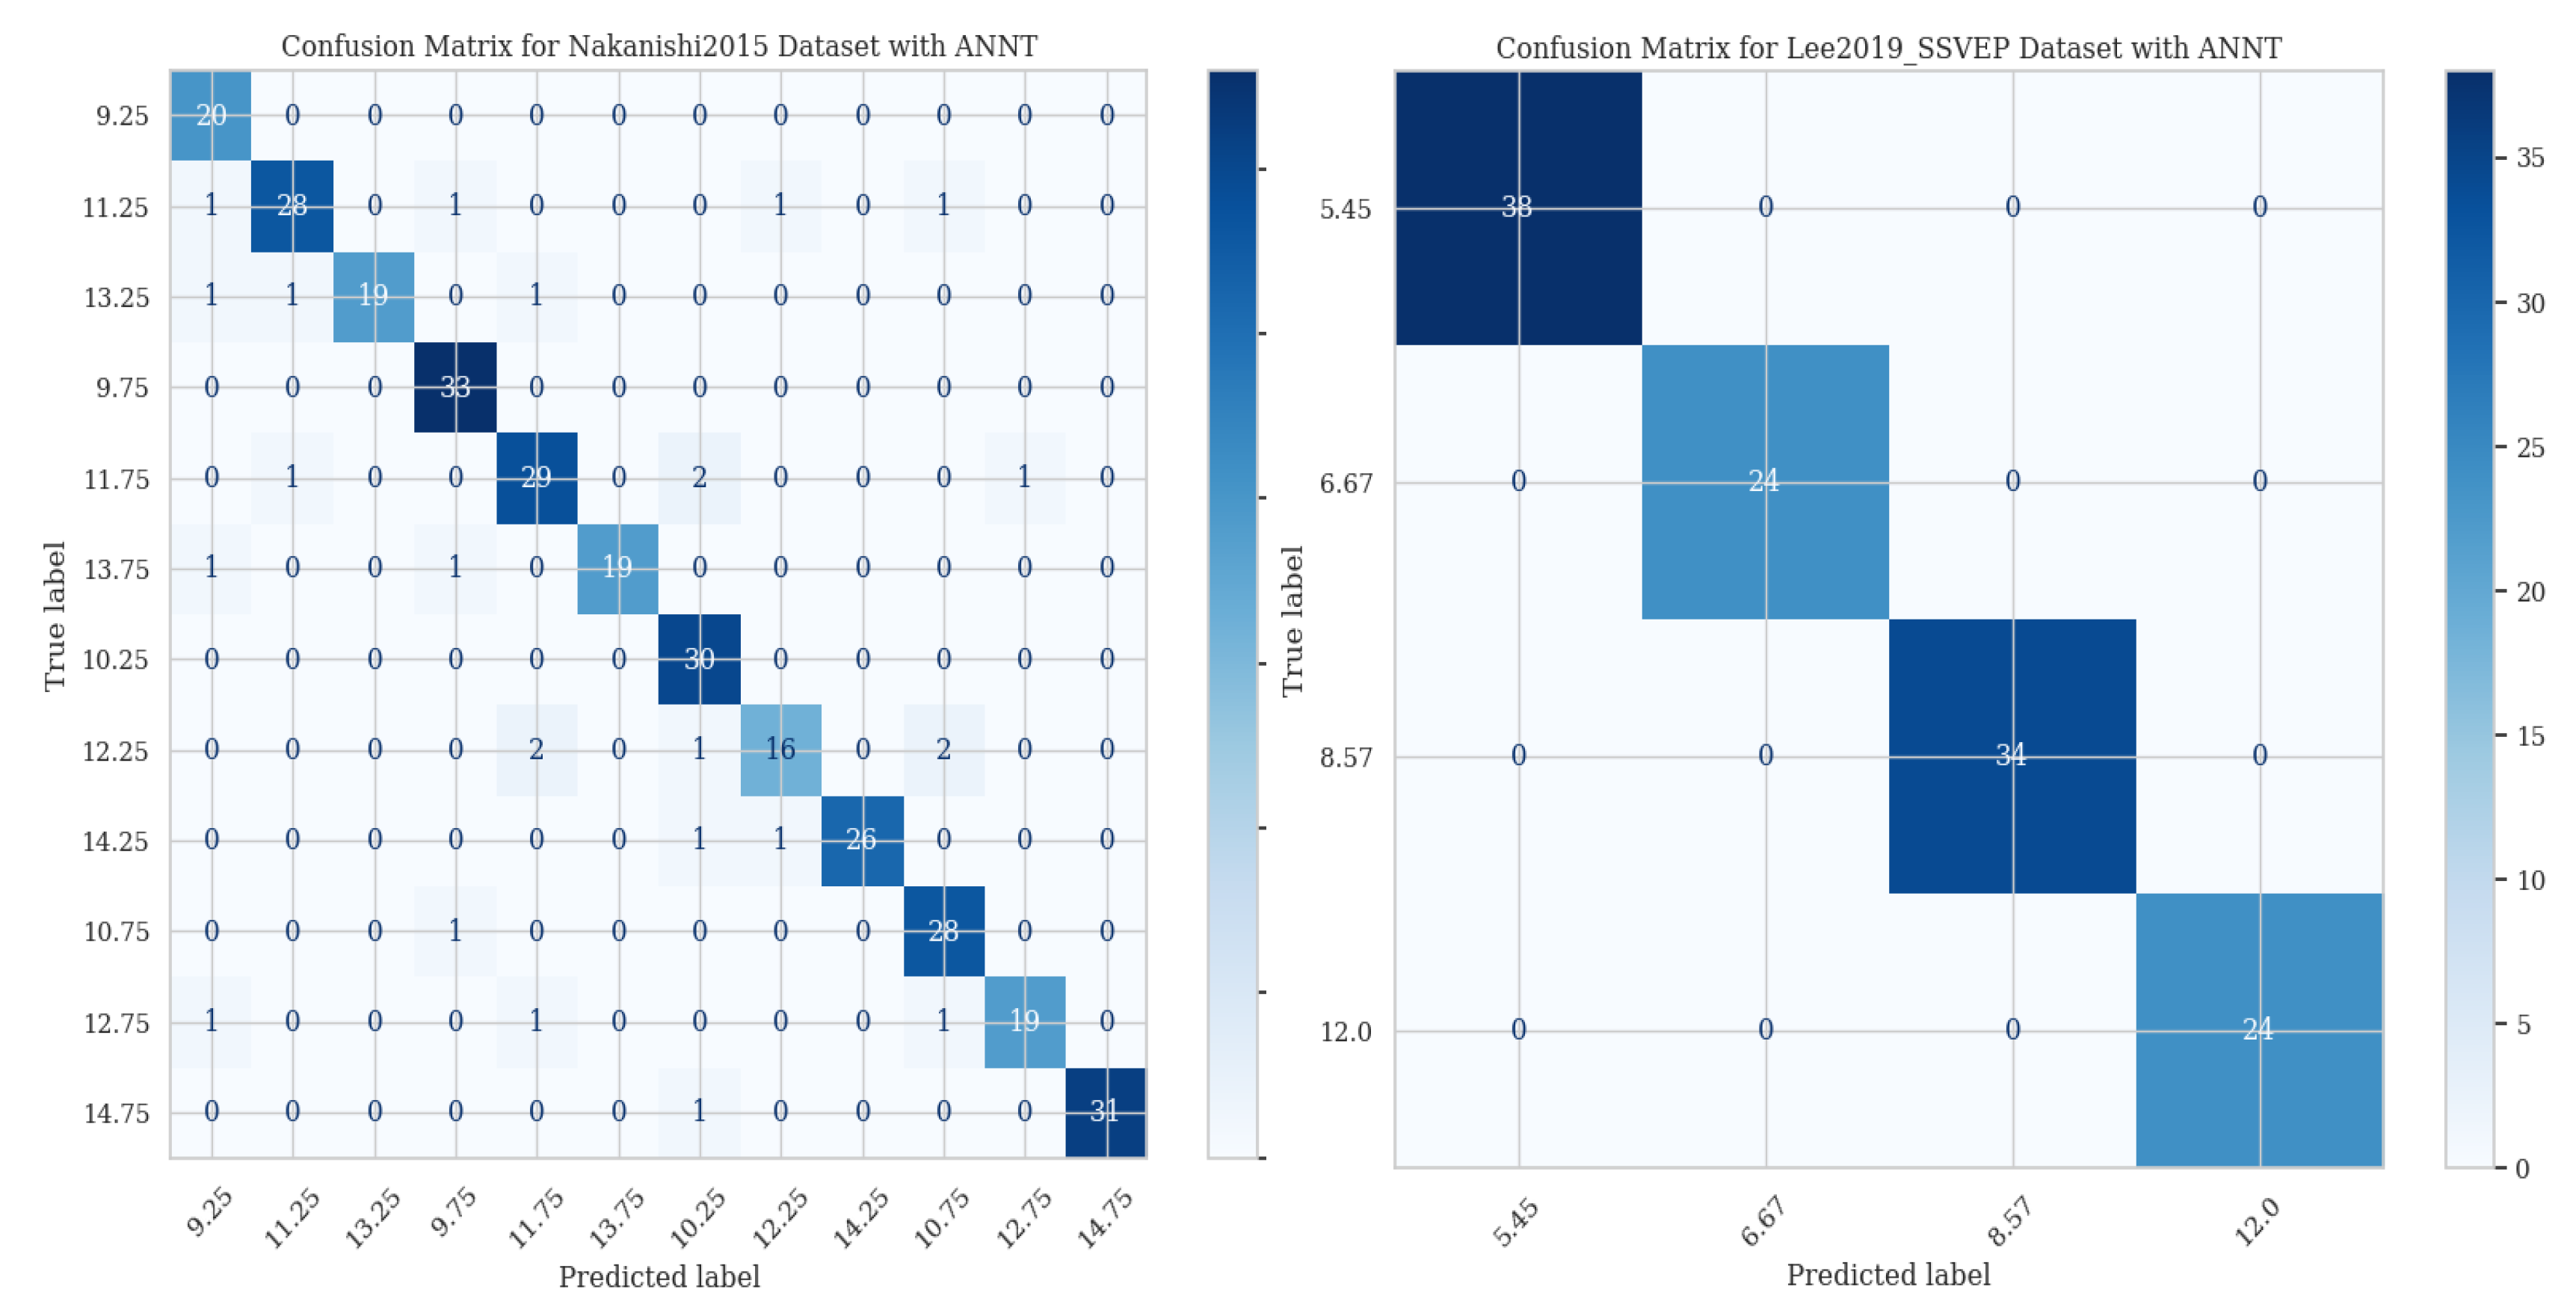
In this section, we present the performance of our proposed B2B-C system using SSVEP EEG data, evaluated with and without the application of ANNT. The primary focus is on the confusion matrices derived from the Nakanishi2015 and Lee2019_SSVEP datasets. These confusion matrices offer a detailed overview of the classification accuracy and error distribution across different classes of SSVEP stimuli. By analyzing the performance without ANNT, we establish a baseline that highlights the challenges posed by adversarial attacks and sets the stage for subsequent comparisons with ANNT-enhanced models. The confusion matrix is a fundamental evaluation tool in classification tasks. It provides insights into the model’s performance by displaying the number of true positive, true negative, false positive, and false negative predictions for each class. In the context of SSVEP-based B2B-C systems, understanding the distribution of these predictions is crucial for assessing the system’s reliability and identifying areas where adversarial attacks may exploit vulnerabilities. In Figure 3, we present the confusion matrices, showcasing the classification results without ANNT. These matrices illustrate the initial performance metrics, serving as a benchmark for subsequent comparisons with adversarially trained models.
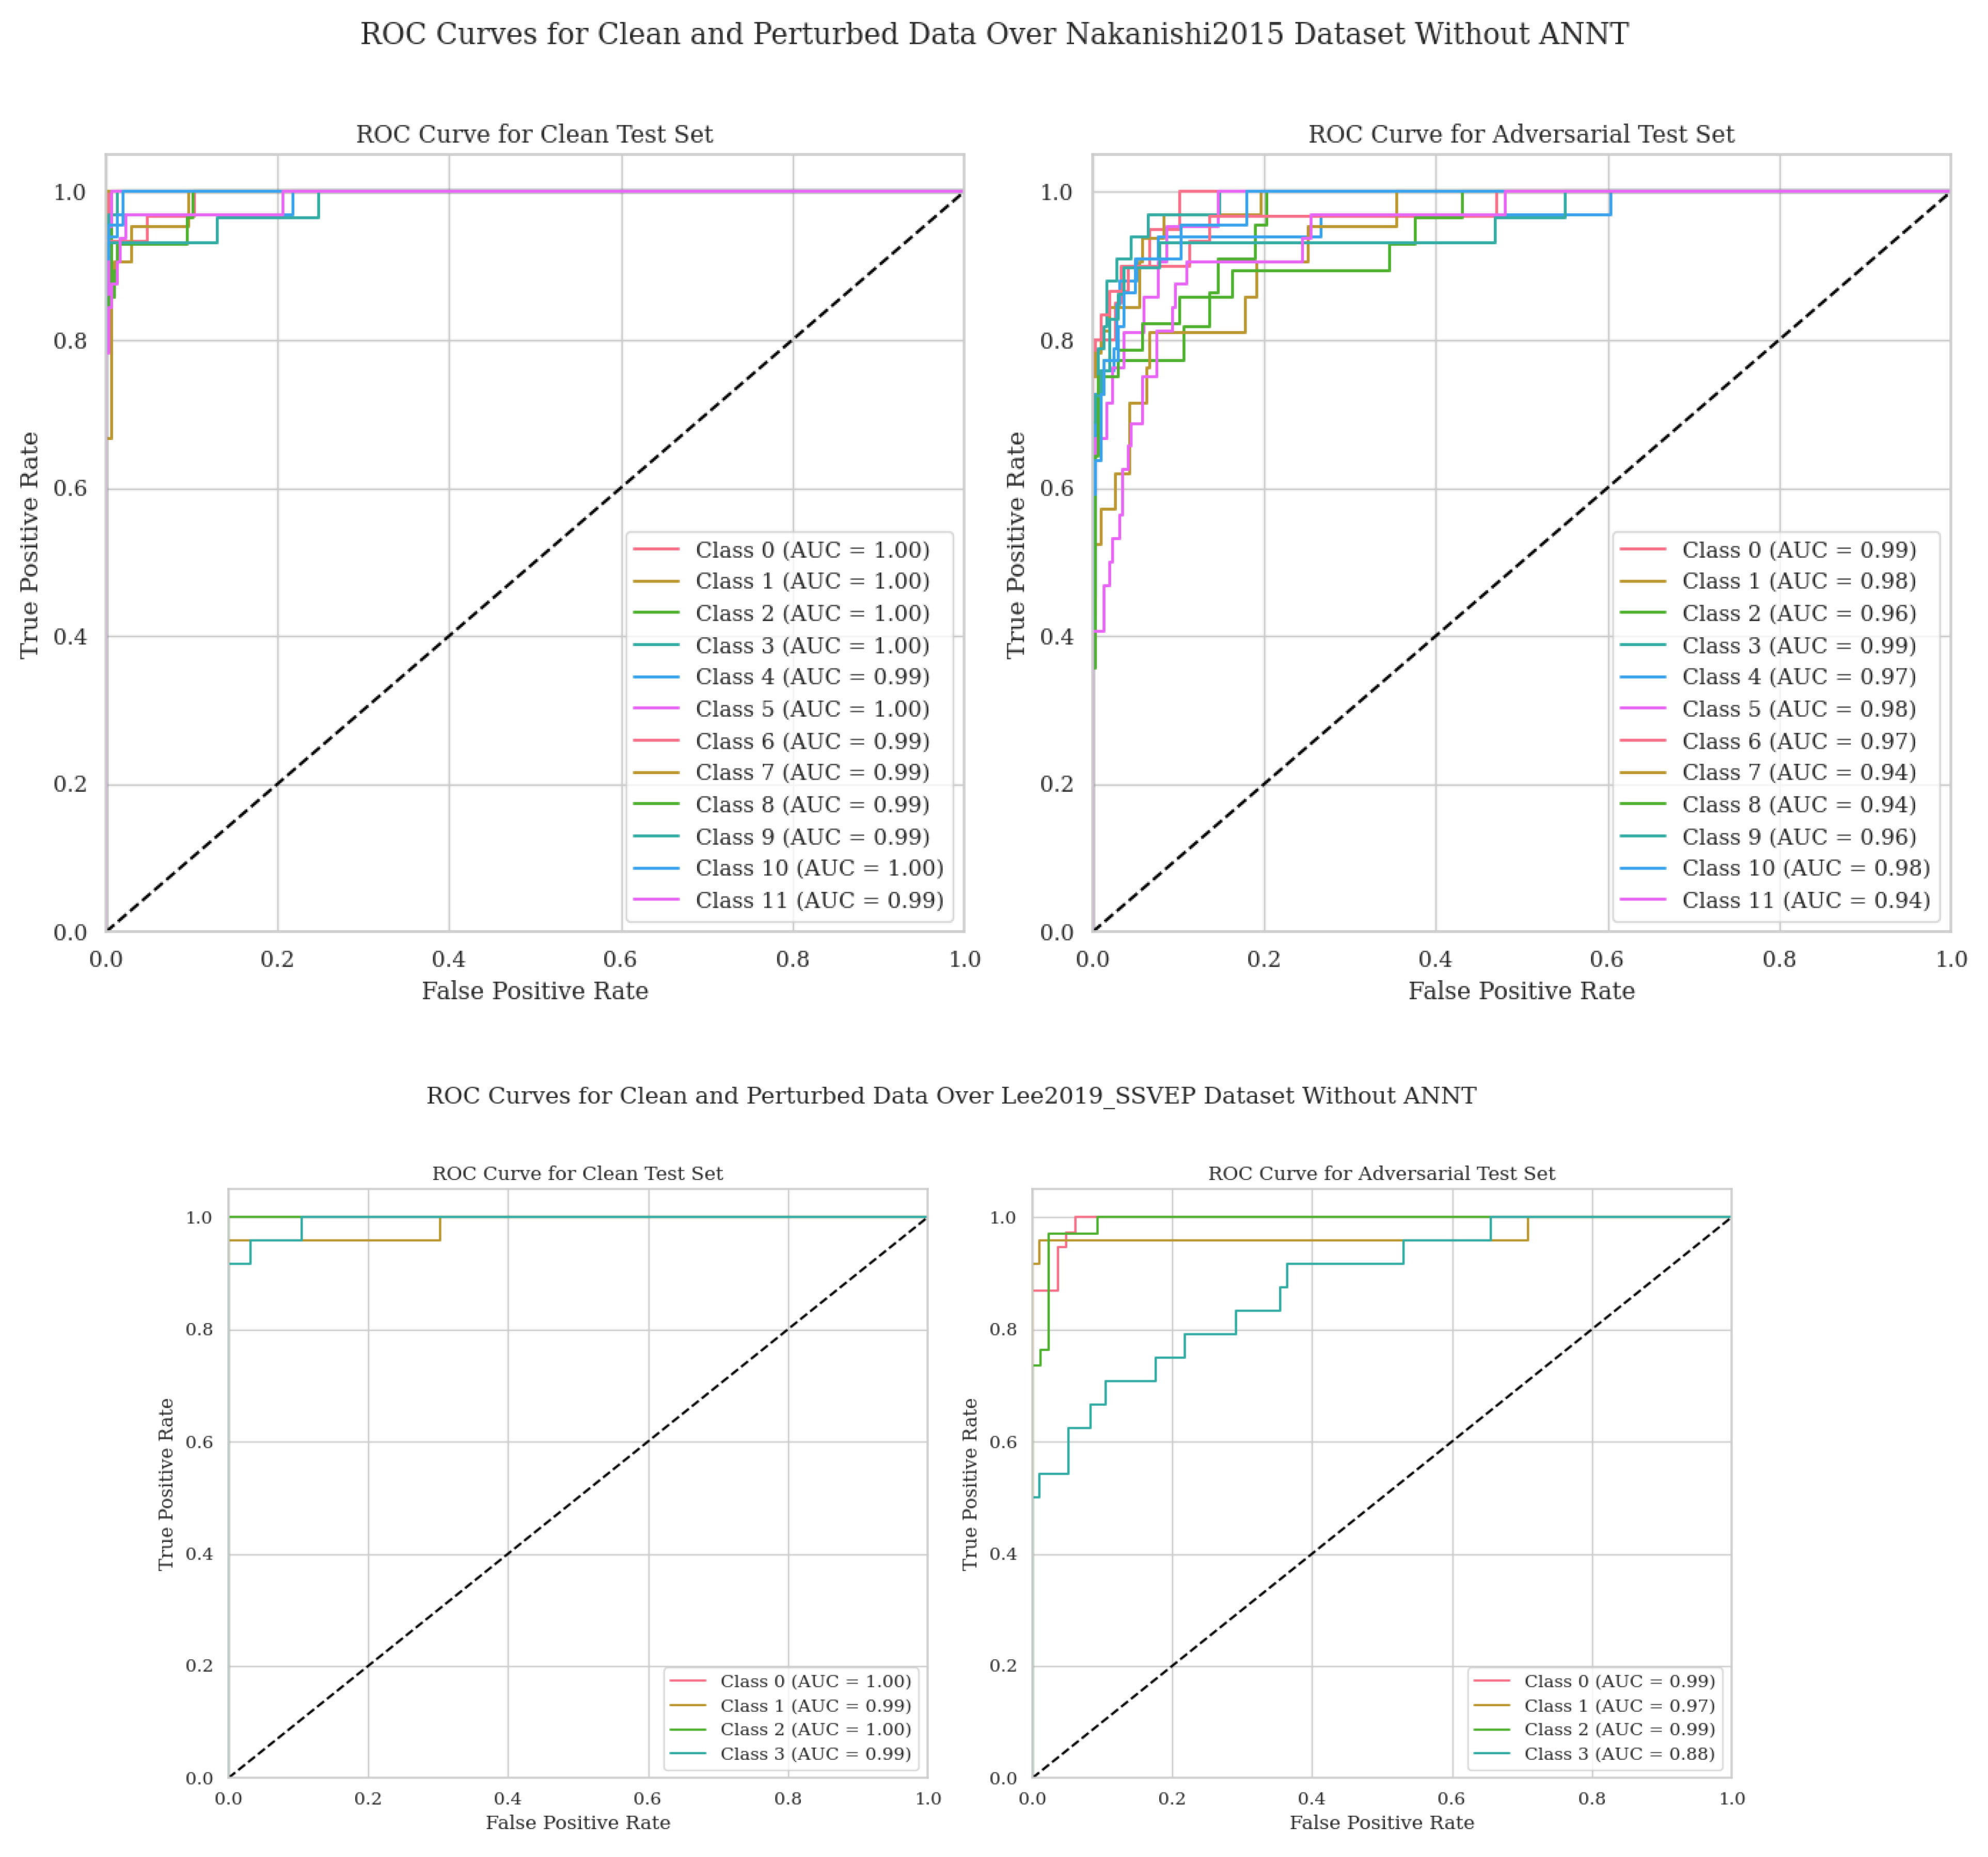
To better understand the model’s behavior when the data is attacked and ANNT has not yet been applied, we also present the Receiver Operating Characteristic (ROC) curves. These curves provide a comprehensive view of the model’s performance by illustrating the trade-off between sensitivity (true positive rate) and the false positive rate across different threshold settings. Analyzing the ROC curves helps us evaluate how well the model distinguishes between classes under clean and perturbed conditions. Figure 4 presents the ROC curves for the Nakanishi2015 and Lee2019_SSVEP datasets, highlighting the model’s performance without ANNT when subjected to adversarial attacks.
To evaluate the effectiveness of ANNT in enhancing the robustness and security of our B2B-C system, we present the confusion matrices after applying ANNT. By comparing these results with those obtained without ANNT, we can assess the impact of adversarial training on the system’s accuracy and resilience to potential attacks. Figure 5 illustrates the confusion matrices for the datasets after ANNT application, providing a clearer understanding of how the model’s performance benefits from this advanced training method.
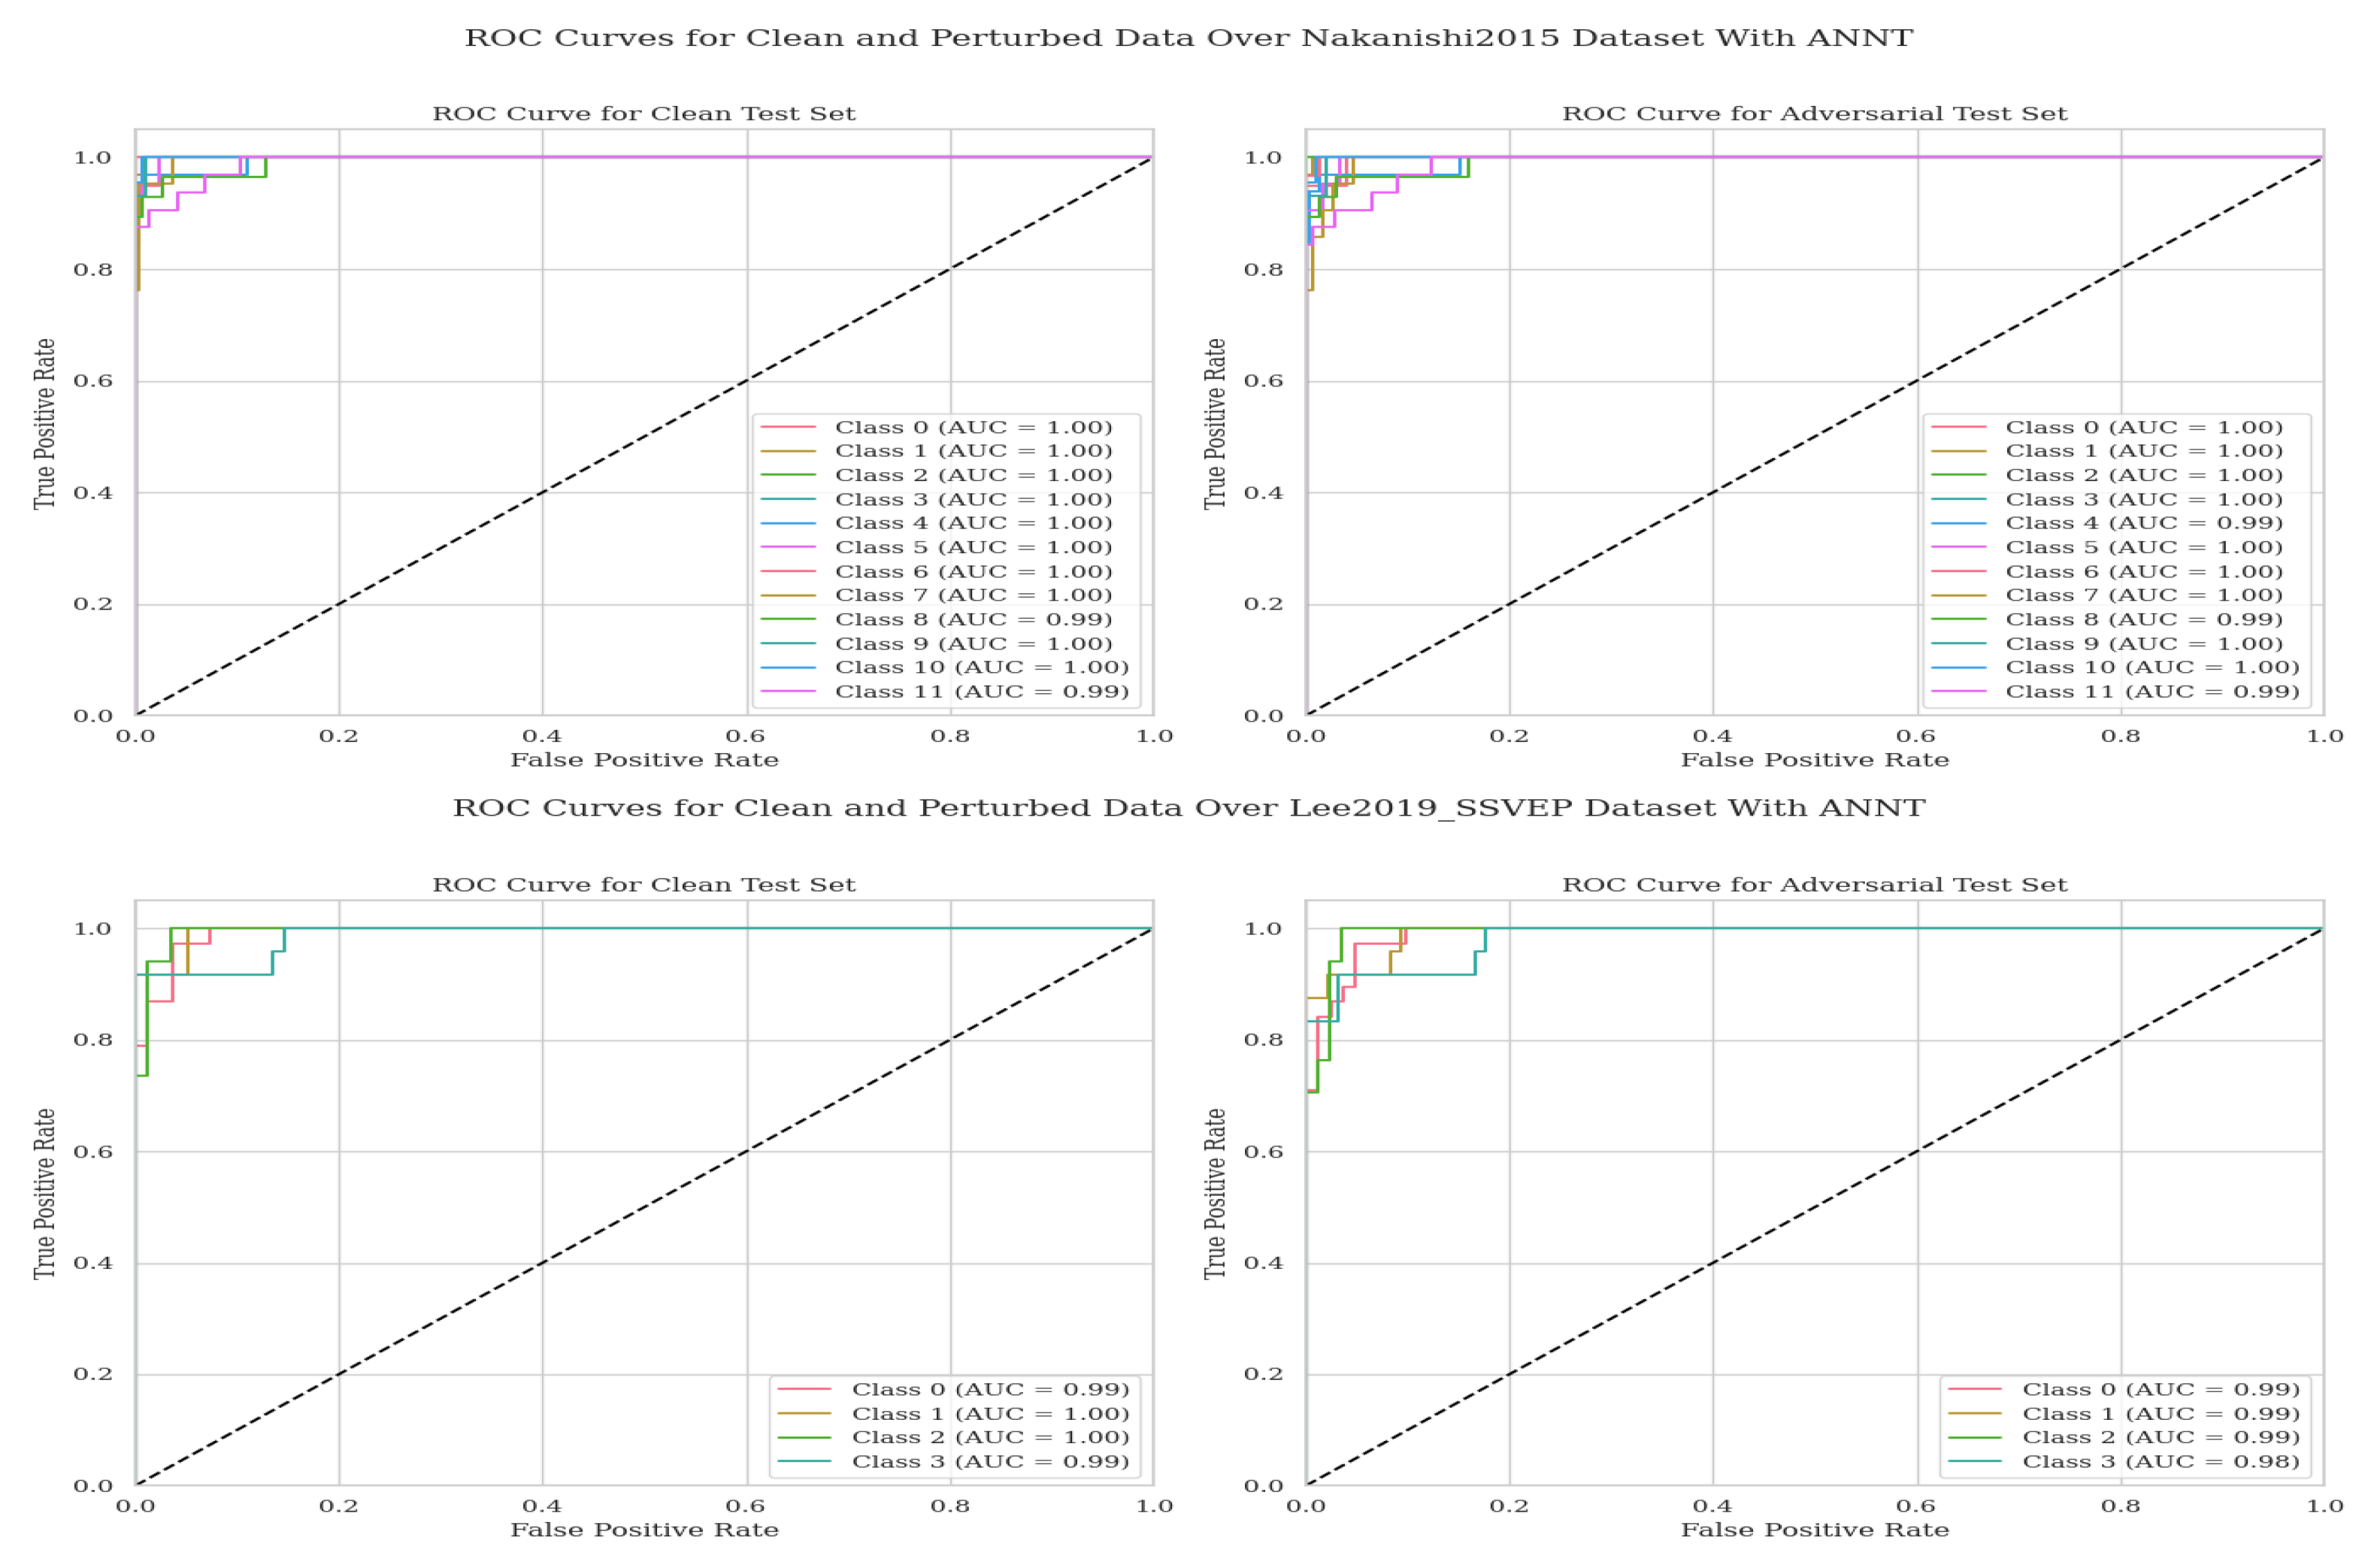
We plot the ROC curves for both datasets under clean and perturbed conditions to better understand the model’s performance after applying ANNT. Combined with the confusion matrices, these curves allow us to evaluate the model’s accuracy and AUC, providing a holistic view of its robustness and sensitivity. By comparing these ROC curves with those obtained without ANNT, we can better assess the effectiveness of adversarial training in enhancing the system’s resilience to potential attacks. Figure 6 presents the ROC curves for the Nakanishi2015 and Lee2019_SSVEP datasets, illustrating the model’s performance improvements with ANNT.

4. Discussion

In this section, we delve deeper into the implications of our findings, comparing them with the previous work [25] and discussing the broader impact on B2B-C systems. We systematically present and analyze the performance improvements observed with ANNT. In our previous work [25], we utilized ERP datasets, which are inherently imbalanced due to their binary classification nature, typically distinguishing between ’Target’ and ’Non-Target’ classes. This imbalance is a common characteristic of ERP datasets, making the AUC a more critical metric for evaluation than accuracy. AUC effectively captures the model’s performance across all possible classification thresholds, providing a comprehensive measure of its ability to differentiate between the two classes, which is essential in imbalanced data.
In contrast, our current study focuses on SSVEP datasets consisting of multiple balanced classes. Unlike ERP datasets, SSVEP datasets do not suffer from class imbalance, as they typically involve multiple evenly distributed classes. Consequently, accuracy becomes a more relevant and important metric for performance evaluation in this context. Accuracy directly measures the proportion of correctly classified instances, offering a straightforward and meaningful evaluation metric for balanced datasets. Thus, it is crucial to emphasize this distinction when evaluating the performance of our model on SSVEP datasets, as the balanced nature of the classes in SSVEP datasets makes accuracy a more appropriate and indicative measure of the model’s effectiveness compared to AUC. Table 1 summarizes the performance improvements in terms of AUC and accuracy for both the Nakanishi2015 and Lee2019_SSVEP datasets.
Table 1. Performance Improvements with ANNT
Dataset Condition Class AUC without ANNT AUC with ANNT Improvement
Nakanishi2015 Clean 1 1.00 1.00 0.00
2 1.00 1.00 0.00
3 1.00 1.00 0.00
4 1.00 1.00 0.00
5 0.99 1.00 0.01
6 1.00 1.00 0.00
7 0.99 1.00 0.01
8 0.99 1.00 0.01
9 0.99 0.99 0.00
10 0.99 1.00 0.01
11 1.00 1.00 0.00
12 0.99 0.99 0.00
Nakanishi2015 Attacked 1 0.99 1.00 0.01
2 0.98 1.00 0.02
3 0.96 1.00 0.04
4 0.99 1.00 0.01
5 0.97 0.99 0.02
6 0.98 1.00 0.02
7 0.97 1.00 0.03
8 0.94 1.00 0.06
9 0.94 0.99 0.05
10 0.96 1.00 0.04
11 0.98 1.00 0.02
12 0.94 0.99 0.05
Lee2019_SSVEP Clean 1 1.00 0.99 -0.01
2 0.99 1.00 0.01
3 1.00 1.00 0.00
4 0.99 0.99 0.00
Lee2019_SSVEP Attacked 1 0.99 0.99 0.00
2 0.97 0.99 0.02
3 0.99 0.99 0.00
4 0.88 0.98 0.10
Dataset Condition Accuracy without ANNT Accuracy with ANNT
Nakanishi2015 Attacked 0.75 0.92
Lee2019_SSVEP Attacked 0.93 1.00
Metric Nakanishi2015 Improvement Lee2019_SSVEP Improvement
Average AUC Improvement (Clean) 0.003 0.00
Average AUC Improvement (Attacked) 0.03 0.03
Accuracy Improvement 0.17 0.07
Metric Overall Improvement
Average AUC Improvement (Clean) 0.0015
Average AUC Improvement (Attacked) 0.03
Accuracy Improvement 0.12

4.1. Key Findings

  • Effectiveness of ANNT: Our study reaffirms the effectiveness of ANNT in enhancing the robustness and security of B2B-C systems. Consistent with our previous findings, ANNT significantly improves accuracy and AUC, particularly under adversarial conditions. This indicates that ANNT is reliable for fortifying B2B-C systems against potential attacks.
  • Impact of Dataset Characteristics:
    Subject and Channel Count: The Lee2019_SSVEP dataset, with its higher subject and channel count, demonstrates superior baseline performance and significant improvement with ANNT. This suggests that datasets with more diverse and extensive data can benefit greatly from adversarial training.
    Number of Classes: The Nakanishi2015 dataset highlights the challenges of complex classification tasks with its larger number of classes. The substantial accuracy improvement with ANNT for this dataset underscores the method’s effectiveness in handling multi-class scenarios.
    Sampling Rate and Data Quality: The higher sampling rate of the Lee2019_SSVEP dataset contributes to better baseline performance. However, ANNT’s ability to enhance performance in the lower-resolution Nakanishi2015 dataset indicates its robustness across varying data quality levels.
    Trial Length and Number of Trials: The significant number of trials in the Lee2019_SSVEP dataset supports better learning and generalization. ANNT’s effectiveness in the Nakanishi2015 dataset with fewer trials suggests its potential in limited-data scenarios.

4.2. Comparison with Previous Work

Our results align with those reported in the previous paper [25], further validating the impact of ANNT on improving B2B-C systems. The observed 17% increase in adversarial accuracy and 0.12-point improvement in AUC align closely with our new results. Specifically, our study shows an accuracy improvement of 17% for the Nakanishi2015 dataset and 7% for the Lee2019_SSVEP dataset, with an overall average AUC improvement of 0.03-point under attacked conditions. These findings demonstrate the reproducibility and consistency of ANNT’s benefits, underscoring its potential for enhancing the security and robustness of B2B-C systems across different datasets and conditions.

4.3. Broader Impact and Implications

  • Robustness and Security: The consistent improvements in robustness and security with ANNT across different datasets highlight its potential as a standard approach for enhancing B2B-C systems. This is crucial for security applications, such as medical and military communications.
  • Dataset Design Considerations: Our findings suggest that when designing datasets for B2B-C systems, factors such as the number of classes, channels, sampling rate, and trial length should be carefully considered. These factors influence baseline performance and how adversarial training can improve system robustness.
  • Future Research Directions:
    Exploring Other Adversarial Techniques: While ANNT has proven effective, exploring other adversarial training techniques could further enhance robustness and security.
    Larger and More Diverse Datasets: Future research should focus on larger and more diverse datasets to validate these findings and understand the limitations of ANNT.
    Real-World Applications: Implementing ANNT in real-world B2B-C systems will be crucial to understanding its practical implications and any challenges that may arise.
    Normalization Limitations: The normalization process, while reducing variability and improving analysis performance, may lead to the loss of information regarding differences in EEG amplitude distribution on the scalp. Future research could explore advanced techniques to preserve this amplitude distribution information while achieving the desired standardization.
    Exploring Additional Attacks: Future work should consider and apply other types of attacks, such as jamming and eavesdropping, to further test the robustness and security of the B2B-C systems. Investigating countermeasures against these attacks will provide a more comprehensive understanding of system vulnerabilities and defenses.

5. Conclusion

Our study confirms the effectiveness of ANNT in enhancing the robustness and security of B2B-C systems, aligning well with the findings from previous research [25]. The consistent improvements in accuracy and AUC with ANNT reinforce the previous study’s conclusions. This demonstrates ANNT’s reliability and applicability across different datasets, highlighting its potential as a standard approach for securing B2B-C systems against adversarial attacks.
Moreover, our detailed analysis of dataset characteristics provides further insights into how specific features influence the efficacy of ANNT. This underscores the importance of considering subject and channel count, number of classes, sampling rate, and trial duration in model training and evaluation.
In addition to adversarial attacks, our research suggests that future work should consider exploring other types of attacks, such as jamming and eavesdropping. Investigating these additional threats and developing appropriate countermeasures will provide a more comprehensive security framework for B2B-C systems, ensuring their robustness and availability in real-world applications.
In summary, our findings underscore the significant impact of ANNT on improving the accuracy and robustness of B2B-C systems. Future research should continue to explore this promising area, focusing on practical implementations, further refinement of adversarial techniques, and addressing additional security threats to enhance neural communication technologies’ overall security and efficiency.

Author Contributions

Conceptualization, H.A., A.K., and L.M.; methodology, H.A.; software, H.A. and M.K.; validation, H.A.; formal analysis, H.A. and M.K.; investigation, H.A.; resources A.K. and L.M.; data curation, H.A.; writing—original draft preparation, H.A.; writing—review and editing, A.K. and L.M.; visualization, H.A.; supervision, A.K. and L.M. All authors have read and agreed to the published version of the manuscript.

Funding

This research received no external funding.

Informed Consent Statement

Not applicable

Conflicts of Interest

The authors declare no conflicts of interest.

Abbreviations

The following abbreviations are used in this manuscript:
ANNT Adversarial Neural Network Training
AUC Area Under the Curve
B2B-C Brain-to-Brain Communication
BCI Brain-Computer Interface
CAR Common Average Reference
CNN Convolutional Neural Network
DL Deep Learning
EEG Electroencephalography
EMG Electromyography
ERP Event-Related Potentials
FGSM Fast Gradient Sign Method
ML Machine Learning
ROC Receiver Operating Characteristic
SSVEP Steady-State Visually Evoked Potentials
TCN Temporal Convolutional Network
WS-AIEC Weighted and Stacked Adaptive Integrated Ensemble Classifier

References

  1. Grau, C., Ginhoux, R., Riera, A., Nguyen, T. L., Chauvat, H., Berg, M., & Amengual, J. L. (2014). Conscious Brain-to-Brain Communication in Humans Using Non-Invasive Technologies. PLOS ONE, 9(8), e105225. [CrossRef]
  2. Lebedev, M., Kunicki, C., Wang, J., & Nicolelis, M. A. (2013). A Brain-to-Brain Interface for Real-Time Sharing of Sensorimotor Information. Scientific Reports 2013, 3, 1-10. [CrossRef]
  3. Hindley, N., Sanchez Avila, A., & Henstridge, C. (2023). Bringing synapses into focus: Recent advances in synaptic imaging and mass-spectrometry for studying synaptopathy. Frontiers in Synaptic Neuroscience, 15, 1130198. [CrossRef]
  4. Saeidi, M., Karwowski, W., Farahani, F. V., Fiok, K., Taiar, R., & Hancock, P. A. (2021). Neural Decoding of EEG Signals with Machine Learning: A Systematic Review. Brain Sciences, 11(11), 1525. [CrossRef]
  5. Dattola, S., Morabito, F. C., Mammone, N., & La Foresta, F. Findings about LORETA Applied to High-Density EEG—A Review. Electronics, 9(4), 660. [CrossRef]
  6. Fares, A., Zhong, S. & Jiang, J. EEG-based image classification via a region-level stacked bi-directional deep learning framework. BMC Medical Informatics and Decision Making, 19(Suppl 6), 268 (2019). [CrossRef]
  7. Walther, D., Viehweg, J., Haueisen, J. & Mäder, P. (2023). A systematic comparison of deep learning methods for EEG time series analysis. Frontiers in Neuroinformatics, 17:1067095. [CrossRef]
  8. Rong, J., Sun, R., Guo, Y., & He, B. (2023). Effects of EEG Electrode Numbers on Deep Learning-Based Source Imaging. In: Liu, F., Zhang, Y., Kuai, H., Stephen, E.P., Wang, H. (eds) Brain Informatics. BI 2023. Lecture Notes in Computer Science(), vol 13974. Springer, Cham. [CrossRef]
  9. Orban, M., Elsamanty, M., Guo, K., Zhang, S., & Yang, H. (2022). A Review of Brain Activity and EEG-Based Brain–Computer Interfaces for Rehabilitation Application. Bioengineering, 9(12), 768. [CrossRef]
  10. Müller-Putz, G. R., Scherer, R., Brauneis, C., & Pfurtscheller, G. (2005). Steady-state visual evoked potential (SSVEP)-based communication: impact of harmonic frequency components. Journal of Neural Engineering, 2(4), 123. [CrossRef]
  11. Zhang, Y., Xu, P., Liu, T., Hu, J., Zhang, R., & Yao, D. (2012). Multiple Frequencies Sequential Coding for SSVEP-Based Brain-Computer Interface. PLOS ONE, 7(3), e29519. [CrossRef]
  12. Diez, P. F., Mut, V. A., Avila Perona, E. M. et al. (2011). Asynchronous BCI control using high-frequency SSVEP. Journal of NeuroEngineering and Rehabilitation, 8, 39. [CrossRef]
  13. Sergio, L. B., et al. (2021). Security in Brain-Computer Interfaces: State of the Art, Opportunities, and Future Challenges. ACM Computing Surveys, 54(1), Article 11. [CrossRef]
  14. Yoo, S., Kim, H., Filandrianos, E., Taghados, S. J., & Park, S. (2013). Non-Invasive Brain-to-Brain Interface (BBI): Establishing Functional Links between Two Brains. PLOS ONE, 8(4), e60410. [CrossRef]
  15. Dongrui, W., et al. (2023). Adversarial attacks and defenses in physiological computing: a systematic review. National Science Open, 2(1). [CrossRef]
  16. Adesina, D., Hsieh, C.-C., Sagduyu, Y. E., & Qian, L. (2023). Adversarial Machine Learning in Wireless Communications Using RF Data: A Review. IEEE Communications Surveys & Tutorials, 25(1), 77-100.
  17. Donchin, E., Spencer, K. M., & Wijesinghe, R. (2000). The mental prosthesis: assessing the speed of a P300-based brain-computer interface. IEEE Transactions on Rehabilitation Engineering, 8(2), 174-179. [CrossRef]
  18. Wolpaw, J. R., & McFarland, D. J. (2004). Control of a two-dimensional movement signal by a noninvasive brain-computer interface in humans. Proceedings of the National Academy of Sciences, 101(51), 17849-17854. [CrossRef]
  19. Buzsáki, G. (2006). Rhythms of the Brain. Oxford University Press.
  20. Ahmadi, H., & Mesin, L. (2024). Enhancing Motor Imagery Electroencephalography Classification with a Correlation-Optimized Weighted Stacking Ensemble Model. Electronics, 13(6), 1033. [CrossRef]
  21. Ahmadi, H., & Mesin, L. (2024). Enhancing MI EEG Signal Classification with a Novel Weighted and Stacked Adaptive Integrated Ensemble Model: A Multi-Dataset Approach, IEEE Access, submitted, 2024.
  22. Rao, R. P., Stocco, A., Bryan, M., Sarma, D., Youngquist, T. M., Wu, J., & Prat, C. S. (2014). A Direct Brain-to-Brain Interface in Humans. PLOS ONE, 9(11), e111332. [CrossRef]
  23. Rajesh, S., Paul, V., Menon, V. G., Jacob, S., & Vinod, P. (2020). Secure Brain-to-Brain Communication With Edge Computing for Assisting Post-Stroke Paralyzed Patients. IEEE Internet of Things Journal, 7(4), 2531-2538. [CrossRef]
  24. Ajmeria, R., Sharma, N., Kalyani, N., Iyer, B., Kamal, M. K., & Pathan, M. (2023). A Critical Survey of EEG-Based BCI Systems for Applications in Industrial Internet of Things. IEEE Communications Surveys & Tutorials, 25(1), 184-212. [CrossRef]
  25. Ahmadi, H., Kuhestani, A., & Mesin, L. (2024). Adversarial Neural Network Training for Secure and Robust Brain-to-Brain Communication. IEEE Access, 12, 39450-39469.
  26. Nakanishi, M., Wang, Y., Wang, T., & Jung, P. (2015). A Comparison Study of Canonical Correlation Analysis Based Methods for Detecting Steady-State Visual Evoked Potentials. PLOS ONE, 10(10), e0140703. [CrossRef]
  27. Lee, M., Kwon, O., Kim, Y., Kim, H., Lee, Y., Williamson, J., Fazli, S., & Lee, S. (2019). EEG dataset and OpenBMI toolbox for three BCI paradigms: An investigation into BCI illiteracy. GigaScience, 8(5). [CrossRef]
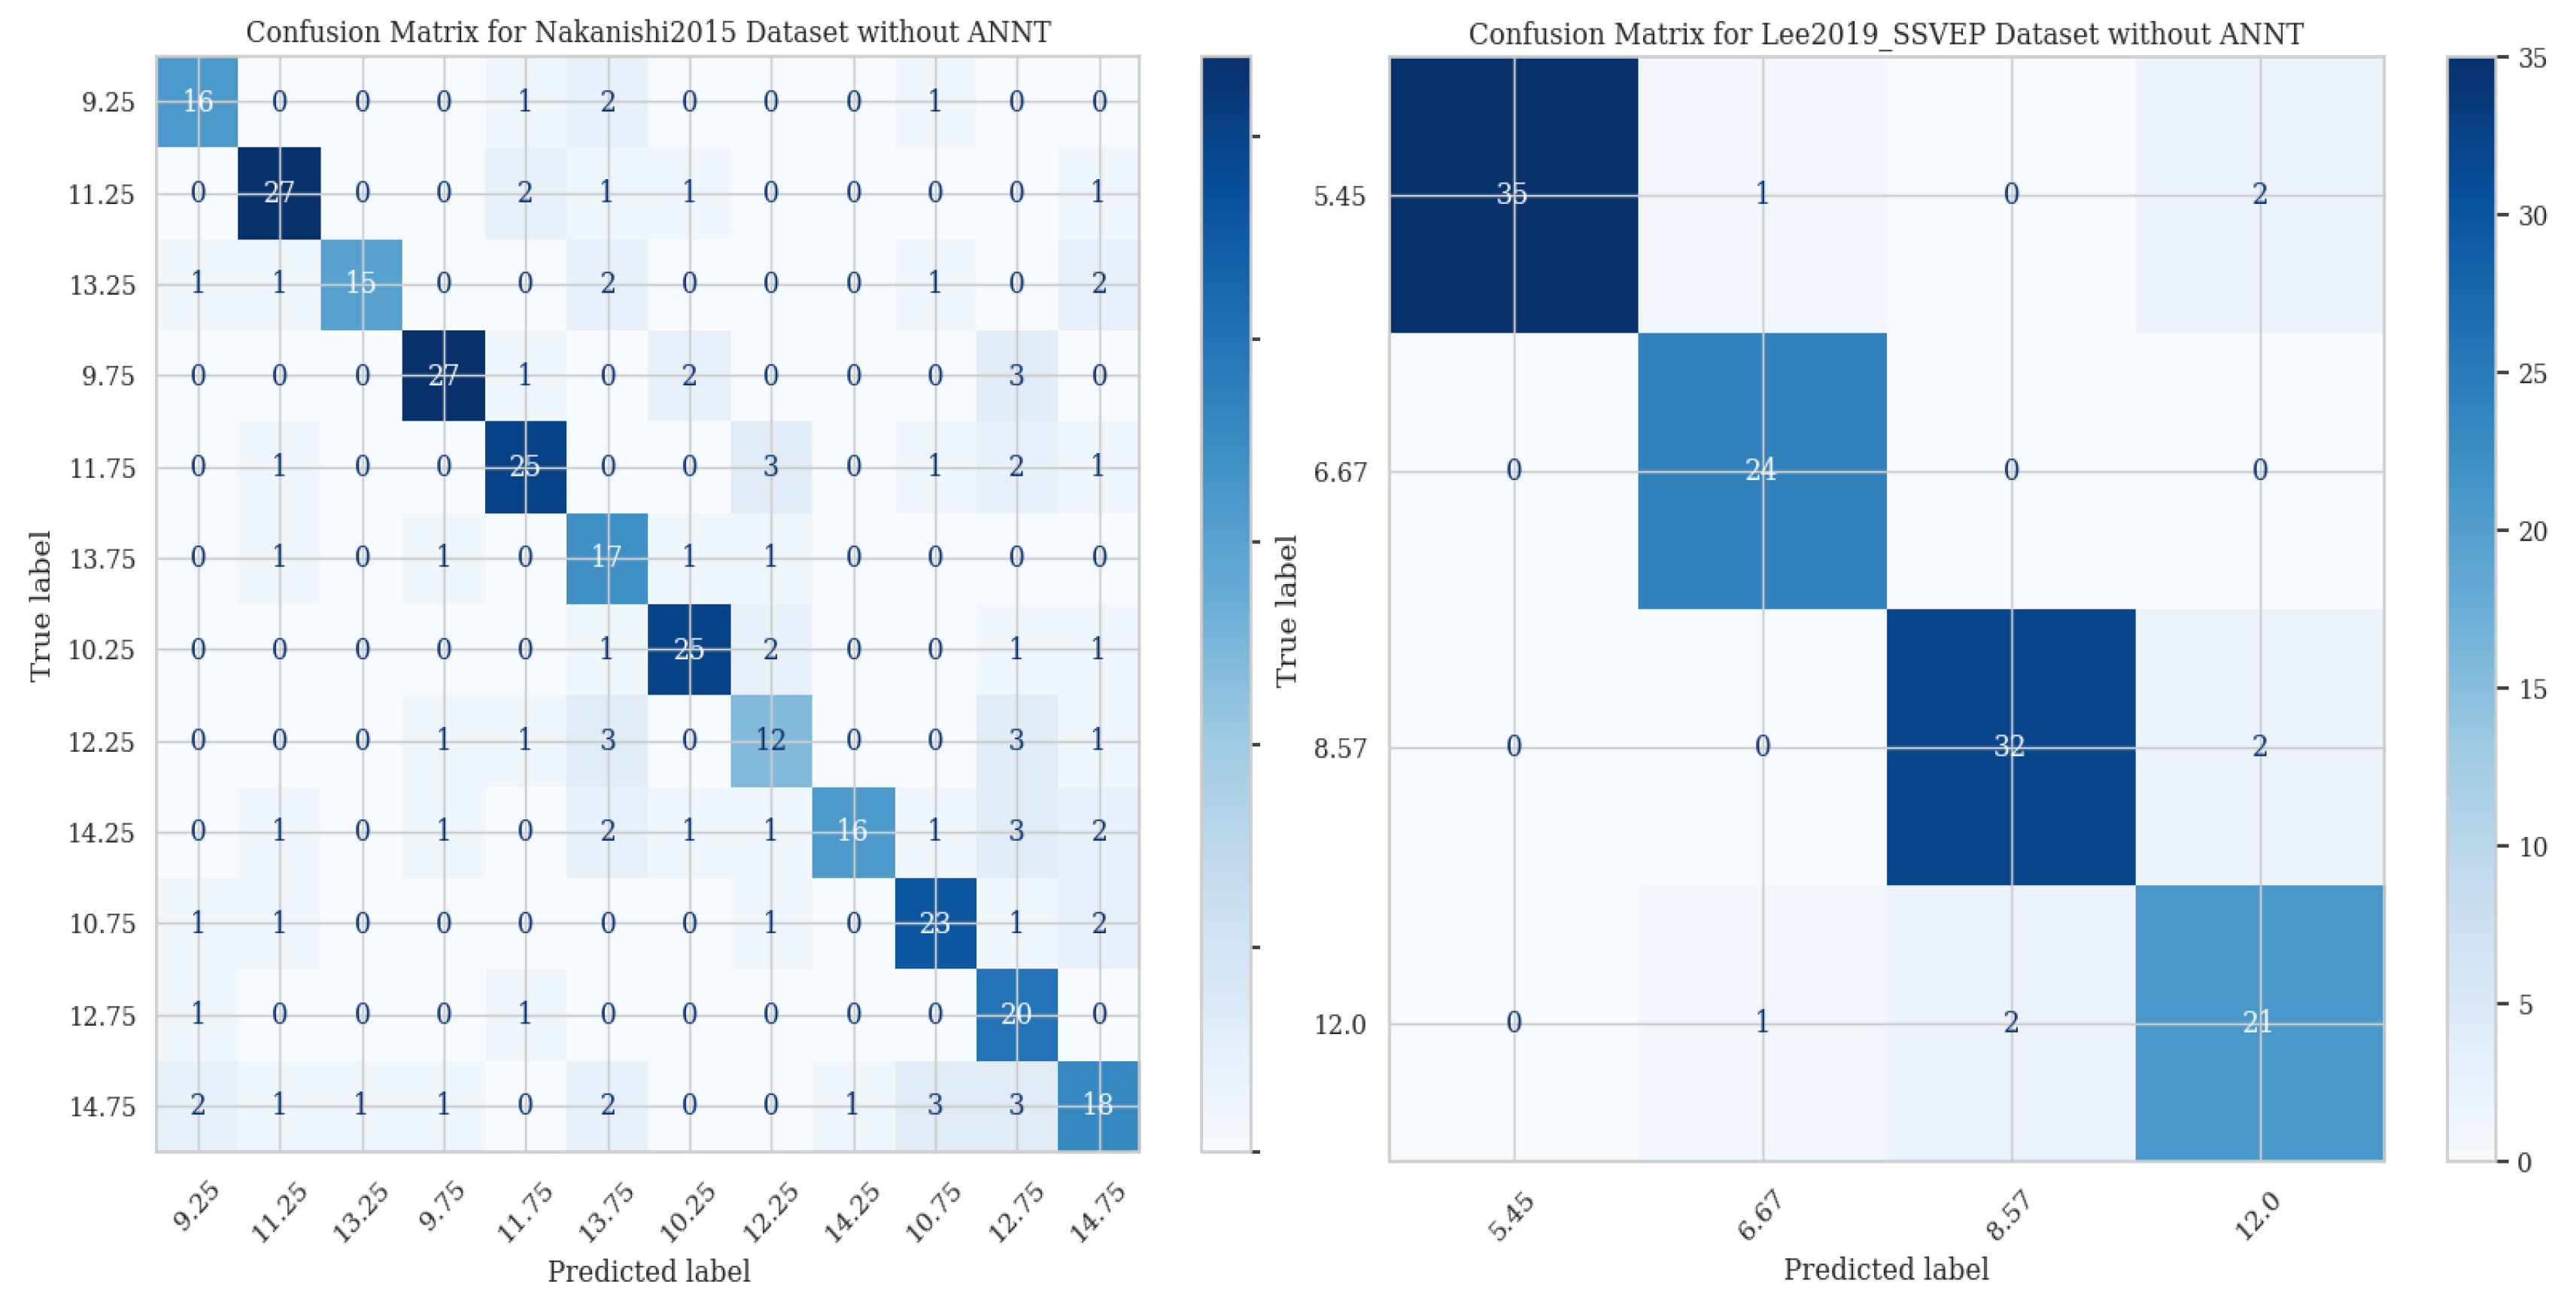
Figure 3. Confusion matrices for Nakanishi2015 and Lee2019_SSVEP datasets without ANNT. The confusion matrix on the left illustrates the classification results for the Nakanishi2015 dataset, while the matrix on the right shows the results for the Lee2019_SSVEP dataset. These matrices provide a detailed overview of the model’s performance in correctly predicting the true labels for each class without applying ANNT. The intensity of the color represents the number of instances for each predicted vs. true label combination, highlighting areas where the model performs well and where it misclassifies.
Preprints 111131 g003
Figure 4. ROC curves for clean and perturbed data over Nakanishi2015 and Lee2019_SSVEP datasets without ANNT. The top row presents the ROC curves for the Nakanishi2015 dataset, with the left graph showing the performance on the clean test set and the right graph displaying the performance on the adversarial test set. Similarly, the bottom row presents the ROC curves for the Lee2019_SSVEP dataset, with the left graph showing the clean test set performance and the right graph displaying the adversarial test set performance. These ROC curves illustrate the trade-off between true positive and false positive rates, providing a detailed view of the model’s ability to distinguish between classes under clean and perturbed conditions without applying ANNT.
Preprints 111131 g004
Figure 5. Confusion matrices for Nakanishi2015 and Lee2019_SSVEP datasets with ANNT. The confusion matrix on the left illustrates the classification results for the Nakanishi2015 dataset after applying ANNT, while the matrix on the right shows the results for the Lee2019_SSVEP dataset with ANNT. These matrices provide a detailed overview of the model’s improved performance in correctly predicting the true labels for each class after applying ANNT. The intensity of the color represents the number of instances for each predicted vs. true label combination, highlighting the enhanced accuracy and robustness of the model against potential adversarial attacks.
Preprints 111131 g005
Figure 6. ROC curves for clean and perturbed data over Nakanishi2015 and Lee2019_SSVEP datasets with ANNT. The top row presents the ROC curves for the Nakanishi2015 dataset, with the left graph showing the performance on the clean test set and the right graph displaying the performance on the adversarial test set after applying ANNT. Similarly, the bottom row presents the ROC curves for the Lee2019_SSVEP dataset, with the left graph showing the clean test set performance and the right graph displaying the adversarial test set performance with ANNT. These ROC curves illustrate the trade-off between true positive and false positive rates, providing a detailed view of the model’s improved ability to distinguish between classes under clean and perturbed conditions after applying ANNT.
Preprints 111131 g006
Disclaimer/Publisher’s Note: The statements, opinions and data contained in all publications are solely those of the individual author(s) and contributor(s) and not of MDPI and/or the editor(s). MDPI and/or the editor(s) disclaim responsibility for any injury to people or property resulting from any ideas, methods, instructions or products referred to in the content.
Copyright: This open access article is published under a Creative Commons CC BY 4.0 license, which permit the free download, distribution, and reuse, provided that the author and preprint are cited in any reuse.
Prerpints.org logo

Preprints.org is a free preprint server supported by MDPI in Basel, Switzerland.

Subscribe

© 2024 MDPI (Basel, Switzerland) unless otherwise stated