Submitted:
03 July 2024
Posted:
04 July 2024
You are already at the latest version
Abstract
This paper delves into the comprehensive analysis and investigation of thermodynamic enhancement and exergy optimization of turbofan engines through the integration of fuzzy logic and newest meta-heuristic optimizers, like the Artificial Bee Colony (ABC) and Particle Swarm Optimization (PSO). In contemporary engineering practices, exergy analysis stands out as a crucial and indispensable tool utilized by numerous engineers and researchers in the design, operation, and performance evaluation of energy systems. Its multifaceted advantages include the precise determination of location, types, and quantification of exergy losses and production. By augmenting exergy efficiency while concurrently curbing exergy destruction, substantial enhancements in engine performance and cost reduction can be achieved. The study focuses on the CF6-80A and CFM56 turbofan engines, scrutinizing individual components such as the fan, low-pressure compressor, high-pressure compressor, combustion chamber, high-pressure turbine, and low-pressure turbine. Key parameters for engine evaluation encompass exergy efficiency, recovery potential, relative exergy destruction, fuel depletion rate, and inefficiency. To conduct a rigorous exergy analysis, engine modeling is imperative, particularly during the cruise phase, which predominantly characterizes engine operation. Subsequently, exergy analysis is executed in accordance with established thermodynamic principles, leveraging equations governing mass conservation, energy conservation, and exergy conservation for each engine component. Further optimization of exergy destruction is achieved through the application of meta-heuristic optimizers and fuzzy logic, facilitating informed decision-making processes.
Keywords:
Thermodynamic improvement
; Meta-heuristic optimization
; Exergy analysis
; Turbofan engine performance
; Turbofan efficiency
Introduction
Due to the widespread use of various types of air engines globally, thermodynamic and exergy analysis has become a critical issue[1]. Developing these engines based on diverse needs and applications, designing more efficient engines, and optimizing existing engines are all methods rooted in thermodynamic and exergy analysis. In the new century, air transport plays a fundamental role in the transportation of passengers and goods[2]. With more than two and a half billion people traveling safely around the world each year, there are an average of 22,000 commercial airliners in operation[3].
Passenger numbers worldwide are projected to grow by an average of 2.9% annually. However, this growth in air transport also exacerbates environmental pollution problems. Jet engines, as significant polluters, emit gaseous pollutants such as CO2, NOx, and other known greenhouse gases, which contribute to the formation of contrails. According to a comprehensive assessment by ICAO [4] published in 2019, the total CO2 emissions from aviation account for approximately 3% of the world's greenhouse gas emissions[5]. While air transportation has a significant environmental impact, it is not inherently detrimental. The environmental effects can be significantly mitigated by improving the efficiency of engine components[6]. More effective and efficient energy use reduces pollutant emissions, making energy consumption a crucial factor in balancing economic and social development with environmental protection. To achieve sustainable development, more efficient and optimal energy systems must be developed. Engineering companies often use energy analysis to evaluate and study energy systems, and exergy analysis is increasingly recognized for its effectiveness in assessing system efficiency, sometimes proving more informative than energy analysis[7].
Exergy analysis is a method that employs the principles of conservation of mass, conservation of energy, and the second law of thermodynamics to analyze, design, and improve systems. This powerful tool enables more efficient and optimal use of energy resources by identifying the locations, types, and amounts of exergy production and losses[8]. The primary aim of this paper is to conduct a thermodynamic and exergy analysis of a turbofan engine, which is the most commonly used engine in commercial aviation. Utilizing the exergy approach allows for a deeper understanding of exergy destruction and inefficiencies within various engine components. The exergy evaluation of the engine is performed for a specific operating condition in the cruise phase. Due to product confidentiality, engine manufacturers typically do not disclose detailed operational information beyond basic specifications. Consequently, a mathematical model of the engine is developed to simulate cruise operational data for use in the exergy analysis[9]. In recent years, researchers and engineers have increasingly employed exergy analysis to assess system performance.
Ebrahim Lalias[10] presented an exergy analysis of a turbofan engine with a low bypass ratio during the take-off phase. The JT8D engine, a low bypass ratio turbofan, is installed on aircraft such as the 737-100, DC9, and MD80. His analysis identified the combustion chamber and turbine as the components with the highest irreversibility and exergy loss. Tatiana and colleagues[11] conducted an exergy analysis on a gas turbine system, highlighting the importance of evaluating the thermodynamic performance of system components to determine which ones cause the most exergy destruction. Ahmad al-Khalid Altai[12] performed an exergy analysis and parametric study of a gas power plant in response to high energy demand in Saudi Arabia. The results of his evaluation are as follows:
- Increasing energy efficiency leads to a reduction in greenhouse gas emissions, resulting in a lower environmental impact.
- The combustion chamber exhibits the highest exergy destruction, followed by the turbine. Additionally, increasing exergy efficiency reduces greenhouse gas emissions and environmental impacts.
Yasin et al. [13] performed an exergy analysis of a turbofan engine for an aircraft during a mission. Their study focused on the Rolls-Royce AE3007H engine; a high bypass ratio turbofan engine developed for the Cessna Citation X. The results indicated that the combustion chamber and afterburner exhibit the most significant exergy destruction within the engine. While the study was thorough, there are potential inconsistencies in the engine modeling data, as the modeling approach by Yasin et al. is not fully detailed. The only reference provided compares a real code with modeling software. Additionally, some critical thermodynamic parameters used in the exergy analysis, such as specific heat at constant pressure and enthalpy, may have been calculated using different formulas than those used in engine modeling.
In this paper, the exergy destruction and efficiency of the CF6-80A and CFM56 engines are analyzed and investigated. The study aims to improve the parameters affecting the engines' exergy analysis using fuzzy logic and optimize these parameters with meta-heuristic optimizers such as the artificial bee colony (ABC) and particle swarm optimization (PSO) to achieve optimal values.
CF6-80A and CFM56 Engine Modeling
To perform the exergy analysis of these engines, it is essential to create a mathematical model to obtain all the basic quantities and characteristics, such as temperature, pressure, and air flow mass. The engines discussed in this analysis are products of General Electric Co. The General Electric CF6, also known as the F103 in US military nomenclature, is one of the high aspect ratio turbofan engines. The CF6-80A is based on the TF39, which was the first high aspect ratio jet engine. This engine supports a wide range of commercial airliners [14]. The CFM56 is a well-known series of high-bypass turbofan aircraft engines produced by CFM International, a joint venture between General Electric (GE) and Safran Aircraft Engines. These engines are commonly used on various commercial aircraft, including the Boeing 737 and the Airbus A320 family, among others [15]. The CFM56 engine consists of six main components, as listed in Table 1.
Technical Specifications of the Engines
The technical specifications of these engines are given in Table 2:
Classification of Engine Components
Given the complexities of these engines and their components, a clear and simplified understanding is crucial. To facilitate this, a general schematic is presented in Figure 1, illustrating the number of stages for each component.
Table 3 provides a detailed breakdown of each component, specifying their respective numbers for analysis and review. This approach ensures a comprehensive and systematic evaluation of the engines' performance and exergy analysis.
Assumptions
This section outlines the assumptions made for the thermodynamic and exergy modeling of the turbofan engines analyzed in this study. These assumptions are as follows:
- The incoming air is assumed to consist of 77% nitrogen and 23% oxygen.
- The working fluid in turbofan engines is primarily air, which is assumed to behave as a perfect gas.
- The reference environment for the exergy analysis is considered to be the ambient air surrounding the engine.
- The combustion process is assumed to be complete.
- The fuel used is C12H23, a common fuel for turbofan engines, with a lower calorific value (QHV) of 43,031 kJ/kg.
- The maximum temperature in the combustion chamber is approximately 1600 Kelvin. According to manufacturer specifications, the combustion chamber temperature is about 1538 Kelvin for the CF6-80A and 1447 Kelvin for the CFM56.
- The velocity in different parts of the engines is considered negligible, except for the inlet and outlet sections. Determining the velocity of gases in each engine section would require detailed knowledge of the cross-sectional geometry, which is not available.
Thermodynamic Governing Equations
For the thermodynamic analysis of these engines, previously established equations are utilized. The exergy analysis employs equations of energy conservation, exergy conservation, and mass conservation for each component of the turbofan engines[16,17].
Inlet
At the inlet, the pressure (P1) and temperature (T1) increase, and the mass flow rate (ṁ) is derived from the engine specifications provided by the manufacturer.
In Equation (1) and (2), () and () are the static temperature and pressure respectively, which are determined and related to the flight altitude. is the flight Mach number which is determined according to the technical specifications of the engine in the cruise phase.
Fan
After the engine inlet, the air flow encounters the fan stage. Upon passing through the fan, the flow is divided into two parts: one part enters the engine core, while the other part bypasses the core. bypass mass flow rate denotes as .Given the high bypass ratio of this engine, it is evident that the mass flow rate entering the engine core is significantly less than the mass flow rate passing through the bypass. The values of and are calculated using Equation (4) and (5).
Since the fan increases the air pressure, the pressure values at the motor core inlet () and the bypass inlet pressure () are determined using Equations (6) and (7).
Equations (6) and (7) involve the fan pressure ratio, and , each with a value of 2.6. The isentropic efficiency of the fan () and ()is calculated using Equations (8) and (9) in this section of the engine.
In the next step, Equations (10) and (11) are used to calculate the temperature at the fan inlet () and the engine bypass temperature ().
Bypass
In this part of the engine, the temperature of the flow is assumed to be nearly constant, with only a slight drop in pressure due to the existing expansion. The temperature () and pressure () in this section are derived from the following equations.
In Equation (13), the bypass expansion ratio, denoted as , is assumed to be 0.91.
Low Pressure Compressor:
In this segment of the engine, the second stage of compression takes place. It should be noted that variations in temperature (), pressure (), or airflow rate in the duct connecting the fan outlet to the low-pressure compressor inlet are disregarded. Consequently, the following is observed:
At the outlet of the low-pressure compressor, the outlet pressure (), outlet temperature (), and mass flow rate () can be calculated using equations (18) to (20):
In Equation (20), , the pressure ratio of the low-pressure compressor, is 5.56, as specified by the manufacturer. The work produced by the low-pressure compressor () will be calculated using Equation (21).
High Pressure Compressor
In this section of the engine, the third and final stage of compression takes place before the flow enters the combustion chamber. The temperature and pressure between the output of the low-pressure compressor and the input of the high-pressure compressor undergo minimal changes, which are considered constant. At the input of the compressor, the pressure (), temperature (), and mass flow rate ) can be obtained from Equations (22) to (24):
At the output of the high-pressure compressor, the output pressure (), output temperature (), and mass flow rate can be calculated using equations (25) to (27):
In Equation (27), , the pressure ratio of the high-pressure compressor, is set at 11, as specified by the manufacturer. The work produced by the high-pressure compressor is calculated using Equation (28).
Combustion Chamber
The temperature, pressure, and mass flow rate of the flow between the high-pressure compressor and the inlet of the combustion chamber undergo slight changes, which can be considered negligible. Consequently, the inlet pressure (), inlet temperature (), and inlet mass flow rate of the combustion chamber are calculated using equations (29) to (31):
In this section of the engine, the combustion process involves the injection of fuel into the combustion chamber. The fuel flow mass rate and the total flow mass rate are calculated using equations (32) and (33):
In Equation (32), represents the ratio of fuel to air, which can be calculated using Equation (34).
The output pressure () and the output temperature () in the combustion chamber can be calculated using Equations (35) and (36), with the output temperature of the combustion chamber determined based on information provided by the engine manufacturer.
In Equation (35), represents the design efficiency of the combustion chamber, typically assumed to be 90% for most turbofan engines.
High-Pressure Turbine
In the high-pressure turbine section, negligible variations occur in the temperature (), pressure (), and mass flow rate () of the fluid stream between the exit of the combustion chamber and the inlet of the high-pressure turbine. Thus, for practical purposes, these alterations can be disregarded, leading to the following assumption:
In this segment of the engine, the first stage of gas expansion occurs. As conventionally understood, the compressor performs work on the fluid. However, in contrast, the turbine operates inversely, extracting work from the fluid to drive both the fan and the compressor. The initial task entails computing the power generated by the high-pressure compressor (). Thus, following Equation (40), the power produced by the high-pressure compressor is determined.
In Equation (40), representing the efficiency of the high-pressure compressor, assumed to be 95%. This value is deemed reasonable and acceptable within the scope of this analysis. Additionally, the output temperature of the high-pressure turbine () can be derived from Equation (41).
To compute the pressure, initially, an acceptable value for the high-pressure turbine expansion ratio () is assumed, set at 5. Subsequently, the pressure value at the outlet of the high-pressure turbine () can be determined. Moreover, the mass flow rate () of the flow remains constant, yielding:
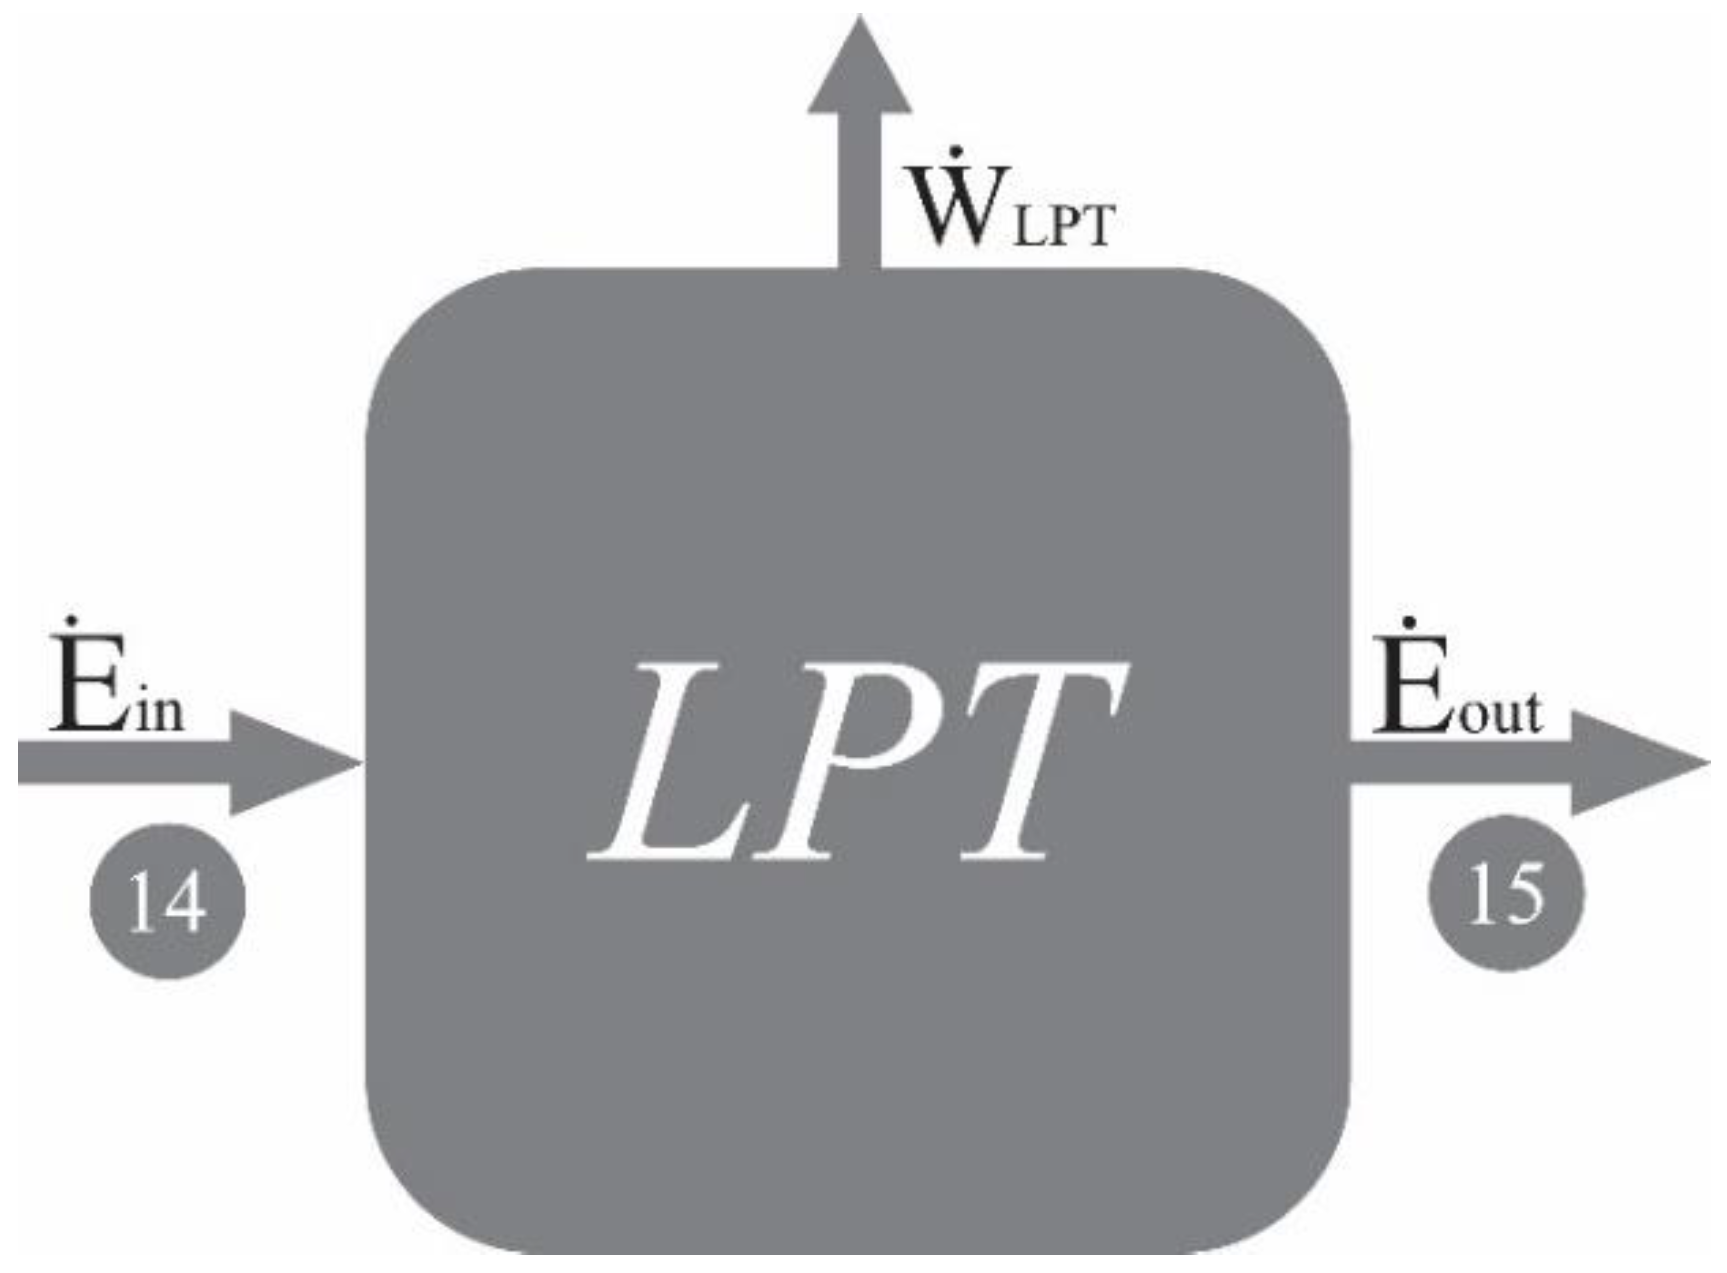
In the low-pressure turbine segment, minor variations occur in the temperature (), pressure (), and mass flow rate () of the fluid stream between the exit of the combustion chamber and the inlet of the low-pressure turbine. These variations are negligible and can be disregarded, resulting in:
In this section of the engine, the second stage of gas expansion occurs. By extracting work from the fluid and driving this segment of the engine, it facilitates the rotation of the low-pressure section of the engine and the N1 shaft. The initial step involves computing the power generated by the low-pressure turbine (), akin to the previous section. Thus, in accordance with Equation (47), the following expression is obtained:
In Equation (47), () representing the efficiency of the low-pressure compressor, is assumed to be 95%, a value deemed reasonable and acceptable. The values for the output pressure () and output temperature () of the low-pressure turbine can be calculated utilizing Equation (49) and (50), respectively. Additionally, the mass flow rate () of the flow remains constant, yielding:
In relation (49), representing the low-pressure turbine expansion ratio, is assumed to be 4, a value considered promising for the analysis.
Nozzle
In this section of the engine, where the final stage of expansion occurs, the mass flow rate (), pressure (), and temperature () of the flow are determined using relations (51) to (53).
In relation (53), denoting the nozzle efficiency, is specified as 92% according to the manufacturer's information for this engine.
specific Fuel Consumption and Thrust
To compute these values, it is imperative to ascertain both the hot thrust of the nozzle () and the cold thrust of the nozzle (). This can be achieved through the following calculations:
In Equation (54), represents the output Mach number from the engine core.
In Equation (55), denotes the output temperature from the engine core.
In Equation (56), represents the output pressure from the engine core.
In Equation (57), denotes the speed of sound in the engine core.
In Equation (58), represents the outlet speed in the engine core.
Equations (54) to (59) can be utilized for calculating the hot thrust. For the cold thrust, a similar methodology will be applied, resulting in:
In Equation (60), represents the Mach number in the exit from the bypass.
In Equation (61), denotes the exit temperature of the bypass.
In Equation (62), represents the output pressure from the bypass.
In Equation (63), a8 denotes the speed of sound of the bypass.
In Equation (64), represents the exit velocity of the bypass.
To calculate the net thrust () and specific thrust fuel consumption (), the following formulas are utilized:
The thrust magnitude and specific thrust fuel consumption are determined as follows:
Thrust = 25.52 KN TSFC = 15.12 g/ (KN. s)
Exergy Governing Equations
Utilizing the principles of conservation of mass, energy, and exergy, equations (68) to (70) governing exergy equations for each component of the engine can be derived and are as follows[18]:
Subscripts in input, output, and Dest. represent input, output, and destruction, respectively. To conduct an exergetic assessment, performance parameters must be considered to evaluate an energy system and its components. Exergy efficiency encompasses the following factors: recovery potential, relative rate of exergy destruction, fuel reduction rate, and productivity deficit.
Exergy efficiency () is defined as the ratio between the exergy rate of the product () and the fuel (). The exergy of the product signifies the desired outcome produced, while the exergy of the fuel represents the resources utilized to generate the product. Their relationship is expressed as follows:
The subsequent parameter is the improvement potential , defined as the quantity of exergy destruction within the system. It quantifies the scope available for enhancement and reduction of irreversibility, and it is derived from Equation (72):
The subsequent parameter is the relative exergy destruction , defined as the ratio of the exergy destruction rate of a component to the total exergy destruction rate of a system. This parameter illustrates the percentage of exergy destruction within the system, and it is derived from Equation (73):
Another critical parameter is the fuel depletion rate (), defined as the ratio of the exergy destruction rate to the total exergy rate of the fuel entering the system. It is derived from equation (74):
Another parameter worth noting is the productivity lack rate (), defined as the ratio of the exergy destruction rate to the total exergetic product rate in the system. This parameter quantifies the loss of exergy potential in the product resulting from exergy destruction. It is obtained from Equation (75):
In the subsequent sections, we will delve into the exergy relations for each component of the engine, which have been deduced utilizing the stability Equation (72) to (74), and employed for the purpose of this analysis and scrutiny:

Low Pressure Compressor (LPC)
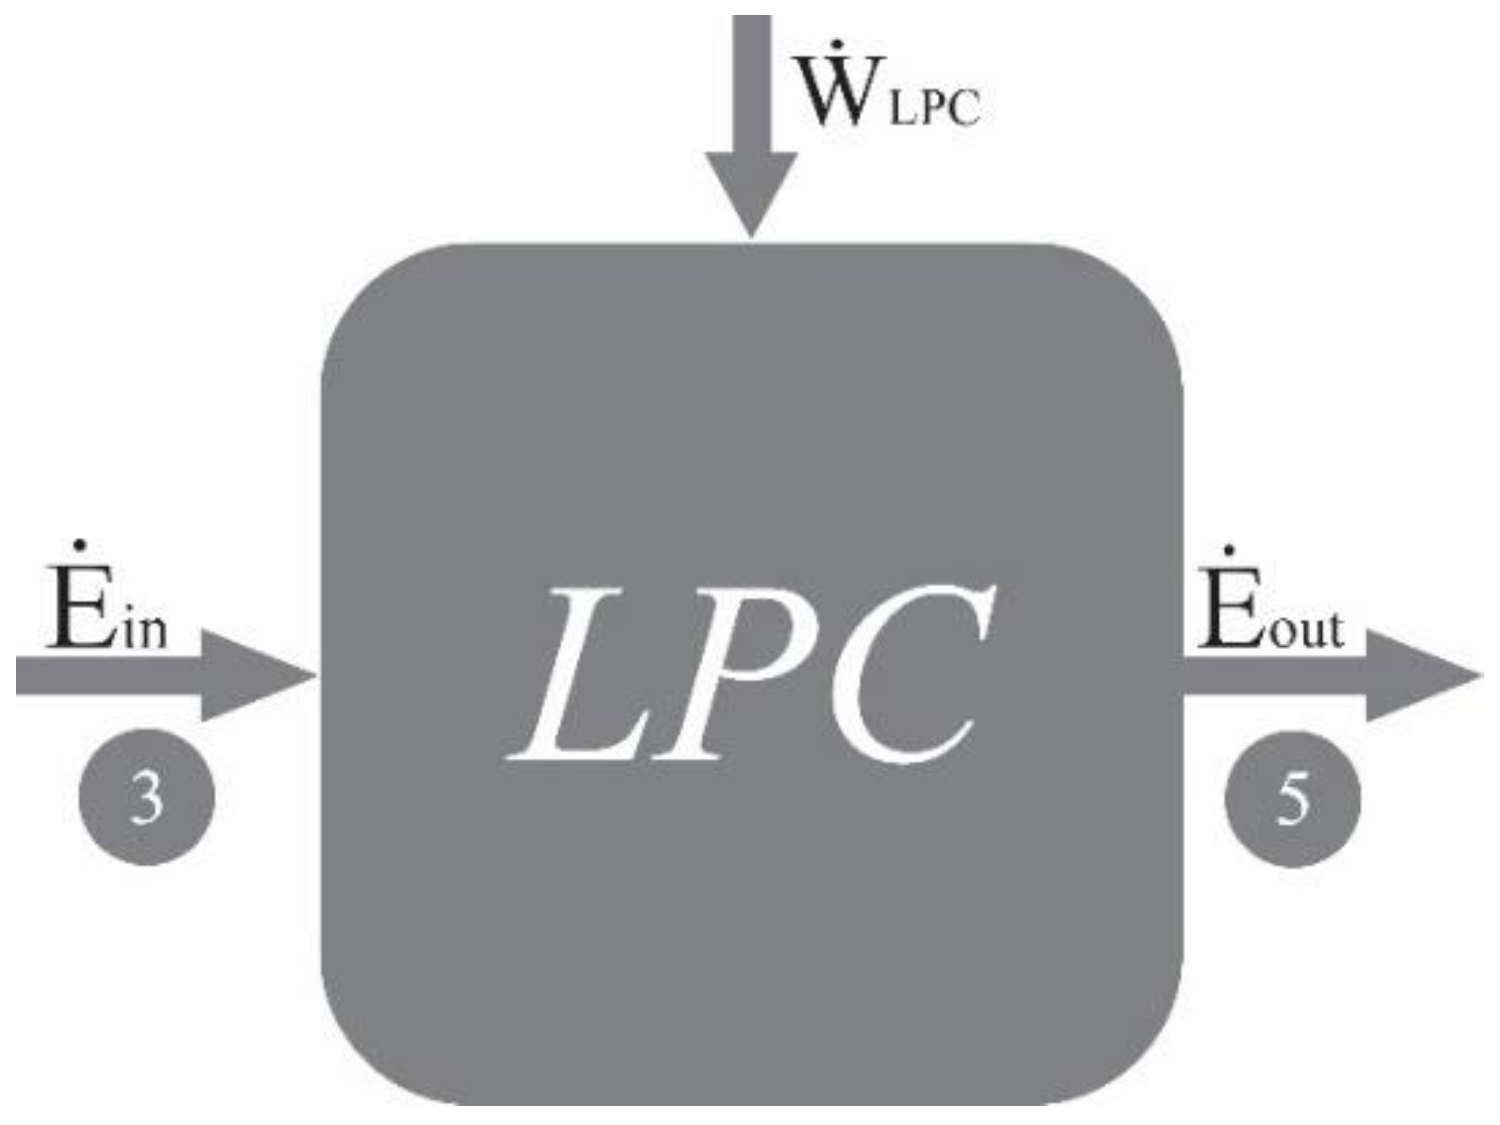
Figure 3.
Exergy flows in the low-pressure compressor.
High Pressure Compressor (HPC)
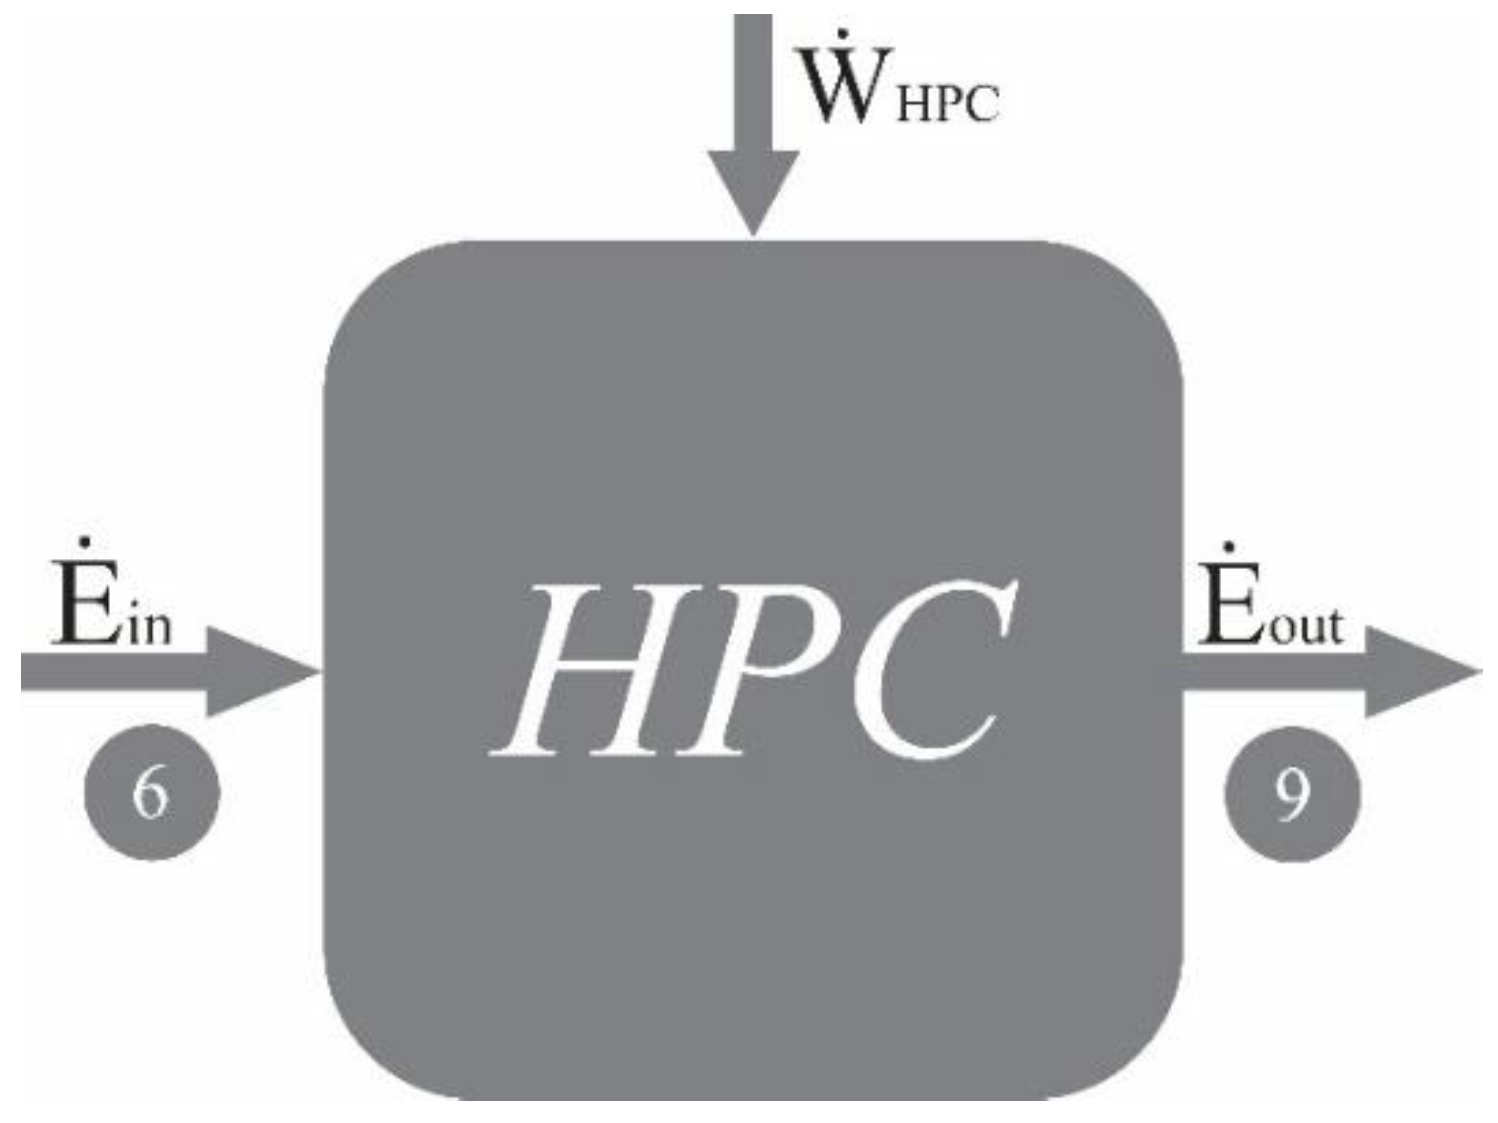
Figure 4.
Exergy Flows in the High-Pressure Compressor.
Combustion Chamber (CC)
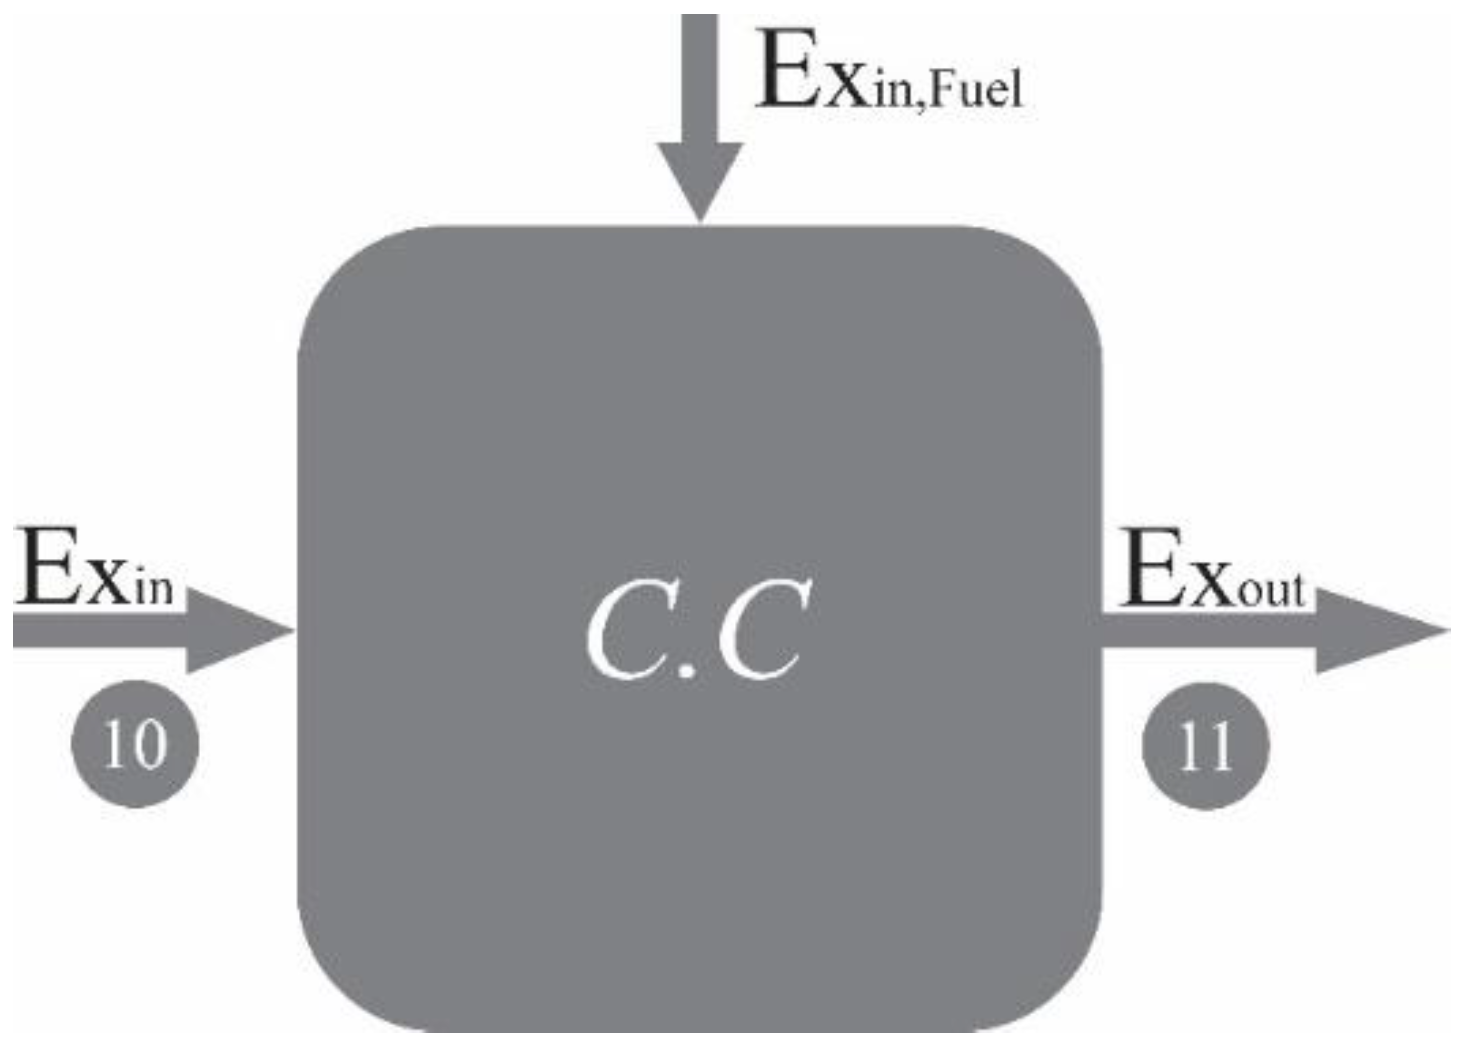
Figure 5.
Exergy Flows in the Combustion Chamber.
In Equation (108), represents the exergy value of the fuel, which can be computed using the following relation. In Equation (112), denotes the ratio of the exergy of the fuel to the low heating value of the fuel, obtained through Equation (109).
The low heating value () represents the low heating value of the fuel. For most liquid and gaseous fuels with compositions such as Cα Hβ Nγ Oδ, the value of is typically close to 1. The fuel utilized in this engine has the chemical formula C12 H23 and a low calorific value of 42800 kJ/kg.
High Pressure Turbine (HPT)
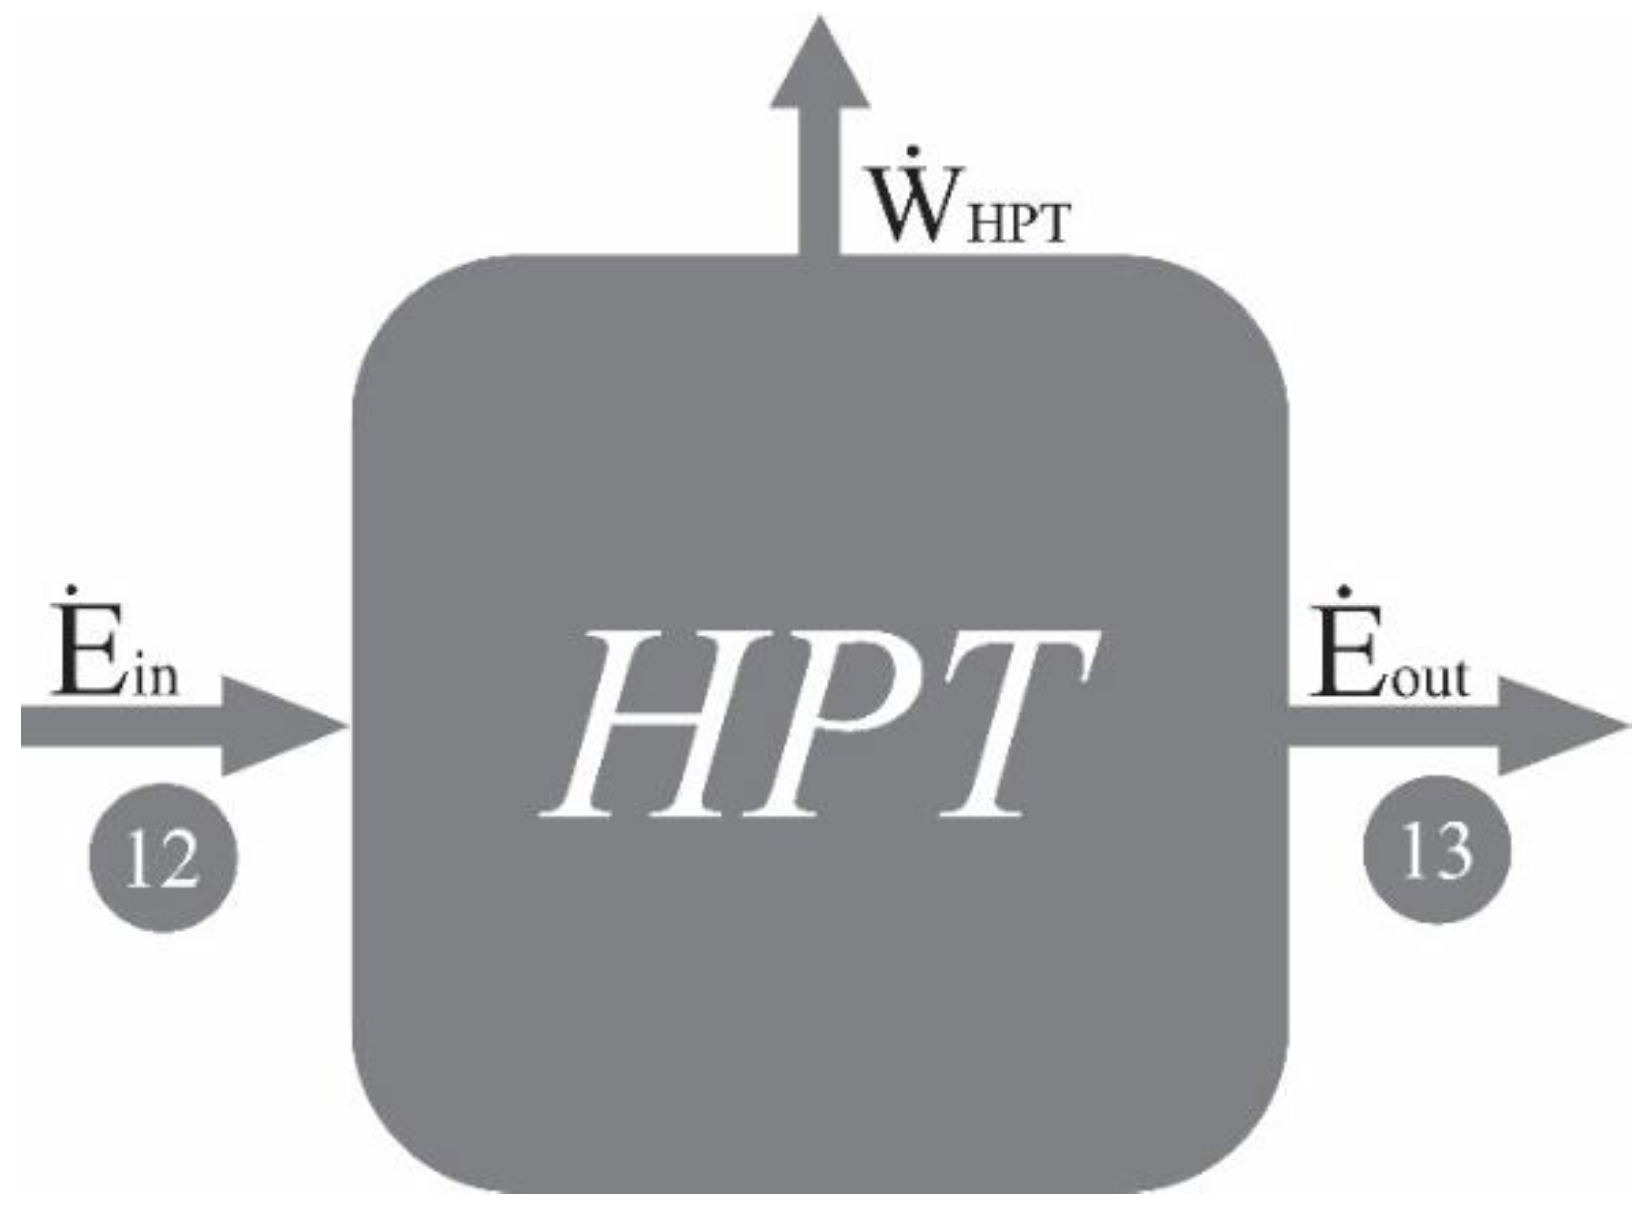
Figure 6.
Exergy Flows in the High-Pressure Turbine.
Calculation Results
In this section, the results of the exergy analysis for the CFM56 and CF6-80A engines are outlined. The analysis encompasses variations in engine design parameters such as compressor pressure ratio, turbine inlet temperature, fuel inlet temperature in the combustion chamber, as well as alterations in decision variables including flight speed, flight altitude, inlet air temperature, and the quantity of air entering these engines. A comparison is made between these parameters. The fixed parameters utilized in this study for the analyzed turbofan engine are listed in Table 8. The parameters obtained for each part of the engines are compared with each other, and any disparities in values are indicated by "(Difference)" in the following tables:

Table 4.
Pressure Values in Each Part of the Engine in Terms of (KPa).
| No. | Components names | Each component No. | CF6-80A engine | CFM56 engine | Difference (%) |
|---|---|---|---|---|---|
| 1 | Fan | 0 | 23.8420 | 23.846 | 0.0041 |
| 1 | 36.3133 | 36.351 | 0.021 | ||
| 2 | Bypass | 4 | 56.3321 | 56.214 | 0.021 |
| 8 | 55.8996 | 55.912 | 0.022 | ||
| 4 | Low pressure compressor | 3 | 56.3321 | 56.333 | 0.0015 |
| 5 | 313.2070 | 314.11 | 0.28 | ||
| 5 | High pressure compressor | 6 | 313.2070 | 314.11 | 0.28 |
| 9 | 1741.4 | 1745.94 | 0.26 | ||
| 6 | Combustion chamber | 10 | 1741.4 | 1745.94 | 0.26 |
| 11 | 1654.4 | 1668.85 | 0.86 | ||
| 7 | High pressure turbine | 12 | 1654.4 | 1668.85 | 0.86 |
| 13 | 413.5897 | 502.67 | 17.72 | ||
| 8 | Low pressure turbine | 14 | 413.5897 | 502.67 | 17.72 |
| 15 | 165.4358 | 169.023 | 2.122 | ||
| 9 | Nozzle | 16 | 148.8922 | 169.023 | 11.97 |
Table 5.
Temperature Values in Each Part of the Engine in (Kelvin).
| No. | Components names | Each component No. | CF6-80A engine | CFM56 engine | Difference (%) |
|---|---|---|---|---|---|
| 1 | Fan | 0 | 218.81 | 218.81 | 0 |
| 1 | 246.8177 | 246.88 | 0.025 | ||
| 2 | Bypass | 4 | 283.2273 | 285.21 | 0.69 |
| 8 | 283.2273 | 285.21 | 0.69 | ||
| 4 | Low pressure compressor | 3 | 283.2273 | 285.21 | 0.69 |
| 5 | 480.8675 | 482.45 | 0.32 | ||
| 5 | High pressure compressor | 6 | 480.8675 | 482.45 | 0.32 |
| 9 | 816.4242 | 833.14 | 2.006 | ||
| 6 | Combustion chamber | 10 | 816.4242 | 833.14 | 2.006 |
| 11 | 1538.2 | 1666.4 | 7.693 | ||
| 7 | High pressure turbine | 12 | 1538.2 | 1666.4 | 7.693 |
| 13 | 1270.1 | 1270.76 | 0.0519 | ||
| 8 | Low pressure turbine | 14 | 1270.1 | 1270.76 | 0.0519 |
| 15 | 868.2 | 898.2 | 3.34 | ||
| 9 | Nozzle | 16 | 868.2 | 898.2 | 3.34 |
Table 6.
Mass Flow Rate Values in Each Part of the Engine in Terms of (Kg/S).
| No. | Components names | Each component No. | CF6-80A engine | CFM56 engine | Difference (%) |
|---|---|---|---|---|---|
| 1 | Fan | 0 | - | - | - |
| 1 | 149 | 149.62 | 0.41 | ||
| 2 | Bypass | 4 | 127.71 | 128.34 | 0.49 |
| 8 | 127.71 | 128.34 | 0.49 | ||
| 4 | Low pressure compressor | 3 | 21.39 | 21.45 | 0.27 |
| 5 | 21.39 | 21.45 | 0.27 | ||
| 5 | High pressure compressor | 6 | 21.39 | 21.45 | 0.27 |
| 9 | 21.39 | 21.45 | 0.27 | ||
| 6 | Combustion chamber | 10 | 21.39 | 21.45 | 0.27 |
| 11 | 21.84 | 22.32 | 2.15 | ||
| 7 | High pressure turbine | 12 | 21.84 | 22.32 | 2.15 |
| 13 | 21.84 | 22.32 | 2.15 | ||
| 8 | Low pressure turbine | 14 | 21.84 | 22.32 | 2.15 |
| 15 | 21.84 | 22.32 | 2.15 | ||
| 9 | Nozzle | 16 | 21.84 | 22.32 | 2.15 |
The flight conditions for this analysis adhere to the specifications provided by the manufacturer. Specifically, the altitude is set at 10,668 meters, which corresponds to the cruise altitude of the engines. Table 8 additionally presents the parameters of the engine, which are deemed reasonable and acceptable values. Furthermore, several parameters are provided directly by the manufacturer.
Table 7.
Flight Condition.
| Properties | Unit | Value |
|---|---|---|
| Altitude | Meter | 10668 |
| Temperature | Kelvin | 218.80 |
| Mach number | 0.8 |
Table 8.
Engine Parameters.
| No. | Components names | Parameter | Value | Unit |
|---|---|---|---|---|
| 1 | Fan | efficiency | 0.91 | - |
| 2 | Low pressure compressor | efficiency | 0.92 | - |
| Pressure ratio | 5.56 | - | ||
| 3 | High pressure compressor | efficiency | 0.92 | - |
| Pressure ratio | 11 | - | ||
| 4 | Combustion chamber | efficiency | 0.6 | - |
| Combustion temperature | 1538 | Kelvin | ||
| Pressure ratio | 0.4 | - | ||
| 5 | High pressure turbine | efficiency | 0.95 | - |
| Shaft mechanical efficiency | 0.97 | - | ||
| 6 | Low pressure turbine | efficiency | 0.94 | - |
| Shaft mechanical efficiency | 0.97 | - | ||
| 7 | Nozzle | efficiency | 0.90 | - |
Exergy Analysis Results
Exergy efficiency results are depicted in Figure 8 for each component of the engines. The combustion chamber exhibits the lowest exergy efficiency, while other components demonstrate relatively high exergy efficiency, exceeding 90%, for both engines. Specifically, for the CF6-80A engine, the exergy efficiencies are as follows: fan 95.11%, low-pressure compressor 90.92%, high-pressure compressor 89.42%, combustor 71.75%, high-pressure turbine 90.75%, low-pressure turbine 88.22%, and nozzle 93.12%. For the CFM56 engine, the corresponding exergy efficiencies are: fan 92.10%, low-pressure compressor 91.52%, high-pressure compressor 90.01%, combustor 68.01%, high-pressure turbine 79.71%, low-pressure turbine 82.12%, and nozzle 81.02%. These results clearly indicate that the CF6-80A engine exhibits superior exergy efficiency compared to the CFM56.
Figure 9 illustrates the exergy destruction in each component of the engine. As anticipated, the combustion chamber exhibits the highest exergy destruction due to the presence of irreversibility’s. For the CF6-80A engine, the exergy destruction values are as follows: fan 0.24 MW, low-pressure compressor 0.57 MW, high-pressure compressor 1.92 MW, combustor 14.21 MW, high-pressure turbine 1.86 MW, low-pressure turbine 0.53 MW, and nozzle 0.152 MW. Conversely, for the CFM56 engine, the corresponding exergy destruction values are: fan 0.238 MW, low-pressure compressor 0.565 MW, high-pressure compressor 1.912 MW, combustor 15.02 MW, high-pressure turbine 1.78 MW, low-pressure turbine 0.481 MW, and nozzle 0.151 MW. These results clearly indicate that the CF6-80A engine experiences lower exergy destruction compared to the CFM56.
Figure 10 illustrates the changes in exergy efficiency for this analysis concerning variations in flight altitude and the working pressure ratio of the compressors. It is evident that the engine's exergy efficiency increases with an increase in flight altitude. The optimal condition depicted in this diagram is flight at an altitude of 10.6 kilometers with a compressor pressure ratio of 40.
Figure 11 presents the improvement potential in each component of the engine. The combustion chamber emerges as the most critical component for improvement. The improvement potential for the CF6-80A engine is as follows: fan 0.0512 MW, low-pressure compressor 0.0481 MW, high-pressure compressor 0.0235 MW, combustor 0.368 MW, high-pressure turbine 0.0289 MW, low-pressure turbine 0.0389 MW, and nozzle 0.298 MW. For the CFM56 engine, the corresponding improvement potential values are: fan 0.0512 MW, low-pressure compressor 0.0612 MW, high-pressure compressor 0.911 MW, combustor 0.40 MW, high-pressure turbine 0.0258 MW, low-pressure turbine 0.03521 MW, and nozzle 0.0257 MW. These results indicate that the CF6-80A engine exhibits better improvement potential compared to the CFM56.
Figure 12 depicts the changes in the exergy efficiency of the engine concerning variations in the temperature entering the turbine and its flight speed. It is observed that as the temperature of the gases entering the turbine and the flight speed of the aircraft increase, the exergy efficiency of the engine is expected to rise. The optimal condition depicted in this diagram is flight at a combustion temperature of 1550 Kelvin and a flight speed of 100 meters per second.
Figure 13 illustrates the relative destruction of exergy in each component of the engine. This diagram holds significant importance as it allows for the measurement of engine performance. By enhancing the relative destruction rate, a high-performance engine can be achieved, leading to reduced gas emissions, lower fuel consumption, and increased profitability. Once again, it is evident that the combustion chamber contributes the most to the destruction of exergy in the engine compared to other components. This is primarily due to irreversibility, as the nature of combustion inherently leads to irreversibility, resulting in a decrease in exergy. The relative destruction rates for the CF6-80A engine components are as follows: fan 2.12%, low-pressure compressor 3.90%, high-pressure compressor 5.21%, combustor 77.21%, high-pressure turbine 5.32%, low-pressure turbine 4.87%, and nozzle 2.11%. For the CFM56 engine, the corresponding relative destruction rates are: fan 2.01%, low-pressure compressor 3.88%, high-pressure compressor 4.98%, combustor 68.01%, high-pressure turbine 4.88%, low-pressure turbine 5.12%, and nozzle 1.98%.
Figure 14 and Figure 15 illustrate the amount of fuel reduction and the lack of efficiency in the engine, respectively. Once again, the combustion chamber emerges as the component with the highest fuel reduction and lack of efficiency. The fuel reduction rates for the CF6-80A engine components are as follows: low-pressure compressor 0.53%, high-pressure compressor 0.61%, combustor 0.91%, high-pressure turbine 8.51%, low-pressure turbine 0.491%, and nozzle 0.12%. For the CFM56 engine, the corresponding fuel reduction rates are: low-pressure compressor 0.529%, high-pressure compressor 0.63%, combustor 0.92%, high-pressure turbine 8.95%, low-pressure turbine 0.421%, and nozzle 0.13%.
Regarding the productivity lack rate, the CF6-80A engine exhibits rates of 1.01% for the fan, 0.74% for the low-pressure compressor, 2% for the high-pressure compressor, 16.91% for the combustor, 2% for the high-pressure turbine, 1.98% for the low-pressure turbine, and 1.01% for the nozzle. Conversely, for the CFM56 engine, the productivity lack rates are: 0.87% for the fan, 0.91% for the low-pressure compressor, 1.99% for the high-pressure compressor, 16.11% for the combustor, 1.97% for the high-pressure turbine, 1.71% for the low-pressure turbine, and 0.92% for the nozzle.
Fuzzy Preference Function
In fuzzy systems, which are knowledge-based systems mimicking human decision-making abilities, the central component is a knowledge base comprising fuzzy if-then rules. A fuzzy If-Then rule is a statement in which certain terms are described by continuous membership functions. For instance, the following statement represents a fuzzy If-Then rule: If the speed of an aircraft is low, then apply more force to the engine before stall. This statement signifies that if the plane's speed is low, then additional force should be applied to the engine before the plane stalls.
Fuzzy Logic Rules
In this section, fuzzy logic rules are delineated based on the inputs and outputs. The first input is the bypass ratio, the second input is fuel quality, and the third input is the material quality of the combustion chamber. These inputs can be increased, decreased, or maintained, and the output can be categorized as high, medium, or low exergy destruction. For this purpose, 26 conditions have been established, with some of the most significant outlined below. Table 9 presents the fuzzy logic rules for this problem.
Fuzzy System Designing
In this section, surface diagrams depicting the relationships between fuel quality, material quality, and bypass ratio with exergy destruction are generated. Figure 16, Figure 17, and Figure 18 present these relationships.
In Figure 16, when fuel quality and material quality are both at 100, exergy destruction reaches 0. This indicates that by optimizing both fuel and material quality, exergy destruction can be minimized, which is an optimal scenario for designers.
As evident from the figures above, to achieve acceptable exergy destruction, the bypass ratio, fuel quality, and material quality need to increase. The next section will delve into the optimization of these values with the assistance of meta-heuristic optimization algorithms.
Meta-Heuristic Optimizers
Particle Swarm Optimization (PSO)
Particle Swarm Optimization (PSO) was initially introduced by Kennedy and Eberhart to model the flocking behavior of birds. In PSO, each potential solution is represented as a particle, possessing its own random velocity and position within the search space. The search space is defined as the collection of all possible solutions for the optimization problem. Each particle adjusts its position and velocity based on the best solution (fitness) encountered in the solution space[19,20].
Artificial Bee Colony (ABC)
The Artificial Bee Colony (ABC) algorithm was developed by Karaboga[21], inspired by the foraging behavior of honey bees, to address multidimensional optimization problems. In the ABC algorithm, a potential solution to any problem is represented by a food source, with honeybees tasked with searching for new food sources. The colony of artificial bees in ABC is divided into three groups:
- Employed bees: This group consists of bees associated with food sources near the hive.
- Onlooker bees: These bees observe the waggle dance performed by the employed bees to share information about food sources with each other.
- Scout bees: Responsible for randomly searching for new food sources.
Once a food source is depleted, the employed bees transition to become scout bees to search for another food source.
Fuel quality, Material Quality and Bypass Ratio Optimization
In this phase of the study, engine parameter optimization is conducted using meta-heuristic optimization methods. The optimizers employed in this study are Artificial Bee Colony and Particle Swarm Optimization. Figure 19 illustrates the optimization of fuel quality achieved by these optimizers. Similarly, the optimization of the bypass ratio is depicted in Figure 20, and the optimization of material quality is shown in Figure 21. Subsequently, the results obtained from these optimizers are scrutinized and discussed.
Fuel Quality Optimization
As evident from Figure 19, the optimizers provided different solutions, indicating varying recommendations regarding the necessary changes in fuel quality to achieve minimum exergy destruction. This discrepancy highlights the influence of optimization algorithms on the final outcomes and underscores the importance of carefully analyzing and interpreting optimization results.
Table 10.
The Results of Each Optimizer.
| Optimizer | Result |
|---|---|
| Particle Swarm Optimizer | 0.148 % |
| Artificial Bee Colony Optimizer | 0.2457 % |
According to the results obtained from the optimizers, an increase in fuel quality of 0.148% (with PSO optimizer) or 0.2457% (with ABC optimizer) for the engines will lead to minimum exergy destruction.
Bypass Ratio Optimization
Figure 20.
Optimizers results for bypass ratio of the engines.

As depicted in Figure 20, the optimizers provided differing recommendations regarding the necessary changes in the bypass ratio to achieve minimum exergy destruction. This variability underscores the importance of considering multiple optimization outcomes and conducting further analysis to make informed decisions.
Table 11.
The results of each optimizer.
| Optimizers | Result |
|---|---|
| Particle Swarm Optimizer | 0.12% |
| Artificial Bee Colony Optimizer | 0.11% |
According to the results obtained from the optimizers, an increase in the bypass ratio of 0.12% (with PSO optimizer) or 0.11% (with ABC optimizer) for the engines will lead to minimum exergy destruction.
Material Quality Optimization
Figure 21.
Optimizers Results for Material Quality of the Engines.
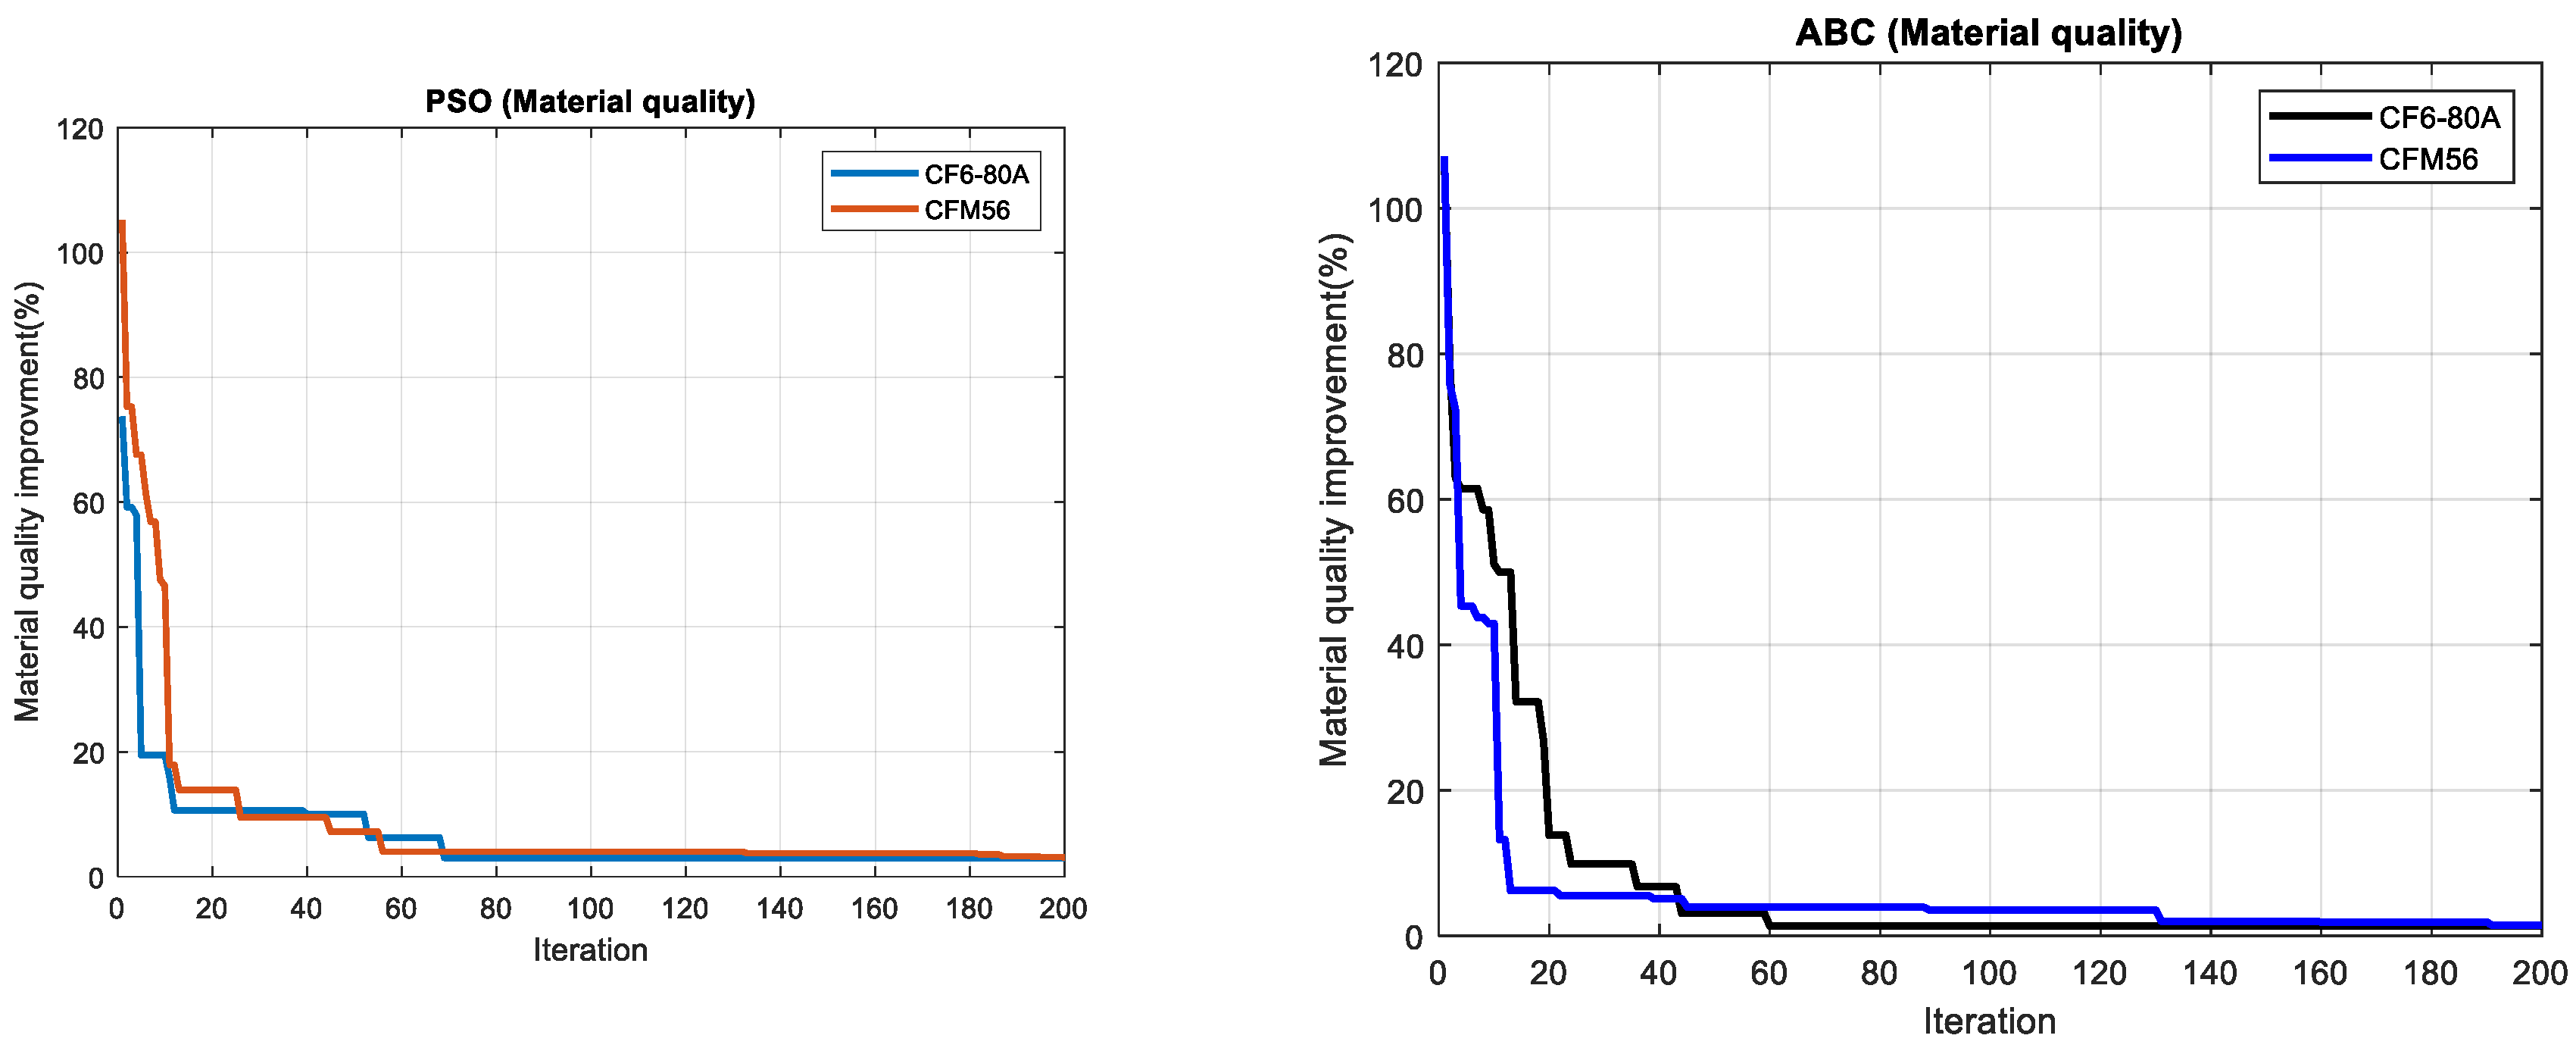
As evident from Figure 21, the optimizers provided varying recommendations regarding the required changes in material quality to achieve minimum exergy destruction. This discrepancy highlights the influence of optimization algorithms on the suggested solutions and underscores the importance of carefully analyzing and interpreting optimization outcomes.
Table 12.
The Results of Each Optimizer and Compare.
| Optimizers | Result |
|---|---|
| Particle Swarm Optimizer | 1.01% |
| Artificial Bee Colony Optimizer | 0.5% |
According to the results obtained from the optimizers, increasing the material quality of the engines by 1.01% (with PSO optimizer) or 0.5% (with ABC optimizer) will lead to minimum exergy destruction.
Conclusion
The objective of this project was to conduct an exergy and thermodynamic analysis of a turbofan engine with 2 shafts and mixed positive flow, aiming to provide a comprehensive understanding of the exergy inefficiencies and destructions within the engine. The results obtained from this research indicate that increasing the flight height of the turbofan engine leads to an increase in its exergy efficiency. This increase is notable when transitioning from flying at sea level to an altitude of 10.6 kilometers, particularly with a compressor pressure ratio of 40. Furthermore, the analysis revealed that the combustion chamber exhibits the highest exergy destruction rate, with values of 14.21 MW for the CF6-80A engine and 15.02 MW for the CFM56 engine.
Several conclusions can be drawn from the exergy analysis of the CF6-80A and CFM56 engines:
- The combustion chamber emerges as the main irreversible component of the engines. Developing fuels that reduce exergy destruction in this component is an area of ongoing research.
- Chemical exergy, primarily from the combustion process in the combustion chamber, significantly impacts the analysis. However, in other engine components, chemical exergy is comparatively lower, and the analysis focuses more on physical exergy.
- The CF6-80A engine demonstrates superior engineering and design under cruise operating conditions compared to the CFM56 engine, which is still under development. Most components exhibit exergetic efficiency above 90%, with an overall exergetic efficiency of 76.71%.
- The optimal pressure ratio of the compressor varies at different flight altitudes. Therefore, selecting the design pressure ratio should consider the altitude at which the aircraft primarily operates.
- Higher exit temperatures from the combustion chamber led to better exergy performance.
- Maximizing the heating of fuel entering the combustion chamber, often achieved with returned oil from the engine, is beneficial for exergy performance.
References
- Dincer, I. and A. Abu-Rayash, Sustainability modeling of turbofan engines. Energy Sustainability, 2022. 112: p. 11023-11035.
- Caliskan, H., S. Ekici, and Y. Sohret, Advanced exergy analysis of a turbojet engine main components considering mexogenous, endogenous, exegenous, avoidable and unavoidable exergy destructions. Propulsion and Power Research, 2022. [CrossRef]
- Kalkan, O. and et al., Exergy and environmental analysis of a turbojet engine for different flight phases. Energy Conversion and Management, 2024. 220: p. 115037.
- ICAO, Forecasts of Scheduled June Passenger and Freight Traffic. 2019.
- Aras, H. and O. Balli, Exergetic and exergoeconomic analysis of a turbofan engine considering fuel type variations. Journal of Exergy, 2022. 12: p. 171-182.
- Elmas, F. and et al., Multi-objective exergy optimization of a turbofan engine using genetic algorithms. Applied Thermal Engineering, 2023. 201: p. 117718.
- Yılmaz, T. and M. Gündüz, Exergy analysis of an advanced turbofan engine with an intercooler. Energy, 2022. 241: p. 122612.
- Yılmaz, C., Exergetic and environmental analysis of a turbofan engine using biofuels. Journal of Cleaner Production, 2022. 331: p. 129857.
- Yılmaz, C. and B. Şahin, Exergetic and environmental analysis of a turbofan engine using biofuels. Journal of Cleaner Production, 2022. 331: p. 129857.
- Elyas, E. and T.H. Karakoç, Exergy Analysis of a Turbofan Engine for an Unmanned Aerial Vehicle during a Surveillance Mission. Journal of Energy, 2017. 93: p. 716-729. [CrossRef]
- Taniyana, D.W., Exergy-Based Performance Analysis of a Turbojet Engine. 52nd AIAA/SAE/ASEE Joint Propulsion Conference, 2016.
- Altaei, A.A.K., Advanced Exergy Analyses to Evaluate the Performance of a Military Aircraft Turbofan Engine (TJE) with Afterburner System: Splitting Exergy Destruction into Unavoidable/Avoidable and Endogenous/Exogenous. Journal of Applied Thermal Engineering, 2017. 111: p. 152-169. [CrossRef]
- Yasin, G.F.C. Rogers, and H.I.H. Saravanamuttoo, Gas Turbine Theory, ed. th. 1999.
- Dodds, W., E. Ekstedt, and D. Bahr, Methanol combustion in a CF6l-80A engine combustor, in 19th Joint Propulsion Conference. 1983.
- Mosavi, A., M. Sabzehali, and S. Davoodabadi Farahani, Prediction of the energy and exergy performance of F135 PW100 turbofan engine via deep learning. Energy Conversion and Management, 2022. 265: p. 115775. [CrossRef]
- Şengör, İ. and S. Ekici, Exergy analysis and environmental impact assessment of a turbofan engine. Journal of Environmental Management, 2022. 302: p. 113989.
- Sabzehali, M., S. Davoodabadi Farahani, and A. Mosavi, Energy-Exergy Analysis and Optimal Design of a Hydrogen Turbofan Engine. Energy Conversion and Management, 2022. 265: p. 115775. [CrossRef]
- Gudmundsson, S., Thrust Modeling for Gas Turbines. General Aviation Aircraft Design, 2022: p. 573-595. [CrossRef]
- Marini, F. and B. Walczak, Particle swarm optimization (PSO). A tutorial. Chemometrics and Intelligent Laboratory Systems, 2015. 149: p. 153-165. [CrossRef]
- Samani, M., et al., Minimum-time open-loop and closed-loop optimal guidance with GA-PSO and neural fuzzy for Samarai MAV flight. IEEE Aerospace and Electronic Systems Magazine, 2015. 30(5): p. 28-37. [CrossRef]
- Karaboga, D. and B. Basturk, A powerful and efficient algorithm for numerical function optimization: artificial bee colony (ABC) algorithm. Journal of global optimization, 2007. 39: p. 459-471. [CrossRef]
Figure 1.
General Schematic of Engines.
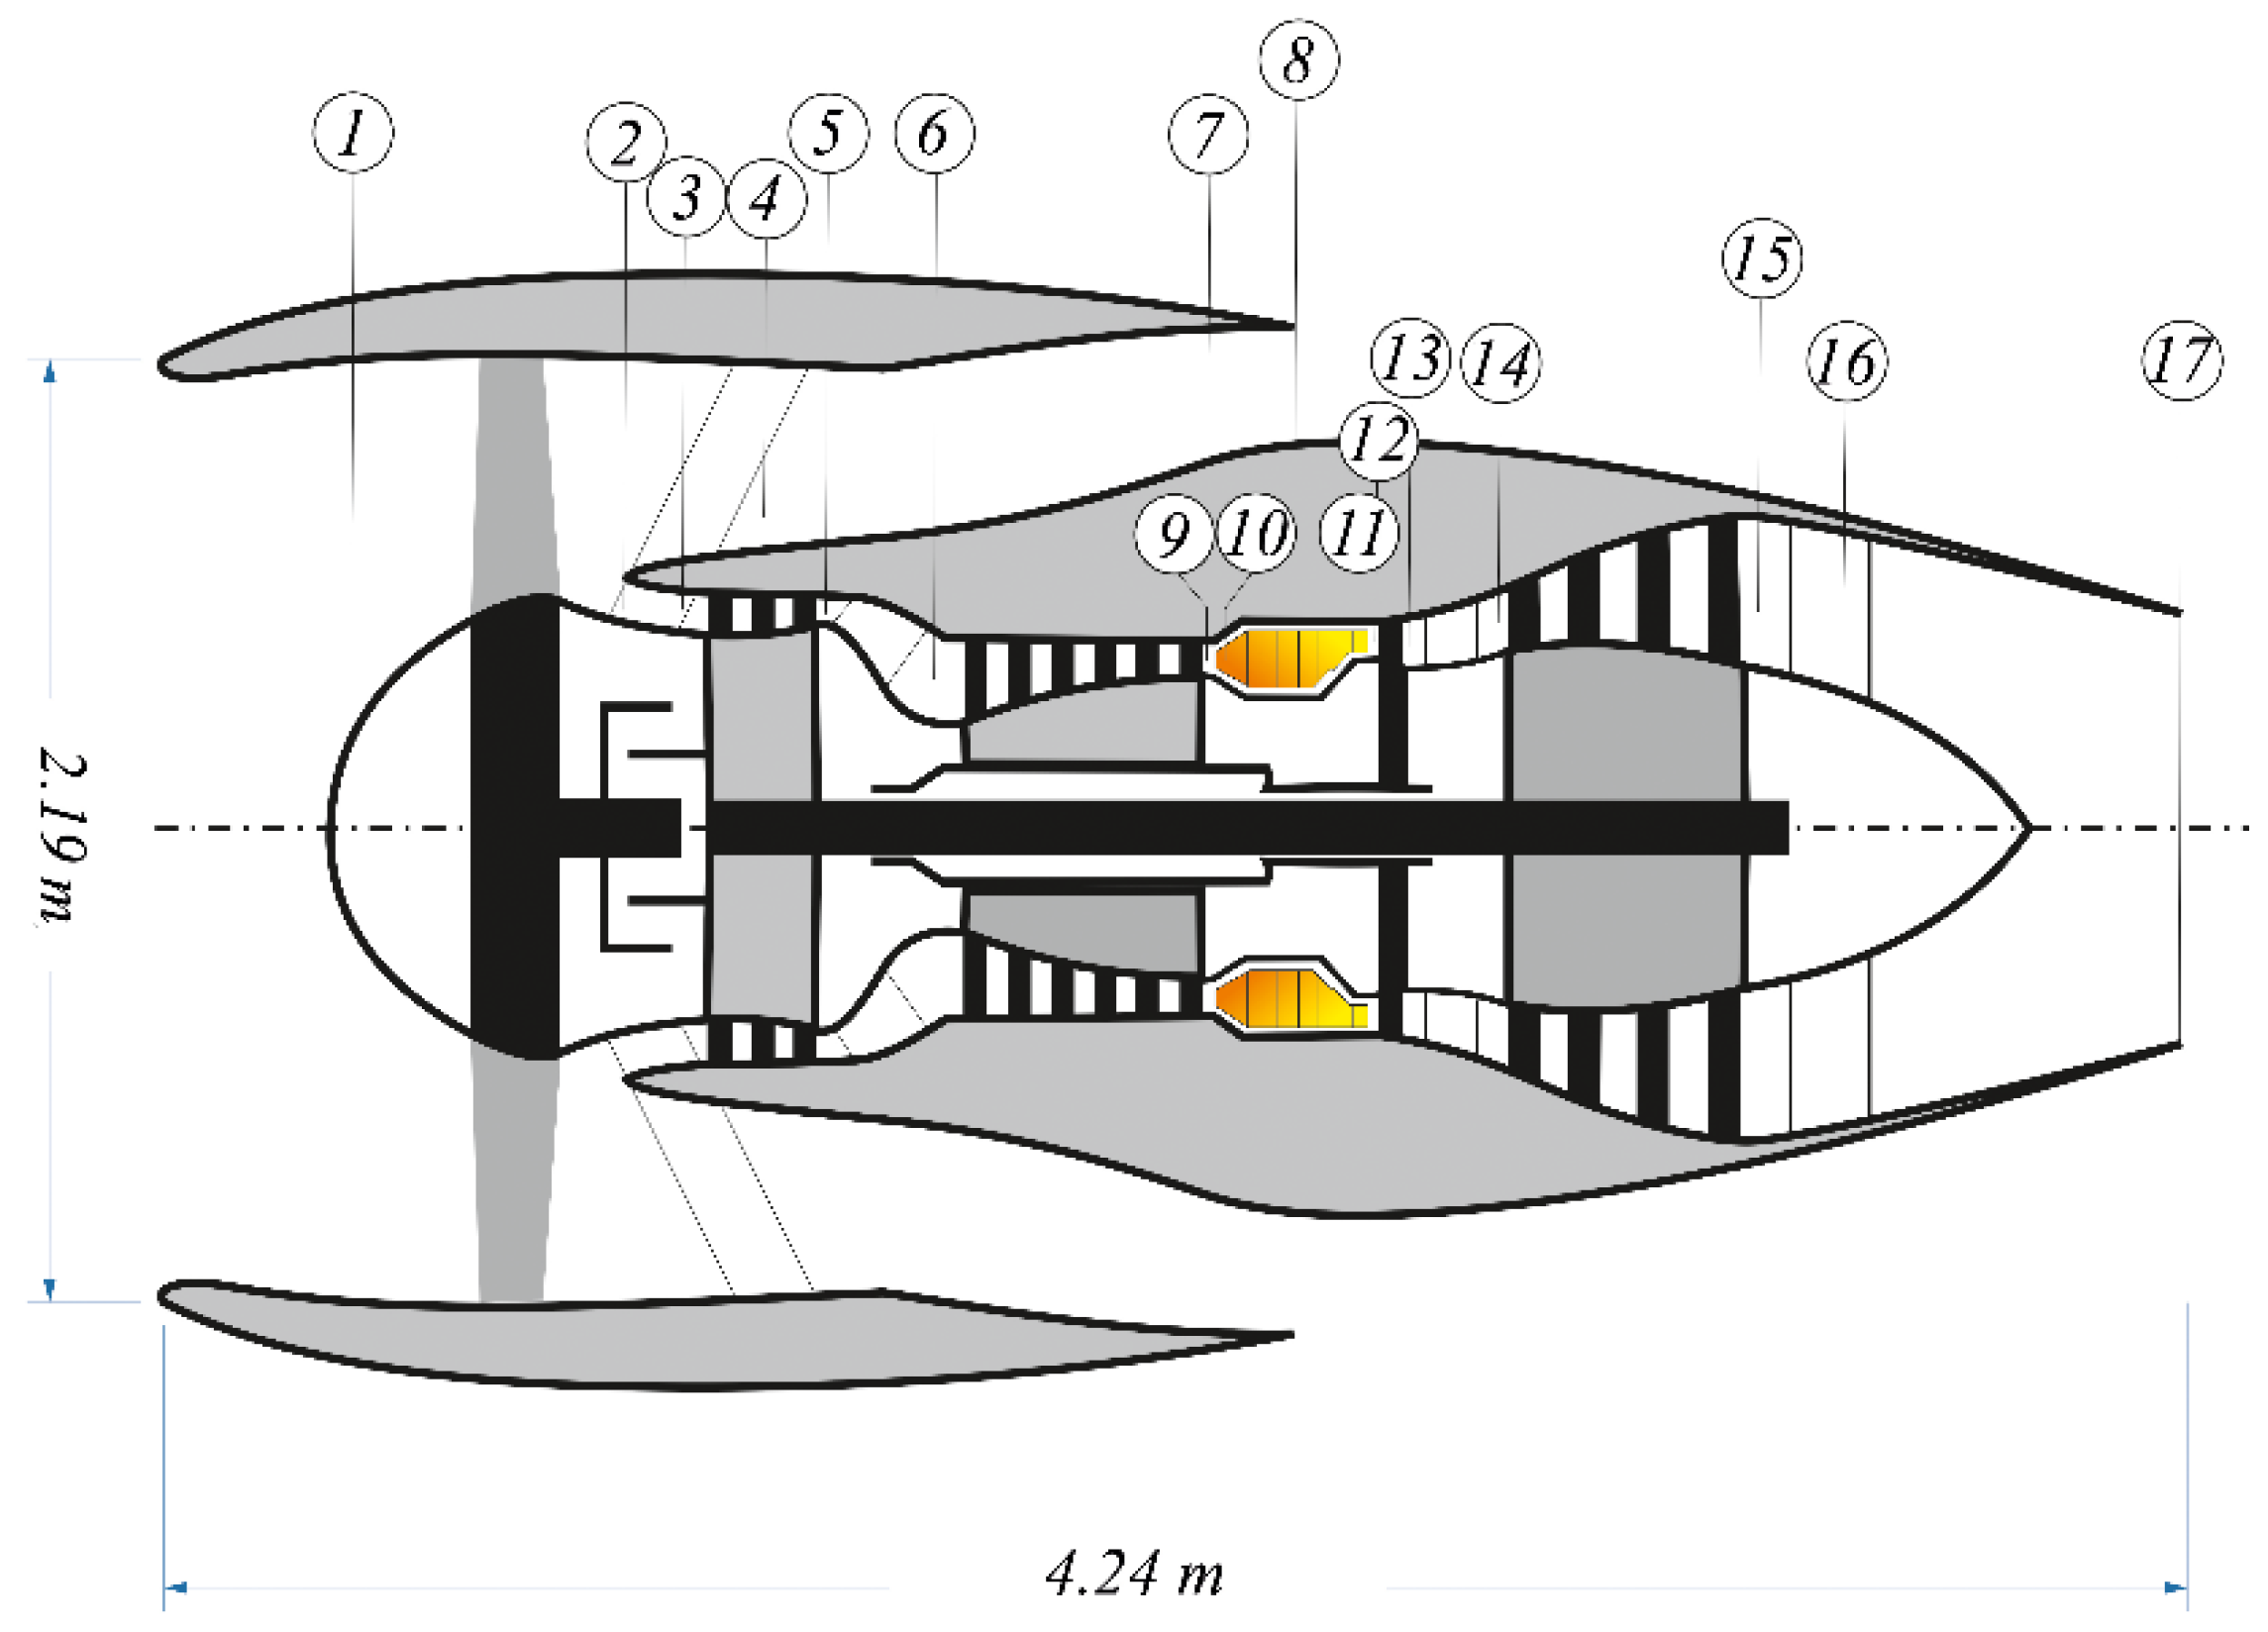
Figure 8.
Exergy Efficiency of Engines Components.
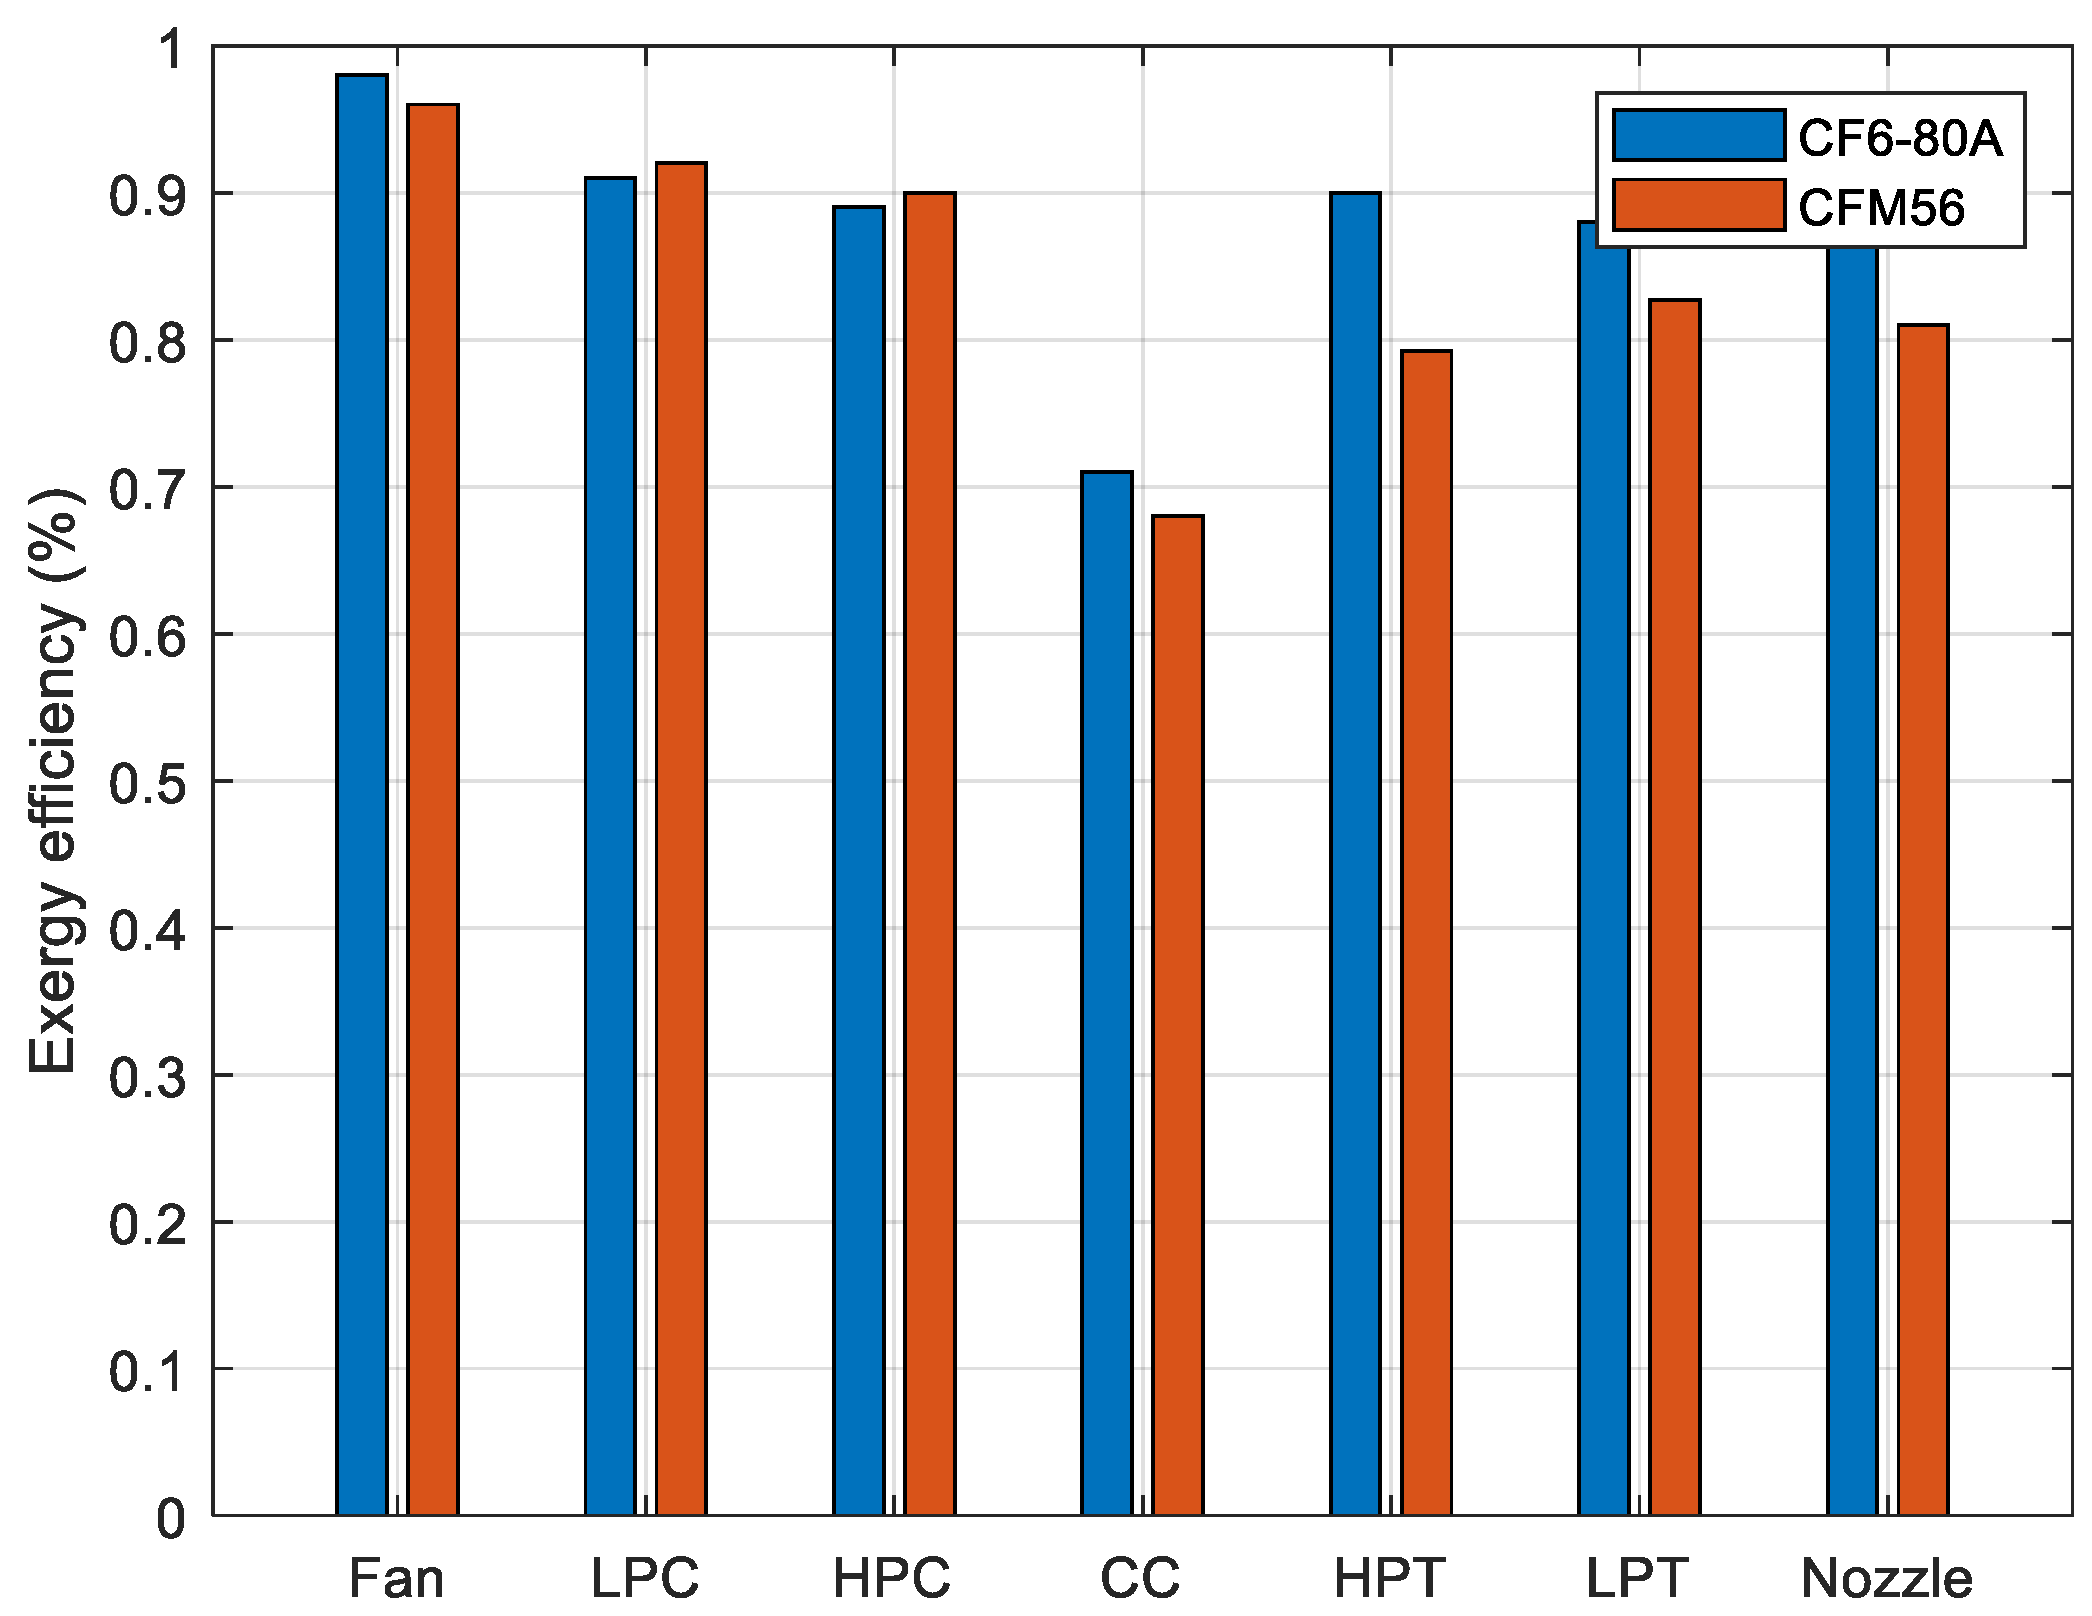
Figure 9.
Exergy Destruction of Engines Components.
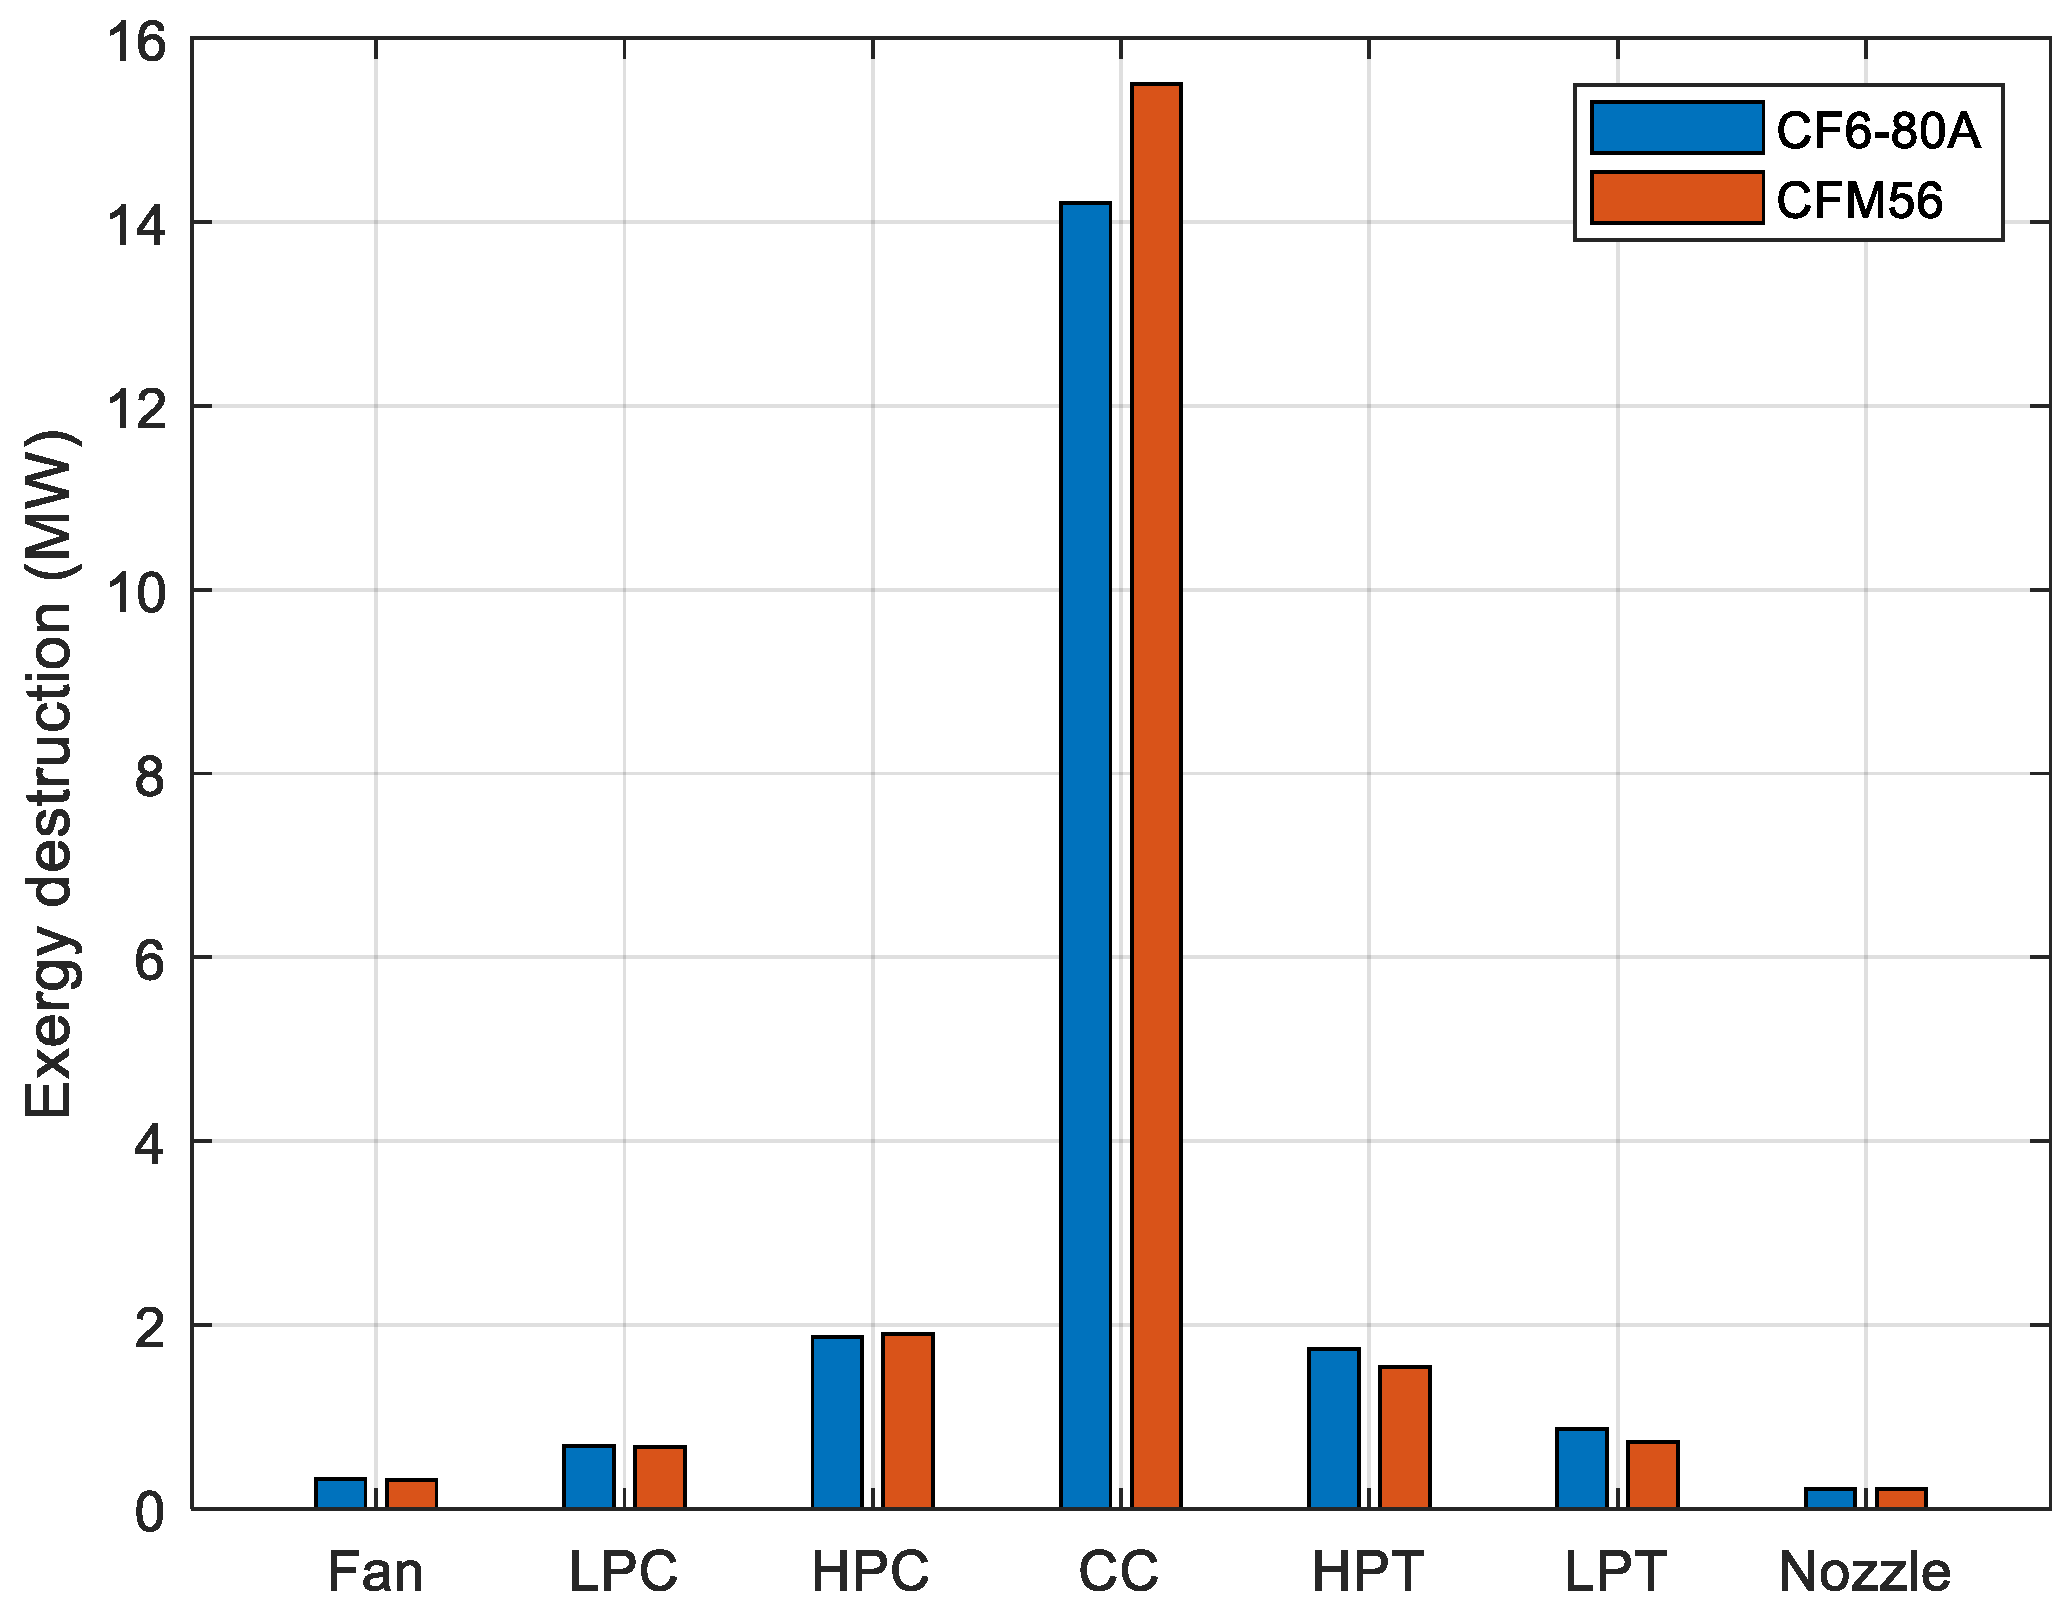
Figure 10.
The Changes in Engine Exergy Efficiency in Relation to the Change in Flight Altitude and the Working Pressure Ratio of the Compressor.
Figure 10.
The Changes in Engine Exergy Efficiency in Relation to the Change in Flight Altitude and the Working Pressure Ratio of the Compressor.
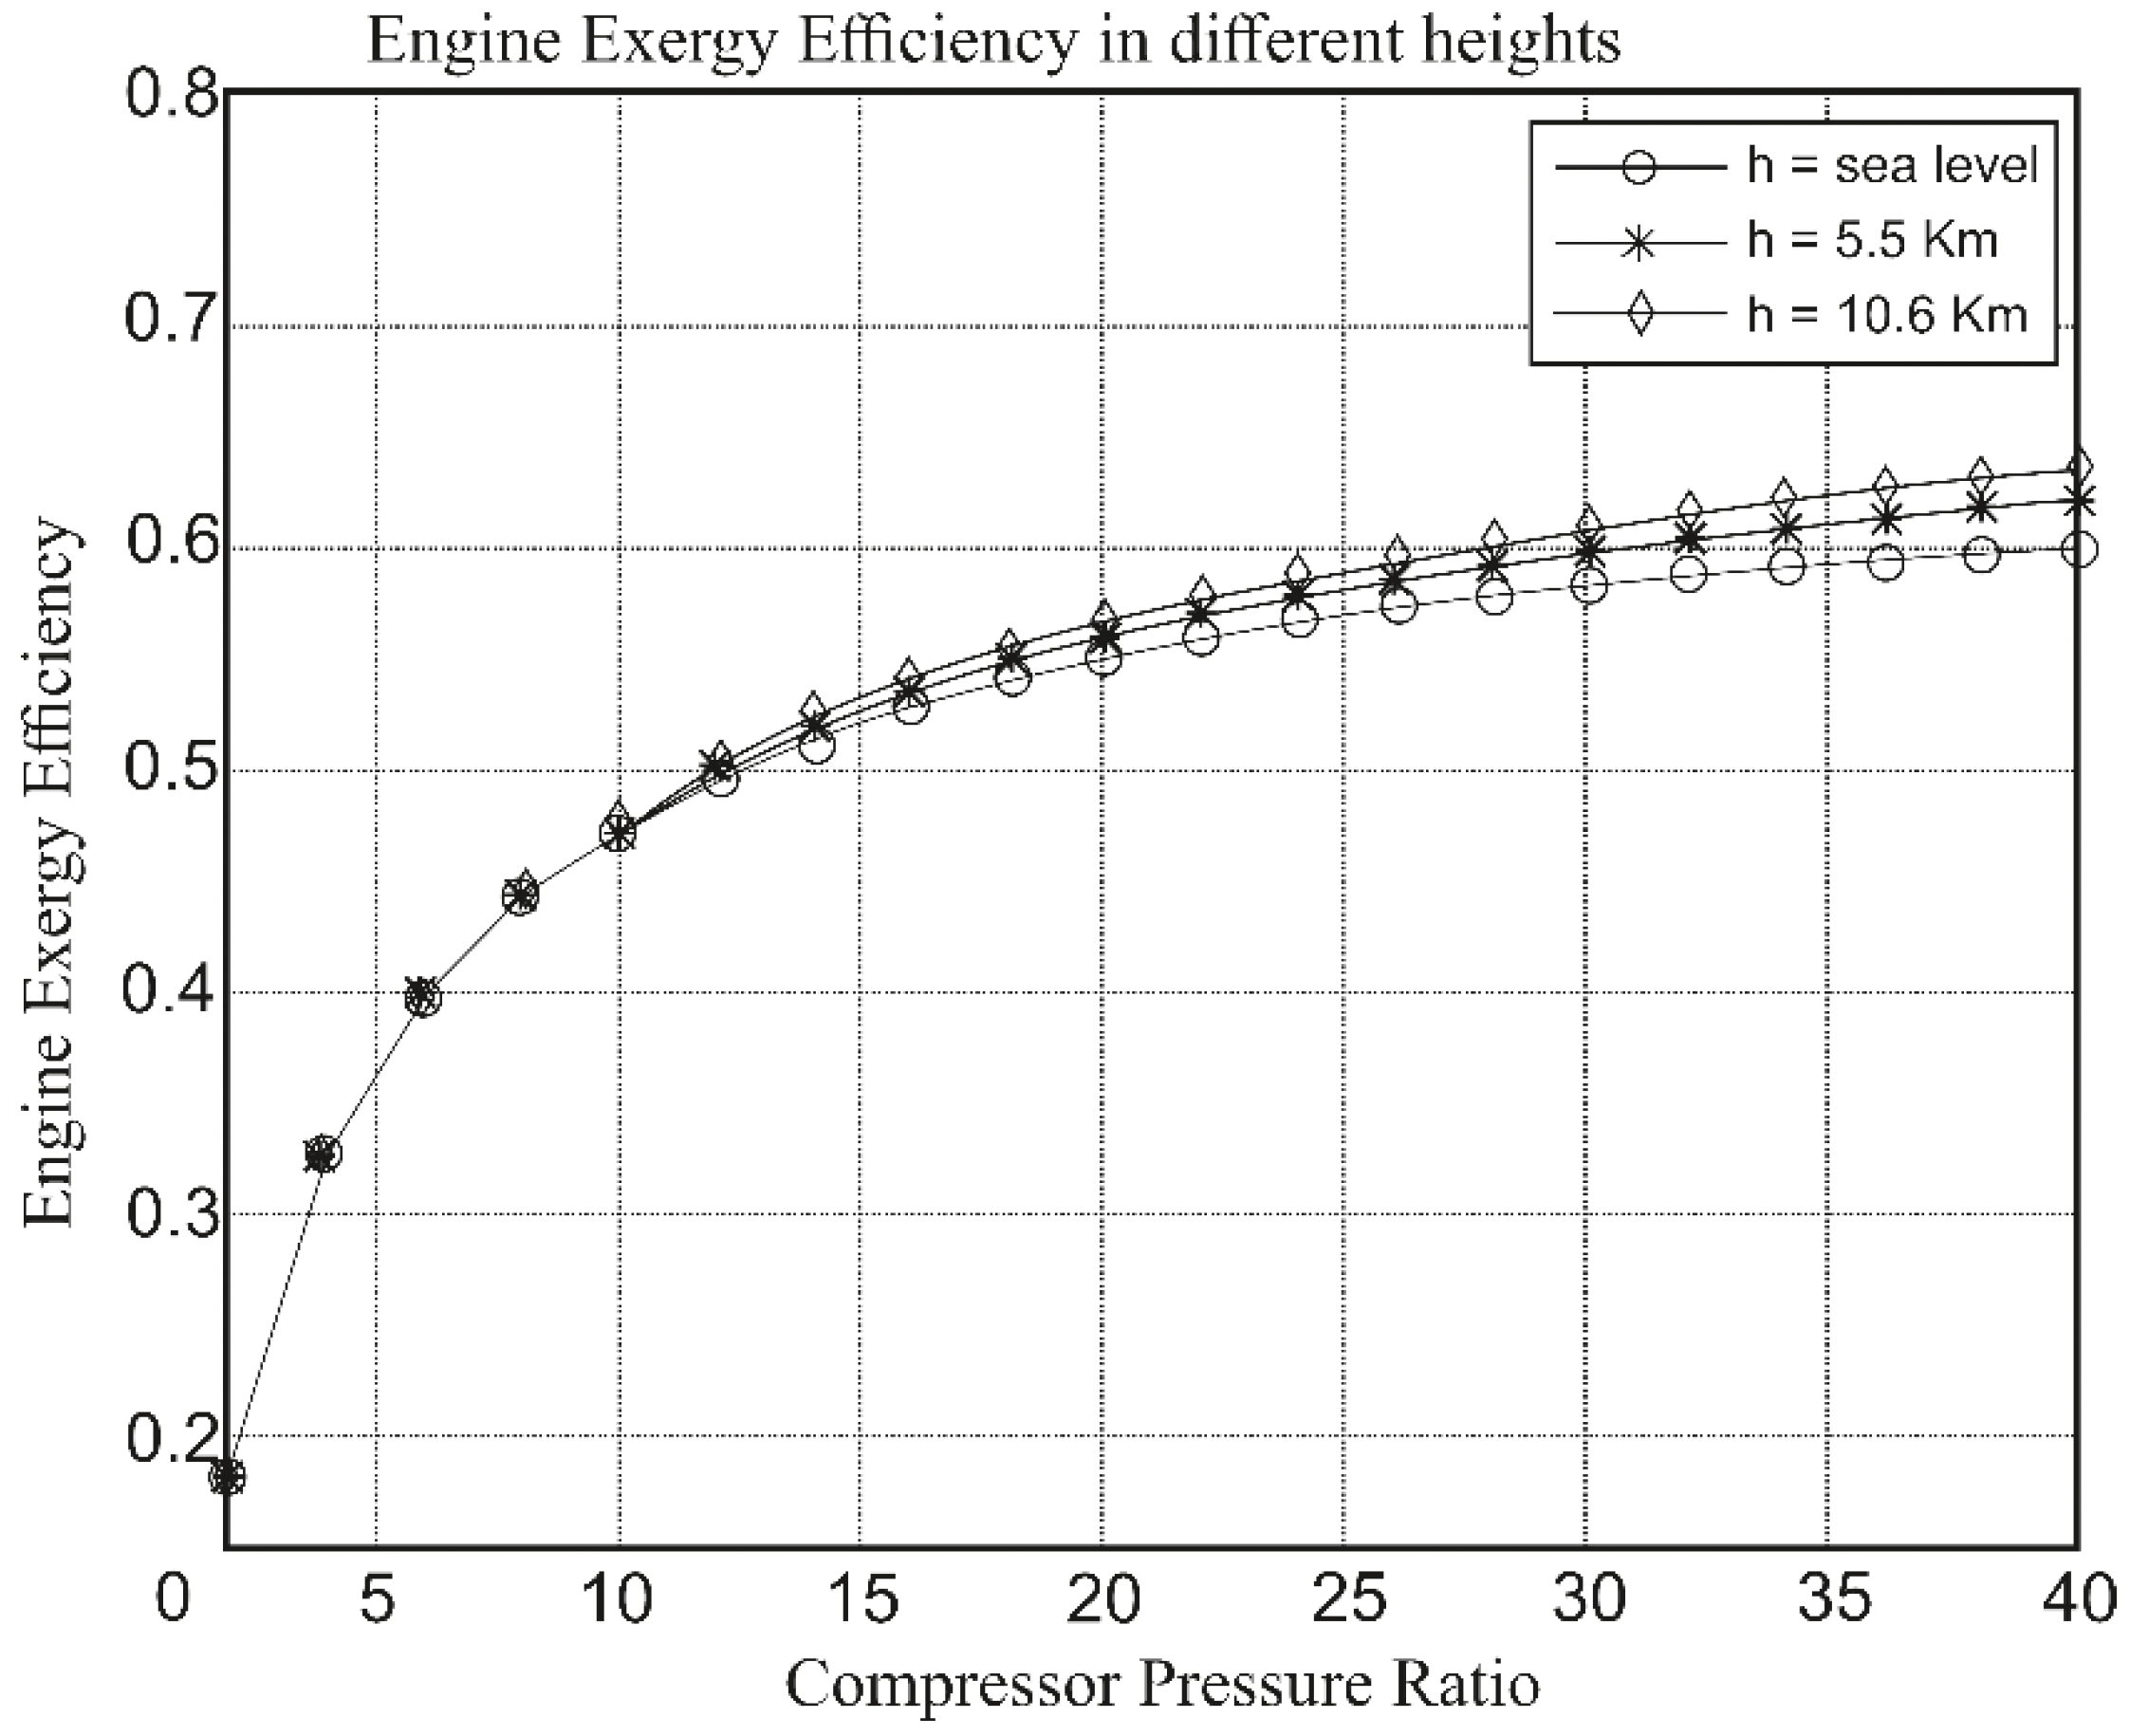
Figure 11.
Improvement Potential of Engines Components.
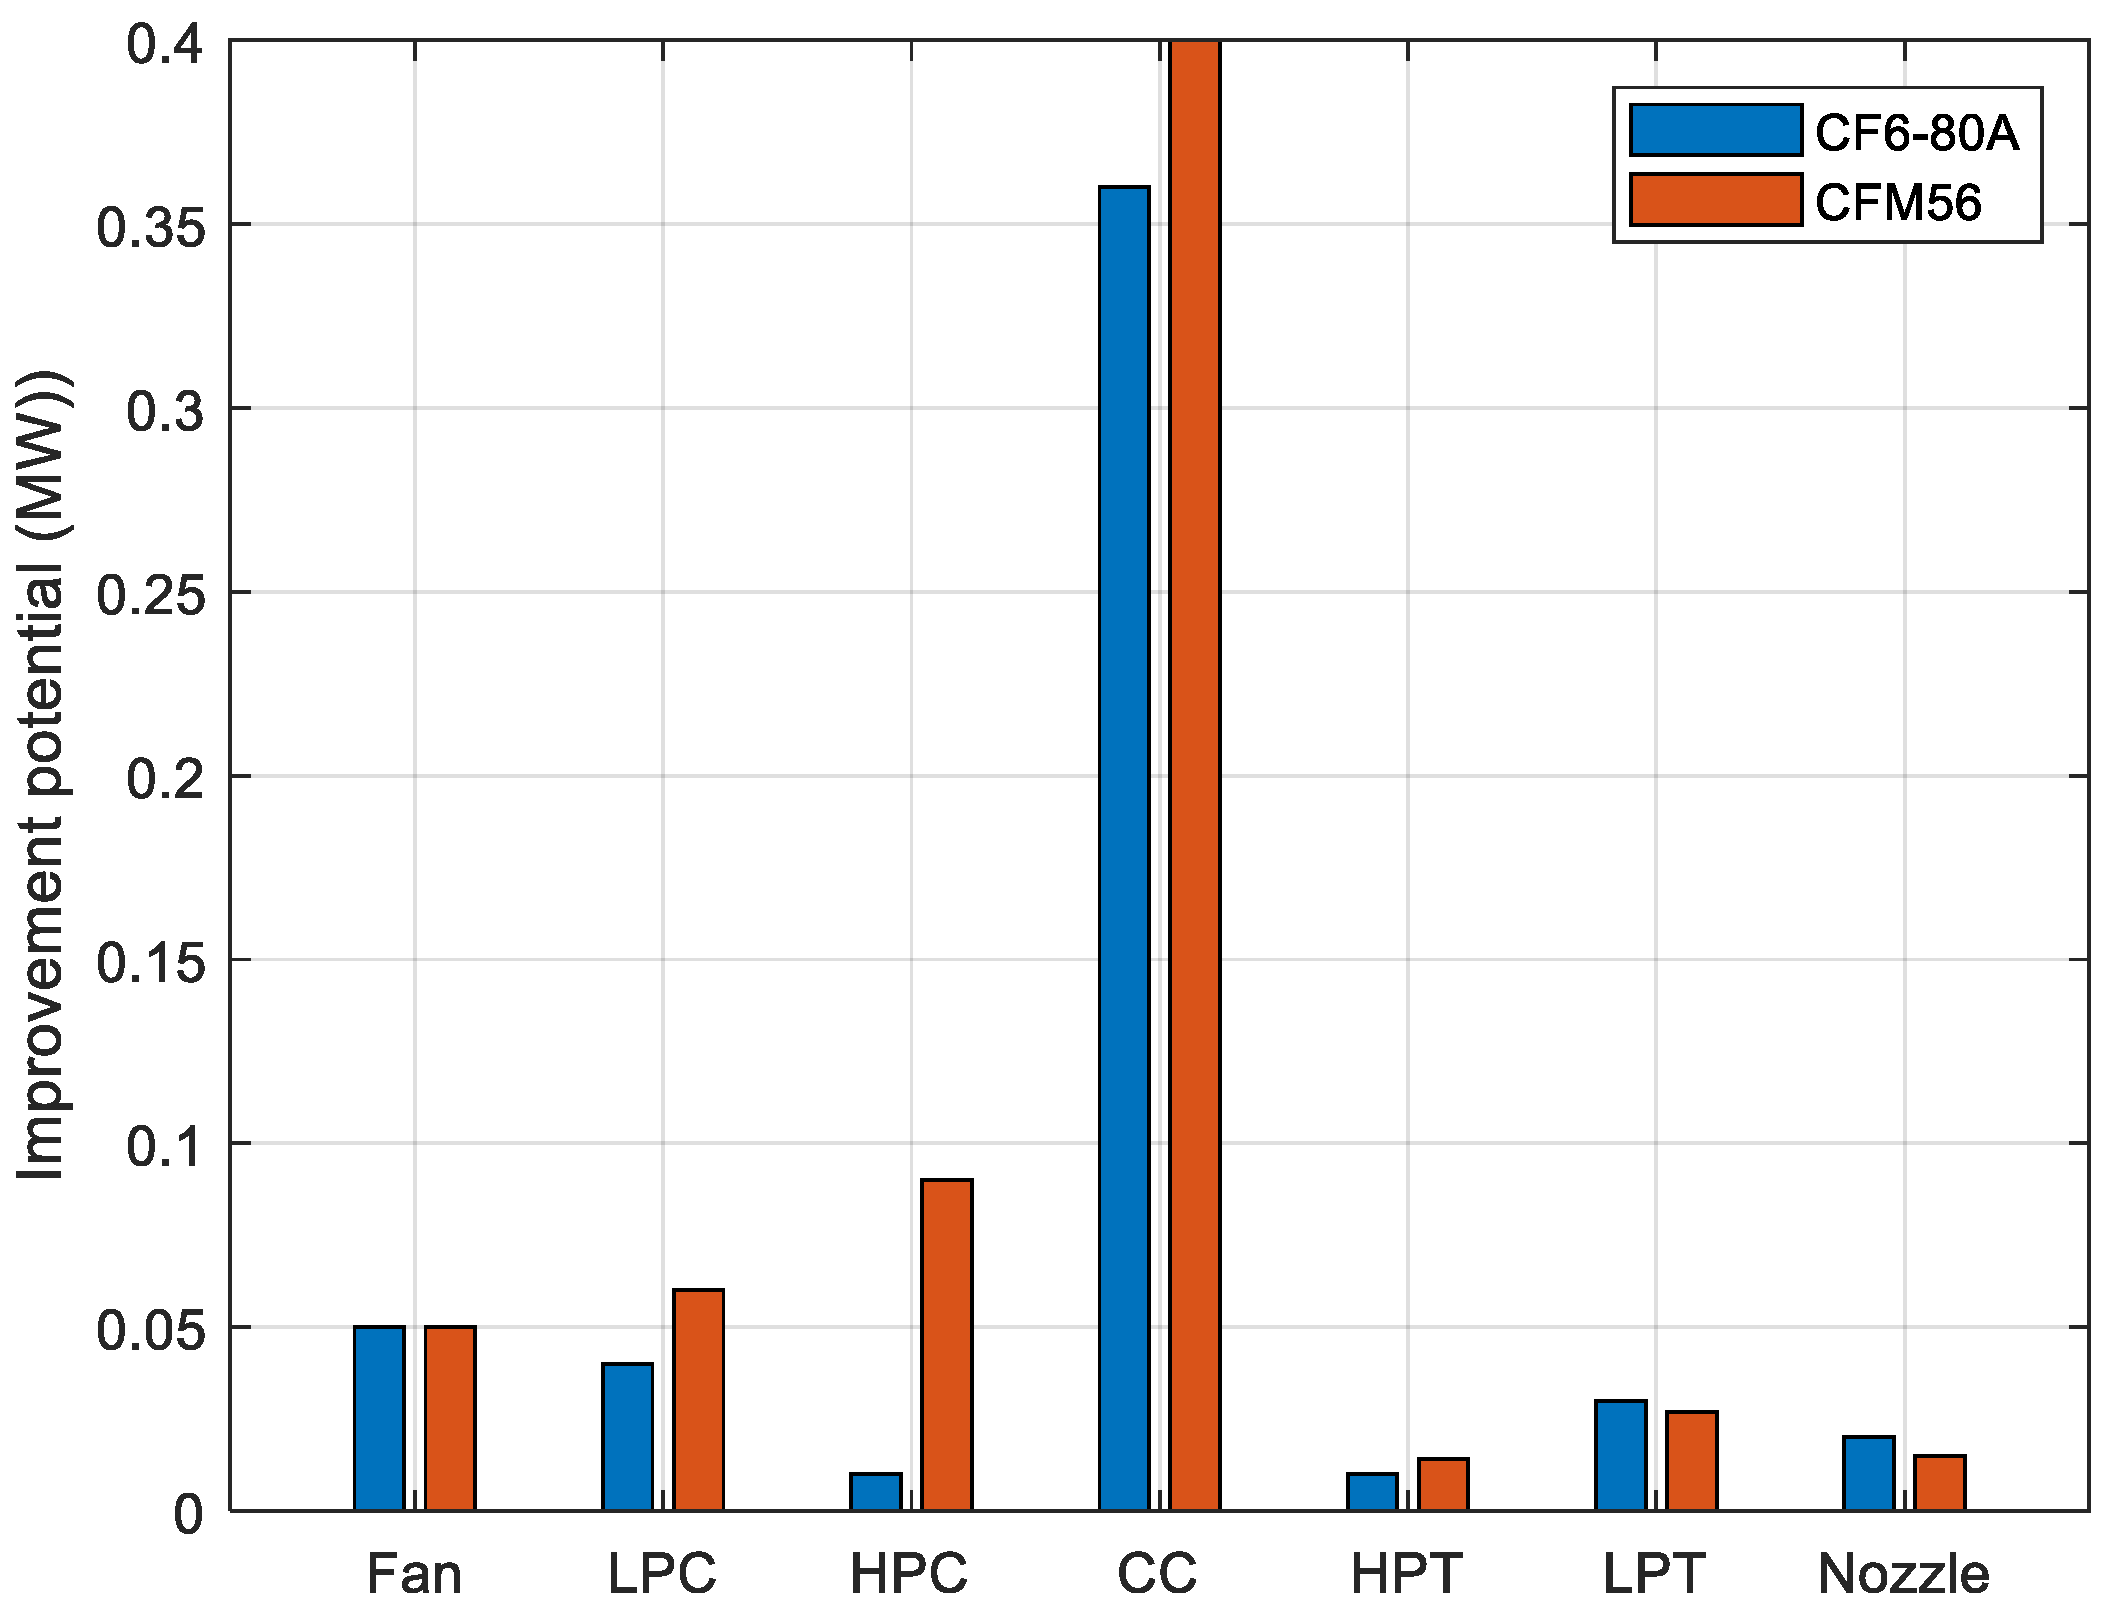
Figure 12.
Changes in Engine Exergy Efficiency Compared to the Change in the Temperature of the Gases Entering the Turbine and the Flight Velocity.
Figure 12.
Changes in Engine Exergy Efficiency Compared to the Change in the Temperature of the Gases Entering the Turbine and the Flight Velocity.
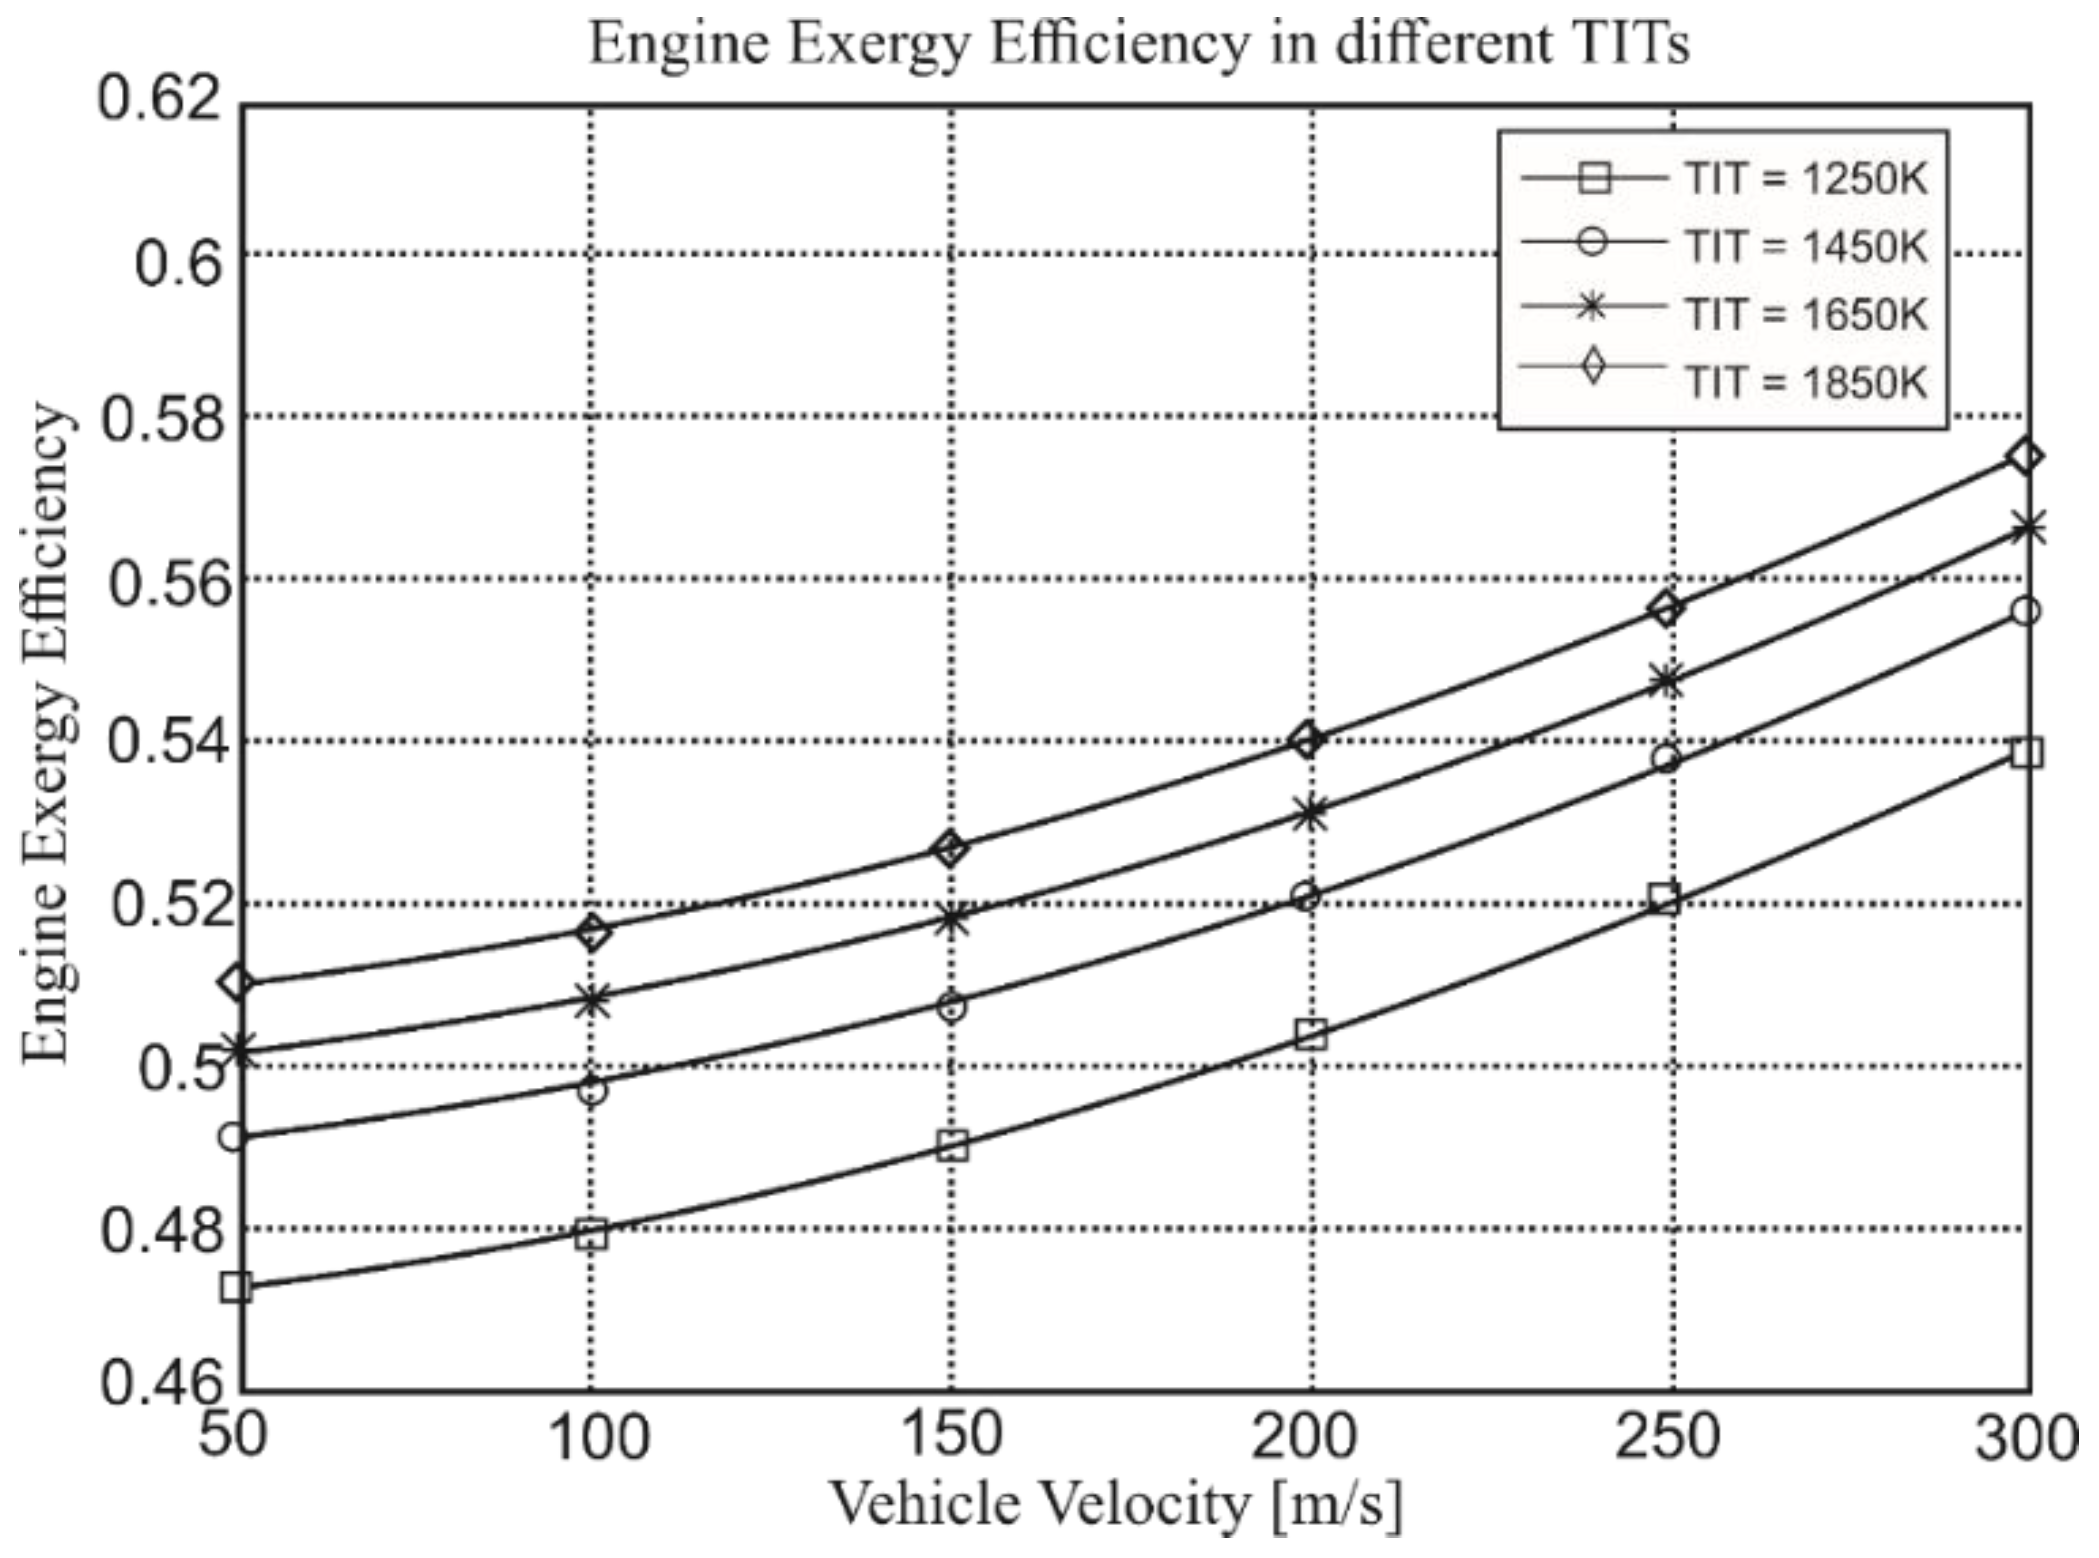
Figure 13.
Relative Exergy Degradation of Engines Components.
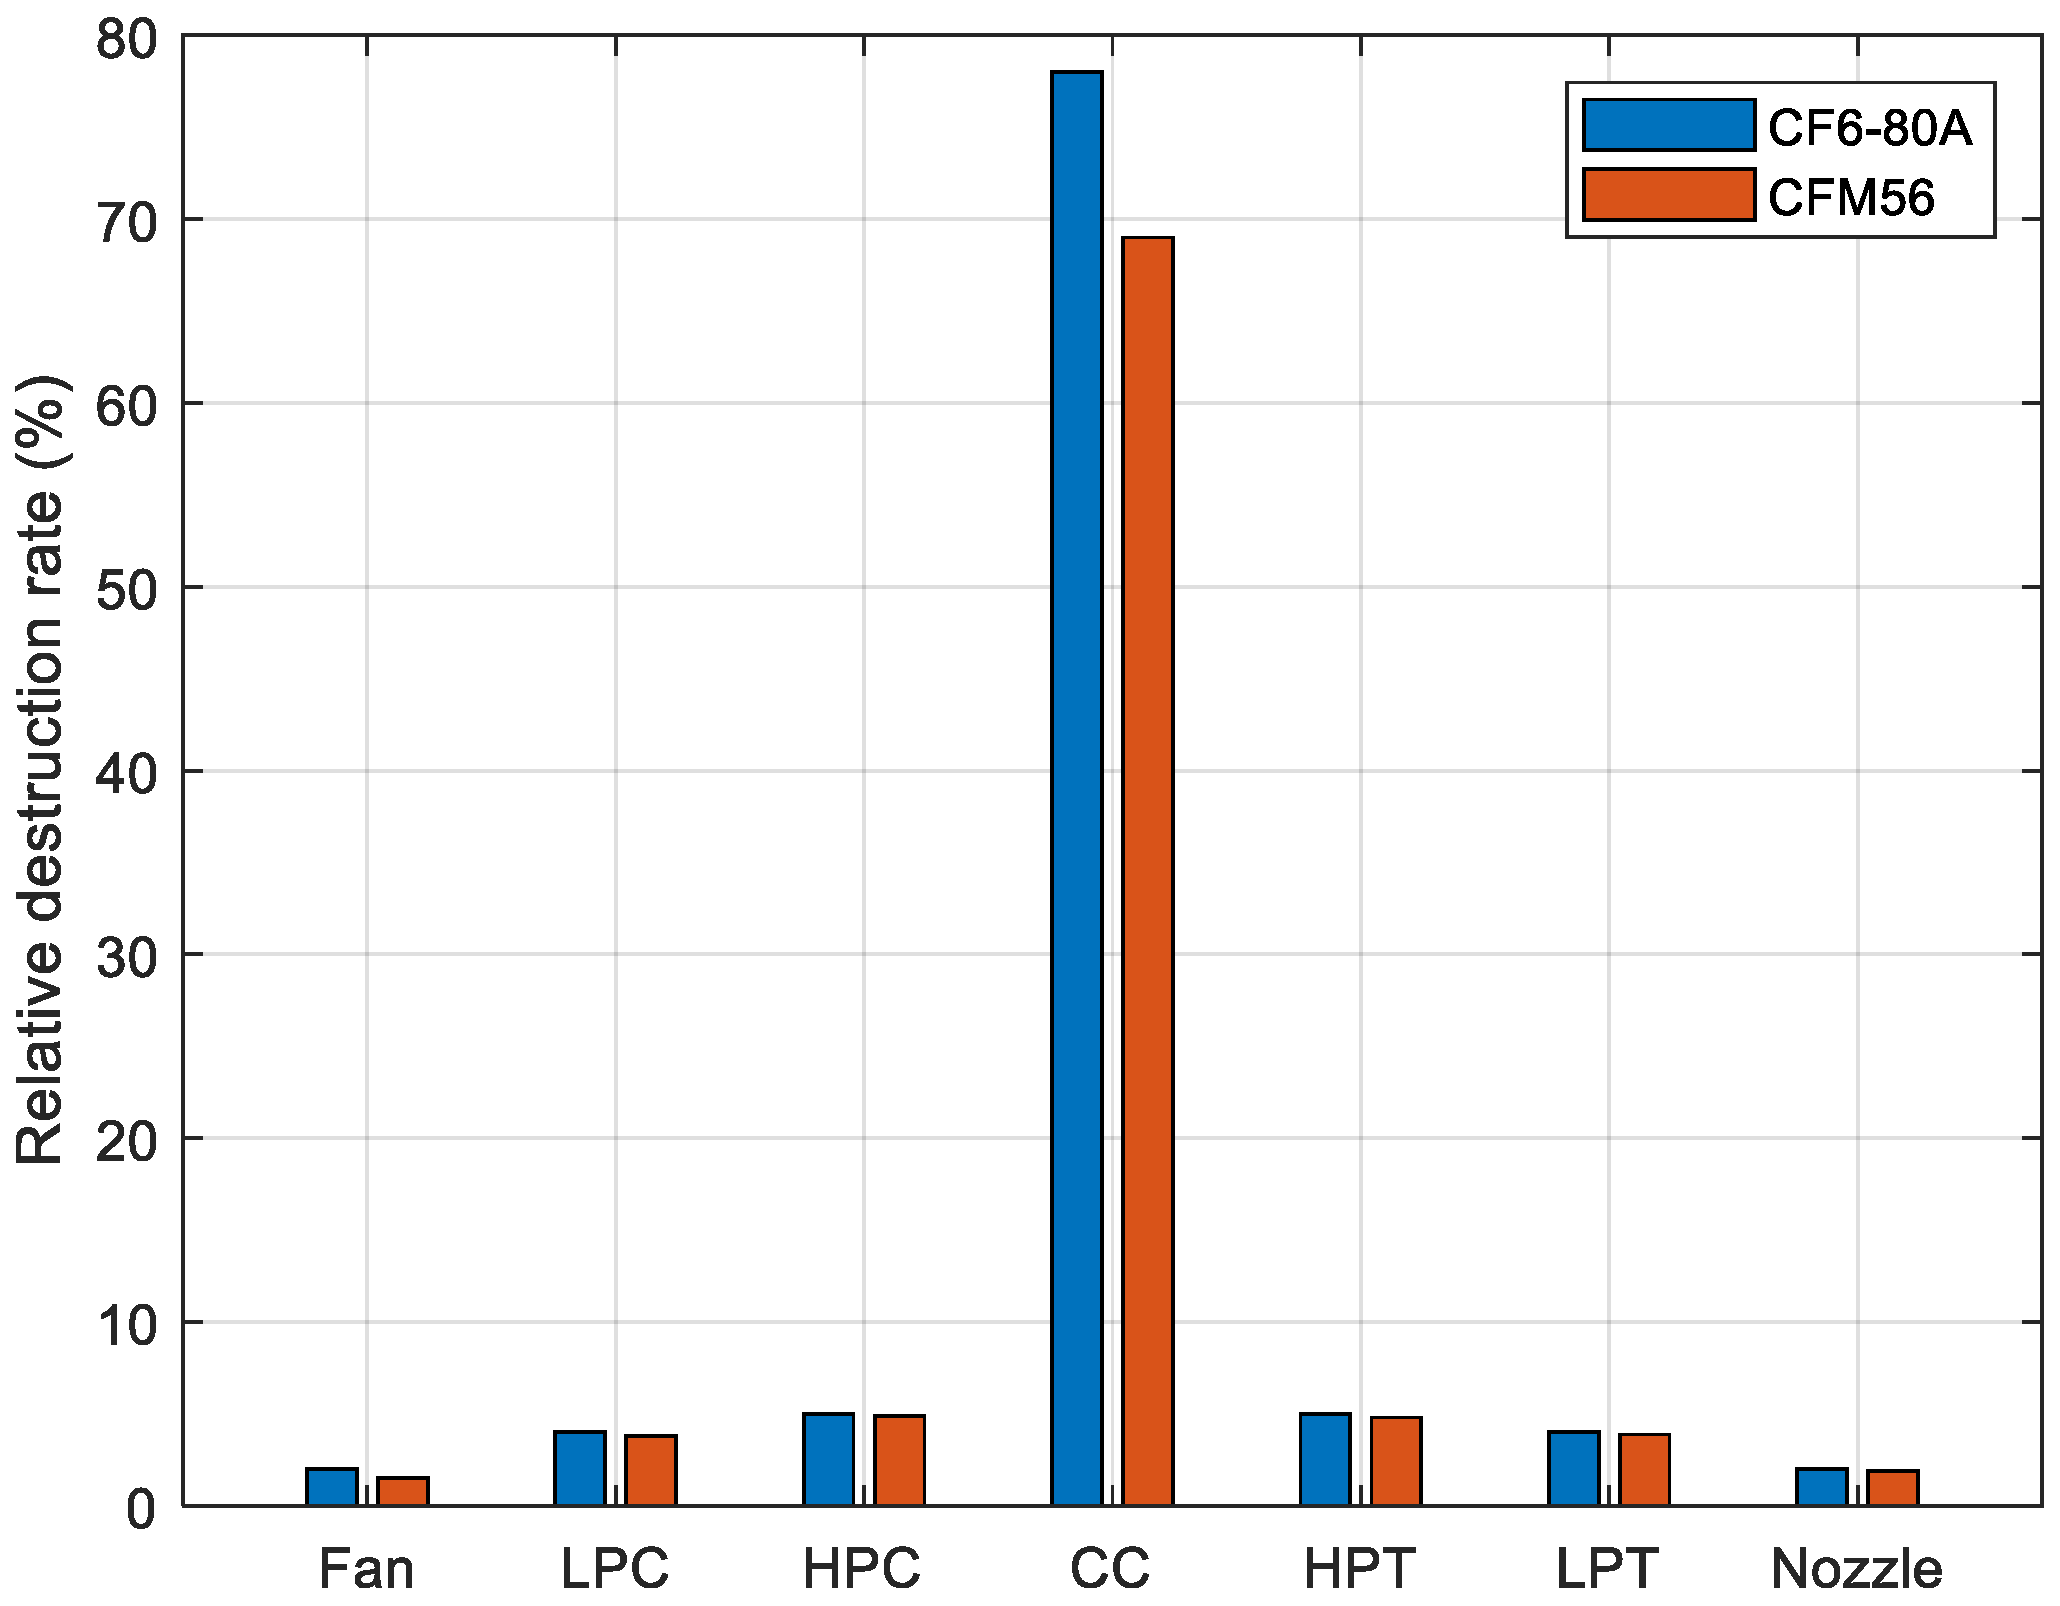
Figure 14.
Engine Components Fuel Depletion Rate.
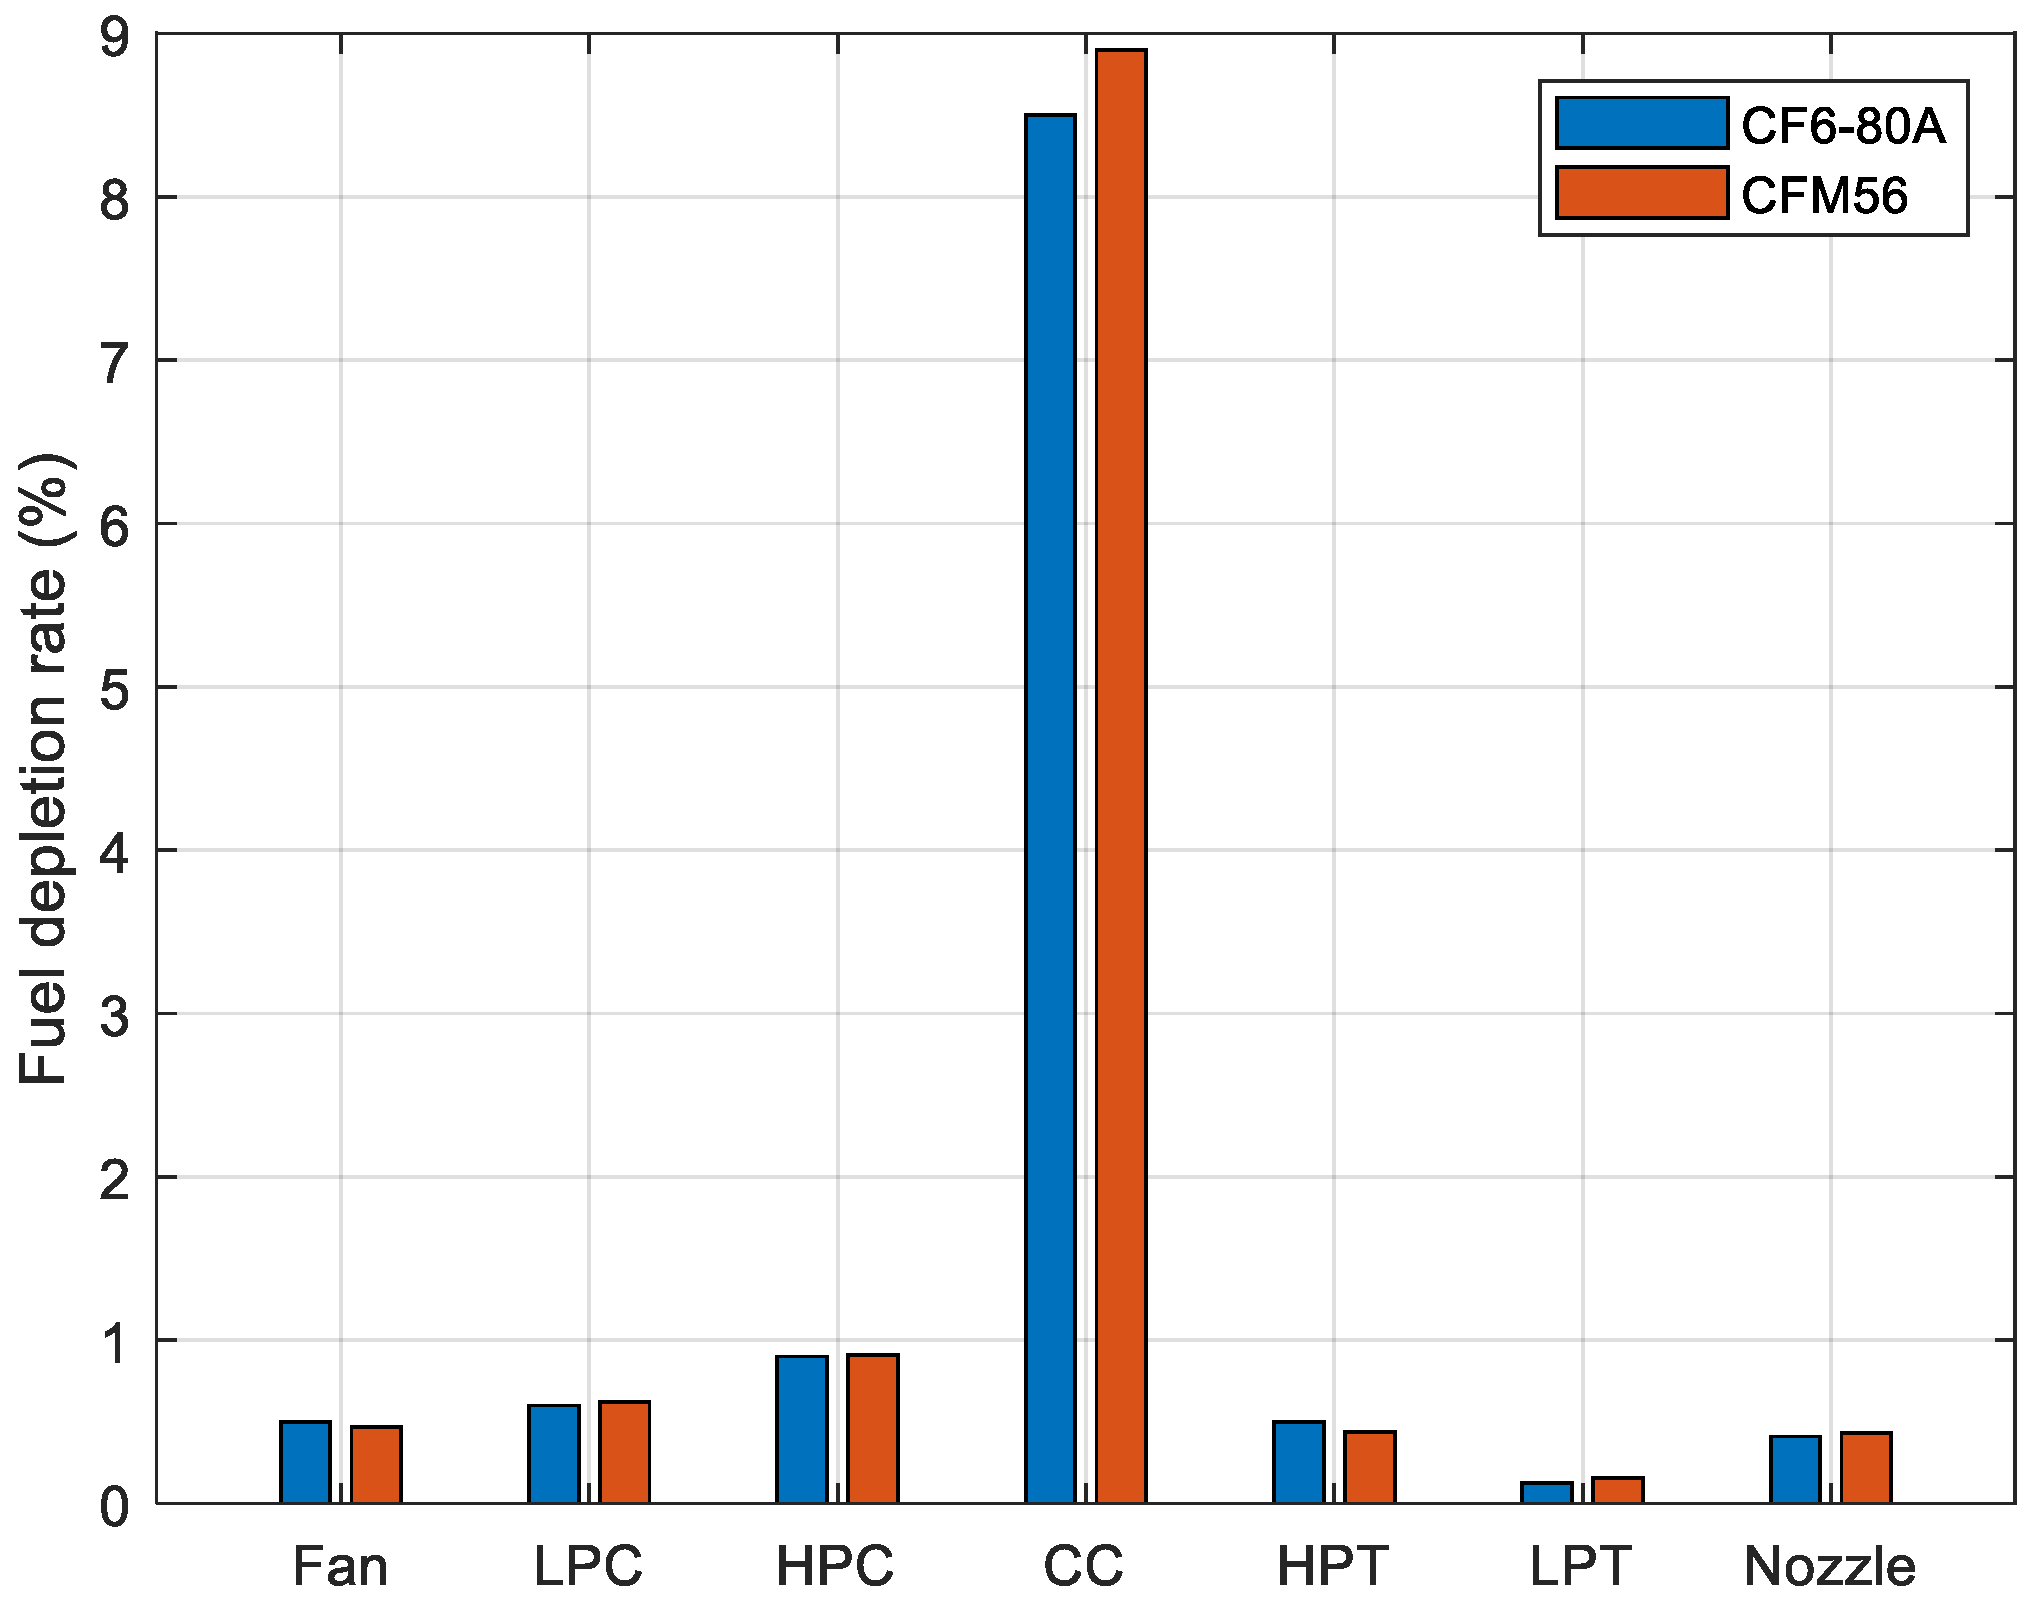
Figure 15.
Engine Components Efficiency Ratio.
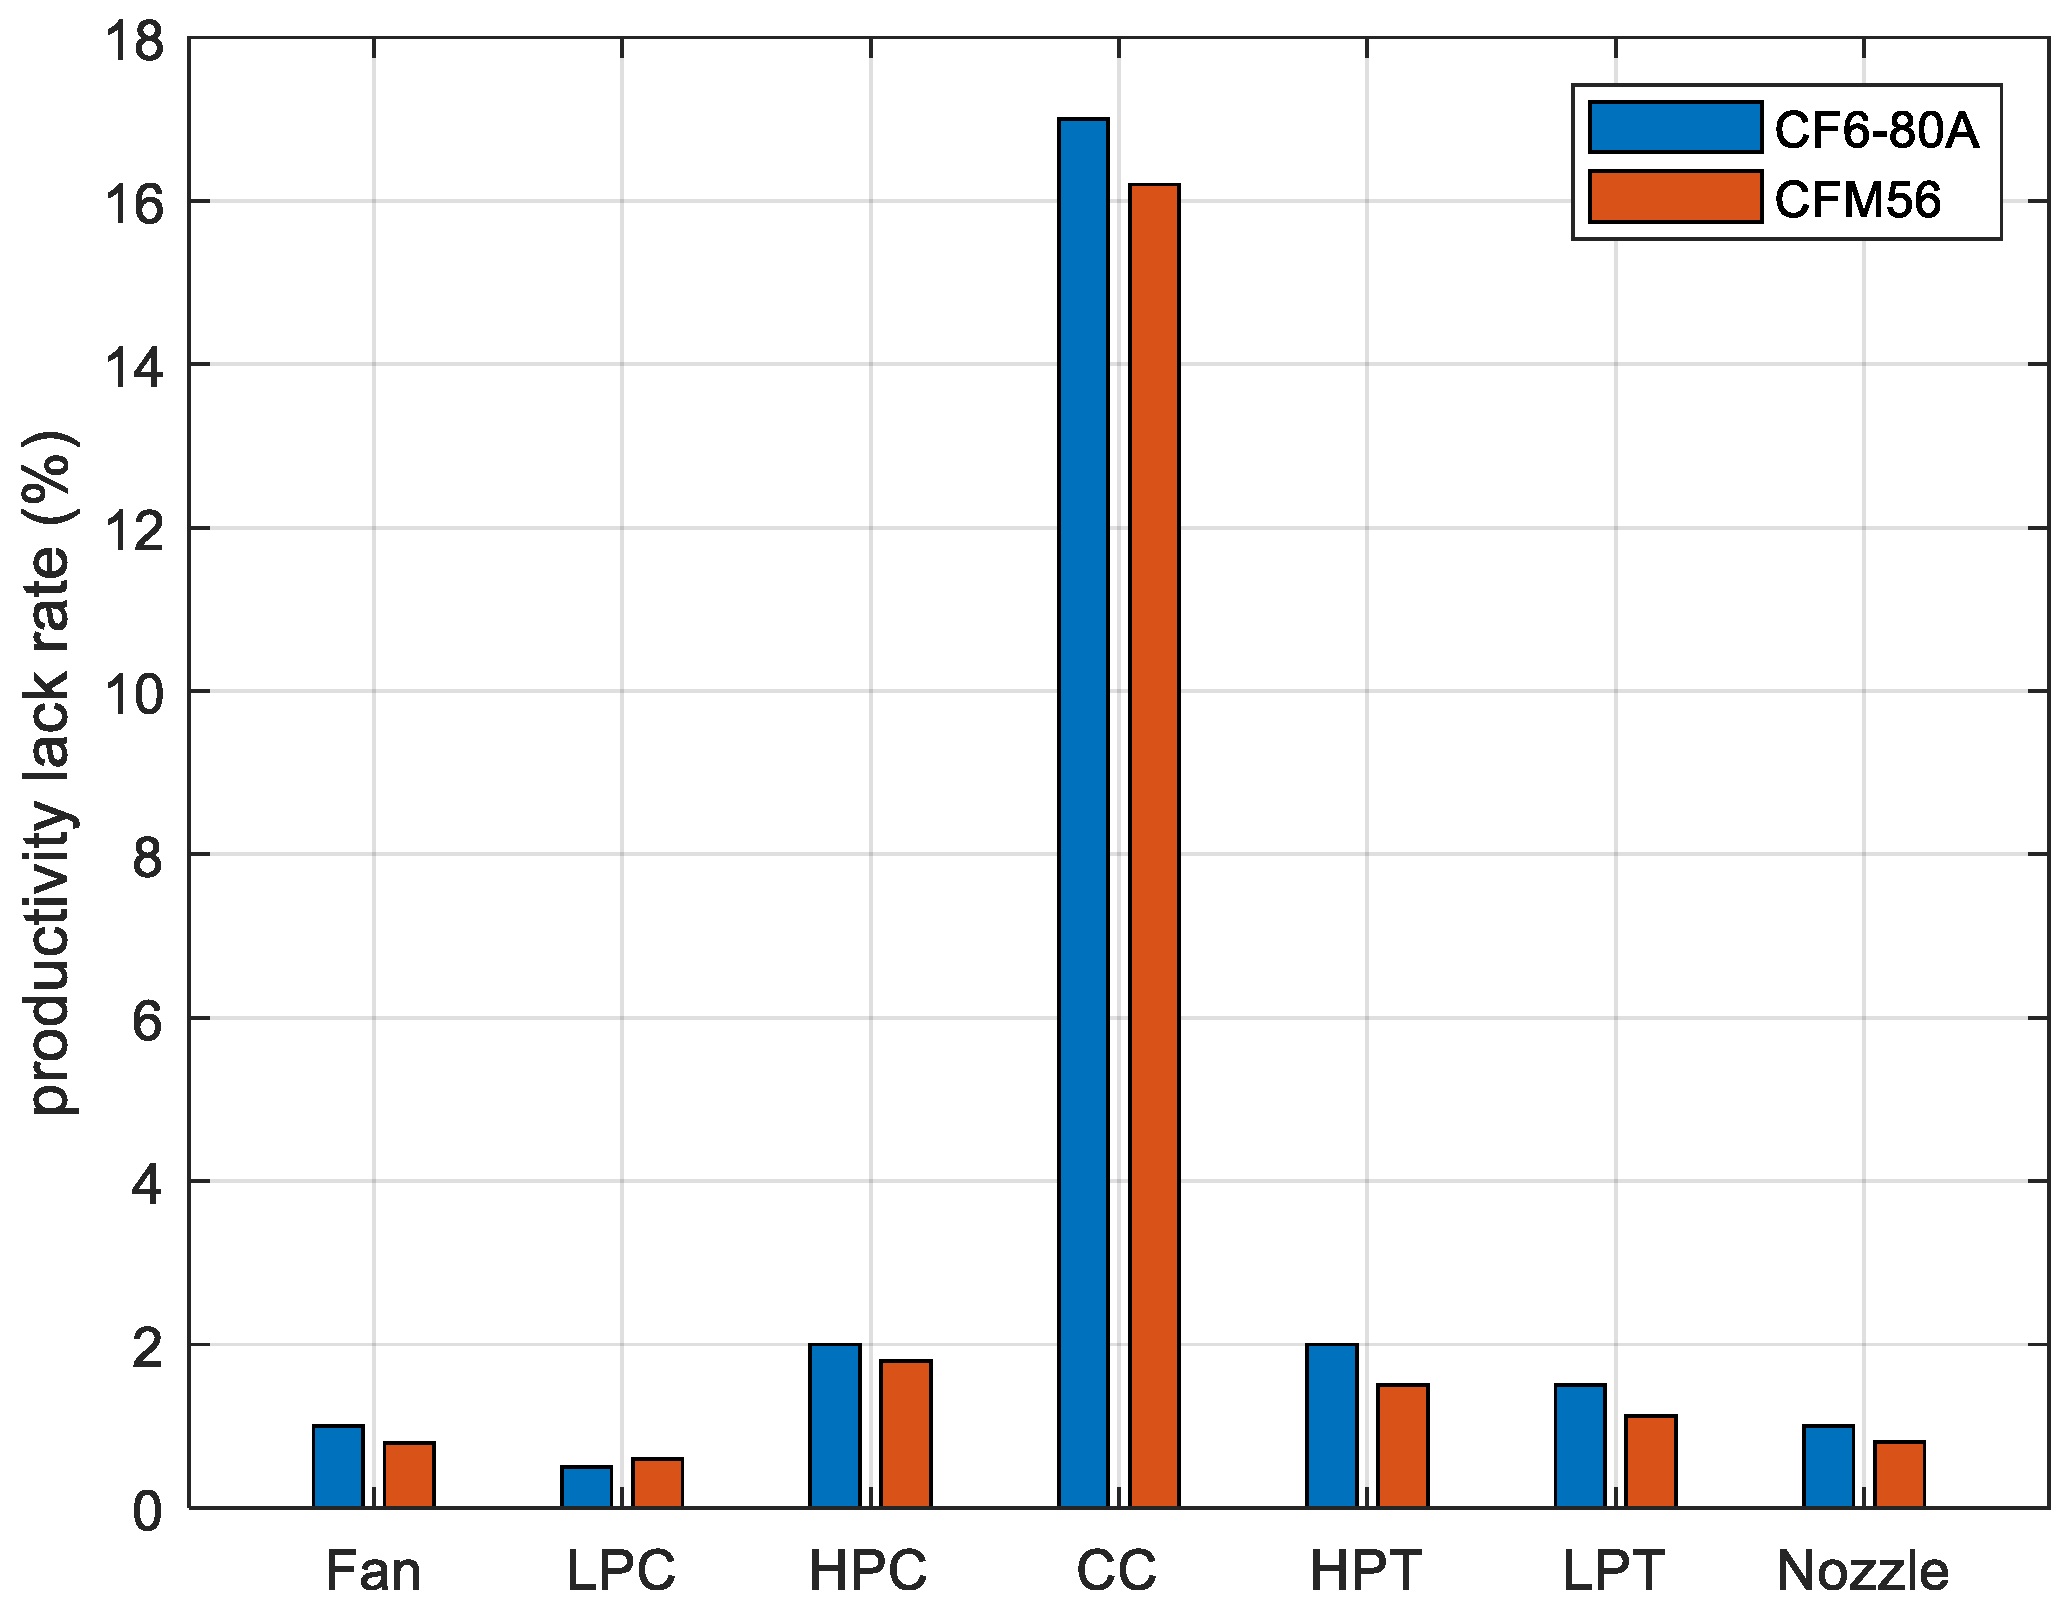
Figure 16.
Fuel and Material Quality Fuzzy Logic Surface Diagram.
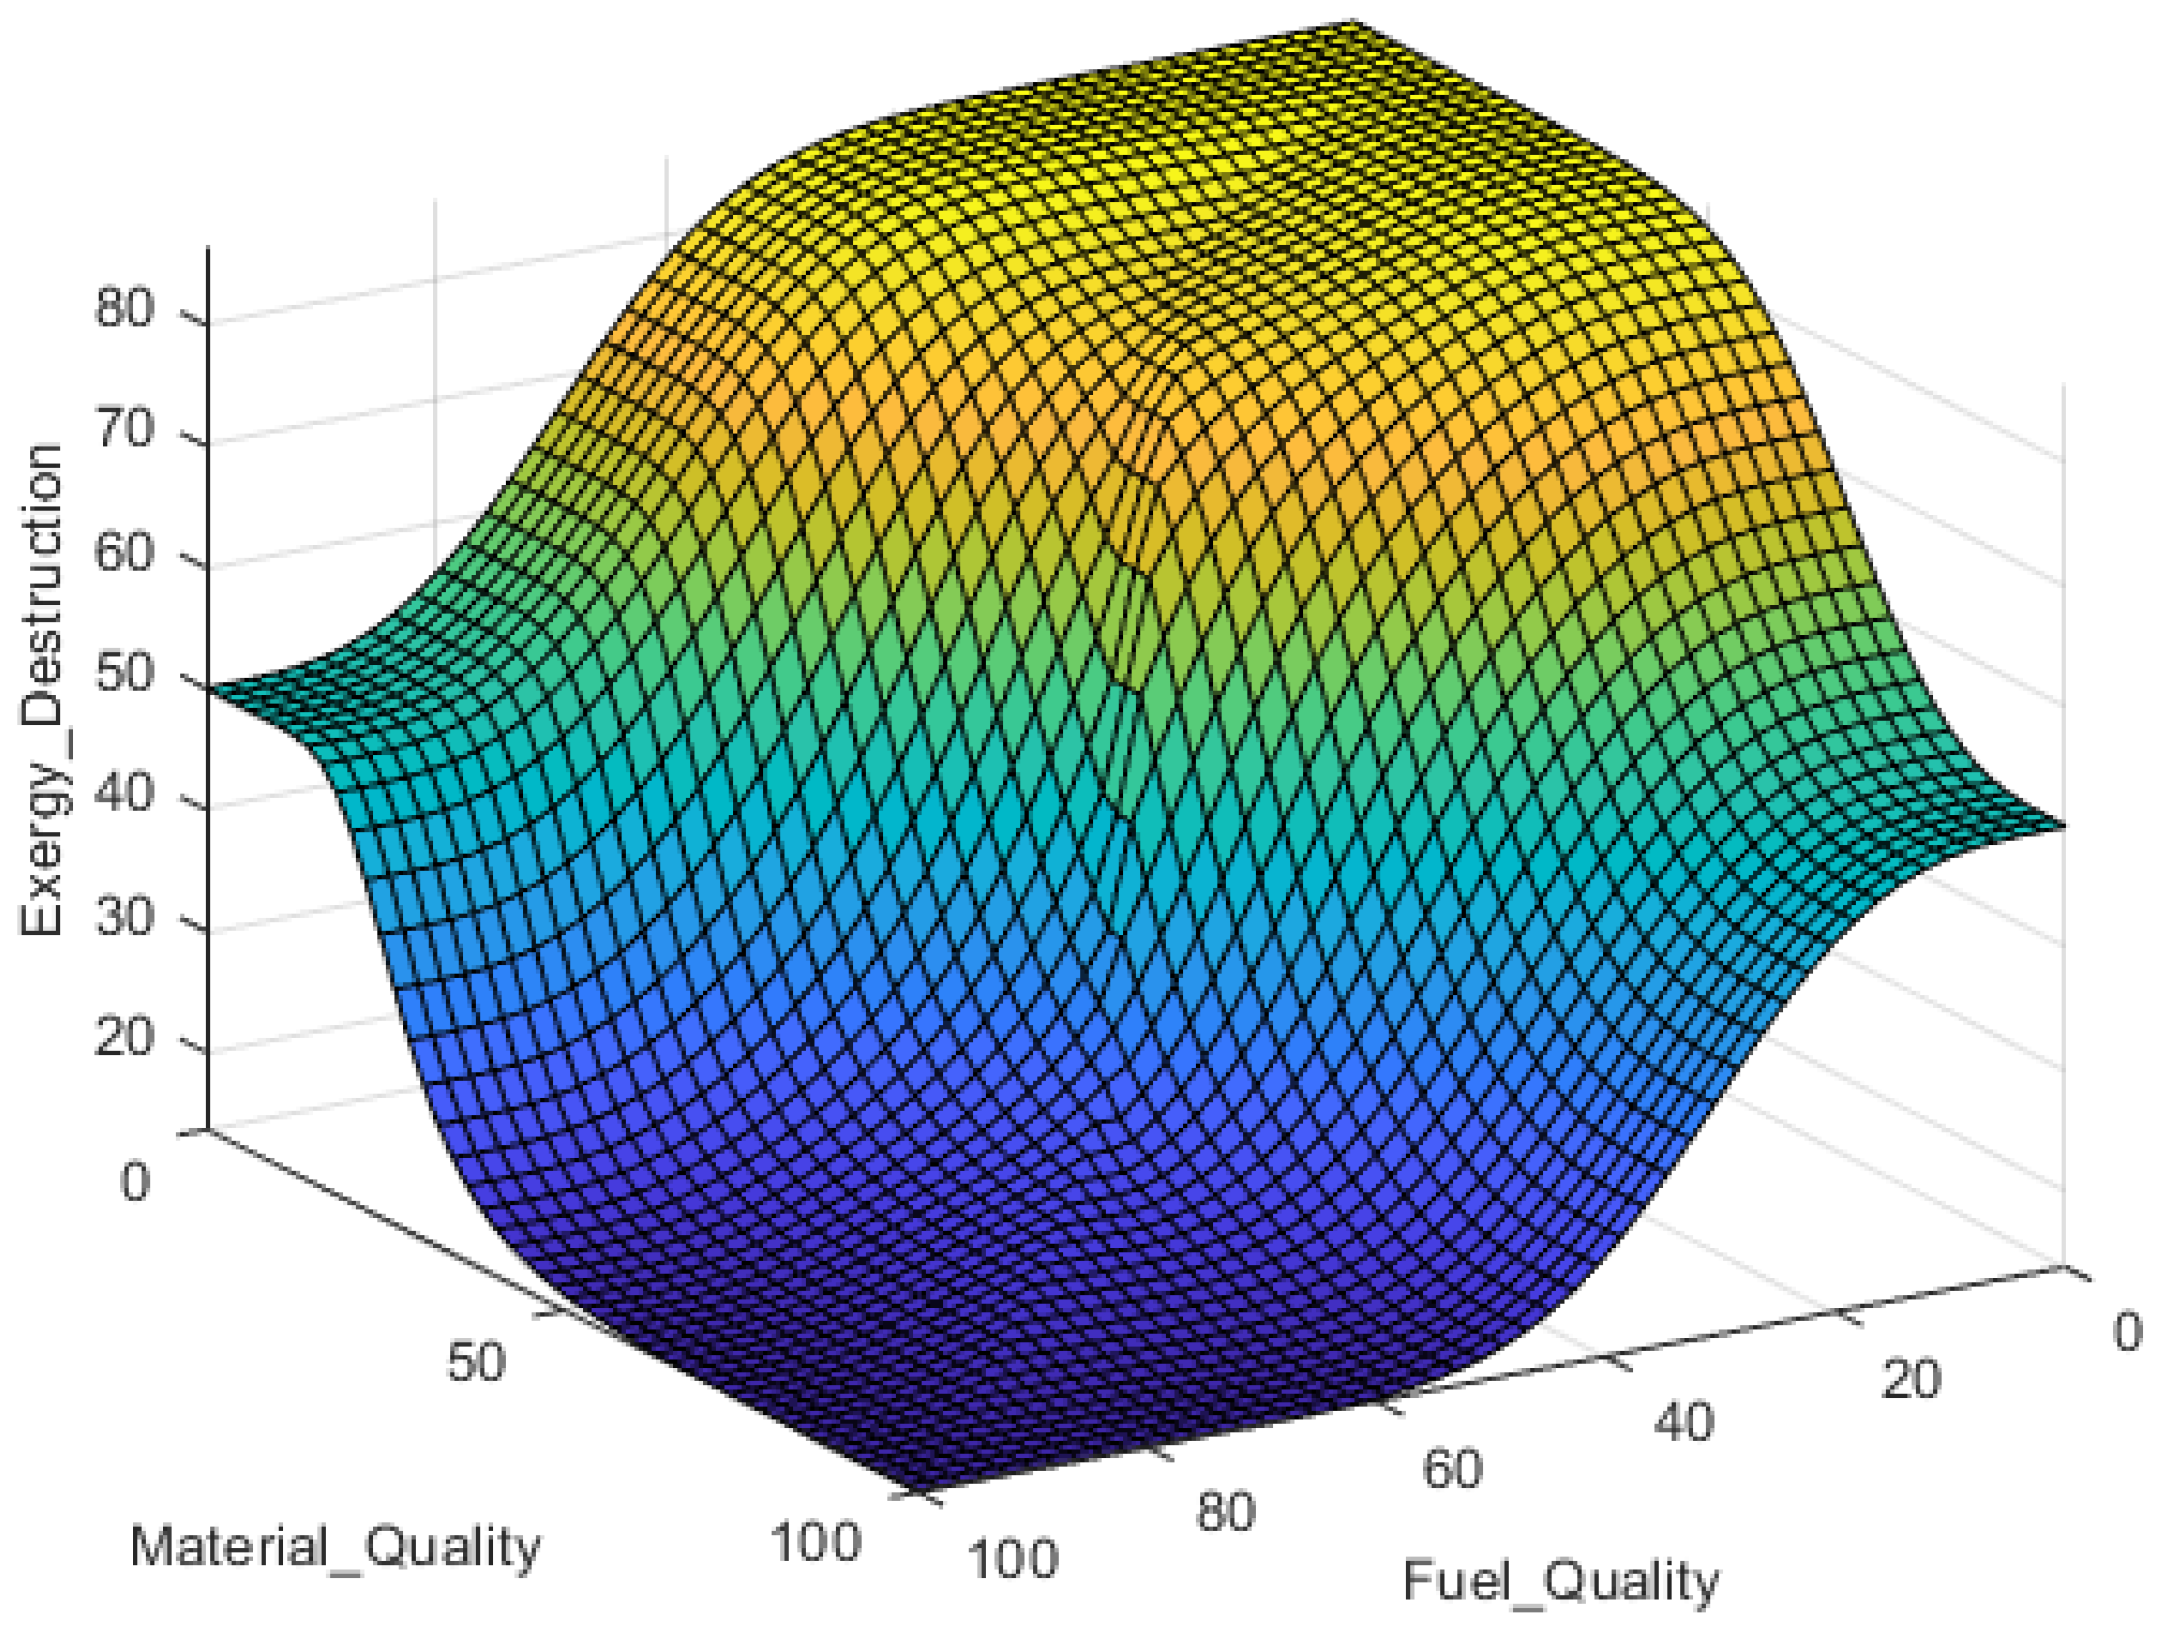
Figure 17.
Fuel Quality and Bypass Ratio Fuzzy logic Surface Diagram.
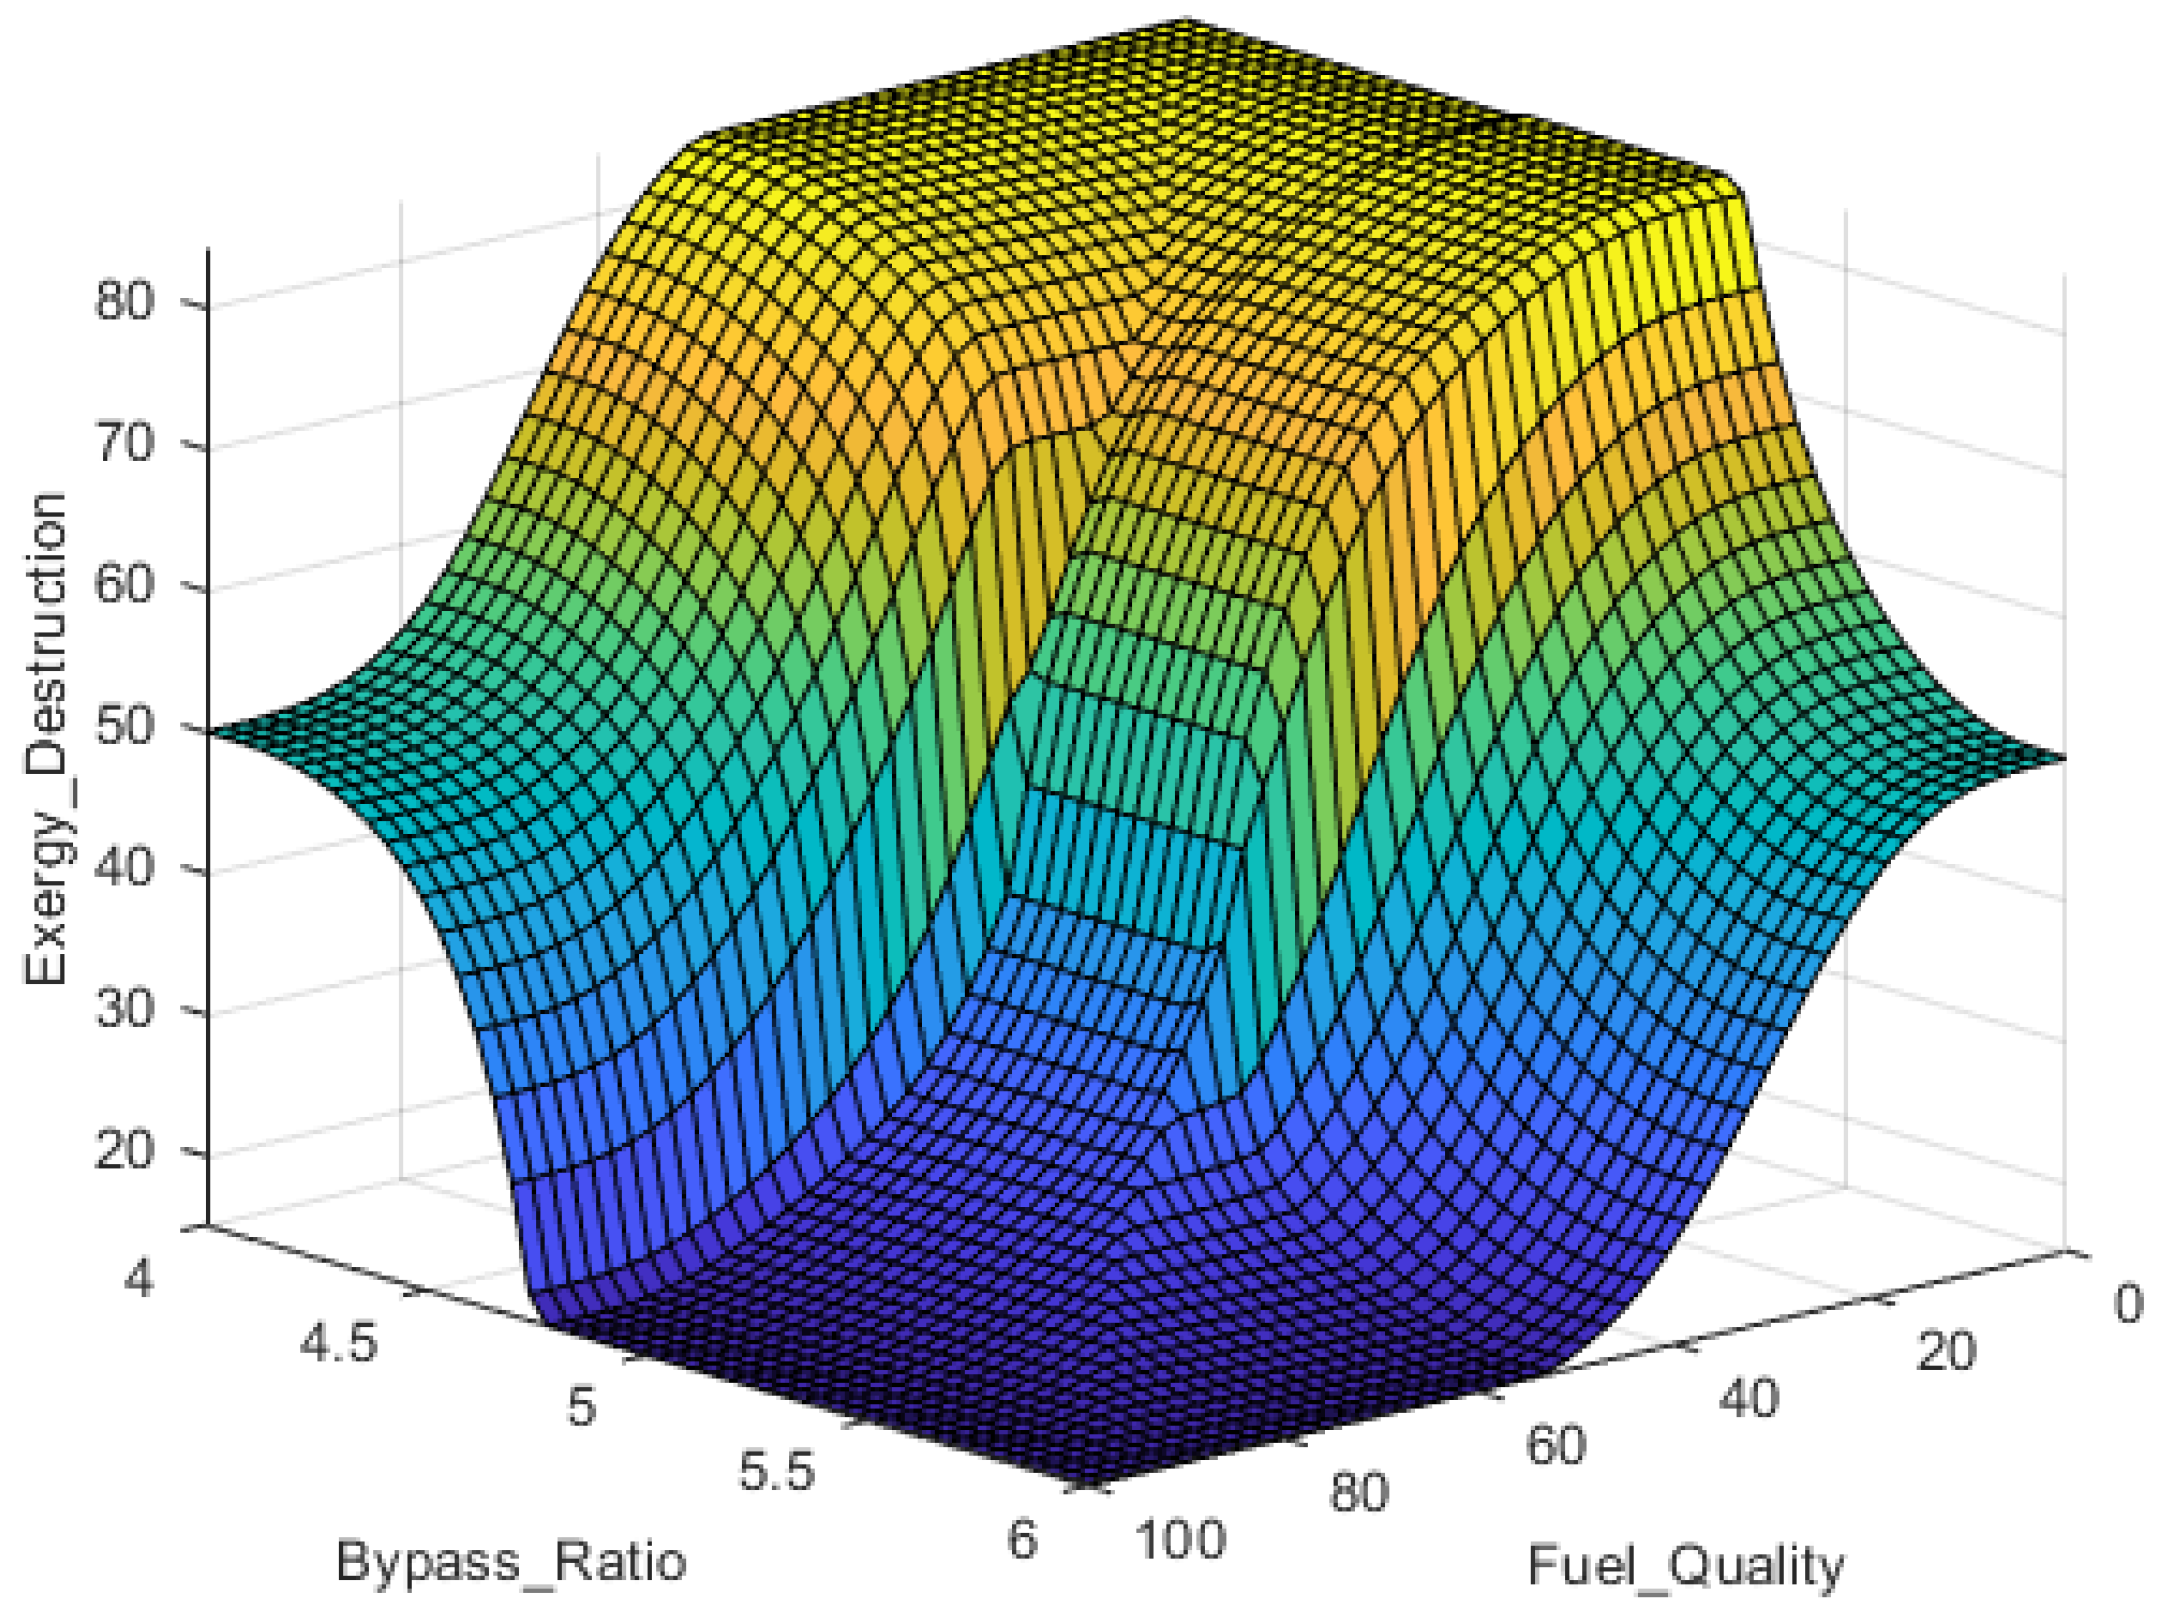
Figure 18.
Bypass Ratio and Material Quality Fuzzy logic Surface Diagram.
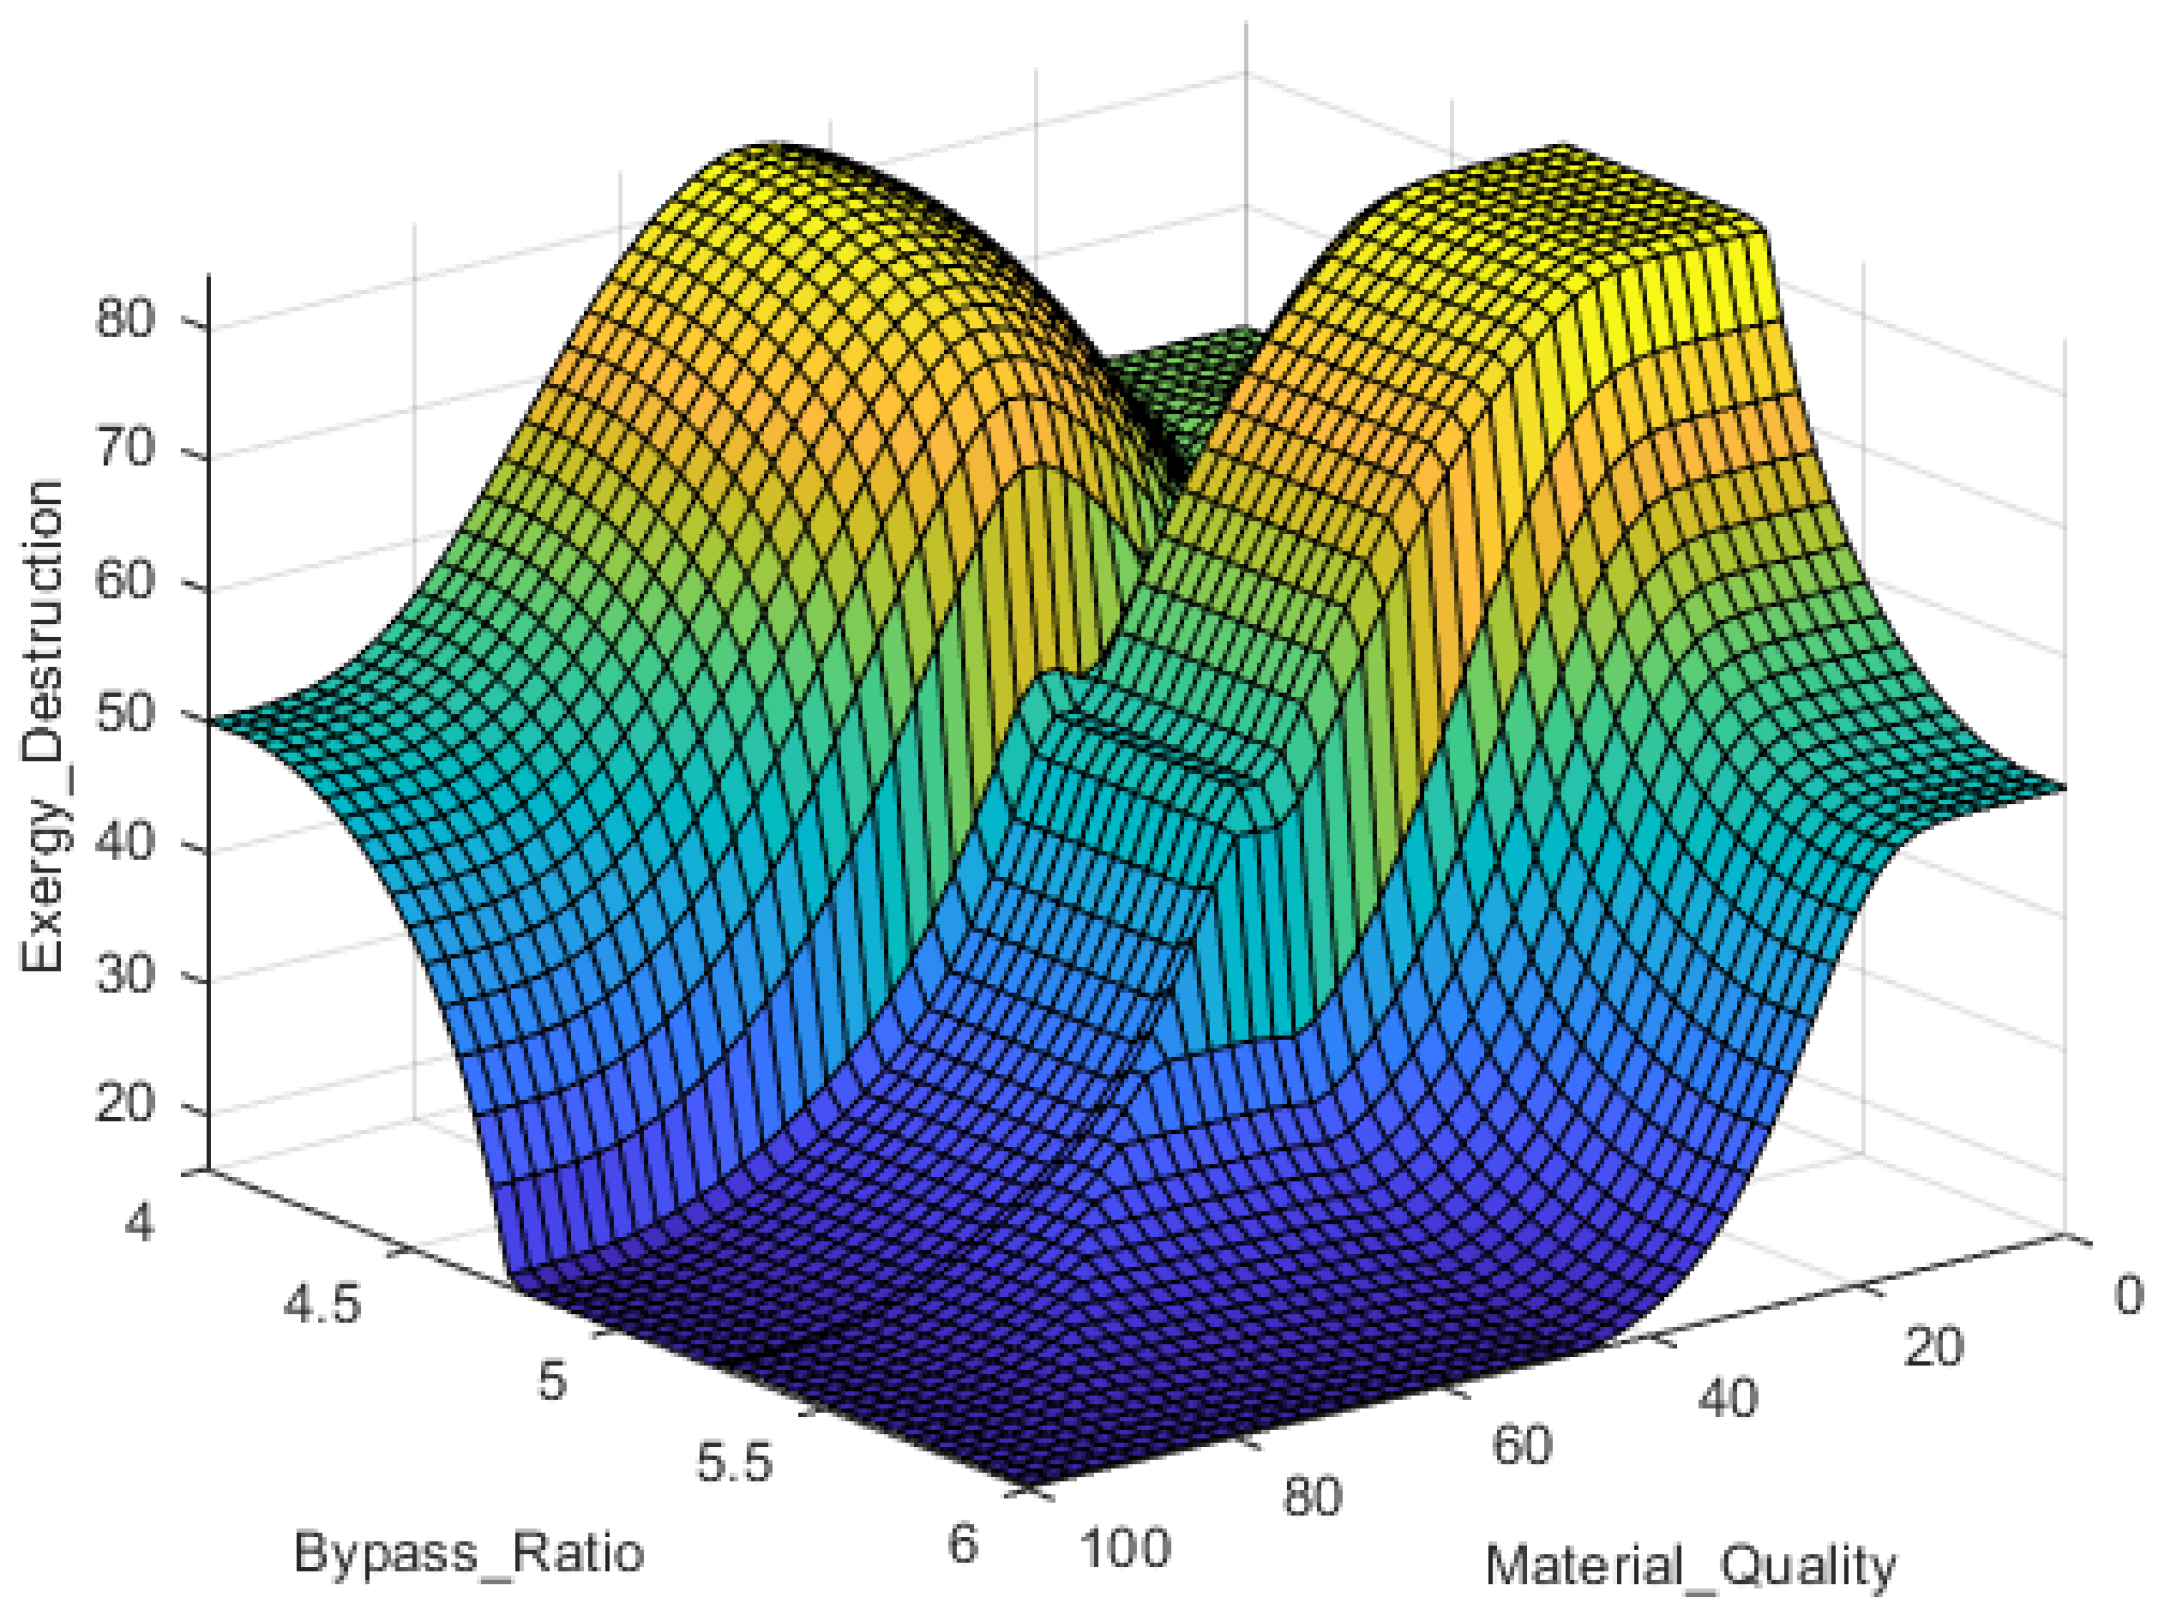
Figure 19.
Optimizers Results for Fuel Quality of the Enigne.
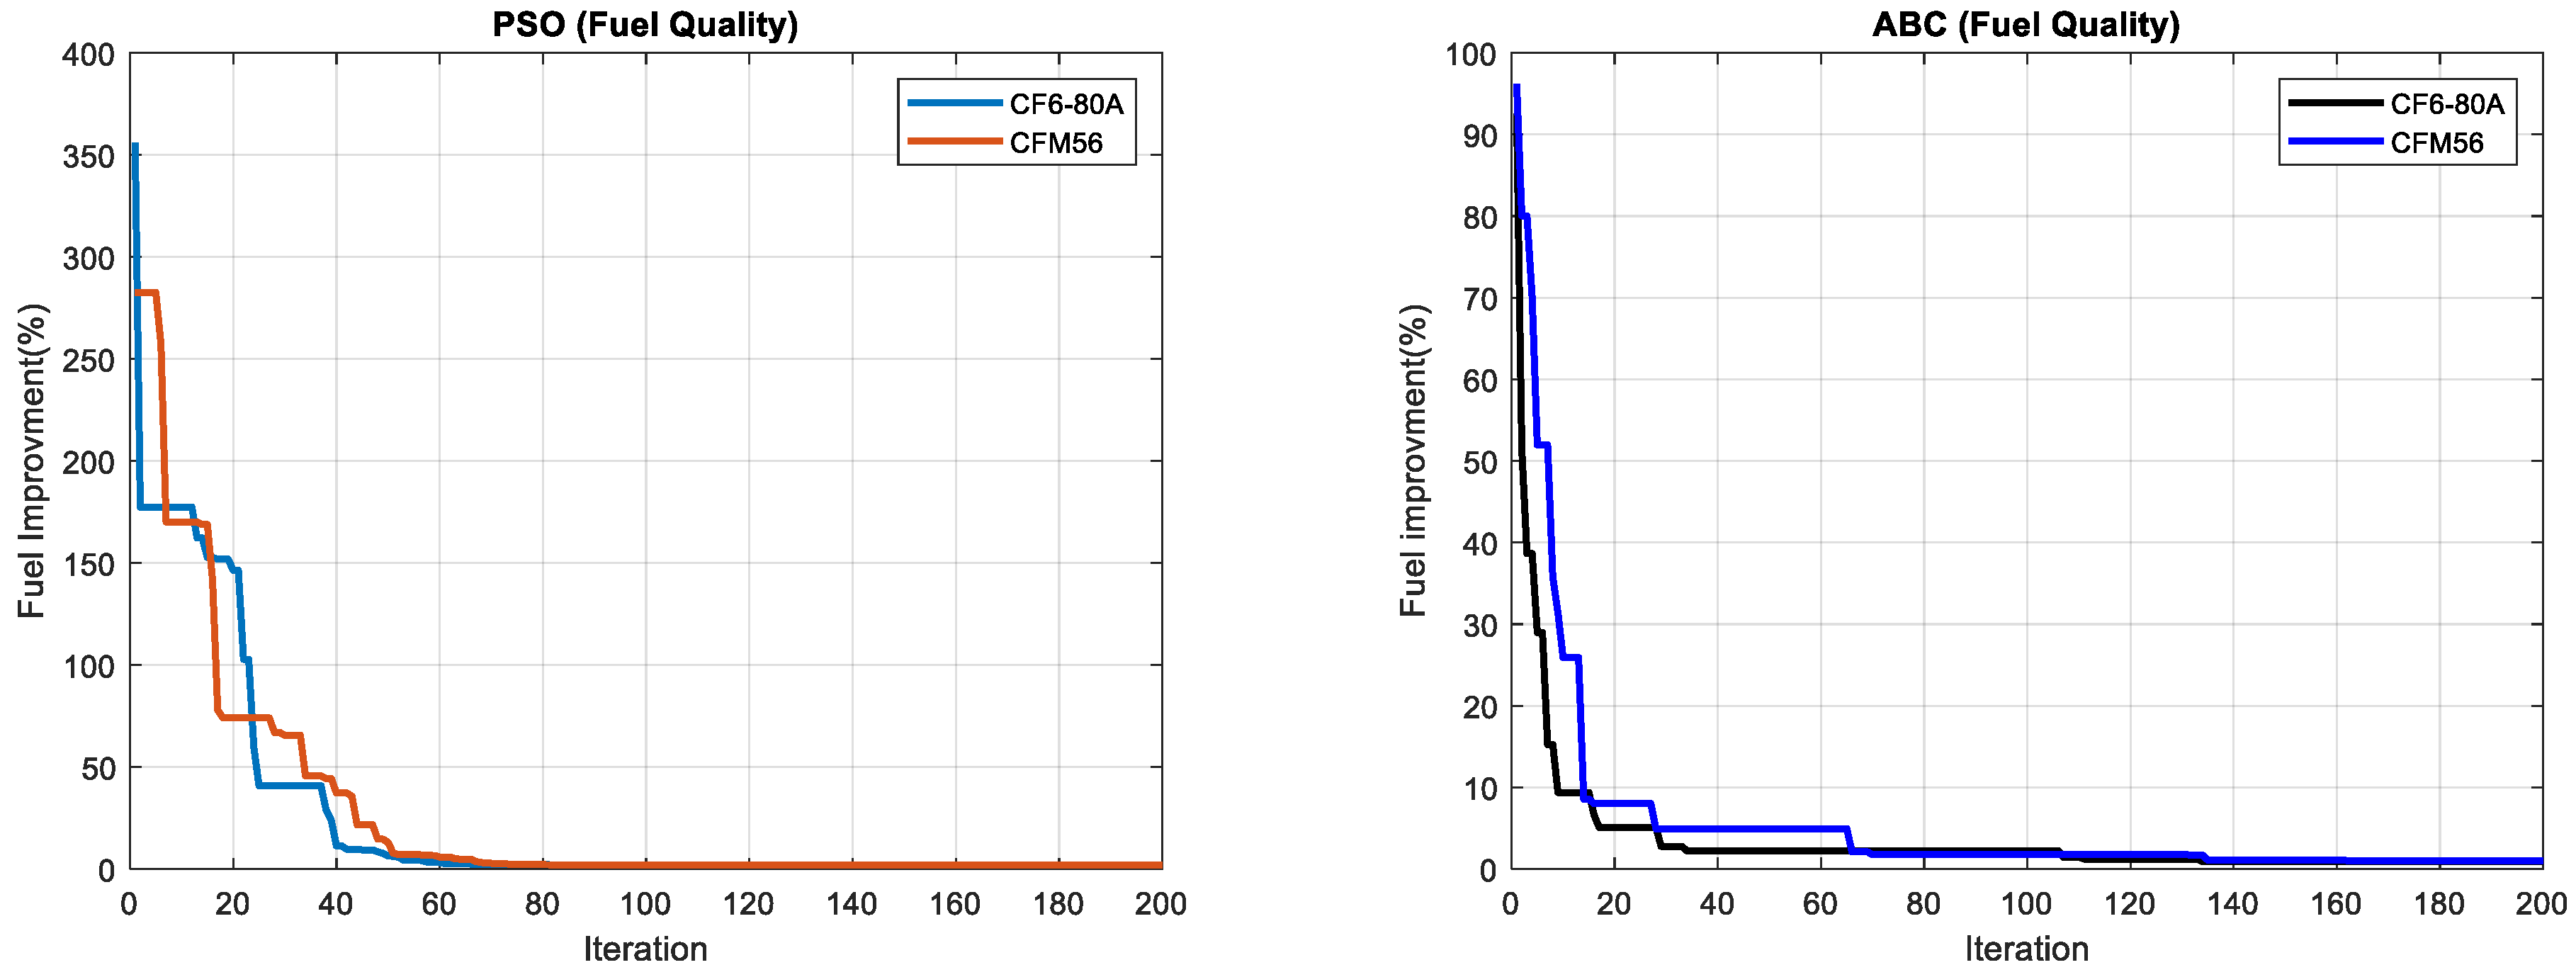
Table 1.
Common Turbofan Components.
| Abbreviation | Components name |
|---|---|
| Fan | Fan |
| LPC | Low pressure compressor |
| HPC | High pressure compressor |
| CC | Combustion Chamber |
| HPT | High pressure Turbine |
| LPT | Low pressure Turbine |
Table 2.
Technical Specifications of CF6-80A and CFM56.
| specifications | The values of each parameter | |
|---|---|---|
| CF6-80A | CFM56 | |
| dry thrust | 111.206 KN | 110 KN |
| Thrust in cruise | 51.500 KN | 38.12 KN |
| Specific dry fuel consumption | 8.40 g/KN. s | 5.43 g/KN. s |
| Specific cruise fuel consumption | 15.1767 g/KN. s | - |
| Mass flow rate at the inlet | 386.382(Kg/s) | 110.122(Kg/s) |
| Pressure ratio | 31.1 | 30.1 |
| bypass ratio | 6 | 6 |
| Specific heat of air | 1004.8 J/Kg. K | 1005 J/Kg. K |
| Specific heat of gas | 1156.9 J/Kg. K | 1150 J/Kg. K |
| Air-specific heat ratio (γc) | 1.4 | 1.4 |
| Gas specific heat ratio (γh) | 1.33 | 1.35 |
| Fan diameter | 2.19 (m) | 1.5 (m) |
| Engine length | 4.24 (m) | 4 (m) |
| Engine core diameter | 1.83 (m) | 7.40 (m) |
Table 3.
Numbering Information of Engine Components.
| each comp. number | Comp. names |
|---|---|
| 1 | Fan inlet |
| 2 | Engine core inlet |
| 3 | Low-pressure compressor inlet |
| 4 | Bypass inlet |
| 5 | Low-pressure compressor outlet |
| 6 | High-pressure compressor inlet |
| 7 | The middle space of the bypass |
| 8 | bypass outlet |
| 9 | High-pressure compressor outlet |
| 10 | Combustion chamber inlet |
| 11 | Combustion chamber outlet |
| 12 | High-pressure turbine inlet |
| 13 | High-pressure turbine outlet |
| 14 | Low-pressure turbine inlet |
| 15 | Low-pressure turbine outlet |
| 16 | Nozzle output |
Table 9.
Fuzzy logic rules.
| If is low and is low and is low then high exergy destruction is considered |
| If is low and is low and is medium then high exergy destruction is considered |
| If is low and is low and is high then medium exergy destruction is considered |
| If is medium and is low and is low then high exergy destruction is considered |
| If is high and is medium and is medium then medium exergy destruction is considered |
| If is medium and is medium and is medium then low exergy destruction is considered |
| If is high and is low and is low then medium exergy destruction is considered |
| If is high and is medium and is high then low exergy destruction is considered |
*BPR = Bypass Ratio; *FQ = Fuel Quality; *MQ = Material Quality.
Disclaimer/Publisher’s Note: The statements, opinions and data contained in all publications are solely those of the individual author(s) and contributor(s) and not of MDPI and/or the editor(s). MDPI and/or the editor(s) disclaim responsibility for any injury to people or property resulting from any ideas, methods, instructions or products referred to in the content. |
© 2024 by the authors. Licensee MDPI, Basel, Switzerland. This article is an open access article distributed under the terms and conditions of the Creative Commons Attribution (CC BY) license (http://creativecommons.org/licenses/by/4.0/).
Copyright: This open access article is published under a Creative Commons CC BY 4.0 license, which permit the free download, distribution, and reuse, provided that the author and preprint are cited in any reuse.


