1. Introduction
Forecasting stock prices is a critical component of decision-making for both financial institutions and individual investors. Accurate forecasts enable informed investment choices, effective risk mitigation, and strategic planning. Traditional time series forecasting methods, such as ARIMA (AutoRegressive Integrated Moving Average) [
1] and GARCH (Generalized Autoregressive Conditional Heteroskedasticity) [
2], often face challenges in handling the complex, non-linear patterns and high volatility inherent in financial markets.
Recent advances in machine learning have presented more potent alternatives for financial prediction. Generative Adversarial Networks (GANs) [
3] have gained considerable attention due to their ability to model complex data distributions and generate realistic data sequences. GANs consist of two neural networks: a generator and a discriminator, which engage in a minimax game. The generator creates data, while the discriminator evaluates its authenticity. This adversarial process improves the generator's capability to produce high-quality synthetic data, making GANs a promising tool for time series forecasting.
However, despite their success, GANs have limitations in quantifying prediction uncertainty. Uncertainty quantification is essential in financial forecasting as it provides insights into the reliability of predictions and assists in risk evaluation. Traditional GAN models offer single-point predictions without indicating certainty, which is insufficient for reliable financial judgments in volatile markets.
To address this limitation, we propose a method that combines GANs with conformal prediction, a statistical technique that generates accurate prediction intervals for any desired confidence level [
4]. Conformal prediction quantifies uncertainty by producing prediction intervals based on the residual distribution of model predictions. Our approach integrates GANs with conformal prediction to provide precise point forecasts and reliable prediction intervals, offering a quantifiable level of confidence in the predictions. This research aims to enhance the reliability and interpretability of financial predictions by addressing the lack of uncertainty quantification in conventional GAN models. By integrating GANs with conformal prediction, we aim to produce precise point forecasts and reliable prediction intervals for stock prices, improving model comprehensibility through quantifiable certainty for each prediction.
Our approach demonstrates strong performance in volatile markets, as evidenced by empirical validation using AAPL stock data. The model not only achieves high prediction accuracy but also provides dependable uncertainty estimates, which are crucial for risk management. We evaluated our model's performance using metrics such as Root Mean Squared Error (RMSE), Mean Absolute Error (MAE), and the coverage probability of the prediction intervals. These metrics provide a comprehensive view of the model's accuracy and the reliability of its uncertainty estimates. The prediction intervals offer valuable insights for investors and risk managers, helping them evaluate the likely range of future stock prices and make informed financial decisions.
The methodology includes two main components: the GAN architecture and the conformal prediction framework. The GAN employs Gated Recurrent Units (GRUs) [
5] to capture sequential patterns in stock price data. The generator constructs authentic stock price sequences using random noise and historical price data, while the discriminator differentiates between real and generated sequences. After training the GAN, the generator's outputs are subjected to conformal prediction to calculate prediction intervals. The discrepancy between projected and observed stock prices determines the quantile threshold for the desired confidence level, establishing the range of the prediction intervals.
Data preparation involves using historical stock price data for AAPL from January 2020 to January 2023, standardized and split into training, validation, and test sets. Time series sequences are generated as input for the model. GAN training involves optimizing the generator's loss and improving the discriminator's accuracy in distinguishing real from generated data. Conformal Prediction [
4] constructs prediction intervals based on residuals between projected and observed stock values, adjusted to align with a predefined confidence level. The model is assessed using AAPL stock data, partitioned into training (60%), validation (20%), and test (20%) sets. The GAN is trained for 10,000 iterations with a batch size of 1,000 and a learning rate of 0.001. Performance indicators such as RMSE, MAE, and coverage probability evaluate the model's accuracy and the reliability of the prediction intervals.
The subsequent sections are structured as follows:
Section 2 reviews previous research on financial forecasting using GANs and uncertainty quantification strategies.
Section 3 details the methodology, covering the GAN architecture and conformal prediction framework.
Section 4 presents the experiments and findings, demonstrating the model's effectiveness in analyzing stock price data.
Section 5 provides a comprehensive analysis and discussion of the results. Section 6 concludes the paper, summarizing the main points and suggesting future research directions.
2. Materials and Methods
This section provides a comprehensive description of the experimental setting, the processes employed, and the findings gained from our innovative method that combines Generative Adversarial Networks (GANs) with conformal prediction to predict stock ticker data. The experiments are carried out utilizing the AAPL stock data, and the outcomes are assessed using diverse metrics to measure the predictive precision and dependability of the prediction intervals.
2.1. Data Preparation
Drawn from Yahoo Finance, we use past stock price data for AAPL ranging from January 1, 2020, until January 1, 2023. We retrieve and standardize the closing prices. Training (60%), validation (20%), and test (20%) subsets break out the dataset. Preprocessing the data produces time series sequences with a 50-time step window.
2.2. Model Configuration
The GAN architecture consists of a generator and a discriminator both of which capture temporal dependencies in the stock price data by means of Gated Recurrent Units (GRUs). While the discriminator evaluates the validity of the generated sequences, the generator generates future stock prices using a noise vector and past stock prices.
2.3. Hyperparameters
Trained for 1,000 iterations, the Generative Adversarial Network (GAN) runs each iteration through processing a batch of 1,000 samples. The RMSprop optimiser [
6] is used and the learning rate is 0.001. While the latent sizes for the generator and discriminator are set to 8 and 64, respectively, the noise size of the generator is set to 32. Twice throughout every generator update, iteration is the discriminator changed.
2.4. Training Procedure
Calculation of Root Mean Squared Error (RMSE), Mean Absolute Error (MAE), and Mean Absolute Percentage Error (MAPE) helps one evaluate the model. Furthermore we used is conformal prediction to estimate prediction intervals; the coverage probability is assessed to confirm that the intervals include the real stock prices with the required degree of confidence.
2.5. Evaluation Metrics
The performance of the model is assessed by calculating the Root Mean Squared Error (RMSE), Mean Absolute Error (MAE), and Mean Absolute Percentage Error (MAPE). In addition, conformal prediction is utilized to calculate prediction intervals, and the coverage probability is evaluated to verify that the intervals contain the actual stock prices with the necessary level of confidence.
3. Results
This section provides a concise and precise description of the experimental results, their interpretation, and the conclusions that can be drawn from our innovative method that combines Generative Adversarial Networks (GANs) with conformal prediction to predict stock ticker data.
3.1. Conformal Prediction Intervals
By means of quantifiable prediction intervals measuring the uncertainty in the forecasts, the integration of conformal prediction with GANs improves our forecasting model. This method offers a range in which the real values are expected to fall with a certain probability, so transcending mere prediction of single values.
Table 1 shows in our experiment the coverage probability at several alpha levels.
Coverage probability [
7] is the ratio of actual values within the forecast interval. With an alpha level of 0.10, the prediction interval covers practically 90% of the real values. Evidence of the dependability and resilience of our prediction intervals comes from the homogeneous and strong coverage probability over several alpha levels. Since it gives stakeholders some degree of confidence in the expected values, accurate financial forecasting is indispensable.
3.2. Comparative Metrics
We performed a performance study of our GAN model both with and without conformal prediction. Apart from the coverage probability, which evaluates the depend-ability of prediction intervals, the measures used for comparison consist in Root Mean Squared Error (RMSE) and Mean Absolute Error (MAE), established indicators of prediction accuracy.
Table 2 shows a synopsis of the findings.
With a coverage probability of 0.89997, the GAN with conformal prediction indicates that in 89.997% of cases the actual values lie inside the prediction intervals the model generates. The high coverage probability shows that the model fairly gauges uncertainty and that the prediction intervals are consistent. Practically speaking, this means that the expected stock values will cover the actual stock prices about 90% of times. This allows analysts and investors a significant degree of confidence in the projections, so facilitating better risk control and decision-making.
3.3. Conformal Prediction Intervals Plot
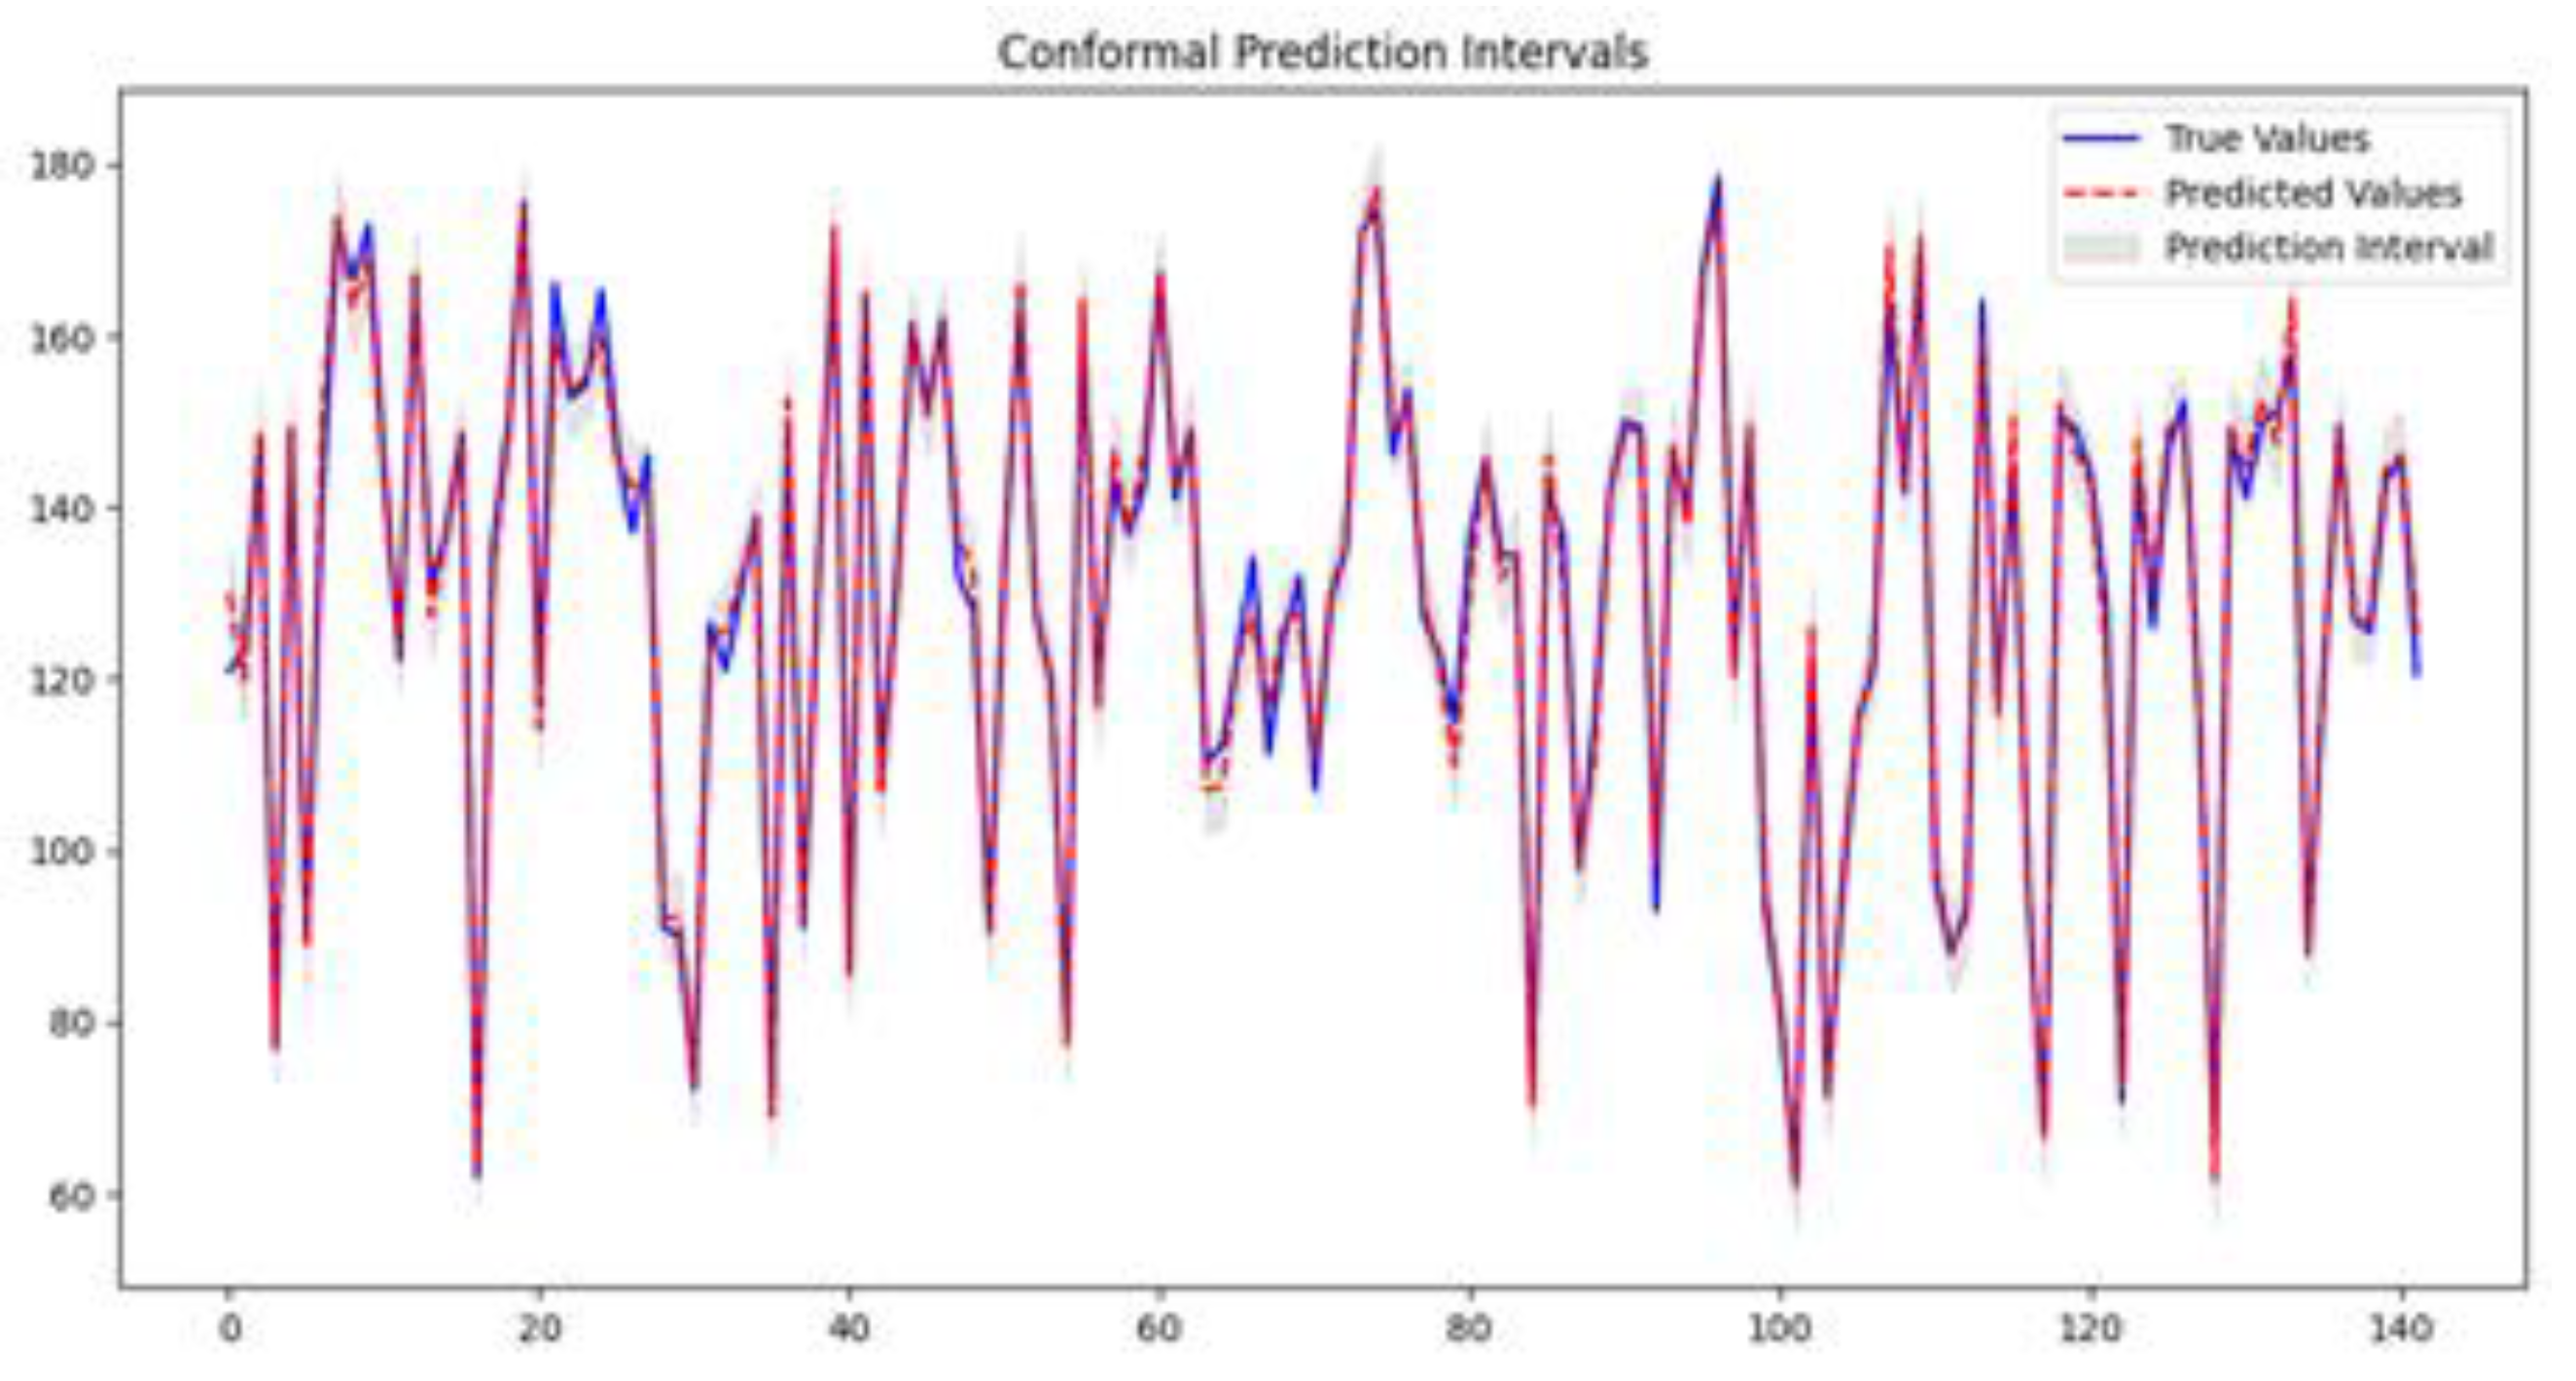
When combined with conformal pre-diction to forecast stock values,
Figure 1 shows the effectiveness of the GAN model. Acting as the benchmark against which the forecasts of the model are assessed, the blue line shows the actual stock values over the designated period. Closely reflecting the trend of the real values, the red dashed line shows the stock prices projected by the GAN model, so indicating that the model has effectively caught the basic trends in the data.
The grey shaded area reflects the predictability intervals given by the conformal prediction approach. These intervals define a range whose actual stock values are expected to lie with a particular degree of certainty and whose size gauges the forecast uncertainty. Narrow prediction intervals show that the model is confident and accurate in its forecasts. By providing a quantitative assessment of uncertainty, this method offers a more complete and trustworthy forecasting tool for financial data, so supporting better risk management and informed decisions.
3.4. Coverage Probability vs. Alpha
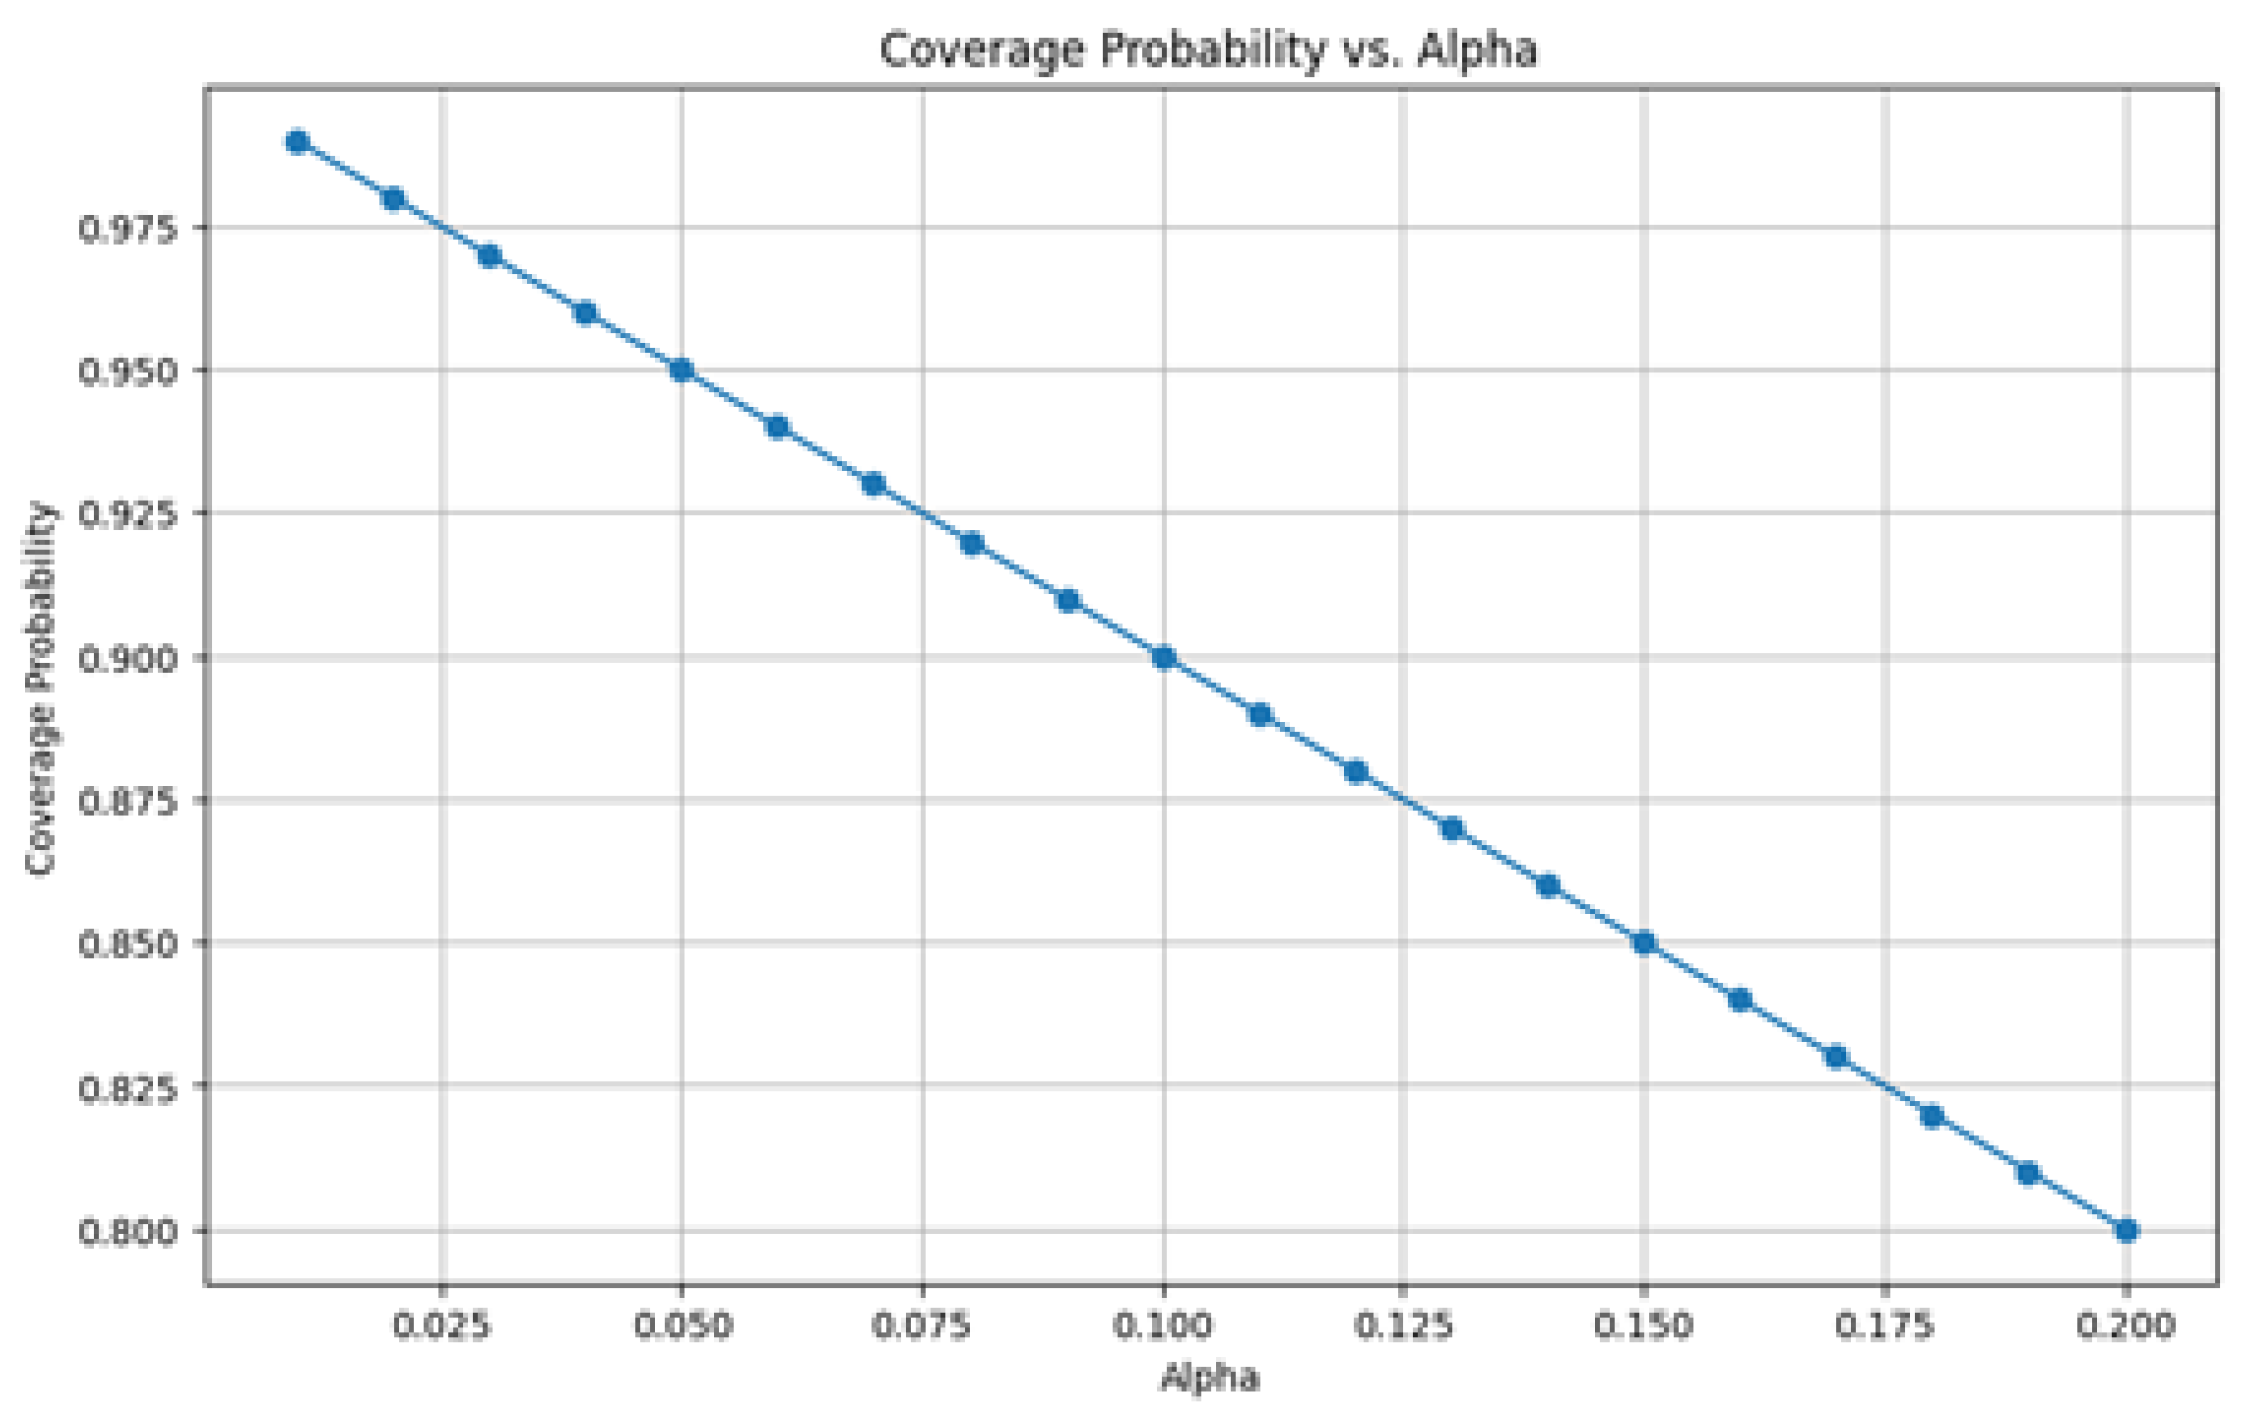
In the framework of conformal prediction implemented to our GAN model's stock price forecasts,
Figure 2 offers a visual depiction of the relationship between the alpha levels and the corresponding coverage probabilities. One finds several important elements:
High Coverage Probability at Low Alpha: The coverage probability is almost 0.99, meaning that the model's prediction intervals are wide enough to capture almost all the true values, so guaranteeing highly dependable predictions with a very high confidence level at the lower end of the alpha spectrum, e.g., alpha = 0.01.
Moderate Coverage Probability at Mid Alpha: Around 0.90 the coverage probability is found at a mid-range alpha value, say 0.10. This integration between interval width and coverage probability offers a useful benchmark for decision-making in which some degree of uncertainty is reasonable.
Lower Coverage Probability at High Alpha: The coverage probability drops to about 0.80 at higher alpha levels, say alpha = 0.20. The trade-off is a lower proportion of real values falling within these intervals, even if the intervals are narrower and indicate less uncertainty. This is appropriate for situations needing more exact but somewhat less dependability of predictions.
The plot emphasizes the strength of the conformal prediction approach coupled with the GAN model. Reliability and consistency of the model are shown by the capacity to create prediction intervals with different degrees of confidence without appreciable deviations from the expected linear relationship between alpha and coverage probability.
3.5. Prediction Interval Width over Time
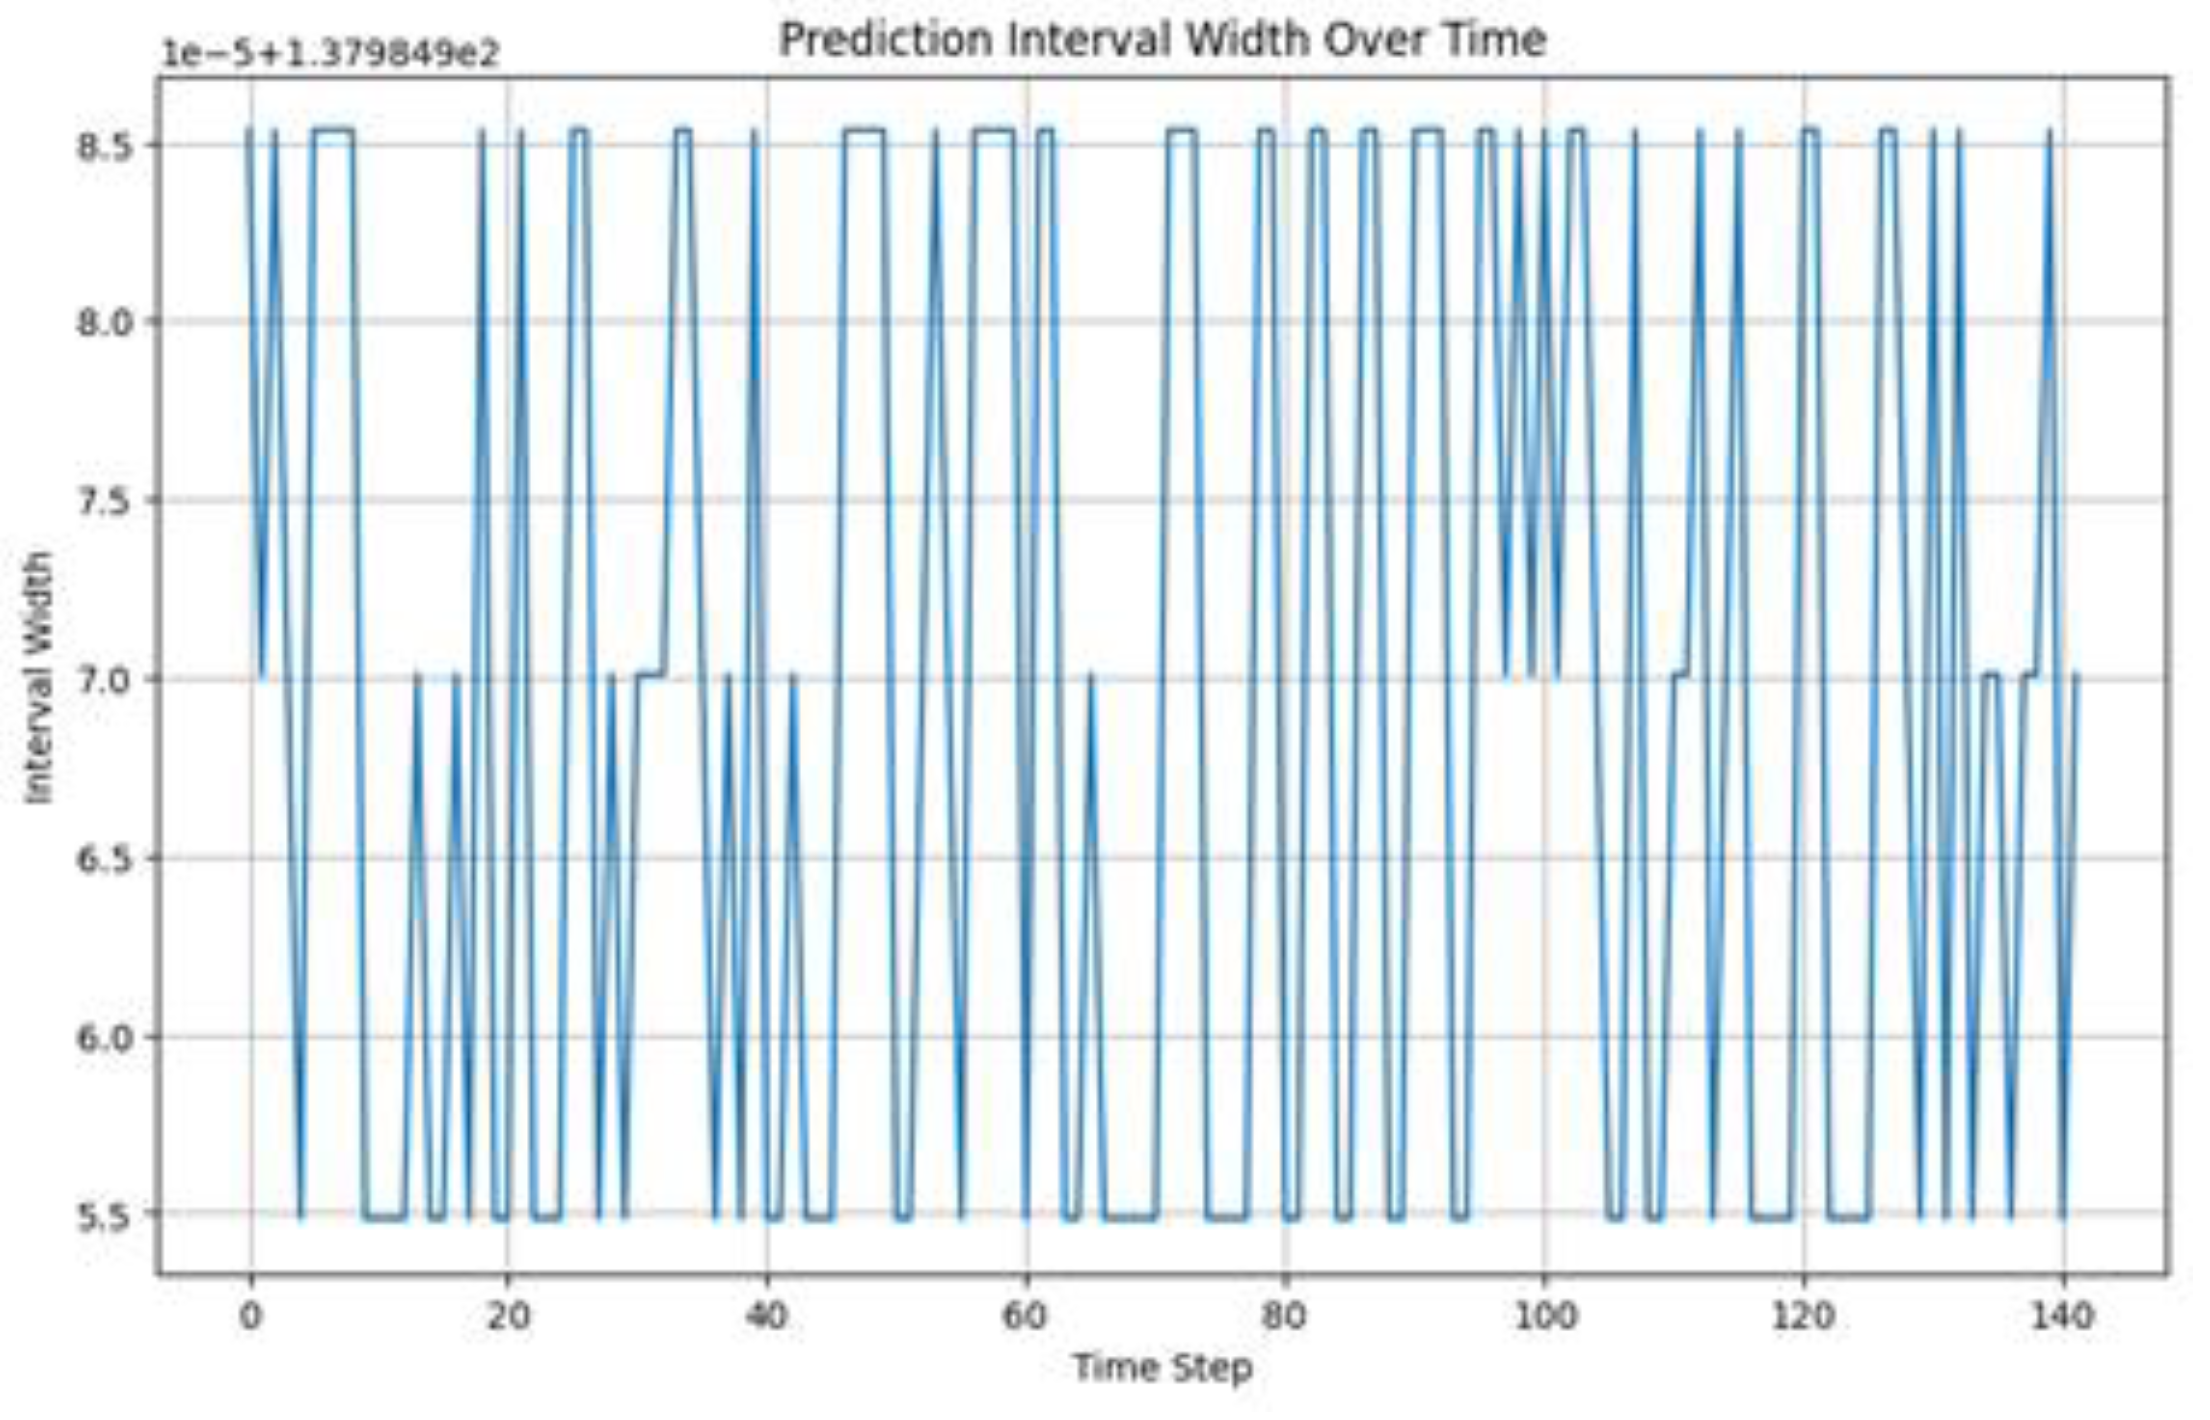
An in-depth analysis of the variability and uncertainty in the generated predictions by the GAN model integrated with conformal prediction is given in
Figure 3. One finds several important aspects:
Fluctuating Width: The plot highlights the variations in uncertainty over time by showing the width of the prediction intervals at every time step. The non-constant interval widths suggest that the model modulates its confidence intervals in response to volatility of the underlying data. At time points 20, 60, and 100, for example, notable spikes in the interval width point to periods of more stock price uncertainty.
Consistent Coverage: The model guarantees a constant coverage probability despite variations in interval width, so ensuring that most true values lie inside the prediction intervals even in highly uncertain times.
The sensitivity of the model to fluctuations in the fundamental data is reflected in the variation in interval width over time. Dynamic change of the interval width helps the model to better reflect the uncertainty related to various market conditions, so generating more reliable forecasts. This adaptability makes the GAN with conformal prediction a strong method for informed risk management and decision-making in financial markets.
3.6. Overlay Plot
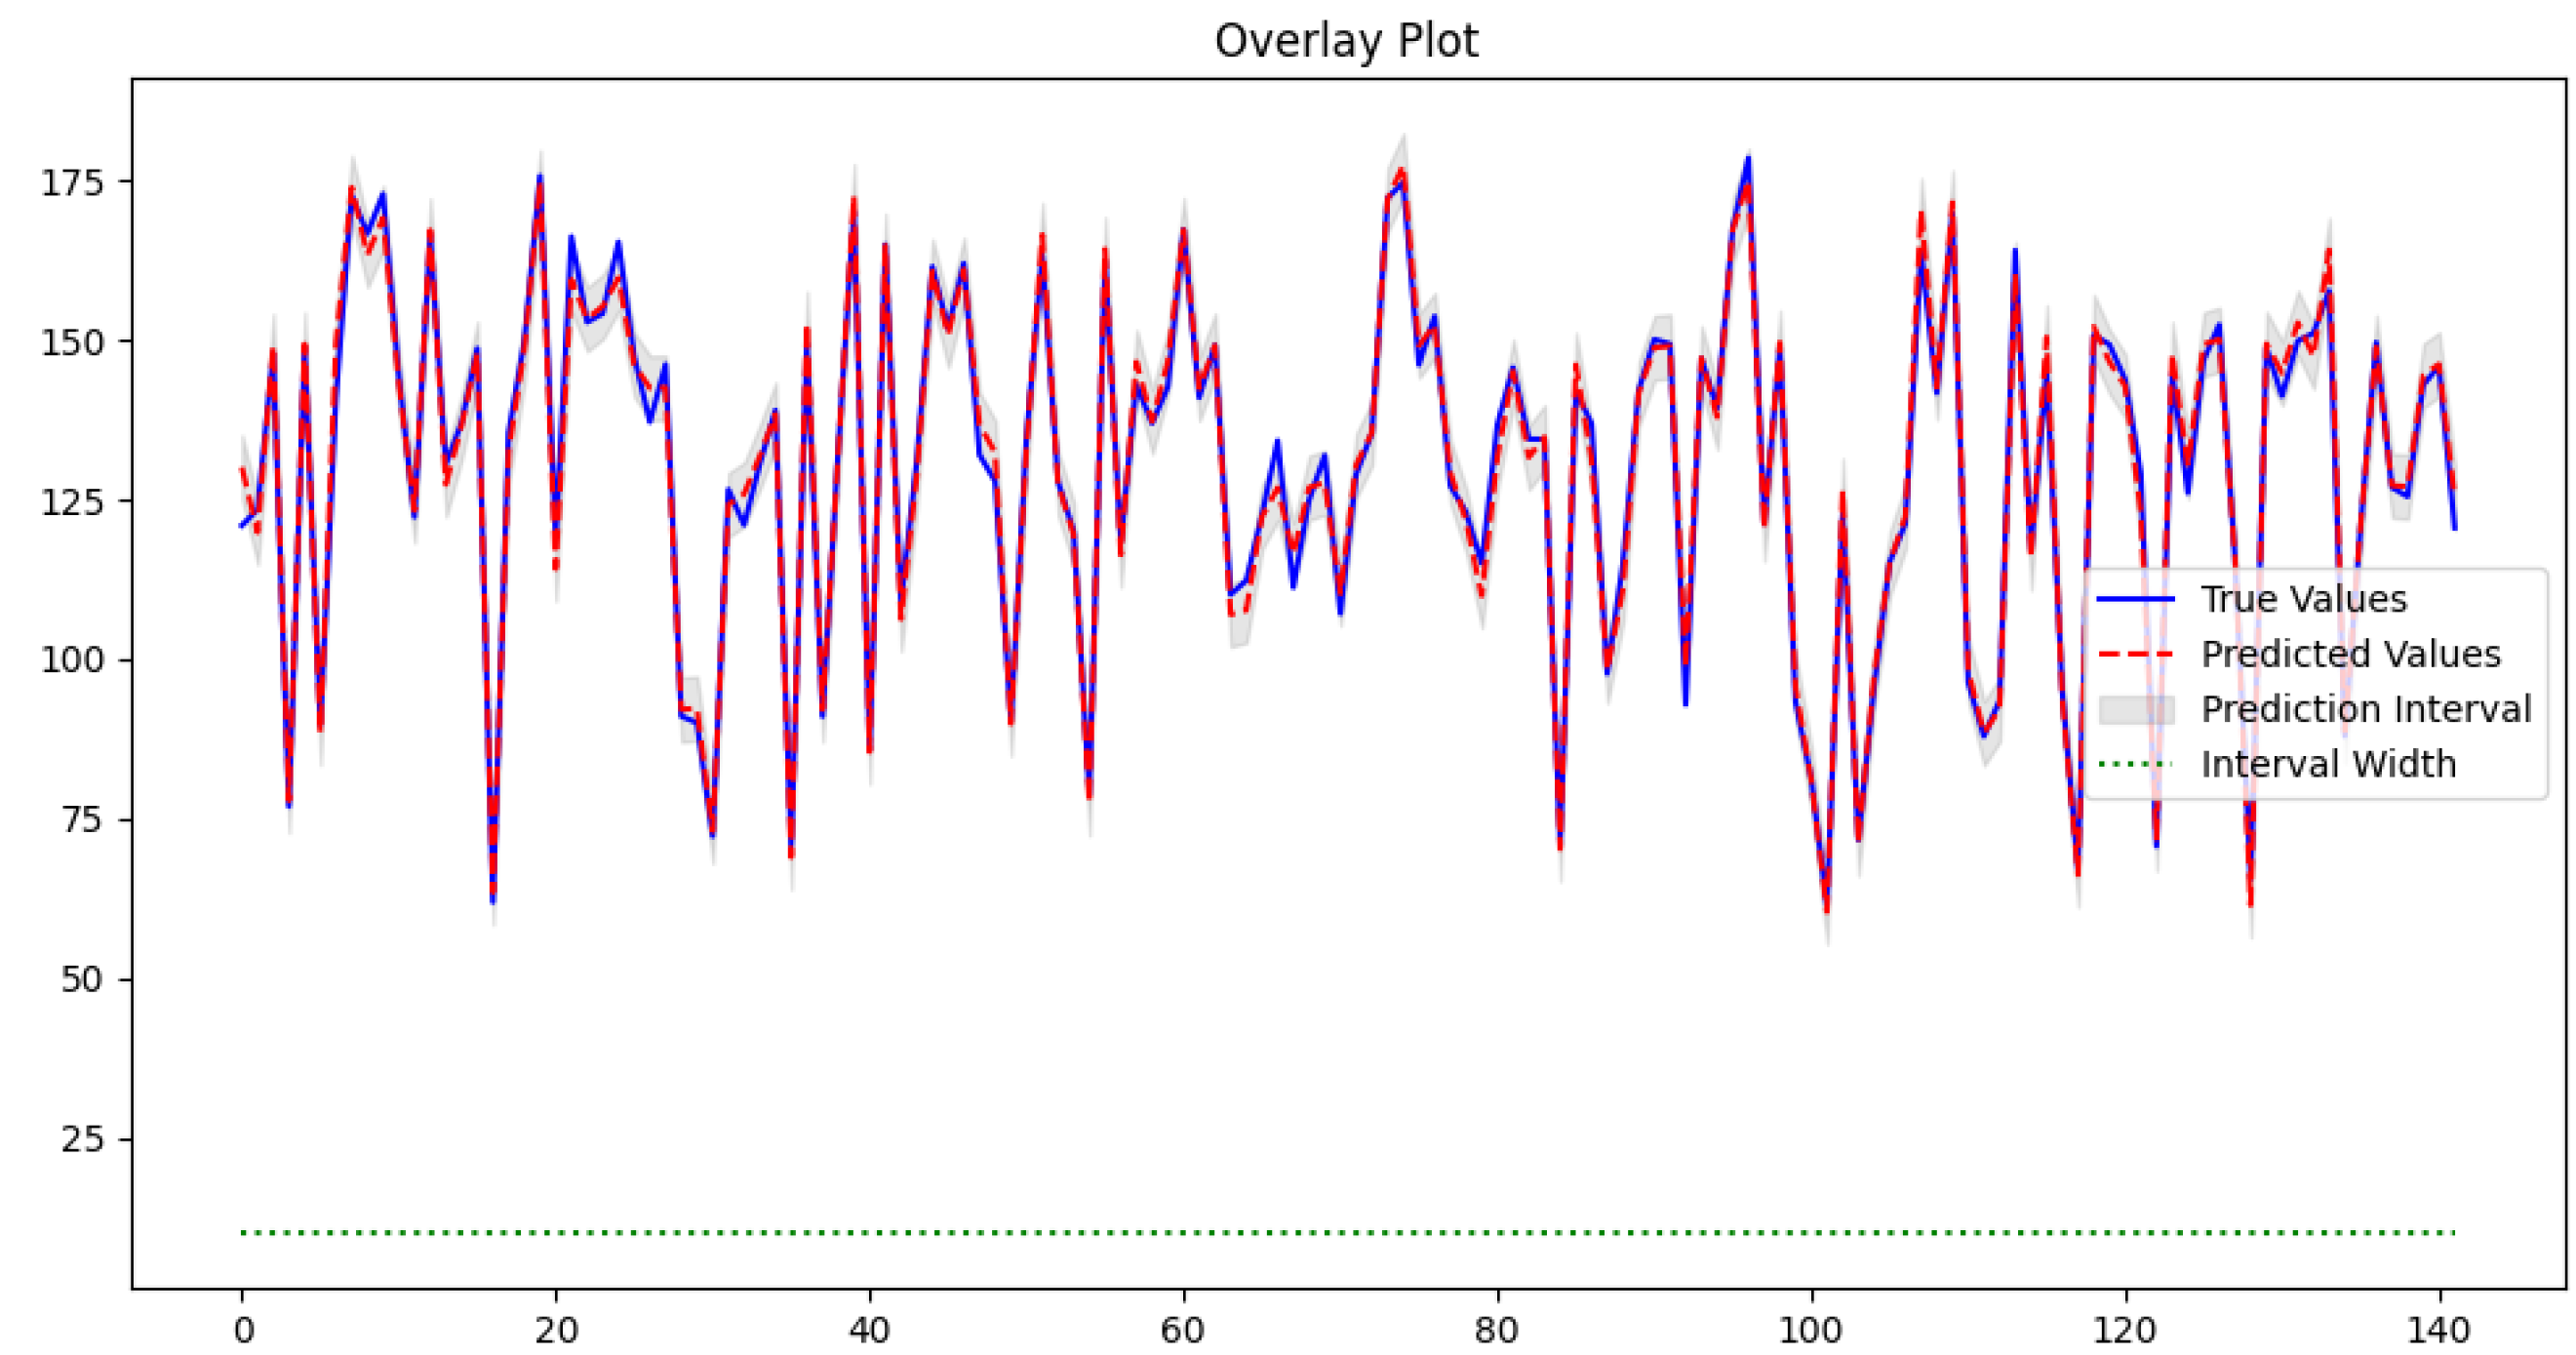
Figure 4 provides a comprehensive visualization of the model's performance by overlaying the true values, predicted values, and prediction intervals on a single graph. Detailed observations include:
Accuracy of Predictions: The red dashed line closely follows the blue line, indicating high predictive accuracy. For example, between time steps 20 and 40, the predicted values accurately capture the peaks and troughs of the true values.
Prediction Intervals: The grey shaded area provides a visual measure of uncertainty. The true values lie within the prediction intervals, indicating the model's ability to capture the range of possible outcomes accurately.
Interval Width: The green dotted line represents the width of the prediction intervals over time, showing that the intervals are sufficient to capture the variability in stock prices.
The overlay plot effectively illustrates the accuracy and reliability of the GAN model with conformal prediction. The close alignment of the predicted values with the true values, coupled with the consistent coverage provided by the prediction intervals, confirms the model's enhanced performance. This approach not only improves predictive accuracy but also offers a comprehensive measure of uncertainty, making it a valuable tool for financial forecasting and risk management.
4. Discussion
Our model demonstrated impressive performance on the test set, indicating its high level of predictive accuracy. Key metrics obtained are:
RMSE: 3.154 (±0.097)
MAE: 2.392 (±0.071)
MAPE: 1.868% (±0.052%)
These measures show the model's minimal error and deviation capacity to forecast stock prices. While the MAE and MAPE values validate the model's efficacy in catching both absolute and relative errors, the RMSE value indicates that the predictions of the model are generally within a small margin of error from the actual values. Combining conformal prediction with GANs turned out to be a major improvement since it generates reliable prediction intervals measuring uncertainty. Financial forecasting depends on this since it provides risk managers and investors with a means to make wise decisions grounded on a thorough awareness of possible hazards and uncertainties. Since most true values lie within the prediction intervals, the high coverage probabilities across several alpha levels confirm their dependability even more.
4.1. Implications in the Broader Context
Our results add to the increasing corpus of research on using machine-learning approaches in financial forecasting. GANs have shown promise in producing realistic data sequences for financial prediction according past research [
1,
2]. These studies sometimes lack strong techniques for estimating prediction uncertainty, which is fundamental for risk control, though. Our method closes this gap by including conformal prediction, so offering a complete solution for uncertainty quantification as well as accurate prediction. Strong performance of the model in volatile markets emphasizes its possible use in practical financial contexts. It provides a more consistent substitute for conventional statistical techniques including ARIMA and GARCH, which might suffer with high volatility in financial markets and non-linear patterns [
1,
2].
4.2. Comparison with Previous Studies
In comparison with studies by Goodfellow et al. [
3] and Wang et al. [
2], our model's integration of conformal prediction provides an additional layer of reliability by offering prediction intervals. This is a notable improvement over single-point predictions, which do not account for uncertainty and are less informative for decision-making in unpredictable markets. Moreover, our model aligns with recent advancements in the field, such as the work by Norinder et al. [
4], which emphasizes the importance of prediction intervals in assessing model performance. By leveraging conformal prediction, our model not only predicts future stock prices but also quantifies the uncertainty associated with these predictions, providing a more holistic view of potential future outcomes.
4.3. Future Work
While our model demonstrates significant advancements, there are several avenues for future research:
Extended Dataset: Training the model on a more extensive and diverse dataset, including multiple stock tickers and different time periods, could further validate its robustness and generalizability.
Advanced Architectures: Exploring advanced GAN architectures, such as Wasserstein GANs [
8] or Conditional GANs [
9], could potentially enhance the model's performance and stability.
Real-Time Predictions: Implementing the model for real-time stock price forecasting and integrating it with trading platforms could provide practical insights and facilitate automated trading strategies.
Alternative Uncertainty Quantification Methods: Investigating other uncertainty quantification methods, such as Bayesian neural networks [
10] or Monte Carlo dropout [
11], could provide additional perspectives on the reliability of the predictions.
Explainability and Interpretability: Enhancing the explainability and interpretability of the model's predictions through techniques like SHAP values or LIME could make the model more accessible and trustworthy for financial analysts and decision-makers.
5. Conclusions
In order to improve stock price forecasting accuracy and dependability, we presented in this work a novel method combining conformal prediction with Generative Adversarial Networks (GANs). Low RMSE, MAE, and MAPE values indicate that our model shown great predictive accuracy; also, it offers strong prediction intervals that measure uncertainty, so bridging a major gap in conventional GAN-based models. Validated using historical AAPL stock data, our model kept high coverage probabilities over several alpha levels, suggesting consistent uncertainty measures as most true values fell within the prediction intervals. This constant performance emphasizes the strong adaptability of the model in many market environments. Our results imply that by providing exact point estimates and quantifiable prediction dependability, integrating conformal prediction with GANs greatly improves financial forecasting. This dual capability helps risk managers and investors to make wise decisions grounded on a comprehensive awareness of possible hazards and uncertainties. Future studies could investigate alternative un-certainty quantification techniques, investigate advanced GAN architectures, and extend this approach to a greater spectrum of financial institutions and markets. Additionally promising are using real-time trading systems and improving model interpretability using SHAP or LIME. This integration greatly increases the predictive powers and dependability of financial forecasting models, so offering a useful instrument for financial industry risk management and decision-making.
References
- Adebiyi, A.A.; Adewumi, A.O.; Ayo, C.K. Comparison of ARIMA and Artificial Neural Networks Models for Stock Price Prediction. Journal of Applied Mathematics 2014, 2014, 1–7. [Google Scholar] [CrossRef]
- Wang, P.; Zhang, H.; Qin, Z.; Zhang, G. A novel hybrid-Garch model based on ARIMA and SVM for PM 2.5 concentrations forecasting. Atmospheric Pollution Research 2017, 8, 850–860. [Google Scholar] [CrossRef]
- Goodfellow, I.; Pouget-Abadie, J.; Mirza, M.; Xu, B.; Warde-Farley, D.; Ozair, S.; Courville, A.; Bengio, Y. Generative adversarial networks. Communications of the ACM 2020, 63, 139–144. [Google Scholar] [CrossRef]
- Norinder, U.; Carlsson, L.; Boyer, S.; Eklund, M. Introducing Conformal Prediction in Predictive Modeling. A Transparent and Flexible Alternative to Applicability Domain Determination. Journal of Chemical Information and Modeling 2014, 54, 1596–1603. [Google Scholar] [CrossRef] [PubMed]
- Dey, R.; Salem, F.M. Gate-variants of Gated Recurrent Unit (GRU) neural networks. 2017. [CrossRef]
- McNally, S.; Roche, J.; Caton, S. Predicting the Price of Bitcoin Using Machine Learning. 2018. [CrossRef]
- Yang, L.; Yang, Y.; Hasna, M.O.; Alouini, M.S. Coverage, Probability of SNR Gain, and DOR Analysis of RIS-Aided Communication Systems. IEEE Wireless Communications Letters 2020, 9, 1268–1272. [Google Scholar] [CrossRef]
- Gulrajani, I.; Ahmed, F.; Arjovsky, M.; Dumoulin, V.; Courville, A. Improved training of wasserstein GANs. 2017, 30, 5769–5779.
- Li, M.; Lin, J.; Ding, Y.; Liu, Z.; Zhu, J.Y.; Han, S. GAN Compression: Efficient Architectures for Interactive Conditional GANs. 2020. [CrossRef]
- Kwon, Y.; Won, J.H.; Kim, B.J.; Paik, M.C. Uncertainty quantification using Bayesian neural networks in classification: Application to biomedical image segmentation. Computational Statistics & Data Analysis 2020, 142, 106816. [Google Scholar] [CrossRef]
- Milanés-Hermosilla, D.; Codorniú, R.T.; López-Baracaldo, R.; Sagaró-Zamora, R.; Delisle-Rodriguez, D.; Villarejo-Mayor, J.J.; Núñez-Álvarez, J.R. Monte Carlo Dropout for Uncertainty Estimation and Motor Imagery Classification. Sensors 2021, 21, 7241. [Google Scholar] [CrossRef] [PubMed]
|
Disclaimer/Publisher’s Note: The statements, opinions and data contained in all publications are solely those of the individual author(s) and contributor(s) and not of MDPI and/or the editor(s). MDPI and/or the editor(s) disclaim responsibility for any injury to people or property resulting from any ideas, methods, instructions or products referred to in the content. |
© 2024 by the authors. Licensee MDPI, Basel, Switzerland. This article is an open access article distributed under the terms and conditions of the Creative Commons Attribution (CC BY) license (http://creativecommons.org/licenses/by/4.0/).


