
Submitted:
05 July 2024
Posted:
08 July 2024
You are already at the latest version
Abstract
L-cysteine, a precursor of essential components for plant growth, is synthesized by the cysteine synthase complex, which includes O-acetylserine(thiol) lyase (OAS-TL) and serine acetyltrans-ferase. In this work, we investigated how S-benzyl-L-cysteine (SBC), an OAS-TL inhibitor, affects the growth, photosynthesis, and oxidative stress of Ipomoea grandifolia plants. SBC impaired gas exchange and chlorophyll a fluorescence, indicating damage that compromised photosynthesis and reduced plant growth. Important parameters such as light-saturated net photosynthetic rate (PNmax), light saturation point (LSP), maximum carboxylation rate of Rubisco (Vcmax), electron transport rate (J), and triose phosphate utilization (TPU) decreased as a result. The quantum yield of photosystem II photochemistry (ϕPSII) and the electron transport rate through PSII (ETR) also decreased, as did the stomatal conductance (gs) and the photochemical quenching coefficient (qP). Additionally, SBC decreased the maximum fluorescence yield (Fm), variable fluorescence (Fv), and chlorophyll index, indicating possible damage to the photosynthetic apparatus. SBC triggered oxidative stress by increasing reactive oxygen species, malondialdehyde, and conjugated dienes. We hypothesize that dysfunctions in the sulfur-containing components of the photosynthetic electron transport chain, such as the cytochrome b6f complex, ferredoxin, and iron-sulfur (Fe-S) centers are the cause of these effects, which ultimately reduce the efficiency of electron transport and hinder photosynthesis in I. grandifolia plants. In short, our findings suggest that targeting OAS-TL with inhibitors such as SBC could be a promising strategy for the development of novel herbicides.
Keywords:
L-cysteine
; herbicides
; OAS-TL
; sulfur assimilation pathway
; weeds
1. Introduction
Ranking as the fourth most crucial nutrient for plants, sulfur plays a pivotal role in their nutrition. The existence of sulfur, which ranges from 0.2% to 0.5% of the dry mass depending on the species, is crucial for several biological processes such as photosynthesis, respiration, and the formation of cell membranes [1]. Prosthetic groups such as Fe-S centers, glutathione, glucosinolates, and chloroplasts, as well as coenzymes like biotin, thiamine pyrophosphate, coenzyme A, and S-adenosylmethionine, all possess sulfur [2]. Furthermore, sulfur significantly contributes to heavy metal detoxification through phytochelatins and glutathione, thereby enhancing plant stress resistance and ultimately impacting crop yields and quality [2,3,4]. A lack of sulfur can considerably impact crop growth, development, disease resistance, and nutritional quality due to its involvement in various biochemical processes [5].
Although leaves possess the ability to absorb sulfur dioxide (SO2) and hydrogen sulfide (H2S), plants predominantly obtain sulfur from inorganic sulfate present in the soil [2]. Upon absorption, ATP sulfurylase activates sulfate to produce adenosine 5′-phosphosulfate (APS), which can undergo phosphorylation to 3′-phosphoadenosine 5′-phosphosulfate (PAPS) via a secondary pathway. PAPS then serves as a sulfate group donor for synthesizing specialized metabolites [3,5,6]. Plants transform sulfate into L-cysteine and other compounds through the sulfur assimilation pathway. The initial step in the process is the conversion of adenosine 5′-phosphosulfate (APS) to sulfite and adenosine monophosphate (AMP) by adenosine 5′-phosphosulfate reductase. This is followed by the conversion of sulfite to sulfide by sulfite reductase, which occurs exclusively within plastids [2]. In contrast to sulfate reduction, L-cysteine production can occur in the cytoplasm, mitochondria, and plastids. O-Acetylserine(thiol) lyase (OAS-TL, EC 4.2.99.8) forms the first sulfur-containing organic molecule by combining sulfide with O-acetylserine (OAS) [7]. A pyridoxal 5′-phosphate cofactor is present in the two identical subunits forming the homodimeric enzyme OAS-TL. During L-cysteine production, sulfide replaces the acetoxy group of OAS [7]. In this process, serine O-acetyltransferase (SAT) produces OAS by transferring the acetate group from acetyl-CoA to L-serine [8].
Weeds are the foremost challenge in modern agriculture, threatening crop growth and productivity. With 23 distinct modes of action, synthetic herbicides have been devised to counteract weed growth. However, their overuse has resulted in environmental damage, human health hazards, and the emergence of herbicide-resistant weed species. There are 272 resistant weed species and over 500 reported cases (species × site of action) worldwide [9]. Our research team focuses on identifying and evaluating new herbicides with innovative modes of action. We employ in silico, in vitro, and in vivo approaches to gauge the effectiveness of enzyme inhibitors with herbicidal potential.
Specific OAS-TL inhibitors, such as alanine β-substituted compounds and anionic inhibitors, can disrupt sulfur assimilation and act as selective herbicides. In vitro assays with OAS-TL from spinach (Spinacea oleracea) demonstrated that these inhibitors bind to both the E and F forms of OAS-TL in a ping-pong kinetic model [10]. Leveraging the crucial role of enzymes in plant sulfur metabolism and employing homology modeling and virtual screening of maize OAS-TL, we have identified S-benzyl-L-cysteine (SBC) as an enzyme inhibitor. Our studies with three-day-old maize and Ipomoea grandifolia seedlings exposed to SBC for 96 h revealed that SBC non-competitively inhibits OAS-TL, impairing L-cysteine production and inhibiting seedling growth. In addition, maize plants exposed to SBC for 14 days exhibited reduced growth due to diminished photosynthetic CO2 assimilation [11].
I. grandifolia (Dammer) O’Donell, a member of the Convolvulaceae family and a type of eudicot with C3 photosynthesis, is commonly found in tropical and subtropical regions. It poses a significant threat to the yield and quality of crops, especially soybean [12]. As a weed, I. grandifolia exhibits resistance to glyphosate, possibly due to limited herbicide mobility within the plant. Moreover, glyphosate has increased plant tolerance levels, suggesting a natural evolution of resistance [13].
Since sulfur is an essential constituent of Fe-S centers, the cytochrome b6f complex, ferredoxin, and redox metabolism [14], it can significantly affect the photosynthetic capacity of plants. Thus, our current work has three-fold objectives. First, we assess the effect of SBC on the growth of I. grandifolia plants. Secondly, we evaluate the effect of SBC on photosynthesis by monitoring gas exchange parameters and chlorophyll a fluorescence. Finally, we measure the levels of reactive oxygen species (ROS), markers of lipid peroxidation (conjugated dienes and malondialdehyde), and the activities of antioxidant enzymes (superoxide dismutase—SOD, catalase—CAT, and peroxidase—POD).
2. Materials and Methods
2.1. Seed Preparation and Growth Conditions
Seeds of I. grandifolia were purchased from Cosmos Agricola (São Paulo, Brazil) and scarified with concentrated H2SO4 for 45 min to break dormancy. The seeds were then rinsed with distilled water and sown in dark plastic pots containing 50 g of expanded vermiculite and 50 g of organic substrate (MecPlant®, Mec Prec, São Paulo, Brazil). Initially, 130 mL of water (as a control) or solutions containing 1.0 to 5.0 mM of SBC (dissolved in water) were added. Subsequently, every two days, 50 mL of SBC solution was applied. Upon leaf emergence, 50 mL of a nutrient solution [15] adjusted to pH 6.0, with or without SBC, was added. The experiment was conducted under a 12-h light/12-h dark photoperiod, with a photon flux density of 500 μmol m–2 s–1, and at 25 °C for 14 days. SBC was purchased from Sigma-Aldrich (St. Louis, MO, USA). All other reagents used were of the highest available purity.
2.2. Biometric Parameters
On the 14th day of incubation, biometric parameters were evaluated. Plants treated with 2.5 and 5.0 mM of SBC were solely subjected to photographic documentation, whereas those treated with 1.0 mM SBC were assessed for root, stem, and leaf length. The material was oven-dried at 60 °C for 72 h to determine dry biomass. All recorded data were expressed in centimeters or grams, encompassing root, stem, leaf, and fresh and dry mass.
2.3. Photosynthetic Parameters
Analyses were conducted on the 14th day of cultivation utilizing the fully expanded first leaf. A portable fluorometer photosynthesis system (Li-6800-F2, Li-Cor Inc., Lincoln, NE, USA) was used to measure gas exchange and multiphase fluorescence. The leaf chamber measured 2 cm2, with measurements taken over 20 min under specified conditions: 400 μmol mol–1 CO2, a flow rate of 700 μmol s–1, 65% relative humidity, and at 25 °C.
Light-response curves were constructed using varying light intensities: 2500, 2250, 2000, 1750, 1500, 1400, 1200, 1000, 800, 600, 400, 200, 175, 150, 125, 100, 75, 50, 25, and 0 µmol photons m–2 s–1 photosynthetically active photon flux density (PPFD), with intervals of 60 to 120 s to achieve a steady state in the plant. The curves were adjusted for C3 plants based on Lobo et al. [16] and Ye [17]. The parameters used to assess plant vitality included the light-saturated net photosynthetic rate (PNmax, µmol CO2 m–2 s–1), light-compensation point (LCP, μmol m–2 s–1), light-saturation point (LSP, μmol m–2 s–1), day respiration rate (RD, μmol m–2 s–1) and photosynthetic quantum yield [α, (μmol CO2 m–2 s–1)/(μmol photon m–2 s–1)].
The CO2-response curves were constructed utilizing varying CO2 concentrations: 400, 200, 25, 50, 75, 125, 175, 225, 275, 325, 350, 400, 400, 500, 600, 800, 1000, 1200, 1400, 1600, 1800, and 2000 µmol mol–1 under a light intensity of 800 μmol m–2 s–1. Measurements were taken post-stabilization of intercellular CO2 concentration, typically occurring between 60 and 120 s. The curves were adjusted for C3 plants based on Sharkey [18]. The following parameters were determined: maximum carboxylation rate of ribulose-1,5-bisphosphate carboxylase/oxygenase (Rubisco) (Vcmax, μmol m–2 s–1), photosynthetic electron transport rate (J, μmol m–2 s–1), triose phosphate utilization (TPU, μmol m–2 s–1), dark respiration rate (RD’, μmol m–2 s–1), and mesophilic conductance (gm, μmol m–2 s–1). From the measurements, values were obtained for the transpiration rate (E, μmol m–2 s–1), intercellular CO2 concentration (Ci, μmol m–2 s–1), stomatal conductance (gs, μmol m–2 s–1), quantum yield of photosystem II photochemistry (ϕPSII), electron transport rate through PSII (ETR, μmol m–2 s–1), photochemical quenching coefficient (qP), nonphotochemical quenching (NPQ), and effective photochemical quantum efficiency (Fv’/Fm’). After 10 h of dark adaptation, the minimal fluorescence yield of the dark-adapted state (F0), maximum fluorescence yield of the dark-adapted state (Fm), and maximum quantum yield of PSII photochemistry (Fv/Fm) were also measured. Variable fluorescence (Fv) was calculated by subtracting Fm from F0 [19]. A chlorophyll meter (SPAD-502, Konica Minolta, Ramsey, USA) was used to determine the chlorophyll index.
For chlorophyll a fluorescence transient (OJIP curve) analysis, plants underwent a 10-h dark adaptation period. The central region of the first leaf (2 cm2) was subjected to a 1-s pulse of red light (2500 μmol m–2 s–1) [20]. The OJIP curve was plotted on a logarithmic timescale. The F0 was considered at 50 μs, representing the fluorescence intensity at which all PSII reaction centers are open and the primary quinone acceptor (QA) is oxidized. The Fm corresponds to the fluorescence intensity when all QA molecules are reduced and the PSII reaction centers are closed. The increase in fluorescence between F0 and Fm occurs in two steps: J-point (at 2 ms) and I-point (at 30 ms), describing the fluorescence changes over time and easing a comprehensive understanding of the OJIP curve.
2.4. Oxidative Stress Parameters
Roots and leaves were mixed with 1 mL of 10 mM Tris-HCL buffer (pH 7.2) and centrifuged at 12,000 g for 20 min at 4 °C to measure the level of ROS. The supernatant (100 μL) was transferred to glass tubes and diluted with 900 μL of the same buffer. After that, 10 μL of 1.0 mM 2′,7′-dichlorofluoroscine diacetate (prepared in dimethyl sulfoxide) was added to each tube to start the fluorescence reaction with ROS. The samples were homogenized and kept in the dark for 10 min. Finally, the samples were read on the spectrofluorometer at 504 nm for excitation and 526 nm for emission [21]. The content of ROS was expressed as fluorescence intensity (in arbitrary units) μg–1 of fresh biomass.
To determine the malondialdehyde (MDA) content, 0.6 g of leaves and roots were macerated with 4 mL of 96% ethanol at 4 °C. Thereafter, 3 mL of the sample was put into a Falcon tube and mixed with 3 mL of a 0.5% solution of 2-thiobarbituric acid dissolved in 10% trichloroacetic acid. After incubation at 95 °C for 30 min, the reaction was stopped in an ice bath, and the samples were centrifuged at 10,000 g for 10 min. The absorbance of MDA at 532 nm and the nonspecific absorbance at 600 nm were measured using the supernatant. The MDA content was calculated by subtracting the nonspecific absorbance from the absorbance at 532 nm. Results were expressed in μmol g–1 of fresh biomass [22].
To measure the content of conjugated dienes, a 500 μL aliquot of the first homogenate was mixed with 1 mL of 96% ethanol in an Eppendorf tube and centrifuged at 20,000 g for 20 min [23]. The absorbance of the supernatant was measured at 234 nm and 500 nm to account for nonspecific absorbance. The difference between these absorbances was then used to determine the concentration of conjugated dienes. Results were expressed as μmol g–1 of fresh biomass.
To assess the activity levels of superoxide dismutase (SOD), catalase (CAT), and peroxidase (POD), a standard extraction method was employed [24]. One gram of fresh leaves or roots was first homogenized with liquid nitrogen and then with 1.5 mL of potassium phosphate buffer 100 mM (pH 7.5) having 3 mM of DTT, 1.0 mM of EDTA, and 0.01 g of polyvinylpyrrolidone. The resulting homogenate was then centrifuged at 18,000 g for 30 min at 4 °C, and the enzymatic activities were determined using the resulting supernatant.
To measure SOD activity, the enzyme extract was mixed with a potassium phosphate buffer (50 mM) containing 1.0 mM EDTA, 389 mM L-methionine, 75 μM nitro blue tetrazolium (NBT), and 60.6 μM riboflavin at 25 °C. The reaction was started with light exposure (300 μmol m–2 s–1) and continued for 5 min. The reduction of NBT was checked with a spectrophotometer at 560 nm. SOD activity was defined as the amount of enzyme needed to cause 50% inhibition of NBT reduction, with one unit (U) expressed as the enzyme amount required to achieve this inhibition. Results were reported in U mg–1 of fresh biomass [25].
CAT activity was measured by checking the consumption of H2O2 in a reaction mixture (1.1 mL) consisting of 50 μL of 0.1 M phosphate buffer (pH 7.0), 50 μL of crude enzyme extract, and 27 mM H2O2. The reaction was started by adding 0.5 mL of 60 mM H2O2. After 4 min, the reaction was stopped by adding 0.5 mL of 34.4 mM ammonium molybdate. The assay was conducted at 38 °C in a water bath, and the readings were taken at 405 nm using a spectrophotometer [26]. The results were expressed as μmol min–1 mg–1 of fresh biomass.
The POD activity was determined by measuring the oxidation of guaiacol in a reaction mixture (3 mL) having 25 mM potassium phosphate buffer (pH 6.8), 2.58 mM H2O2, 10 mM guaiacol, and 200 μL of enzyme extract diluted in 67 mM potassium phosphate buffer (pH 7.0). After adding the enzyme extract, the samples were read at 470 nm for 5 min. POD activity was calculated using the molar extinction coefficient for tetraguaiacol (25.5 mM–1 cm–1), and the results were expressed as μmol min–1 g–1 of fresh biomass [27].
2.5. Statistical Analysis
The experimental design was completely randomized, pairing each plot with a pot containing a single plant. The results were expressed as the mean of five to ten samples ± standard error of the mean (SEM). The GraphPad Prism® package (Version 8.0.2, GraphPad Software Inc., Boston, MA, USA) was used for the statistical analyses. The Student’s t-test was employed to ascertain the statistical significance of the mean values, with the following definitions: *p ≤ 0.005, **p ≤ 0.01, and ***p ≤ 0.001.
3. Results
3.1. The Impact of SBC on Plant Growth
Treatment with SBC exhibited a suppressive effect on the growth of I. grandifolia plants. More pronounced effects were observed in plants treated with 2.5- and 5.0-mM of SBC (Figure 1A). At 1.0 mM, SBC induced chlorosis in the first true leaves (Figure 1B) and led to a 30% decrease in root length, a 43% decrease in stem length, and a 28% decrease in leaf growth (Table 1). Treatment with 1.0 mM SBC decreased both the fresh and dry mass of roots (57% and 55%, respectively), stems (61% and 55%, respectively), and leaves (56% and 50%, respectively) (Table 1). Given the significant impact of 2.5- and 5.0 mM SBC on plant growth (Figure 1A), the following experiments were conducted using 1.0 mM SBC, which exhibited a pronounced yet non-lethal effect.
3.2. The Impact of SBC on Photosynthesis
At 1.0 mM, SBC affected gas exchange, chlorophyll a fluorescence, and chlorophyll content. The light-response curves showed that SBC decreased PNmax by 24% (Figure 2A) and LSP by 22% (Figure 2B) compared to the controls. However, it did not significantly affect LCP (Figure 2C), RD (Figure 2D), or α (Figure 2E). The LSP value derived from the light-response curve was 800 μmol m−2 s−1, which was utilized for further analyses. According to the CO2-response curves, SBC decreased Vcmax by 23% (Figure 2F), J by 19% (Figure 2G), and TPU by 20% (Figure 2H) relative to controls. RD’ (Figure 2I) and gm (Figure 2J) remained unchanged.
While SBC had no significant effect on E (Figure 3A) and Ci (Figure 3B), it reduced gs by 34% (Figure 3C). The ϕPSII (Figure 3D), ETR (Figure 3E), and qP (Figure 3F) decreased by 19%, 19%, and 12%, respectively, compared to controls. Conversely, NPQ (Figure 3G) and Fv’/Fm’ (Figure 3H) did not change significantly.
Following the dark adaptation of I. grandifolia plants, SBC decreased Fm by 14% (Figure 4B) and Fv by 15% (Figure 4C), while F0 (Figure 4A) and Fv/Fm (Figure 4D) remained unchanged.
The SPAD index showed a 15% decrease in chlorophyll content in SBC-treated plants (Figure 5A). The OJIP curve (Figure 5B) was analyzed by measuring the fluorescence levels FO, FJ, FI, and FP at times of 50 μs, 2 ms, 30 ms, and tFm, respectively. The analysis revealed significant decreases in FI (11%) and FP (13%) values compared to the control, resulting in a lower curve enhancement.
3.3. The Impact of SBC and Oxidative Stress
Treatment with 1.0 mM SBC significantly increased ROS and lipid peroxidation levels (Table 2). The ROS content increased by 55% in roots and 50% in leaves. Conjugated dienes, a marker of lipid peroxidation, increased by 61% in roots and 77% in leaves. Malondialdehyde, another lipid peroxidation marker, increased by 30% in roots but showed no significant change in leaves. The activities of SOD, CAT, and POD remained unchanged in roots and leaves after treatment with 1.0 mM SBC, except for a 30% increase in root POD activity.
4. Discussion
Treatment with SBC resulted in a significant reduction in the growth of I. grandifolia at all concentrations tested. Our previous study has shown that SBC inhibits OAS-TL, consequently disrupting the biosynthesis of L-cysteine and related sulfur-containing compounds [28]. By hindering the biosynthesis of L-cysteine, the assimilation of sulfur is compromised. A lack of assimilated sulfur in plants can lead to severe damage, such as stunted growth and leaf chlorosis, particularly pronounced in young plants [2]. This has been noted in rice [29], maize, and I. grandifolia [28]. Compared to the control group, I. grandifolia plants treated with 1.0 mM SBC showed reduced leaf, stem, and root lengths, and decreased fresh and dry mass. At higher concentrations (2.5 and 5.0 mM), the plants stopped growing. Additionally, internerval chlorosis was visible in the fully expanded first leaves.
Measurements of gas exchange and chlorophyll a fluorescence are valuable tools for understanding photosynthesis and stress responses [30,31]. In our study, 1.0 mM SBC decreased photosynthetic parameters (PNmax, LSP, Vcmax, J, TPU, gs, ϕPSII, ETR, qP, Fm, and Fv) and increased ROS and oxidative stress markers (conjugated dienes and malondialdehyde) in I. grandifolia. The lack of assimilated sulfur inhibits the biosynthesis of essential components in the photosynthetic electron transport chain and enzymes involved in carbon metabolism, thereby reducing photosynthesis and producing ROS [2]. Our evaluation of I. grandifolia plants further revealed a decrease in PNmax and LSP, likely due to reductions in gs and/or interference with CO2 assimilation reactions. To achieve maximum photosynthetic capacity (PNmax), it is essential to align biophysical processes that transport CO2 through the leaves and stomata with biochemical processes occurring in the thylakoids, stroma, mitochondria, and cytoplasm of the cell [18].
Analysis of punctual gas exchange measurements in I. grandifolia plants revealed no significant alteration in E and Ci but a reduction in gs. Soybean plants treated with benzoxazolinone [32], allelochemical L-3,4-dihydroxyphenylalanine (L-DOPA) or an aqueous extract of Mucuna pruriens [33] also showed decreases in PNmax and gs. Stomatal limitation of photosynthesis reduces gs and Ci [34,35]; the latter was not observed in our data. Despite the reduction in gs, Ci may remain unchanged due to a decrease in Vcmax, as explained later.
Beyond stomatal limitations, non-stomatal factors can also impede photosynthesis, including diminished activity of photosystem II (PSII) or inhibition of electron transport [36]. Chlorophyll a fluorescence is a non-invasive measure of ϕPSII activity, providing insights into the structure and function of the photosynthetic apparatus. These fluorescence parameters, which primarily reflect the photochemical phase of photosynthesis, precisely delineate the efficiency of PSII in capturing light energy and converting it into chemical energy [20,37]. Our data showed a significant decrease in ϕPSII, indicating a decline in the ability of chlorophyll to absorb light for photochemical reactions [38]. Similar changes in PSII activity have been reported in sulfur-deprived plants [29] and in soybean plants subjected to benzoxazolinone [32], L-DOPA [33], and t-aconitic acid [35].
As demonstrated herein, the diminished efficiency of the PSII reaction center, as indicated by a decrease in ϕPSII, can significantly impact ETR. Given that ϕPSII can estimate the ETR, it provides valuable insights into both photosynthetic efficiency and carbon fixation [38]. Furthermore, when analyzing ϕPSII, it is imperative to consider two key parameters: qP and Fv’/Fm’ [37]. The qP value elucidates the proportion of open PSII reaction centers. In I. grandifolia plants submitted to SBC, we observed a 12% decrease in qP, signifying a higher proportion of closed reaction centers. This closure renders plants susceptible to photoinhibition due to reduced excitation energy utilized for photochemistry and an accumulation of the reduced QA fraction [39]. Despite these alterations, Fv’/Fm’, which gauges the effective photochemical quantum efficiency under light, as well as NPQ and the PSII structural integrity parameter (Fv/Fm), remained unchanged in response to SBC exposure. However, I. grandifolia plants submitted to SBC exhibited decreased chlorophyll levels, like those observed in sulfur-deficient rice plants [29]. In a nutshell, this finding underscores the broader impact of SBC on the photosynthetic apparatus.
The OJIP curve provides a detailed analysis of chlorophyll a fluorescence kinetics, describing the oxidation-reduction processes and electron transport dynamics from chlorophyll excitation to the reduction of final acceptors [40]. Thus, the OJIP curve can be used to describe the photochemical quantum yield of PSII and the transport of electrons within the photosynthetic machinery [20]. The OJIP curve comprises three distinct phases. The initial phase (O to J) involves the reduction of QA, the primary electron acceptor of the PSII, accompanied by an increase in fluorescence depending on the absorbed photons [20]. Subsequently, the second phase (J to I) reveals a decline in the plastoquinone (PQ) pool, indicating a complete reduction of the secondary electron acceptor (Qfr), followed by PQBH2 reoxidation facilitated by the cytochrome b6f complex. The final phase (I to P) involves the reduction of the final electron acceptors on the acceptor side of PSI, including NADP+ and ferredoxin. In essence, the shape of the OJIP transients is a valuable indicator of the structural stability of PSII and provides insights into energy fluxes between its components. Herein, the OJIP curve revealed that exposure to SBC reduced the J to I and I to P phases in I. grandifolia plants, indicating reduced PQBH2 reoxidation and final acceptor reduction processes mediated by the cytochrome b6f complex, PSI, and ferredoxin. When plants are treated with SBC, the inhibition of OAS-TL impairs the synthesis of L-cysteine, causing expected changes in related steps. This primary effect confers sulfur groups necessary for forming essential photosynthetic complexes. For instance, the cytochrome b6f complex has a 2Fe-2S center and a Rieske protein, while PSI has three Fe-S centers (Fx, Fa, and Fb), and ferredoxin has a 4Fe-4S center. In simple terms, sulfur metabolism and photosynthesis are closely related, and changes in physiology induced by SBC may be explained by this interaction.
An alternative approach to understanding how C3 photosynthesis adapts to diverse conditions, such as SBC treatment, is the method developed by Farquhar et al. [41]. This method categorizes photosynthesis into three distinct states: Rubisco-limited, 1.5-biphosphate ribulose (RuBP)-limited, and TPU-limited. In the initial state, enzyme limitation is predominantly attributed to the low concentration of CO2 rather than its Vmax, assuming a saturating supply of RuBP. In the second state, photosynthesis is limited by the regeneration of RuBP. Under elevated CO2 conditions, the rate at which Rubisco utilizes RuBP surpasses the regenerative capacity of other enzymes in the Calvin cycle. Finally, the TPU-limited state occurs when the chloroplast reactions generate products more rapidly than the leaf’s capacity to utilize them, mainly but not exclusively phosphate triose [42].
Steady-state photosynthetic CO2 responses (PN/Ci curves) are valuable tools for accurately assessing the plant’s photosynthetic capacity, efficiency, and the upper limits of photosynthesis rates [43]. Our thorough analysis has revealed that the application of 1.0 mM SBC resulted in a substantial decrease of Vcmax, J, and TPU, which represent the primary limitations of photosynthesis under conditions of light saturation [44].
A decline in photosynthesis may occur from various factors, including decreased Rubisco activity due to stomatal closure, resulting in diminished CO2 levels within the intercellular space [45]. Alternatively, a decrease in Rubisco amounts, as observed in sulfur-free rice plants [29], may decrease photosynthesis. This seems to be the case with SBC exposure.
A decreased J value, for instance, reduces the availability of NADPH required for the regeneration reactions of ribulose-1,5-bisphosphate. This is particularly relevant in the context of herbicides, many of which kill plants by obstructing electron transport. C-group herbicides such as diuron, atrazine, and metribuzin inhibit photosynthesis by binding to the D1 protein complex, disrupting electron transport from QA to QB, impeding CO2 fixation, and inhibiting NADPH and ATP production [9,46].
The blockage in electron transport also hinders the activation of crucial enzymes (ribulose-5-phosphate-kinase, fructose-1,6-bisphosphatase, sedoheptulose-1,7-bisphosphatase, and glyceraldehyde-3-phosphate-dehydrogenase) via the ferredoxin-thioredoxin system. Under light conditions, electrons from PSI reduce ferredoxin, which donates electrons to thioredoxin. In its reduced state, thioredoxin donates electrons to reduce the disulfide bonds of Calvin cycle enzymes, thereby activating them. Additionally, we observed a decrease in the TPU value due to diminished J values, compromised ferredoxin-thioredoxin system, and cycle enzyme function. The disulfide bonds between critical Cys residues in these enzymes are indispensable for their catalytic activities. According to the findings of Foletto-Felipe [11], leaf proteome analysis revealed a reduction in Calvin cycle enzyme expression in maize plants exposed to SBC.
A blockage in electron transport inevitably activates chlorophyll into a high-energy state known as the triplet state. This state can generate harmful radicals in membrane unsaturated fatty acids or react with oxygen to produce singlet oxygen [47,48]. Elevated levels of ROS cause significant cell damage, degrading proteins, lipids, carbohydrates, and DNA, ultimately culminating in cell death [49]. Chloroplasts are the primary source of ROS within plant cells [49]. We observed significant ROS levels concomitant with high MDA levels, a lipid peroxidation marker, and conjugated dienes in both leaves and roots.
To prevent oxidative damage caused by ROS, plants utilize a combination of antioxidant enzymes (SOD, POD, CAT, ascorbate peroxidase—APX, and glutathione reductase) and antioxidant compounds (glutathione, ascorbate, α-tocopherol, proline, and flavonoids) [49]. We assessed the activities of SOD, POD, and CAT. SOD is the first line of defense against ROS by dismutating O2•- to H2O2, while CAT and POD detoxify H2O2 into H2O [50]. Herein, we found that the activities of SOD, POD, and CAT remained unchanged in both the leaves and roots of I. grandifolia. However, SBC increased ROS content and oxidative damage. This discrepancy could be attributed to decreased levels of L-cysteine and L-methionine, which may have prevented the activation and synthesis of antioxidant system enzymes due to the inhibitory effect of SBC on OAS-TL, potentially compromising protein structure.
Although SBC does not directly inhibit photosynthesis, it does impact electron transport efficiency and increases ROS and lipid peroxidation, akin to PSII-inhibiting herbicides [9]. Depending on the dosage, C-group herbicides have elicited varied antioxidant enzyme responses. For example, in foxtail millet (Setaria italica) plants treated with atrazine, a PSII-inhibiting herbicide, ROS and malondialdehyde levels increased. Conversely, the activities of POD and APX increased, while CAT and SOD activities decreased [51]. Similarly, wheat plants exposed to prometryne, another PSII-inhibiting herbicide, exhibited elevated malondialdehyde content, indicating oxidative damage [52]. Furthermore, at low doses of this herbicide, the activities of SOD, POD, CAT, APX, and glutathione S-transferase increased but decreased at high doses. At high doses, PSII-inhibiting herbicides can impair the transport of photosynthetic electrons and compromise the antioxidant defense system. This occurs due to the excessive production of ROS, potentially leading to protein degradation and other detrimental consequences. Our findings suggest that a similar pattern may apply to SBC.
5. Conclusions
Treatment with SBC reduced the growth of I. grandifolia plants and suppressed photosynthesis, as evidenced by a reduction in PNmax, LSP, Vcmax, J, and TPU in conjunction with a decreased ΦPSII, ETR, gs, qP, Fm, Fv, and chlorophyll index. This was accompanied by an impairment of the antioxidant system, as indicated by increased ROS and lipid peroxidation products. These effects are likely due to the damage of complexes containing the cytochrome b6f, ferredoxin, and Fe-S centers, which in turn makes electron transport less efficient and impairs photosynthesis in I. grandifolia plants. This study opens a new perspective in herbicide research by highlighting OAS-TL inhibition as a distinct mechanism and furnishing valuable insights for developing innovative approaches in this field.
Author Contributions
Investigation, methodology, writing—original draft, D.C.I.M.; investigation, L.H.E.G.; M.d.P.F.-F.; A.P.d.S.M., and R.P.C.; formal analysis, A.P.F.; W.D.d.S., and R.P.C.; conceptualization, supervision, writing—review & editing, R.M.; and conceptualization, funding acquisition, writing—review & editing, O.F.-F. All authors have read and agreed to the published version of the manuscript.
Funding
This research was funded by the Coordination of Higher Education Personnel Improvement—Brazil (CAPES, Finance Code 001), and Araucaria Foundation [grant numbers 013/2017 (PRONEX) and 002/2016].
Data Availability Statement
The data presented in this study are available on request from the corresponding author.
Acknowledgments
D.C.I.M., L.H.E.G., and A.P.S.M. are scholarship from the CAPES—Brazil. R.M., W.D.d.S., and O.F.-F. are research fellows of the National Council for Scientific and Technological Development (CNPq).
Conflicts of Interest
The authors declare no conflict of interest.
References
- Marschner, P. Marschner’s Mineral Nutrition of Higher Plants; Marschner, P., Ed.; Third edit.; Elsevier, 2012; ISBN 9780123849052.
- Li, Q.; Gao, Y.; Yang, A. Sulfur Homeostasis in Plants. Int. J. Mol. Sci. 2020, 21, 1–16. [CrossRef]
- Jez, J.M.; Ravilious, G.E.; Herrmann, J. Structural Biology and Regulation of the Plant Sulfation Pathway. Chem. Biol. Interact. 2016, 259, 31–38. [CrossRef]
- Huang, X.Y.; Li, M.; Luo, R.; Zhao, F.J.; Salt, D.E. Epigenetic Regulation of Sulfur Homeostasis in Plants. J. Exp. Bot. 2019, 70, 4171–4182. [CrossRef]
- Koprivova, A.; Kopriva, S. Sulfation Pathways in Plants. Chem. Biol. Interact. 2016, 259, 23–30. [CrossRef]
- Kopriva, S.; Malagoli, M.; Takahashi, H. Sulfur Nutrition: Impacts on Plant Development, Metabolism, and Stress Responses. J. Exp. Bot. 2019, 70, 4069–4073. [CrossRef]
- Jez, J.M. Structural Biology of Plant Sulfur Metabolism: From Sulfate to Glutathione. J. Exp. Bot. 2019, 70, 4089–4103. [CrossRef]
- Jez, J.M.; Dey, S. The Cysteine Regulatory Complex from Plants and Microbes: What Was Old Is New Again. Curr. Opin. Struct. Biol. 2013, 23, 302–310. [CrossRef]
- Heap, I. International Herbicide-Resistant Weed Database Available online: https://www.weedscience.org/Home.aspx (accessed on 1 January 2024).
- Warrilow, A.G.S.; Hawkesford, M.J. Modulation of Cyanoalanine Synthase and O-Acetylserine (Thiol) Lyases A and B Activity by β-Substituted Alanyl and Anion Inhibitors. J. Exp. Bot. 2002, 53, 439–445.
- Foletto-Felipe, M. de P. O-Acetilserina(Tiol) Liase: Estudos in Silico, in Vitro e in Vivo, Universidade Estadual de Maringá, 2021.
- Pagnoncelli, F. de B.; Trezzi, M.M.; Brum, B.; Vidal, R.A.; Portes, Á.F.; Scalcon, E.L.; Machado, A. Morning Glory Species Interference on the Development and Yield of Soybeans. Bragantia 2017, 76, 470–479. [CrossRef]
- Pazuch, D.; Trezzi, M.M.; Guimarães, A.C.D.; Barancelli, M.V.J.; Pasini, R.; Vidal, R.A. Evolução Da Tolerância Ao Glyphosate Em Populações de Corda-de-Viola. Planta Daninha 2017, 35. [CrossRef]
- Chan, K.X.; Wirtz, M.; Phua, S.Y.; Estavillo, G.M.; Pogson, B.J. Balancing Metabolites in Drought: The Sulfur Assimilation Conundrum. Trends Plant Sci. 2013, 18, 18–29. [CrossRef]
- Hoagland, D.R.; Arnon, D.I. The Water Culture Method for Growing Plants without Soil. Circ. Calif. Agric. Exp. Stn. 1950, 347, 32.
- Lobo, F. de A.; de Barros, M.P.; Dalmagro, H.J.; Dalmolin, Â.C.; Pereira, W.E.; de Souza, É.C.; Vourlitis, G.L.; Rodríguez Ortíz, C.E. Fitting Net Photosynthetic Light-Response Curves with Microsoft Excel - a Critical Look at the Models. Photosynthetica 2013, 51, 445–456. [CrossRef]
- Ye, Z.P. A New Model for Relationship between Irradiance and the Rate of Photosynthesis in Oryza Sativa. Photosynthetica 2007, 45, 637–640. [CrossRef]
- Sharkey, T.D.; Bernacchi, C.J.; Farquhar, G.D.; Singsaas, E.L. Fitting Photosynthetic Carbon Dioxide Response Curves for C3 Leaves. Plant, Cell Environ. 2007, 30, 1035–1040. [CrossRef]
- Marchiosi, R.; de Souza Bido, G.; Böhm, P.A.F.; Soares, A.R.; da Silva, H.A.; Ferro, A.P.; de Lourdes Lucio Ferrarese, M.; Ferrarese-Filho, O. Photosynthetic Response of Soybean to L-DOPA and Aqueous Extracts of Velvet Bean. Plant Growth Regul. 2016, 80, 171–182. [CrossRef]
- Stirbet, A.; Lazár, D.; Kromdijk, J. Chlorophyll a Fluorescence Induction: Can Just a One-Second Measurement Be Used to Quantify Abiotic Stress Responses? Photosynthetica 2018, 56, 86–104. [CrossRef]
- Jambunathan, N. Determination and Detection of Reactive Oxygen Species (ROS), Lipid Peroxidation, and Electrolyte Leakage in Plants. In Plant stress tolerance: Methods in molecular biology; Sunkar, R., Ed.; Springer, 2010; pp. 291–297 ISBN 978-1-60761-701-3.
- Heath, R.L.; Packer, L. Photoperoxidation in Isolated Chloroplast. I. Kinetics and Stoichiometry of Fatty Acids Peroxidation. Arch. Biochem. Biophys. 1968, 125, 189–198.
- Buege, J.A.; Aust, S.D. Biomembranes - Part C: Biological Oxidations. Methods Enzymol. 1978, 52, 302–310.
- Azevedo, R.A.; Alas, R.M.; Smith, R.J.; Lea, P.J. Response of Antioxidant Enzymes to Transfer from Elevated Carbon Dioxide to Air and Ozone Fumigation, in the Leaves and Roots of Wild-Type and a Catalase-Deficient Mutant of Barley. Physiol. Plant. 1998, 104, 280–292. [CrossRef]
- Giannopolitis, C.N.; Ries, S.K. Superoxide Dismutases Occurrence in Higher Plants. Plant Physiol. 1977, 59, 309–314. [CrossRef]
- Tománková, K.; Luhová, L.; Petřivalský, M.; Peč, P.; Lebeda, A. Biochemical Aspects of Reactive Oxygen Species Formation in the Interaction between Lycopersicon Spp. and Oidium neolycopersici. Physiol. Mol. Plant Pathol. 2006, 68, 22–32. [CrossRef]
- Dos Santos, W.D.; Ferrarese, M.L.L.; Nakamura, C. V.; Mourão, K.S.M.; Mangolin, C.A.; Ferrarese-Filho, O. Soybean (Glycine max) Root Lignification Induced by Ferulic Acid. The Possible Mode of Action. J. Chem. Ecol. 2008, 34, 1230–1241. [CrossRef]
- Foletto-Felipe, M. de P.; Abrahão, J.; Siqueira-Soares, R. de C.; Contesoto, I. de C.; Grizza, L.H.E.; de Almeida, G.H.G.; Constantin, R.P.; Philippsen, G.S.; Seixas, F.A.V.; Bueno, P.S.A.; et al. Inhibition of O-Acetylserine (Thiol) Lyase as a Promising New Mechanism of Action for Herbicides. Plant Physiol. Biochem. 2023, 204, 108127. [CrossRef]
- Lunde, C.; Zygadlo, A.; Simonsen, H.T.; Nielsen, P.L.; Blennow, A.; Haldrup, A. Sulfur Starvation in Rice: The Effect on Photosynthesis, Carbohydrate Metabolism, and Oxidative Stress Protective Pathways. Physiol. Plant. 2008, 134, 508–521. [CrossRef]
- Bucher, S.F.; Bernhardt–Römermann, M.; Römermann, C. Chlorophyll Fluorescence and Gas Exchange Measurements in Field Research: An Ecological Case Study. Photosynthetica 2018, 56, 1161–1170. [CrossRef]
- Da˛Browski, P.; Baczewska-Dąbrowska, A.H.; Kalaji, H.M.; Goltsev, V.; Paunov, M.; Rapacz, M.; Wójcik-Jagła, M.; Pawluśkiewicz, B.; Bąba, W.; Brestic, M. Exploration of Chlorophyll a Fluorescence and Plant Gas Exchange Parameters as Indicators of Drought Tolerance in Perennial Ryegrass. Sensors (Switzerland) 2019, 19, 2736. [CrossRef]
- Parizotto, A. V.; Marchiosi, R.; Bubna, G.A.; Bevilaqua, J.M.; Ferro, A.P.; Ferrarese, M.L.L.; Ferrarese-Filho, O. Benzoxazolin-2-(3H)-One Reduces Photosynthetic Activity and Chlorophyll Fluorescence in Soybean. Photosynthetica 2017, 55, 386–390. [CrossRef]
- Zhou, Y.H.; Yu, J.Q. Allelochemicals and Photosynthesis. In Allelopathy: A Physiological Process with Ecological Implications; 2006; pp. 127–139 ISBN 9781402042805.
- Bortolo, T. da S.C.; Marchiosi, R.; Viganó, J.; Siqueira-Soares, R. de C.; Ferro, A.P.; Barreto, G.E.; Bido, G. de S.; Abrahão, J.; dos Santos, W.D.; Ferrarese-Filho, O. Trans-Aconitic Acid Inhibits the Growth and Photosynthesis of Glycine max. Plant Physiol. Biochem. 2018, 132, 490–496. [CrossRef]
- Everard, J.D.; Cucci, R.; Kann, S.C.; Flore, J.A.; Loescher, W.H. Gas Exchange and Carbon Partitioning in the Leaves of Celery (Apium Graveolens L.) at Various Levels of Root Zone Salinity. Plant Physiol. 1994, 106, 281–292. [CrossRef]
- Murchie, E.H.; Lawson, T. Chlorophyll Fluorescence Analysis: A Guide to Good Practice and Understanding Some New Applications. J. Exp. Bot. 2013, 64, 3983–3998. [CrossRef]
- Maxwell, K.; Johnson, G.N. Chlorophyll Fluorescence - A Practical Guide. J. Exp. Bot. 2000, 51, 659–668. [CrossRef]
- Hussain, M.I.; Reigosa, M.J. Allelochemical Stress Inhibits Growth, Leaf Water Relations, PSII Photochemistry, Non-Photochemical Fluorescence Quenching, and Heat Energy Dissipation in Three C 3 Perennial Species. J. Exp. Bot. 2011, 62, 4533–4545. [CrossRef]
- Lazár, D. The Polyphasic Chlorophyll a Fluorescence Rise Measured under High Intensity of Exciting Light. Funct. Plant Biol. 2006, 33, 9–30. [CrossRef]
- Farquhar, G.D.; Caemmerer, S.; Berry, J.A. A Biochemical Model of Photosynthetic CO2 Assimilation in Leaves of C3 Species. Planta 1980, 149, 78-90–90.
- Sharkey, T.D. Photosynthesis in Intact Leaves of C3 Plants: Physics, Physiology and Rat Limitation. Bot. Rev. 1985, 5, 53–105.
- Sharkey, T.D. What Gas Exchange Data Can Tell Us about Photosynthesis. Plant Cell Environ. 2016, 39, 1161–1163. [CrossRef]
- Long, S.P.; Bernacchi, C.J. Gas Exchange Measurements, What Can They Tell Us about the Underlying Limitations to Photosynthesis? Procedures and Sources of Error. J. Exp. Bot. 2003, 54, 2393–2401. [CrossRef]
- Ashraf, M.; Harris, P.J.C. Photosynthesis under Stressful Environments: An Overview. Photosynthetica 2013, 51, 163–190. [CrossRef]
- Octobre, G.; Delprat, N.; Doumèche, B.; Leca-Bouvier, B. Herbicide Detection: A Review of Enzyme- and Cell-Based Biosensors. Environ. Res. 2024, 249, 118330. [CrossRef]
- Fuerst, E.P.; Norman, M.A. Interactions of Herbicides with Photosynthetic Electron Transport. Weed Sci. 1991, 39, 458–464. [CrossRef]
- Krieger-Liszkay, A. Singlet Oxygen Production in Photosynthesis. J. Exp. Bot. 2005, 56, 337–346. [CrossRef]
- Das, K.; Roychoudhury, A. Reactive Oxygen Species (ROS) and Response of Antioxidants as ROS-Scavengers during Environmental Stress in Plants. Front. Environ. Sci. 2014, 2, 1–13. [CrossRef]
- Apel, K.; Hirt, H. Reactive Oxygen Species: Metabolism, Oxidative Stress, and Signal Transduction. Annu. Rev. Plant Biol. 2004, 55, 373–399. [CrossRef]
- Sher, A.; Mudassir Maqbool, M.; Iqbal, J.; Nadeem, M.; Faiz, S.; Noor, H.; Hamid, Y.; Yuan, X.; Pingyi, G. The Growth, Physiological and Biochemical Response of Foxtail Millet to Atrazine Herbicide. Saudi J. Biol. Sci. 2021, 28, 6471–6479. [CrossRef]
- Jiang, L.; Yang, H. Prometryne-Induced Oxidative Stress and Impact on Antioxidant Enzymes in Wheat. Ecotoxicol. Environ. Saf. 2009, 72, 1687–1693. [CrossRef]
Figure 1.
Effects of SBC on the growth of I. grandifolia plants over a 14-day experiment. The plants were watered with 50 mL of a nutrient solution at pH 6.0 every two days. The control plants were treated with the nutrient solution only. The experiment was conducted at 25 °C, with a 12 h light/12 h dark photoperiod and a photon flux density of 500 μmol m–2 s–1.
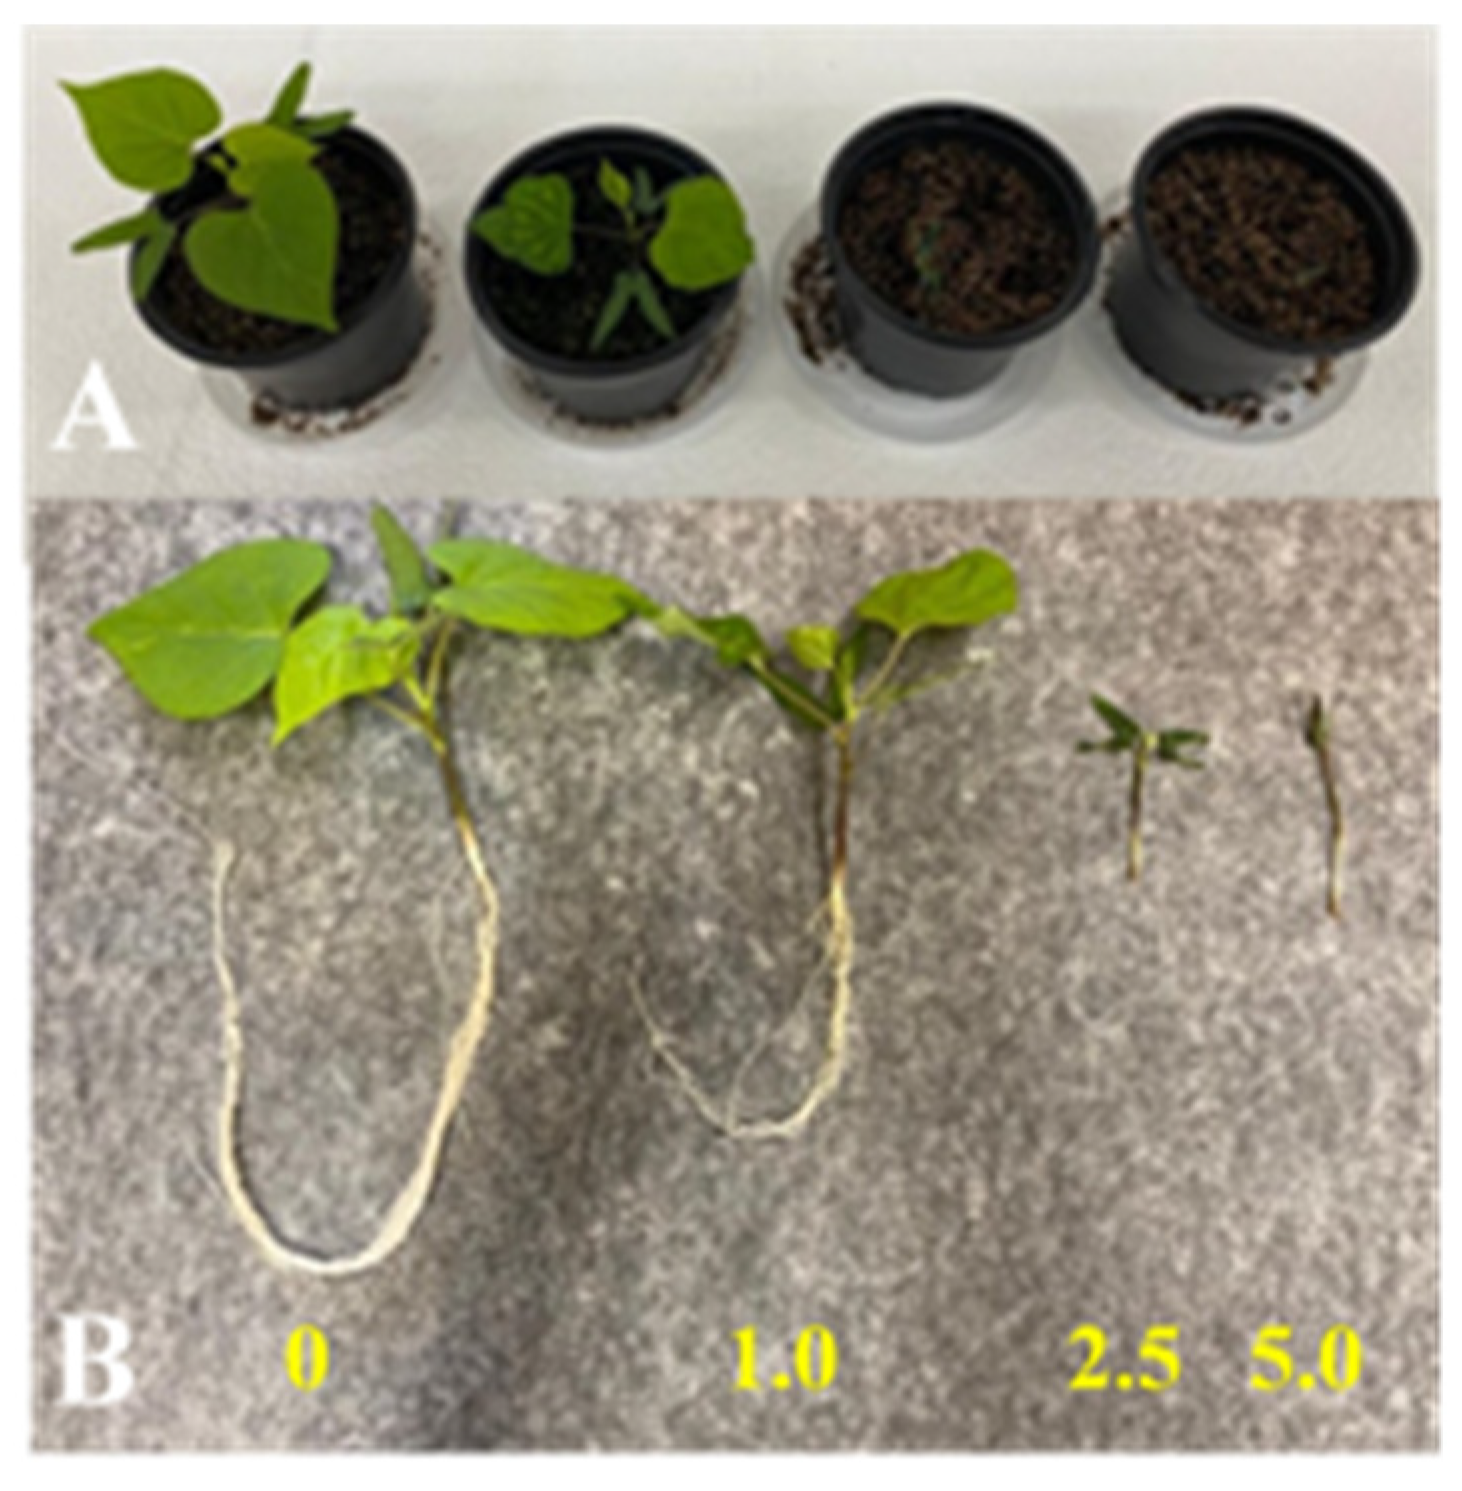
Figure 2.
Effects of 1.0 mM SBC on 14-day-old I. grandifolia plants. Light-response curve parameters include A) maximum net photosynthetic rate (PNmax), B, light-saturation point (LSP), C, light-compensation point (LCP), D, day respiration rate (RD), and E, photosynthetic quantum yield (α). CO2-response curve parameters include F) maximum carboxylation rate of Rubisco (Vcmax), G, photosynthetic electron transport rate (J), H, triose phosphate utilization (TPU), I, dark respiration rate (RD’), and J, mesophilic conductance (gm). Mean values (n = 5 ± SEM for A to E; n = 6 ± SEM for F to J) significantly different from the control are marked with **p ≤ 0.01, ***p ≤ 0.001, according to the Student’s t-test.
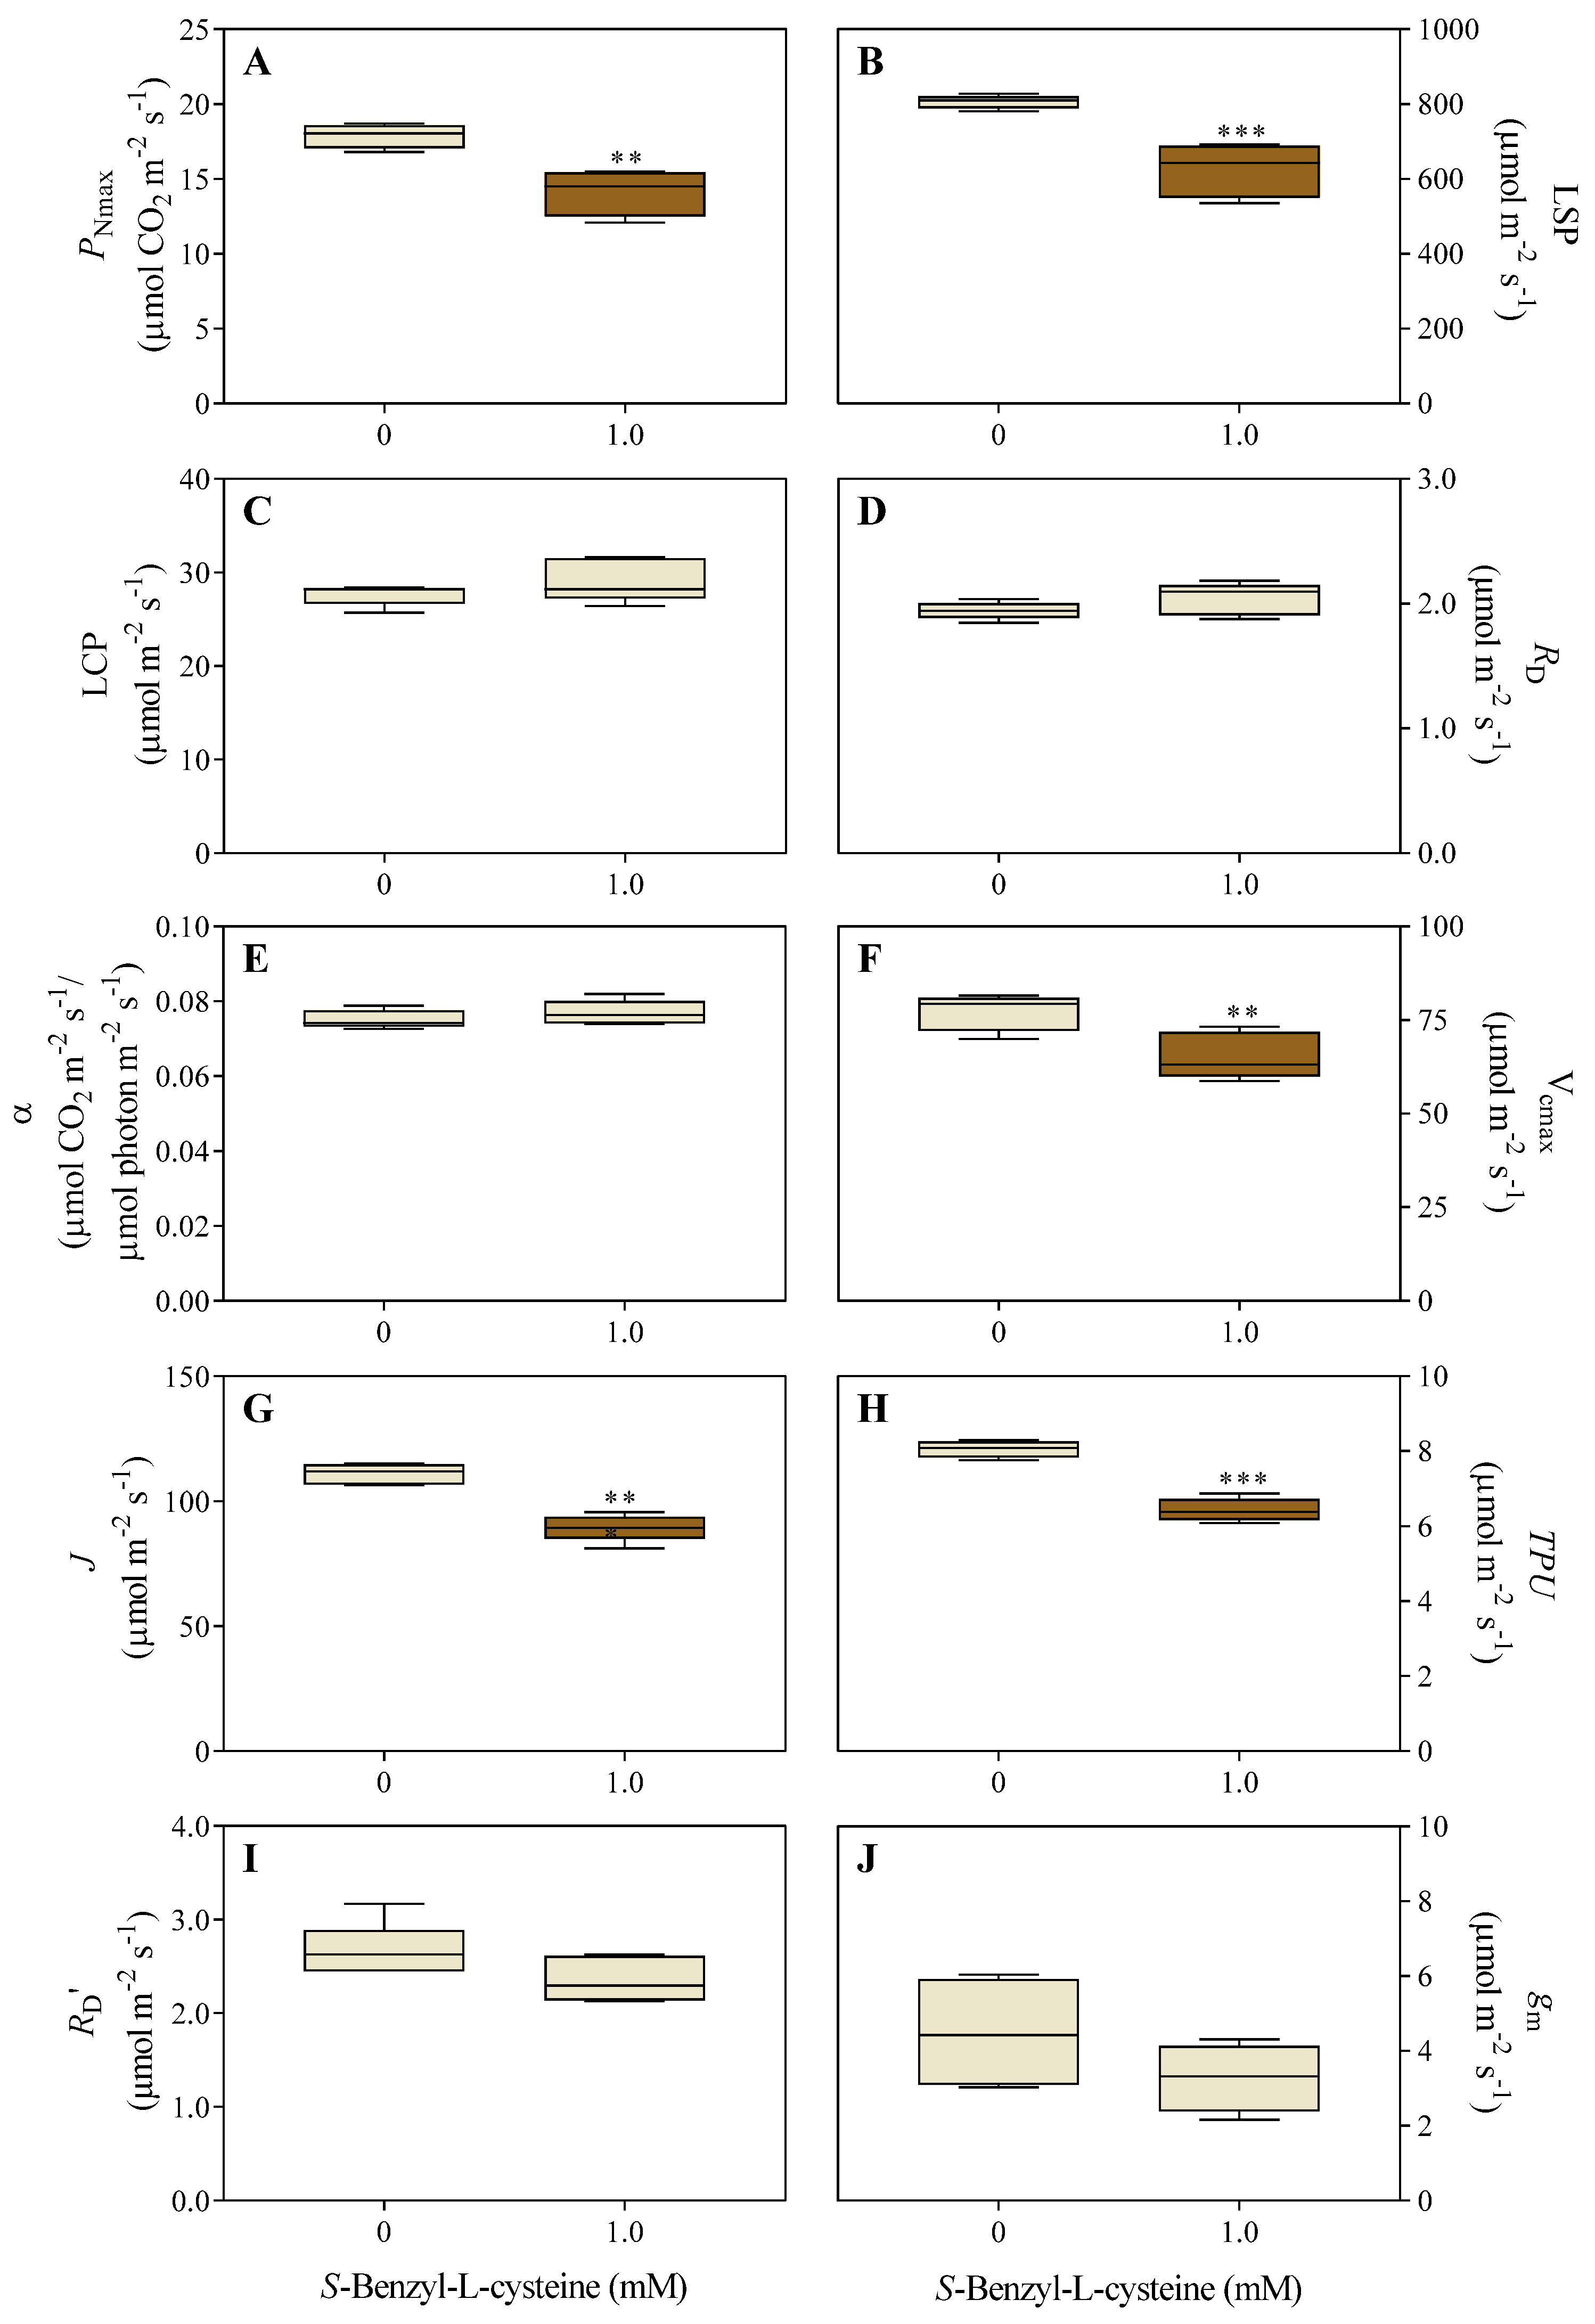
Figure 3.
Effects of 1.0 mM SBC on 14-day-old I. grandifolia plants. Gas exchange measurements and chlorophyll a fluorescence include A) transpiration rate (E), B) intercellular CO2 concentration (Ci), C) stomatal conductance (gs), D) quantum yield of photosystem II photochemistry (ϕPSII), E) electron transport rate through PSII (ETR), F) photochemical quenching coefficient (qP), G) nonphotochemical quenching (NPQ), and H) effective photochemical quantum efficiency (Fv’/Fm’). Mean values (n = 6 ± SEM) significantly different from the control are marked with *p ≤ 0.05, according to the Student’s t-test.
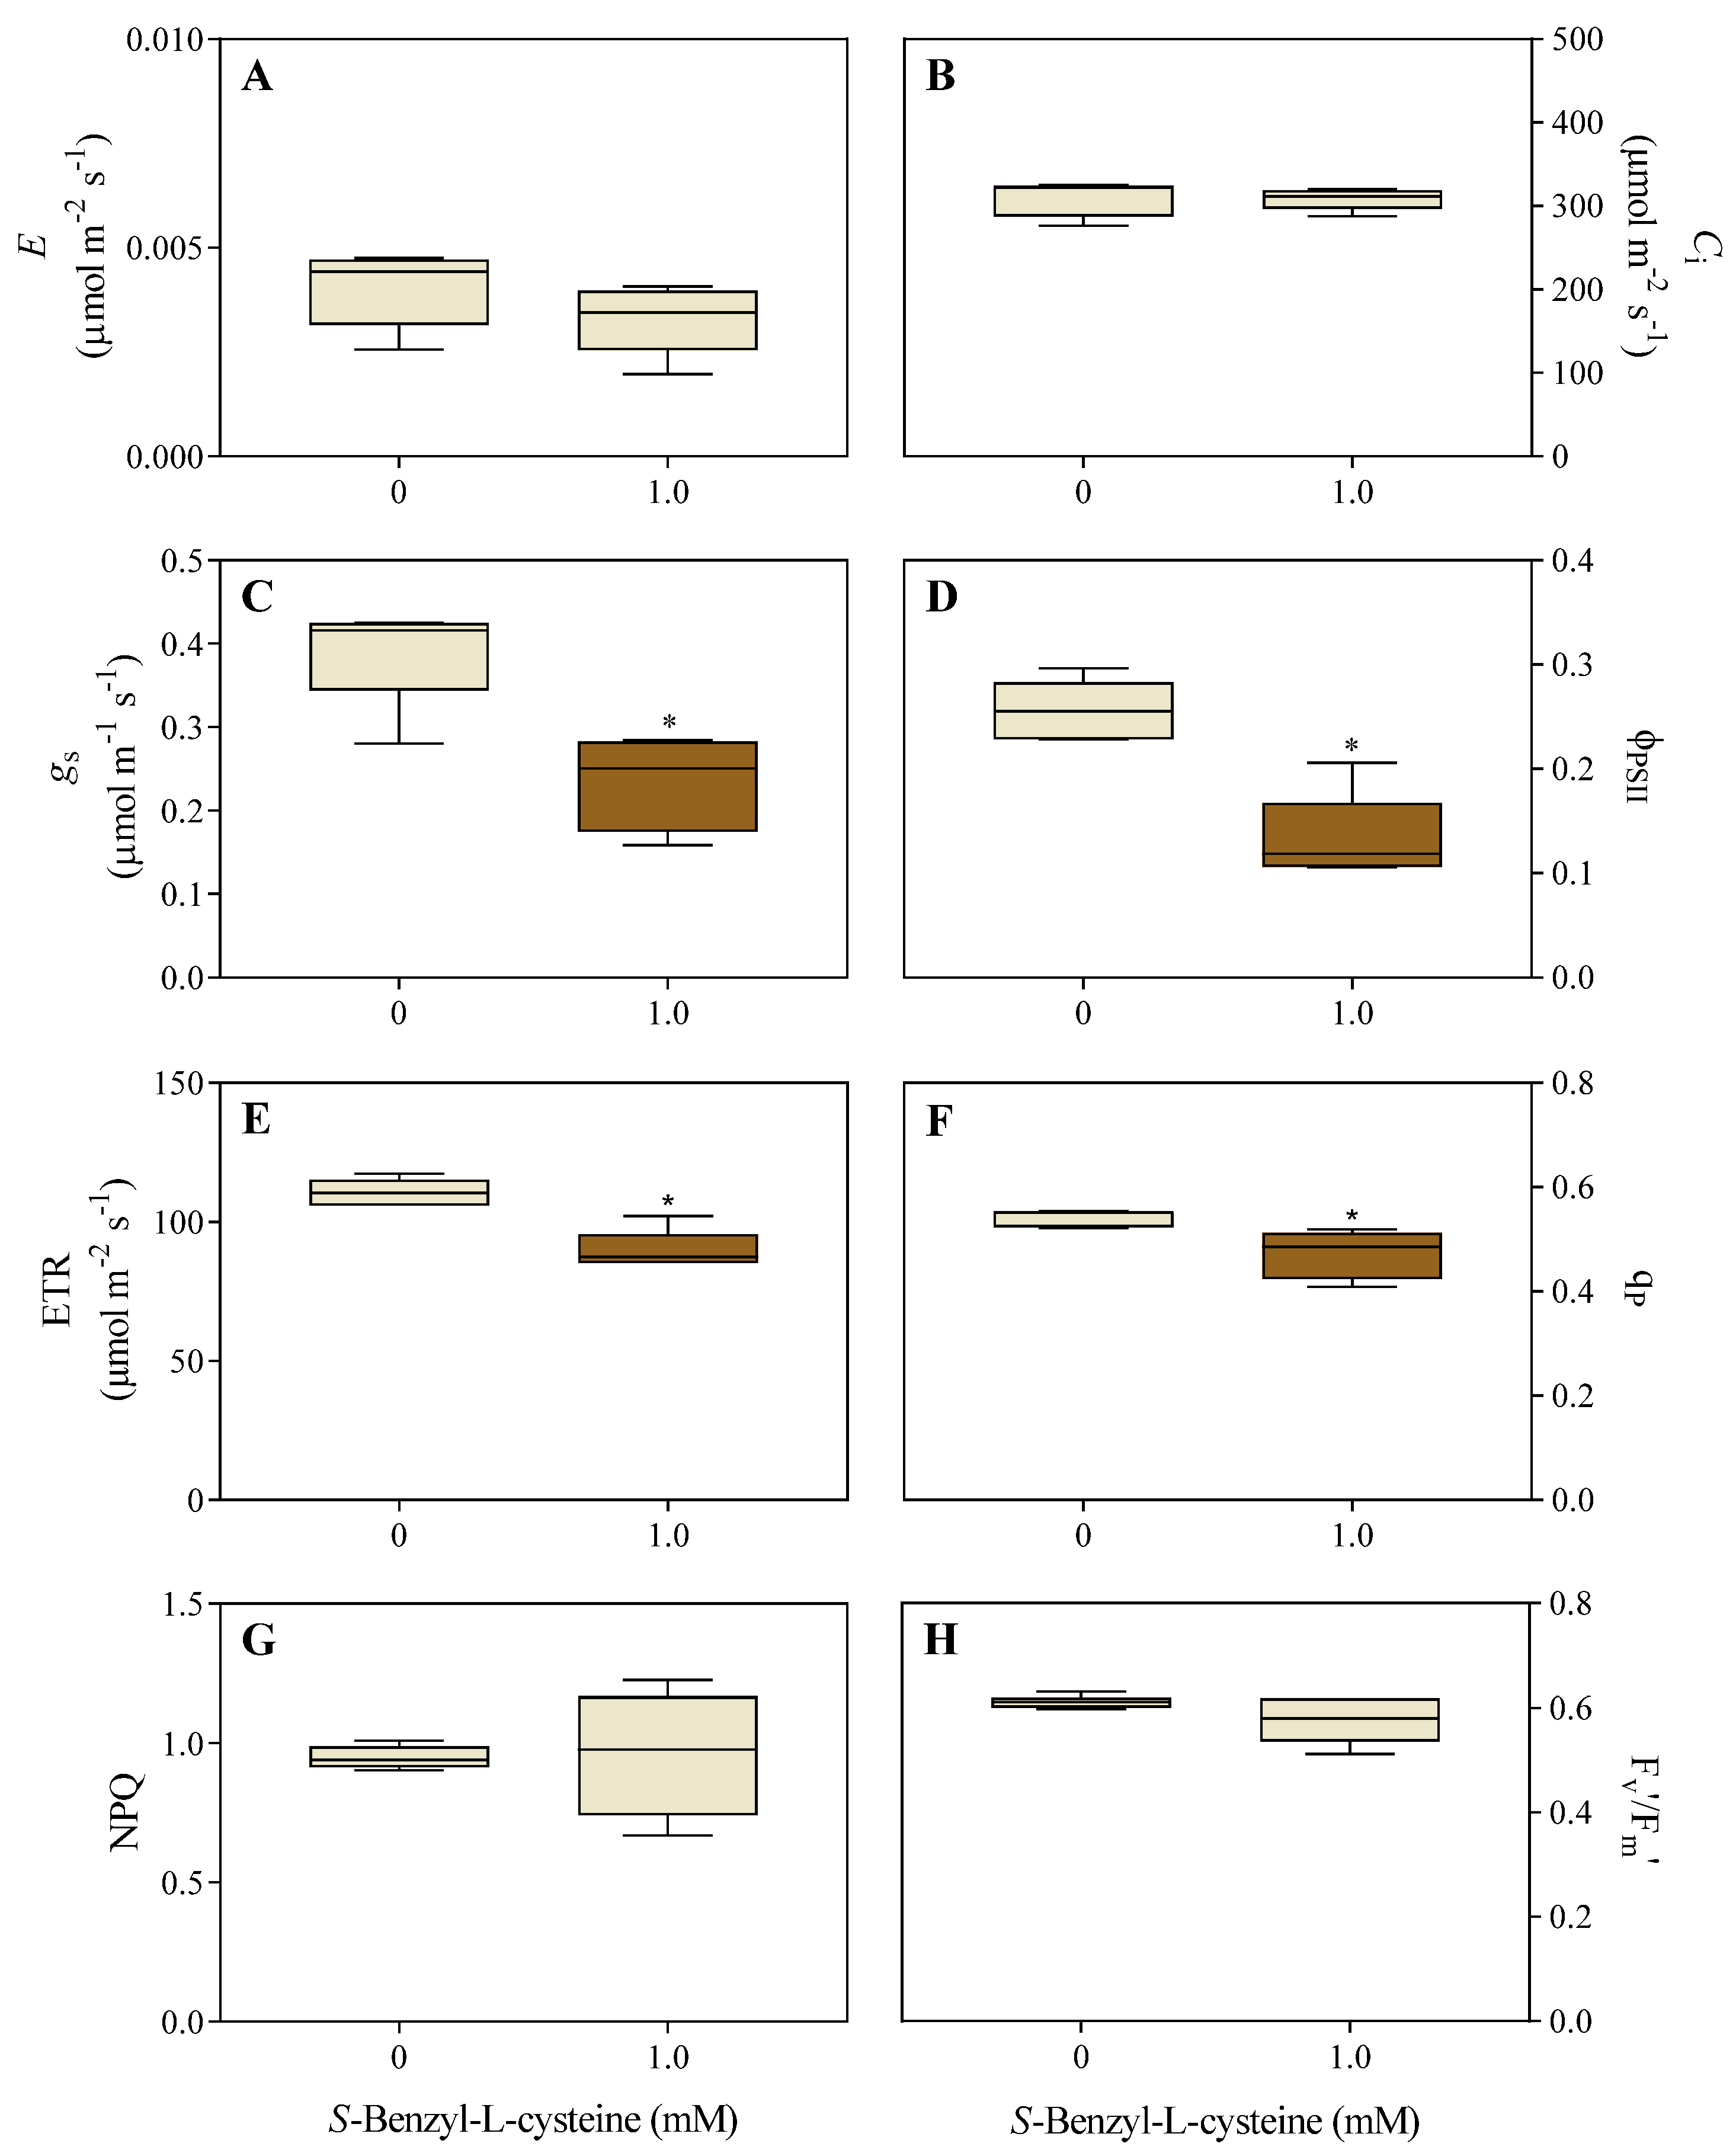
Figure 4.
Effects of 1.0 mM SBC on 14-day-old I. grandifolia plants after 10 h of dark adaptation. Chlorophyll fluorescence measurements include A, minimal fluorescence yield (F0), B, maximum fluorescence yield (Fm), C, variable fluorescence (Fv), and D, maximum quantum yield of PSII (Fv/Fm). Mean values (n = 8 ± SEM) significantly different from the control are marked with **p ≤ 0.01, according to the Student’s t-test.
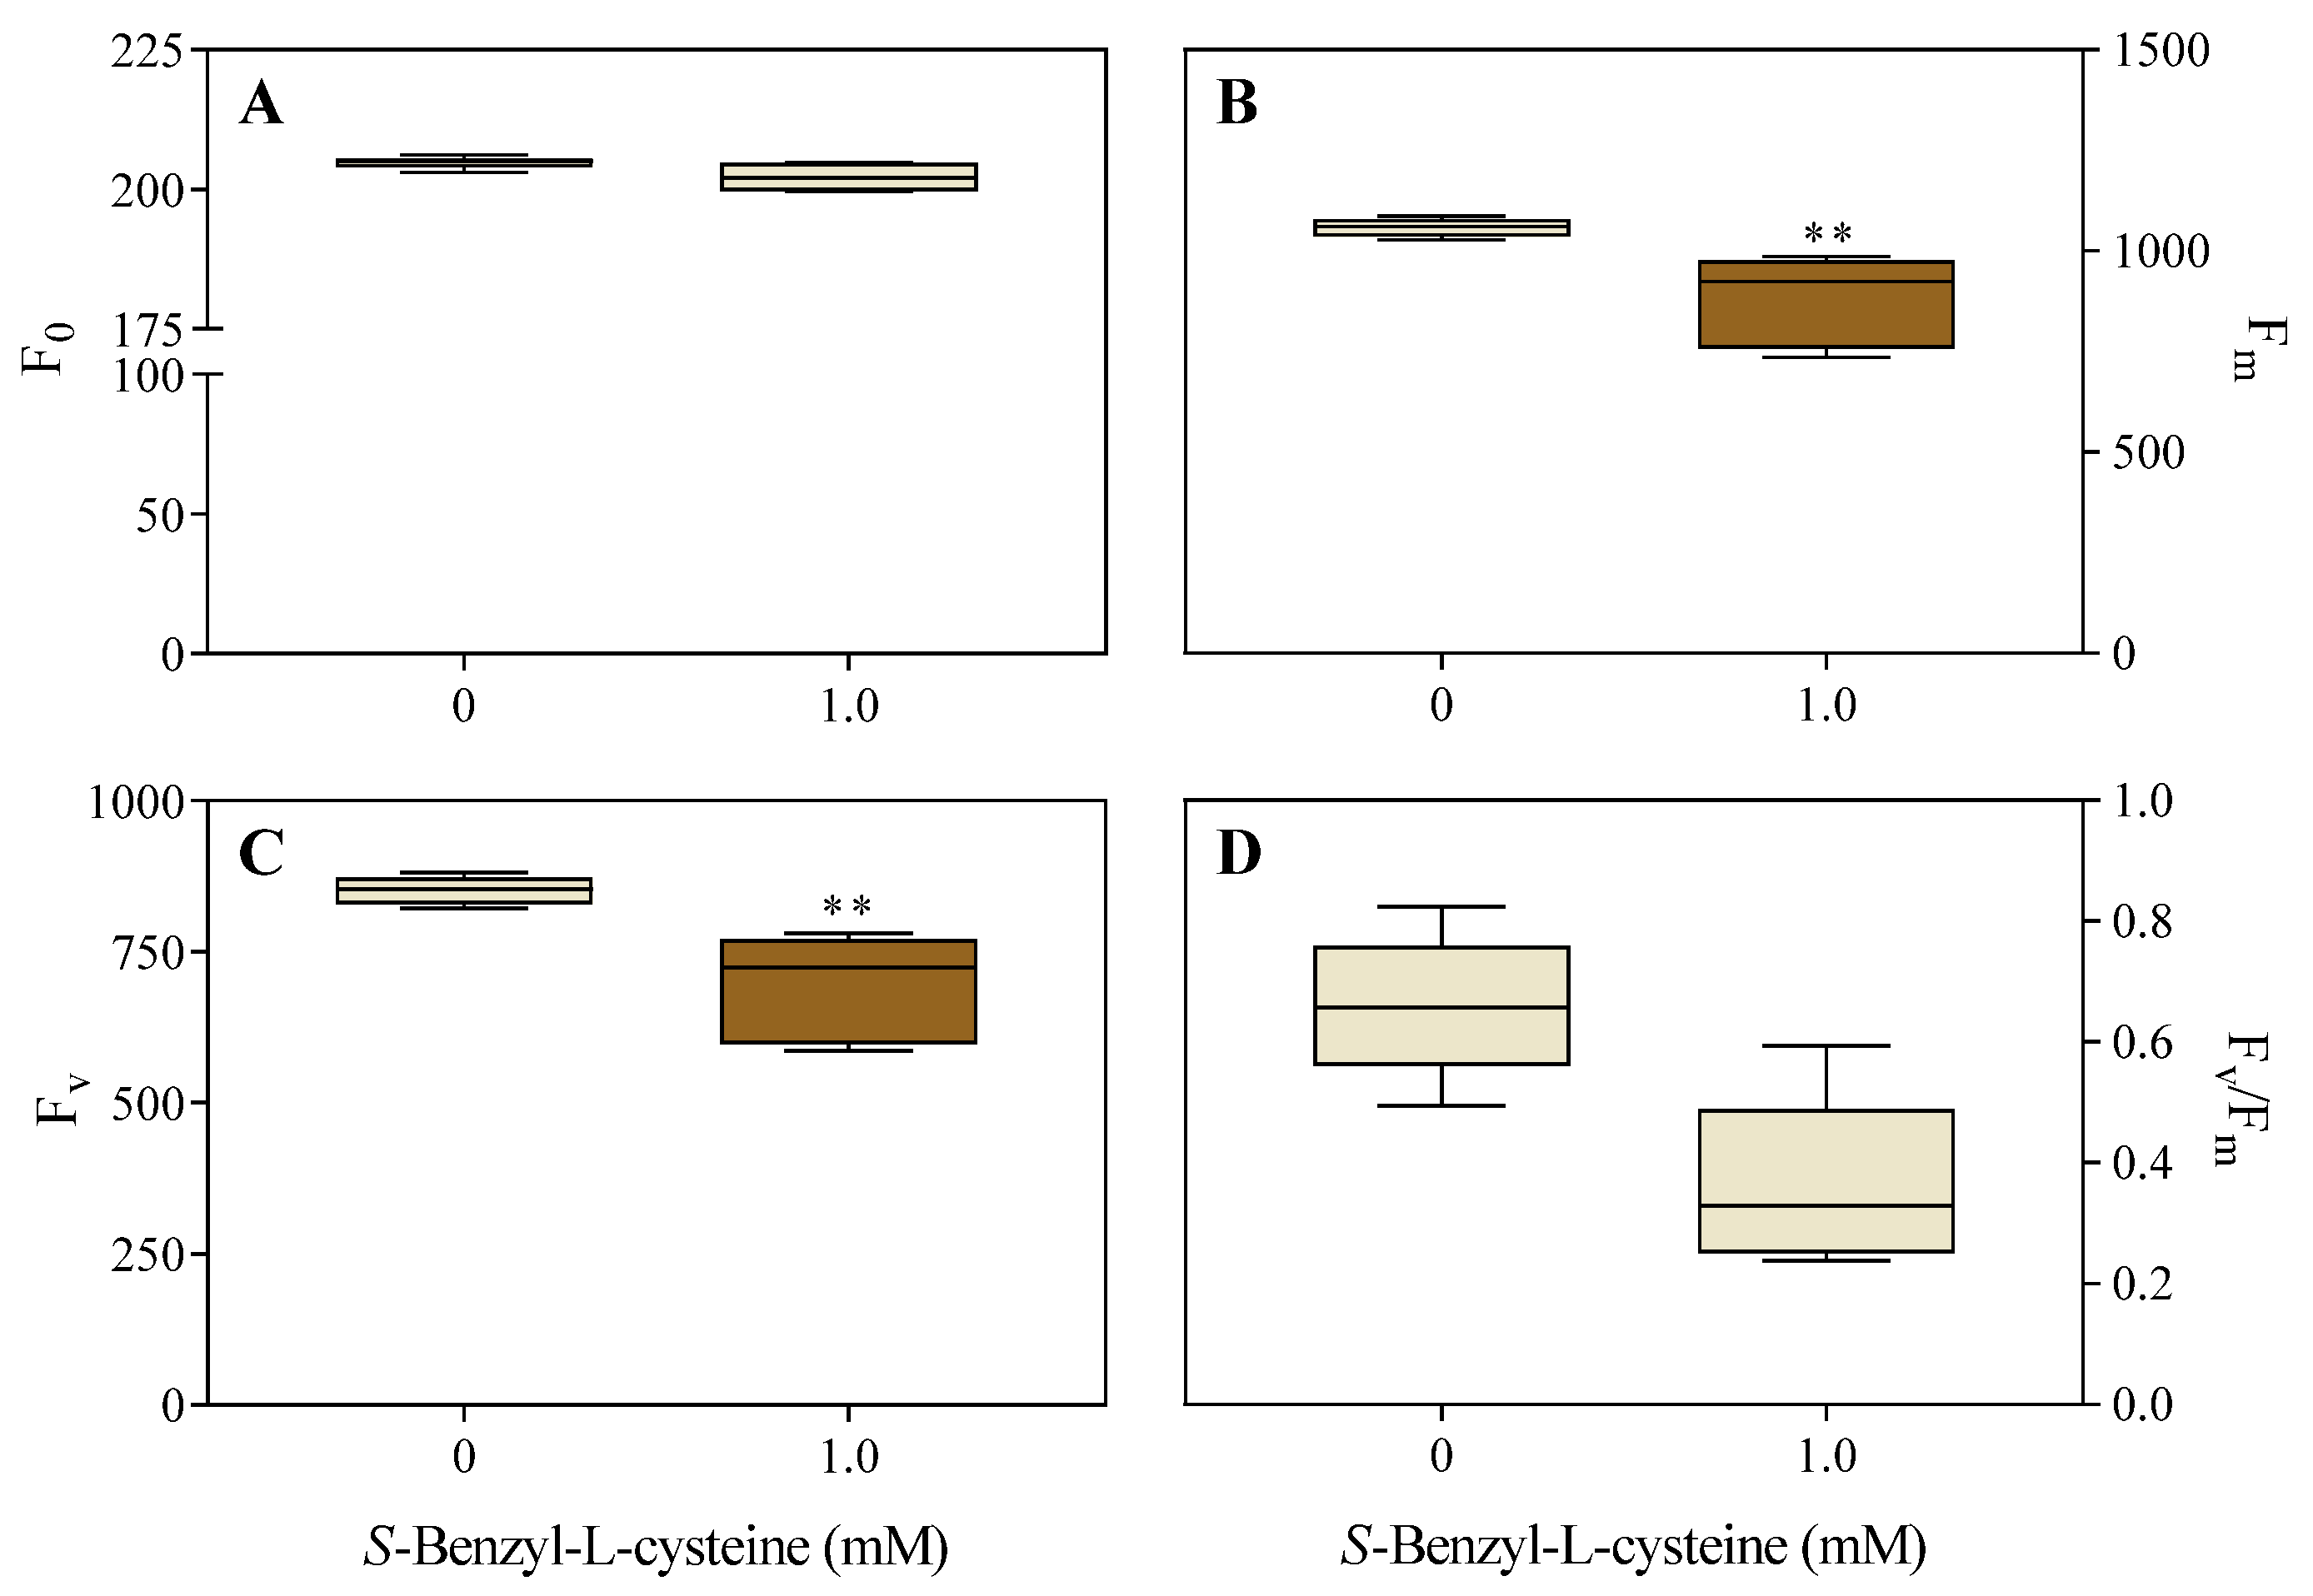
Figure 5.
Effects of 1.0 mM SBC on 14-day-old I. grandifolia plants. A, chlorophyll (SPAD index), and B, chlorophyll a fluorescence transient (OJIP curve). In B, the fluorescence levels F0, FJ, FI, and Fm are represented by points O, J, I, and P, respectively, at times of 50 µs, 2 ms, 30 ms, and tFm equal to 200 ms (peak at 650 nm). Mean values (n = 8 ± SEM for A; n = 10 ± SEM for B) significantly different from the control are marked with *p ≤ 0.05, **p ≤ 0.01, and ***p ≤ 0.001, according to the Student’s t-test.
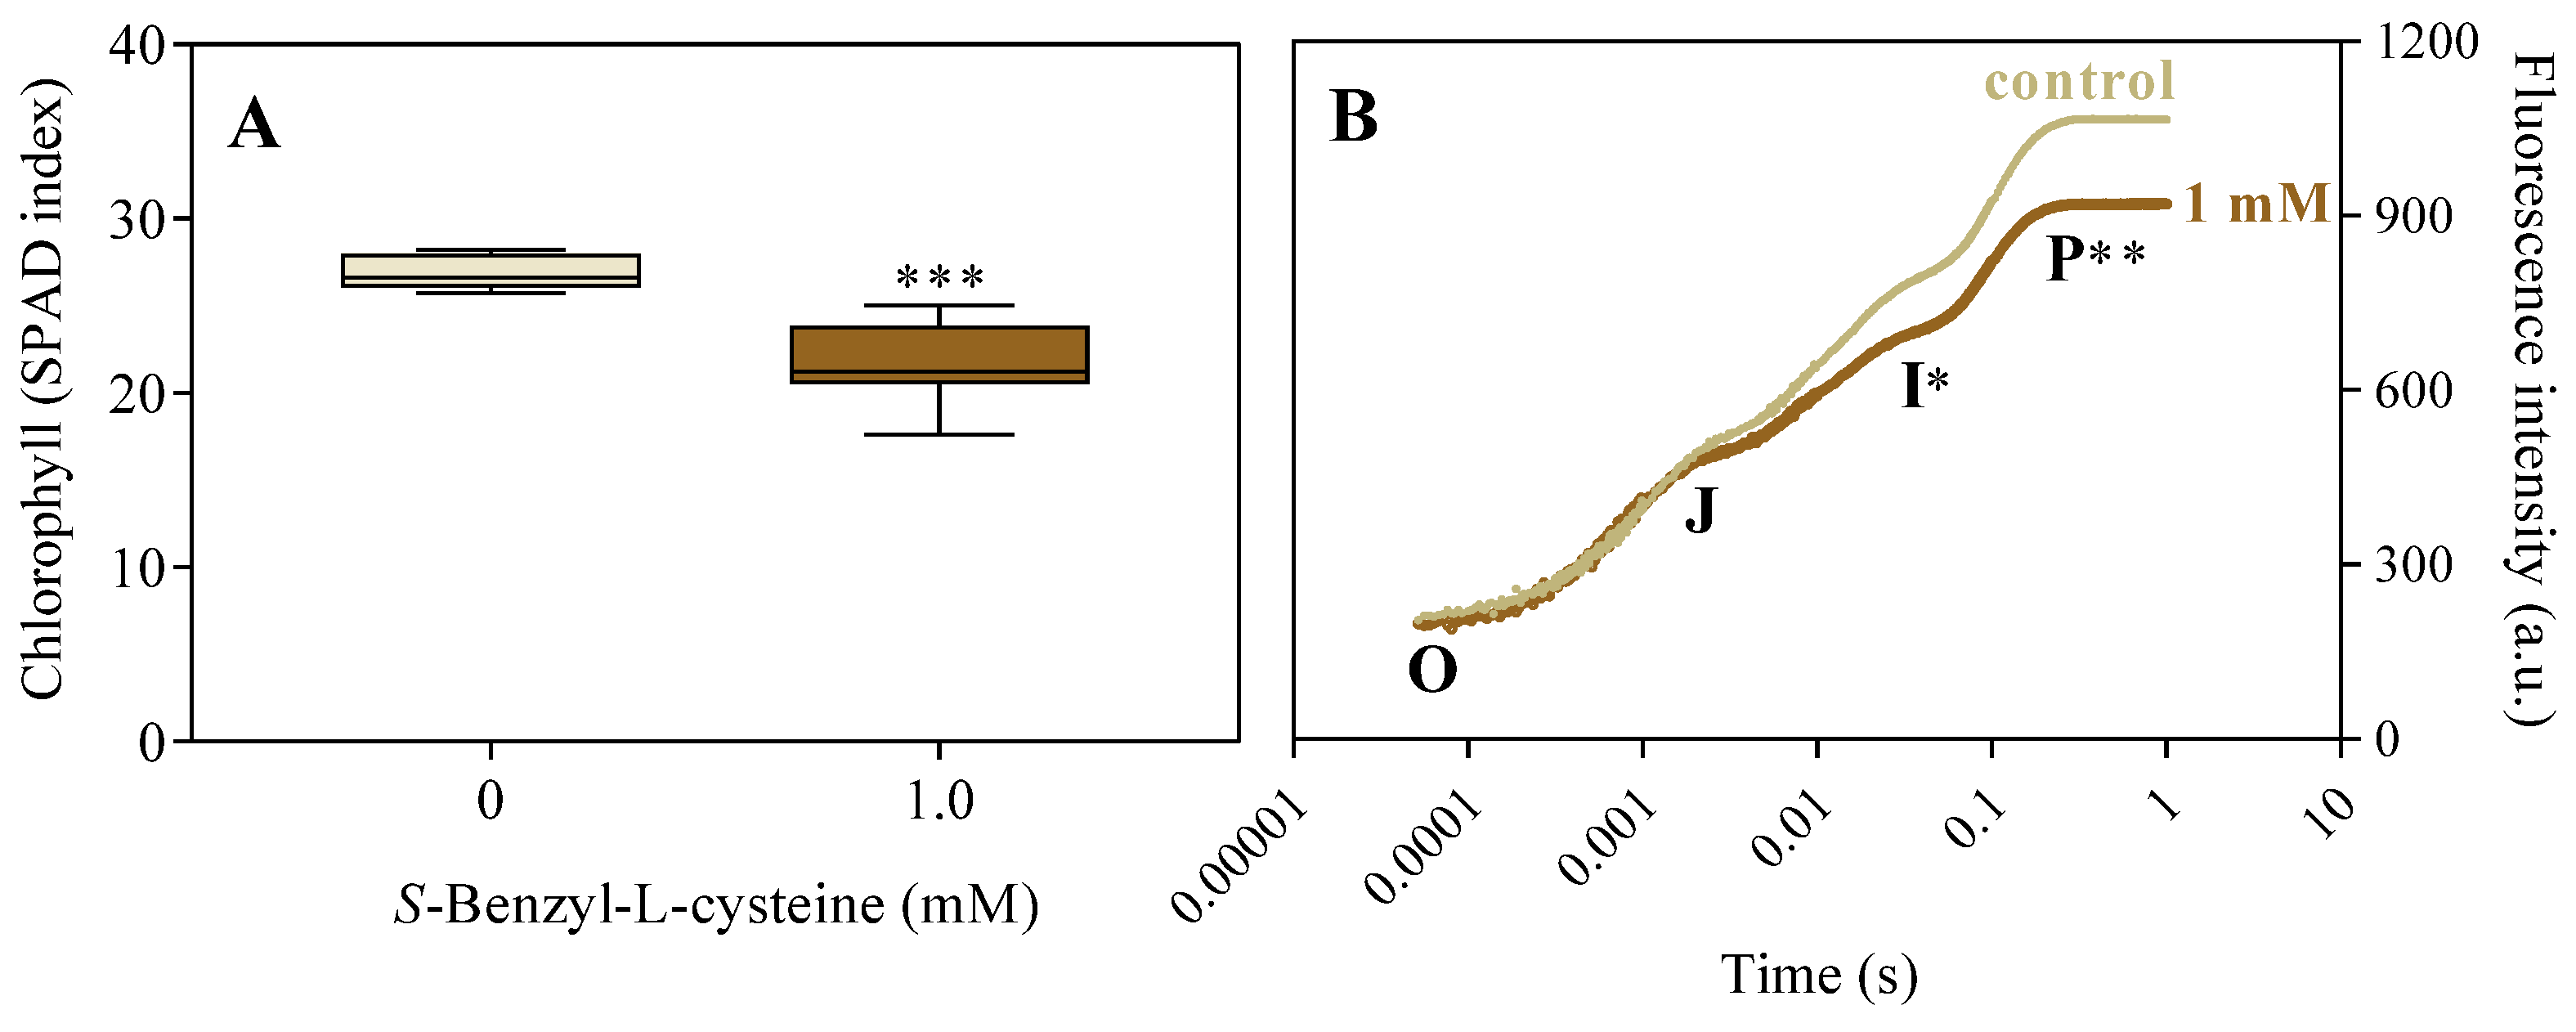

Table 1.
Effects of 1.0 mM SBC on length, fresh mass, and dry mass of roots, stems, and leaves of I. grandifolia plants grown for 14 days.
Table 1.
Effects of 1.0 mM SBC on length, fresh mass, and dry mass of roots, stems, and leaves of I. grandifolia plants grown for 14 days.
| SBC (mM) | Root | Stem | Leaf | |
|---|---|---|---|---|
| Length (cm) | 0 | 21.22 ± 0.97 | 6.02 ± 0.67 | 5.60 ± 0.16 |
| 1.0 | 14.87 ± 1.10* | 3.42 ± 0.21* | 4.02 ± 0.19* | |
| Fresh mass (g) | 0 | 0.36 ± 0.02 | 0.30 ± 0.02 | 0.79 ± 0.05 |
| 1.0 | 0.16 ± 0.02* | 0.12 ± 0.01* | 0.34 ± 0.03* | |
| Dry mass (g) | 0 | 0.02 ± 0.001 | 0.02 ± 0.002 | 0.10 ± 0.007 |
| 1.0 | 0.01 ± 0.001* | 0.01 ± 0.001* | 0.05 ± 0.004* |
Values (n = 10 ± SEM) significantly different from the control (p ≤ 0.05, Student’s t-test) are marked *.
Table 2.
Effects of 1.0 mM SBC on the levels of reactive oxygen species, conjugated dienes, and malondialdehyde and the activities of superoxide dismutase, catalase, and peroxidase of roots and leaves of I. grandifolia plants grown for 14 days.
Table 2.
Effects of 1.0 mM SBC on the levels of reactive oxygen species, conjugated dienes, and malondialdehyde and the activities of superoxide dismutase, catalase, and peroxidase of roots and leaves of I. grandifolia plants grown for 14 days.
| SBC (mM) | Root | Leaf | |
|---|---|---|---|
| Reactive oxygen species | 0 | 0.40 ± 0.068 | 4.40 ± 0.543 |
| (fluorescence μg−1) | 1.0 | 0.62 ± 0.035* | 6.61 ± 0.623* |
| Conjugated dienes | 0 | 1.79 ± 0.042 | 5.24 ± 0.414 |
| (μmol g−1) | 1.0 | 2,89 ± 0.163* | 9.27 ± 0.639* |
| Malondialdehyde | 0 | 1.90 ± 0.067 | 19.7 ± 2.041 |
| (nmol g−1) | 1.0 | 2.48 ± 0.055* | 21.9 ± 1.707 |
| Superoxide dismutase | 0 | 0.01 ± 0.001 | 0.06 ± 0.004 |
| (U mg−1) | 1.0 | 0.01 ± 0.002 | 0.05 ± 0.003 |
| Catalase | 0 | 0.02 ± 0.004 | 0.13 ± 0.006 |
| (μmol min−1 mg−1) | 1.0 | 0.03 ± 0.004 | 0.14 ± 0.006 |
| Peroxidase | 0 | 0.10 ± 0.011 | 0.12 ± 0.018 |
| (μmol min−1 g−1) | 1.0 | 0.13 ± 0.003* | 0.16 ± 0.027 |
Values (n = 8 ± SEM) significantly different from the control (p ≤ 0.05, Student’s t-test) are marked *.
Disclaimer/Publisher’s Note: The statements, opinions and data contained in all publications are solely those of the individual author(s) and contributor(s) and not of MDPI and/or the editor(s). MDPI and/or the editor(s) disclaim responsibility for any injury to people or property resulting from any ideas, methods, instructions or products referred to in the content. |
© 2024 by the authors. Licensee MDPI, Basel, Switzerland. This article is an open access article distributed under the terms and conditions of the Creative Commons Attribution (CC BY) license (http://creativecommons.org/licenses/by/4.0/).
Copyright: This open access article is published under a Creative Commons CC BY 4.0 license, which permit the free download, distribution, and reuse, provided that the author and preprint are cited in any reuse.


