
Submitted:
06 July 2024
Posted:
09 July 2024
You are already at the latest version
Abstract
In order to explore the yield-increasing mechanism of mechanized potato planting with corn straw mulching, a two-year ( 2021 and 2022 ) field experiment was conducted to study the effects of mechanized no-tillage with straw mulching on potato yield and water use efficiency. This experiment included corn straw mulching potato mechanized no-tillage planting ( JG ), plastic film mulching ( HM ) and open flat planting ( CK ). The results showed that mechanical no-tillage with straw mulching had significant effects on soil water content, yield and water use efficiency in 0-100 cm soil layer (p< 0.05). There was no significant difference in yield between JG and HM, but it was significantly higher than that of CK. The yield of JG was 3.09 %~12.27 % higher than that of CK. The yield increase was mainly achieved by increasing the potato weight per plant ( 0.697 ~ 0.862** ) and the average single potato weight ( 0.048 ~ 0.631 ). The tuber weight per plant was positively correlated with the plant height at seedling stage ( 0.03 ~ 0.92** ), and positively correlated with the dry weight of stems and leaves at tuber expansion stage and starch accumulation stage ( 0.74** ~ 0.95**). It was negatively correlated with the number of branches at tuber formation stage ( -0.33 ~ -0.88** ). Compared with CK, JG could significantly improve the water use efficiency of potato and reduce the water consumption during the whole growth period of crops. In 2021, JG was 6.5 % higher than CK, and HM was 6.88 % lower than CK. In 2022, JG and HM increased water use efficiency by 26.17 % and 14.50 % compared with CK. It can be seen that JG is a green and efficient mechanized potato cultivation technology suitable for dry farming areas.
Keywords:
potato no-tillage sowing
; soil moisture content
; agronomic index
; mechanism of production increasing
1. Introduction
Potato is one of the main staple crops in China [1], it is also one of the main staple crops in Gansu Province of China. The potato planting area in this area is large, with an annual planting area of about 680,000 hm2 [2]. However, the yield of potato is 17.43 t/hm2 [2], which is 1.58 t/hm2 lower than the average yield of potato in the world [2]. The main causes of low and unstable potato yields in the region are attributed to drought, water scarcity, and the uneven seasonality of precipitation. In order to improve water retention and irrigation conditions for crops and enhance agricultural productivity in the area, researchers have proposed a novel cultivation technique known as strip mulching with straw for potato cultivation [3].
This technique involves dividing the surface into planting strips and covering strips, each 60 cm wide, arranged alternately. Extensive research indicates that strip mulching with straw can regulate soil temperature [4,5,6,7], improve soil structure and fertility [8,9], and enhance potato yields [10,11]. However, the current technology involves manually removing the surface corn straw, followed by farmland tillage and fertilization. Then, the straw is manually covered on the surface according to the arrangement of the 60 cm wide planting and covering belts. Finally, potato planting is completed by manual dibbling. This process is labor-intensive and inefficient, which seriously affects the large-scale promotion and application of the technology.
Mechanized seeding equipment is essential for promoting the widespread application of advanced technologies. In response, our project team, based on previous research on strip mulching with straw for potato cultivation, proposed a mechanized no-tillage planting mode for potatoes with year-round straw cover in the arid regions of Northwest China. We designed a no-tillage potato seeding machine for dryland corn straw mulch cover [12] (ZL 2023 2 0852451.2), capable of completing tasks such as straw separation, deep loosening, fertilization, seeding, and soil covering and compacting in a single operation.
At present, the research on the yield effect of potato no-tillage cultivation is mainly focused on the artificial cultivation of straw mulching. There is no research on the mechanical equipment of straw mulching potato no-tillage, and the no-tillage method has not yet been mechanized. The research on no-tillage machinery and equipment mainly focuses on small grain crops such as wheat and corn. The agronomic requirements of potato planting require deep planting and loose soil environment, which is quite different from the agronomic requirements of wheat and corn planting. It is not clear whether straw mulching potato mechanized no-tillage planting can improve soil moisture environment and increase potato yield. Therefore, based on the self-developed dryland corn straw mulching potato no-tillage planter, according to the local potato conventional planting mode, three treatments of straw mulching potato mechanized no-tillage (JG), plastic film mulching (HM) and traditional conventional planting (CK) were set up according to the local potato conventional planting mode, and the traditional conventional planting was used as the control. The soil moisture, agronomic indexes and yield of potato in the key growth period were measured. The statistical analysis method was used to study the yield-increasing mechanism of straw mulching potato mechanized no-tillage planting, and to explore the yield-increasing mechanism of straw mulching potato mechanized no-tillage, so as to provide theoretical guidance for the popularization and application of this technology.
2. Materials and Methods
2.1. General Situation of Test Site
The experiments were conducted from June to October 2021 at the field trial base of Taoyang Town, Taohe Tractor Co., Ltd., Lintao County, Gansu Province, and from June to October 2022 at the dryland agricultural experimental base in Pingxiang Town, Tongwei County, Gansu Province. The Lintao trial base is located at 103°29′E, 35°03′N, with an elevation of 1890m. It experiences a temperate continental climate, with an average annual temperature of 7°C, a frost-free period of 150 days, and an average annual rainfall of 538.5mm. Over 70% of the rainfall occurs during the months of July, August, and September, with uneven distribution throughout the rainy season. In 2021, the total annual rainfall was 440.9mm, with an effective rainfall during the potato growing season of 317.2mm, accounting for 71.9% of the total annual rainfall. The Tongwei trial base is located at 35°11′N, 105°19′E, with an elevation of 1760m. It has a semi-arid climate with a temperate zone, an average annual temperature of 7.2°C, and a frost-free period ranging from 120 to 170 days. The average annual rainfall is 390.7mm, with uneven distribution throughout the rainy season. In 2022, the total annual rainfall was 309.22mm, with an effective rainfall during the potato growing season of 211.45mm, accounting for 68.4% of the total annual rainfall. The soil in the experimental area is classified as loess soil, with an average bulk density of 1.25 g/cm³ in the 0-30cm soil layer. The soil components (0–100 cm) at the tongwei County are as follows: total N: 0.53g/kg, available P: 4.91 mg/kg, available K: 183.46 mg/kg, soil organic matter 8.50 g/kg, and pH is 8.73. The monthly rainfall and average temperature of the two test bases during the test are shown in Figure 1. The rainwater is naturally infiltrated, and the rainwater infiltration of the plastic film mulching treatment is realized by the dibbling hole and the plastic film uncovered strip between two ridges.
2.2. Experimental Design
The potato variety ‘Longshu 7’ commonly planted in dryland areas of Gansu Province (Tongwei County and Lintao County) was selected in the experiment. For the mulch covering, locally available black plastic mulch with a width of 120 cm and a thickness of 0.01 mm was utilized. Three treatments were established: plastic mulch covering (HM), mechanized no-tillage potato planting with straw mulch covering (JG), and traditional conventional planting (control, CK). Each treatment was replicated three times, resulting in a total of nine experimental plots. The plots were arranged randomly in blocks, with each plot covering an area of 100 m2. The length and width of the plot is 16.67 m × 6 m.
The treatment mode of traditional conventional planting (CK) was as follows: the straw was removed from the field when the corn was harvested, and the soil was prepared and fertilized by rotary tillage 7 days before the potato sowing in the spring of the next year. When sowing, the artificial hole sowing method was used in the field flat planting with equal row spacing, and the row spacing was 60 cm. The planting pattern and actual growth diagram of CK treatment test is shown in Figure 2a,d.
The mode of the mechanical no-tillage planting with straw mulching (JG) treatment was as follows: after the previous corn harvest, the straw is left in the field without any treatment. In the next year, the straw was chopped and returned to the field during the potato planting season. Then, the self-developed dryland corn straw mulching potato no-till planter was used to complete the ditching, fertilization, sowing and soil covering and pressing operations at one time, with a row spacing of 60 cm. The planting pattern and actual growth diagram of JG treatment test is shown in Figure 2b,e.
The mode of the plastic film mulching treatment (HM) was as follows: the straw was removed from the field when the corn was harvested, and the soil was prepared by rotary tillage 7 days before the potato was sown in the spring of the next year. When sowing, the ridge and film mulching machine was used to ridge and film in the field. The width of the ridge surface was 80 cm, the width of the furrow was 40 cm, and the gap between the inner membrane of the furrow was 5 cm wide as the seepage zone. The artificial hole sowing method was used to plant on the ridge. Each ridge was planted with 2 rows and the row spacing was 60 cm. The planting pattern and actual growth diagram of HM treatment test is shown in Figure 2c,f.
2.3. Field Management
For the three treatment modes, the planting density was 55500 plants / hm2. The fertilizers were diammonium phosphate and urea, which were commonly used in potato planting. The amount of fertilizer was uniformly applied at 180 kg/hm2 of nitrogen (N) and 150 kg/hm2 of phosphorus pentoxide (P2O5), applied uniformly in one application (no additional fertilization later). The HM treatment mode also adds ridging, film mulching and manual dibbling operations after soil preparation. In addition to the timely release of seedlings under plastic film mulching, other production management methods were consistent with the production habits of local farmers. Sowing takes place on June 3rd, with harvest on October 17th in 2021, and sowing on June 8th, with harvest on October 18th in 2022.
2.4. Determination Items and Methods
2.4.1. Growth Index
In the key growth period of potato (seedling, tuber formation, tuber enlargement, starch accumulation, and harvest), five plants were randomly selected for plant height, stem and leaf quality and tuber quality measurement. Plant height is measured as physiological height, which is the distance from the base of the aboveground stem to the growing point. The straw mass refers to the total mass of aboveground stems and leaves, while the tuber yield represents the total mass of tubers with a diameter greater than 1 cm. After the weight of straw and tubers was weighed, the straw and tubers were placed in an oven at 105 °C for 30 min according to the drying method in Reference [13], and then dried at 85 °C for 24 h to obtain the dry weight of straw and tubers.
2.4.2. Soil Moisture
(1) In the key growth period of potato (seedling, tuber formation, tuber enlargement, starch accumulation, and harvest), soil samples were taken from five soil layers of 0 ~ 20cm, 20 ~ 40cm, 40 ~ 60cm, 60 ~ 80cm and 80 ~ 100cm with soil drills in each plot, respectively. Soil sample using a 50 mm diam steel-core sampling drill, which was manually driven. The soil moisture content of each growth period was measured by drying method (drying at 105 ± 2 °C for more than 24 h). The soil moisture content is calculated by the following formula:
Soil water content (%) = (Weight of wet soil and aluminum box-Weight of dry soil and aluminum box)/(Weight of dry soil and aluminum box-Weight of empty aluminum box)×100%.
(2) Calculation of soil water storage capacity
The selected experimental farmland had smooth terrain, deep soil layers, uniform soil texture, and a relatively deep groundwater level, with no irrigation system in place. The water required for potato growth was entirely dependent on rainfall. The formula used to calculate soil water storage capacity is as follows:
W=h×ρ×ω×10
Where: W is soil water storage capacity (mm); h is the depth of soil layer (cm); ρ is soil bulk density (g/cm3); ω is the soil mass moisture content (%).
(3) Calculation of crop water consumption
Field experiments were carried out under dry and non-irrigated conditions during the growing season. The groundwater level in the test area is maintained at about 50 m below the surface, so the upward flow into the root system can be ignored. Because the test area is dry and flat terrain, surface runoff and drainage are not significant, drainage can be ignored, crop water consumption can be calculated according to the following formula:
ET= (W1-W2)+P
Where: ET is the water consumption during the growth period, including plant transpiration and surface evaporation (mm); W1 and W2 are the soil water storage capacity (mm) before sowing and after harvesting respectively; P is the effective rainfall (mm) of crop growth period ≥ 5 mm, it is effective rainfall(mm) recorded at the weather station near the experimental site.
2.4.3. Yield and Yield Water Use Efficiency
When the potato was harvested, 15 randomly selected plants are taken from each plot for tuber sampling. According to the literature [14], the weight was divided into three grades: > 100g for large potato, 50 ~ 100g for medium potato, < 50g for small potato. The number of tubers in each grade is recorded, and they are weighed accordingly. This data is used for yield composition analysis and to calculate the commercial potato rate.
Commercial potato rate (%) = (Yield of single potato above 50 g / Total potato yield) ×100%
Average single potato weight (g) = Potato weight per plant at harvest / Number of tubers per plant
At harvest, the potato excavation was completed manually, and the actual yield is measured separately for each plot. The average of three repeated measurements is taken, and then converted to hectare yield.
Yield water use efficiency: WUE=Y/ET
Where WUE is the yield water use efficiency, kg/(mm·hm2); Y is the fresh yield of potato tuber, kg/hm2.
2.5. Statistical Analysis
Excel 2007 software was used for data processing and mapping. SPSS 20.0 statistical analysis software was used for analysis of variance and correlation. Analysis of variance was performed on all data collected each year. In addition, the correlation analysis between potato yield and yield components, yield components and growth indicators, growth indicators and soil moisture was also carried out.The mean values between treatments were compared by a Fisher’s least significant differences (LSD) at p<0.05.
3. Results and Analysis
3.1. Yield Effect of Mechanized No-Tillage with Straw Mulching
Table 1 shows potato yield and yield components under the three treatment modes. Table 1 shows that the effects of treatments on yield and yield components are significantly different (p < 0.05). Compared with CK, JG significantly increased potato yield by 3.09 % ~ 12.27 %. The yield increase of HM treatment was inconsistent with that of CK in two years. The yield of HM was 8.31 % lower than that of CK in 2021 and 13.09 % higher than that of CK in 2022. The main reason is that the test is set in Lintao, Gansu Province in 2021. The soil is sticky and heavy (Soil bulk density 1432 kg / m3), and there is more rainfall after sowing. The soil on the surface of the plastic film is hardened, which affects the emergence of potato. The emergence rate is 66%. The artificial transplanting method ensures that the test reaches the planting density, and the growth is slow after replanting, which affects the yield of potato. The yield difference between JG and HM was significant in 2021 (p < 0.05), and JG increased potato yield by 11.06 % compared with HM. There was no significant difference between JG and HM in 2022(p > 0.05).
Based on the analysis of the components of yield, it can be observed that HM and JG significantly increased the individual tuber weight compared to CK. The number of tubers per plant showed inconsistent results across the two years of experimentation. In 2021, HM significantly increased the average tuber weight compared with CK and JG. From the perspective of coefficient of variation, each treatment had the greatest impact on the average tuber weight in 2021, followed by the tuber weight per plant. In 2022, each treatment had the greatest impact on the number of tubers per plant, followed by the weight of tubers per plant.
In 2021, compared with JG, HM significantly increased the number of large and medium-sized potatoes and the yield of commercial potatoes. In 2022, compared with CK, both HM and JG significantly increased the commercial potato rate. There was no significant difference in commercial potato rate between HM and JG. The commercial potato rate of HM and JG were 2.87% ~ 4.16% and 1.3 % ~ 2.84% higher than those of CK, respectively.
3.2. Effect of Mechanized No-Tillage with Straw Mulching on Yield Water Use Efficiency
The water consumption and water use efficiency during the growth period under different cultivation methods are shown in Table 2. It can be seen from Table 2 that the water consumption and yield water use efficiency of the three treatments in the whole growth stage of potato were significantly different (p<0.05). JG can significantly improve the water use efficiency of potato and reduce the water consumption in the whole growth stage of crops. In 2021, JG significantly increased water use efficiency compared with HM and CK (p<0.05). HM significantly reduced water use efficiency of yield, JG was 6.5 % higher than CK, and HM was 6.88 % lower than CK. In 2022, compared with HM and CK, JG significantly reduced crop water consumption during the whole growth period and increased yield water use efficiency. Compared with HM and CK, JG reduced water consumption during the whole growth period by 29.52 mm and 36.56 mm, and increased water use efficiency by 26.17 % and 14.50%, respectively. This indicates that JG can improve both the yield and water use efficiency of potatoes compared to HM and CK.
3.3. Effect of Mechanized No-Tillage with Straw Mulching on Soil Moisture Content
3.3.1. Average Soil Moisture Content in 0 ~ 100 cm Soil Layer during the Whole Growth Period
The average soil moisture content in the 0 ~100cm soil layer during the entire growth period is shown in Figure 3. It is evident from Figure 3 that significant differences exist in soil moisture content among the different treatments throughout the entire growth period. In both experimental years, there was no significant difference between HM and JG (p > 0.05), but both were significantly higher than CK. In 2021, HM and JG were 0.51 and 0.41 percentage points higher than CK, respectively. In 2022, HM and JG were 0.91 and 1.30 percentage points higher than CK, respectively.
3.3.2. Average Soil Moisture Content in 0 ~ 100 cm Soil Layer at Different Growth Stages
The variation of the average soil moisture content in the 0 ~100cm soil layer during different growth stages is depicted in Figure 4. It is evident from Figure 4 that the trend of changes in the average soil moisture content in the 0 ~100cm soil layer remains relatively consistent across all three treatments as the growth progresses, with HM and JG generally higher than CK. However, the water storage and moisture retention effects of HM and JG differ. In 2021, before the tuber formation stage, JG was higher than HM, but during the tuber enlargement and starch accumulation stages, it was lower than CK. Significant differences between treatments were observed at the tuber formation stage (July 27th) and tuber enlargement stage (August 29th), with the maximum difference between treatments reaching 1.98 percentage points at the tuber formation stage (July 27th). In 2022, both HM and JG had higher soil moisture content compared to CK, with JG having the highest soil moisture content at the harvest stage, being 2.27% higher than CK. JG was significantly higher than CK after the tuber enlargement stage, with the greatest difference observed at the harvest stage, being 1.55% higher than HM. Significant differences were observed between treatments at each growth stage, with the largest difference occurring at the harvest stage (October 17th), reaching 2.27%.
The average soil moisture content in the 0 ~100cm soil layer during different growth stages is summarized in Table 3. It can be observed from Table 3 that in both experimental years, the tuber formation stage had a significant impact on soil moisture content across treatments, with differences ranging from 1.98% to 3.36%. In 2021, the starch accumulation stage had minimal impact on soil moisture content across treatments, with a difference of 0.23%. In 2022, the seedling stage had a relatively small impact on soil moisture content across treatments, with a difference of 0.63 percentage points. The coefficients of variation for HM, JG, and CK treatments during the growth stages were 7.66%, 11.29%, and 9.42% in 2021, respectively, and 6.20%, 5.40%, and 8.27% in 2022, respectively. This indicates that mechanical no-tillage with straw mulching exacerbated changes in soil moisture content during different growth stages in 2021 compared to plastic film mulching and conventional open-field planting. However, it dampened the changes in soil moisture content during different growth stages in 2022.
3.3.3. Average Soil Moisture Content in Different Soil Layers during the Whole Growth Period
The variation trend of average soil moisture content with soil layer from shallow to deep is shown in Figure 5. It is evident from Figure 5 that the impact of different treatments on the average soil moisture content during the entire growth period at different soil layer are significantly different (p < 0.05). The trend of average soil moisture content in different soil layers during the entire growth period generally shows a decreasing trend followed by an increasing trend with increasing soil depth, except for HM in 2021. In all treatments, the average soil moisture content is lower in the 60cm soil layer during the entire growth period. HM and JG increased the soil moisture content in each soil layer compared to CK (except for the 20cm soil layer in 2021 for HM). In 2021, HM showed the greatest increase in soil moisture content in the 60cm soil layer, reaching 2.08 percentage points. In 2022, JG significantly increased the average soil moisture content during the entire growth period in the 20cm and 40cm soil layers compared to HM, with the greatest increase observed in the 20cm soil layer, reaching 1.51 percentage points.
The average soil moisture content in different soil layers during the entire growth period of potatoes is presented in Table 4. From Table 4, it can be observed that the coefficients of variation for soil moisture content vary across different soil layers in both experimental years. In 2021, the largest variation in soil moisture content between soil layers during the entire growth period was observed in the 60 cm soil layer, with a difference of 2.08 percentage points. In 2022, the greatest variation occurred in the 20 cm soil layer, with a difference of 2.38 percentage points. Across soil layers, in 2021, the CK treatment exhibited the greatest variation in soil moisture content between layers during the entire growth period, with a difference of 3.52 percentage points. In contrast, in 2022, the JG treatment showed the greatest variation, with a difference of 3.05 percentage points.
3.3.4. Temporal and Spatial Variation of Soil Moisture Content
The vertical variation trend of soil moisture content in the 0 ~100cm soil layer during different growth stages and treatments is illustrated in Figure 6. From Figure 6, it can be observed that there were significant differences between different growth periods and different soil layers (p<0.05). In general, the difference between the treatments was the largest in the 80 cm soil layer at the harvest stage, with a difference of 4.08 % in 2021 and 3.11 % in 2022. Among the soil layers, JG had the largest difference in the tuber formation period in 2021, with a difference of 9.01 %, and CK had the largest difference in the tuber formation period in 2022, with a difference of 6.30 %. During the growth period, CK had the greatest difference in 20cm soil layer in 2021, with a difference of 9.26 %, and CK had the greatest difference in 80cm soil layer in 2022, with a difference of 4.58 %.
The variation coefficient and range of soil moisture content in different growth stages of each treatment are summarized in Table 5. From Table 5, it can be observed that in 2021, the coefficient of variation between soil layers was highest for JG during the tuber formation stage (CV=23.24%) and lowest for CK during the starch accumulation stage (CV=6.25%). This indicates that JG exacerbated the variation in soil moisture content between soil layers during the tuber formation stage compared to HM and CK, while CK suppressed the variation in soil moisture content between soil layers during the starch accumulation stage compared to HM and JG. In 2022, the coefficient of variation was highest for CK during the tuber formation stage (CV=16.32%) and lowest for HM during the seedling stage (CV=4.39%). This suggests that CK exacerbated the variation in soil moisture content between soil layers during the tuber formation stage compared to HM and JG, while HM suppressed the variation in soil moisture content between soil layers during the seedling stage compared to JG and CK.
3.3.5. Effect of Mechanized No-Tillage with Straw Mulching on Water Consumption of Potato
The stage water consumption and its proportion to the total water consumption for different treatments in the two experimental years are shown in Table 6. It can be observed from Table 6 that there are significant differences in water consumption among the three treatments at each growth stage (p < 0.05). The influence of each treatment on water consumption at different growth stages varies between the two experimental years. In 2021, JG had the highest proportion of water consumption from the seedling stage to the tuber formation stage, reaching 36.47%, while HM had the lowest proportion of water consumption from the tuber formation stage to the tuber enlargement stage, accounting for only 7.46% of the total. In 2022, HM had the highest proportion of water consumption from sowing to the seedling stage, reaching 37.15%, while JG had the lowest proportion of water consumption from the starch accumulation stage to the harvest stage, accounting for only 2.23% of the total.
Throughout both growing seasons, JG had lower total water consumption compared to CK, averaging 20.43mm lower than CK. HM showed inconsistent performance in the two experimental years, being 5.44mm lower than CK in 2021 and 7.04mm higher than CK in 2022.
3.4. Potato Growth Index
The effect of mechanized no-tillage sowing of straw-covered potato on growth indicators is shown in Table 7. Each treatment had significant effects on plant height, branch number and dry weight of stems and leaves in 2 years (p < 0.05). Compared with HM and CK, JG significantly increased plant height by 4 ~ 7.2 cm and 2.8 ~ 8.9 cm at tuber formation stage, and decreased branch number by 2.5 ~ 3.9 and 1.3 ~ 5.9. There was no significant difference in dry weight of stems and leaves between JG and HM at late growth stage, but it was significantly higher than that of CK. In 2021, the dry weight of stems and leaves had the greatest difference at harvest stage, and JG was 1.69 g and 15.72g higher than HM and CK. In 2022, the dry weight of stems and leaves had the greatest difference at starch accumulation stage, and JG was 34.5 g and 0.1 g higher than HM and CK. It can be seen from the coefficient of variation that each treatment had the greatest influence on the number of branches and the least influence on plant height.
3.5. Formation Mechanism of Yield Difference
3.5.1. The Relationship between Yield and Its Components
The correlation analysis between potato yield and its components is shown in Table 8. It can be seen from Table 8 that the yield was significantly positively correlated with the tuber weight per plant ( 0.697 to 0.862** ), positively correlated with the average single tuber weight ( 0.048 ~ 0.631 ), significantly negatively correlated with the number of tubers per plant (-0.865 to -0.877**), and negatively correlated with the number of large and medium tubers(in 2021: -0.772*, in 2022: -0.327). The results showed that under different mulching treatments, increasing yield was achieved by increasing tuber weight per plant and average tuber weight, and reducing the number of tubers per plant and the number of large and medium tubers.
3.5.2. Relationship between Yield Components and Growth Index
The correlation analysis between the yield components of potato and the growth index at the growth stage is shown in Table 9. From Table 9, it can be observed that individual tuber weight is positively correlated with plant height during the seedling stage (0.03 to 0.92**). However, its correlation with other indicators shows inconsistent patterns across the two experimental years. In 2021, individual tuber weight is significantly positively correlated with stem and leaf dry weight during the tuber enlargement and starch accumulation stages (0.74** to 0.95**), but not significant in 2022. It is negatively correlated with the number of branches during the tuber formation stage (-0.33 to -0.88**). Average tuber weight is positively correlated with the number of branches (0.74* to 0.95**), stem dry weight (0.30 to 0.88**), and leaf dry weight (0.10 to 0.75**) during the seedling stage, while negatively correlated with plant height during the seedling stage (-0.18 to -0.90**) and during the tuber formation stage (-0.08 to -0.43).The number of tubers per plant is positively correlated with plant height during the tuber formation stage (0.30 to 0.84**), while negatively correlated with plant height during the tuber enlargement stage (-0.27 to -0.48) and starch accumulation stage (-0.06 to -0.66), number of branches during the tuber formation stage (-0.09 to -0.56), and tuber weight during the tuber enlargement stage (-0.23 to -0.94). The proportion of large and medium-sized tubers is positively correlated with leaf dry weight during the seedling stage (0.05 to 0.68*), but negatively correlated with plant height during the seedling stage (-0.08 to 0.19).
This indicates that plant height and stem and leaf dry weight during the seedling stage have a major influence on the constituent factors of potato yield (individual tuber weight and proportion of large and medium-sized tubers), suggesting that high yields are supported by good nutritional growth during the seedling stage.
3.5.3. Relationship between Growth Index and Soil Moisture
The correlation analysis of soil moisture content and growth index in different soil layers at different growth stages is shown in Table 10. It can be seen from Table 10 that 51 of the 90 points in the determination of soil moisture content were positively correlated with plant height (36 points were significant), 74 points were negatively correlated with branch number (48 points were significant), and 50 points were positively correlated with stem and leaf dry weight (21 points were significant). The soil moisture content in the 40 ~100cm soil layer during the seedling stage is significantly positively correlated with plant height during the seedling stage, tuber enlargement stage, and starch accumulation stage (0.66** to 0.92**). It is also positively correlated with stem and leaf dry weight during the seedling stage and starch accumulation stage (0.35 to 0.64**).
In general, under the condition of certain varieties, increasing the soil moisture content in each soil layer at each growth stage is beneficial to increase plant height and dry weight of stems and leaves, and reduce the number of plant branches. The soil moisture content below 40 cm in seedling stage had a great influence on potato growth index.
3.6. Economic Benefits of Straw Mulching Mechanized No-Tillage
Straw mulching mechanized no-tillage on potato production had higher economic benefits and output/input than CK (Table 11). JG had the highest economic benefits and output-input ratio compared with other treatments in both of years. Compared with CK, JG increased net income and output-input ratio by 10.64% and 12.68%, respectively. The net income of HM is slightly lower than that of CK, but the ratio of output to input is slightly higher than that of CK.
4. Discussion
4.1. Effect of Mechanized No-Tillage with Straw Mulching on Soil Moisture in Farmland
The research already indicates that mechanized no-tillage technology with straw mulch can enhance the soil moisture conditions throughout the entire growth period of maize [15] and potatoes [16]. Different tillage methods can improve soil moisture conditions in farmland, enhance precipitation use efficiency, and promote crop growth [17,18,19]. This experimental study demonstrates that there is no significant difference in soil moisture content between plastic film mulching and mechanized no-tillage with straw mulch (p > 0.05), but both are significantly higher than traditional conventional planting (CK) (p < 0.05) (Figure 3). This finding is consistent with the conclusions of previous studies by Hou Xianqing [20,21], Zhang Long [22], and others. The water retention and moisture conservation effects of plastic film mulching and mechanized no-tillage with straw mulch cover varied over the two experimental years. Before the tuber formation period in 2021, JG was higher than HM, while during the tuber swelling and starch accumulation period, it was lower than CK. In 2022, the soil moisture content of HM and JG during each growth period was higher than CK, with JG significantly higher than HM after the tuber swelling period, and the difference was most significant at the harvest stage, being 1.55% higher than HM (Figure 6). The main reason for the analysis is that the rainfall in the two experimental years is quite different (317.2mm in 2021 and 211.45mm in 2022). The effects of mulching and tillage methods on rainfall infiltration are different. HM is easy to stagnate in the low-lying part of the film for heavy rain and less than 5mm precipitation, which hinders water infiltration. At the same time, it increases the soil temperature during the growth period and increases the evaporation loss [23]. JG is easy to infiltrate for heavy rain [24], and reduces the soil temperature during the growth period [25], which is beneficial to reduce the soil evaporation loss [26]. It can be seen that JG has a good effect on water storage and soil moisture conservation, which is basically consistent with the research results of Song Yali et al. on the effect of straw mulching on soil moisture content of winter wheat in dryland [27].
4.2. Effect of Straw Mulching Mechanized No-Tillage on Potato Growth Index
Covering and tillage methods [28,29,30] have a significant impact on the growth indicators of potatoes. For instance, plastic film mulching can promote the nutritional growth of potatoes [31], and no-tillage with straw mulch combined with plastic film mulching significantly increases the height of potato plants [32]. Both plastic film and straw mulch cover effectively increase plant height and biomass accumulation [33]. This study showed that the increase of rainfall was beneficial to the increase of plant height, but it was not conducive to the increase of branch number. Compared with CK, JG was beneficial to increase the plant height at the tuber formation stage, increase the dry weight of stems and leaves at the late growth stage, the number of tubers per plant and the dry weight of tubers per plant, and reduce the number of branches. HM was beneficial to increase the dry weight of stems and leaves at the early growth stage. This finding is largely consistent with the experimental conclusions of Hou Xianqing et al. [31] on no-tillage and mulch-covered potato planting in the Ningnan Mountainous Area.
4.3. Effect of Mechanized No-Tillage with Straw Mulching on Yield and Water Use Efficiency
Existing studies have shown that mechanized no-tillage with straw mulching can improve the soil environment of farmland, increase crop yields, and enhance water use efficiency [34,35,36]. For instance, Zhao Hong et al. [37] found that ridge-furrow cultivation of potatoes could increase yield and water use efficiency compared to traditional flat planting, with a yield increase of up to 78.2% with double ridge-furrow covering. Zhang Pingliang’s research on different covering planting methods in the arid areas of northwest China revealed that compared with open field planting, whole film mulching ridge planting can increase potato yield (43.4% ~60.7%) and yield water use efficiency (59.4%~79.6% ) [38]. Wu Chunhua et al. [39] showed that ridge-furrow rainwater harvesting combined with mulching could significantly increase potato yield (44.8 %) and commodity potato rate (8.1 %) compared with open field planting. Zhang Long et al. [40], through research on no-tillage and deep loosening combined with straw mulching, found that different tillage measures combined with straw mulching could further increase water storage in the soil layer of 0 to 100 cm, which is beneficial for stable and high potato yields. However, some studies have found that covering planting leads to yield reduction. For example, Zhang Long et al. found that no-tillage increased soil bulk density, affecting crop root growth and hindering crop absorption of deep soil nutrients, thus affecting crop yield [41]. Li Fengmin et al. found that the warming effect of plastic film covering led to premature senescence of wheat in the later stages of growth, resulting in reduced wheat yields [42]. Gao Chuang et al. showed that moderate covering in rainfed areas is conducive to increasing wheat yields, while excessive covering leads to yield reduction [43].
The effects of mulching and tillage methods on yield and yield water use efficiency were significantly different. (p < 0.05). In 2021, the yield and water use efficiency of JG were 3.09 % and 6.5 % higher than those of CK, respectively, and the yield and water use efficiency of HM were 8.31 % and 6.88 % lower than those of CK, reaching a significant level (p < 0.05). In 2022, the yield and water use efficiency of JG and HM were 12.27 %, 13.09 % and 26.17 %, 14.50 % higher than that of CK, respectively, reaching a significant level (p < 0.05). The main reason is that the experiment is set in Lintao, Gansu Province in 2021. The soil is sticky and heavy, and there is more rainfall after sowing. The soil on the surface of the plastic film is hardened, resulting in a potato emergence rate of 66 % in HM treatment. After emergence, due to soil hardening and high temperature of plastic film mulching, potato seedling burning affected the growthof potato. At the same time, in order to ensure that the plastic film mulching planting reached the density set in the experiment, the experiment ensured the planting density of potato by artificial seedling replenishment, which seriously affected the yield and yield water use efficiency of potato. In 2022, the experiment was conducted in Tongwei, Gansu Province, where there was relatively less rainfall and loose soil. The emergence under plastic film covering was better, and the difference in yield between JG and HM was not significant but significantly higher than CK (p < 0.05). HM and JG significantly increased the tuber weight per plant compared to CK.
5. Conclusions
Compared with traditional film mulching planting and conventional planting, there was no significant difference in yield between JG and HM in two test years, but it was significantly higher than CK. The yield of JG was 3.09 % ~ 12.27 % higher than that of CK. The yield increase was mainly achieved by increasing the potato weight per plant (0.697 ~ 0.862 * *) and the average single potato weight (0.048 ~ 0.631). JG could significantly increase the yield water use efficiency of potato by 6.5% ~26.17 % compared with CK, and reduce the water consumption of crops during the whole growth period by 11.35 mm ~29.52 mm. At the same time, straw mulching mechanized no-tillage can reduce the amount of plastic film and the labor cost of soil preparation, and reduce the production cost. It is a green and efficient mechanized potato cultivation technology suitable for dry farming areas. In this study, soil moisture, agronomic indicators and yield were studied. In the follow-up study, the yield-increasing mechanism of straw-covered potato no-tillage could be studied in terms of improving soil temperature, soil structure and soil physical and chemical properties.
Author Contributions
Conceptualization, H.L.; methodology, P.L. and H.Z.; software, H.L.; validation, P.L. and F.Z.; formal analysis, P.L., W.S., X.L. and H.L.; investigation, P.L., H.L. and X.L.; resources, H.L. and F.Z.; data curation, H.L.; writing—original draft preparation, P.L.; writing—review and editing, H.L.; visualization, Y.Y. and P.H.; supervision, S.L. and P.H.; project administration, S.L.; funding acquisition, H.L. All authors have read and agreed to the published version of the manuscript.
Funding
This research was financially supported by the Public Recruitment Doctoral Research Initiative of Gansu Agricultural University in China(GAU-KYQD-2021-33), and the Research and development of agricultural machinery and equipment of Agricultural and Rural Department of Gansu Province Project (njyf2024-04-1), and the Gansu province agricultural machinery R & D and manufacturing application integration (2-2), and the Industrial Support Program of Gansu Provincial Colleges and Universities (2024CYZC-32), and Northwest Chinese herbal medicine full mechanization scientific research base construction project(2109-000000-20-01-199092).
Data Availability Statement
The data presented in this study are available on request from the corresponding author.
Conflicts of Interest
The authors declare no conflict of interest.
References
- Jie, Y. China’s potato production has ranked first in the world for many years [EB OL]. https://baijiahao.baidu.com/s?id =1776517446349324287&wfr=spider&for=pc, 2023. 09. 09.
- Li, Q.; Li, H.; Zhang, L.; Zhang, S.; & Chen, Y. Mulching improves yield and water-use efficiency of potato cropping in China: A meta-analysis. Field Crops Research. 2018, 221, 50–60.
- Wang, H.; Zhang, X.; Yu, X.; Ma, Y.; Hou, H. Effect of using black plastic film as mulch on soil temperature and moisture and potato yield[J]. Acta Ecologica Sinica. 2016, 36 (16): 5215–5226. (in Chinese with English abstract).
- Chai, S. A new technique of crop planting with straw strip mulching in rainfed area[J]. Journal of Gansu Agricultural University. 2014, 49(5): 42–42. (in Chinese with English abstract).
- Han, F.; Chang, L.; Chai, S.; Yang, C.; Cheng, H.; Yang, D.; Li, H.; Li, B.; Li, S.; Song, Y. Lan, X. Effect of straw strip covering on ridges on soil water content and potato yield under rain-fed semiarid conditions[J]. Chinese Journal of Eco-Agriculture. 2016, 24(7): 874–882. (in Chinese with English abstract).
- Chang, L.; Han, F.; Chai, S.; Cheng, H.; Yang, D.; Chen, Y. Straw strip mulching affects soil moisture and temperature for potato yield in semiarid regions[J]. Agronomy Journal. 2020, 112(2):1126-1139.
- Liu, P.; Chai, S.; Chang, L.; Zhang, F.; Sun, W.; Zhang, H.; Liu, X.; Li, H.; Effects of Straw Strip Covering on Yield and Water Use Efficiency of Potato cultivars with Different Maturities in Rain-Fed Area of Northwest China[J]. Agriculture. 2023, 13(2):1-19.
- Ma, J.; Huang, C.; Li, Y.; Yang, Y.; Cheng, Z.; Li, H.; Li, Y.; Hu, L.; Wang, L.; Zhang, Q. The Way and Amount of Straw Mulching Impact Water Consumption and Yield of Potato[J]. Journal of Irrigation and Drainage. 2023, 42(3): 57-64, 96.
- Xia, B.; Pang L.; Chang, L.; Wu H., Galimah, G.; Shang, X.; Hou, Y.; Wang, F.; Lu, J. Effects of different mulching methods on soil nitrogen content and distribution of potato in semi-arid rain-fed areas [J]. Journal of Gansu Agricultural University. 2023, 58(01):55-62.
- Feng, Y.; Zhang, S.; Yang, C.; Ma, Ji.; Han, F.; Chai, S.; Huang, C.; Chang, L. Effects of Straw Strip Mulching on Potato Photosynthetic Characteristics and Yield in Semi-arid Rainfed Areas[J]. Journal of Nuclear Agricultural Sciences. 2023, 37(07):1442-1451.
- Zhang, S.; Feng, Y.; Ma, J.; Yang, C.; Han, f.; Chai, S.; Huang, C.; Chang, L. Effects of straw strip mulching on tuber quality and yield of potato in dry farming area of Northwest China under different hydrological years[J]. Agricultural Research in the Arid Areas. 2023, 41(05):207-216.
- Li, H.; Liu, P.; Zhang, H.; Liu, X.; Sun, W.; Chang, L.; Li, H. A dry land corn straw mulching potato no-tillage planter [P]. 2023-04-17.
- Chen, Y.; Chai, S.; Tian, H.; Chai, Y.; Li, Y.; Cheng, L.; Cheng, H. Straw strips mulch on furrows improves water use efficiency and yield of potato in a rainfed semiarid area[J]. Agricultural Water Management. 2019, 211: 142–151.
- Lin, H., Zhou, J., Wang, D., et al. Effect of sparse sowing of large whole tubers on the yield and agronomic traits of potato [J]. Journal of Grassland Science. 2011, 20 (3): 304-308.
- Wang, Y.; Xu, L.; Sun, J.; Liu, Z.; He, X.; Qiao, J. A study on the effects of no tillage and no tillage straw mulching on soil physical properties [J]. Journal of Northeast Agricultural University. 2023, 54 (2): 75-86.
- Zhao, Q., Li, H. Study on the Effect of Dryland Potato Nulching and Tillage-Free on Soil Typical and Chemical Properties [J]. Ningxia Agriculture and Forestry Science and Technology. 2022, 63 (10-11): 70-73.
- Li, G., Wu, H. Effects of no-tillage and straw returning on yield and water use of direct seeding rice [J]. Journal of Irrigation and Drainage Machinery Engineering. 2022, 40 (9): 945-951.
- Cheng, Z.; Zhang, C.; Wang, F.; Wang, Z.; Zhang, Y.; Yan, L.; Liang, H.; Yang, Z.; Gao, J.; Wang, Z. Effects of tillage methods on Inner Mongolia dry farming regions soil moisture temperature and maize yield [J]. Journal of Northern Agriculture. 2023, 51 (2): 22-32.
- Su, X.; Yu, A.; Lv, H.; Wang, Y.; Wang, P.; Chai, J. Effects of Tillage and Straw Returning Management on Soil Hydrothermal Characteristics in Maize Field of Oasis Irrigated Area [J]. Northwest Agricultural Journal. 2023, 32 (7): 1005-1014.
- Hou, X.; Tang, J.; Yu, L.; Zhao, F.; Wang, J.; Hu, E.; Wei, K. Effect of autumn mulching tillage on growth and water use efficiency of potato [J]. Journal of Drainage and Irrigation Machinery Engineering. 2016, 34 (2): 165-172.
- Hou, X.; Li, R. Effects of Autumn Tillage with Mulching on Soil Water, Temperature and Nutrient and Potato Growth [J]. Transactions of the Chinese Society for Agricultural Machinery. 2020, 51 (12): 262-275.
- Zhang, L.; Li, J.; Zhao F.; Li, D.; Hou, X.; Li, Y. Synergistic effect of no-tillage or sub-soiling tillage with straw mulching increasing soil carbon, nitrogen and water storage and potato yield [J]. Journal of Plant Nutrition and Fertilizer. 2023, 29 (1): 45-56.
- Lu, X.; Li, Z.; Bu, Q.; Cheng, D.; Duan, W.; Sun, Z. Effects of rainfall harvesting and mulching on corn yield and water use in the corn belt of northeast China[J]. Agronomy Journal. 2014, 106:2175-2184.
- Zhang, J. Effects of Ridge Membrane Rainwater Harvesting on Soil Properties and Rainfed Sunflower Growth [D]. Hohhot: Inner Mongolia Agricultural University. 2018.
- Chai, Y.; Chai, Q.; Li, R.; Li, Y.; Yang, C.; Cheng, H.; Chang, L.; Chai, S. Straw strip mulching in a semiarid rainfed agroecosystem achieves winter wheat yields similar to those of full plastic mulching by optimizing the soil hydrothermal regime[J]. The Crop Journal. 2022, 10(3):879-892.
- Chai, Y.; Chai Q.; Han, F.; Li, Y.; Ma, J.; Li, R.; Cheng, H.; Zhang, L.; Chai, S. Increasing yields while reducing soil nutrient accumulation by straw strip mulching in the dryland wheat (Triticum aestivum L.) cropping system of Northwest China[J]. Agriculture, Ecosystems and Environment. 2022, 326:107797.
- Song, Y.; Yang, C.; Li, B.; Li, S.; Lan, X.; Chang, L.; Han, F.; Cheng, H.; Huang, C. Chai, S. Effect of Bundled Straw Mulching on Yield of Winter Wheat and Soil Moisture in Arid Region [J]. Journal of Wheat Crops. 2011, 36 (6): 765-772.
- Su, F. Effects of Different Ridge-furrow Covering Patterns on Soil Water Temperature, Inorganic Nitrogen and Potato Growth [D]. Yinchuan: Ning Xia University. 2019.
- Chen, Y. Effects of Mulching Patterns on Soil Hydrothermal Regimes and Yield Formation of Potato in Semiarid Rain-fed Ecosystem [D]. Lanzhou: Gansu Agricultural University. 2019.
- Pu, X.; Wu, C.; Mian, Y.; Miao, F.; Hou, X.; Li, R.; Effects of Different Mulching Patterns on Growth of Potato and Characteristics of Soil Water and Temperature in Dry Farmland [J]. Chinese Agricultural Science. 2020, 53 (4): 734-747.
- Hou, X.; Li, R. Effects of mulching with no-tillage on soil physical properties and potato yield in mountain area of southern Ningxia [J]. Transactions of the Chinese Society of Agricultural Engineering. 2015, 31 (19): 112-119.
- Wang, Q.; Liu, H.; Jia, S.; Shen, J.; Chen, X.; Zhang, S.; Zhang, Y.; Gao, Y.; Liang, A. Effect of conservation tillage on microbial functional genes related to carbon cycle of black soil [J]. Acta Ecologica Sinica. 2023, 43 (11): 4760-4771.
- Xu, F. Effects of rotational tillage and fertilization measures on soil organic carbon sequestration and crop yield under dry farming system in the Guan zhong Plain, Northwest China[D]. Xian Yang: Northwest A&F University. 2022.
- Yang, H.; Wu, G.; Mo, P. Chen, S.; Wang, S.; Xiao, Y.; Ma, H.; Wen, T. Guo, X. Fan, G. The combined effects of maize straw mulch and no-tillage on grain yield and water and nitrogen use efficiency of dry-land winter wheat (Triticum aestivum L.) [J]. Soil Tillage Research. 2020, 197,104485.
- Wang, J.; Zhang, S.; Upendra, M.; Rajan, G.; Fan, Z. A meta-analysis on cover crop impact on soil water storage succeeding crop yield and water-use efficiency[J]. Agricultural Water Management. 2021, 256:107085.
- Kashif Akhtar.; Noor UlAin, Wang, W.. Straw mulch decreased nitrogen fertilizer requirements viaregulating soil moisture and temperature to improve physiologynitrogen, and water use efficiency of wheat[J]. Agronomy Journal, 2023, 115(6):3106-3118.
- Zhao, H.; Wang, R.; Ma, B.; Xiong, Y.; Qiang, S.; Wang, C.; Liu, C.; Li, F. Ridge-furrow with full plastic film mulching improves water use efficiency and tuber yields of potato in a semiarid rainfed ecosystem[J]. Field Crops Research. 2014,161:137-148.
- Zhang, P.; Guo, T.; Li, S.; Liu, X.; Zeng, J. Effects of different coverage cultivation and balanced fertilization on yield and water use efficiency of potato in the dry-land [J]. Agricultural Research in Arid Regions. 2017, 35 (01): 50-54.
- Wu, C.; Pu, X.; Zhou, Y.; Mian, Y.; Miao, F.; Li, R. Effects of ridge-and-furrow rainwater harvesting with mulching on soil water-heat-fertility and potato yield in arid areas of southern Ningxia [J]. Acta Agronomica Sinica. 2021, 47 (11): 2208-2219.
- Zhang, L.; Li, J.; Zhao, F.; Li, D.; Hou, X.; Li, R. Synergistic effect of no-tillage or sub-soiling tillage with straw mulching increasing soil carbon, nitrogen and water storage and potato yield [J]. Journal of Plant Nutrition and Fertilizer. 2023, 29 (01): 45-56.
- Zhang, L.; Wang, J., Fu, G., Zhao, Y. Rotary tillage in rotation with plowing tillage improves soil properties and crop yield in a wheat-maize cropping system[J]. PloS one. 2018, 13(6):193-198.
- Li, F.; Yan, X.; Wang, J.; Li, S.; Wang, T.; The Mechanism of Yield Decrease of Spring Wheat Resulted from Plastic Film Mulching [J]. Scientia Agricultura Sinica. 2001, 34 (03): 330-333.
- Gao, C.; Fu, Y.; Wang, S. Effects of Straw Mulch on Yield and Water Use Efficiency in Winter Wheat [J]. Rural Water Resources and Hydropower in China. 2011, (7): 12-15.
Figure 1.
Precipitation and air temperature at study area in 2021 and 2022.
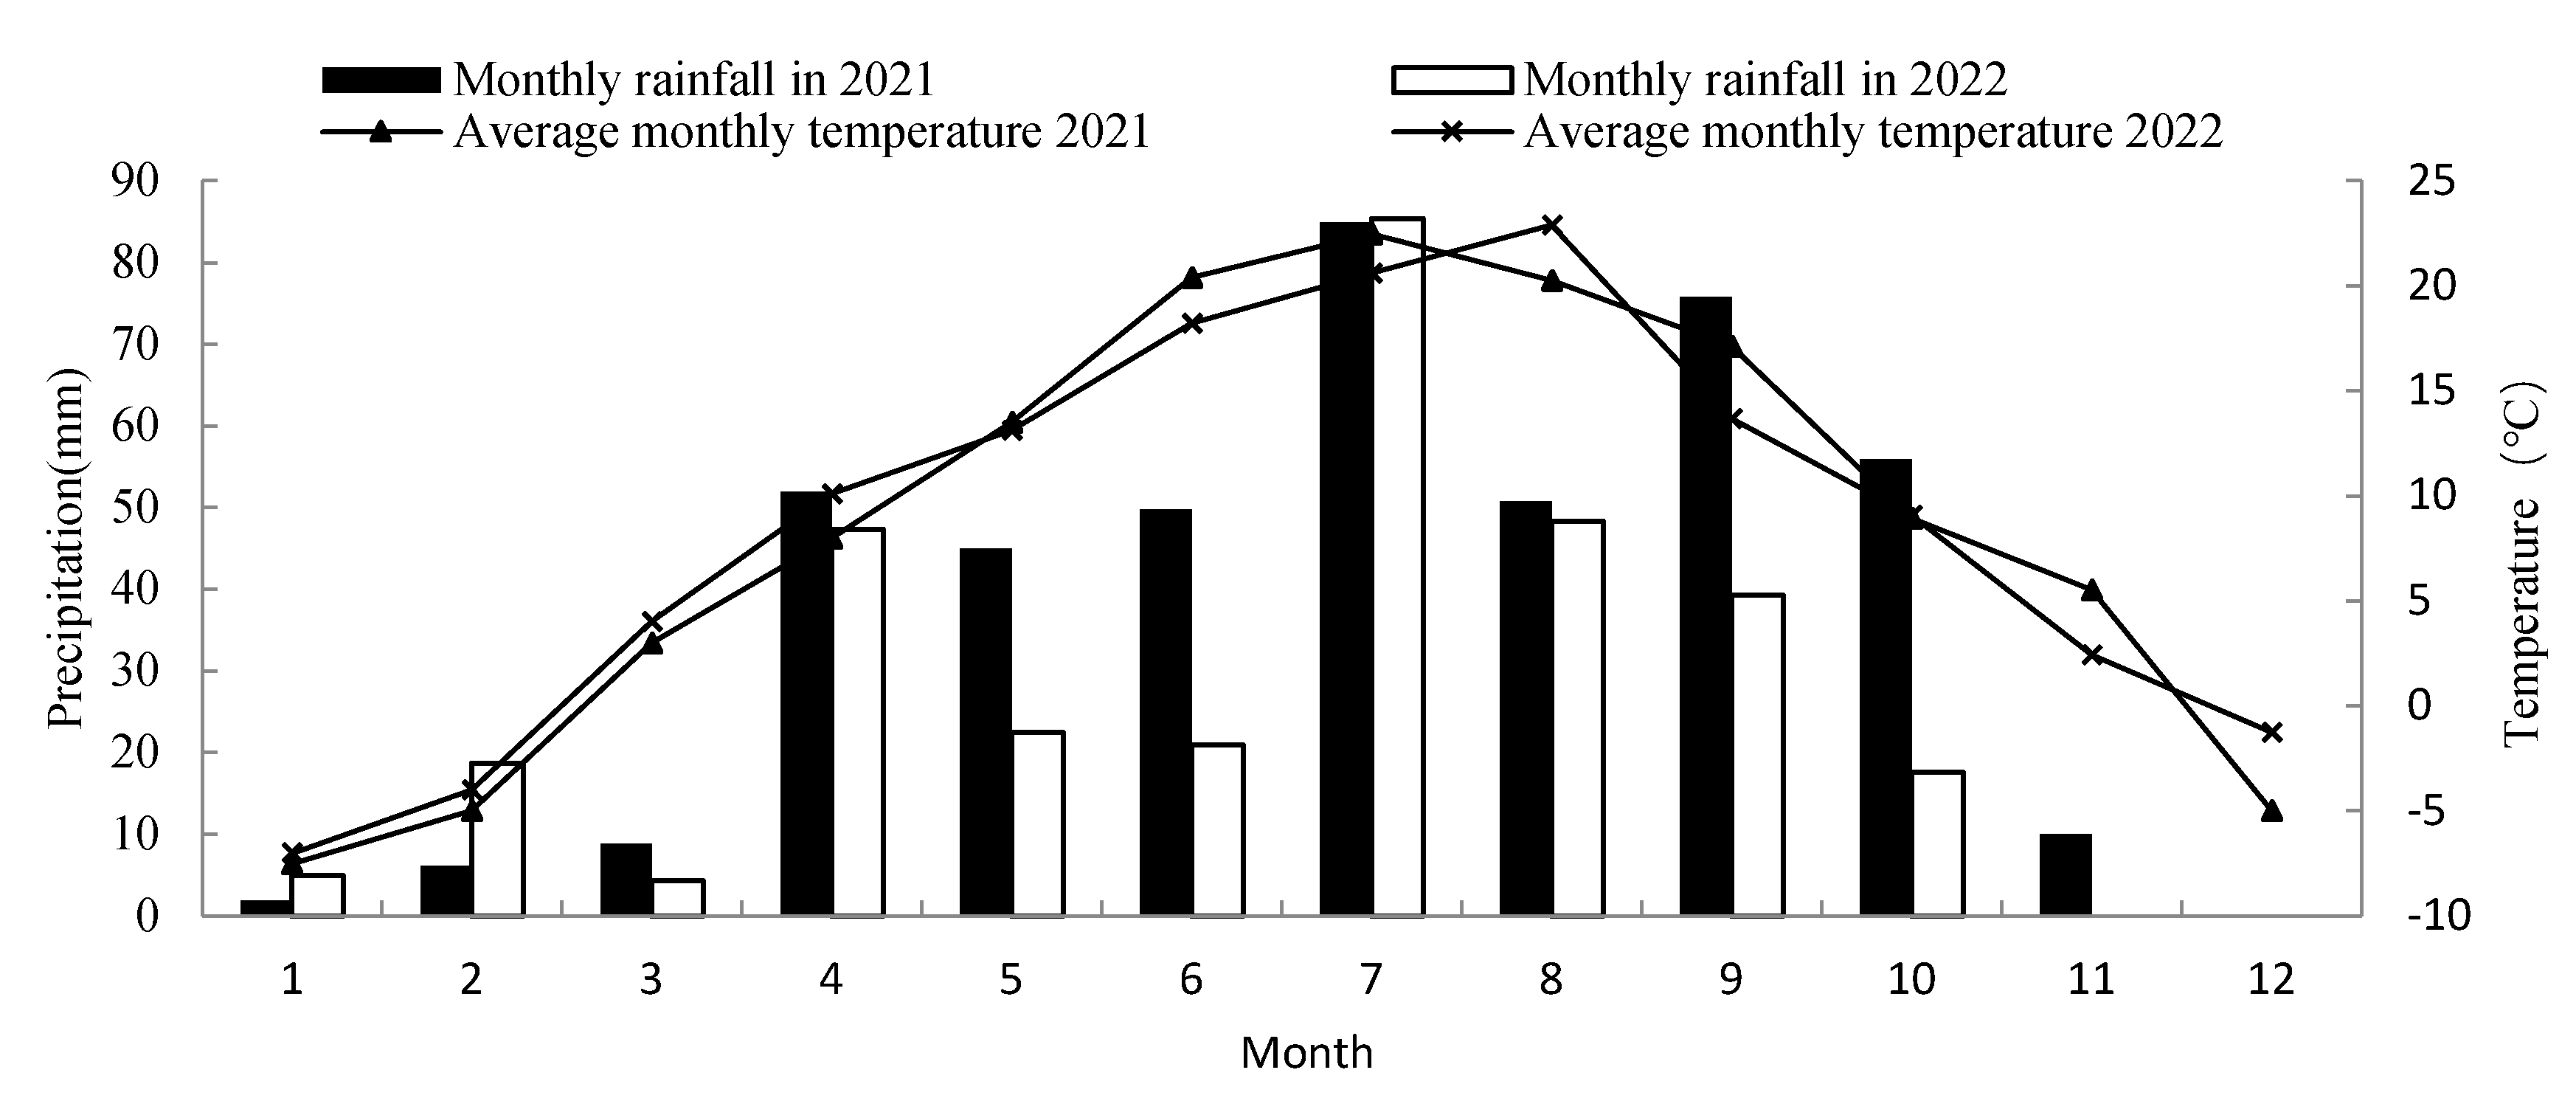
Figure 2.
The planting pattern and realistic picture of each treatment on Longshu 7.
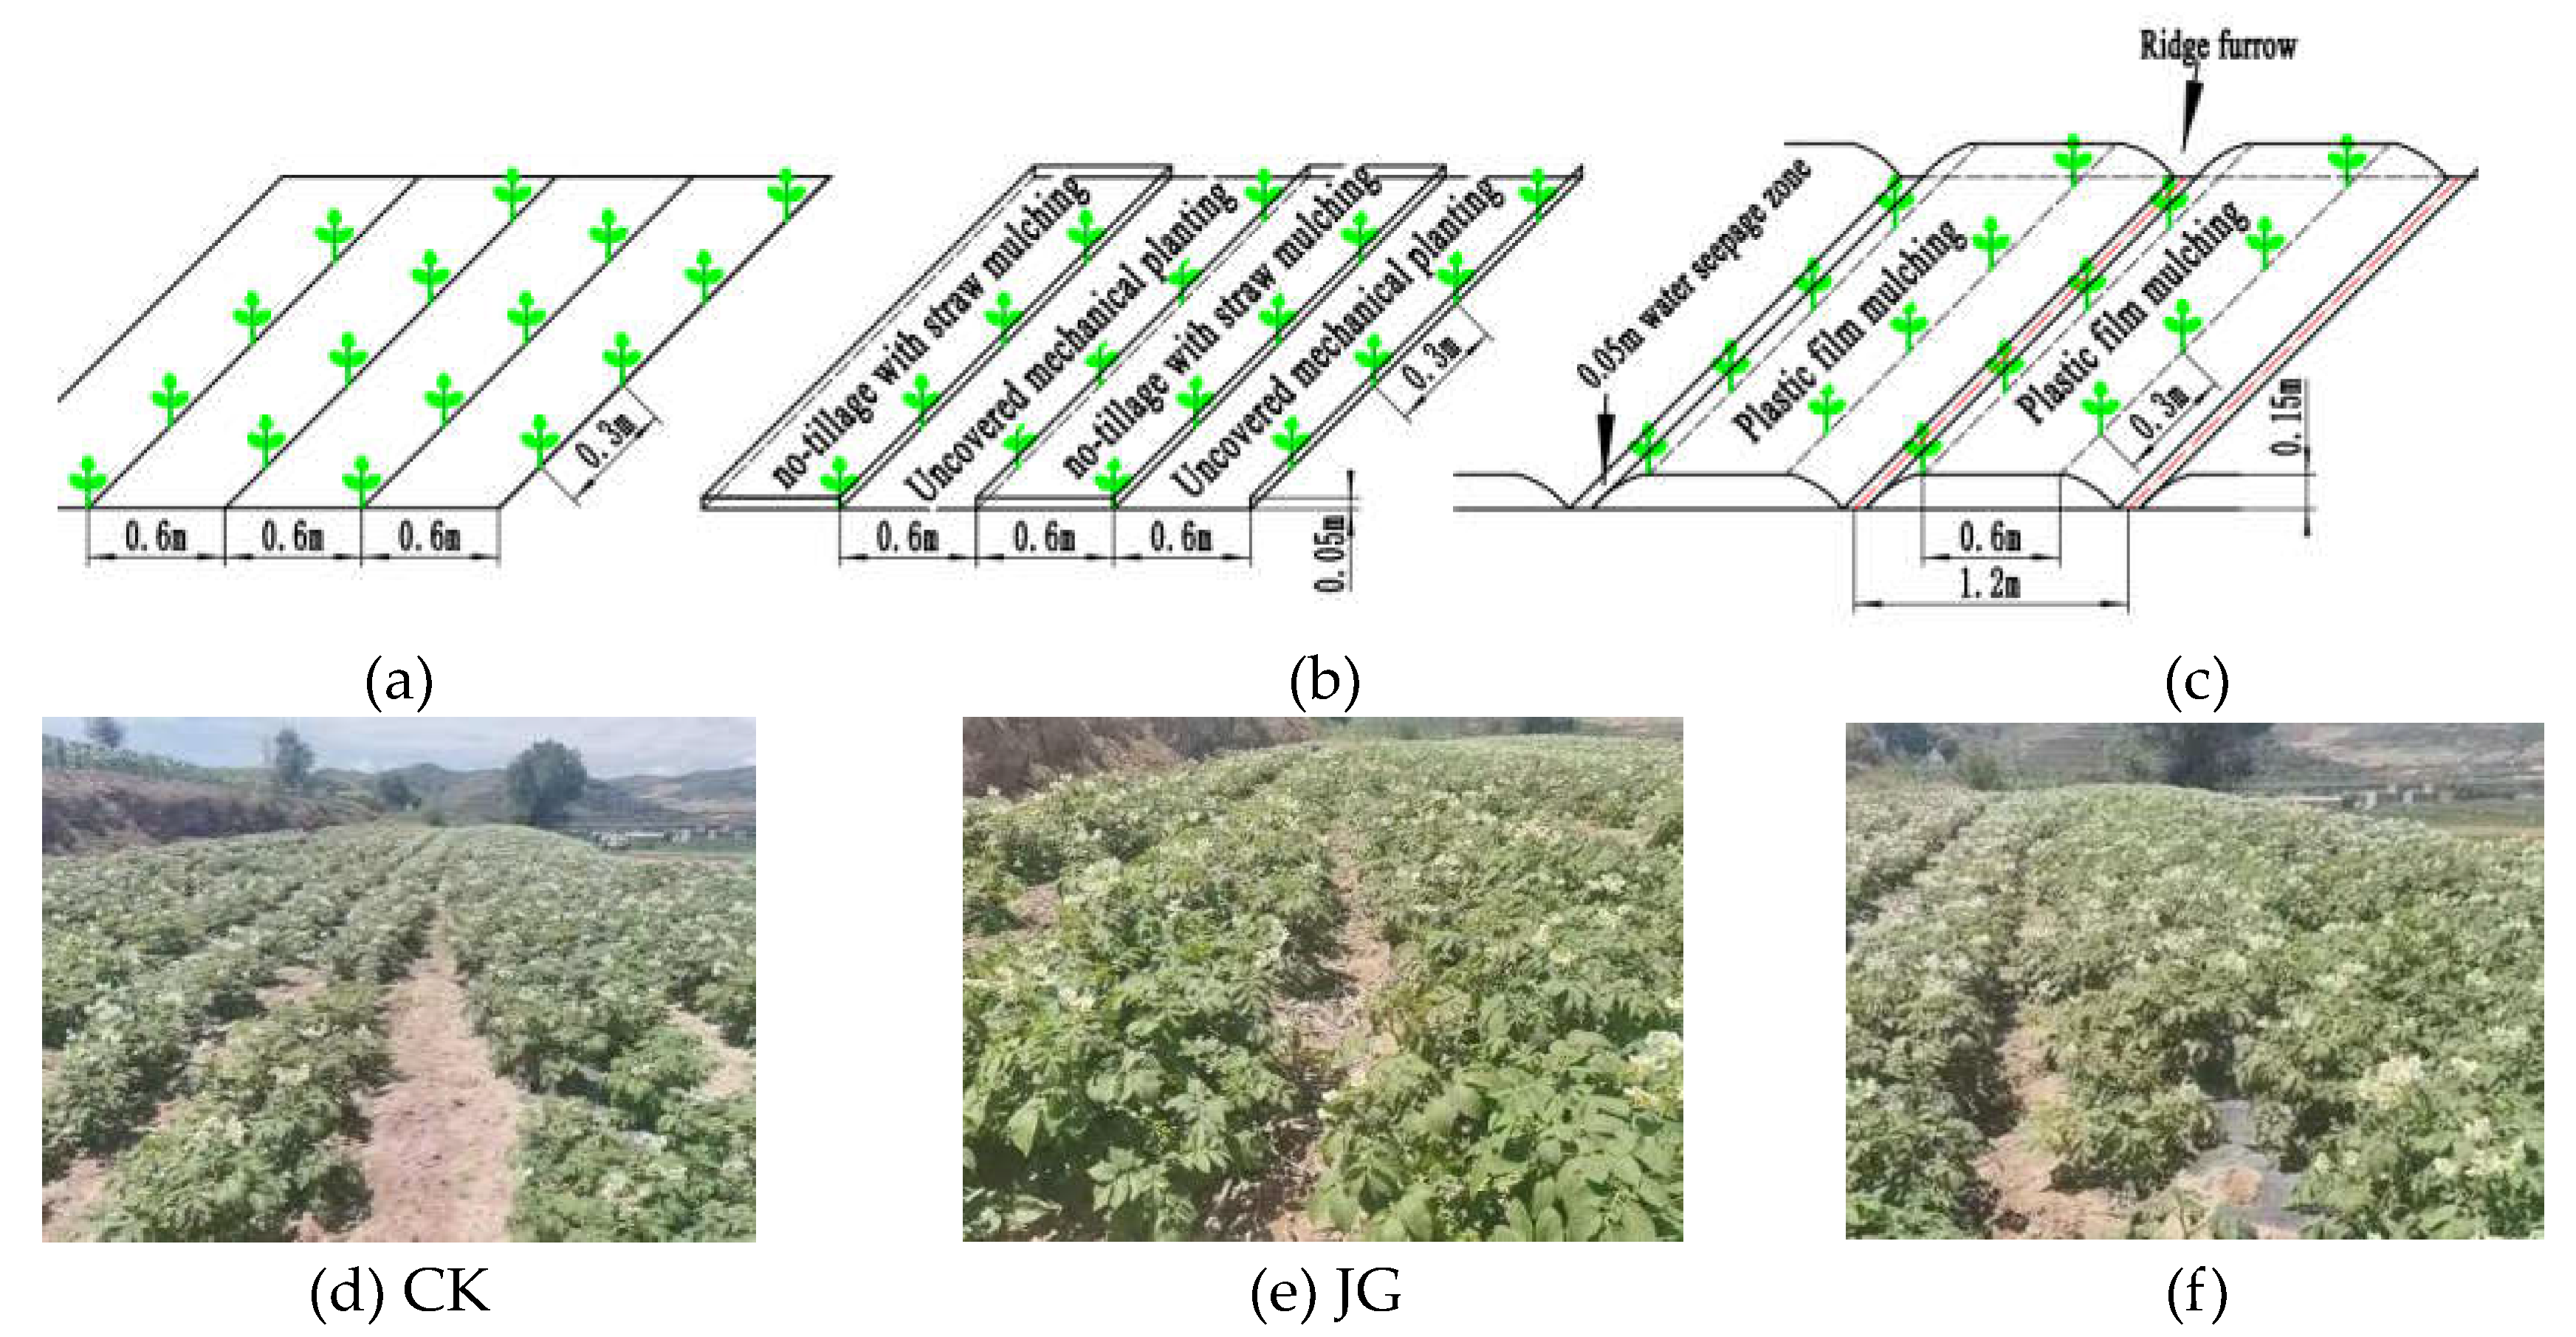
Figure 3.
Mean soil water content in 0 ~100cm during whole growth period.
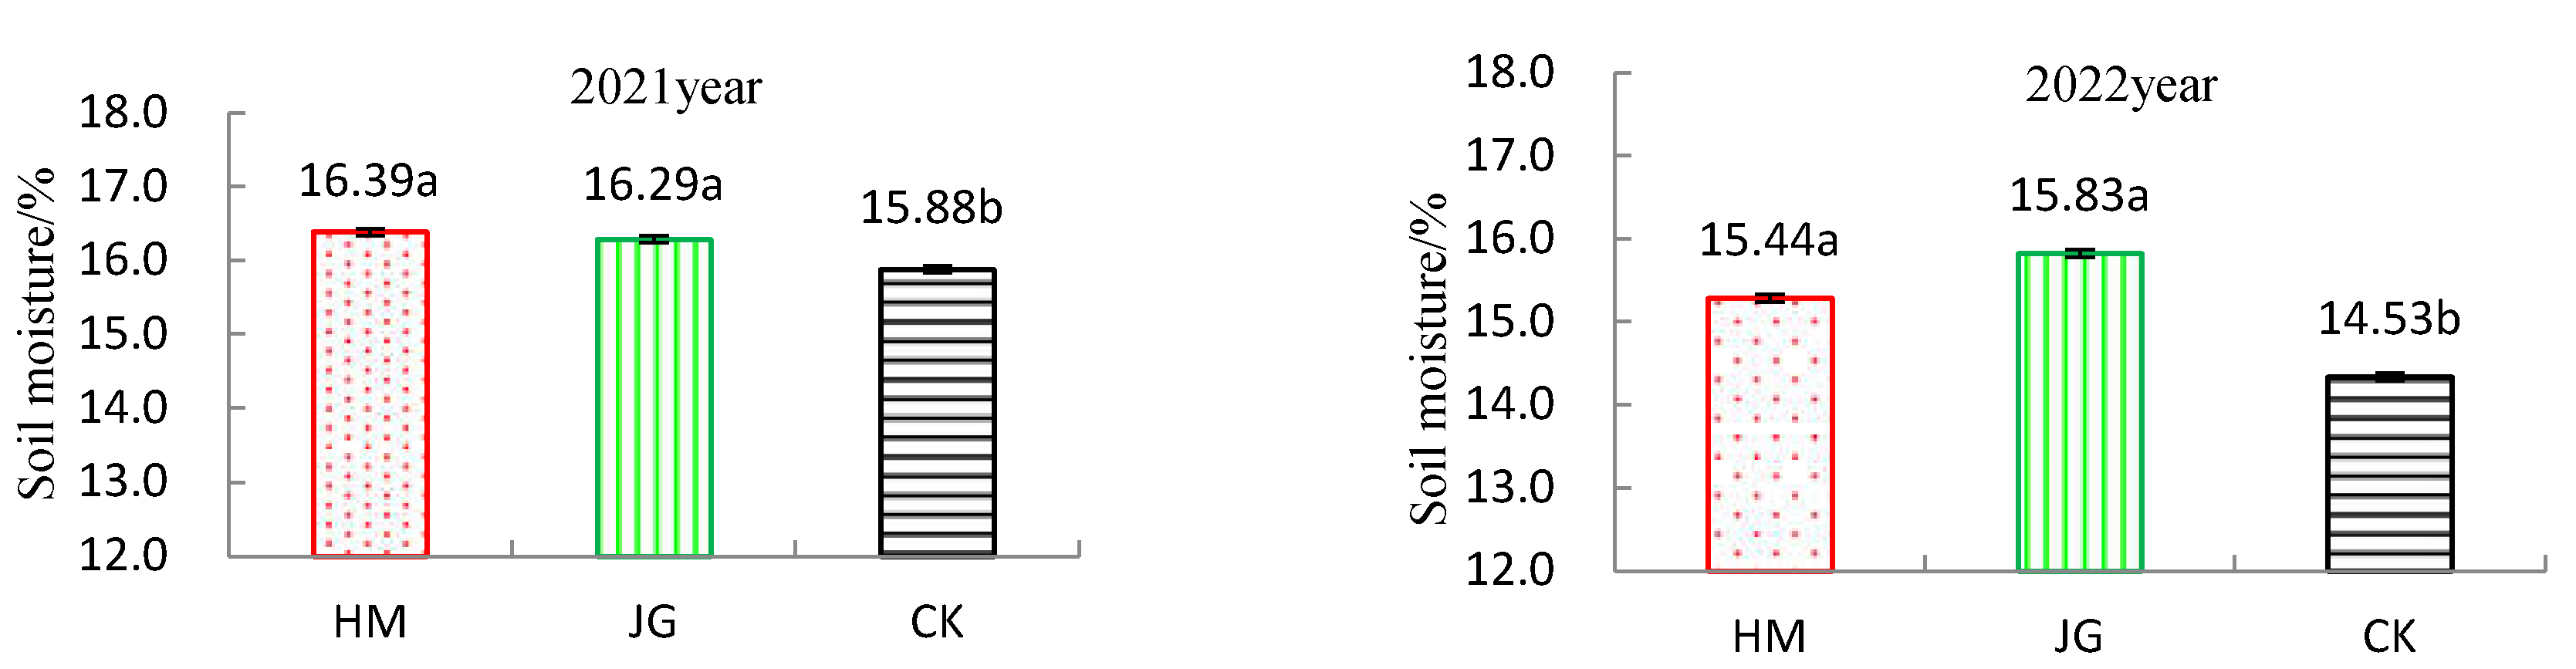
Figure 4.
The change of average content water in 0 ~100 cm soil layers with growth stages.
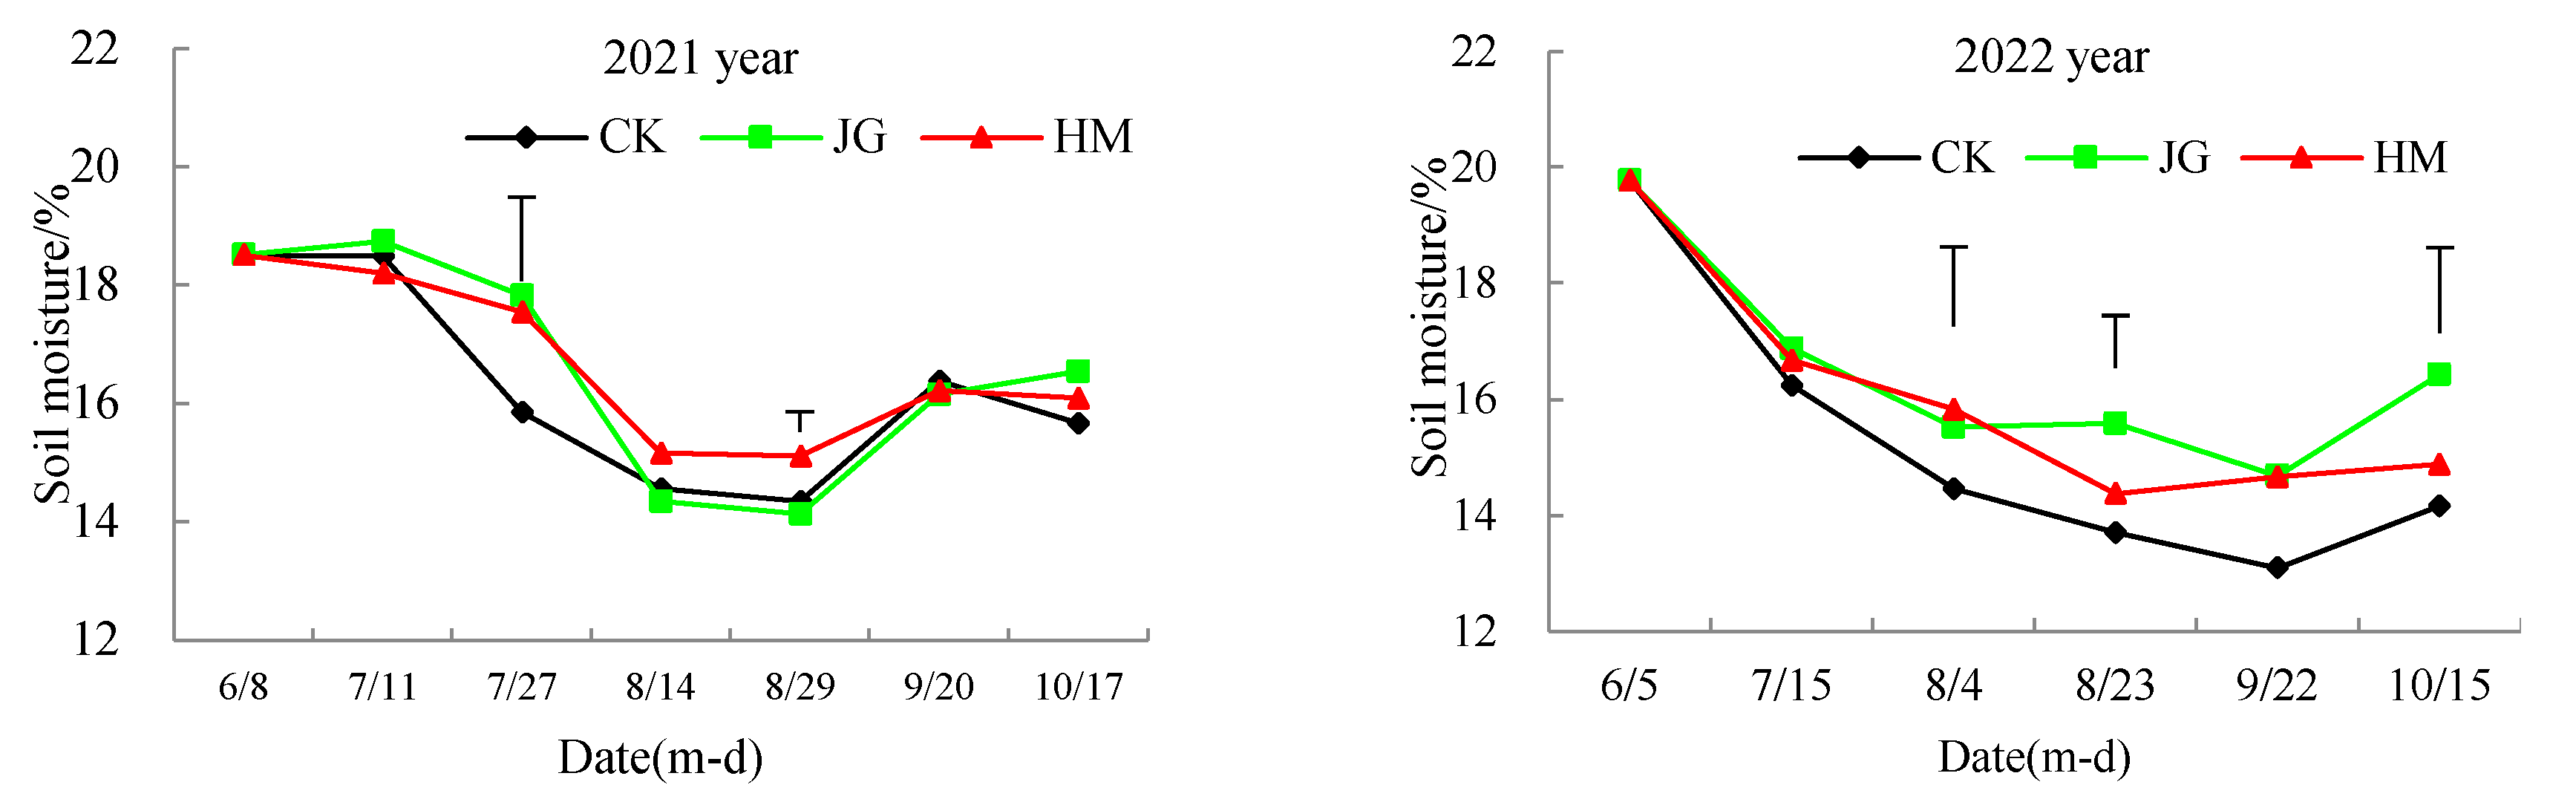
Figure 5.
Variation trend of average soil moisture content with soil layer from shallow to deep.
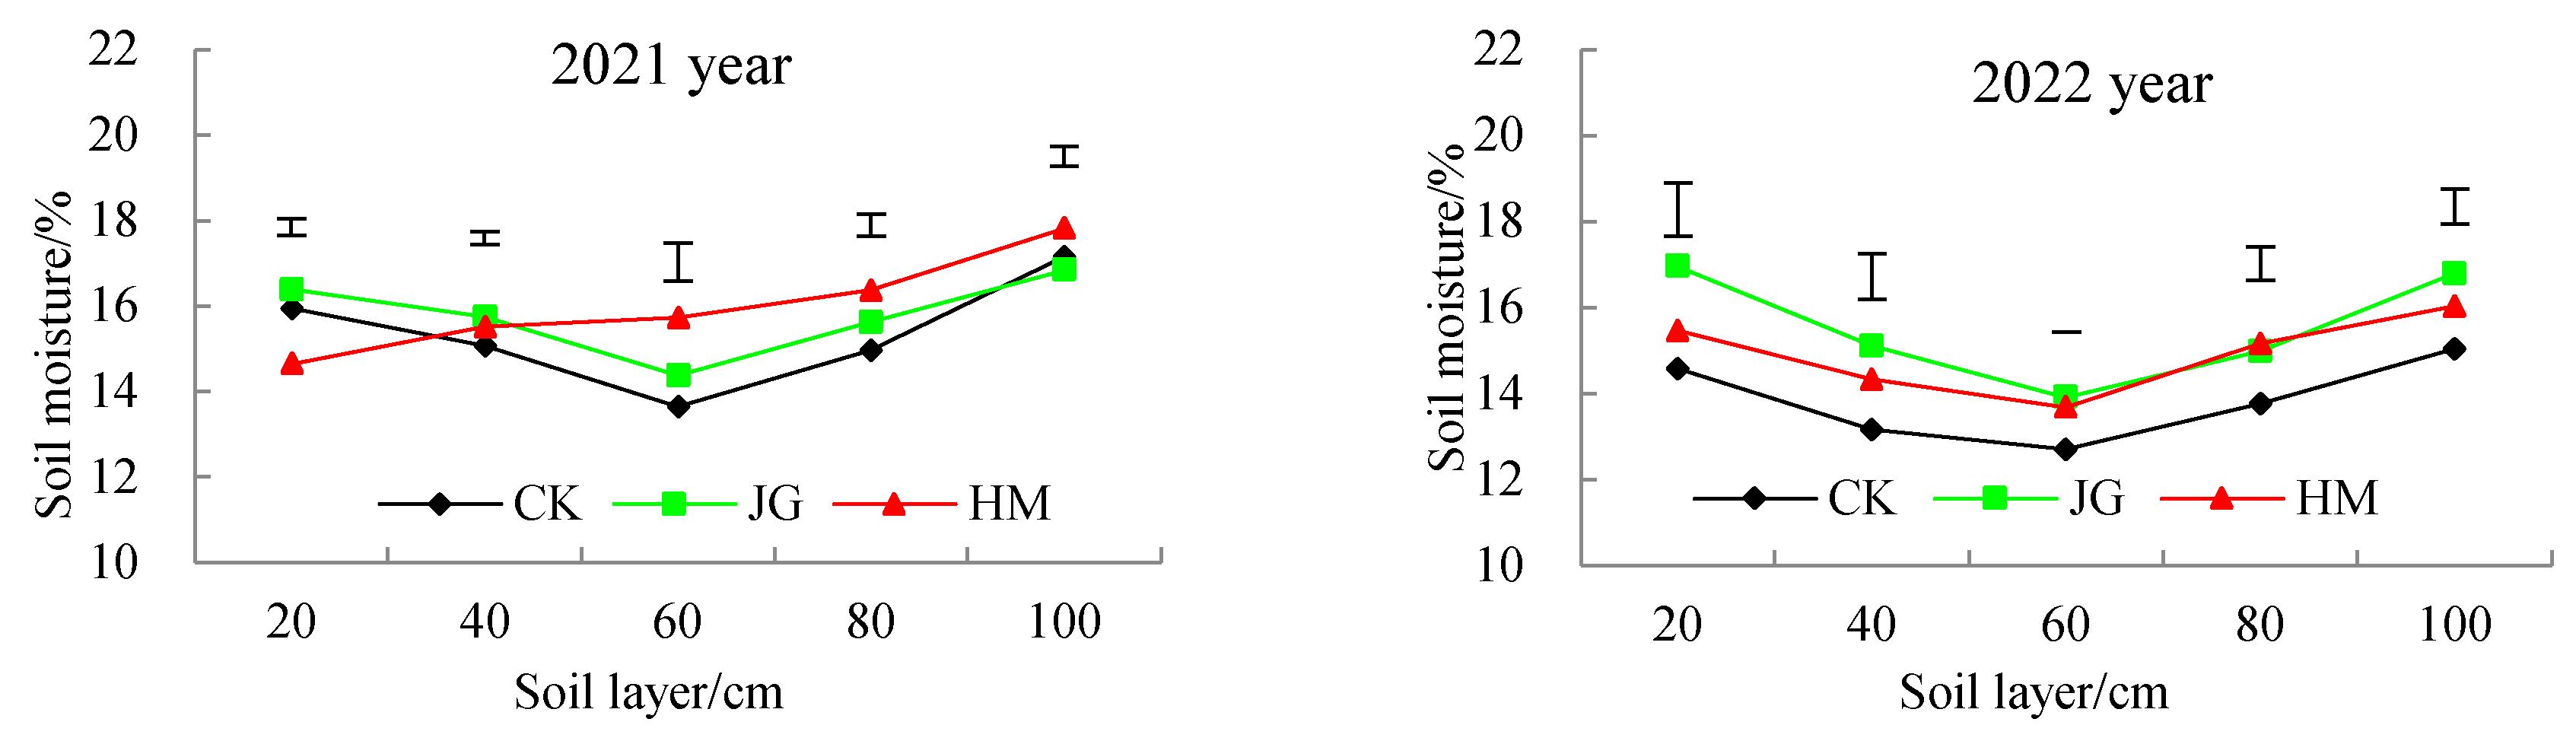
Figure 6.
The spatial and temporal changes of soil water content at different growth stages in 2021 and 2022. Note A: Seedling stage; B: Tuber formation period; C: Tuber enlargement stage; D: Starch accumulation period; E: Harvest; Same below.
Figure 6.
The spatial and temporal changes of soil water content at different growth stages in 2021 and 2022. Note A: Seedling stage; B: Tuber formation period; C: Tuber enlargement stage; D: Starch accumulation period; E: Harvest; Same below.
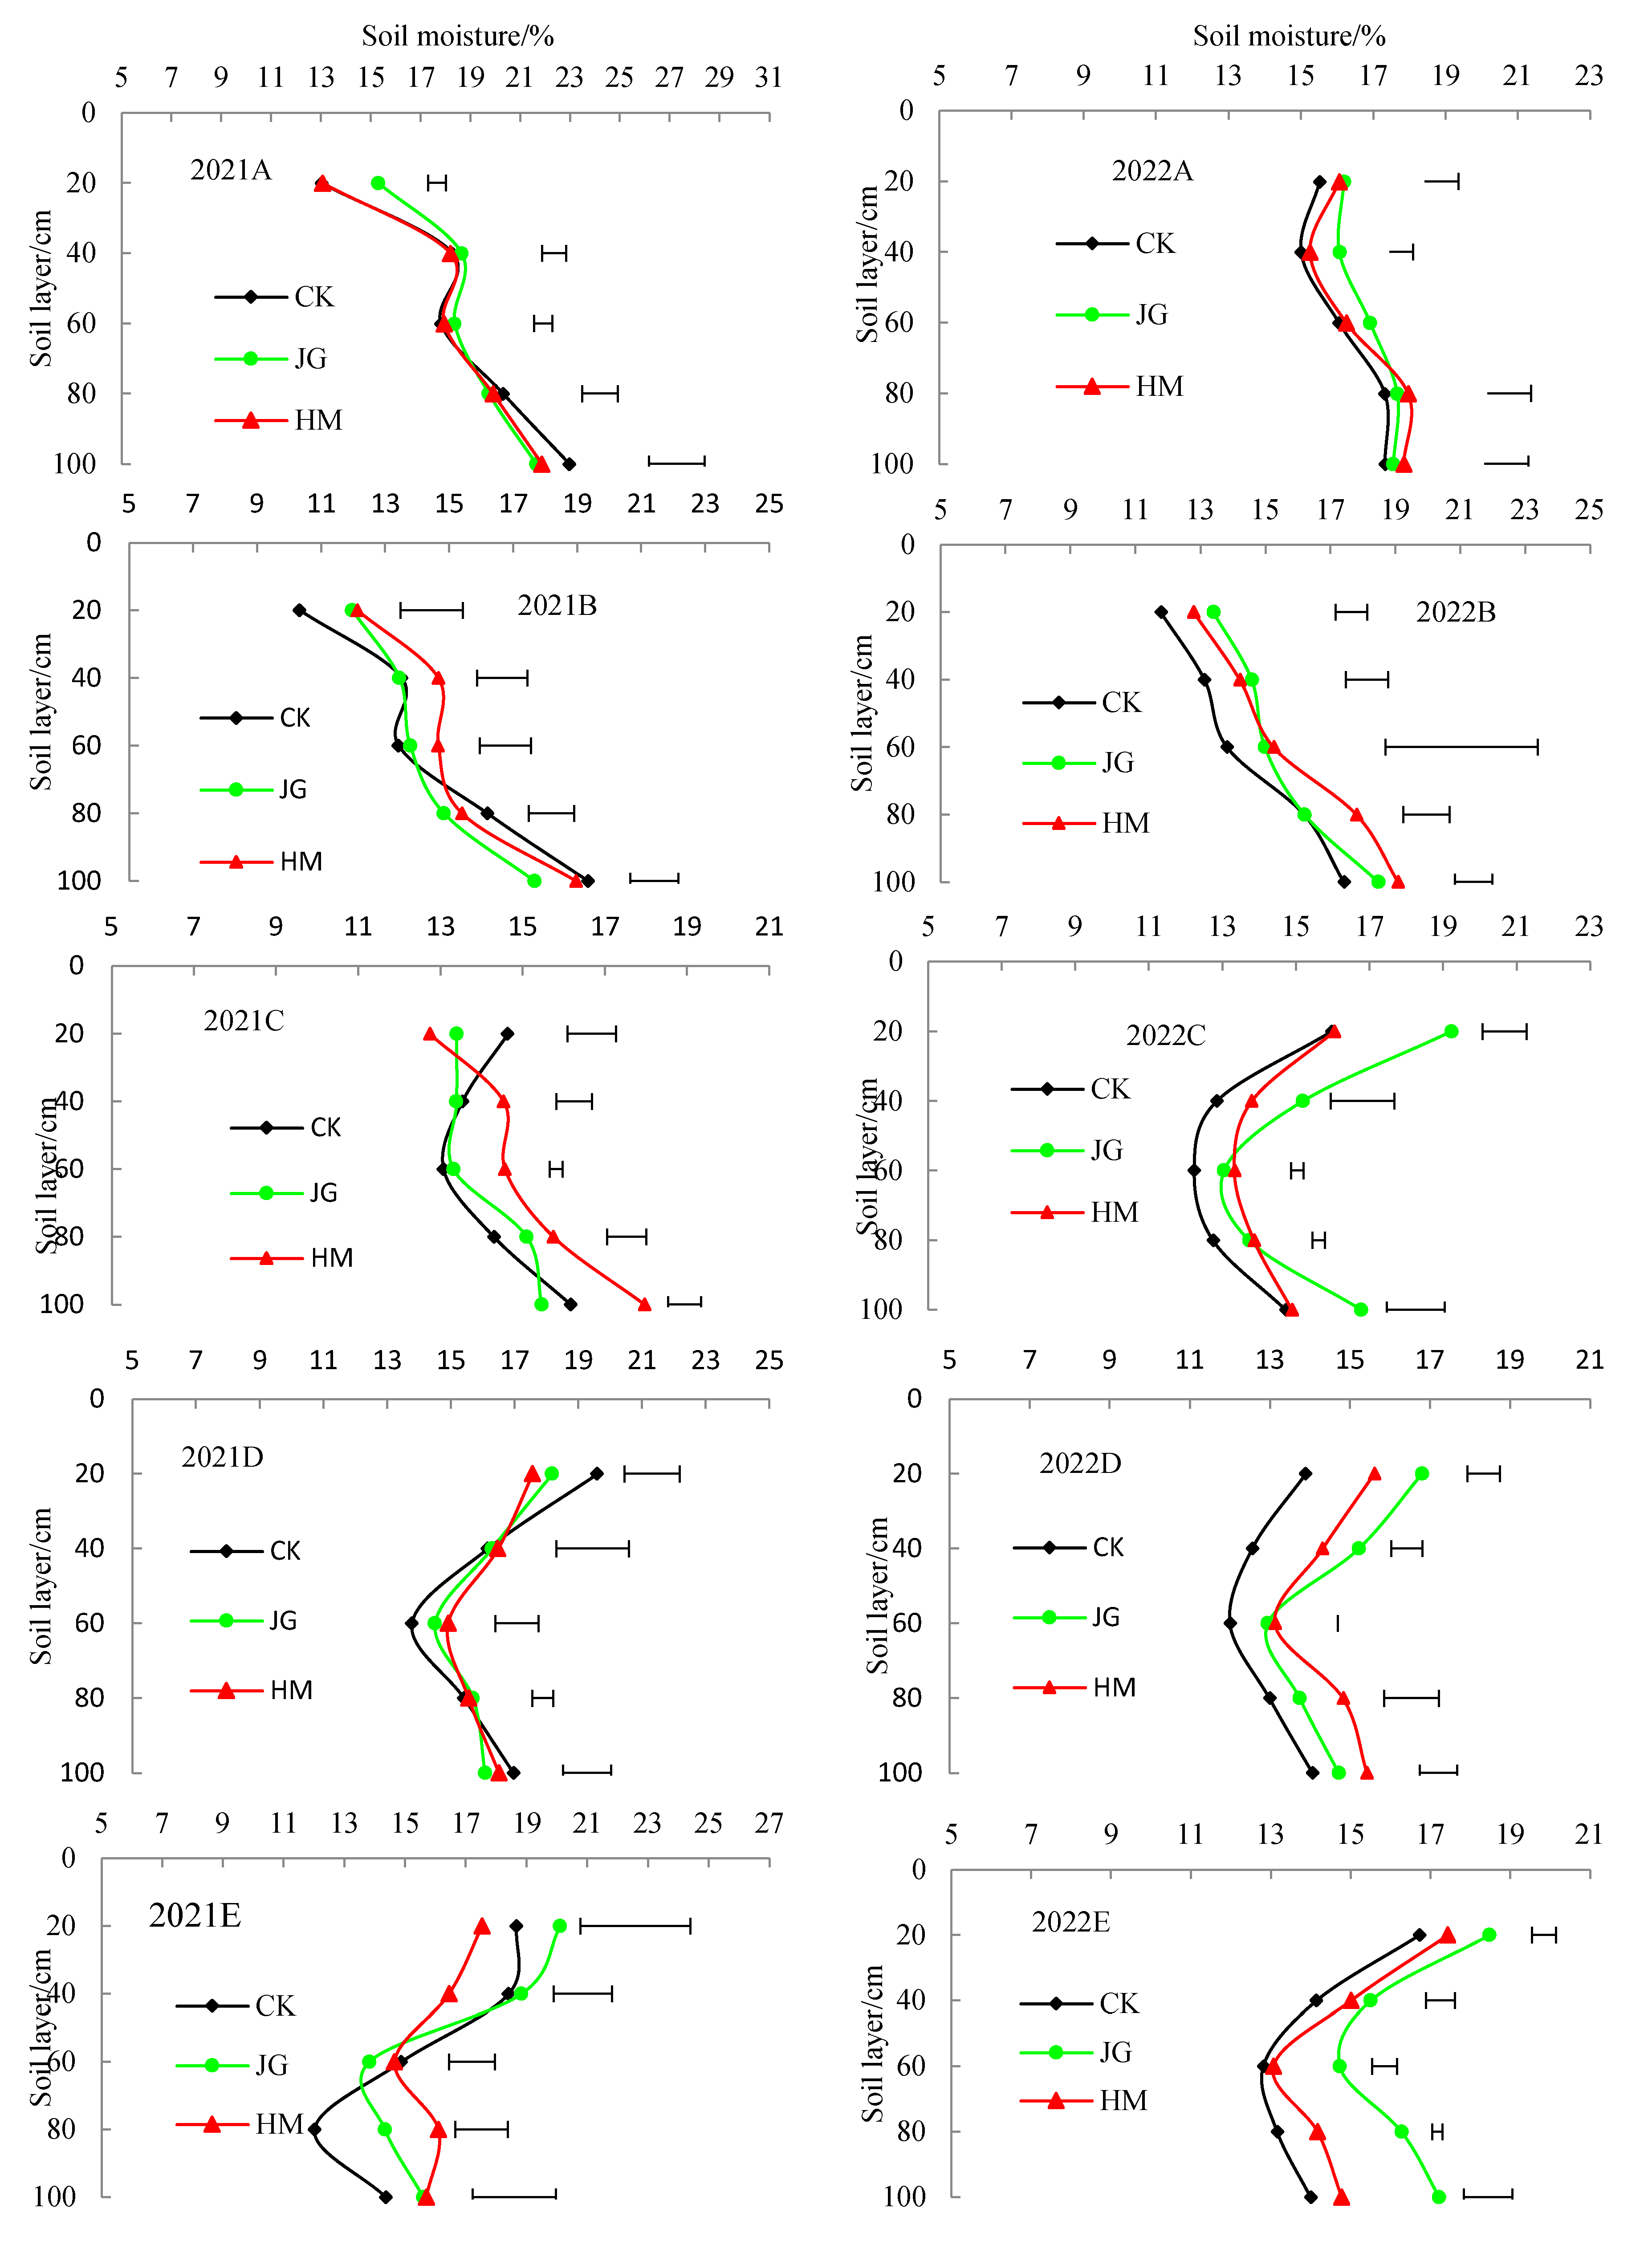

Table 1.
The effects of mulching treatment on yield and yield components.
| Test Years |
Treatments | Potato weight per plant (g) |
Number of tubers per plant (number) | Average single potato weight (g) | Number of large and medium potatoes (%) | Commodity potato rate (%) | Yield /kg hm-2 |
| 2021 | JG | 1200.38b | 7.37b | 157.97b | 0.60b | 0.92b | 50498.60a |
| HM | 1497.14a | 7.67a | 204.53a | 0.68a | 0.94a | 44914.16b | |
| CK | 1088.60b | 7.47b | 148.06b | 0.64ab | 0.91c | 48987.01a | |
| Mean | 1262.04 | 7.50 | 170.18 | 0.64 | 0.92 | 48133.26 | |
| Range | 408.54 | 0.30 | 56.47 | 0.08 | 0.03 | 5584.44 | |
| CV (%) | 16.73 | 2.04 | 17.72 | 6.34 | 1.43 | 6.00 | |
| 2022 | JG | 447.93b | 2.53b | 118.76a | 0.50a | 0.87a | 18946.99a |
| HM | 507.28a | 3.33b | 104.45ab | 0.48a | 0.88a | 19084.67a | |
| CK | 380.61c | 3.70a | 90.69b | 0.49a | 0.84b | 16875.59b | |
| Mean | 445.27 | 3.19 | 104.63 | 0.49 | 0.86 | 18302.42 | |
| Range | 126.67 | 1.17 | 28.07 | 0.02 | 0.04 | 2209.08 | |
| CV (%) | 14.23 | 18.71 | 13.41 | 2.42 | 2.08 | 6.76 |
Table 2.
The effects of mulching treatment on water use efficiency of potato yield.
| Test years |
Treatments | Yield /kg hm-2 |
Soil water storage before seeding /mm |
Soil water storage harvest /mm |
Amount of rainfall in the growth period /mm |
Crop water consumption /mm |
WUE/ kg·(mm·hm2)-1 |
Yield is more than CK/% |
| 2021 | JG | 50498.55a | 240.62 | 214.98a | 317.20 | 342.83b | 147.30a | 6.50 |
| HM | 44914.2b | 240.62 | 209.08b | 317.20 | 348.74ab | 128.79c | -6.88 | |
| CK | 48987a | 240.62 | 203.64c | 317.20 | 354.18a | 138.31b | ||
| 2022 | JG | 18946.95a | 240.62 | 213.64a | 211.45 | 238.43b | 79.47a | 26.17 |
| HM | 19084.65a | 257.03 | 193.49b | 211.45 | 274.99a | 69.40b | 10.19 | |
| CK | 16875.6b | 240.62 | 184.12c | 211.45 | 267.95a | 62.98c |
Table 3.
Average soil water content in 0-100cm at different growth stages(%).
| Years | Measuring time | CK | JG | HM | Mean | Range | CV (%) |
| 2021 | 6-8 | 18.51 | 18.51 | 18.51 | 18.51 | ||
| 7-11 | 18.48 | 18.74 | 18.20 | 18.47 | 0.54 | 1.47 | |
| 7-27 | 15.84 | 17.82 | 17.55 | 17.07 | 1.98 | 6.28 | |
| 8-14 | 14.56 | 14.34 | 15.16 | 14.69 | 0.82 | 2.90 | |
| 8-29 | 14.34 | 14.13 | 15.11 | 14.53 | 0.98 | 3.55 | |
| 9-20 | 16.38 | 16.15 | 16.21 | 16.25 | 0.23 | 0.75 | |
| 10-17 | 15.66 | 16.54 | 16.08 | 16.09 | 0.87 | 2.71 | |
| Mean | 15.88 | 16.29 | 16.39 | ||||
| Range | 4.14 | 4.61 | 3.09 | ||||
| CV (%) | 9.42 | 11.29 | 7.66 | ||||
| 2022 | 6-5 | 19.77 | 19.77 | 19.77 | 19.77 | 0.00 | 0.00 |
| 7-15 | 16.24 | 16.88 | 16.67 | 16.60 | 0.63 | 1.95 | |
| 8-4 | 14.46 | 15.53 | 15.83 | 15.27 | 1.36 | 4.69 | |
| 8-23 | 13.70 | 15.59 | 14.38 | 14.55 | 1.89 | 6.58 | |
| 9-22 | 13.10 | 14.68 | 14.66 | 14.15 | 1.58 | 6.42 | |
| 10-15 | 14.16 | 16.43 | 14.88 | 15.16 | 2.27 | 7.65 | |
| Mean | 14.33 | 15.82 | 15.28 | ||||
| Range | 3.14 | 2.19 | 2.29 | ||||
| CV (%) | 8.27 | 5.40 | 6.20 |
Table 4.
Average water content in the different soil layers during the whole growth period (%).
| Years | Soil layer/cm | CK | JG | HM | Mean | Range | CV (%) |
| 2021 | 20 | 15.95 | 16.39 | 14.66 | 15.66 | 1.73 | 5.73 |
| 40 | 15.08 | 15.74 | 15.52 | 15.45 | 0.67 | 2.20 | |
| 60 | 13.65 | 14.38 | 15.73 | 14.59 | 2.08 | 7.25 | |
| 80 | 14.96 | 15.62 | 16.38 | 15.65 | 1.42 | 4.55 | |
| 100 | 17.16 | 16.85 | 17.83 | 17.28 | 0.98 | 2.90 | |
| Mean | 15.36 | 15.80 | 16.02 | ||||
| Range | 3.52 | 2.46 | 3.17 | ||||
| CV (%) | 8.48 | 5.91 | 7.38 | ||||
| 2022 | 20 | 14.59 | 16.97 | 15.46 | 15.67 | 2.38 | 7.70 |
| 40 | 13.16 | 15.12 | 14.33 | 14.20 | 1.95 | 6.93 | |
| 60 | 12.71 | 13.92 | 13.69 | 13.44 | 1.21 | 4.76 | |
| 80 | 13.77 | 14.99 | 15.16 | 14.64 | 1.39 | 5.18 | |
| 100 | 15.05 | 16.80 | 16.04 | 15.96 | 1.75 | 5.50 | |
| Mean | 13.86 | 15.56 | 14.94 | ||||
| Range | 2.33 | 3.05 | 2.35 | ||||
| CV (%) | 6.99 | 8.34 | 6.24 |
Table 5.
The variation coefficient and range of water content between soil layers.
| Years | Measuring time | JG | HM | CK | |||
| Range | CV (%) | Range | CV (%) | Range | CV (%) | ||
| 7-11 | 9.94 | 19.83 | 6.34 | 12.33 | 8.80 | 17.96 | |
| 2021 | 7-27 | 5.88 | 15.17 | 2.94 | 6.73 | 6.69 | 17.11 |
| 8-14 | 9.01 | 23.24 | 5.70 | 14.81 | 6.84 | 16.23 | |
| 8-29 | 3.10 | 8.32 | 2.15 | 7.48 | 5.23 | 12.73 | |
| 9-20 | 5.82 | 13.11 | 3.68 | 8.23 | 2.65 | 6.25 | |
| 10-17 | 6.65 | 18.10 | 6.28 | 16.86 | 2.89 | 6.56 | |
| 7-15 | 2.32 | 6.48 | 1.59 | 4.39 | 2.71 | 7.10 | |
| 2022 | 8-4 | 5.64 | 15.90 | 5.09 | 12.44 | 6.30 | 16.32 |
| 8-23 | 3.73 | 11.54 | 6.18 | 15.95 | 2.71 | 7.58 | |
| 9-22 | 2.06 | 6.69 | 3.86 | 10.04 | 2.48 | 6.81 | |
| 10-15 | 3.90 | 10.81 | 3.75 | 8.92 | 4.36 | 10.79 | |
Table 6.
Water consumption and ratios in different growth periods of potato.
| Test years | Treatments | Sowing to A | A to B | B to C | C to D | D to E | Sowing to E | |||||
| Quantity (mm) | Proportion (%) | Quantity (mm) | Proportion (%) | Quantity (mm) | Proportion (%) | Quantity (mm) | Proportion (%) | Quantity (mm) | Proportion (%) | Quantity (mm) |
||
| 2021 | HM | 96.28a | 27.60a | 107.35c | 30.79c | 26.01b | 7.46b | 61.57a | 17.65a | 57.54b | 16.50b | 348.74ab |
| JG | 89.21ab | 26.03b | 125.08a | 36.47a | 28.09a | 8.19a | 49.59b | 14.48b | 50.86c | 14.83c | 342.83b | |
| CK | 92.60b | 26.16b | 118.88b | 33.60b | 28.17a | 7.93ab | 49.28b | 13.94b | 65.24a | 18.38a | 354.18a | |
| 2022 | HM | 101.81a | 37.15a | 55.79c | 20.10b | 50.65a | 18.56a | 52.08c | 19.03c | 14.66a | 5.16a | 274.99a |
| JG | 82.74c | 34.67b | 62.33b | 26.21a | 31.03c | 13.04c | 67.48a | 28.32a | (5.14)c | (2.23)c | 238.43c | |
| CK | 90.97b | 33.85b | 67.93a | 25.55a | 41.76b | 15.65b | 63.51b | 24.08b | 3.77b | 0.87b | 267.95b | |
Table 7.
Effects of different mulching methods on potato growth index.
| Years | Treatments | A | B | C | D | E | ||||||||||||
| ZG | FZ | JY | ZG | FZ | JY | ZG | FZ | JY | ZG | FZ | JY | ZG | FZ | JY | ||||
| 2021 | CK | 32.6 | 0.0 | 11.0b | 48.0 | 1.3 | 23.2b | 82.0a | 4.0a | 26.1b | 103.5c | 19.3a | 98.0c | 133.0a | 12.5a | 105.8b | ||
| JG | 32.0 | 0.0 | 10.8b | 50.8 | 0.0 | 33.2a | 85.0a | 3.8a | 31.5c | 113.5b | 14.3ab | 103.0b | 120.5b | 9.5b | 121.6a | |||
| HM | 31.3 | 2.5a | 16.4a | 46.8 | 2.5 | 23.1b | 86.5a | 5.3a | 64.9a | 135.0a | 7.3b | 121.4a | 127.5ab | 11.0ab | 119.9a | |||
| Mean | 32.0 | 0.8 | 12.7 | 48.5 | 1.3 | 26.5 | 84.5 | 4.3 | 40.8 | 117.3 | 13.6 | 107.5 | 127.0 | 11.0 | 115.8 | |||
| Range | 1.4 | 2.5 | 5.7 | 4.0 | 2.5 | 10.1 | 4.5 | 1.5 | 38.8 | 31.5 | 12.0 | 23.4 | 12.5 | 3.0 | 15.7 | |||
| CV (%) | 2.1 | 173.2 | 25.3 | 4.2 | 100.0 | 21.9 | 2.7 | 18.5 | 51.4 | 13.7 | 44.4 | 11.5 | 4.9 | 13.6 | 7.5 | |||
| 2022 | CK | 23.5b | 5.5a | 10.4ab | 52.1b | 15.8a | 46.8a | 68.8b | 32.5a | 74.5b | 75.ab | 28.8b | 94.5a | |||||
| JG | 27.4a | 2.8b | 11.0a | 61.0a | 9.9c | 39.1b | 66.8c | 24.5c | 78.9b | 69.8b | 31.3a | 94.6a | ||||||
| HM | 28.1a | 5.0a | 10.2b | 53.8b | 13.8b | 48.0a | 72.5a | 26.5b | 89.3a | 80.5a | 14.3c | 57.1b | ||||||
| Mean | 26.3 | 4.4 | 10.5 | 55.6 | 13.1 | 44.6 | 69.4 | 27.8 | 80.9 | 75.3 | 24.8 | 82.1 | ||||||
| Range | 4.7 | 2.8 | 0.8 | 9.0 | 5.9 | 8.9 | 5.8 | 8.0 | 14.8 | 10.6 | 17.0 | 37.5 | ||||||
| CV (%) | 9.5 | 33.2 | 3.6 | 8.5 | 22.8 | 10.8 | 4.2 | 15.0 | 9.4 | 7.1 | 37.1 | 26.3 | ||||||
Note: ZG was Plant height / cm, FZ was branch number/number, JY was stem leaf dry weight /g; Same below.
Table 8.
Correlation analysis table of potato yield and components.
| Test Years |
Yield | Potato weight per plant | Number of tubers per plant | Average single potato weight | Number of large and medium potatoes | |
| 2021 | Yield | 1 | ||||
| Potato weight per plant | 0.697* | 1 | ||||
| Number of tubers per plant | -0.865** | 0.868** | 1 | |||
| Average single potato weight | 0.048 | 0.182 | -0.071 | 1 | ||
| Number of large and medium potatoes |
-0.772* | 0.551 | 0.607 | -0.094 | 1 | |
| 2022 | Yield | 1 | ||||
| Potato weight per plant | 0.862** | 1 | ||||
| Number of tubers per plant | -0.877** | -0.751* | 1 | |||
| Average single potato weight | 0.631 | 0.541 | -0.878** | 1 | ||
| Number of large and medium potatoes | -0.327 | -0.414 | -0.125 | 0.275 | 1 |
Note: * A significant correlation at the 0.05 level, * *.A significant correlation at the 0.01 level.
Table 9.
Correlation analysis table of yield components and growth index.
| Test Years |
Index | Measuring time | Potato weight per plant | Average single potato weight | Number of tubers per plant | Number of large and medium potatoes | Index | Measuring time | Potato weight per plant | Average single potato weight | Number of tubers per plant | Number of large and medium potatoes |
| 2021 | Plant height | 7-11 | 0.033 | -0.18 | -0.421 | -0.082 | Stem dry weight | 7-11 | 0.806** | 0.882** | -0.296 | 0.795* |
| 8-14 | -0.608 | -0.434 | 0.3 | -0.12 | 8-14 | -0.875** | -0.689* | -0.277 | -0.164 | |||
| 8-29 | 0.021 | 0.243 | -0.48 | 0.691* | 8-29 | 0.922** | 0.950** | 0.096 | 0.668* | |||
| 9-20 | 0.498 | 0.593 | -0.058 | 0.853** | 9-20 | 0.785* | 0.869** | 0.023 | 0.659 | |||
| 10-17 | 0.063 | 0.097 | 0.525 | -0.474 | 10-17 | 0.795* | 0.771* | -0.191 | 0.266 | |||
| Branch number | 7-11 | 0.883** | 0.945** | -0.032 | 0.767* | Leaf dry weight | 7-11 | 0.790* | 0.745* | -0.334 | 0.679* | |
| 8-14 | -0.88** | -0.925** | -0.087 | -0.43 | 8-14 | -0.729* | -0.556 | -0.32 | 0.051 | |||
| 8-29 | 0.297 | 0.629 | -0.232 | 0.304 | 8-29 | 0.938** | 0.963** | 0.048 | 0.642 | |||
| 9-20 | -0.392 | -0.688* | 0.397 | -0.781* | 9-20 | 0.885** | 0.786* | 0.405 | 0.52 | |||
| 10-17 | 0.231 | 0.093 | 0.368 | -0.582 | 10-17 | -0.33 | -0.219 | 0.064 | 0.262 | |||
| 2022 | Plant height | 7-16 | 0.919** | -0.902** | 0.644 | -0.194 | Stem dry weight | 7-16 | -0.191 | 0.304 | -0.572 | -0.172 |
| 8-4 | 0.237 | -0.763* | 0.835** | 0.57 | 8-4 | 0.362 | 0.116 | -0.189 | -0.203 | |||
| 8-23 | 0.569 | 0.088 | -0.268 | -0.602 | 8-23 | 0.284 | -0.09 | -0.232 | 0.186 | |||
| 9-19 | 0.141 | 0.368 | -0.661 | -0.314 | 9-19 | -0.575 | 0.33 | -0.287 | 0.024 | |||
| Branch number | 7-16 | -0.233 | 0.743* | -0.837** | -0.539 | Leaf dry weight | 7-16 | -0.185 | 0.096 | -0.337 | 0.045 | |
| 8-4 | -0.332 | 0.634 | -0.556 | 0.114 | 8-4 | -0.153 | 0.432 | -0.408 | -0.195 | |||
| 8-23 | -0.752* | 0.963** | -0.938** | -0.025 | 8-23 | 0.006 | -0.006 | -0.199 | 0.486 | |||
| 9-19 | -0.667* | 0.105 | 0.199 | 0.646 | 9-19 | -0.613 | 0.187 | -0.069 | 0.262 |
Table 10.
Correlation analysis table of growth index with soil water in different periods of potato growth.
Table 10.
Correlation analysis table of growth index with soil water in different periods of potato growth.
| Growth stage | Soil layer | A | B | C | D | E | ||||||||||
| ZG | FZ | JY | ZG | FZ | JY | ZG | FZ | JY | ZG | FZ | JY | ZG | FZ | JY | ||
| A | 20 | -0.55* | 0.53* | -051* | 0.72** | 0.66** | 0.86** | -0.56* | 0.72** | 0.51* | -0.70** | 0.45 | -0.58* | -0.88** | -0.79* | 0.55 |
| 40 | 0.69** | -0.71** | 0.39 | -0.50* | -0.84** | -0.80** | 0.70** | -0.86** | -0.71** | 0.78** | -0.45 | 0.64** | -0.32 | -0.53 | 0.10 | |
| 60 | 0.66** | -0.75** | 0.39 | -0.39 | -0.86** | -0.78** | 0.80** | -0.87** | -0.72** | 0.79** | -0.51* | 0.64** | -0.86** | -0.92** | 0.43 | |
| 80 | 0.68** | -0.72** | 0.40 | -0.58* | -0.83** | -0.84** | 0.92** | -0.90** | -0.72** | 0.84** | -0.70** | 0.50* | -0.13 | -0.18 | -0.34 | |
| 100 | 0.74** | -0.76** | 0.41 | -0.65** | -0.85** | -0.86** | 0.86** | -0.93** | -0.78** | 0.84** | -0.57* | 0.55* | 0.17 | 0.01 | -0.61 | |
| 0~100 | 0.70** | -0.74** | 0.35 | -0.48* | -0.84** | -0.76** | 0.83** | -0.88** | -0.75** | 0.79** | -0.55* | 0.54* | -0.56 | -0.65 | -0.03 | |
| B | 20 | -0.26 | -0.82** | -0.53* | 0.55* | -0.78** | -0.92** | 0.44 | -0.28 | 0.24 | -0.35 | -0.23 | -0.07 | |||
| 40 | -0.07 | -0.59** | -0.33 | 0.54* | -0.58* | -0.43 | 0.51* | -0.52* | 0.28 | -0.92** | -0.83** | 0.93** | ||||
| 60 | -0.21 | -0.39 | -0.34 | 0.15 | -0.35 | 0.04 | 0.54* | -0.41 | 0.43 | -0.08 | 0.01 | 0.65 | ||||
| 80 | -0.39 | -0.52* | -0.42 | 0.46 | -0.54* | -0.17 | 0.71** | -0.73** | 0.26 | -0.20 | -0.04 | 0.69* | ||||
| 100 | -0.33 | -0.69** | -0.56* | 0.44 | -0.67** | -0.31 | 0.64** | -0.61** | 0.25 | 0.01 | 0.21 | 0.48 | ||||
| 0~100 | -0.19 | -0.67** | -0.59* | 0.69** | -0.72** | -0.48* | 0.53* | -0.61** | 0.10 | -0.23 | -0.24 | -0.30 | ||||
| C | 20 | -0.70** | 0.71** | 0.56* | -0.86** | 0.70** | -0.47* | 0.22 | 0.18 | -0.71* | ||||||
| 40 | -0.02 | -0.06 | 0.30 | 0.08 | -0.01 | 0.17 | -0.05 | 0.08 | 0.19 | |||||||
| 60 | 0.56* | -0.61** | -0.06 | 0.77** | -0.72** | 0.41 | -0.01 | -0.11 | 0.52 | |||||||
| 80 | 0.74** | -0.83** | -0.44 | 0.85** | -0.74** | 0.53* | -0.26 | -0.49 | 0.73* | |||||||
| 100 | 0.33 | -0.48* | -0.05 | 0.52* | -0.28 | 0.62** | 0.35 | 0.19 | 0.18 | |||||||
| 0~100 | 0.71** | -0.87** | -0.64** | 0.68** | -0.44 | 0.55* | -0.23 | -0.24 | -0.30 | |||||||
| D | 20 | 0.53* | -0.39 | 0.33 | 0.19 | 0.29 | -0.64 | |||||||||
| 40 | 0.62** | -0.57* | 0.37 | -0.36 | -0.41 | 0.23 | ||||||||||
| 60 | 0.76** | -0.58* | 0.40 | -0.47 | -0.54 | 0.47 | ||||||||||
| 80 | 0.74** | -0.69** | 020 | -0.32 | -0.17 | 0.20 | ||||||||||
| 100 | 0.66** | -0.55* | 0.24 | 0.23 | 0.16 | -0.58 | ||||||||||
| 0~100 | 0.72** | -0.60** | 0.36 | -0.23 | -0.24 | -0.30 | ||||||||||
| E | 20 | -0.01 | -0.17 | 0.06 | ||||||||||||
| 40 | 0.06 | 0.04 | -0.26 | |||||||||||||
| 60 | 0.81** | 0.65 | -0.50 | |||||||||||||
| 80 | -0.39 | -0.30 | 0.82** | |||||||||||||
| 100 | -0.51 | -0.69* | 0.58 | |||||||||||||
| 0~100 | -0.24 | -0.42 | 0.57 | |||||||||||||
Table 11.
Economic benefits of straw mulching mechanized no-tillage on potato production, based on data from experimental field plots in Tongwei and Lintao, Gansu Province, China in 2021 and 2022.
Table 11.
Economic benefits of straw mulching mechanized no-tillage on potato production, based on data from experimental field plots in Tongwei and Lintao, Gansu Province, China in 2021 and 2022.
| Treatment | Mean yield (kg/hm2) | Value of output (RMB/hm2) |
Input (RMB/hm2) | Net income (RMB/hm2) | Output-input ratio | |||
| Cladding material | Labor |
Others (fertilizers, seeds, pesticides, etc.) |
Total investment | |||||
| JG | 34722.75 | 24305.93 | 2160.00 | 3600.00 | 4500.00 | 10260.00 | 14045.93 | 1.37 |
| HM | 31999.43 | 22399.60 | 1650.00 | 4000.00 | 4500.00 | 10150.00 | 12249.60 | 1.21 |
| CK | 32931.30 | 23051.91 | 0.00 | 6000.00 | 4500.00 | 10500.00 | 12551.91 | 1.20 |
Note: The output value is 1.4 RMB/kg according to the unified price of fresh potato, and the manual and other calculations are based on the actual occurrence of the test site.
Disclaimer/Publisher’s Note: The statements, opinions and data contained in all publications are solely those of the individual author(s) and contributor(s) and not of MDPI and/or the editor(s). MDPI and/or the editor(s) disclaim responsibility for any injury to people or property resulting from any ideas, methods, instructions or products referred to in the content. |
© 2024 by the authors. Licensee MDPI, Basel, Switzerland. This article is an open access article distributed under the terms and conditions of the Creative Commons Attribution (CC BY) license (http://creativecommons.org/licenses/by/4.0/).
Copyright: This open access article is published under a Creative Commons CC BY 4.0 license, which permit the free download, distribution, and reuse, provided that the author and preprint are cited in any reuse.


