Preprint
Article

Water Injection for Cloud Cavitation Suppression: Analysis on the Effects of Injection Parameters

Altmetrics

Downloads

97

Views

33

Comments

0

A peer-reviewed article of this preprint also exists.

Submitted:

05 July 2024

Posted:

09 July 2024

You are already at the latest version

Alerts
Abstract
This study investigates cloud cavitation suppression around a model scale NACA66 hydrofoil using active water injection and explores the effect of multiple injection parameters. Numerical simulations and a mixed-level orthogonal test method are employed to systematically analyze the impact of jet angle αjet, jet location Ljet, and jet velocity Ujet on cavitation suppression efficiency and hydrofoil energy performance. The study reveals that jet location has the greatest influence on cavitation suppression, while jet angle has the greatest influence on hydrofoil energy performance. The optimal parameter combination (Ljet = 0.30C, αjet = +60 degrees, Ujet = 3.25 m/s) effectively balances energy performance and cavitation suppression, reducing cavitation volume by 49.34% and improving lift-drag ratio by 8.55%. The study found that the jet's introduction not only enhances vapor condensation and reduces the intensity of the vapor-liquid exchange process but also disrupts the internal structure of cavitation clouds and elevates pressure on the hydrofoil suction surface, thereby effectively suppressing cavitation. Further analysis shows that positive-going horizontal jet components enhance the lift-drag ratio, while negative-going components have a detrimental effect. Jet arrangements near the trailing edge negatively impact both cavitation suppression and energy performance. These findings provide valuable reference for selecting optimal injection parameters to achieve a balance between cavitation suppression and energy performance in hydrodynamic systems.
Keywords: 
Subject: Engineering  -   Marine Engineering

1. Introduction

Cavitation, a prevalent phenomenon in fluid systems engineering [1,2,3], presents multifaceted challenges ranging from material erosion [4,5] and efficiency losses in fluid machinery [6] to increased noise [7] and performance degradation in hydrodynamic systems such as hydrofoils and propellers [1,2,3,4,5,6,7]. Characterized by the formation and collapse of vapor-filled cavities due to local pressures falling below the liquid’s vapor pressure [8], its suppression is crucial for optimizing fluid system performance. To mitigate these adverse effects and optimize fluid system performance, effective cavitation suppression is of utmost importance.
Flow control strategies are dichotomized into passive and active methods. Passive control, leveraging fixed geometries or surface modifications, offers simplicity and cost-effectiveness but often lacks adaptability to varying flow conditions [8]. Conversely, active control methods provide dynamic adjustability, crucial for complex flow scenarios, albeit at the expense of higher complexity and energy requirements [9,10].
Passive flow control methods involve the use of fixed geometries or modifications to the surfaces of the system to influence the flow behavior. These modifications can include the use of specially designed surface textures [8], dimples, vortex generators [11,12], or obstacles [13,14] to interfere flow separation, reduce drag, or suppress cavitation. Kadivar et al. [15,16] experimentally investigated the arrangement of bubble generators on the hydrofoil, observing significant reduction in the low-pressure area and effective suppression of cavitation development. Liu et al. [17,18] introduced a C groove structure for hydrofoil tips, showing through simulations its benefits in energy efficiency, cavitation reduction, and vortex core minimization. Yang et al. [19] applied a wavy leading edge on a hydrofoil and focused on cavitation noise characteristics. Qiu et al. [20] found that micro-vortex generators angled to the inflow direction can alter flow dynamics around hydrofoils. Amini et al. [21] found that 10%-bent 90° downward winglets on an elliptical hydrofoil effectively suppress tip vortex cavitation without compromising hydrodynamic efficiency. Cheng et al. [22,23] introduced overhanging grooves (OHGs) at hydrofoil tips as a novel method for tip-leakage vortex cavitation control, demonstrating significant suppression across various gap sizes with minimal impact on hydrofoil performance through experimental and numerical analysis.
Active control methods, characterized by their adaptability, have been explored through various experimental and numerical studies. Timoshevskiy et al. [24,25,26] conducted a study on the impact of tangential liquid injection on the suction surface of a hydrofoil, achieving effective suppression of sheet cavitation through experimental and numerical methods. Chang et al. [27] observed that water injection can delay the inception of tip vortex cavitation, while Lee et al. [28] successfully controlled propeller cavitation using water injection in rotating machinery. De Giorgi et al. [29] employed a single synthetic jet actuator on the hydrofoil, leading to the suppression of cloud cavitation. Maltsev et al. [30] demonstrated that active jet flow can maintain a separation-less flow around the hydrofoil at high attack angles, and Lu et al. [31] achieved efficient suppression of sheet/cloud cavitation by applying water injection to the suction surface of a NACA66 hydrofoil. Liu et al. [32] demonstrated the effectiveness of water injection for TVC (tip vortex cavitation) suppression, with parametric studies showing increased cavitation inhibition rate with higher injection velocity or cross-streamwise velocity component.
Despite these advancements, a gap remains in the comprehensive understanding of how different control parameters influence cavitation suppression and the hydrodynamic performance. Previous research has predominantly focused on the effectiveness of active control using configurations limited to single-injection parameters. It has restricted the depth of understanding regarding the multifaceted impact of jet variations on cavitation control. Therefore, it inspires us to bridge this gap by providing a detailed investigation into the effects of various injection parameters on cavitation dynamics and the lift-drag ratio of hydrofoils.
In the literature, active and passive control methods for cavitation are mainly explored through numerical simulations and some experimental studies. Key techniques include Large Eddy Simulation (LES) and the Reynolds time-averaged method, with LES favored for its detailed turbulence capture despite high computational costs, and the Reynolds method preferred for its efficiency in extensive numerical analyses. Studies by Liu et al. [33], Li et al. [34,35], and Huang et al. [36,37] demonstrate LES’s effectiveness in analyzing cavitating flows, while Yu et al. [38], Cheng et al. [39], Long et al. [40], and Han et al. [41] validate the Reynolds method’s accuracy and predictive capabilities in various cavitation scenarios. The Reynolds time-averaged method offers reasonable accuracy and computational efficiency. It is preferable for scenarios involving a large number of multi-group numerical calculations or when conducting parametric studies with numerous simulations.
Current research on active control methods in cavitation suppression primarily examines the effects of injection parameters at fixed positions. However, the comprehensive impact of varying these parameters, including jet position, inclination angle, and velocity, on the cavitating flow field remains underexplored. This gap highlights the need for a more nuanced understanding of how these variables collectively influence cavitation dynamics and hydrofoil performance. Therefore, investigating multiple parameters of active jets can provide insights into how different parameters influence the flow field, leading to a broader understanding of the cavitation suppression mechanism.
In our prior work, we demonstrated the potential of active jet methods to significantly suppress cavitation by employing a single row of jet holes on a hydrofoil surface [32,42]. These experiments, however, were constrained by the limited range of jet positions and angles tested. Further, our numerical analyses indicated that specific jet placements could adversely affect the hydrofoil’s lift-drag ratio, suggesting a trade-off between cavitation suppression and aerodynamic efficiency [9]. Recognizing the limitations of focusing on singular injection parameters, this study expands the investigation to encompass multiple jet variables—angle, position, and velocity—to ascertain their integrated effect on both cavitation suppression and the lift-drag ratio of hydrofoils.
This manuscript expands on existing research by exploring multiple injection parameters, providing a more comprehensive perspective on active control strategies that builds upon the current body of literature. By systematically analyzing the roles of these variables, this paper aims to identify an optimal jet configuration that effectively balances cavitation suppression with hydrodynamic performance. Our findings propose an optimal combination of injection parameters, which is capable of enhancing cavitation control while maintaining, or even improving, the lift-drag ratio of hydrofoils.
The manuscript is organized as follows: Section 2 describes the methodology, including the computational setup and mesh details. Section 3 elaborates on the numerical methods employed and the setup for the simulations. Section 4 introduces the orthogonal test method used to evaluate the influence of injection parameters on cavitation suppression and hydrofoil performance. Finally, Section 5 discusses the results of these tests, offering insights into the optimal injection parameters for improved flow control.

2. Research Object

2.1. Hydrofoil and Jet Configuration

Figure 1 (a) illustrates the scaled model of the NACA66 hydrofoil, hereinafter referred to as the “original hydrofoil” or “Hori” for conciseness, which will be discussed in subsequent sections of this paper. The hydrofoil features a chord length (C) of 0.07 m and a span length of 0.021 m, equivalent to 0.3C. Leroux et al. [43,44] performed detailed cavitation experiments on the NACA66 hydrofoil, providing the XY geometric data necessary to define the NACA66 profile’s shape in reference [43]. In our research, we utilize a reduced-scale model of the NACA66 hydrofoil, decreasing the chord length from the 150 mm reported in previous studies [43] to 70 mm, while preserving the proportional relationship between the dimensions.
Figure 1 (b) depicts a hydrofoil equipped with a single row of nine jet holes on its suction surface, designed to inject water into the flow field. Each hole has a diameter (Φ) of 1.4 mm and is spaced 2.35 mm apart from its neighbors. This modified hydrofoil will henceforth be referred to as the “jet hydrofoil” or “Hori”. In Figure 1 (e), three critical parameters of the jet configuration are highlighted. The holes are located a distance (Ljet) from the leading edge, and the angle of jet injection (αjet) is measured in degrees relative to a vertical reference line. Notably, each jet hole releases water at a consistent flow rate, with the jet velocity denoted as Ujet. The mainstream flow direction is parallel to the x-axis, as shown in Figure 1 (e). Therefore, a positive αjet implies water injection in the direction of the mainstream flow, while a negative αjet indicates injection against it. An αjet of 0° means the water is injected perpendicular to the mainstream flow.
The jet diameter Φ and distance d between each hole are considered fixed parameters. The jet angle αjet, jet location Ljet, and jet velocity Ujet are regarded as variable parameters, as they are potential factors that may influence cavitating flows.
For ease of reference, these three factors are denoted as A, B, and C, respectively. To investigate their effects on the cavitating flows, a mixed-level orthogonal table of three factors has been constructed, as summarized in Table 1. The jet angle αjet is varied across five different parameters: -60°, -30°, 0°, +30°, and +60°. Similarly, the jet location Ljet is set at four different levels: 0.19C, 0.30C, 0.45C, and 0.60C. Furthermore, the jet velocity Ujet is categorized into four groups: 2.60 m/s, 2.74 m/s, 2.89 m/s, and 3.25 m/s.
By adopting this mixed-level orthogonal table, the numerical test groups are designed systematically to assess the combined and individual effects of these factors on the cavitating flows surrounding the hydrofoil.

2.2. Computational Domain and Mesh Arrangement

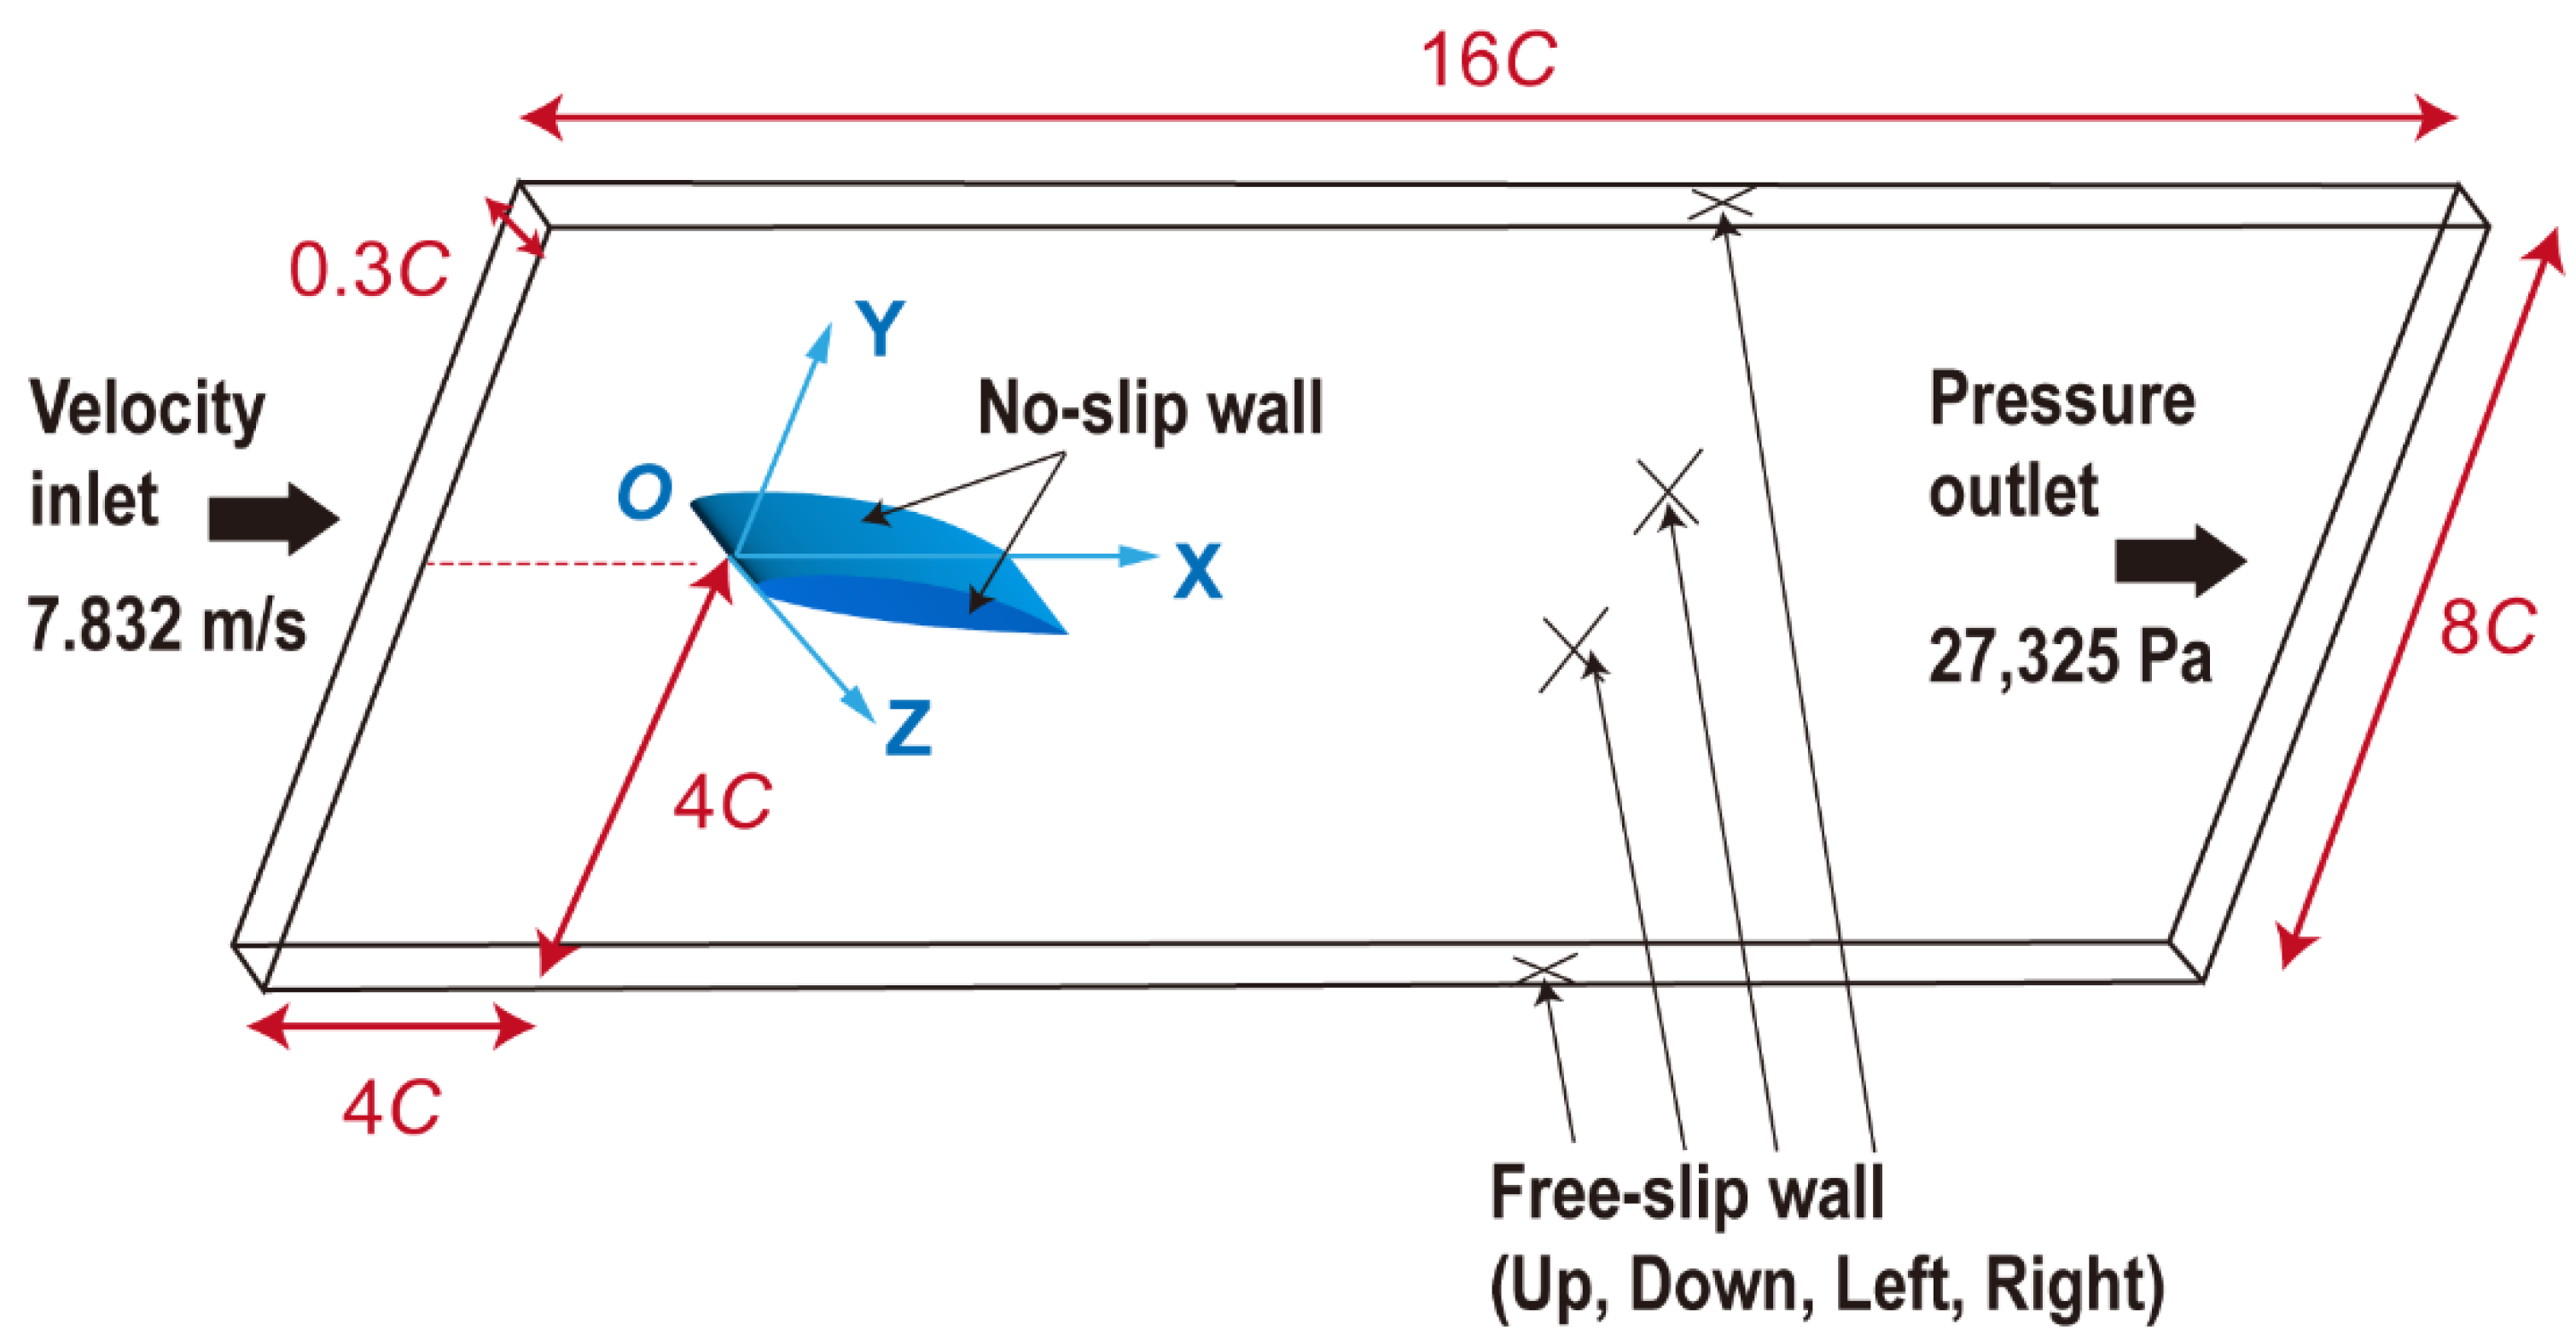
In order to establish the computational domain, a cuboid with dimensions of 16.0C × 4.0C × 0.3C is employed, as visually represented in Figure 2 (b). The hydrofoil is positioned within this computational domain, with an attack angle of 8 degrees. The leading edge of the hydrofoil is positioned 4.0C away from the upstream velocity inlet, while the pressure outlet is situated 12.0C downstream from the leading edge to ensure fully developed flow conditions. No-slip wall boundary conditions are imposed on the hydrofoil surface. Additionally, free-slip wall boundary conditions are implemented on the water tunnel wall, allowing fluid motion along the walls without shear forces.
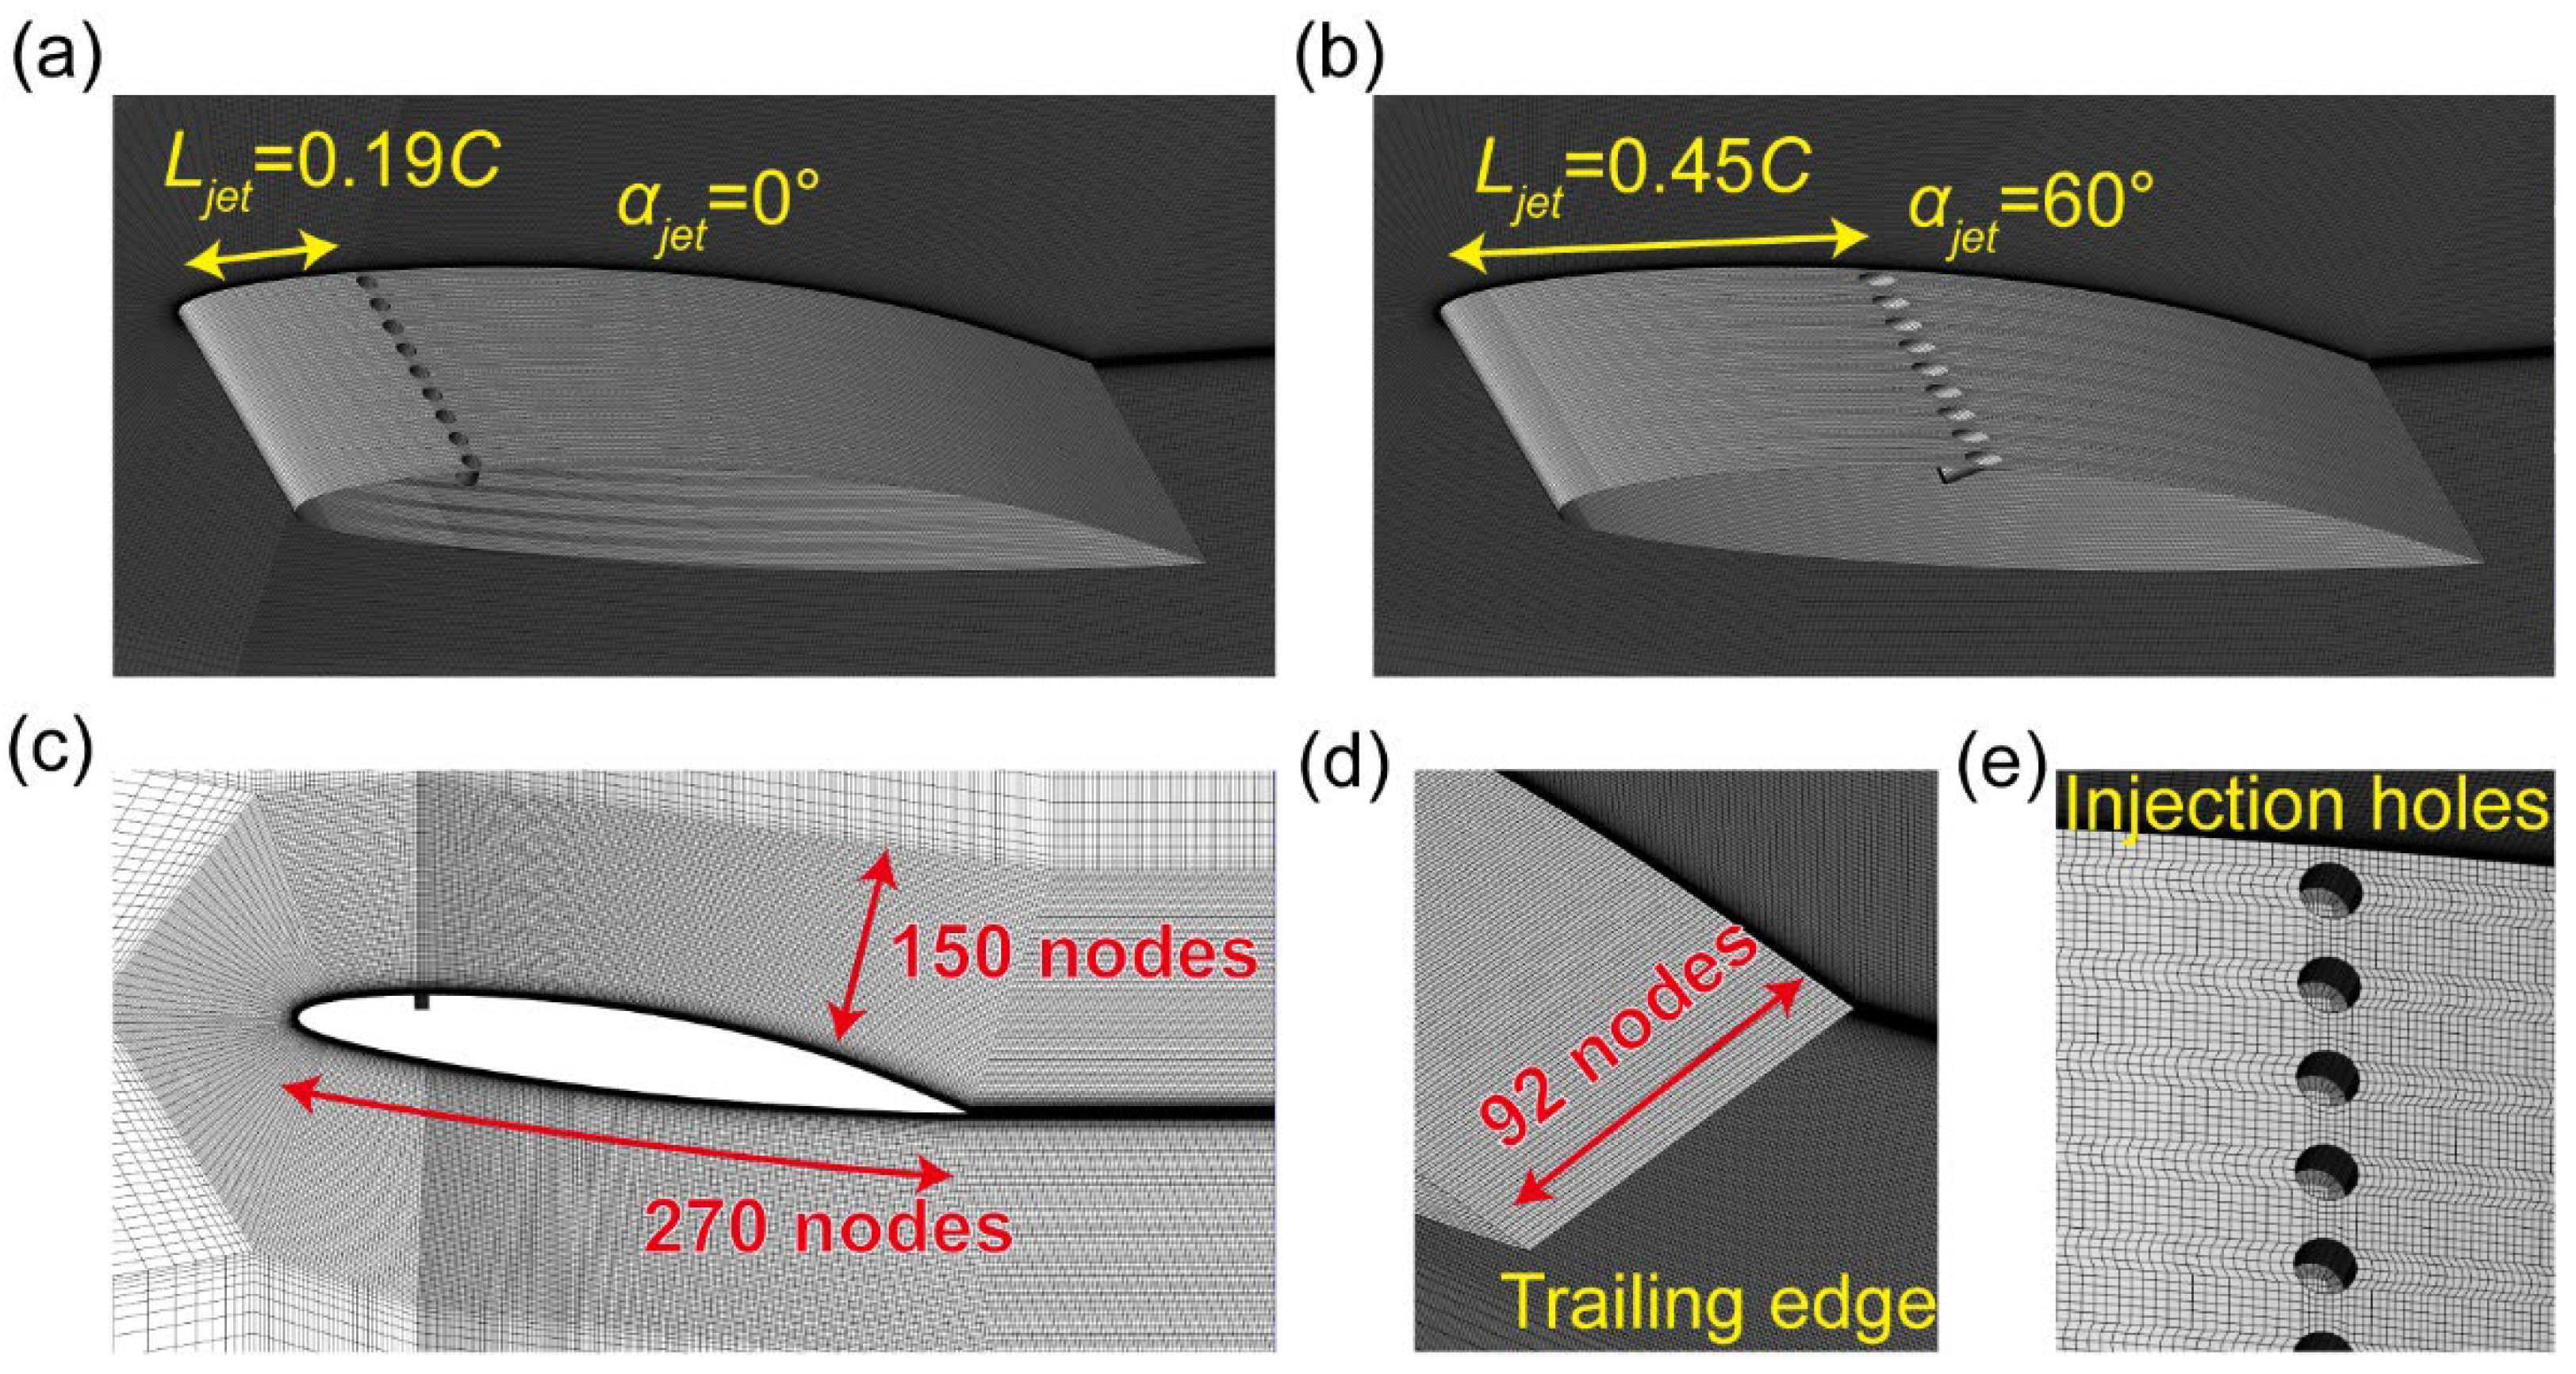
Table 1 presents the variable parameters, namely the jet angle and jet position, which influence the structural configuration of the jet hydrofoil, leading to the generation of 20 distinct mesh configurations (4×5 = 20). Two representative mesh configurations of the jet hydrofoil are illustrated in Figure 3a,b.
This paper focuses on the operating condition of cloud cavitation. The cavitation number, a dimensionless parameter, is introduced to quantify the state of cavitating flow:
σ = p o u t p v 0.5 ρ l U 2
where pout is the outlet pressure and U is the inlet velocity. pv is the saturated vapor pressure, which in this paper is set as 1940 Pa (17). ρl is the density of water, which is set as 998.2 kg/m3.
The numerical cases in this study are conducted under specific working conditions with a Reynolds number Re = 5×10⁵ and a cavitation number σ = 0.83, corresponding to the boundary condition of inlet velocity of 7.832 m/s and outlet pressure of 27,325 Pa. For the jet hydrofoil, the boundary condition of velocity inlet is set on the surface of the jet hole.
The generation of structured meshes based on geometric topology is carried out using the ICEM CFD software. The block around the hydrofoil leading edge is set as topological C-Block in order to generate mesh with fine quality. Although the positions and angles of the jet holes differ among the 20 meshes, their geometric topology remains consistent. Consequently, the span nodes of the jet hydrofoils are uniformly distributed with 92 nodes, while the Y-direction grid of the turbulent core region is refined to 150 nodes. To facilitate a smooth transition from the foil grid to the jet hole grid, the chordwise nodes are also refined, resulting in 270 nodes, as depicted in Figure 3 (c). Figure 3 (e) illustrates the detailed grid arrangement for the jet holes. In an effort to realistically simulate the shape of the “cylindrical jet” in the experiments [31,32,42], a total of 3875 grids are allocated for each jet hole. The jet hydrofoil is characterized by 92 nodes along its spanwise direction.
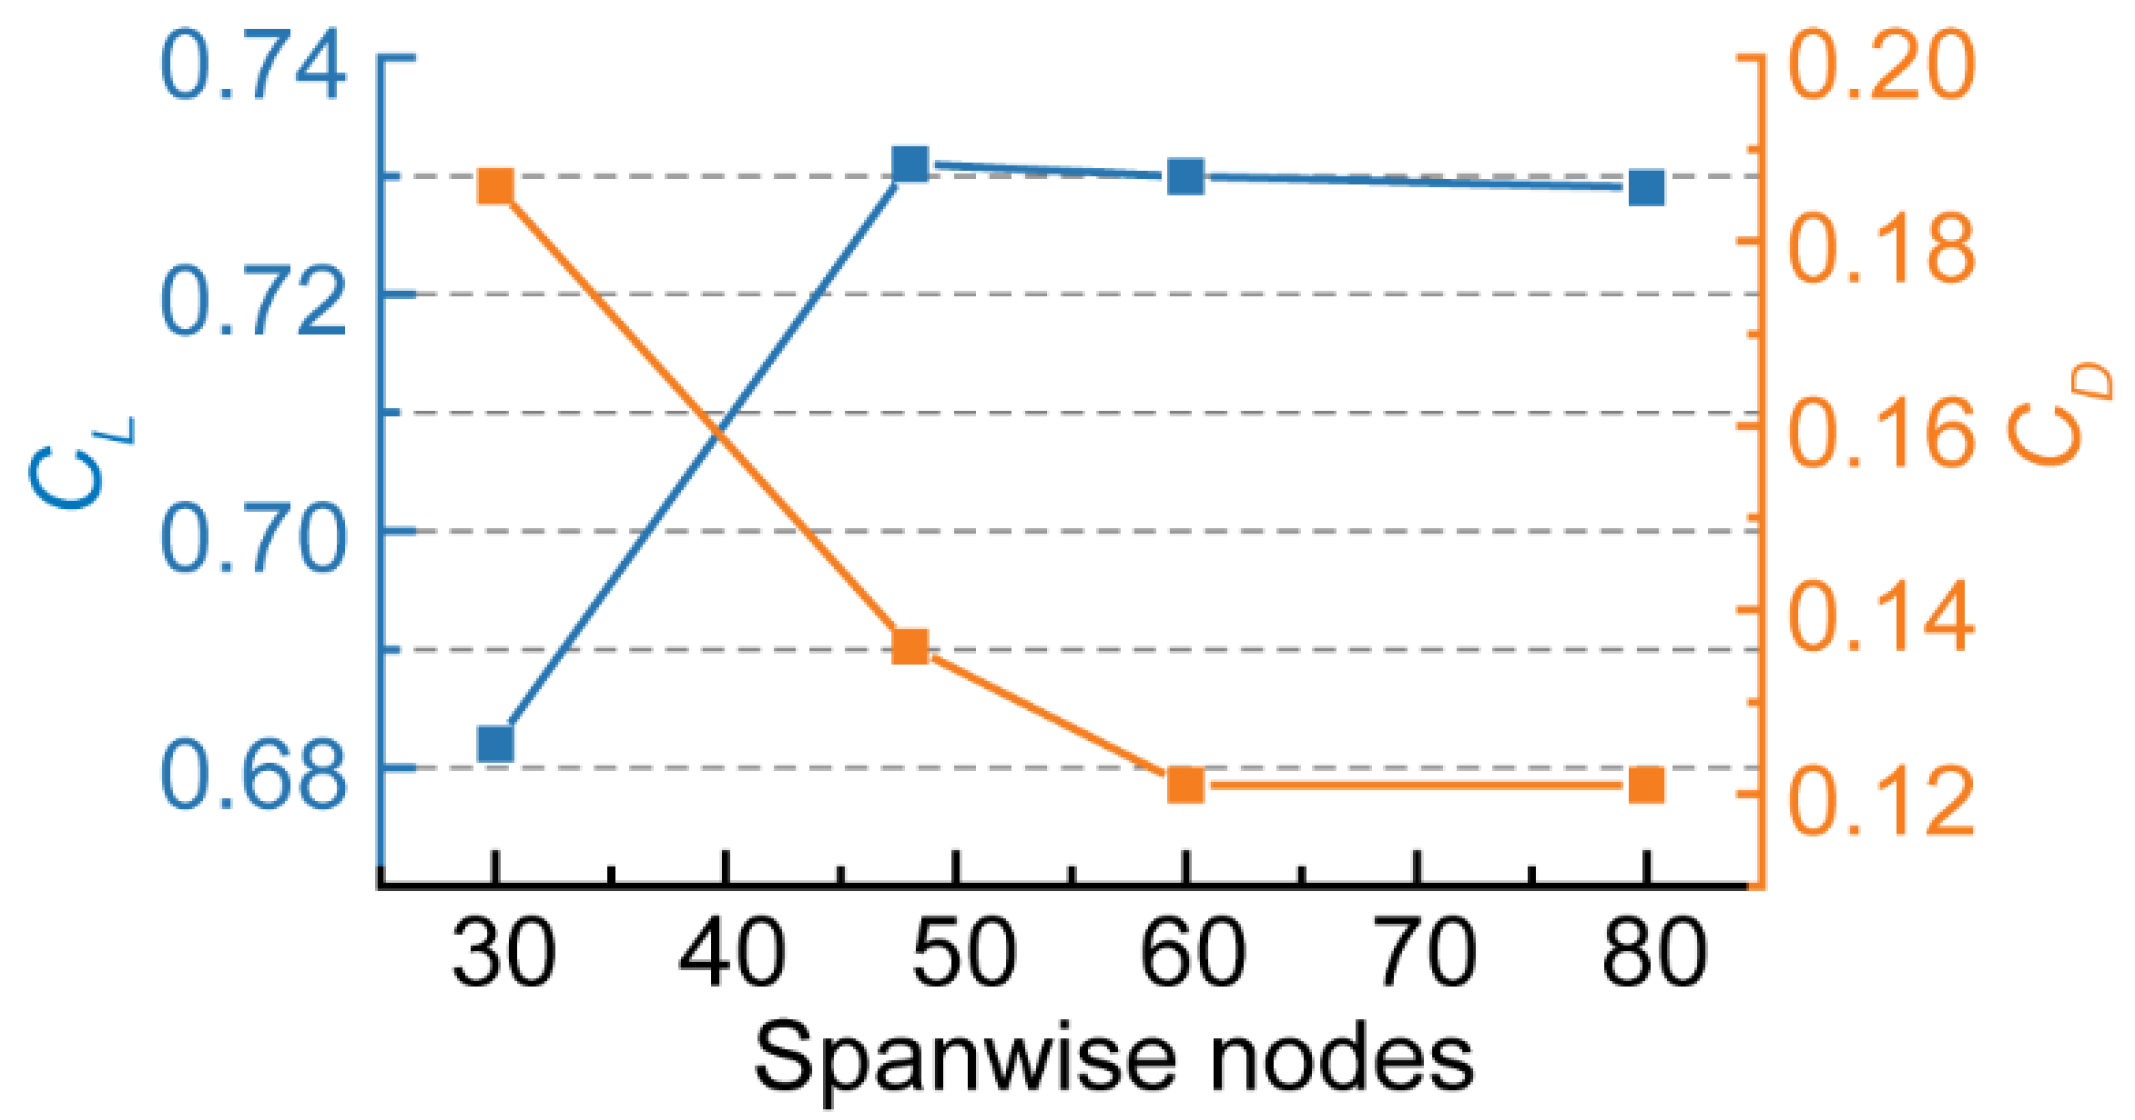
The mesh independence verification for the hydrofoil is typically assessed by increasing the number of spanwise nodes [33,45]. Lift coefficient CL and drag coefficient CD are used as indicators to test the grid independence, and their expressions are as follows:
C L = F L 0.5 ρ l U 2 A C , C D = F D 0.5 ρ l U 2 A C
where U is the inlet velocity and ρl is the water density. A and C are the spanwise and chordwise length of the hydrofoil, respectively. FL and FD are the lift force and drag force acting on the hydrofoil, respectively.
As shown by Figure 4, the change trend of CL and CD stabilizes when the number of spanwise nodes reaches 60. The grid resolution which comprises 60 spanwise nodes has demonstrated sufficient capability to resolve multiphase flow in the previous study [46]. Therefore, this grid configuration is adopted in this work. More information on the grid independence verification and Y plus distribution could be found in our previous work [46].
In comparison, the mesh of jet hydrofoil in Table 2 boasts superior analytical resolution when compared to the original hydrofoil, attributed to its higher number of spanwise and chord nodes, resulting in a total mesh size of nearly 14 million.

3. Numerical Method and Validation

3.1. Governing Equation and Turbulence Model

The cavitating flow is assumed as homogeneous in this study. The vapor and liquid phases share the same velocity and pressure. The continuity and momentum equations in Cartesian coordinates are expressed as follows:
( ρ m U i ) t + ( ρ m U i U j ) x j = 0
( ρ m U i ) t + ( ρ m U i U j ) x j = p x i + x j [ ( μ m + μ t ) ( U i x j + U j x i 2 3 U k x k δ i j ) ]
where ρm, µm, and µt signify the density of the mixed phase and the coefficients for the mixed-phase laminar and turbulent viscosities, respectively. i, j and k refer to the coordinate directions, while p and U represent the pressure and velocity of the mixture phase, respectively.
The mass transport equation of the vapor-water two-phase mixture are expressed as follows:
ρ v α v t + ( ρ v α v u j ) x j = m ˙ + m ˙
ρ m = ρ l α l + ρ v α v
μ m = μ l α l + μ v α v
where αv represents the vapor volume fraction, with l and v denoting the liquid and vapor phases, respectively. The two terms on the right hand of Eq. (5) are the evaporation term and the condensation term in the phase change process of cavitation, respectively.
The SST k-ω turbulence model, also known as the Shear Stress Transport k-ω turbulence model, is particularly effective in capturing complex boundary layer flow and accurately predicts flow separation, reattachment, and transitional boundary layers. The SST k-ω turbulence model is often used in previous work related to cavitating flows around hydrofoil [17,18,47,48].
In the SST k-ω turbulence model, two transport equations are solved: one for the turbulent kinetic energy (k) and the other for the specific dissipation rate (ω). The turbulent viscosity is computed from these equations, and the model includes a blending function that automatically switches between the k-ε and k-ω formulations based on the local flow conditions. The equations are as follows:
t ( ρ m k ) + ( ρ m k U ) = [ ( μ m + σ k μ t ) k ] + P k ρ m β * f β * ( ω k ω 0 k 0 ) + S k
t ( ρ m ω ) + ( ρ m ω U ) = [ ( μ m + σ ω μ t ) ω ] + P ω ρ m β f β ( ω 2 ω 0 2 ) + S ω
where ∇·(ρmkU) represents the divergence of the convective term involving density ρm, turbulent kinetic energy k, and the velocity U. The terms σk and σω are constants. The terms ρmβ*fβ* (ωk - ω0k0) and ρmβfβ(ω2 - ω02) are the pressure-strain terms, where β* and β are model constants, fβ* and fβ are model functions, ωk is the specific dissipation rate of turbulent kinetic energy, and ω0k0 is a reference value for ωk. Sk and Sω represents the turbulent kinetic energy source term and the turbulent specific dissipation rate source term, respectively. They account for any additional energy input to the turbulent flow. Pk and Pω are the production terms, which represents the generation of turbulent kinetic energy and turbulent specific dissipation rate due to mean velocity gradients, respectively.
The turbulent viscosity μt is introduced to close the turbulence equations in the SST k-ω turbulence model [49,50], of which expression is as follows:
μ t = ρ m a 1 k max ( a 1 ω , Ω F 2 )
For turbulence simulations that take into account phase transition effects, the turbulent viscosity needs to be modified to ensure a more accurate simulation of the vapor phase:
μ t _ D C M = μ t ρ v + ( ρ l ρ v ) ( α l ) n ρ v + ( ρ l ρ v ) α l
where the n is constants which set as 10 according to literature [9,10].

3.2. Cavitation Model

The Zwart-Gerber-Belamri cavitation model (ZGB), as proposed by Zwart et al. [51], has been developed to simulate cavitating flows surrounding a three-dimensional hydrofoil. The ZGB model incorporates meticulous linearization and coupling strategies to ensure favorable convergence behavior. Hence, the ZGB model is adopted as the phase transition model in this research, which is presented as follows:
P P v , m ˙ + = C v a p 3 α n u c ( 1 α v ) ρ v R B 2 3 P v P ρ l
P P v , m ˙ = C c o n d 3 α v ρ v R B 2 3 P P v ρ l
P v = P s a t + 1 2 ( 0.39 ρ k )
where RB represents the bubble radius, and its reference value is set at 1 μm. Additionally, the reference value for αnuc, pertaining to the nucleation point, is established as 5×10⁻⁴. The parameters Cvap and Ccond, denoting the evaporation and condensation coefficients, respectively, possess reference values of 50 and 0.01.

3.3. Calculation Setup, Uncertainty Analysis and Validation of Numerical Results

The numerical solution of the three-dimensional cavitating flow is carried out using ANSYS Fluent 2021 R1. The simulation process involves multiple steps: initially, a steady simulation is performed with the cavitation model disabled. Then, a steady simulation of cavitating flow is executed, initiated from the results obtained in the previous non-cavitating flow simulation. Finally, the steady-state outcomes from the cavitating flow simulation are employed as the initial condition for the transient simulation.
The coupling of velocity and pressure fields is solved using the SIMPLE algorithm. The turbulent transport equation and several scalar equations are discretized with the second-order upwind scheme. In determining the computational time step for the unsteady simulations, the total flow time is established at 0.3 seconds, which is sufficient to encompass at least 5 cavitation cycles, thereby ensuring a representative analysis of the cavitation phenomena. The time step is set as Δt = 0.1 ms, and a maximum of 40 iterations per time step are performed to maintain computational accuracy. The residuals target for continuity is set to 1×10⁻⁵ to ensure a high degree of numerical precision.
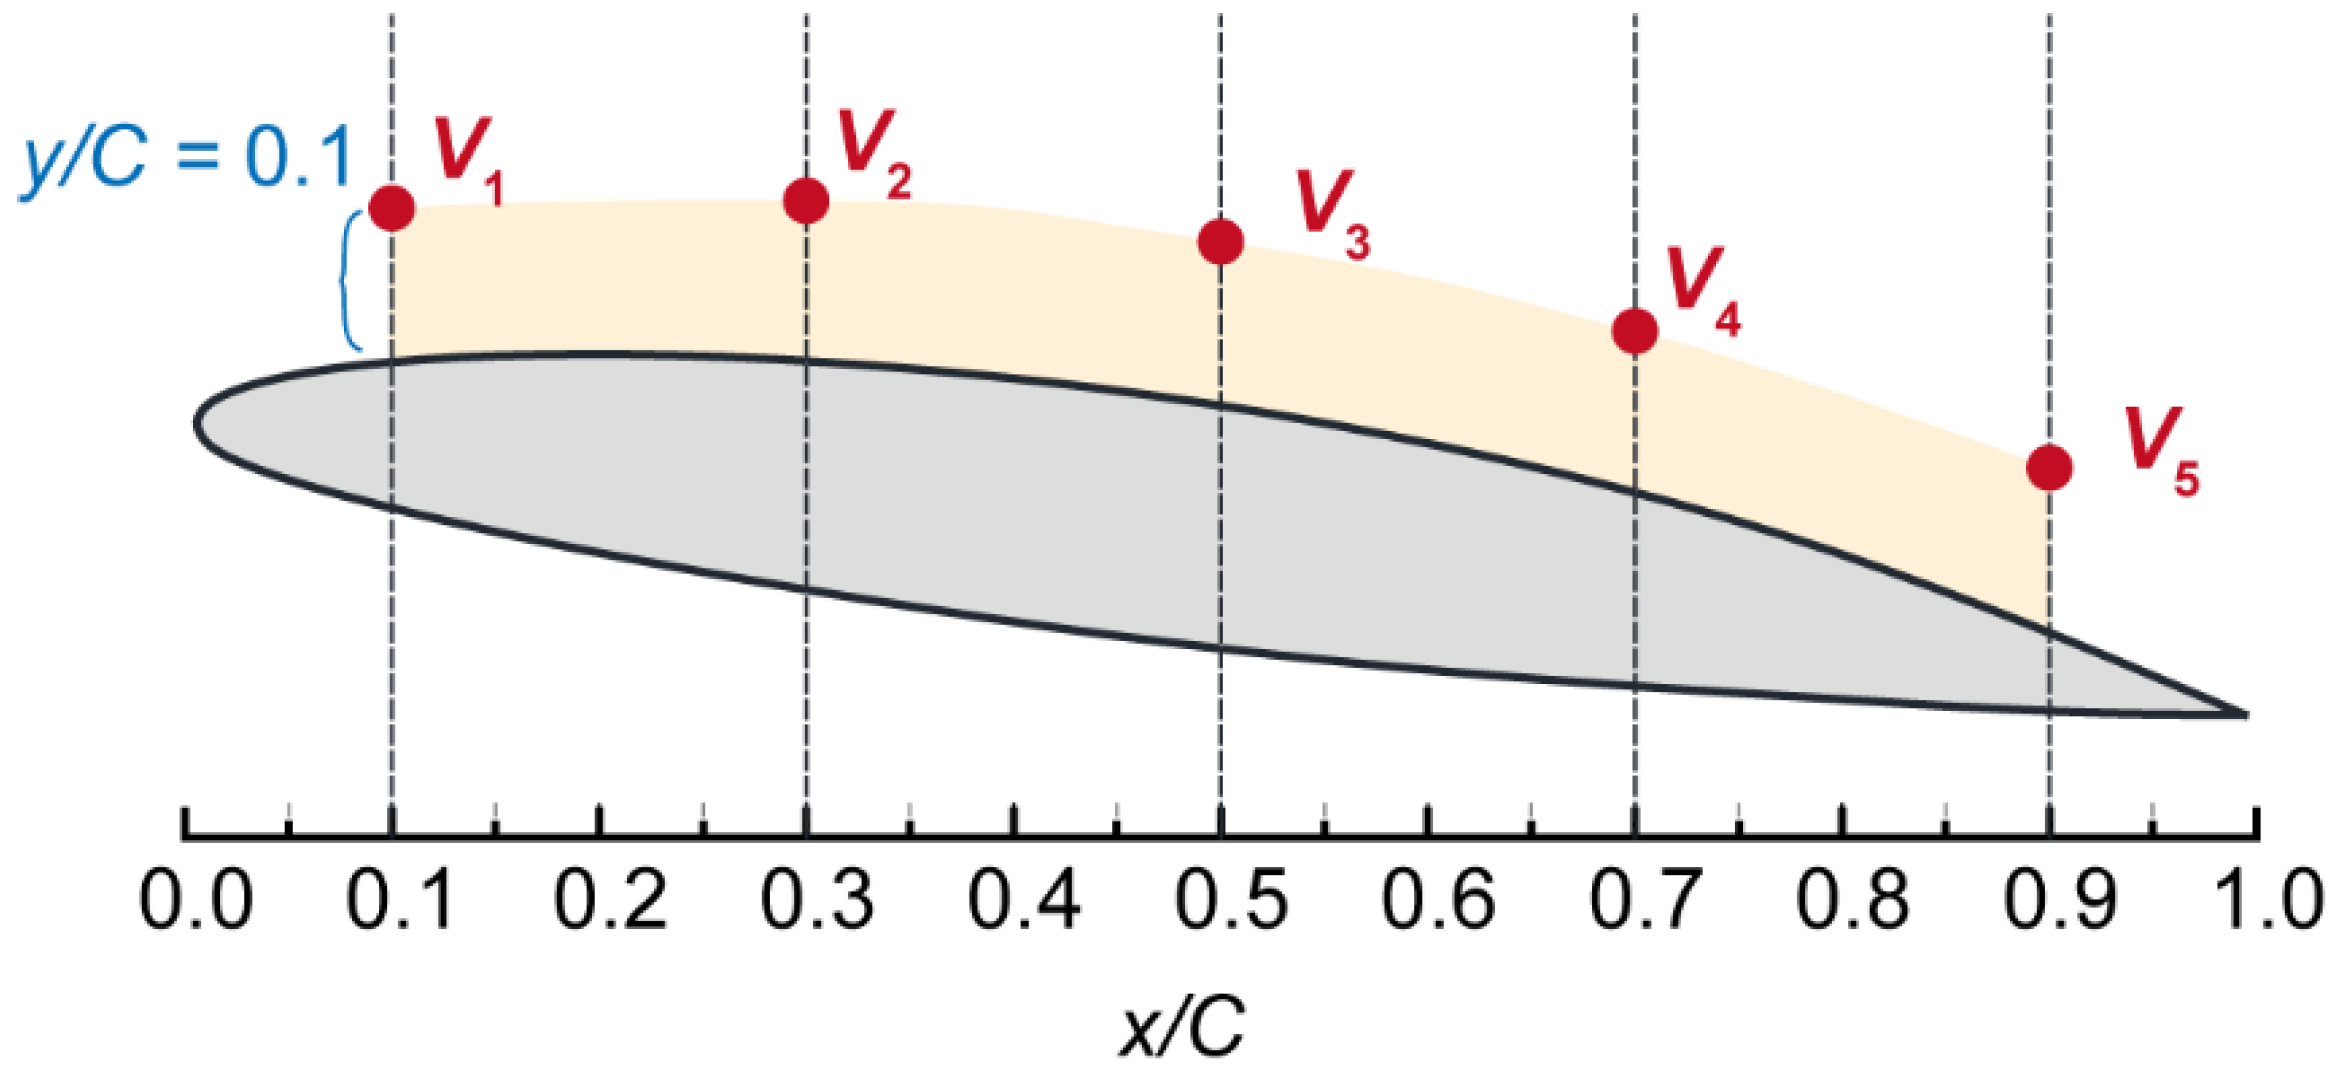
The uncertainty analysis is utilized as an initial step to assess the reliability of computational results. This study employs three distinct methods: the Correction Factor method (CF), Factor of Safety (FS), and Grid Convergence Index (GCI). Detailed descriptions of these methodologies and their application procedures can be found in references [52,53,54,55]. The monitoring points designated for velocity data extraction are illustrated in Figure 5, with each point positioned 0.1C from the hydrofoil’s suction surface.
Table 3 presents the uncertainty associated with the time-averaged velocity measurements. The uncertainties estimated by each method are relatively small for points V1-V3 but significantly larger for V4 and V5, with some data exceeding the 95% confidence interval. This discrepancy is likely attributed to the periodic shedding of cavitation near the hydrofoil’s trailing edge, causing pronounced periodic fluctuations in key metrics like velocity, pressure, and lift coefficient. Such fluctuations result in a broad uncertainty range for both numerical and experimental data. Consequently, in cavitating flow studies, a qualitative comparison between numerical and experimental results is widely accepted as the standard verification method by most researchers in the field.
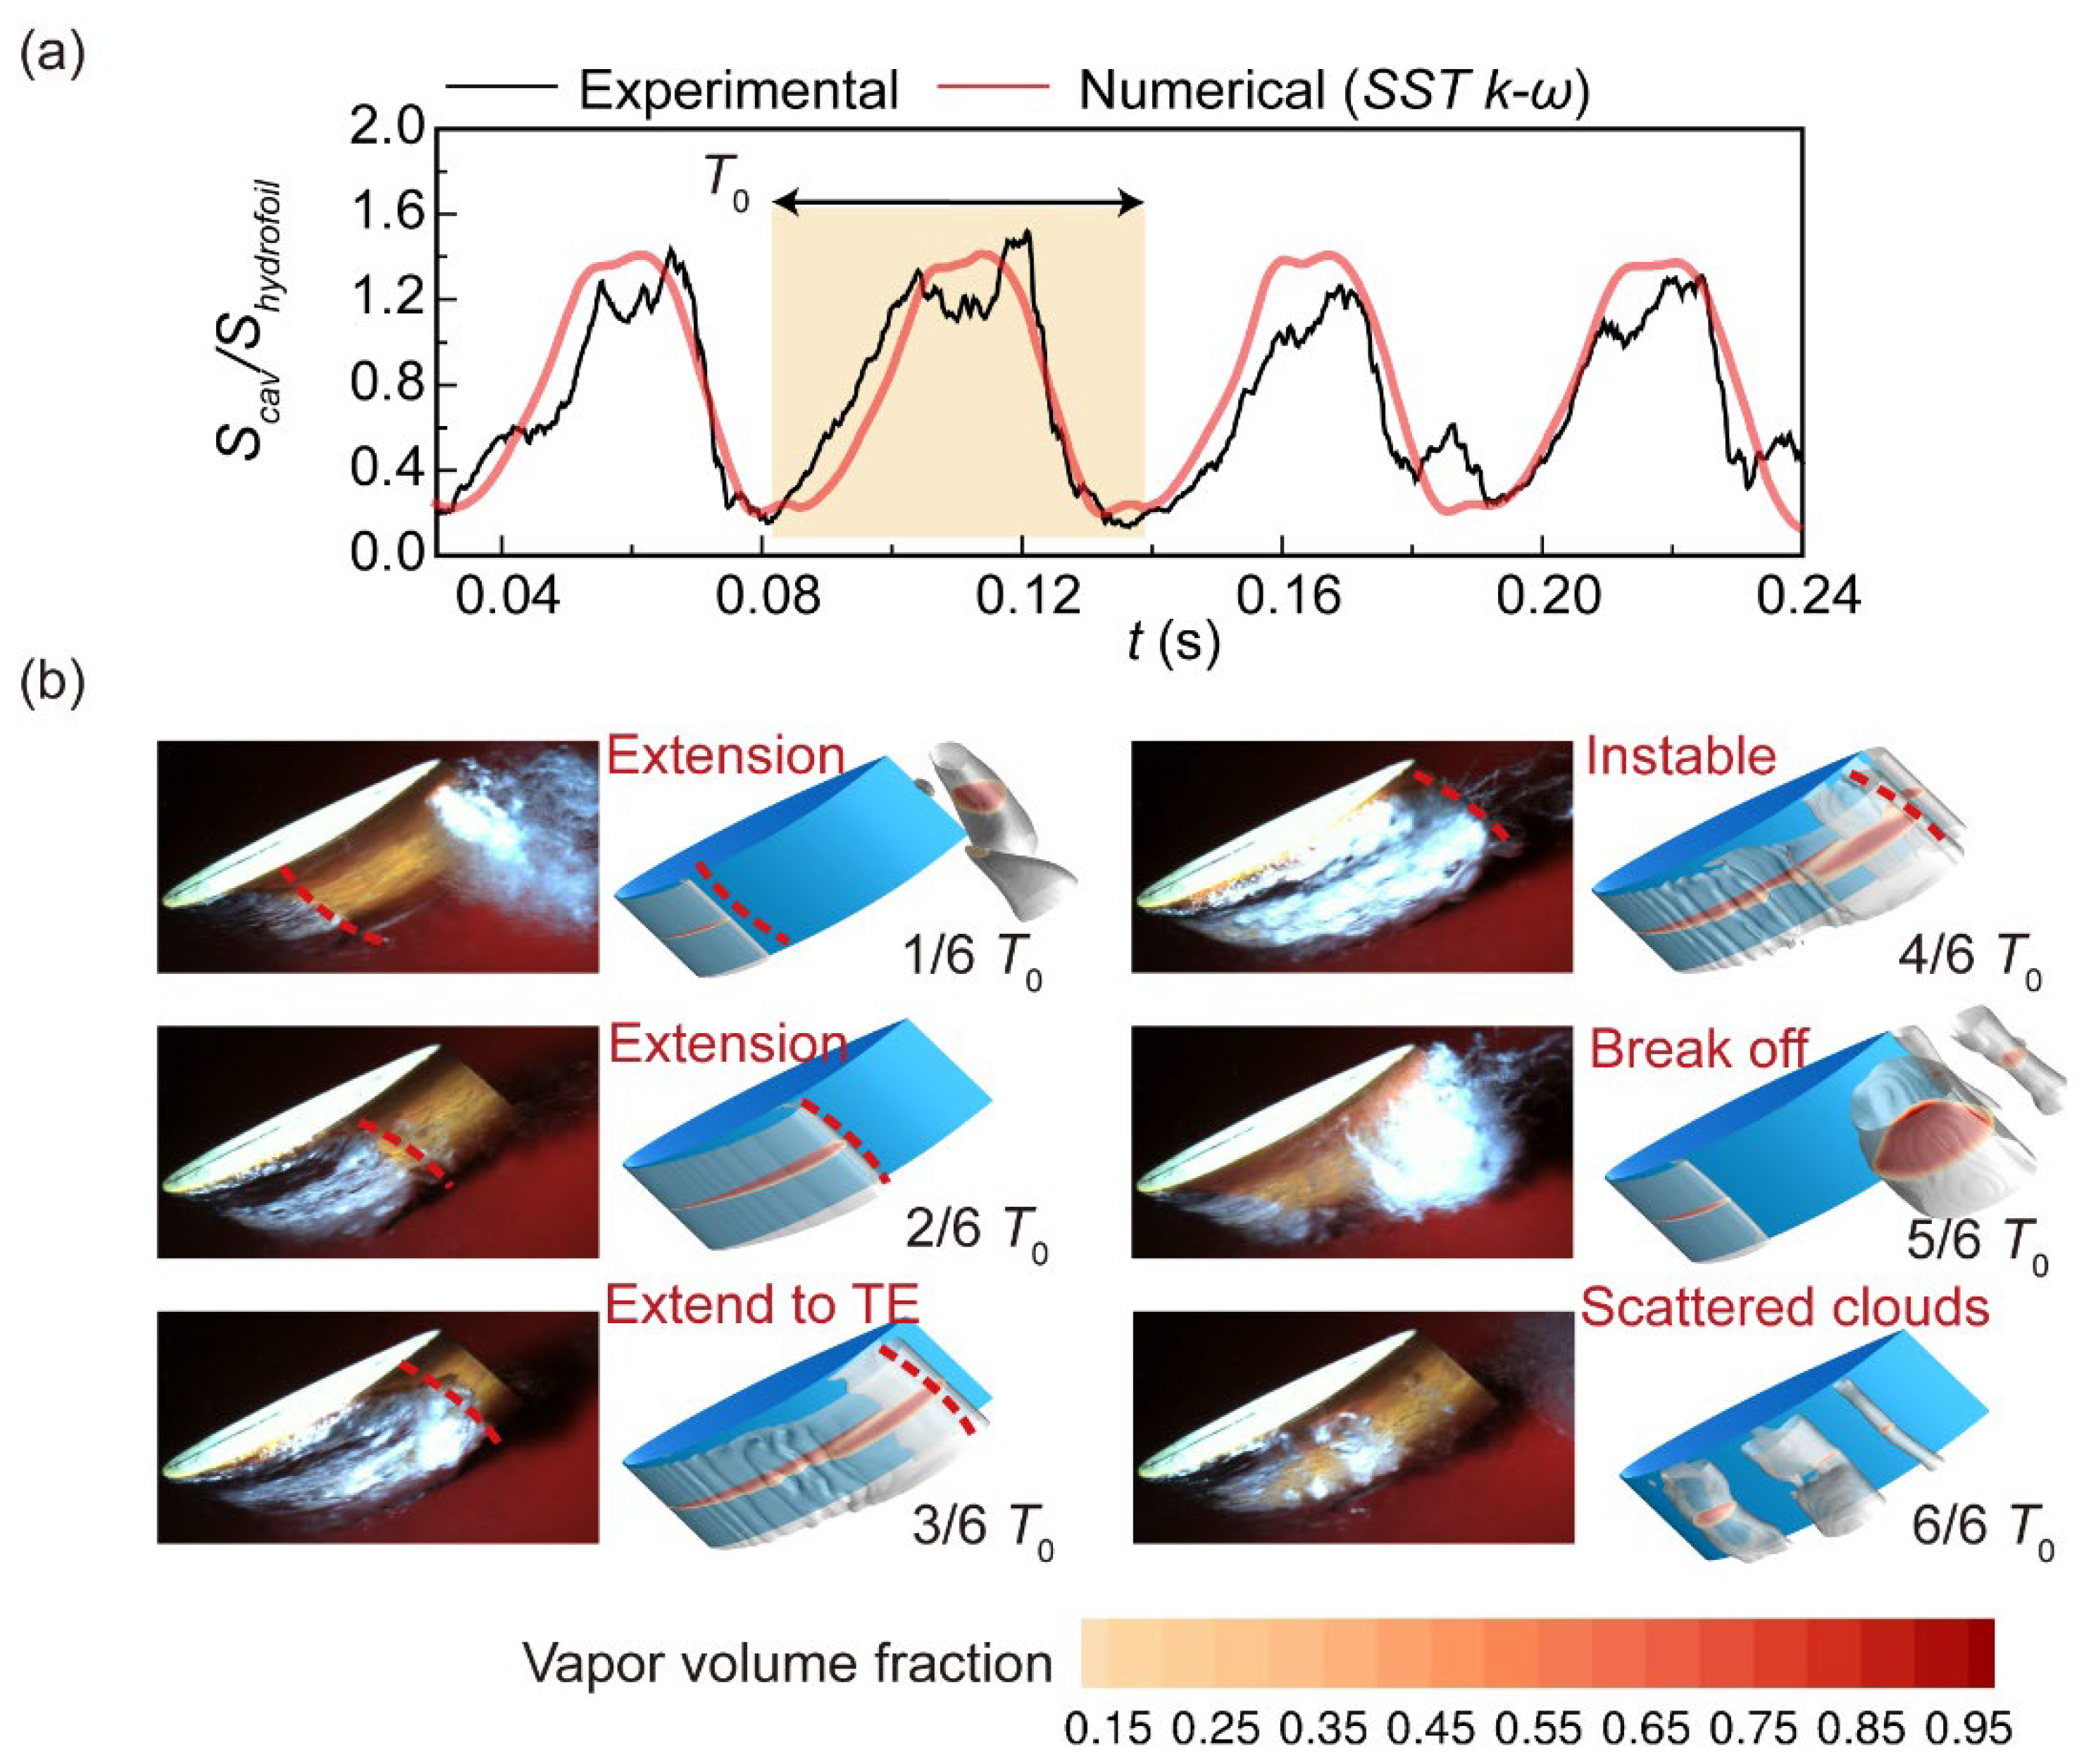
Figure 6 (b) depicts the evolution of cavitating flow over one complete cycle. The attached cavitation expands from the leading edge to the trailing edge of the hydrofoil, followed by loss of stability, leading to the formation of a large free cloud that detaches from the hydrofoil’s trailing edge. The numerical simulation successfully captures the observed flow patterns from the experiment. Figure 6 (a) presents the periodic curves of the non-dimensional cavitation area (Snd = Scav/Shydrofoil, where Shydrofoil represents the cross-section area of the hydrofoil, and Scav is the cavitation area) obtained from both numerical simulations and experimental measurements. The Scav can be obtained through digital image processing in experiments. In the numerical simulation, several equidistant cut-planes along the spanwise of hydrofoil are extracted and superimposed to calculate the cavitation area, Scav. The numerical simulation shows a cavitation cycle duration of approximately 50.27 ms, while the experimental measurement is 53.73 ms, resulting in an error of approximately +6.44%.
Due to the introduction of a new inlet velocity condition for the jet, it is necessary to assess the continued applicability of the numerical method for jet hydrofoil. In our prior experiments, we conducted tests on a jet hydrofoil with specific parameters, featuring Ljet = 0.19C and αjet = 0 degree. In this context, the experimental data at Ujet = 2.89 m/s serves as the basis for validation.
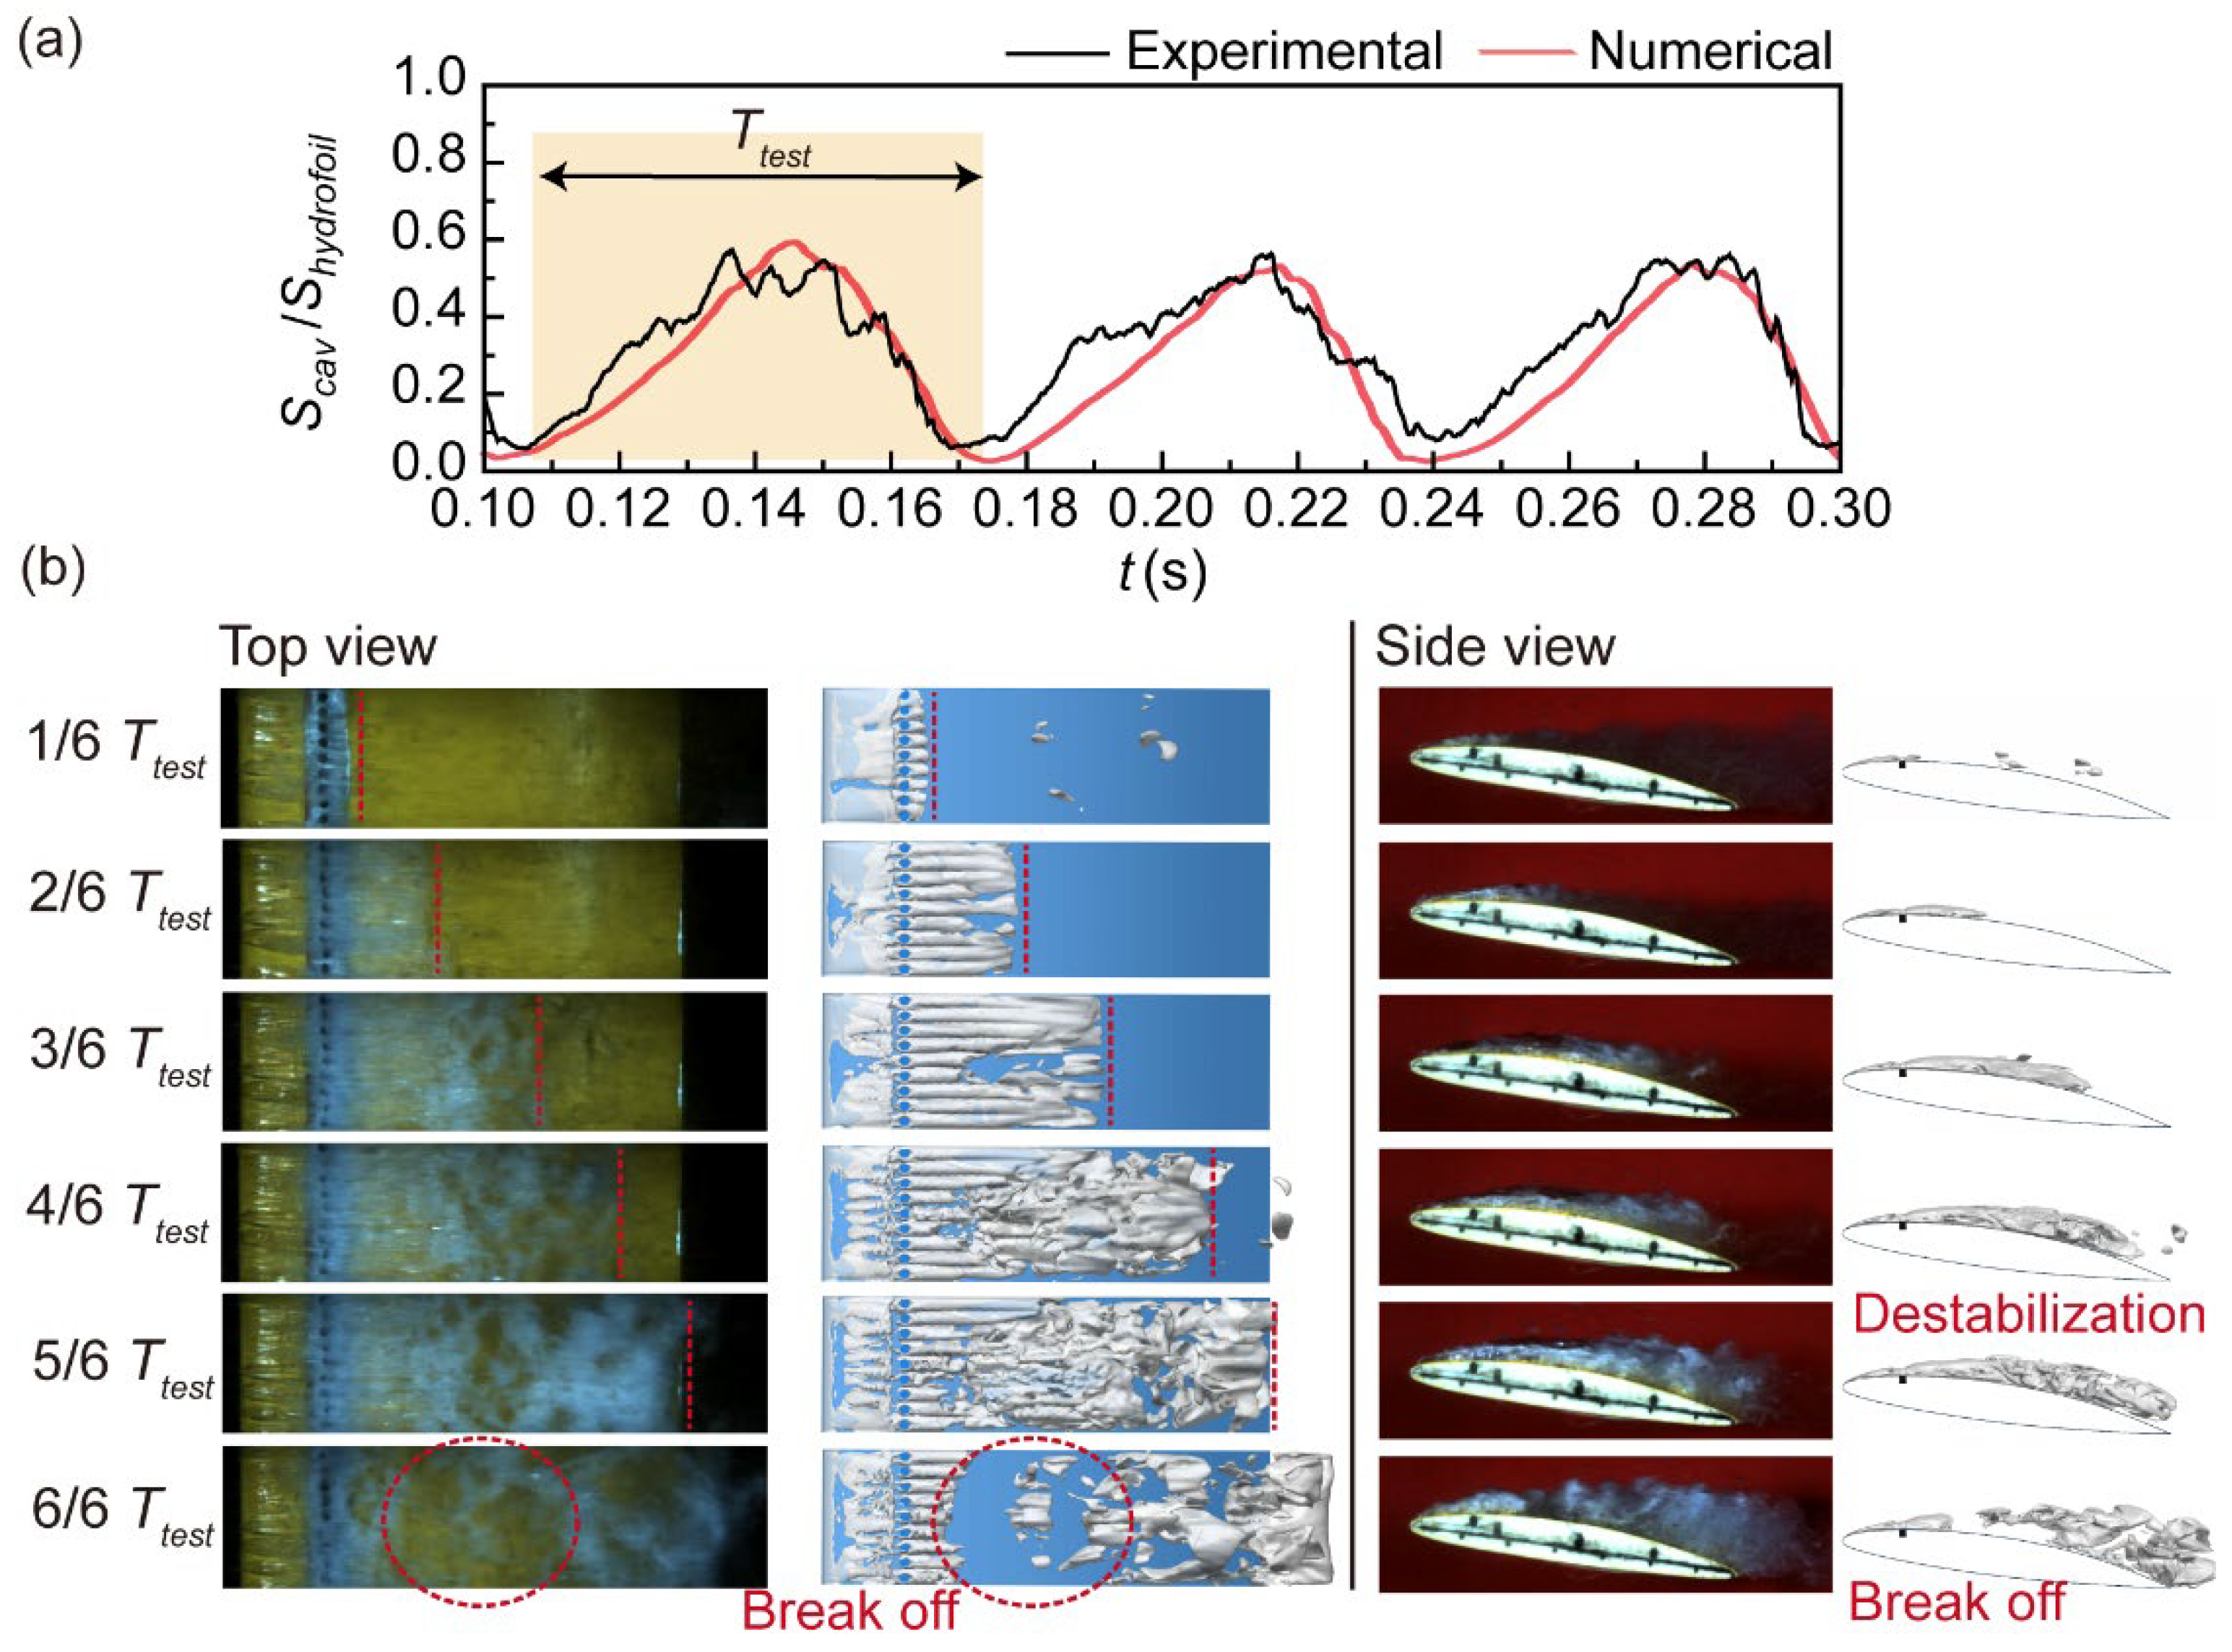
As shown in Figure 7 (a), The numerical simulation shows a cavitation cycle duration of approximately 75.14 ms, while the experimental measurement is 71.32 ms, resulting in an error of approximately +5.36%. Hence, the numerical results are capable of satisfactorily predicting the characteristics of the cavitation structure and its periodicity.
As depicted in Figure 7 (b), the presence of the jet makes significant changes to the attached cavitation structure. The stability of attached cavitation is disrupted, leading to the fragmentation of free clouds that detach from the hydrofoil surface. The dynamic characteristics of cavitation closely align with experimental observations. The cavitation is reduced by approximately 50% compared to the original scenario without the jet. However, it is important to highlight that this injection parameter combination (Ljet = 0.19C and αjet = 0 degrees) led a decrease in the lift-drag ratio [9], an issue that this paper aims to address and resolve.

4. Setup of Orthogonal Test Method

The orthogonal test method represents a systematic approach employed to investigate multiple factors and their respective levels. This methodology involves the selection of a well-defined set of representative test cases from a diverse dataset, possessing evenly dispersed and comparable characteristics [56]. This analysis allows for the reduction of the total number of tests conducted, leading to a shorter testing duration [57,58], while effectively identifying the optimal program.
The factors considered in this paper are the jet angle (αjet), jet velocity (Ujet), and jet location (Ljet), each encompassing 5, 4, and 4 levels, respectively. Undertaking all possible parameter combinations would necessitate a total of 5×4×4 = 80 sets of numerical simulations, which is evidently impractical. Consequently, the orthogonal test method is applied to systematically explore the effects of these three factors and their respective levels on two crucial metrics: the cavitation suppression efficiency (ηcav.) and the energy performance (ηeng) of the hydrofoil. These metrics are expressed in percentiles and defined as follows:
η c a v . [ % ] = ( S ¯ n d t e s t S ¯ n d o r i ) / S ¯ n d o r i
η e n g . [ % ] = ( K ¯ t e s t K ¯ o r i ) / K ¯ o r i
K = C L / C D
where the parameters ?Snd-test and ?Snd-ori denote the time-averaged Snd of the jet hydrofoil and the original hydrofoil, respectively. Additionally,?Ktest and ?Kori represent the time-averaged lift-drag ratio of the jet hydrofoil and the original hydrofoil, respectively. FL and FD are lift force and drag force acting on the hydrofoil, respectively. The negative values in ηcav. indicate a reduction in cavitation volume, implying effective cavitation suppression. On the other hand, positive or negative values in ηeng represent an increase or decrease in lift-drag ratio, respectively, indicating the improvement or deterioration of energy performance.
In this study, the three factors, namely jet angle (αjet), jet velocity, and jet location, are designed with multiple levels in an orthogonal manner, leading to the generation of 20 different parameter combinations, each identified as H01 to H20. This mixed-level orthogonal table, along with the corresponding values of ηcav. and ηeng, are computed as follows:
In Table 4, a crucial characteristic of the table is the equal occurrence of each factor level across the different combinations. This balanced representation has been scientifically chosen to ensure that the variable is uniformly distributed among the various factor levels. Such a balanced design enhances the reliability and robustness of the test results, as it minimizes potential bias and confounding effects. In the subsequent chapter, a comprehensive analysis will be conducted to examine the effects of the factors and their respective levels on the two metrics ηcav. and ηeng.

5. Results and Discussion

5.1. Analysis of Orthogonal Results

To analyze the data in Table 4, the mean calculation in descriptive statistics is adopted. The average?ij with the same level under each factor and the range of levels Rj under the same factor are defined as the following two formulas:
i j ¯ = 1 k n = 1 k y n
R j = i j ¯ max i j ¯ min
where the notation ij refers to the value of the test result y, corresponding to a specific level i under a particular factor j.
Here, i represents the level within a given factor, and j denotes the column order of the orthogonal Table 4. Specifically, factor A (jet angle) is represented by j = 1, while j = 2 and j = 3 correspond to factor B (jet location) and factor C (jet velocity), respectively. The test result y, in the context of investigating the influence of parameters on cavitation suppression, represents the ηcav. Likewise, when studying the influence of parameters on energy characteristics, y signifies the ηeng. For example, the notation “32” would represent column 2 (factor B: jet location) and level 3 (0.45C). Thus, “32” would correspond to the test result y for the specific combination of factor B at level 3 in the orthogonal table.
The method aims to determine the average influence of a specific parameter on the indices ηcav. and ηeng. The average?ηcav. and?ηeng values when a certain parameter in Table 4 remains at a consistent level are calculated. For instance, to obtain the average?ηcav. and?ηeng at the level of -60 degrees for the parameter jet angle, we perform average processing on the data from series H01 to H04 in Table 4. These series represent different combinations of parameter values, including the other two parameters, jet location, and jet velocity.
The calculated result includes not only the impact of the independent parameter (jet angle) but also the influence of the other two parameters. The orthogonal design characteristics ensure that the frequency of occurrence of the other two parameters is balanced, thus minimizing interference. By considering the influence of all factors under orthogonal design conditions, the final selection of parameter combinations avoids unexpected abnormal results. This approach provides a comprehensive understanding of the combined impact of multiple parameters on the indices?ηcav. and?ηeng, allowing for more informed decisions in the analysis.
It is essential to note that due to the averaging process and the influence of the other parameters under orthogonal design condition, the combination of parameters eventually selected by this method may not directly correspond to any specific combination in Table 4. Instead, the method may generate completely new combinations that are not originally present in Table 4.
The effect of injection parameters on the cavitation suppression performance is shown as follows:
When the jet position is shifted from 0.45C to 0.60C, a significant reduction in?ηcav. is observed, indicating that the cavitation suppression effect is most sensitive to the jet position. Conversely, the jet velocity exhibited relatively minimal impact on?ηcav., with the corresponding Rj only 1.65%. As for the jet angle, its influence on?ηcav. lies between the other two parameters.
In summary, the order of importance of the three parameters concerning cavitation suppression is as follows: jet location (B) > jet angle (A) > jet velocity (C). For optimizing cavitation suppression efficiency alone, the most favorable parameter combination is A3B1C4, signifying a jet configuration with Ljet = 0.19C, αjet = 0 degrees, and Ujet = 3.25m/s. This combination is identified as the optimal configuration for achieving the highest cavitation suppression efficiency.
The effect of injection parameters on the hydrofoil energy performance is shown as follows:
The abundant negative values in the table indicates that, regardless of the jet discharge configuration, the lift-drag ratio of the hydrofoil will be reduced. This reduction is likely attributable to the reaction force exerted by the jet flow on the hydrofoil body. Nevertheless, a few promising results stand out: when the jet angle is set to +30 degrees, there is a 0.37% increase in the lift-drag ratio, and at +60 degrees, the lift-drag ratio is even improved by 2.93%. The hydrofoil’s performance is notably influenced by the jet position, and positioning the jet at 0.60C leads to a considerable 7.98% decrease in hydrofoil performance. This analysis, along with the previous findings on?ηcav, suggests that placing the jet near the hydrofoil’s trailing edge is not a reasonable arrangement.
In summary, the order of importance of the three parameters concerning the lift-drag ratio is as follows: jet angle (A) > jet location (B) > jet velocity (C). For optimizing energy performance alone, the most favorable parameter combination is A5B3C3, indicating a jet configuration with Ljet = 0.45C, αjet = +60 degrees, and Ujet = 2.89 m/s.
However, it is important to note that considering only one index to determine the best jet configuration may lead to a biased evaluation. Additionally, sacrificing energy performance to suppress cavitation cannot be regarded as an ideal flow control approach. Hence, the authors hope to combine both cavitation suppression efficiency and energy performance to identify the best parameter combination with the most balanced capabilities.
In similar studies, scholars have frequently utilized grey relational theory [59,60] to normalize multiple indices and transform multivariate optimization problems into univariate optimization problems represented as grey relational grades. However, it is important to acknowledge that the rankings and results obtained through this method are solely based on the data available within the given dataset and do not guarantee the best combination of parameter values beyond the original dataset.
In the previous content, the final selection of parameter combinations takes into account the combined impact of multiple parameters on the indices?ηcav. and?ηeng. This allows for more comprehensive exploration of the parameter and the potential discovery of novel combinations with excellent performance. Consequently, the graphical representation of the data in Table 5 and Table 6 simplified the process of intuitively selecting the optimal combination, making the decision-making procedure both straightforward and efficient.
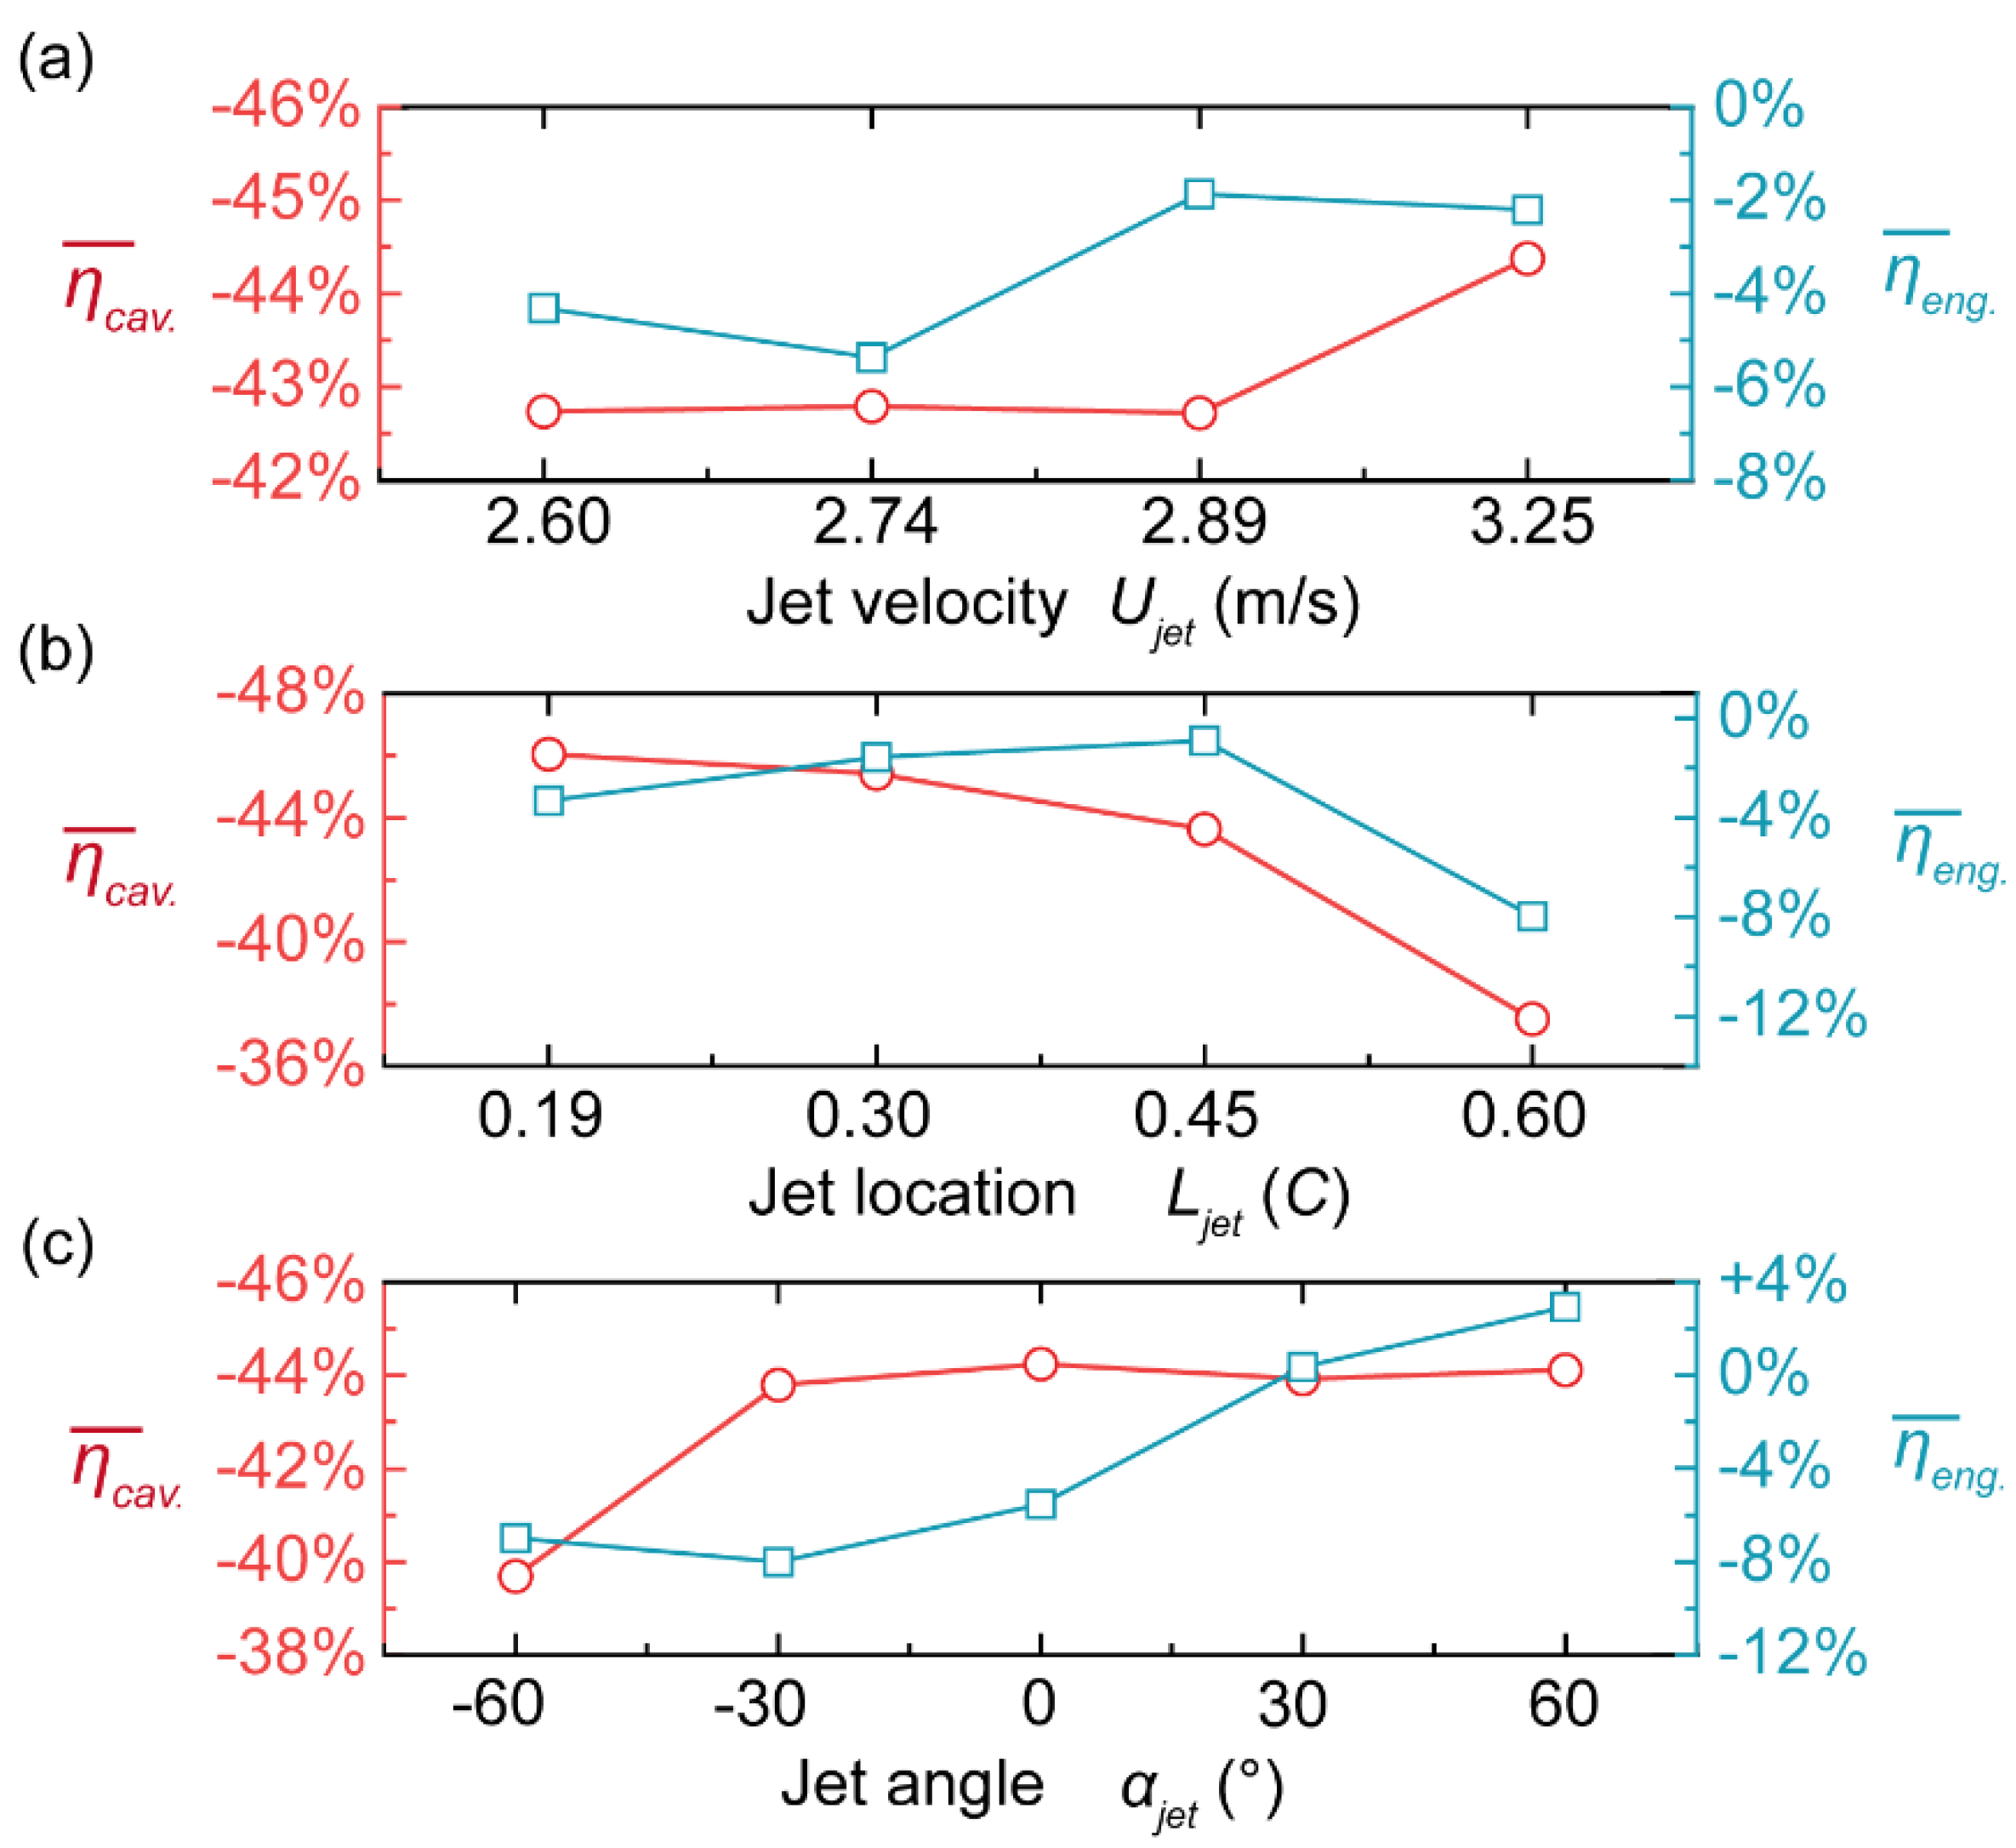
Based on the observations from Figure 8 (a), minimal differences are noted in?ηcav at jet velocities of 2.60, 2.74, and 2.89 m/s, while the lift-drag ratio exhibits significantly low values at these velocities. In contrast, a jet velocity of 3.25 m/s demonstrates satisfactory performance for both?ηcav and?ηeng Consequently, parameter C4 is considered a suitable candidate for further consideration.
Moving to Figure 8 (b), it becomes apparent that the jet positioned at 0.60C yields poor performance in both ?ηcav and?ηeng. In contrast, jets positioned at 0.19C, 0.30C, and 0.45C exhibit no significant differences in their respective cavitation suppression effects and lift-drag ratios. Thus, parameters B1, B2, and B3 emerge as viable options.
Finally, Figure 8 (c) reveals poor performance of both?ηcav and?ηeng at a jet angle of -60 degrees. However, as the angle shifts from -30 to +60 degrees, the lift-drag ratio of the hydrofoil gradually increases, with a notable improvement in?ηeng when the angle shifts from 0 to 30 degrees. In terms of cavitation suppression, all angles, except for -60 degrees, yield non-significant differences in?ηcav. Consequently, parameters A4 and A5 are identified as promising alternatives.
Considering the analysis above, 1×3×2=6 parameter combinations have the potential to achieve a desirable balance between lift-drag ratio and cavitation suppression. These combinations hold promising potential for optimizing the performance of the hydrofoil in terms of both energy efficiency and cavitation mitigation.
To further screen out parameter combination of better performance, two constraints are imposed: (1) The lift-drag ratio must be improved, i.e., ηeng > 0, and (2) The cavitation suppression efficiency must surpass 44%, i.e., ηcav. < -44% (based on the evidence of the mean?ηcav. of the 20 combinations in Table 4, which is -43.44%). Following these constraints, two combinations, A5B1C4 and A5B2C4, remain as potential candidates.
However, it is evident that for B1 (Ljet = 0.19C),?ηeng is -4.62%, whereas for B2 (Ljet = 0.30C), ?ηeng is -1.16%, indicating a noticeable difference. On the other hand, for ηcav., B1 is -46.05%, and B2 is -45.42%, with no significant difference between the two. As a result, the combination A5B2C4 (Ljet = 0.30C, αjet = 60°, and Ujet = 3.25 m/s) is chosen to minimize any adverse impact on the energy characteristics, even though it sacrifices approximately 1% of?ηcav. This final combination does not belong to any cases in Table 4.
Subsequently, numerical simulations are conducted for the final selected combination, A5B2C4 jet hydrofoil. The next two sections present the findings related to its cavitation suppression efficiency, energy performance, and flow control mechanisms. Through these comprehensive analyses, a deeper understanding of the optimal jet configuration’s capabilities and effects will be achieved.

5.2. Cavitation Suppression Performance (σ = 0.83)

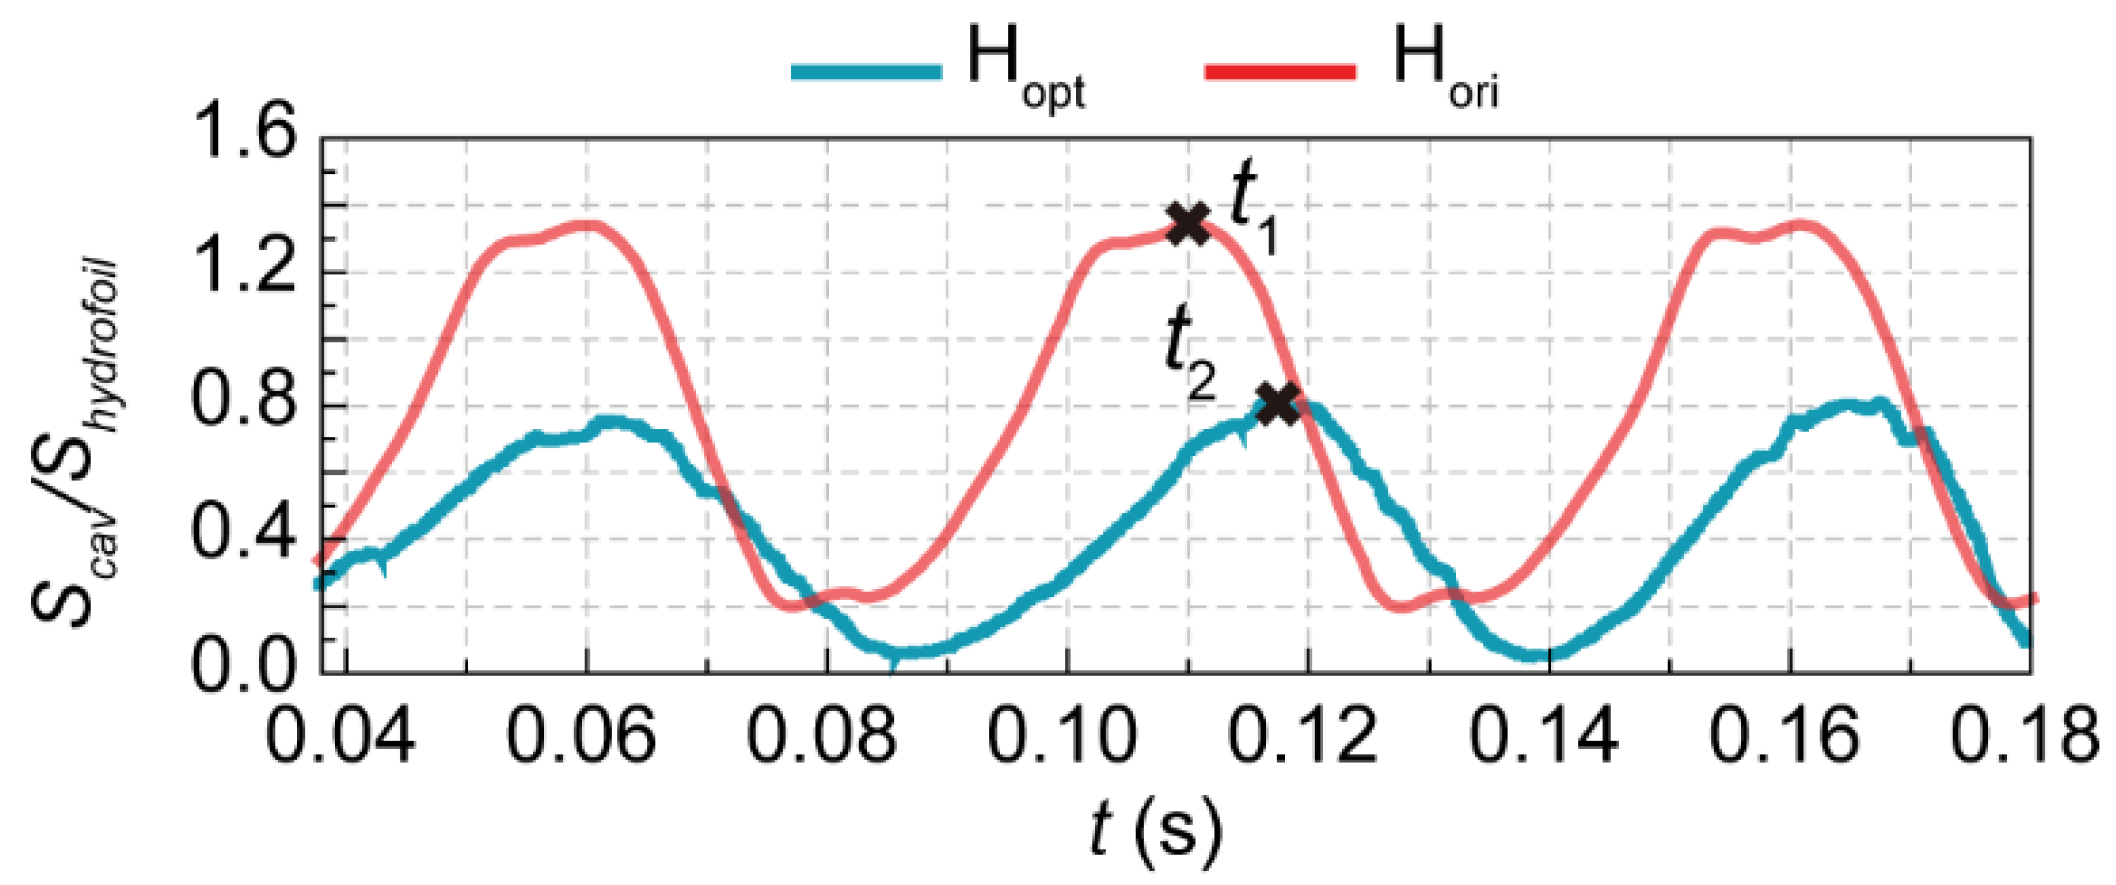
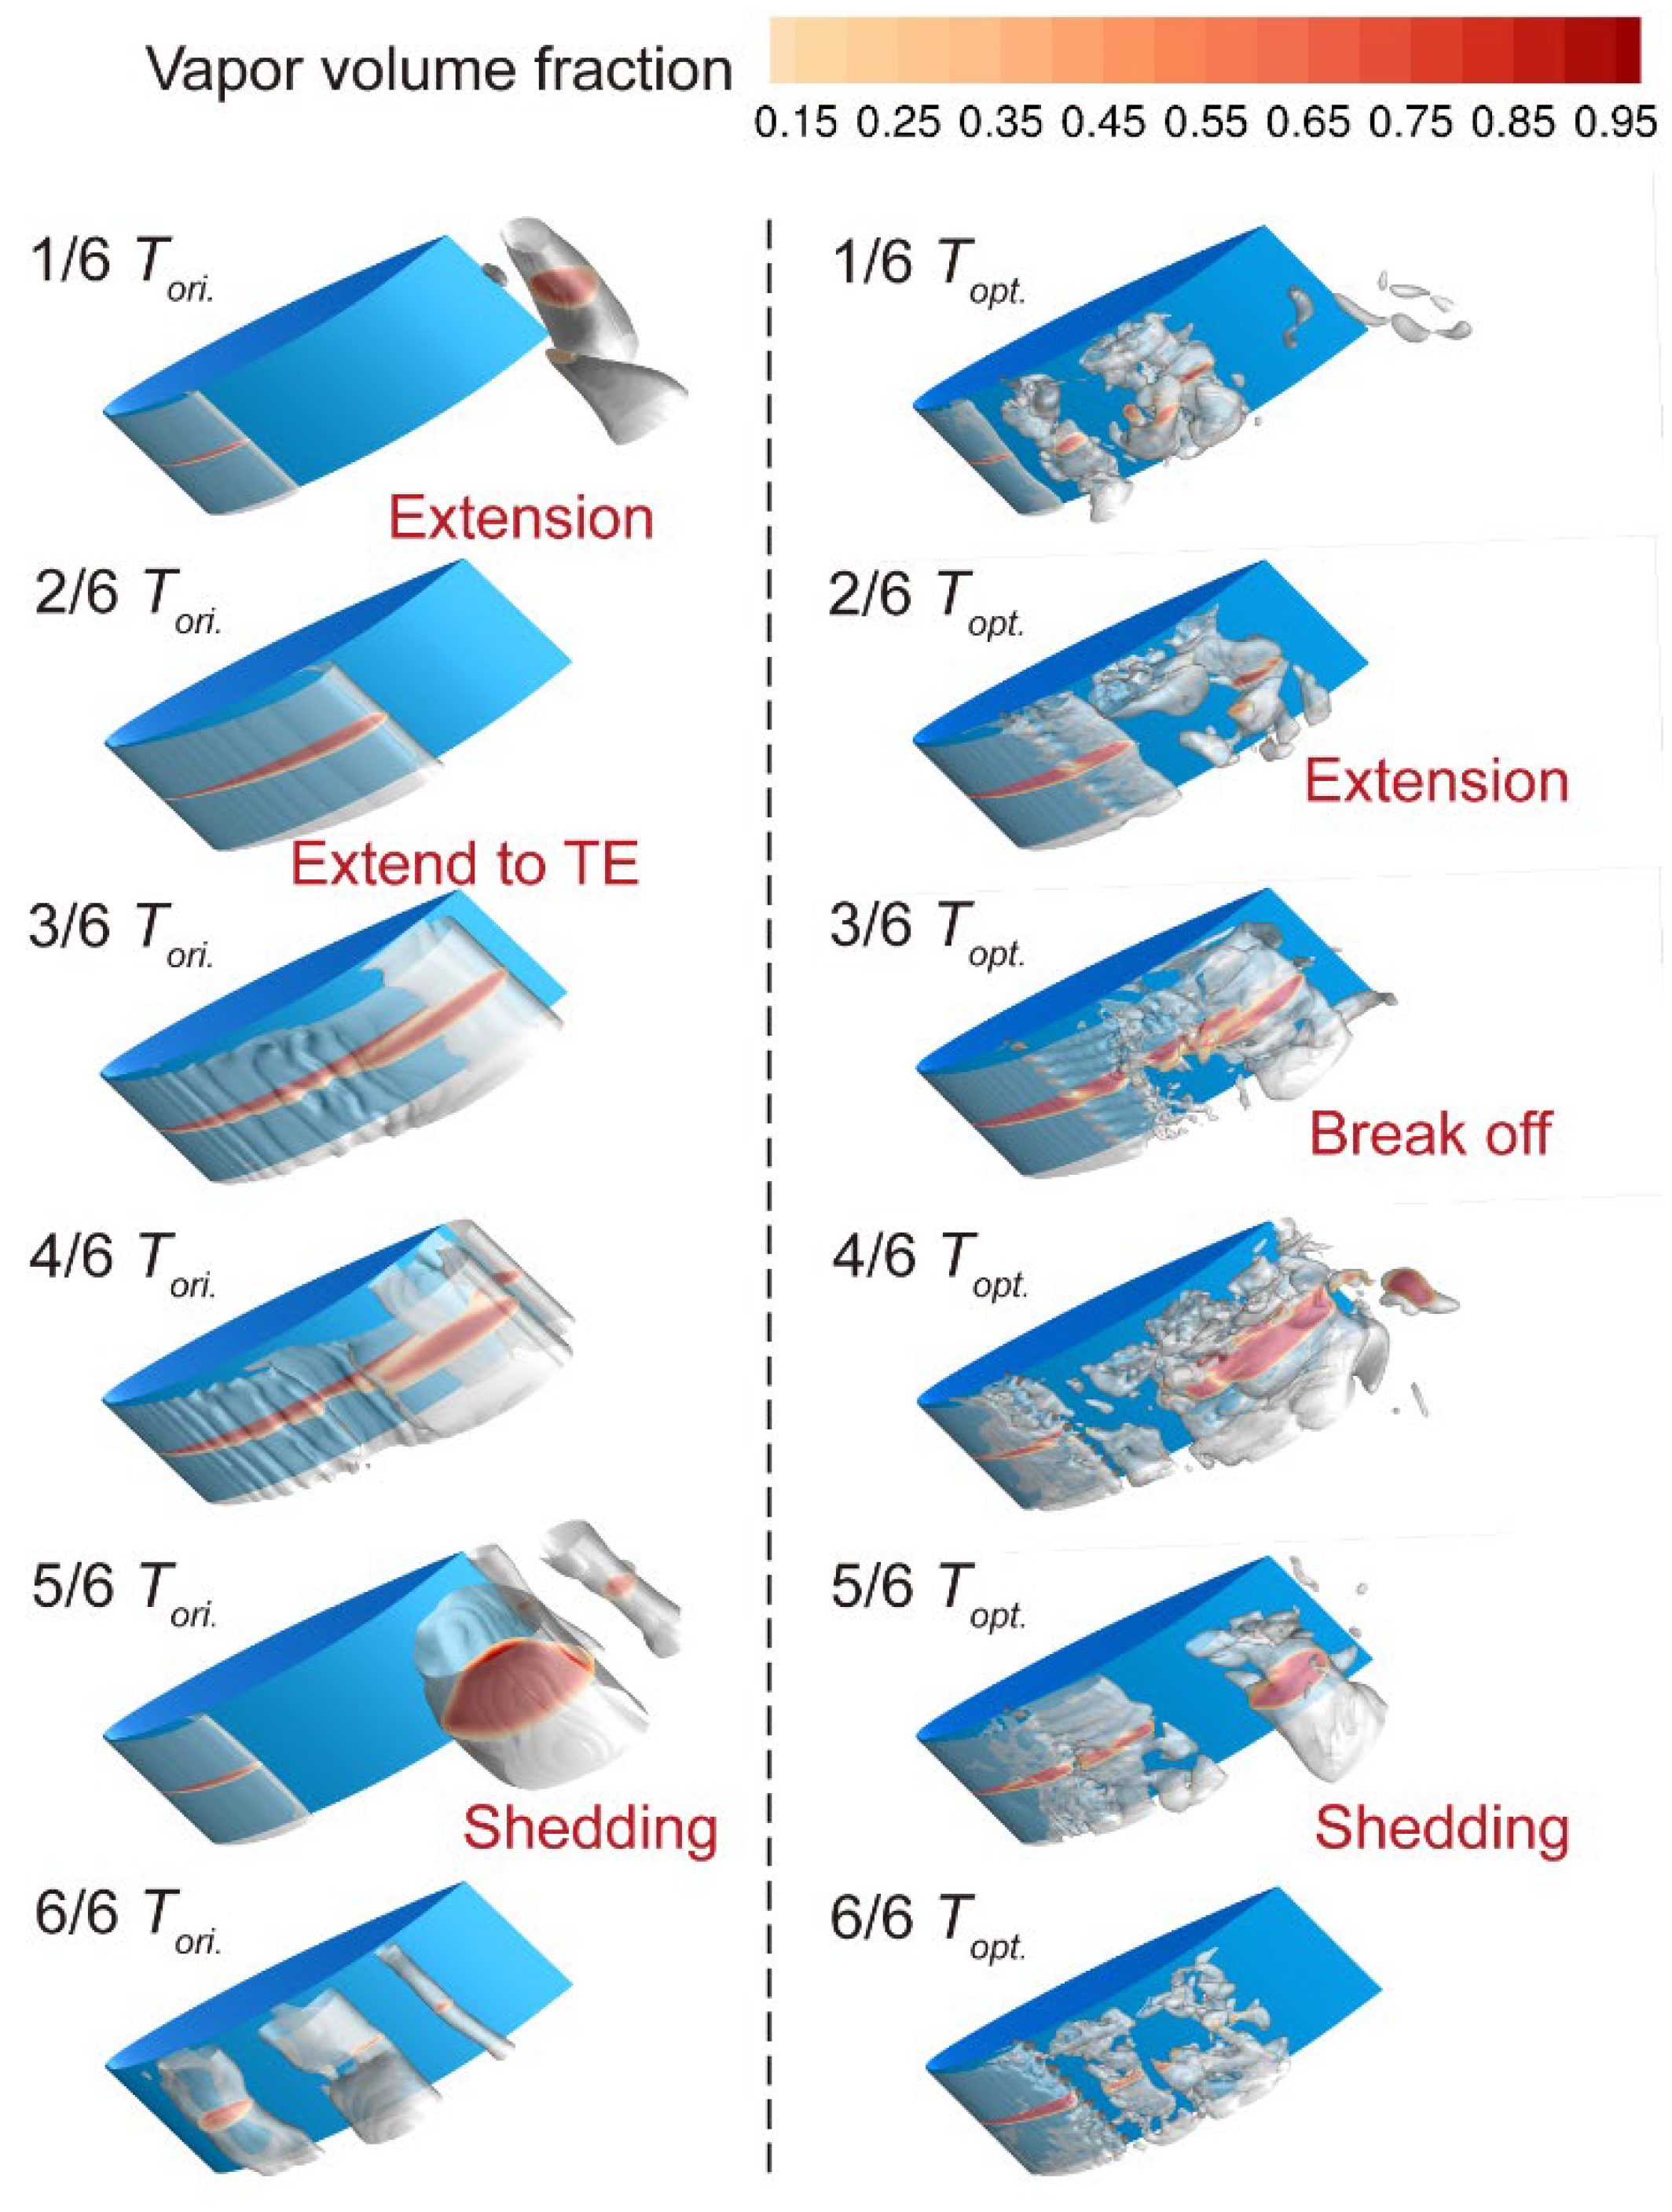
The A5B2C4 jet hydrofoil is referred to Hopt for short, and the original hydrofoil with no jet is referred as Hori. They are conducted in numerical simulation with the same boundary condition (U = 7.832 m/s, Pout = 27325 Pa, σ = 0.83). The monitored data of non-dimensional cavitation area for these two hydrofoils are depicted in Figure 9. The temporal evolution of cavitation structures in one cycle are displayed in Figure 10. The structure of the cavitation cloud is plotted by an iso-surface with the vapor phase volume fraction of 10%.
After implementing the optimal jet scheme (A5B2C4), a noticeable reduction in cavitation volume is observed. The Snd of the original hydrofoil (Hori.) predominantly varies between 0.2 and 1.4, while the Snd of the jet hydrofoil (Hopt) varies mainly between 0.1 and 0.8. Through calculations, the cavitation volume under the A5B2C4 scheme is reduced by an impressive 49.34%. Comparing cavitation periods, Tori (the cavitation period of Hori.) is measured at 51.78 ms, whereas Topt (the cavitation period of Hopt) is 56.84 ms. The jet’s effect extends the cavitation period by approximately 9.77%.
For the original hydrofoil Hori, the physical process corresponding to the monitoring curve in the rising stage involves the continuous expansion of attached cavitation until it reaches the trailing edge of the hydrofoil. The wave peak of the curve signifies the formation of highly unstable three-dimensional cloud structures, followed by the descending stage, which corresponds to the shedding of the unstable cloud. Similarly, under the influence of the jet, the cavitation motion pattern for Hopt is similar. It also undergoes the growth of attached cavitation (from 1/6 to 3/6 of Topt) and the subsequent shedding of free clouds (from 4/6 to 5/6 of Topt).
It is observed that the attached cavitation passes through the jet holes during 1/6 to 2/6 of Topt. However, with a value of σ = 0.83, representing a relatively severe cloud cavitation state, the jet cannot completely block the expansion of attached cavitation. Nevertheless, unlike the stable strip structure observed in Hori, the attached cavitation of Hopt exhibits a distinctive comb-like structure under the influence of the jet. Although the attached cavitation passes through the jet hole, it becomes destabilized and fractured shortly after (at 3/6 of Topt). This indicates that the jet destabilizes the attached cavitation before it reaches its most intense level. By 4/6 of Topt, the unstable cloud exhibits a group of scattered clouds, likely due to the jet flow disrupting the internal structure of the cloud. These scattered clouds then undergo incomplete fusion or collapse, forming smaller free clouds that subsequently shed away from the hydrofoil (at 5/6 of Topt).
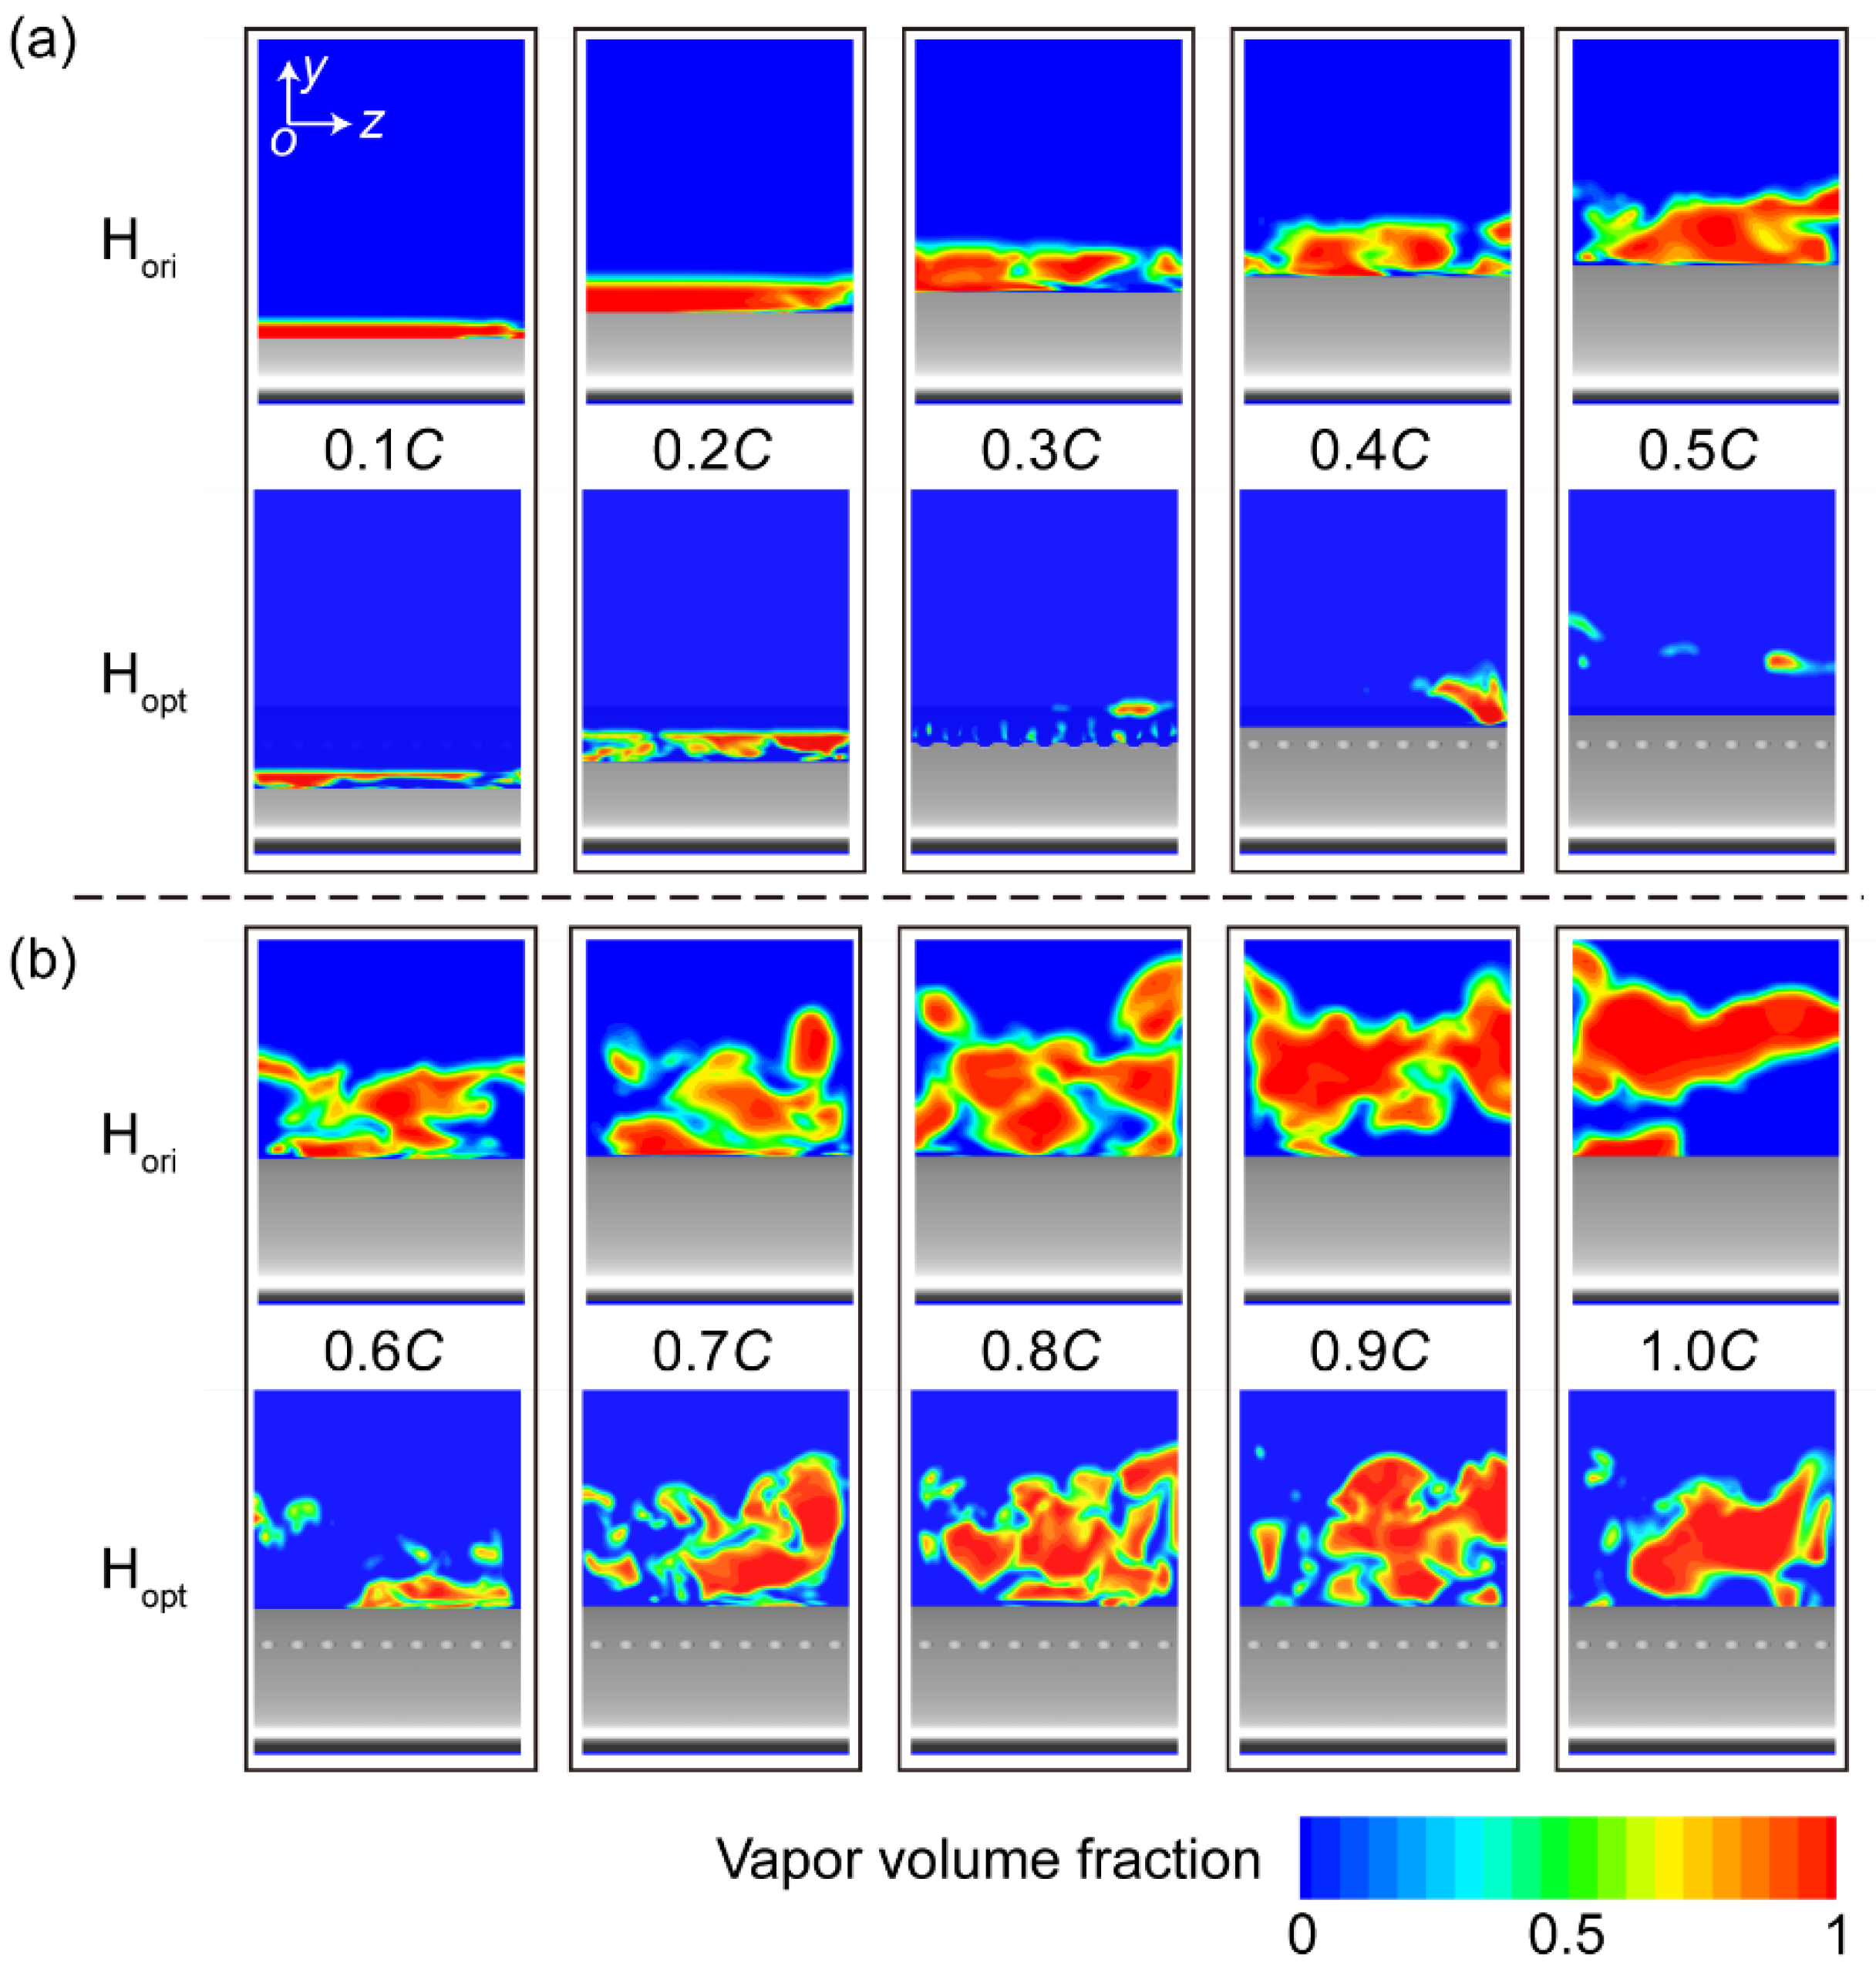
In Figure 10, t1 and t2 represent the moments when the cavitation volume of the original hydrofoil (Hori) and the jet hydrofoil (Hopt) reach their maximum, respectively. At these two specific moments, ten y-o-z sections are taken along the chordwise direction of both hydrofoils. The obtained data for vapor phase volume fraction is presented in Figure 11.
Examining the vapor phase distribution at 0.1C and 0.2C, it is observed that for the original hydrofoil (Hori), the red regions indicate high vapor phase concentration in the attached cavitation. Conversely, in the case of the jet hydrofoil (Hopt), the front exhibits an incomplete attached cavitation structure with a relatively lower vapor phase concentration. This suggests that the jet, situated at 0.3C, exerts a controlling effect on the cavitation in front of it. This is attributed to the low pressure near the leading edge and the high pressure near the jet hole, which attracts the jet flow towards the front, acting on the attached cavitation and leading to the fragmented vapor phase structure. At 0.3C, 0.4C, and 0.5C, a significant number of vapor phase distributions are observed above the suction surface of Hori, with their thickness increasing. In contrast, for Hopt, there is almost no vapor phase, confirming that the jet causes the attached cavitation to break.
From 0.6C to 1.0C, it is evident that the area of vapor phase expands significantly for both hydrofoils. However, the height of the vapor phase region in the jet hydrofoil (Hopt) are notably lower than those in the original hydrofoil (Hori). Particularly, at 0.7C to 0.9C, for Hori, the distribution of αv > 90% is continuous and complete, while for Hopt, the distribution of αv > 90% appears scattered. The red contour regions are interspersed with green contour regions (approximately αv = 50%). This observation provides supporting evidence that the jet disrupts the internal structure of the clouds, leading to the formation of fragmented and scattered vapor phase regions.
Derived from Equations (13) and (14), the mass transfer equation for the conservation of the vapor volume fraction is shown as follows:
D α v D t = α v t + ( u ) α v = ρ m ρ l ρ v u
Combining the above equation with the transport equation of vapor volume fraction Equations (5), (12) and (13), the evaporation and condensation are derived to the following equation [61]:
m ˙ = ρ l ρ v ρ l ρ v u
This expression shows that the velocity divergence is directly associated with the rate of mass transfer between the vapor and liquid.
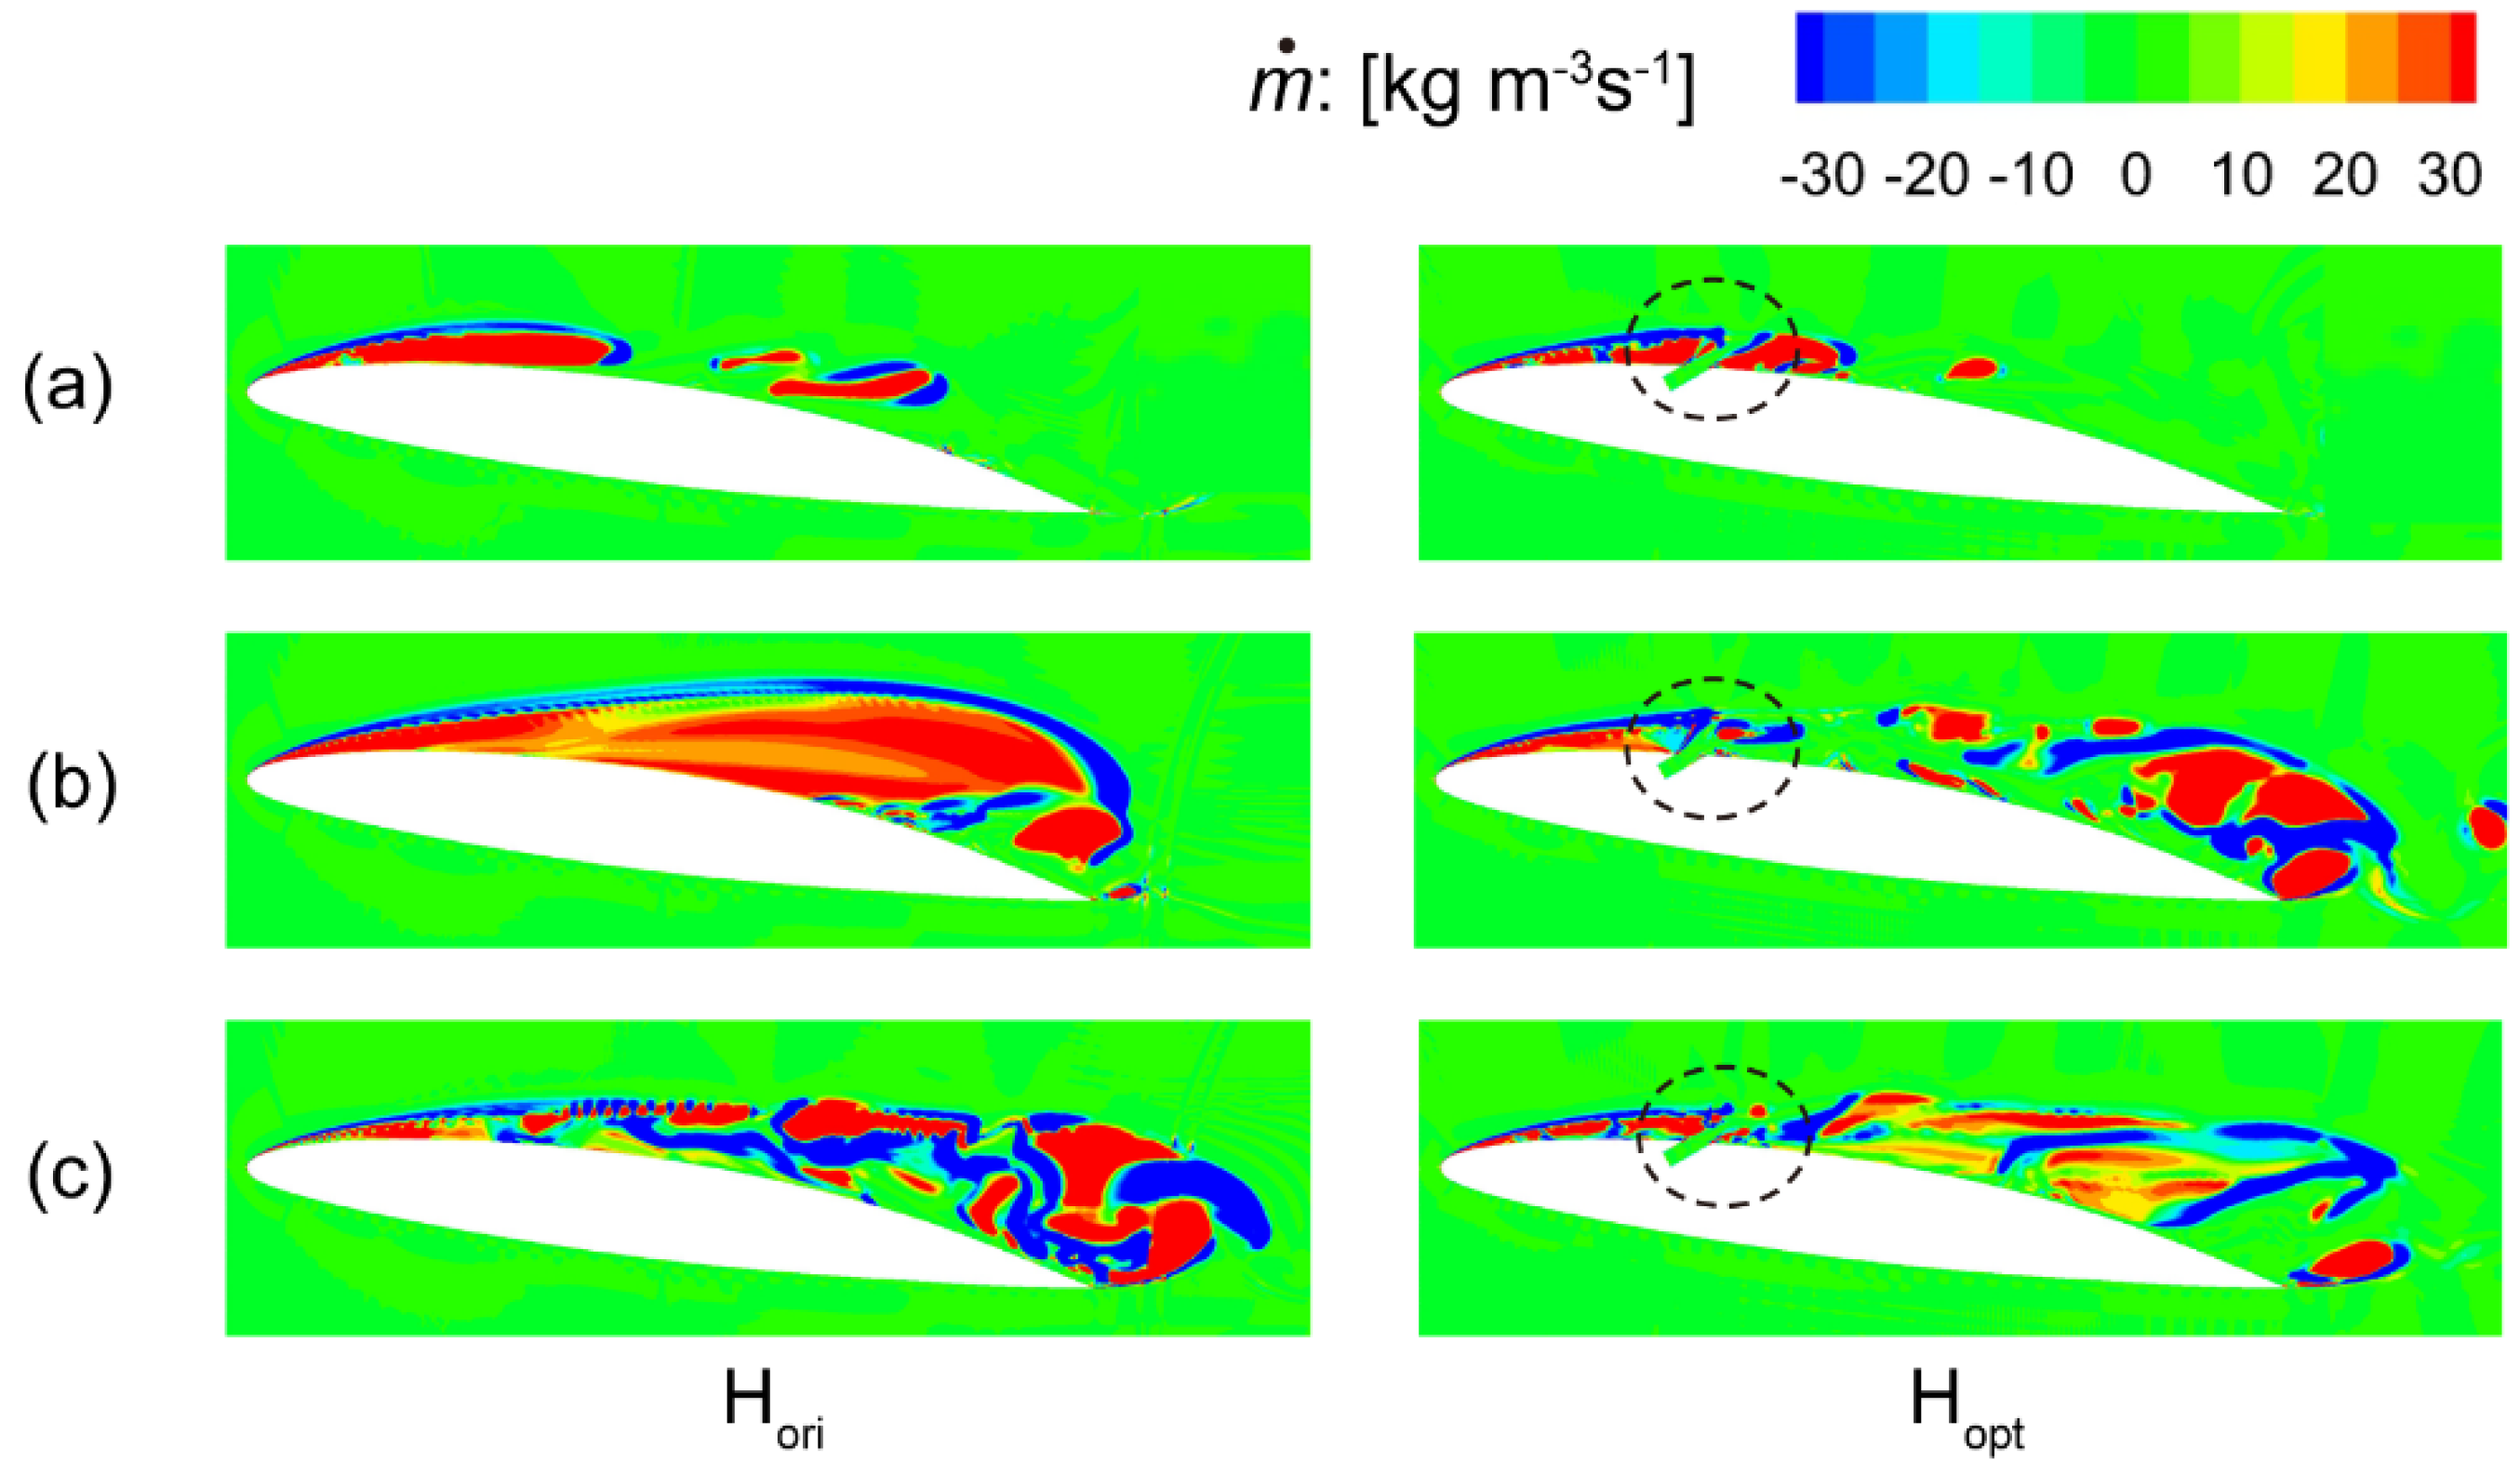
The contours of m ˙ on the hydrofoil’s mid-plane are captured at three critical moments: during the development of attached cavitation, when the cavity volume reaches its maximum, and during the shedding of unstable scattered clouds, as illustrated in Figure 12.
A negative value of signifies a local tendency for fluid condensation, while a positive value indicates evaporation. During the development of attached cavitation, it is evident that the evaporation area is intercepted by the jet. At the point of maximum cavitation volume, as depicted in Figure 12 (b), the original hydrofoil Hori predominantly exhibits areas prone to evaporation. In contrast, the jet hydrofoil Hopt shows a markedly reduced evaporation area, with a noticeable increase in negative regions, particularly near the jet hole—highlighted within the circular box. This suggests that the jet fosters local fluid condensation, thereby suppressing cavitation. When the cloud becomes unstable and detaches, the original hydrofoil displays large, alternately distributed positive and negative regions of m ˙ , indicating drastic vapor-liquid exchange. However, the pattern on Hopt is significantly more subdued. The introduction of the jet promotes vapor condensation and moderates the intensity of the vapor-liquid exchange process, effectively suppressing cavitation. This observation corroborates the findings in Table 4, affirming that cavitation can be mitigated with various jet parameter combinations, thus supporting the general rule that jet intervention facilitates cavitation control.
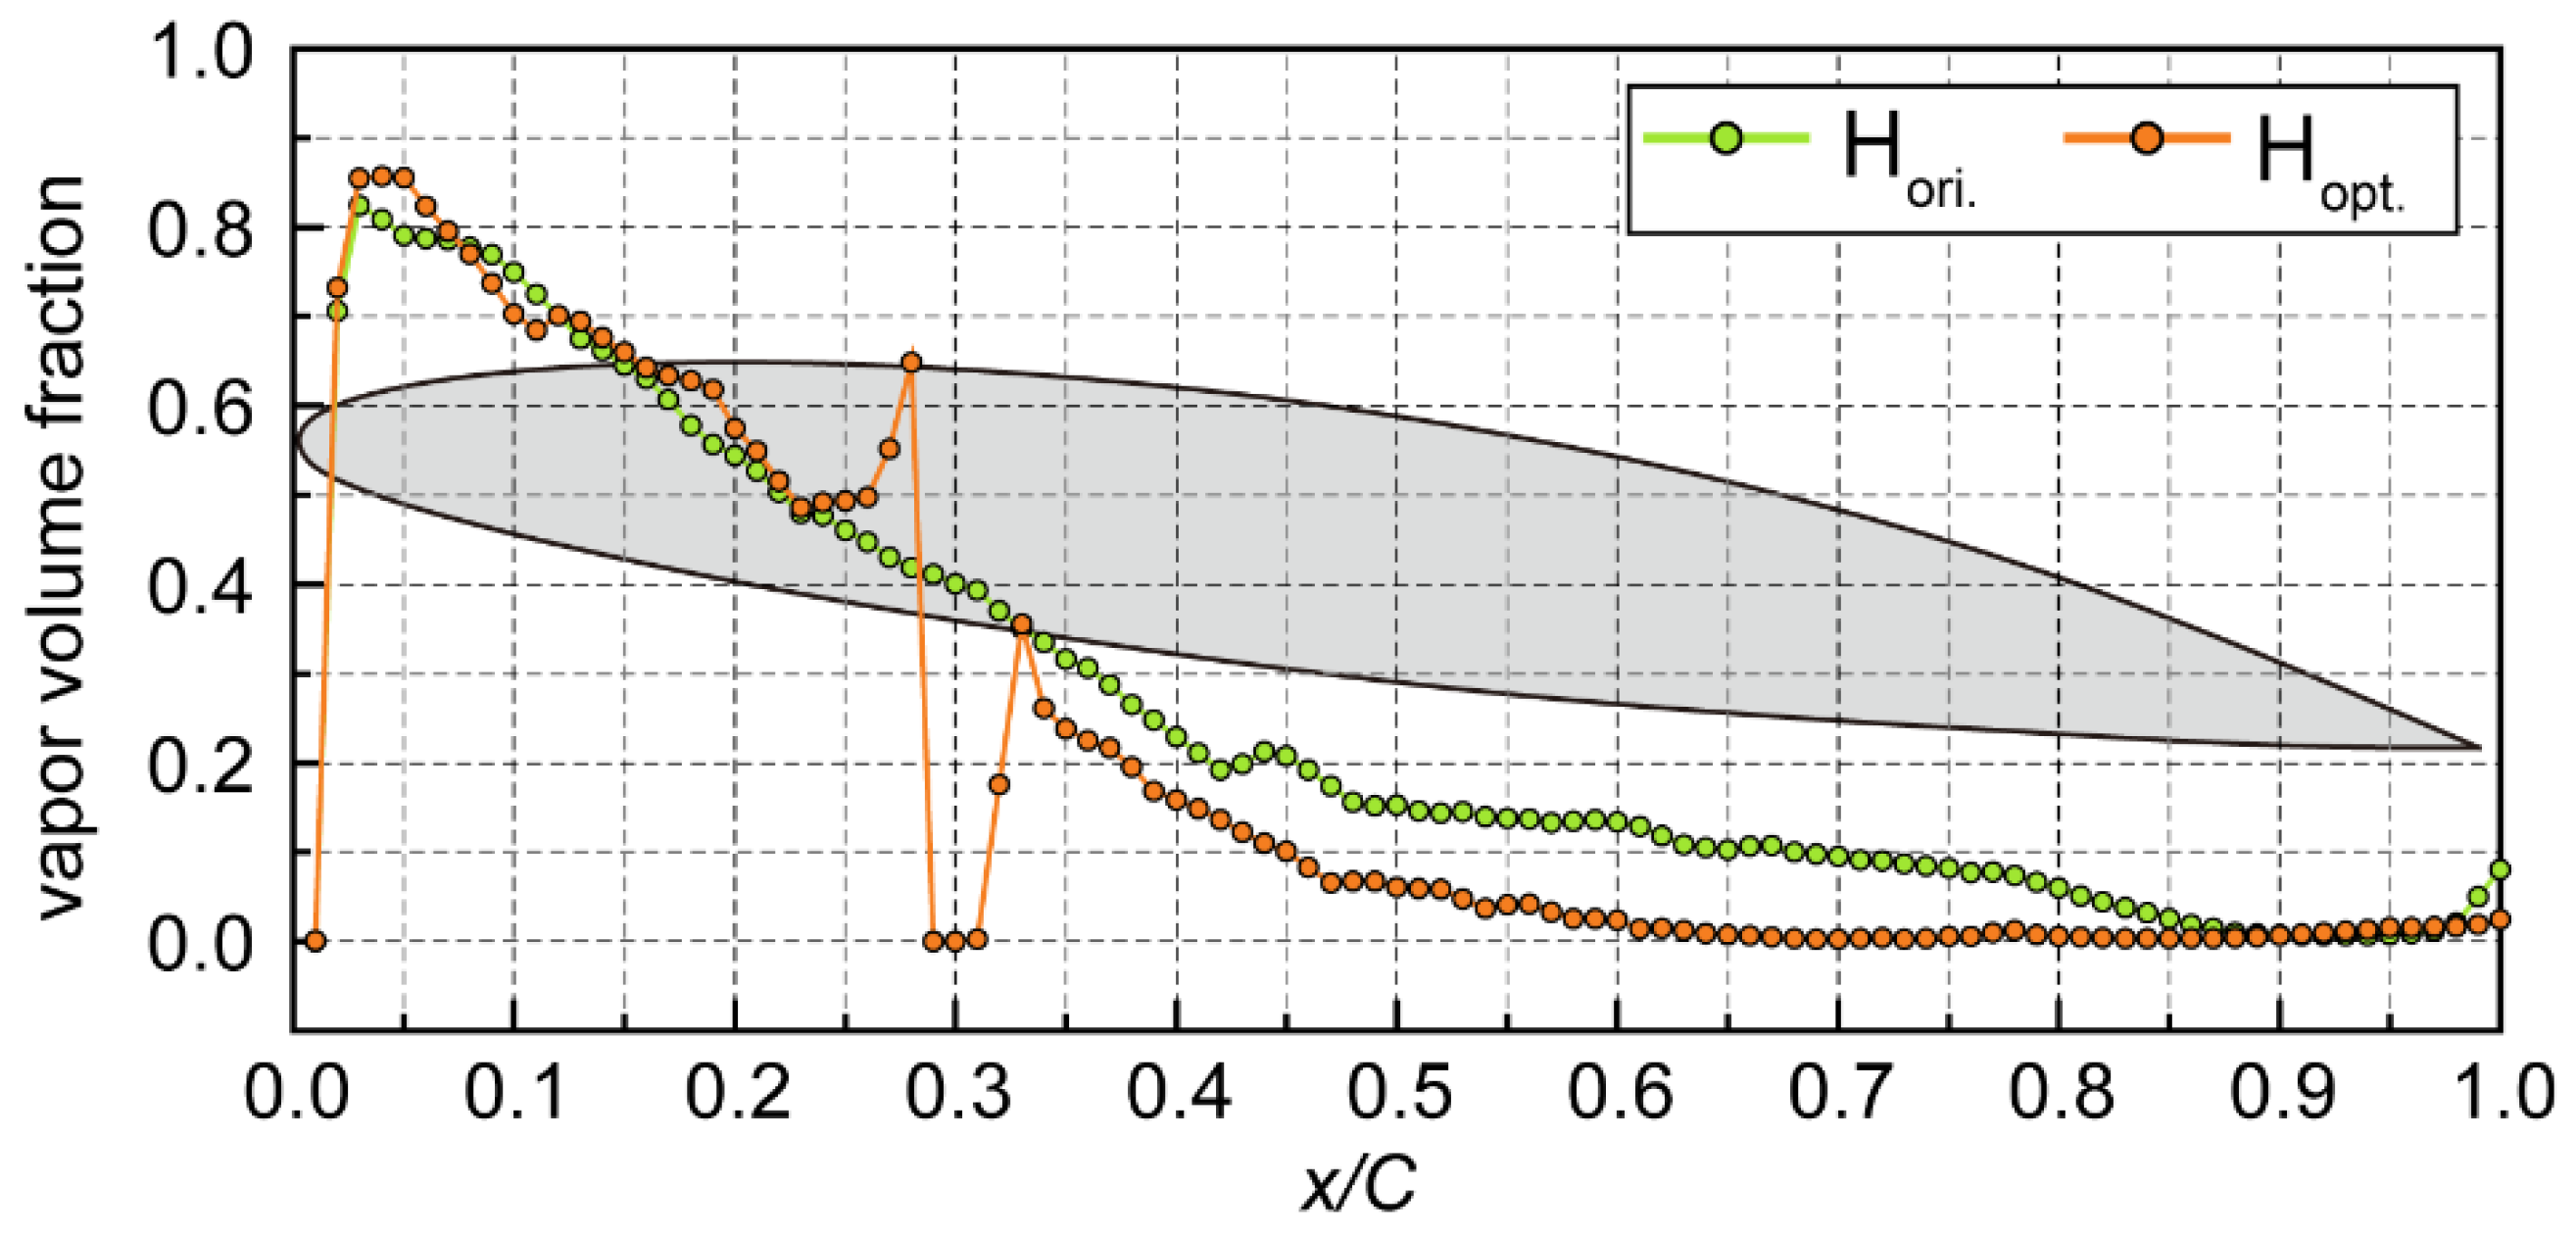
Figure 13 presents the chordwise distribution of the vapor phase volume fraction (αv) near the wall of the two hydrofoils. The data are collected from sampling points located at the mid-section of the hydrofoil’s near-wall region, representing time-averaged values. From 0 to 0.2C, the time-averaged αv of both hydrofoils appears to be nearly identical. However, at 0.29C, 0.30C, and 0.31C, αv shows zero, suggesting the absence of cavitation in these regions. Interestingly, unusually high values of αv are observed at 0.25C to 0.28C and 0.32C to 0.33C, indicating the presence of cavitation in the vicinity of the jet hole due to the interaction of the jet with the hole edge. After 0.34C, the time-averaged αv of Hopt is consistently lower than that of Hori.

5.3. Energy Performance and Pressure Distribution

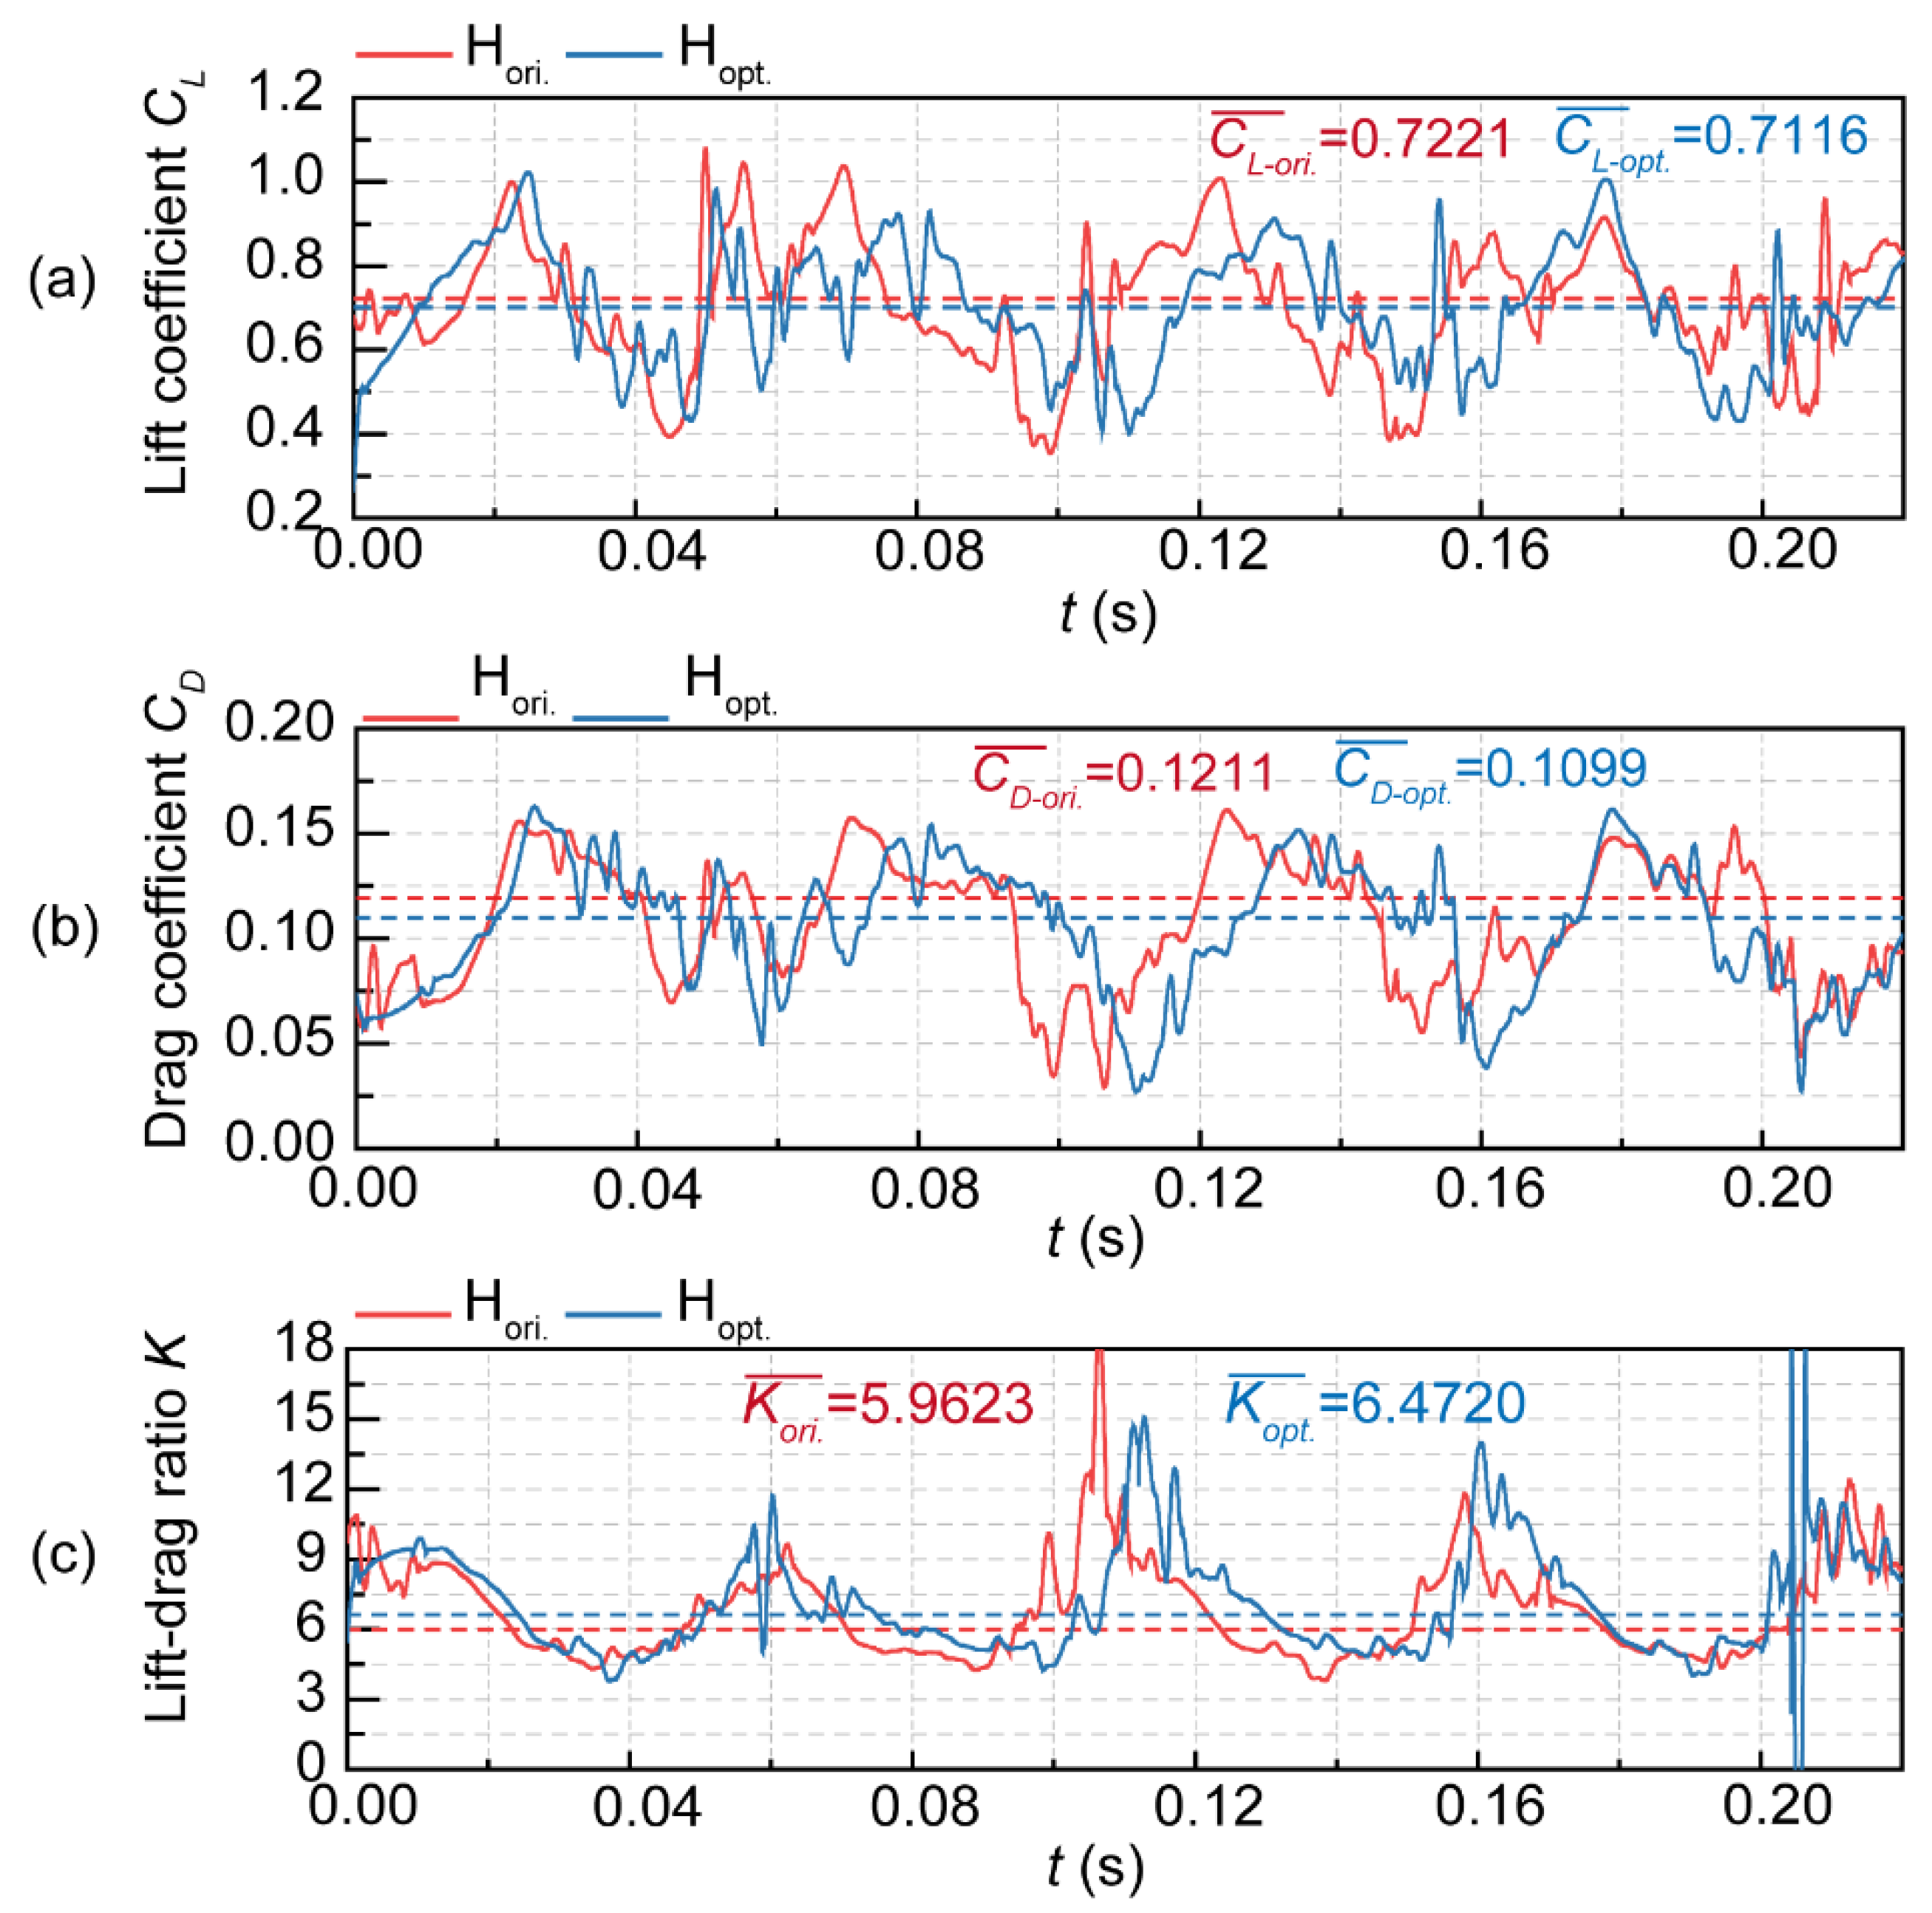
Figure 14 presents the time-domain information of the lift coefficient, drag coefficient, and lift-drag ratio for both hydrofoils. The dotted line represents the time-averaged value. The time fluctuations of the three energy performance indexes for the jet hydrofoil exhibit similarities with those of the original hydrofoil. Their periodicity corresponds to the respective cavitation periods. The jet’s influence is observed to reduce the lift coefficient by 1.43%. Moreover, Figure 14 (b) illustrates a remarkable 9.19% reduction in the drag coefficient, indicating the jet’s significant drag reduction effect on the hydrofoil. Most notably, the lift-drag ratio experiences an exciting 8.55% increase in Figure 14 (c).
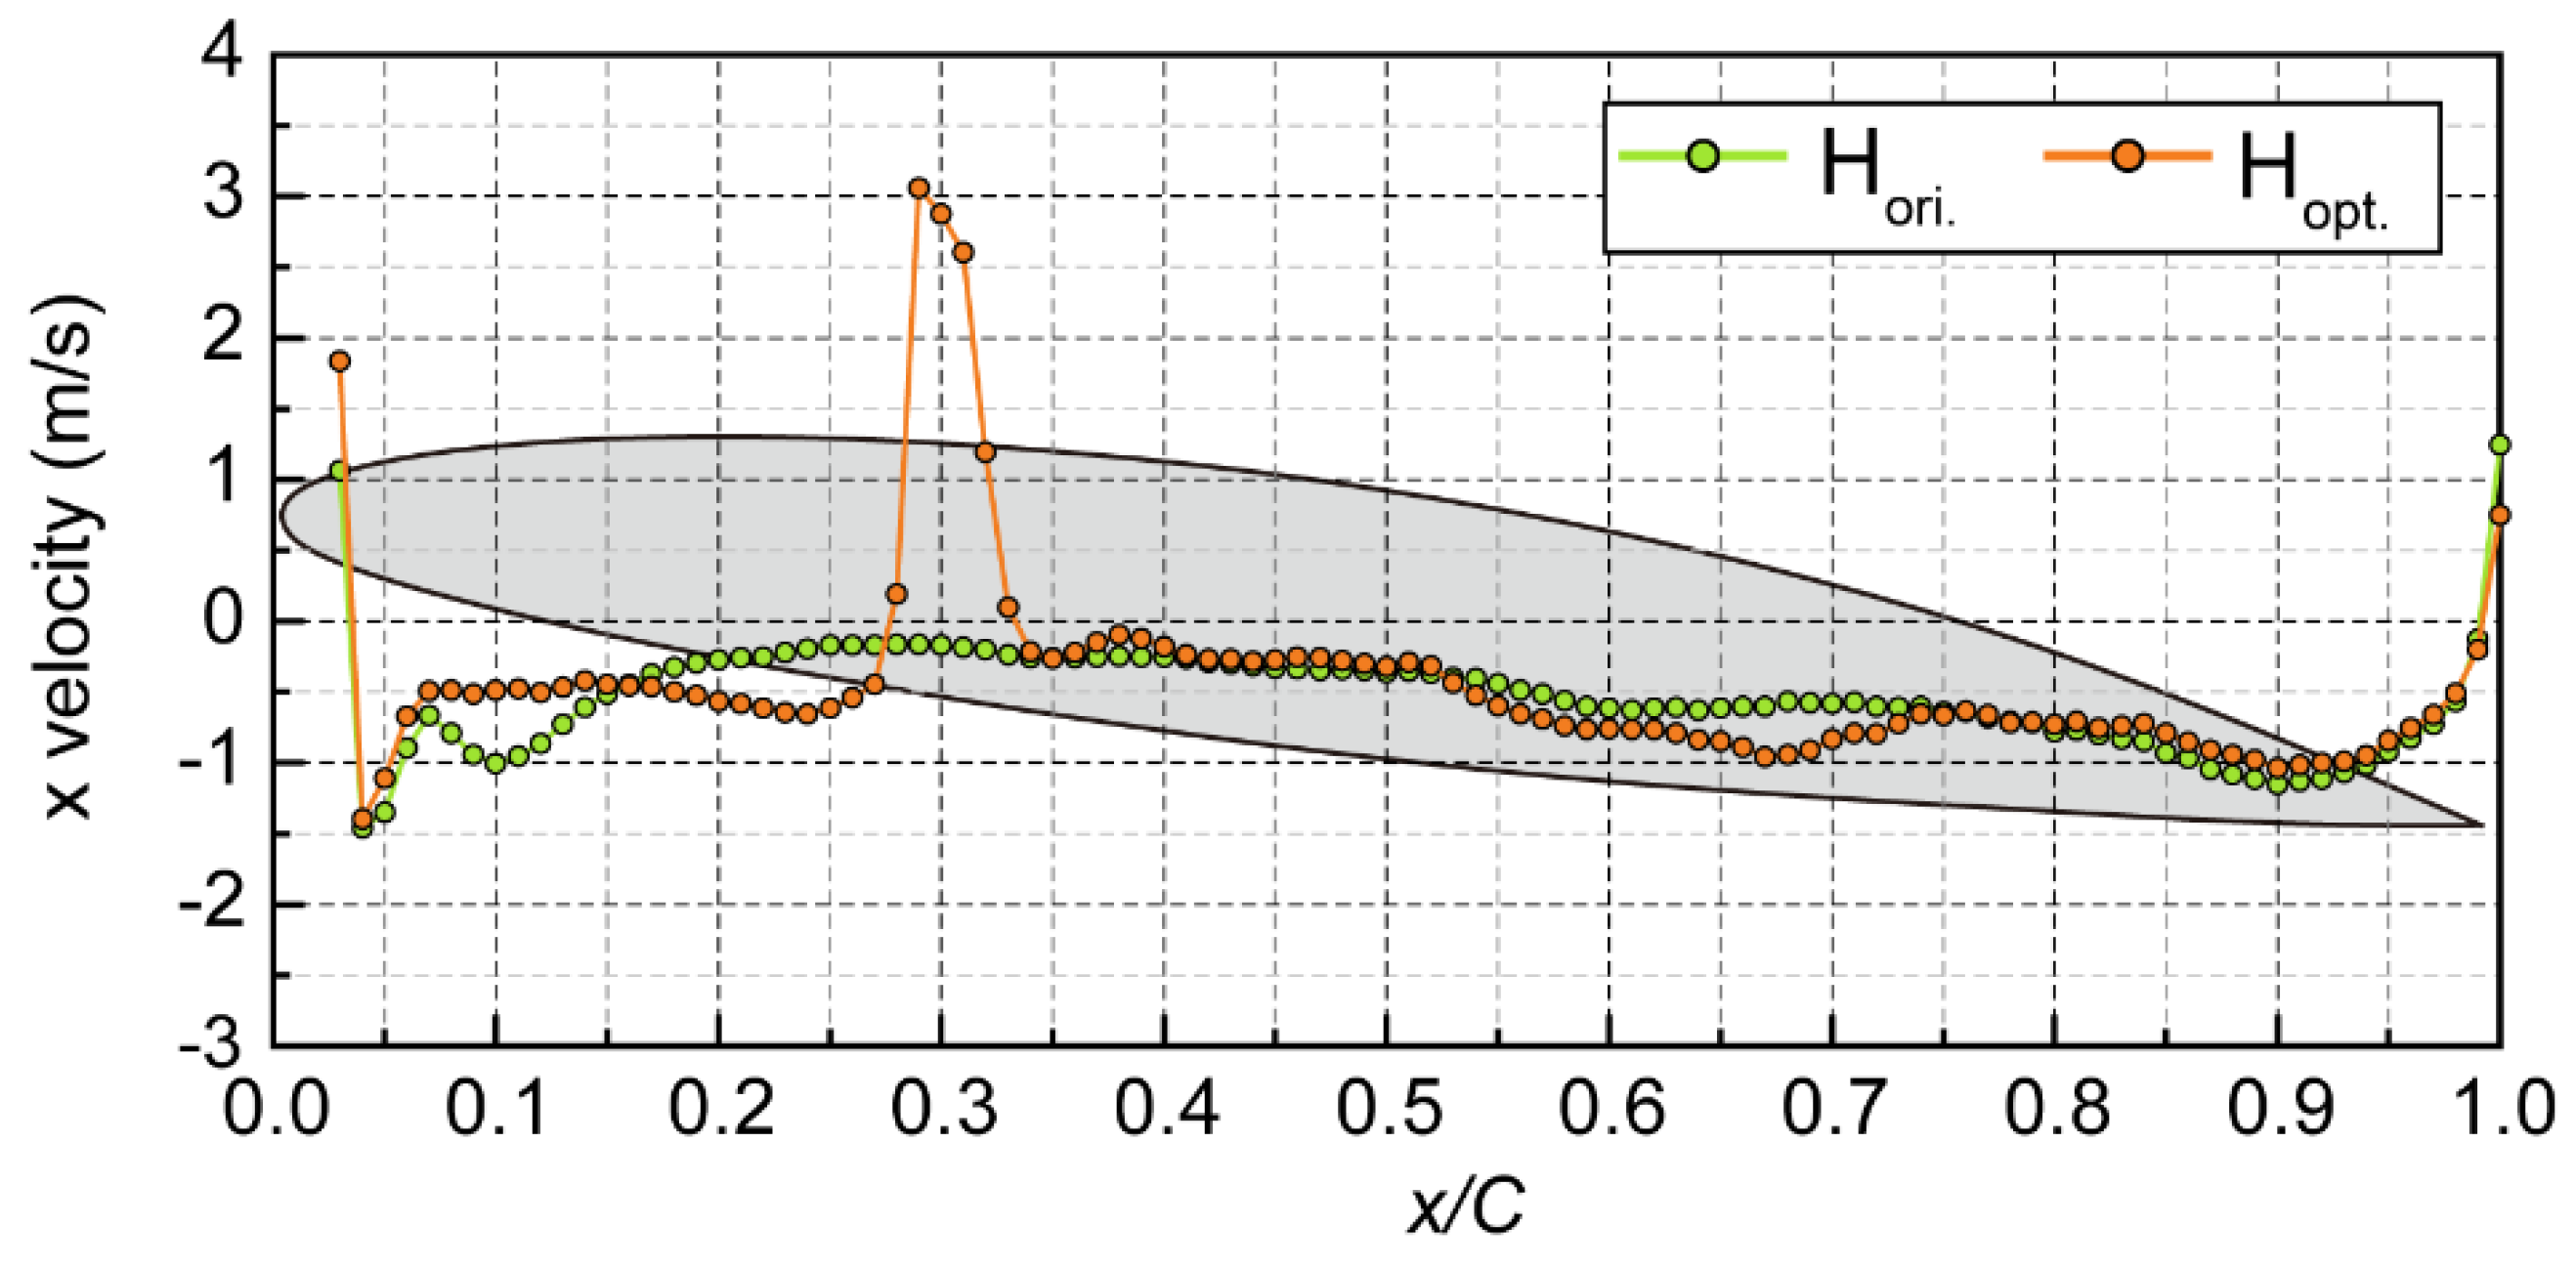
Evidence of the observed increase in lift-drag ratio can be observed in Figure 15. Notably, the X velocity distribution near the jet hole significantly exceeds values at other positions, resembling the effect of installing a power jet device on the wing. The velocity distribution downstream at 0.35C from the jet hydrofoil shows a resemblance to that of the original hydrofoil, indicating similar re-entrant jet strengths in both scenarios. Despite the water barrier emitted by the jet holes preventing the re-entrant jet from advancing toward the hydrofoil’s leading edge, it does not appear to weaken its strength. Unlike traditional studies on cavitating flow control, which generally explain the mechanism as weakening the re-entrant jet to suppress cavitation, the mechanism of cavitation suppression by the jet method in this study may differ from the conventional approach.
Next, the pressure distribution of Hopt is investigated, and the pressure coefficient Cp is defined as follows:
C p = p p o u t 0.5 ρ U 2
The adverse pressure gradient promotes the propagation of re-entrant jet, resulting in serious flow separation, which is the main cause of cavitation instability. In this paper, the gradient of pressure coefficient to space is defined, as shown in the following equation:
g r a d C p = C p ( x / C )
Negative values of gradCp indicate an adverse pressure gradient from the trailing edge to the leading edge, while positive values indicate a favorable forward pressure gradient from the leading edge to the trailing edge. Figure 16 depicts the time evolution of gradCp over two cavitation cycles as a function of both space and time.
In Figure 16 (a), enclosed by dotted lines in the circular box, the adverse pressure gradient on Hori is observed to develop steadily and continuously over time. In contrast, Figure 16 (b) shows scattered red regions interspersed with blue areas. The jet creates an interweaving pattern of forward and inverse pressure gradients on the hydrofoil’s surface, disrupting the continuous space-time development of gradCp. This observation indicates that the jet has a favorable influence in decelerating flow separation. Notably, a blocky area of inverse pressure gradient (marked by the rectangular box) is observed near the jet location. This leads to the attraction of the jet towards the leading edge and consequently disrupting the attached cavitation structure.
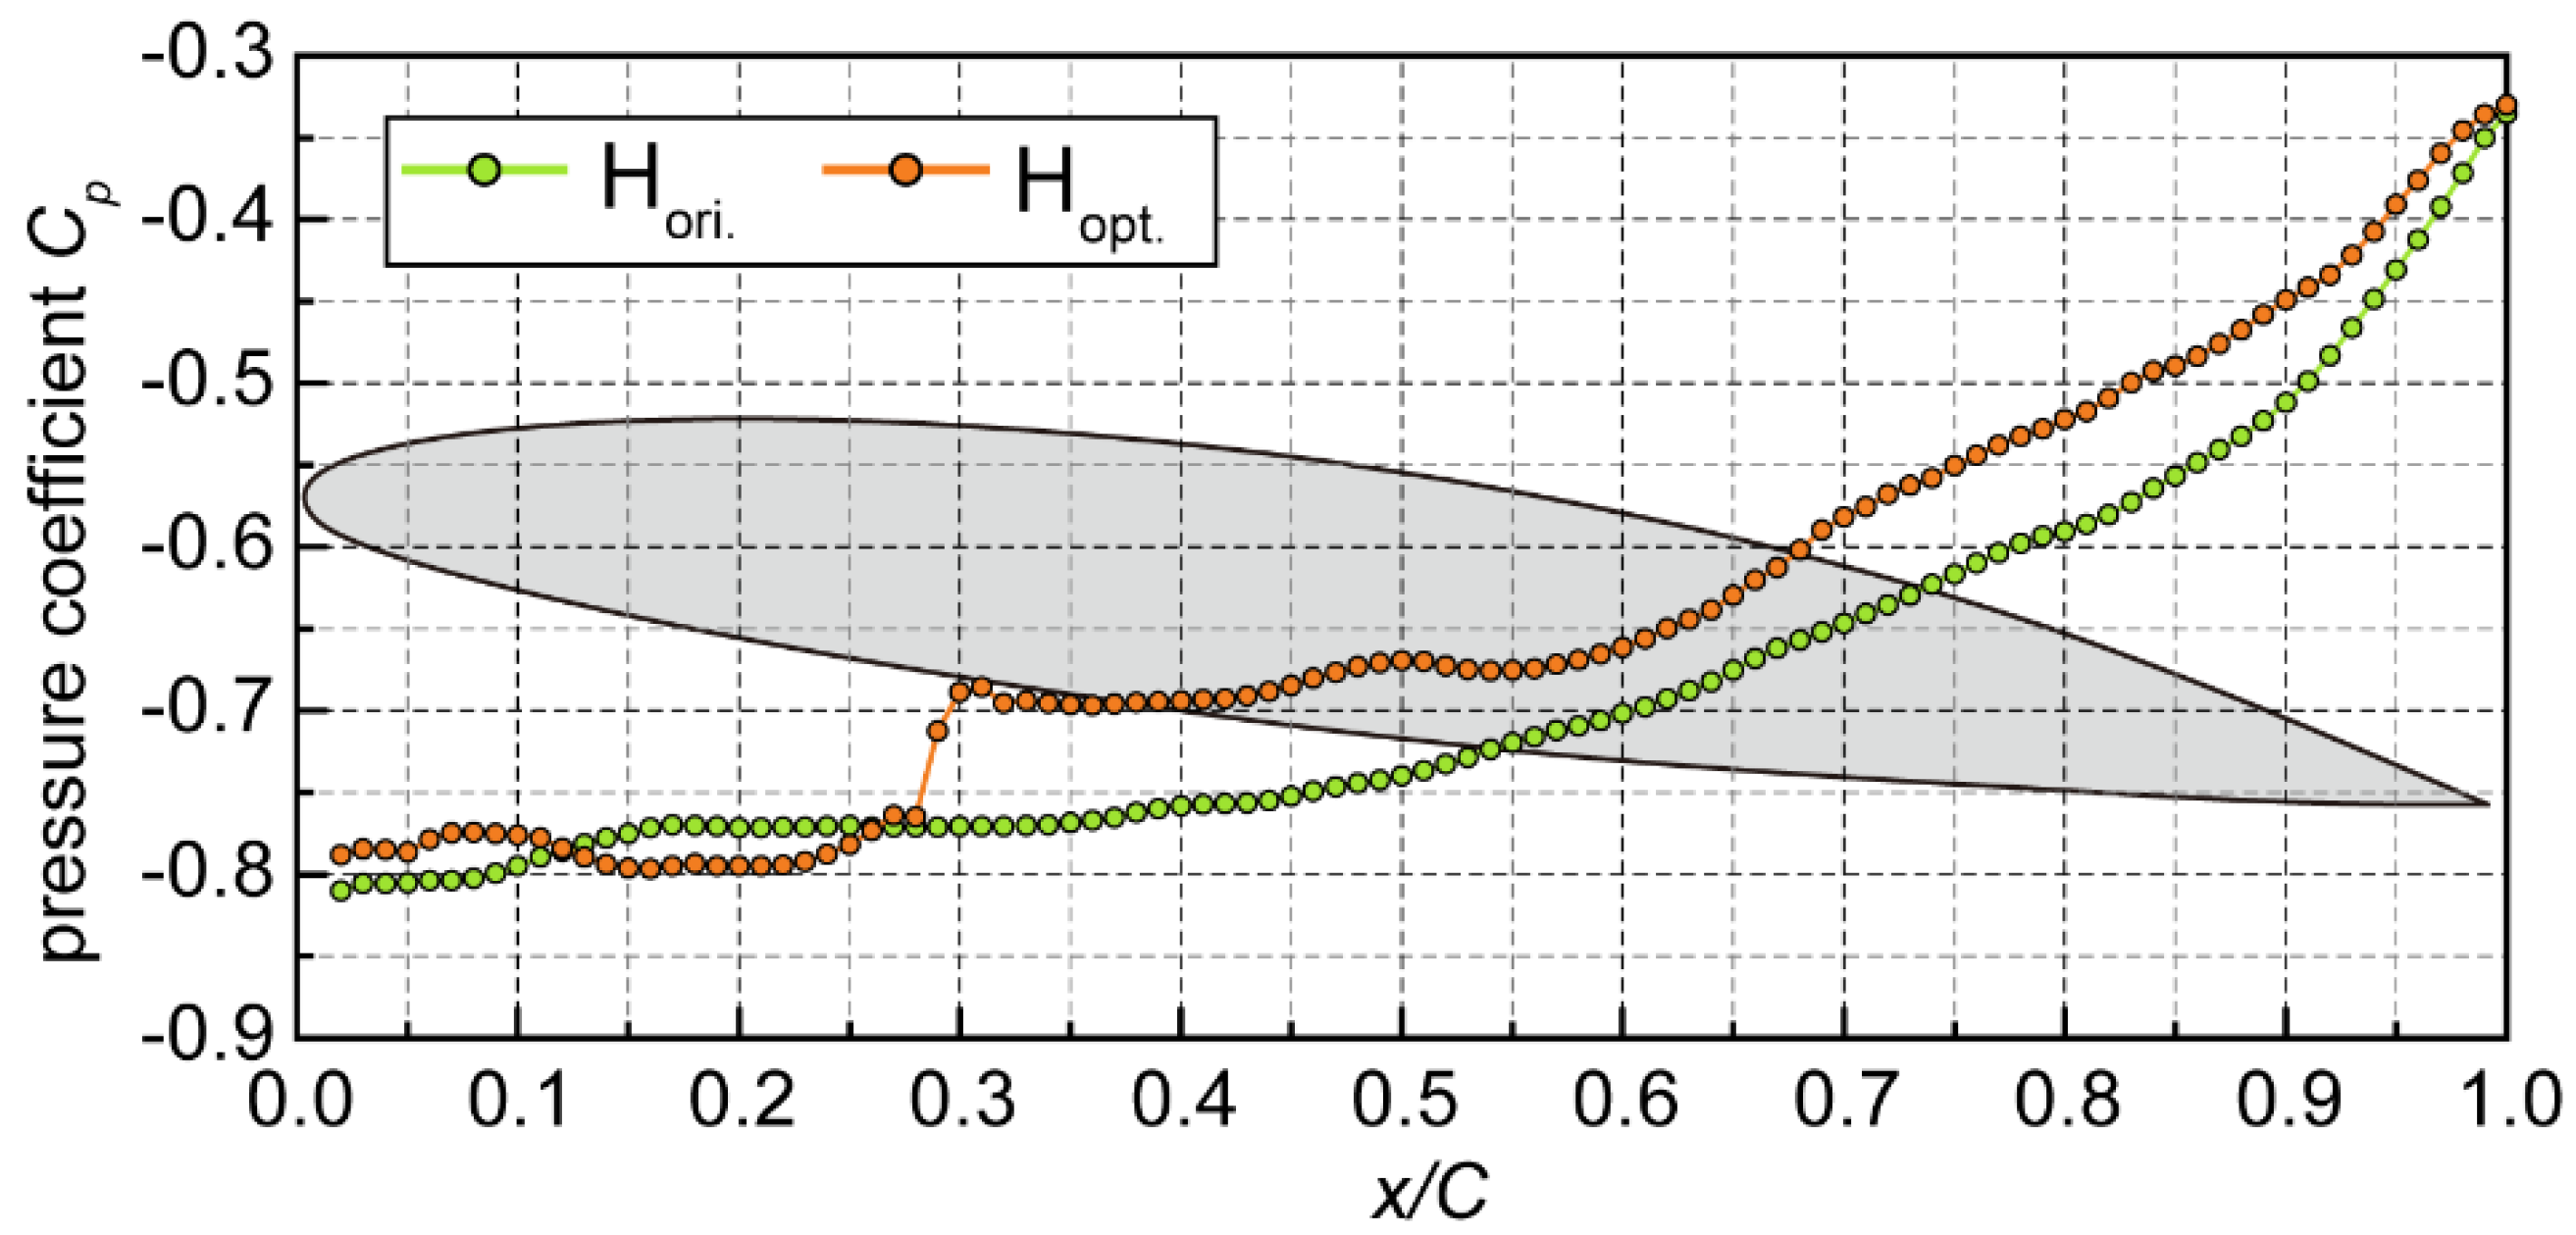
Figure 17 shows the chordwise distribution of time-averaged pressure coefficient from the near-wall region of the two hydrofoils. Before the jet position at 0.3C, the pressure coefficient (Cp) distributions of the two hydrofoils exhibit close similarities. However, beyond 0.3C, the Cp of the jet hydrofoil demonstrates a notable overall increase. Compared with the original hydrofoil, the Cp after the jet position exhibits an average increase of 9.07%. As widely acknowledged, the lift generated by hydrofoil results from the pressure difference between its suction surface and pressure surface. Hence, the decrease in lift coefficient of the jet hydrofoil can be attributed to this rise in Cp. Nonetheless, this phenomenon may not necessarily be disadvantageous. The augmented pressure coefficient on the suction surface creates an unfavorable environment for the survival of the vapor phase, which is favorable from the perspective of cavitation suppression. Consequently, this reaches the issue of achieving a trade-off between energy performance and cavitation suppression, which returns to the primary objective of this research.

5.4. Influence Mechanism of Injection Parameters on Flow Performance

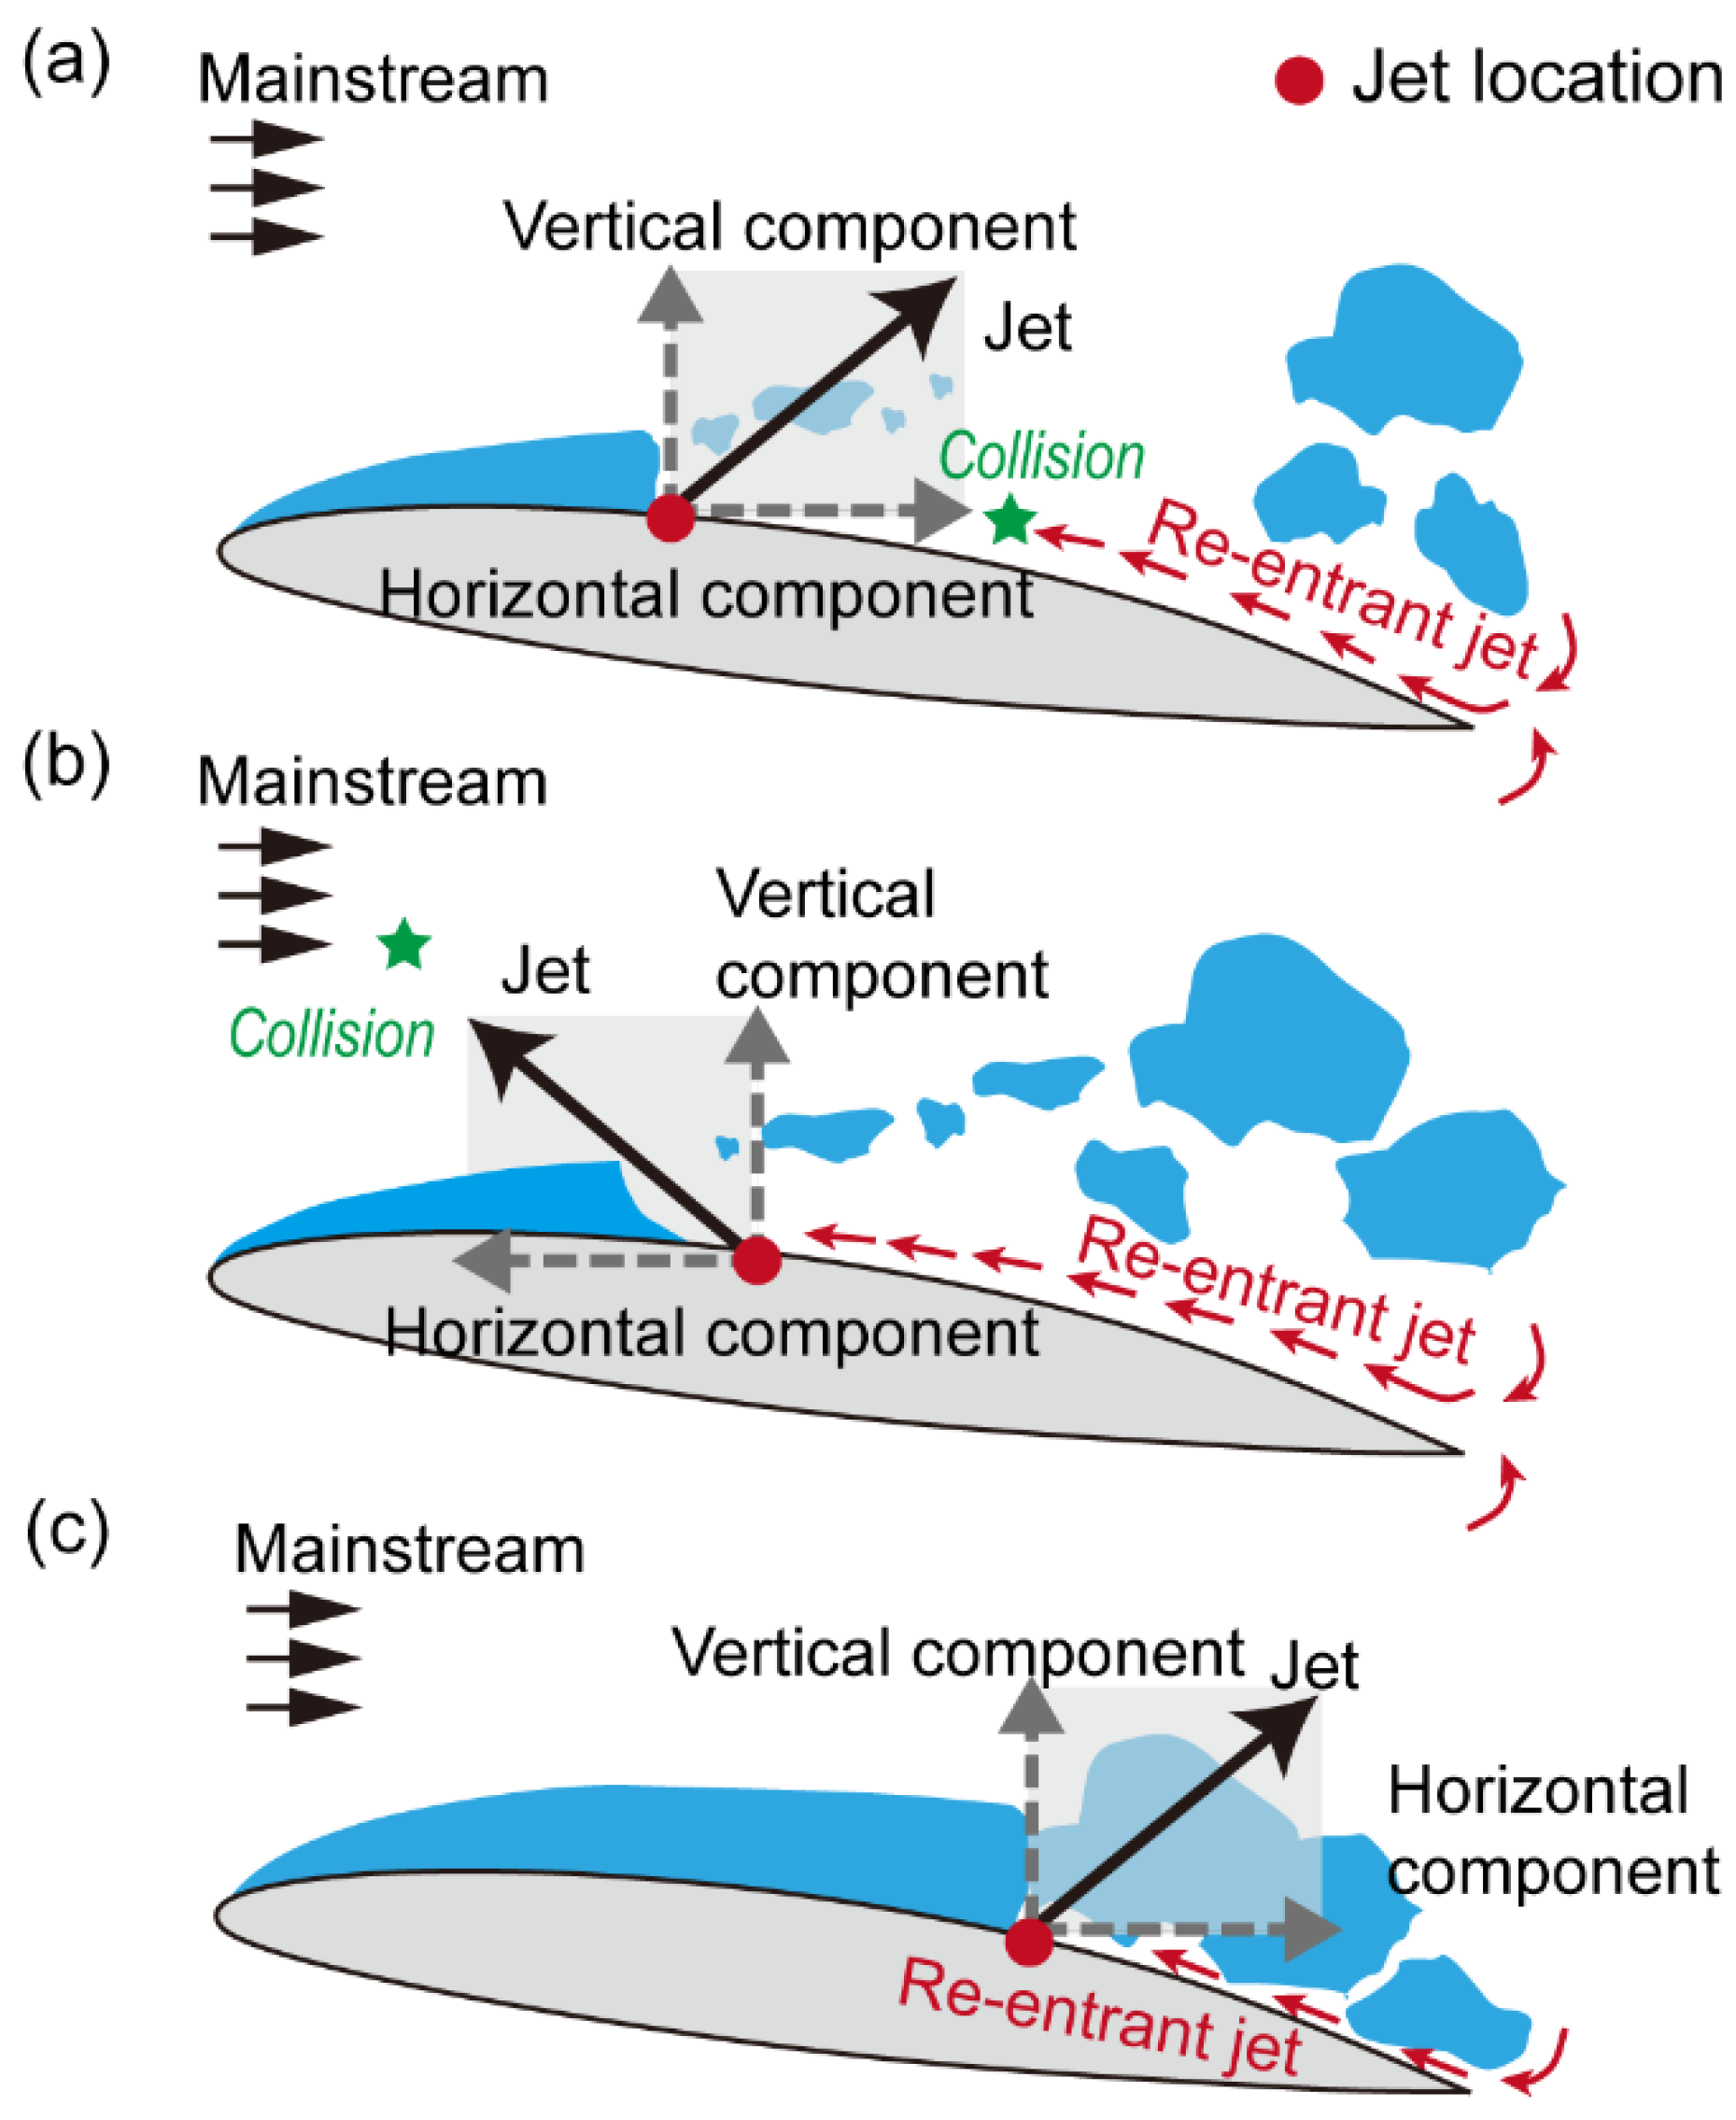
Based on the conclusions and analyses presented in the preceding sections, this section aims to explore and summarize the mechanisms underlying the influence of injection parameters on hydrofoil energy performance and cavitation suppression. To facilitate comprehension, the interaction between the jet and cavitation is conceptualized in a graph, where the jet is divided into vertical and horizontal components, as depicted in Figure 18.
The jet plays a vital role in impeding the expansion of attached cavitation, attributed to its vertical component. In Figure 18 (a), when the jet angle (αjet) is positive, a more inclined jet direction relative to the X-axis results in a larger horizontal component. As illustrated in Figure 8 (c), the average?ηeng increases with an escalating jet angle, ranging from 0 degrees to +60 degrees. Thus, it is inferred that the positive horizontal component of the jet contributes to an increase in the hydrofoil’s lift-drag ratio. Conversely, with a negative jet angle, the horizontal component conflicts with the main stream and even strengthens the incoming re-entrant jet, as depicted in Figure 18 (b), leading to a decline in the hydrofoil’s lift-drag ratio. This inference is further corroborated by the observed low levels of?ηeng at negative angles in Figure 8 (c).
Notably, when the jet angle is -60 degrees, the jet plays a role of an additional re-entrant jet stream. This exacerbates cavitation instability. The strengthened re-entrant jet and its counteracting impact on cavitation suppression ultimately result in a very low cavitation suppression efficiency.
The stability of attached cavitation diminishes as it extends towards the trailing edge, becoming extremely unstable when it nears the hydrofoil trailing edge. As depicted in Figure 18 (c), placing the jet in close proximity to the trailing edge yields unfavorable intervention effects. The cavitation instability on the suction surface disrupts the hydrofoil’s energy performance, rendering the jet at this position insufficient in improving the lift-drag ratio. Consequently, the jet at 0.60C in Figure 8 (b) exhibits lower levels for both ηcav. and ηeng.
These analyses shed light on the intricate interplay between injection parameters and their impacts on cavitation suppression and hydrofoil energy performance. The findings underscore the importance of considering jet angle and position for achieving an optimal balance between lift enhancement and cavitation mitigation, contributing to a deeper understanding of the jet method’s potential for flow control applications.

6. Conclusion

This study explored the impact of multiple injection parameters in active water injection, including jet angle, jet location, and jet velocity, on cloud cavitation (σ = 0.83) suppression around a model scale NACA66 hydrofoil through numerical simulation. The mixed-level orthogonal test method is employed to systematically investigate the influence of the three factors and their levels on cavitation suppression efficiency and energy performance of the hydrofoil. The detailed conclusions are as follows:
(1) The jet location (Ljet) emerged as the paramount factor in cavitation suppression, with the most effective suppression observed at Ljet = 0.19C, αjet = 0 degrees, and Ujet = 3.25 m/s. In contrast, the jet angle (αjet) was identified as the primary influencer on the hydrofoil’s energy performance, achieving optimal results at Ljet = 0.45C, αjet = +60 degrees, and Ujet = 2.89 m/s.
(2) Striking a balance between cavitation suppression and energy efficiency, an optimal jet configuration was found at Ljet = 0.30C, αjet = +60 degrees, and Ujet = 3.25 m/s. This setup notably reduced the cavitation volume by 49.34% and improved the lift-drag ratio by 8.55%, albeit with a slight decrease in the lift coefficient by 1.43%.
(3) Detailed analysis of the cavitation suppression mechanism revealed that the active jet significantly alters the internal structure of cavitation clouds. The jet significantly promotes vapor condensation, diminishes the intensity of the vapor-liquid exchange. It induces fragmentation in the vapor phase regions, disrupts the formation of intense attached cavitation, and raises the pressure on the hydrofoil’s suction surface. This counteracts the adverse pressure gradient, curbing flow separation and fostering flow field stabilization.
(4) Analyzing the A5B2C4 case and 20 other cases revealed how jets affect cavitation and lift-drag ratios, with positive jets enhancing and negative angles diminishing lift-drag ratios. Jet placements near the hydrofoil’s end were found to harm cavitation control and energy efficiency, offering valuable reference for injection parameter optimization to balance cavitation suppression with energy performance.

Author Contributions

Conceptualization, Wei Wang and Zhijian Li; Data curation, Wei Wang; Formal analysis, Wei Wang and Zhijian Li; Funding acquisition, Wei Wang; Investigation, Wei Wang and Zhijian Li; Methodology, Zhijian Li; Project administration, Wei Wang; Resources, Wei Wang and Xiaofang Wang; Software, Zhijian Li and Xiang Ji; Supervision, Wei Wang and Xiaofang Wang; Validation, Zhijian Li, Xiang Ji and Yun Wang; Visualization, Zhijian Li, Xiang Ji and Yun Wang; Writing—original draft, Zhijian Li; Writing—review & editing, Wei Wang and Zhijian Li. All authors have read and agreed to the published version of the manuscript.

Funding

This research was funded by the National Natural Science Foundation of China, grant No. 51876022).

Institutional Review Board Statement

Not applicable.

Informed Consent Statement

Not applicable.

Data Availability Statement

The data presented in this study are available on request from the corresponding author. (the data are not publicly available due to privacy.)

Acknowledgments

The authors are grateful for the support of the National Natural Science Foundation of China (51876022), and two master graduates, Zhaoyang An and Mingyu Liu, have invested in the preliminary work of this study.

Conflicts of Interest

The authors declare no conflict of interest.

References

  1. Wang, G.; Wu, Q.; Huang, B. Dynamics of Cavitation–Structure Interaction. Acta Mech. Sin. /Lixue Xuebao 2017, 33, 685–708. [Google Scholar] [CrossRef]
  2. Yang, C.; Zhang, J.; Huang, Z. Numerical Study on Cavitation-Vortex-Noise Correlation Mechanism and Dynamic Mode Decomposition of a Hydrofoil. Phys. Fluids 2022, 34. [Google Scholar] [CrossRef]
  3. Long, Y.; Long, X.; Ji, B. LES Investigation of Cavitating Flows around a Sphere with Special Emphasis on the Cavitation–Vortex Interactions. Acta Mech. Sin. /Lixue Xuebao 2020, 36, 1238–1257. [Google Scholar] [CrossRef]
  4. Peters, A.; Sagar, H.; Lantermann, U.; el Moctar, O. Numerical Modelling and Prediction of Cavitation Erosion. Wear 2015, 338–339, 189–201. [Google Scholar] [CrossRef]
  5. Qiu, N.; Zhou, W.; Che, B.; Wu, D.; Wang, L.; Zhu, H. Effects of Microvortex Generators on Cavitation Erosion by Changing Periodic Shedding into New Structures. Phys. Fluids 2020, 32. [Google Scholar] [CrossRef]
  6. Kawasaki, S.; Shimura, T.; Uchiumi, M.; Iga, Y. One-Dimensional Analysis Method for Cavitation Instabilities of a Rotating Machinery. J. Fluids Eng. Trans. ASME 2018, 140. [Google Scholar] [CrossRef]
  7. Bai, X.; Cheng, H.; Ji, B. LES Investigation of the Noise Characteristics of Sheet and Tip Leakage Vortex Cavitating Flow. Int. J. Multiph. Flow 2022, 146, 103880. [Google Scholar] [CrossRef]
  8. Gropper, D.; Wang, L.; Harvey, T.J. Hydrodynamic Lubrication of Textured Surfaces: A Review of Modeling Techniques and Key Findings. Tribol Int 2016, 94, 509–529. [Google Scholar] [CrossRef]
  9. Wang, W.; Li, Z.; Liu, M.; Ji, X. Influence of Water Injection on Broadband Noise and Hydrodynamic Performance for a NACA66 (MOD) Hydrofoil under Cloud Cavitation Condition. Appl. Ocean Res. 2021, 115, 102858. [Google Scholar] [CrossRef]
  10. Li, Z.; Wang, W.; Ji, X.; Wang, X. Investigation of Water Injection Influence on Cloud Cavitating Vortical Flow for a Naca66 (Mod) Hydrofoil. Energ. (Basel) 2021, 14, 5973. [Google Scholar] [CrossRef]
  11. Che, B.; Wu, D. Study on Vortex Generators for Control of Attached Cavitation. Am. Soc. Mech. Eng. Fluids Eng. Div. (Publ. ) FEDSM 2017, 1A-2017, 1–7. [Google Scholar] [CrossRef]
  12. Che, B.; Chu, N.; Cao, L.; Schmidt, S.J.; Likhachev, D.; Wu, D. Control Effect of Micro Vortex Generators on Attached Cavitation Instability. Phys. Fluids 2019, 31. [Google Scholar] [CrossRef]
  13. Che, B.; Cao, L.; Chu, N.; Likhachev, D.; Wu, D. Effect of Obstacle Position on Attached Cavitation Control through Response Surface Methodology. J. Mech. Sci. Technol. 2019, 33, 4265–4279. [Google Scholar] [CrossRef]
  14. Zhang, L.; Chen, M.; Shao, X. Inhibition of Cloud Cavitation on a Flat Hydrofoil through the Placement of an Obstacle. Ocean Eng. 2018, 155, 1–9. [Google Scholar] [CrossRef]
  15. Kadivar, E.; Moctar, O. el; Javadi, K. Stabilization of Cloud Cavitation Instabilities Using Cylindrical Cavitating-Bubble Generators (CCGs). Int. J. Multiph. Flow 2019, 115, 108–125. [Google Scholar] [CrossRef]
  16. Kadivar, E.; Timoshevskiy, M. V.; Pervunin, K.S.; Moctar, O. el Cavitation Control Using Cylindrical Cavitating-Bubble Generators (CCGs): Experiments on a Benchmark CAV2003 Hydrofoil. Int. J. Multiph. Flow 2020, 125, 103186. [Google Scholar] [CrossRef]
  17. Liu, Y.; Tan, L. Influence of C Groove on Suppressing Vortex and Cavitation for a NACA0009 Hydrofoil with Tip Clearance in Tidal Energy. Renew Energy 2020, 148, 907–922. [Google Scholar] [CrossRef]
  18. Liu, Y.; Tan, L. Method of C Groove on Vortex Suppression and Energy Performance Improvement for a NACA0009 Hydrofoil with Tip Clearance in Tidal Energy. Energy 2018, 155, 448–461. [Google Scholar] [CrossRef]
  19. Yang, Z.; Wang, X.; Zhao, X.; Cheng, H.; Ji, B. LES Investigation of the Wavy Leading Edge Effect on Cavitation Noise. Ultrason Sonochem 2024, 103, 106780. [Google Scholar] [CrossRef]
  20. Qiu, N.; Zhu, H.; Che, B.; Zhou, W.; Bai, Y.; Wang, C. Interaction Mechanism between Cloud Cavitation and Micro Vortex Flows. Ocean Eng. 2024, 297, 117004. [Google Scholar] [CrossRef]
  21. Amini, A.; Reclari, M.; Sano, T.; Iino, M.; Farhat, M. Suppressing Tip Vortex Cavitation by Winglets. Exp Fluids 2019, 60, 1–15. [Google Scholar] [CrossRef]
  22. Cheng, H. yu; Ji, B.; Long, X. ping; Huai, W. xin; Farhat, M. A Review of Cavitation in Tip-Leakage Flow and Its Control. Journal of Hydrodynamics 2021 33:2 2021, 33, 226–242. [Google Scholar] [CrossRef]
  23. Cheng, H.; Long, X.; Ji, B.; Peng, X.; Farhat, M. Suppressing Tip-Leakage Vortex Cavitation by Overhanging Grooves. Exp Fluids 2020, 61, 1–18. [Google Scholar] [CrossRef]
  24. Timoshevskiy, M. V.; Zapryagaev, I.I. Generation of a Wall Jet to Control Unsteady Cavitation over a 2D Hydrofoil: Visualization and Hydroacoustic Signal Analysis. J Phys Conf Ser 2017, 899, 032021. [Google Scholar] [CrossRef]
  25. Timoshevskiy, M. V.; Zapryagaev, I.I.; Pervunin, K.S.; Markovich, D.M. Cavitation Control on a 2D Hydrofoil through a Continuous Tangential Injection of Liquid: Experimental Study. AIP Conf Proc 2016, 1770. [Google Scholar] [CrossRef]
  26. Timoshevskiy, M. V.; Zapryagaev, I.I.; Pervunin, K.S.; Markovich, D.M. Cavitating Flow Control through Continuous Tangential Mass Injection on a 2D Hydrofoil at a Small Attack Angle. MATEC Web Conf. 2016, 84, 00039. [Google Scholar] [CrossRef]
  27. Chang, N.; Ganesh, H.; Yakushiji, R.; Ceccio, S.L. Tip Vortex Cavitation Suppression by Active Mass Injection. J. Fluids Eng. Trans. ASME 2011, 133. [Google Scholar] [CrossRef]
  28. Lee, C.S.; Ahn, B.K.; Han, J.M.; Kim, J.H. Propeller Tip Vortex Cavitation Control and Induced Noise Suppression by Water Injection. J. Mar. Sci. Technol. (Jpn. ) 2018, 23, 453–463. [Google Scholar] [CrossRef]
  29. de Giorgi, M.G.; Ficarella, A.; Fontanarosa, D. Active Control of Unsteady Cavitating Flows in Turbomachinery. Proc. ASME Turbo Expo 2019, 2A-2019, 2A–2019. [Google Scholar] [CrossRef]
  30. Maltsev, L.I.; Dimitrov, V.D.; Milanov, E.M.; Zapryagaev, I.I.; Timoshevskiy, M. V.; Pervunin, K.S. Jet Control of Flow Separation on Hydrofoils: Performance Evaluation Based on Force and Torque Measurements. J. Eng. Thermophys. 2020, 29, 424–442. [Google Scholar] [CrossRef]
  31. Wang, W.; Yi, Q.; Lu, S.; Wang, X. Exploration and Research of the Impact of Hydrofoil Surface Water Injection on Cavitation Suppression. In Proceedings of the Volume 2D: Turbomachinery; American Society of Mechanical Engineers, June 26 2017; Vol. 2D-2017; pp. 1–8. [Google Scholar]
  32. Lu, S.P.; Wang, W.; Hou, T.; Zhang, M.; Jiao, J.; Zhang, Q.; Wang, X.F. Experiment Research on Cavitation Control by Active Injection. In Proceedings of the Proceedings of the 10th International Symposium on Cavitation (CAV2018); pp. 2019363–368.
  33. Liu, M.; Tan, L.; Cao, S. Cavitation-Vortex-Turbulence Interaction and One-Dimensional Model Prediction of Pressure for Hydrofoil ALE15 by Large Eddy Simulation. J. Fluids Eng. Trans. ASME 2018, 141. [Google Scholar] [CrossRef]
  34. Li, L.; Wang, Z.; Li, X.; Zhu, Z. Multiscale Modeling of Tip-Leakage Cavitating Flows by a Combined Volume of Fluid and Discrete Bubble Model. Phys. Fluids 2021, 33. [Google Scholar] [CrossRef]
  35. Li, L.; Jiang, B.; Wei, G.; Li, X.; Zhu, Z. Multiscale Multiphase Flow Simulations Using Interface Capturing and Lagrangian Particle Tracking. Phys. Fluids 2022, 34. [Google Scholar] [CrossRef]
  36. Li, F.; Huang, Q.; Pan, G.; Shi, Y. Effect of Hydrofoil Leading Edge Waviness on Hydrodynamic Performance and Flow Noise. Ocean Eng. 2021, 231, 108883. [Google Scholar] [CrossRef]
  37. Li, F.; Huang, Q.; Pan, G.; Shi, Y. Numerical Study on Hydrodynamic Performance and Flow Noise of a Hydrofoil with Wavy Leading-Edge. AIP Adv 2021, 11. [Google Scholar] [CrossRef]
  38. Yu, A.; Ji, B.; Huang, R.F.; Zhang, Y.; Zhang, Y.N.; Luo, X.W. Cavitation Shedding Dynamics around a Hydrofoil Simulated Using a Filter-Based Density Corrected Model. Sci China Technol Sci 2015, 58, 864–869. [Google Scholar] [CrossRef]
  39. Cheng, H.Y.; Long, X.P.; Ji, B.; Liu, Q.; Bai, X.R. 3-D Lagrangian-Based Investigations of the Time-Dependent Cloud Cavitating Flows around a Clark-Y Hydrofoil with Special Emphasis on Shedding Process Analysis. J. Hydrodyn. 2018, 30, 122–130. [Google Scholar] [CrossRef]
  40. Long, X.; Cheng, H.; Ji, B.; Arndt, R.E.A. Numerical Investigation of Attached Cavitation Shedding Dynamics around the Clark-Y Hydrofoil with the FBDCM and an Integral Method. Ocean Eng. 2017, 137, 247–261. [Google Scholar] [CrossRef]
  41. Han, Y.; Liu, Y.; Tan, L. Method of Variable-Depth Groove on Vortex and Cavitation Suppression for a NACA0009 Hydrofoil with Tip Clearance in Tidal Energy. Renew Energy 2022, 199, 546–559. [Google Scholar] [CrossRef]
  42. Wang, W.; Tang, T.; Zhang, Q.D.; Wang, X.F.; An, Z.Y.; Tong, T.H.; Li, Z.J. Effect of Water Injection on the Cavitation Control:Experiments on a NACA66 (MOD) Hydrofoil. Acta Mech. Sin. /Lixue Xuebao 2020, 36, 999–1017. [Google Scholar] [CrossRef]
  43. Leroux, J.B.; Astolfi, J.A.; Billard, J.Y. An Experimental Study of Unsteady Partial Cavitation. J. Fluids Eng. Trans. ASME 2004, 126, 94–101. [Google Scholar] [CrossRef]
  44. Leroux, J.B.; Coutier-Delgosha, O.; Astolfi, J.A. A Joint Experimental and Numerical Study of Mechanisms Associated to Instability of Partial Cavitation on Two-Dimensional Hydrofoil. Phys. Fluids 2005, 17, 1–20. [Google Scholar] [CrossRef]
  45. Liu, M.; Tan, L.; Liu, Y.; Xu, Y.; Cao, S. Large Eddy Simulation of Cavitation Vortex Interaction and Pressure Fluctuation around Hydrofoil ALE 15. Ocean Eng. 2018, 163, 264–274. [Google Scholar] [CrossRef]
  46. Li, Z.; Wang, W.; Ji, X.; Wang, X.; Wang, Y. Loading Noise Induced by Cavitating Flow and Its Simplified Model Prediction. Ocean Eng. 2023, 280, 114584. [Google Scholar] [CrossRef]
  47. Zhao, M. sheng; Zhao, W. wen; Wan, D. cheng Numerical Simulations of Propeller Cavitation Flows Based on OpenFOAM. J. Hydrodyn. 2020, 32, 1071–1079. [Google Scholar] [CrossRef]
  48. Li, X.; Li, B.; Yu, B.; Ren, Y.; Chen, B. Calculation of Cavitation Evolution and Associated Turbulent Kinetic Energy Transport around a NACA66 Hydrofoil. J. Mech. Sci. Technol. 2019, 33, 1231–1241. [Google Scholar] [CrossRef]
  49. Li, D.Q.; Grekula, M.; Lindell, P. Towards Numerical Prediction of Unsteady Sheet Cavitation on Hydrofoils. J. Hydrodyn. 2010, 22, 741–746. [Google Scholar] [CrossRef]
  50. Coutier-Delgosha, O.; Fortes-Patella, R.; Reboud, J.L. Evaluation of the Turbulence Model Influence on the Numerical Simulations of Unsteady Cavitation. J. Fluids Eng. Trans. ASME 2003, 125, 38–45. [Google Scholar] [CrossRef]
  51. Zwart, P.J.; Gerber, A.G.; Belamri, T. A Two-Phase Flow Model for Predicting Cavitation Dynamics. In Proceedings of the 5th International Conference on Multiphase Flow; 2004; Vol. 152; p. 152. [Google Scholar]
  52. Xing, T.; Stern, F. Factors of Safety for Richardson Extrapolation. J. Fluids Eng. Trans. ASME 2010, 132, 0614031–0640313. [Google Scholar] [CrossRef]
  53. Wilson, R.; Shao, J.; Stern, F. Discussion: Criticisms of the “Correction Factor” Verification Method. J Fluids Eng 2004, 126, 704–706. [Google Scholar] [CrossRef]
  54. Stern, F.; Wilson, R. V.; Coleman, H.W.; Paterson, E.G. Comprehensive Approach to Verification and Validation of CFD Simulations—Part 1: Methodology and Procedures. J Fluids Eng 2001, 123, 793–802. [Google Scholar] [CrossRef]
  55. Roache, P. 1998.
  56. Wang, B.; Lin, R.; Liu, D.; Xu, J.; Feng, B. Investigation of the Effect of Humidity at Both Electrode on the Performance of PEMFC Using Orthogonal Test Method. Int J Hydrog. Energy 2019, 44, 13737–13743. [Google Scholar] [CrossRef]
  57. Shi, G.; Li, H.; Liu, X.; Liu, Z.; Wang, B. Transport Performance Improvement of a Multiphase Pump for Gas–Liquid Mixture Based on the Orthogonal Test Method. Processes 2021, Vol. 9, Page 1402 2021, 9, 1402. [Google Scholar] [CrossRef]
  58. Yan, H.; Zhang, H.; Zhou, L.; Liu, Z.; Zeng, Y. Optimization Design of the Unsmooth Bionic Structure of a Hydrofoil Leading Edge Based on the Grey–Taguchi Method. 2022. [CrossRef]
  59. Mohanta, D.K.; Sahoo, B.; Mohanty, A.M. Optimization of Process Parameter in AI7075 Turning Using Grey Relational, Desirability Function and Metaheuristics. 2023. [CrossRef]
  60. Yan, H.; Li, J.; Wu, M.; Xie, C.; Liu, C.; Qi, F. Study on the Influence of Active Jet Parameters on the Cavitation Performance of Clark-Y Hydrofoil. Ocean Eng. 2022, 261, 111900. [Google Scholar] [CrossRef]
  61. Correction Ji, B.; Luo, X.; Arndt, R.E.A.; Wu, Y. Numerical Simulation of Three Dimensional Cavitation Shedding Dynamics with Special Emphasis on Cavitation–Vortex Interaction. Ocean Eng. 2014, 87, 64–77. [Google Scholar] [CrossRef]
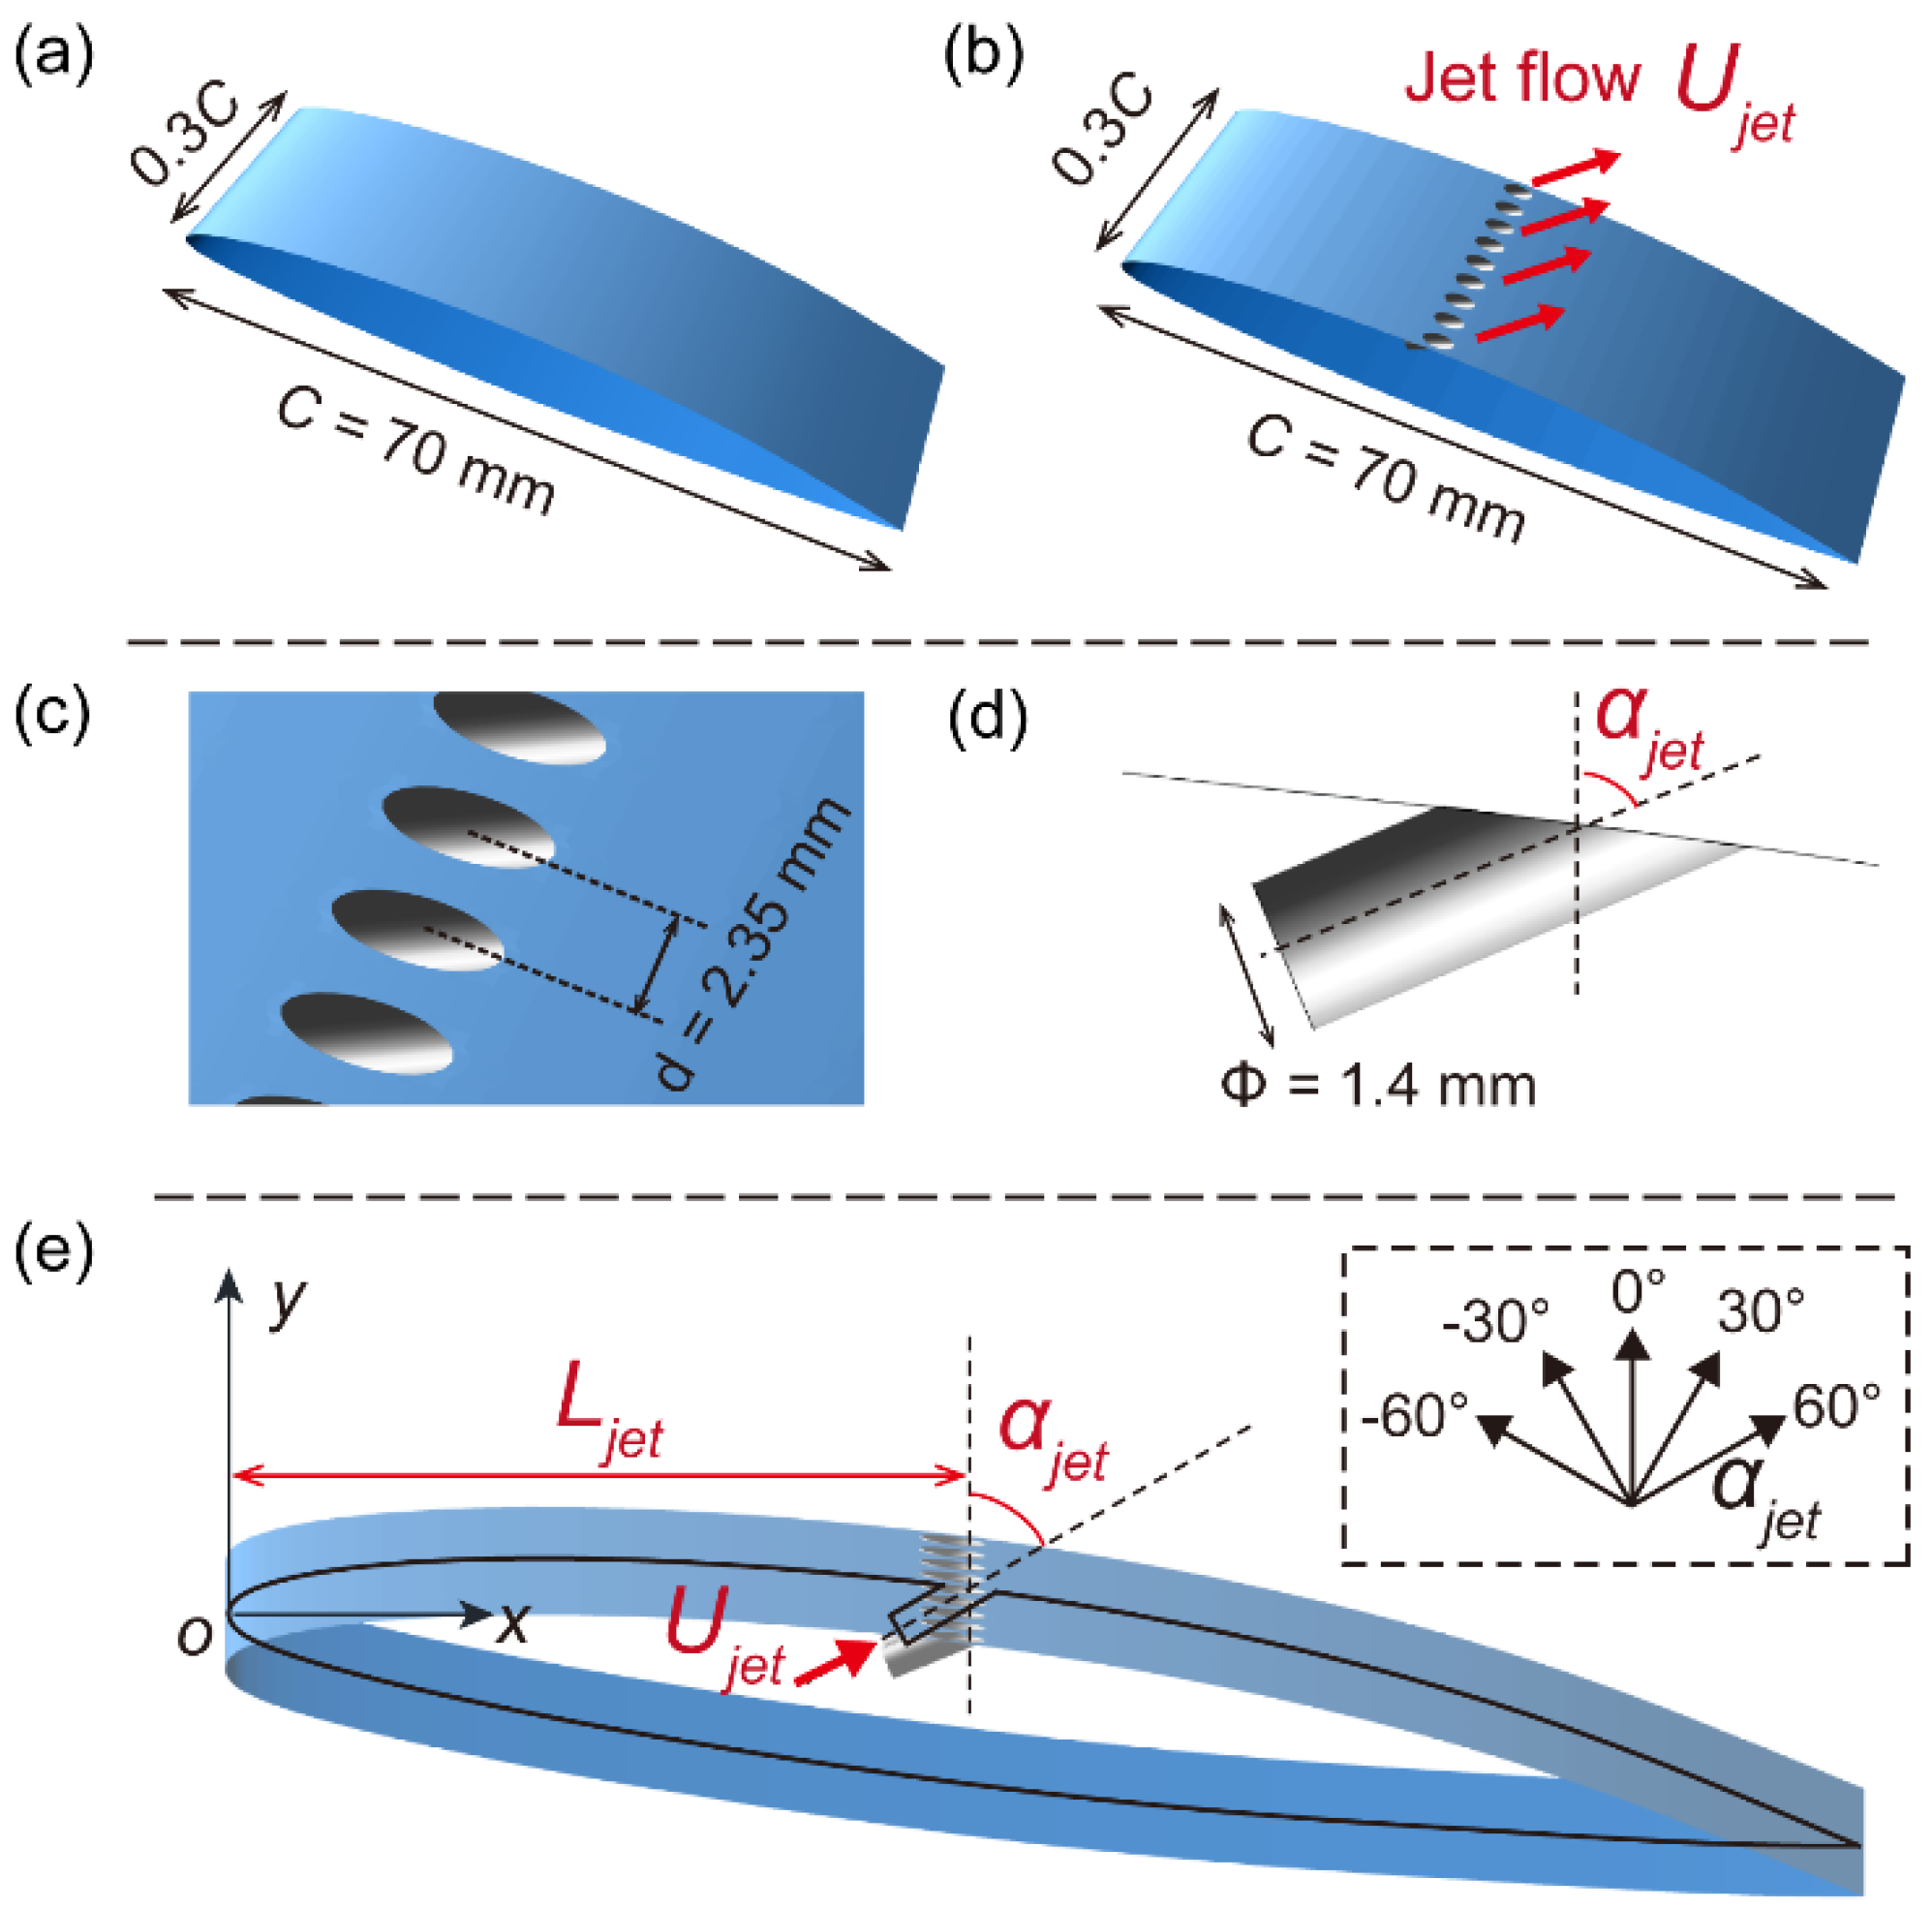
Figure 1. Schematic of hydrofoil with water injection: (a) Original hydrofoil for comparison. (b) Modified hydrofoil. (c) Details of the jet hole distance. (d) Diameter of the jet hole. (e) Graphical interpretation for the three variable parameters in this study.
Preprints 111388 g001
Figure 2. Computational domain and boundary conditions.
Preprints 111388 g002
Figure 3. Mesh distribution around the modified hydrofoil: (a) Jet hydrofoil with configuration of Ljet = 0.19C and αjet = 0°. (b) Jet hydrofoil with configuration of Ljet = 0.45C and αjet = 60°. (c) Grids distribution on the mid-section on hydrofoil. (d) Details of the hydrofoil trailing edge. (e) Details of mesh around the jet holes.
Preprints 111388 g003
Figure 4. Influence of spanwise nodes on the change trend of lift coefficient CL and drag coefficient CD.
Preprints 111388 g004
Figure 5. Schematic of velocity monitoring points for uncertainty analysis.
Preprints 111388 g005
Figure 6. Validation of cavitation cycle and patterns: (a) Monitored curves of non-dimensional cavitation area for experimental and numerical data, respectively. (b) Temporal evolution of vapor structures in one complete cavitation cycle (Re = 5×10⁵, σ = 0.83).
Preprints 111388 g006
Figure 7. Validation of cavitation cycle and patterns for jet hydrofoil: (a) Monitored curves of non-dimensional cavitation area for experimental and numerical data, respectively. (b) Temporal evolution of vapor structures, including top view and side view, in one complete cavitation cycle (Re = 5×10⁵, σ = 0.83, Ujet = 2.89 m/s).
Preprints 111388 g007
Figure 8. The performance of ηcav and ηeng under the influence of three factors: (a) jet velocity, (b) jet location and (c) jet angle, respectively.
Preprints 111388 g008
Figure 9. Monitored curves of non-dimensional cavitation area of Hori. and Hopt, respectively.
Preprints 111388 g009
Figure 10. Monitored curves of non-dimensional cavitation area of Hori. and Hopt, respectively.
Preprints 111388 g010
Figure 11. Contours of vapor volume fraction on the cut-planes along the chordwise direction. (Re = 5×10⁵, σ = 0.83).
Preprints 111388 g011
Figure 12. Contours of mass transferring on the hydrofoil’s mid-plane at moments of (a) attached cavitation developing, (b) max cavity volume and (c) unstable scattered clouds shedding (Re = 5×10⁵, σ = 0.83).
Preprints 111388 g012
Figure 13. αv distribution near hydrofoil wall along the chordwise direction. (Re = 5×10⁵, σ = 0.83).
Preprints 111388 g013
Figure 14. Energy performance for the Hori and Hopt, respectively: (a) lift coefficient, (b) drag coefficient and (c) lift-drag ratio. (Re = 5×10⁵, σ = 0.83).
Preprints 111388 g014
Figure 15. x velocity distribution near hydrofoil wall along the chordwise direction. (Re = 5×10⁵, σ = 0.83).
Preprints 111388 g015
Figure 16. Chordwise and temporal evolution of Cp gradient for (a) the original hydrofoil and (b) the jet hydrofoil, respectively. (Data extracted from the hydrofoil mid-section).
Preprints 111388 g016
Figure 17. Cp distribution near hydrofoil wall along the chordwise direction. (Re = 5×10⁵, σ = 0.83).
Preprints 111388 g017
Figure 18. Schematic of interaction among the jet, mainstream, re-entrant jet and cavitation: (a) The situation where the jet flows in same direction as the mainstream. (b) The situation where the jet flows against the mainstream. (c) The situation where the jet placed near the hydrofoil trailing edge.
Preprints 111388 g018
Table 1. Factors and their corresponding levels in the study.
Levels Jet angle αjet (°)
Factor A
Jet location Ljet (C)
Factor B
Jet velocity Ujet (m/s)
Factor C
Level 1 -60 0.19 2.60
Level 2 -30 0.30 2.74
Level 3 0 0.45 2.89
Level 4 +30 0.60 3.25
Level 5 +60 / /
Table 2. Mesh configuration of the original hydrofoil and the jet hydrofoils.
Item Total number of cells Spanwise × Chordwise nodes Cells of each jet hole
Original hydrofoil 6,566,400 60 × 220 /
Jet hydrofoils 13,828,200 92 × 270 3,875
Table 3. The uncertainty of the time-averaged velocity.
V1 V2 V3 V4 V5
UCF 0.022 0.031 0.047 0.114 0.135
UFS 0.017 0.035 0.048 0.092 0.103
UGCI 0.035 0.042 0.056 0.089 0.122
Table 4. The mixed level orthogonal table.
Series Jet angle (°) Jet location (C) Jet velocity (m/s) ηcav ηeng
H01 -60 0.19 2.60 -37.71% -4.62%
H02 -60 0.30 2.74 -38.23% -4.85%
H03 -60 0.45 2.89 -38.34% -8.94%
H04 -60 0.60 3.25 -44.46% -9.47%
H05 -30 0.19 3.25 -47.18% -4.77%
H06 -30 0.30 2.89 -45.86% -4.27%
H07 -30 0.45 2.74 -42.94% -4.78%
H08 -30 0.60 2.60 -39.21% -18.23%
H09 0 0.19 2.89 -49.09% -3.69%
H10 0 0.30 3.25 -48.82% -2.31%
H11 0 0.45 2.60 -42.34% +1.33%
H12 0 0.60 2.74 -36.74% -17.41%
H13 +30 0.19 2.74 -47.51% -3.12%
H14 +30 0.30 2.60 -45.64% +0.35%
H15 +30 0.45 3.25 -48.38% +2.28%
H16 +30 0.60 2.89 -34.18% +1.95%
H17 +60 0.19 2.60 -48.78% -0.41%
H18 +60 0.30 2.74 -48.54% +3.27%
H19 +60 0.45 2.89 -46.12% +5.59%
H20 +60 0.60 3.25 -33.02% +3.28%
Table 5. Orthogonal analysis of cavitation suppression efficiency?ηcav.
Levels Jet angle αjet
Factor A
Jet location Ljet
Factor B
Jet velocity Ujet
Factor C
?1j -39.69% -46.05% -42.74%
?2j -43.80% -45.42% -42.79%
?3j -44.25% -43.62% -42.72%
?4j -43.93% -37.52% -44.37%
?5j -44.12% / /
Rj 4.56% 8.53% 1.65%
Table 6. Orthogonal analysis of cavitation suppression efficiency?ηeng.
Levels Jet angle αjet
Factor A
Jet location Ljet
Factor B
Jet velocity Ujet
Factor C
?1j -6.97% -3.32% -4.32%
?2j -8.01% -1.56% -5.38%
?3j -5.52% -0.90% -1.87%
?4j 0.37% -7.98% -2.20%
?5j 2.93% / /
Rj 10.95% 7.07% 3.51%
Disclaimer/Publisher’s Note: The statements, opinions and data contained in all publications are solely those of the individual author(s) and contributor(s) and not of MDPI and/or the editor(s). MDPI and/or the editor(s) disclaim responsibility for any injury to people or property resulting from any ideas, methods, instructions or products referred to in the content.
Copyright: This open access article is published under a Creative Commons CC BY 4.0 license, which permit the free download, distribution, and reuse, provided that the author and preprint are cited in any reuse.
Prerpints.org logo

Preprints.org is a free preprint server supported by MDPI in Basel, Switzerland.

Subscribe

© 2024 MDPI (Basel, Switzerland) unless otherwise stated