1. Introduction
Titanium dioxide nanoparticles (TiO
2NPs) are among the most manufactured nanomaterials in the world and are used in a wide range of cosmetics and food, as well as in the biomedical field [
1,
2]. As the use cases of TiO
2NPs expand, the exposure to the human body increases, which may result in unintended absorption. In particular, TiO
2NPs are introduced into the human body by inhalation through the respiratory tract. TiO
2NP exposure damages the lungs by altering the cell cycle of lung epithelial cells, causing pulmonary inflammation and fibrosis [
3,
4]. In addition, exposure to TiO
2NPs is the main culprit for exacerbating respiratory diseases such as asthma and pneumonia [
5,
6,
7]. Therefore, reducing the effects of TiO
2NPs on the lungs and alleviating its side effects should improve the quality of life; however, studies focusing on these issues are lacking.
Excessive immune response and reactive oxygen species (ROS) generation underlie the pulmonary toxicity of TiO
2NPs [
8,
9,
10]. ROS are cell signaling molecules necessary for normal biological processes, but excessive production of ROS can cause damage to multiple organelles, which ultimately interferes with normal cell physiology [
9,
11]. Accordingly, cells have an antioxidant system to maintain redox homeostasis. Antioxidants possess the capacity to mitigate cellular damage by eliminating ROS. They can be categorized into two groups: non-enzymatic antioxidants, including glutathione and vitamin C, and enzymatic antioxidants, such as glutathione peroxidase (GPx), glutathione reductase (GR), superoxide dismutase (SOD), and catalase [
12,
13]. Moreover, thioredoxin (Trx), which controls cytoplasmic and mitochondrial ROS, can be converted into reduced and oxidized forms by exchanging hydrogen ions, thus acting as an antioxidant, and its antioxidant activity is regulated by thioredoxin-interacting protein (TXNIP) [
14]. TXNIP functions as an important mediator in various cell signaling pathways such as apoptosis and the inflammatory response [
14], and these pathways are also key mechanisms of action of nanomaterials [
15,
16]. Therefore, TXNIP is a key protein involved in the mechanism of action of TiO2NPs. However, the underlying mechanistic basis has not yet been fully elucidated.
Pycnogenol (PYC), a natural extract of pine bark, has beneficial health functions by supporting immunity and reducing the progression of chronic obstructive pulmonary disease (COPD) [
17]. The main components of PYC are oligomeric procyanidins, flavonoids, and polyphenols, which have strong antioxidant capacity [
18,
19]. Moreover, PYC modulates apoptosis by inhibiting inflammatory responses and oxidative stress through antioxidant and free radical scavenging properties [
20,
21,
22].
In this study, we performed a comprehensive assessment of TiO2NPs-induced pulmonary toxicity. Moreover, the antioxidant and anti-inflammatory effects of PYC in pulmonary inflammation generated by TiO2NPs were examined, and the mechanism of action of PYC was explored by analyzing TXNIP and its downstream signaling.
2. Materials and Methods
2.1. Nanoparticles
TiO2NPs were obtained from Sigma-Aldrich (catalog number 637254, St. Louis, MO, USA) with a particle size smaller than 25 nm. The samples were dissolved in phosphate-buffered saline (PBS) and subjected to sonication using a VCX-130 instrument (Sonics and Materials, Newtown, CT, USA) for 3 min. The sonication parameters were set to 130 W power, 20 kHz frequency, and a pulse ratio of 59/1. This pre-treatment step was performed before analysis or experimentation.
2.2. Test Article and Experimental Procedure for In Vivo Experiments
Pycnogenol® (US patent # 4,698,360), extracted exclusively from the bark of French maritime pine, was donated by Horphag Research Ltd. (Route de Belis, France). Female BALB/c mice, aged six weeks, that were free from specific pathogens were procured from Samtako (Osan, Korea). These mice were then subjected to a quarantine period and allowed to acclimate for 7 days. Animal experiments were conducted in accordance with the National Institute Health Guidelines for the Care and Use of Laboratory Animals. The experimental protocols involving animals (CNU IACUC-YB-2021-92) were approved by the Institutional Animal Care and Use Committee of Chonnam National University.
The mice were allocated into five groups using randomization, with each group consisting of six animals. These groups were identified as vehicle control (VC), TiO2NPs (in which only TiO2NPs were administered), dexamethasone (DEX) (in which TiO2NPs were administered with a 1 mg/kg dose of DEX), PYC 10 (in which TiO2NPs were administered with a 10 mg/kg dose of PYC, sourced from Horphag Research in Le Sen, France), and PYC 20 (in which TiO2NPs were administered with a 20 mg/kg dose of PYC). DEX and PYC were solubilized in PBS and afterward fed to the mice via oral route for 2 weeks. Intranasal administration of TiO2NPs was performed on mice on days 1, 7, and 13. The dosage used was 20 mg/kg in 50 µL of PBS, and the mice were under light anesthesia induced by Zoletil 50. The VC group received an intranasal instillation of 50 μL of PBS.
2.3. Collection of Bronchoalveolar Lavage Fluid (BALF) and Cell Counting
The mice were euthanized 48 h following the final instillation by an intraperitoneal dose of Zoletil 50. A tracheostomy was also performed: the lungs were subjected to a tracheal cannula through which 0.7 mL of cold PBS was administered and afterward withdrawn to collect BALF. This procedure was performed twice. The inflammatory cells present in BALF were evaluated as described by Lim et al. [
16].
2.4. Cytokine Assays
The concentrations of cytokines, including tumor necrosis factor-α (TNF-α), IL (interleukin)-1β, and IL-6, in BALF were quantified using ELISA kits obtained from BD Biosciences (San Jose, CA, USA). The manufacturer's instructions were followed during the experimental procedure. Absorbance was measured using an ELISA reader (Bio-Rad Laboratories, Hercules, CA, USA).
2.5. Histopathology and Immunohistochemistry (IHC)
Lung tissue was treated with 4% (v/v) paraformaldehyde for 48 h. The tissues underwent paraffin embedding, followed by sectioning at a thickness of 4 μm. Airway inflammation and mucus production were assessed using H&E staining (Sigma-Aldrich, St. Louis, MO, USA) and PAS solution (IMEB, San Marcos, CA, USA), respectively. Using a light microscope, each slide was manually assessed by histopathologists blinded to the treatment groups as previously described [
23,
24]. The tissues were also prepared for IHC as described by Lim et al. [
25]. Protein expression was determined using anti-TXNIP (diluted at 1:200; Novus Biologicals, Littleton, CO, USA) and anti-cleaved-caspase 3 (Cas3; diluted at 1:200; Cell signaling, Danvers, MA, USA) antibodies. An image analyzer (IMT i-Solution Software, Vancouver, BC, Canada) was used to quantitatively assess airway inflammation, mucus production, and protein expression.
2.6. Western Blot Analysis
To measure the level of protein expression, we conducted immunoblotting as described by Shin et al. [
26]. The primary antibodies include anti-TXNIP (Novus Biologicals), anti-β-actin (β-act; Cell Signaling), and anti-cleaved-caspase 3 (Cas3; Cell Signaling). The densitometric analysis of expression was conducted using the Chemi-Doc system (Bio-Rad Laboratories, CA, USA).
2.7. Malondialdehyde (MDA) and Glutathione Assays
MDA levels, which serve as an indicator of oxidative stress in cellular and tissue environments, were determined in lung tissue samples using a TBARS assay kit (Cayman Chemical, Ann Arbor, USA) following the manufacturer's instructions. The levels of reduced and oxidized glutathione in lung tissue were quantified using a glutathione assay kit (Cayman Chemical, Ann Arbor, USA) by an enzymatic recycling method. Absorbance was determined using an ELISA reader (Bio-Rad Laboratories).
2.8. Cell Culture
The NCI-H292 human airway epithelial cell line was acquired from the ATCC (Manassas, VA, USA). The cells were grown in RPMI 1640 medium (WELGENE, Gyeongsan, Republic of Korea) supplemented with 10% FBS and antibiotics. The incubation was carried out in a humidified space at 37 °C with 5% CO2. The cells underwent a period of serum starvation for 1 h before use.
2.9. Cell Viability Assay
Cell viability was assessed using the EZ-Cytox cell viability assay kit (DAELIL Lab, Seoul, Korea). NCI-H292 cells were distributed into 96-well plates at a density of 4 × 10⁴ cells per well. Following a 24-hour period, fresh medium was introduced along with different concentrations of PYC (5, 10, 20, 40, and 80 µg/mL), and the culture plates were incubated for a further 24 h. Subsequently, live cells were identified by adding 10 µL of the kit solution to each well and incubating for 4 h. The absorbance at 450 nm was determined using an ELISA reader (Bio-Rad Laboratories).
2.10. RNA Extraction and qRT-PCR
RNA extraction was performed using the HiGene Total RNA Prep Kit (Biofact, Daejeon, Republic of Korea) and reverse transcription of the extracted RNA into cDNA using a cDNA kit (Qiagen, Hilden, Germany). To measure the mRNA expression levels of proinflammatory cytokines, qRT-PCR was performed as described by Lim et al. [
16]. Specific primers used in qRT-PCR experiments were listed in
Table 1. A Real-Time PCR Detection System (Bio-Rad Laboratories) was used for quantitative analysis.
2.11. Double-Immunofluorescence and Confocal Microscope
Double-immunofluorescence was performed as described by Kim et al. [
27]. The primary antibodies used were anti-TXNIP (diluted 1:200; Novus Biologicals) and anti-cleaved-Cas3 (diluted 1:200; Cell Signaling). Fluorescence images were acquired using a confocal microscope (Leica Microsystems).
2.12. Statistical Analysis
The data are presented as the mean value accompanied by the standard deviation (SD). The statistical significance of the data was assessed by using analysis of variance, followed by Dunnett’s test for multiple comparisons. Statistical significance was attributed to p-values that were less than 0.05.
4. Discussion
TiO
2NPs are being used more frequently in a diverse range of industrial applications. Recently, exposure to TiO
2NPs has been shown to induce oxidative stress and an inflammatory response in the respiratory tract [
10,
28]. Nevertheless, the toxic effects and underlying mechanisms of TiO
2NP toxicity have not yet been completely elucidated. This study was performed to characterize the toxic effects of TiO
2NPs in mouse lungs and human airway epithelial cells. Moreover, the antioxidant and anti-inflammatory effects of PYC in TiO
2NP-induced pulmonary inflammation were investigated, and the mechanism of action of PYC was explored by analyzing TXNIP expression and its downstream signaling. TiO
2NP exposure significantly increased inflammatory mediators, ROS, and mucus production in the lungs of mice, accompanied by an activation of TXNIP expression and apoptotic signaling. However, PYC treatment alleviated TiO
2NP-induced pulmonary toxicity by suppressing the expression of TXNIP, and these protective effects of PYC were confirmed
in vitro.
Inflammation is a protective response of the host to harmful substances, and it is an essential program for removing harmful foreign substances, repairing damaged tissues, and maintaining homeostasis. However, when this process is disturbed by an excessive inflammatory response, the tissue is damaged [
29]. Moreover, as alveolar macrophages fail to eliminate invading pathogens and foreign substances, cytokines and chemokines are released to attract neutrophils [
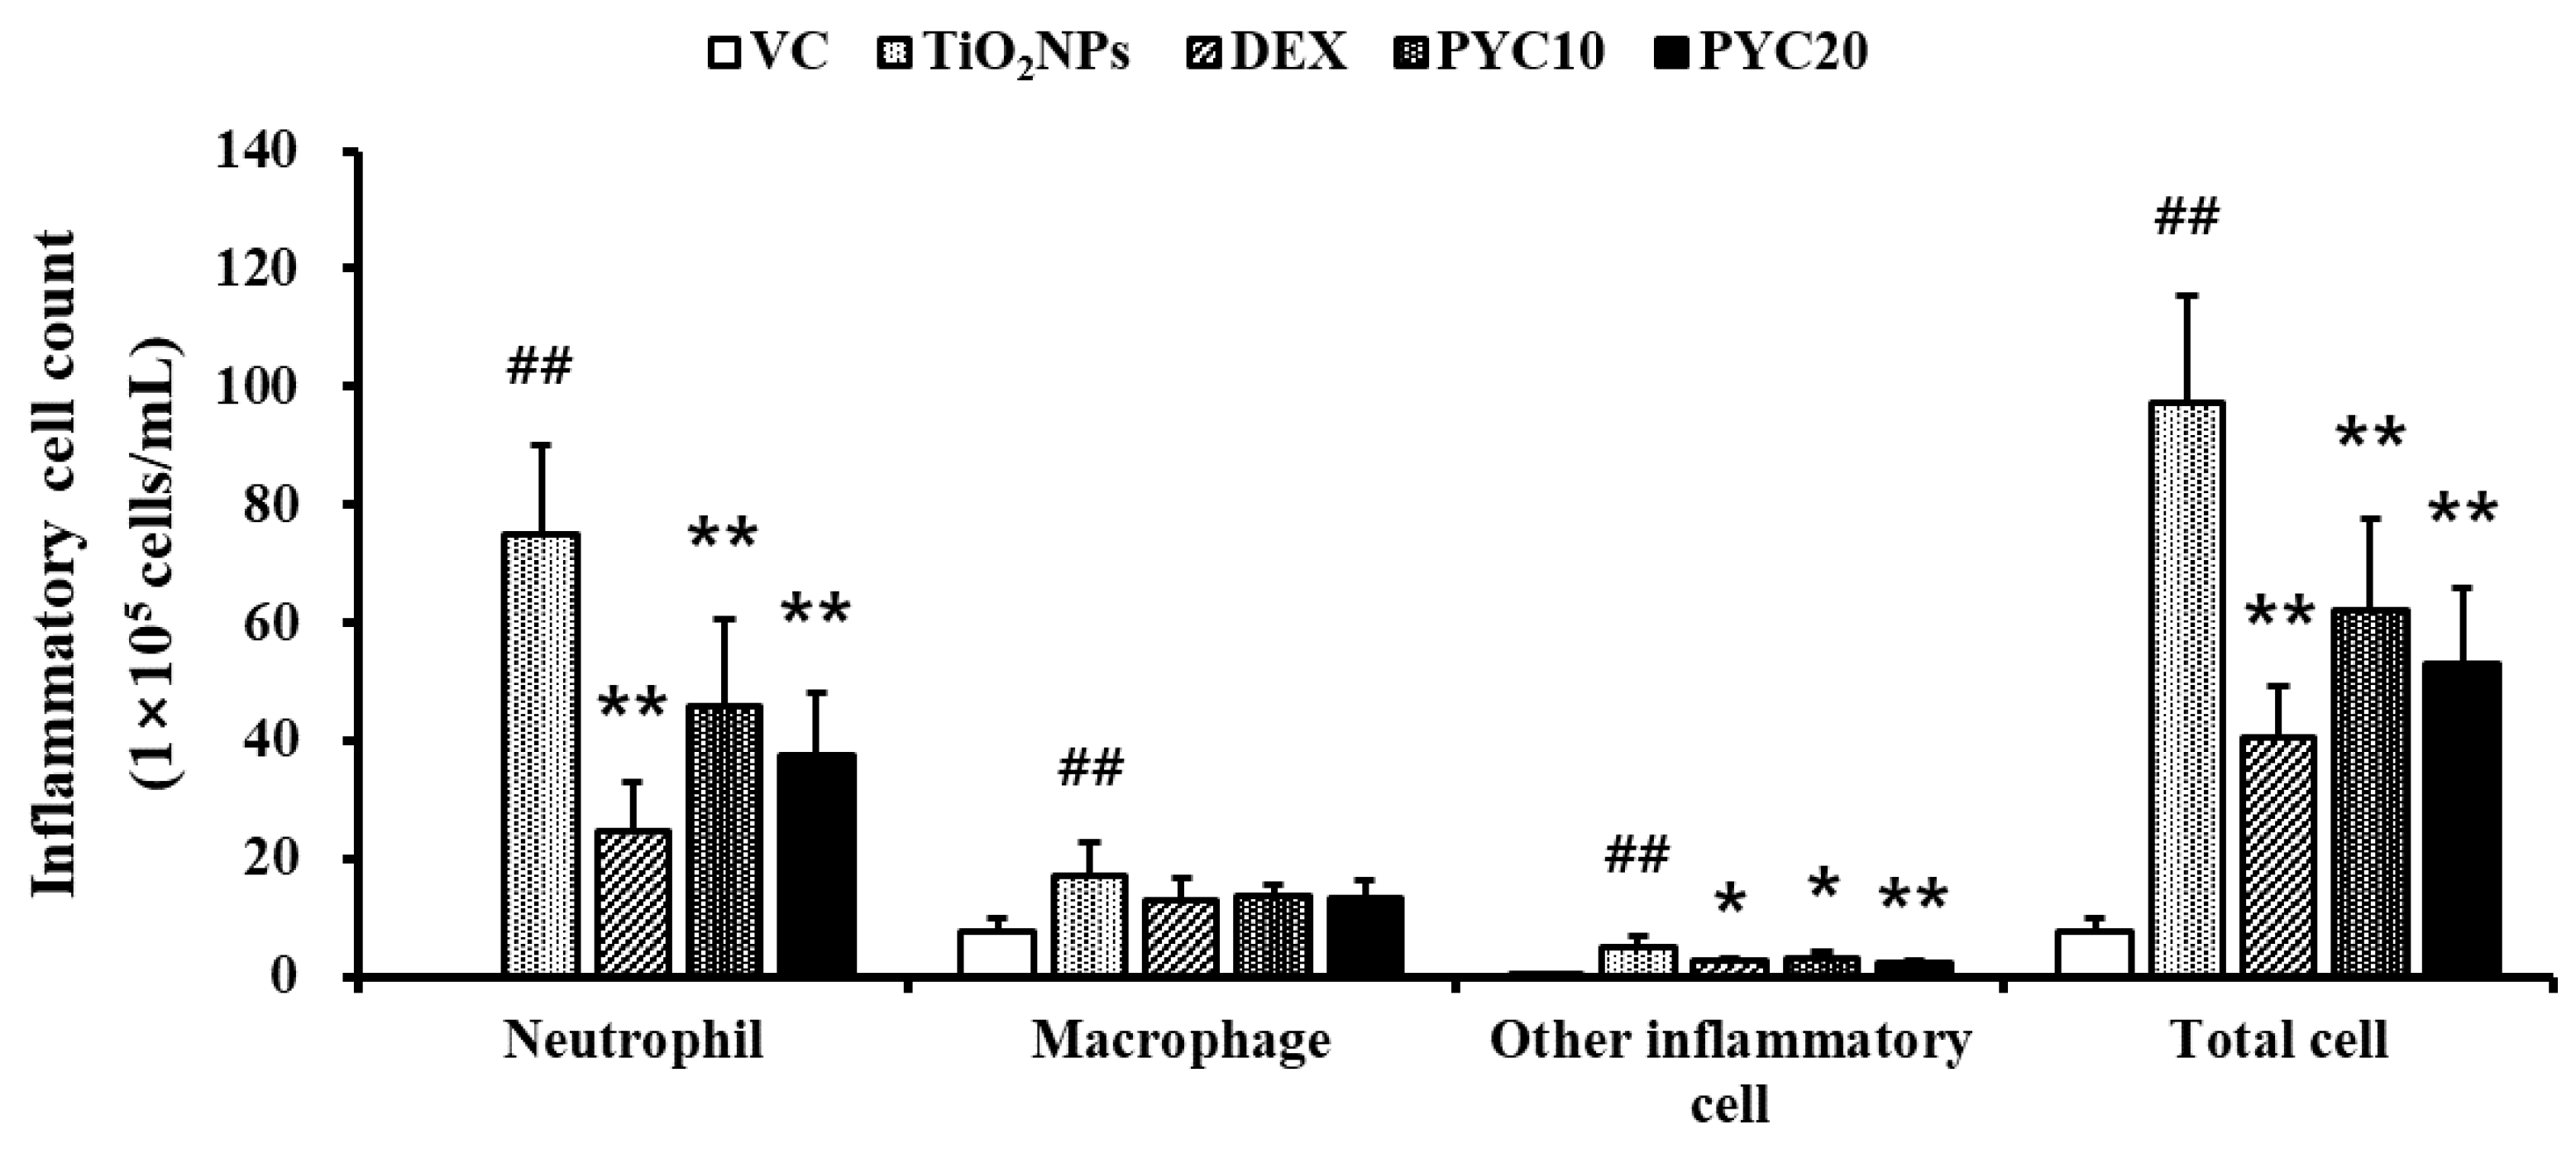
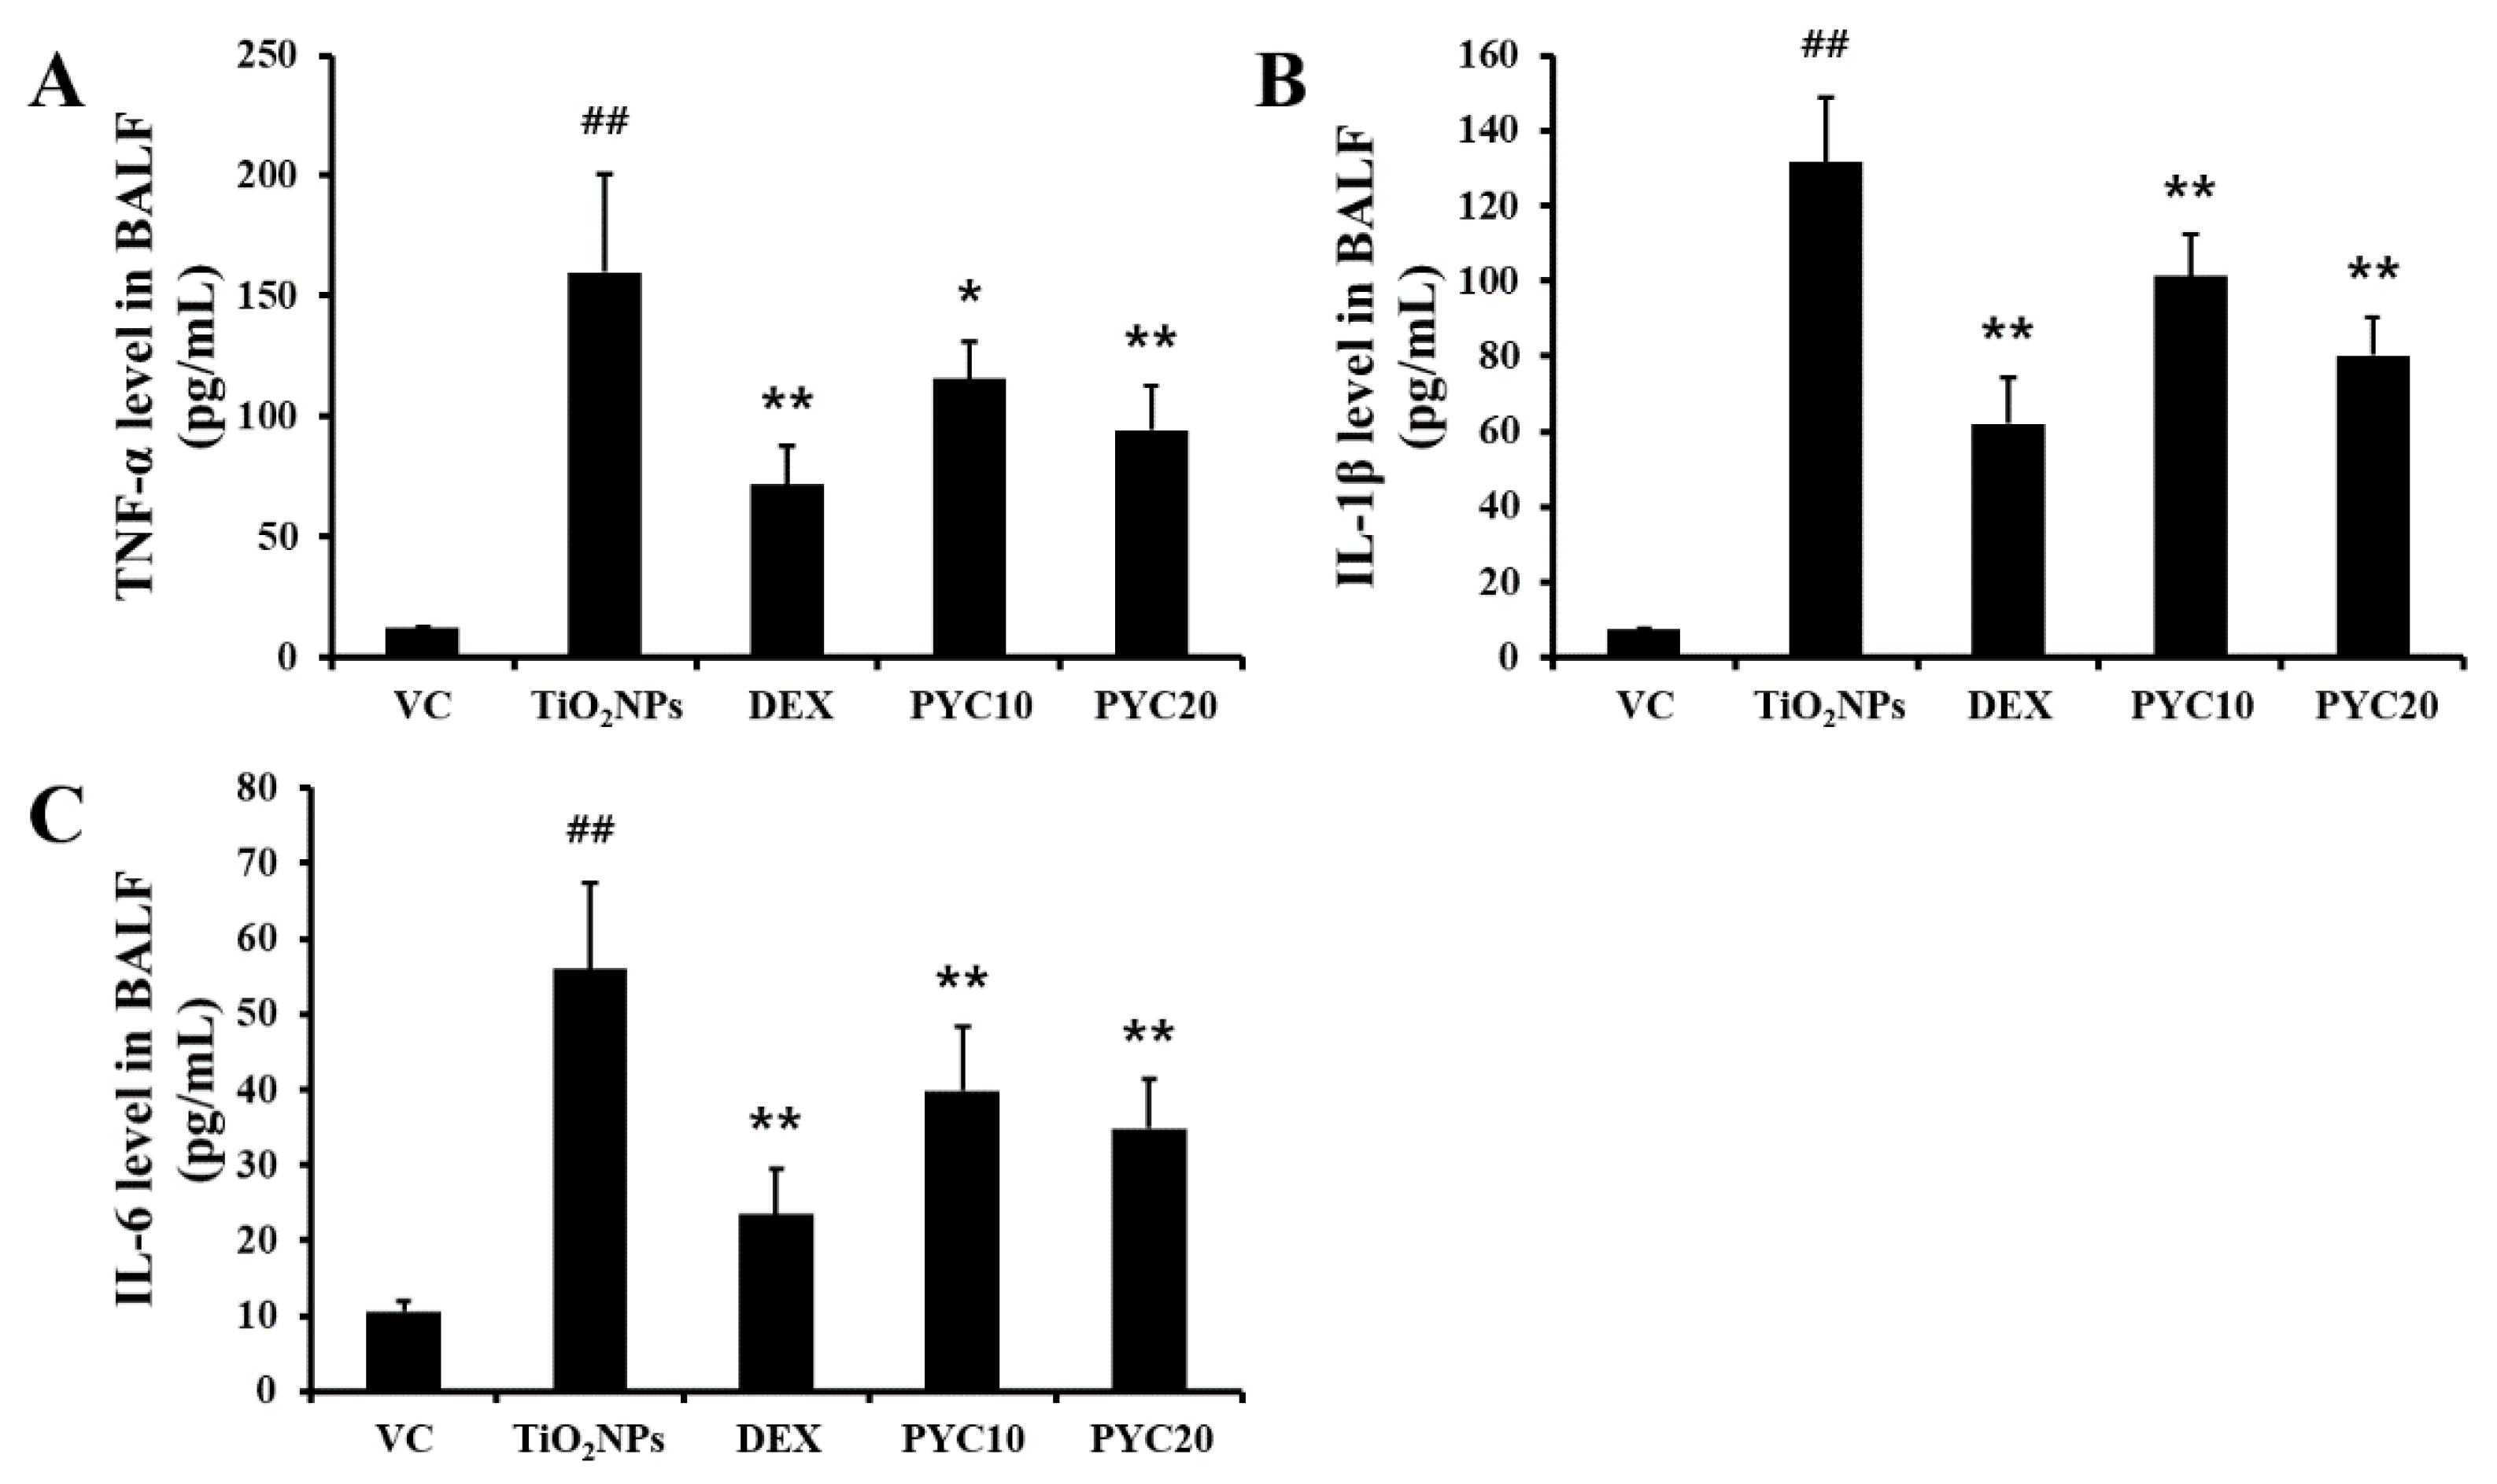
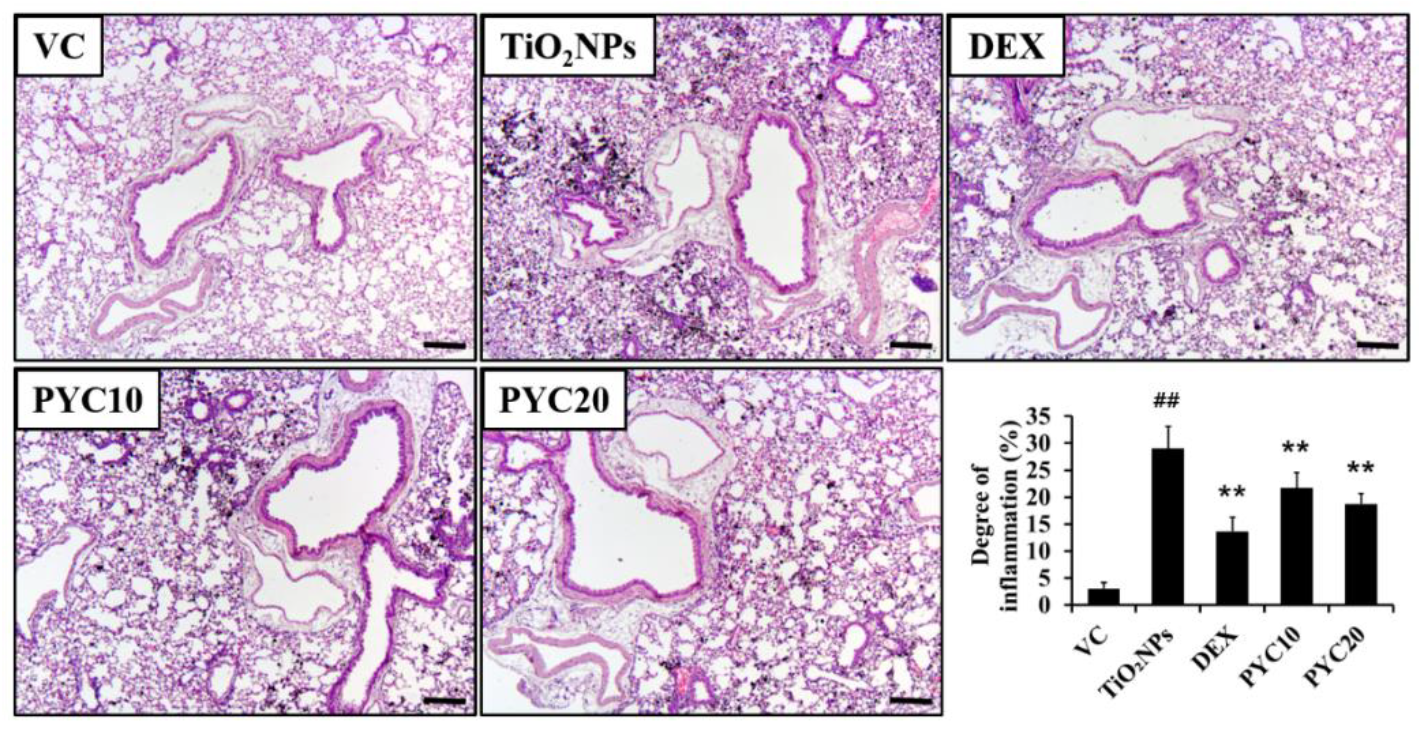
30]. In this study, proinflammatory cytokine levels increased owing to immune system activation by TiO
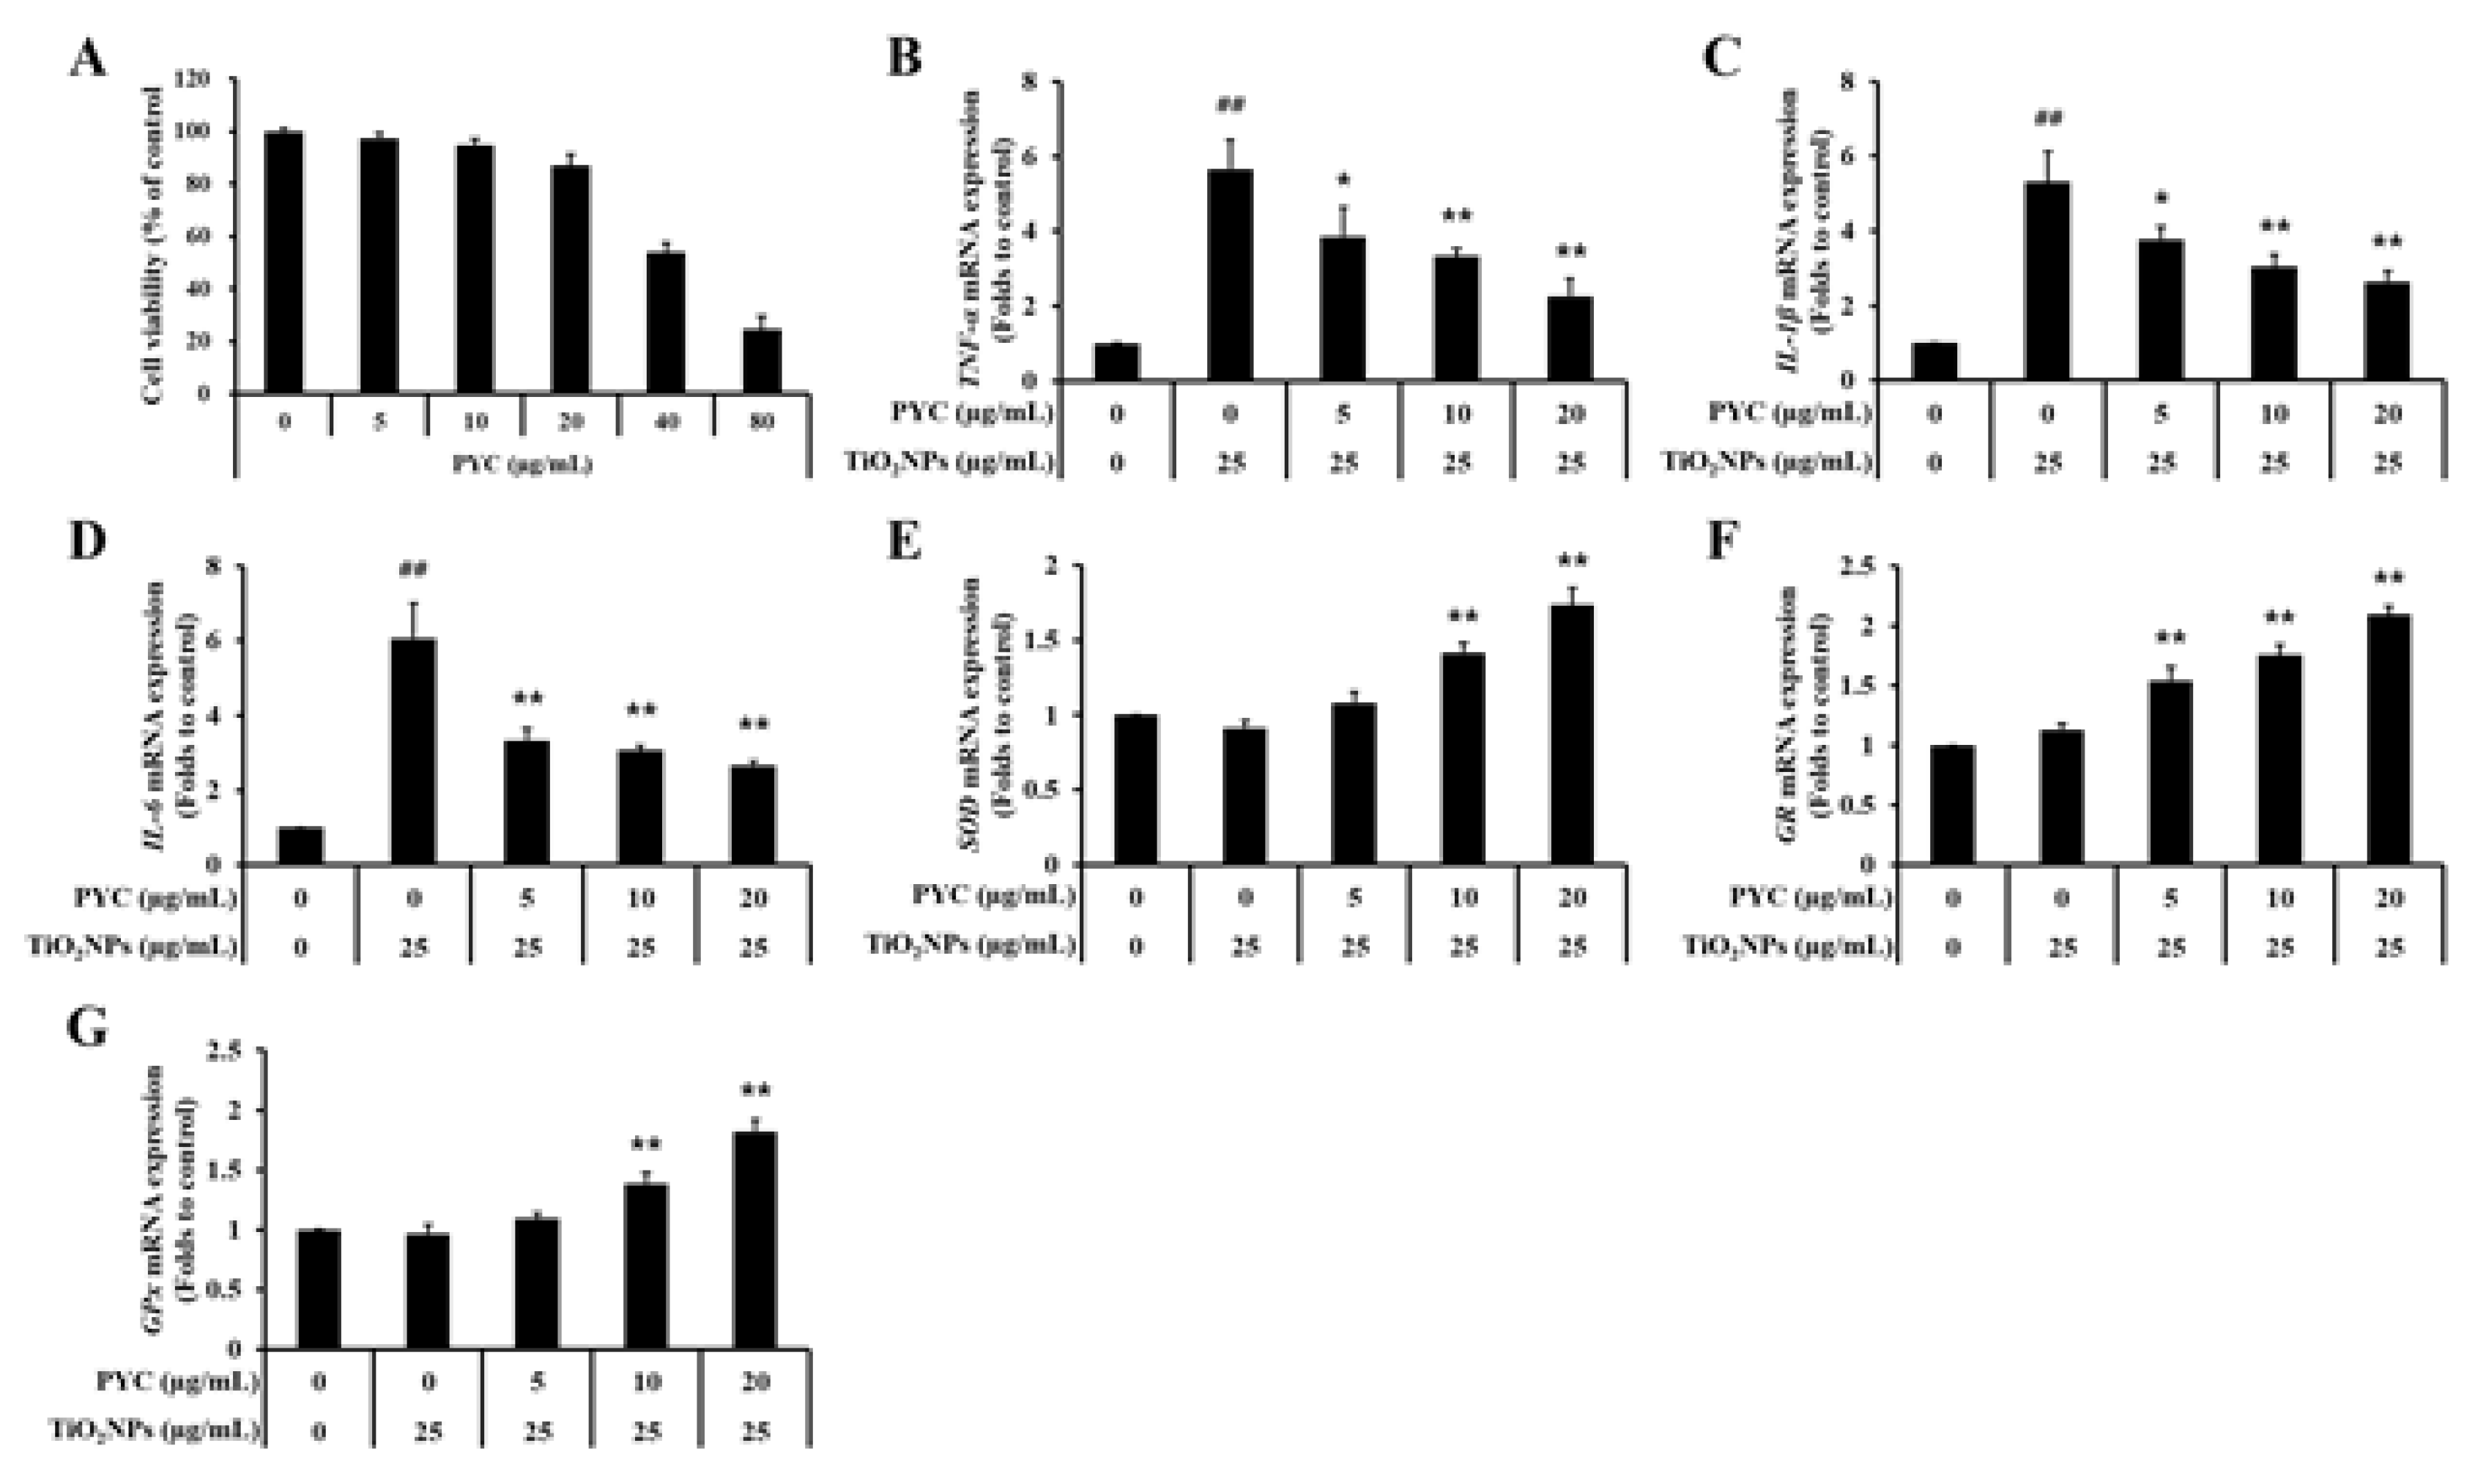
2NPs being recognized as a foreign substance, and the migration and accumulation of inflammatory cells increased, resulting in lung injury. However, these lung injury-related indicators were lowered in the lungs of PYC-treated mice, and PYC reduced the levels of the proinflammatory cytokines IL-1β, IL-6, and TNF-α in TiO
2NP-exposed human bronchial epithelial cells. According to recent articles [
17,
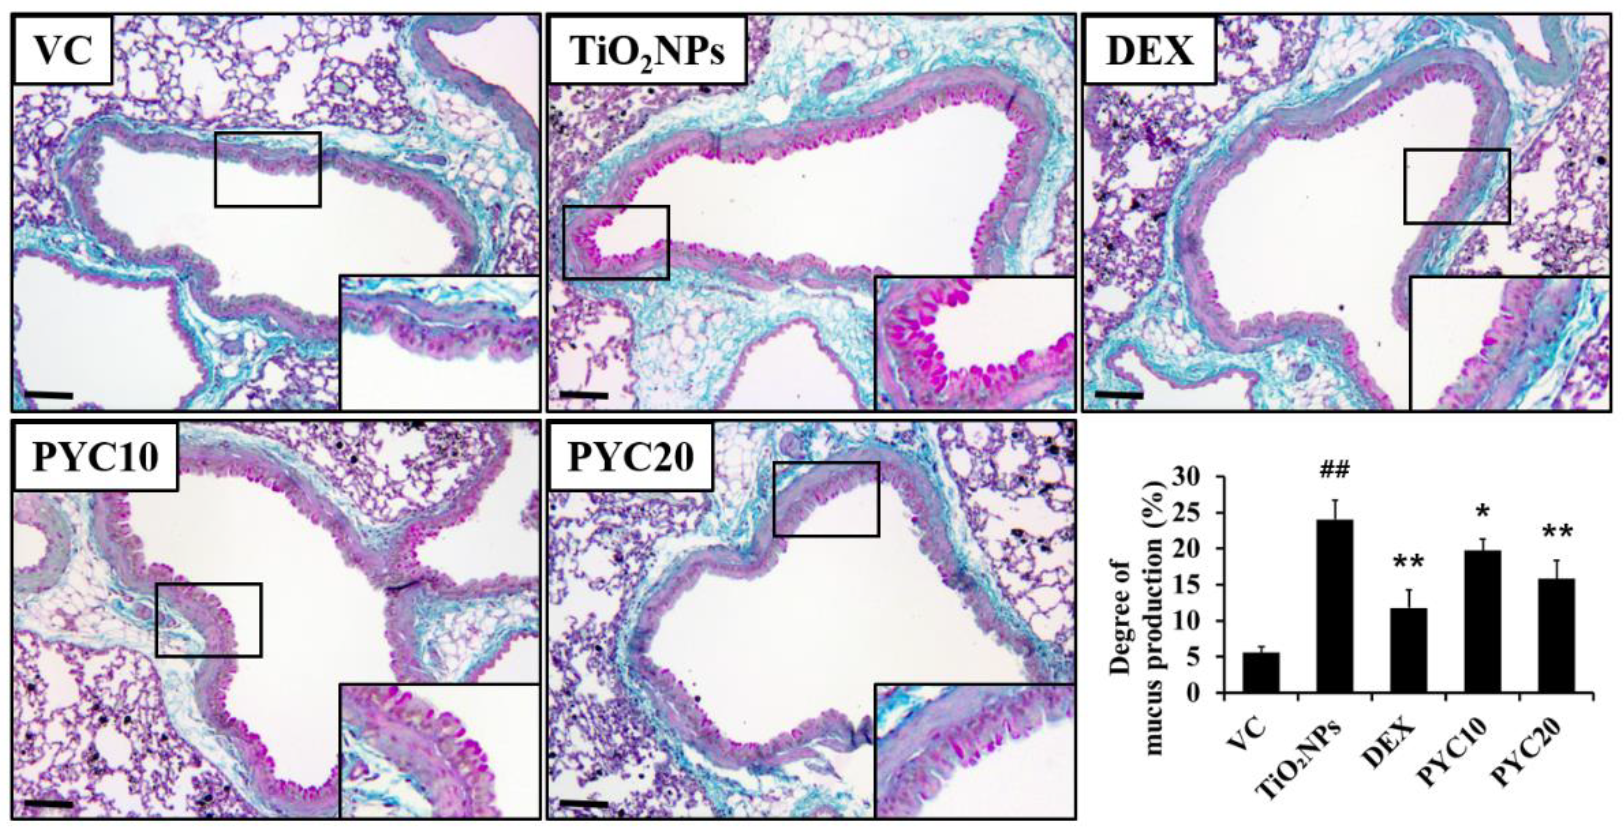
31], PYC exerts an anti-inflammatory effect by reducing the release of TNF-α, IL-6, and IL-1β and inhibiting inflammatory cell infiltration, and these effects ameliorate the lung dysfunction caused by COPD. Furthermore, PYC has an inhibitory effect on mucus production by reducing the expression of mucin 5AC mRNA [
17]. Taken together, our results suggest that the anti-inflammatory effects of PYC can prevent lung damage from TiO
2NP exposure.
When a cell is subjected to excessive stress, it generates large amounts of ROS, which have a strong chemical affinity to other substances in the body, attacking the membrane of cells or organs, thereby impairing cellular functions and leading to cell death. In normal conditions, ROS are maintained at low levels, but when they are increased by external stress, oxidative stress and apoptosis occur [
32,
33]. Inflammation and ROS are importantly intertwined in cellular physiological processes. TNF-α and IL-1β increase ROS generation and cause mitochondrial dysfunction, resulting in redox imbalance [
9,
34]. In this study, TiO
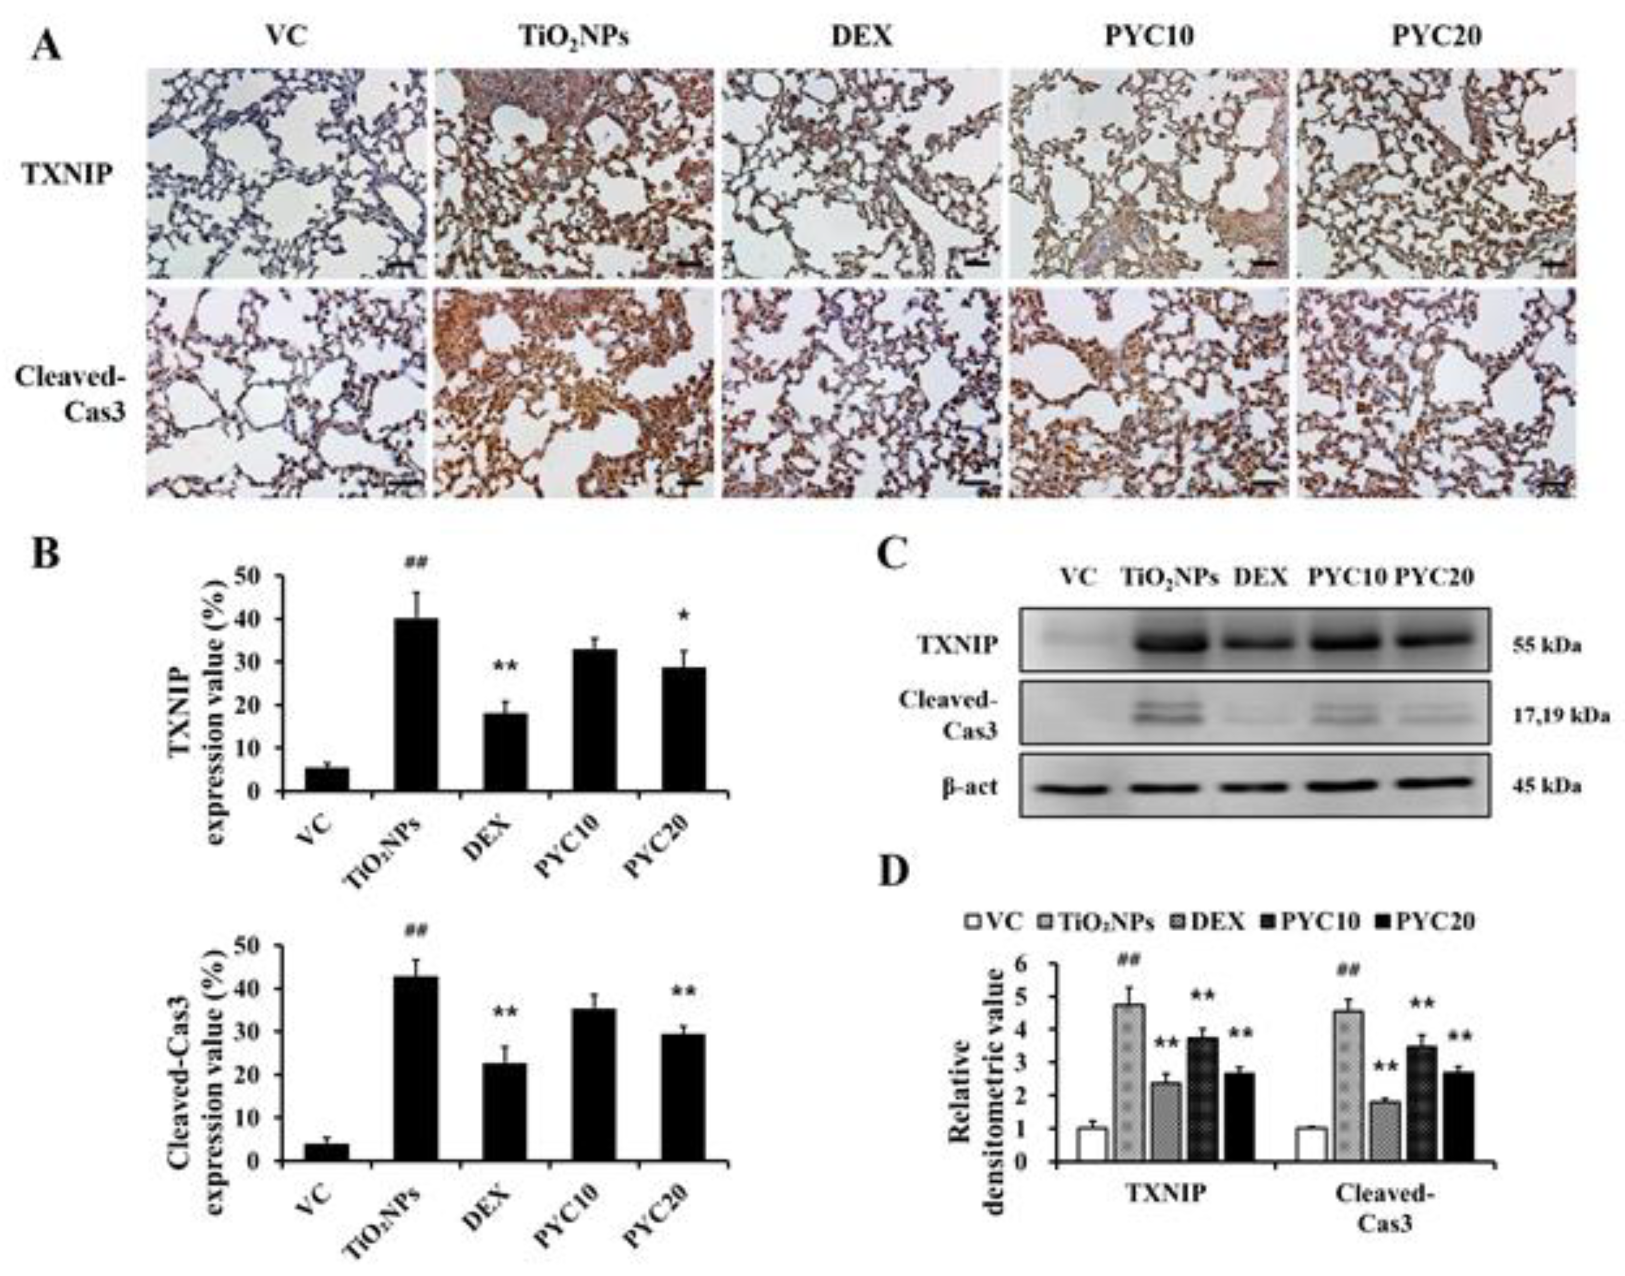
2NP exposure increased MDA levels and cleaved-Cas3 expression and decreased glutathione levels in the lungs of mice. Moreover, TXNIP expression increased in mice exposed to TiO
2NPs. In a recent study, TiO
2NP exposure was shown to elevate the expression of cleaved-Cas3 and Bax by increasing the expression of TXNIP, which regulates the Trx antioxidant system, and the downregulation of TXNIP reduces pulmonary toxicity and apoptosis induced by TiO
2NPs [
16]. Furthermore, our results showed that PYC treatment suppressed TiO
2NP adverse effects, such as increased expression of TXNIP, cleaved-Cas3, and MDA, and restored glutathione to normal levels. In TiO
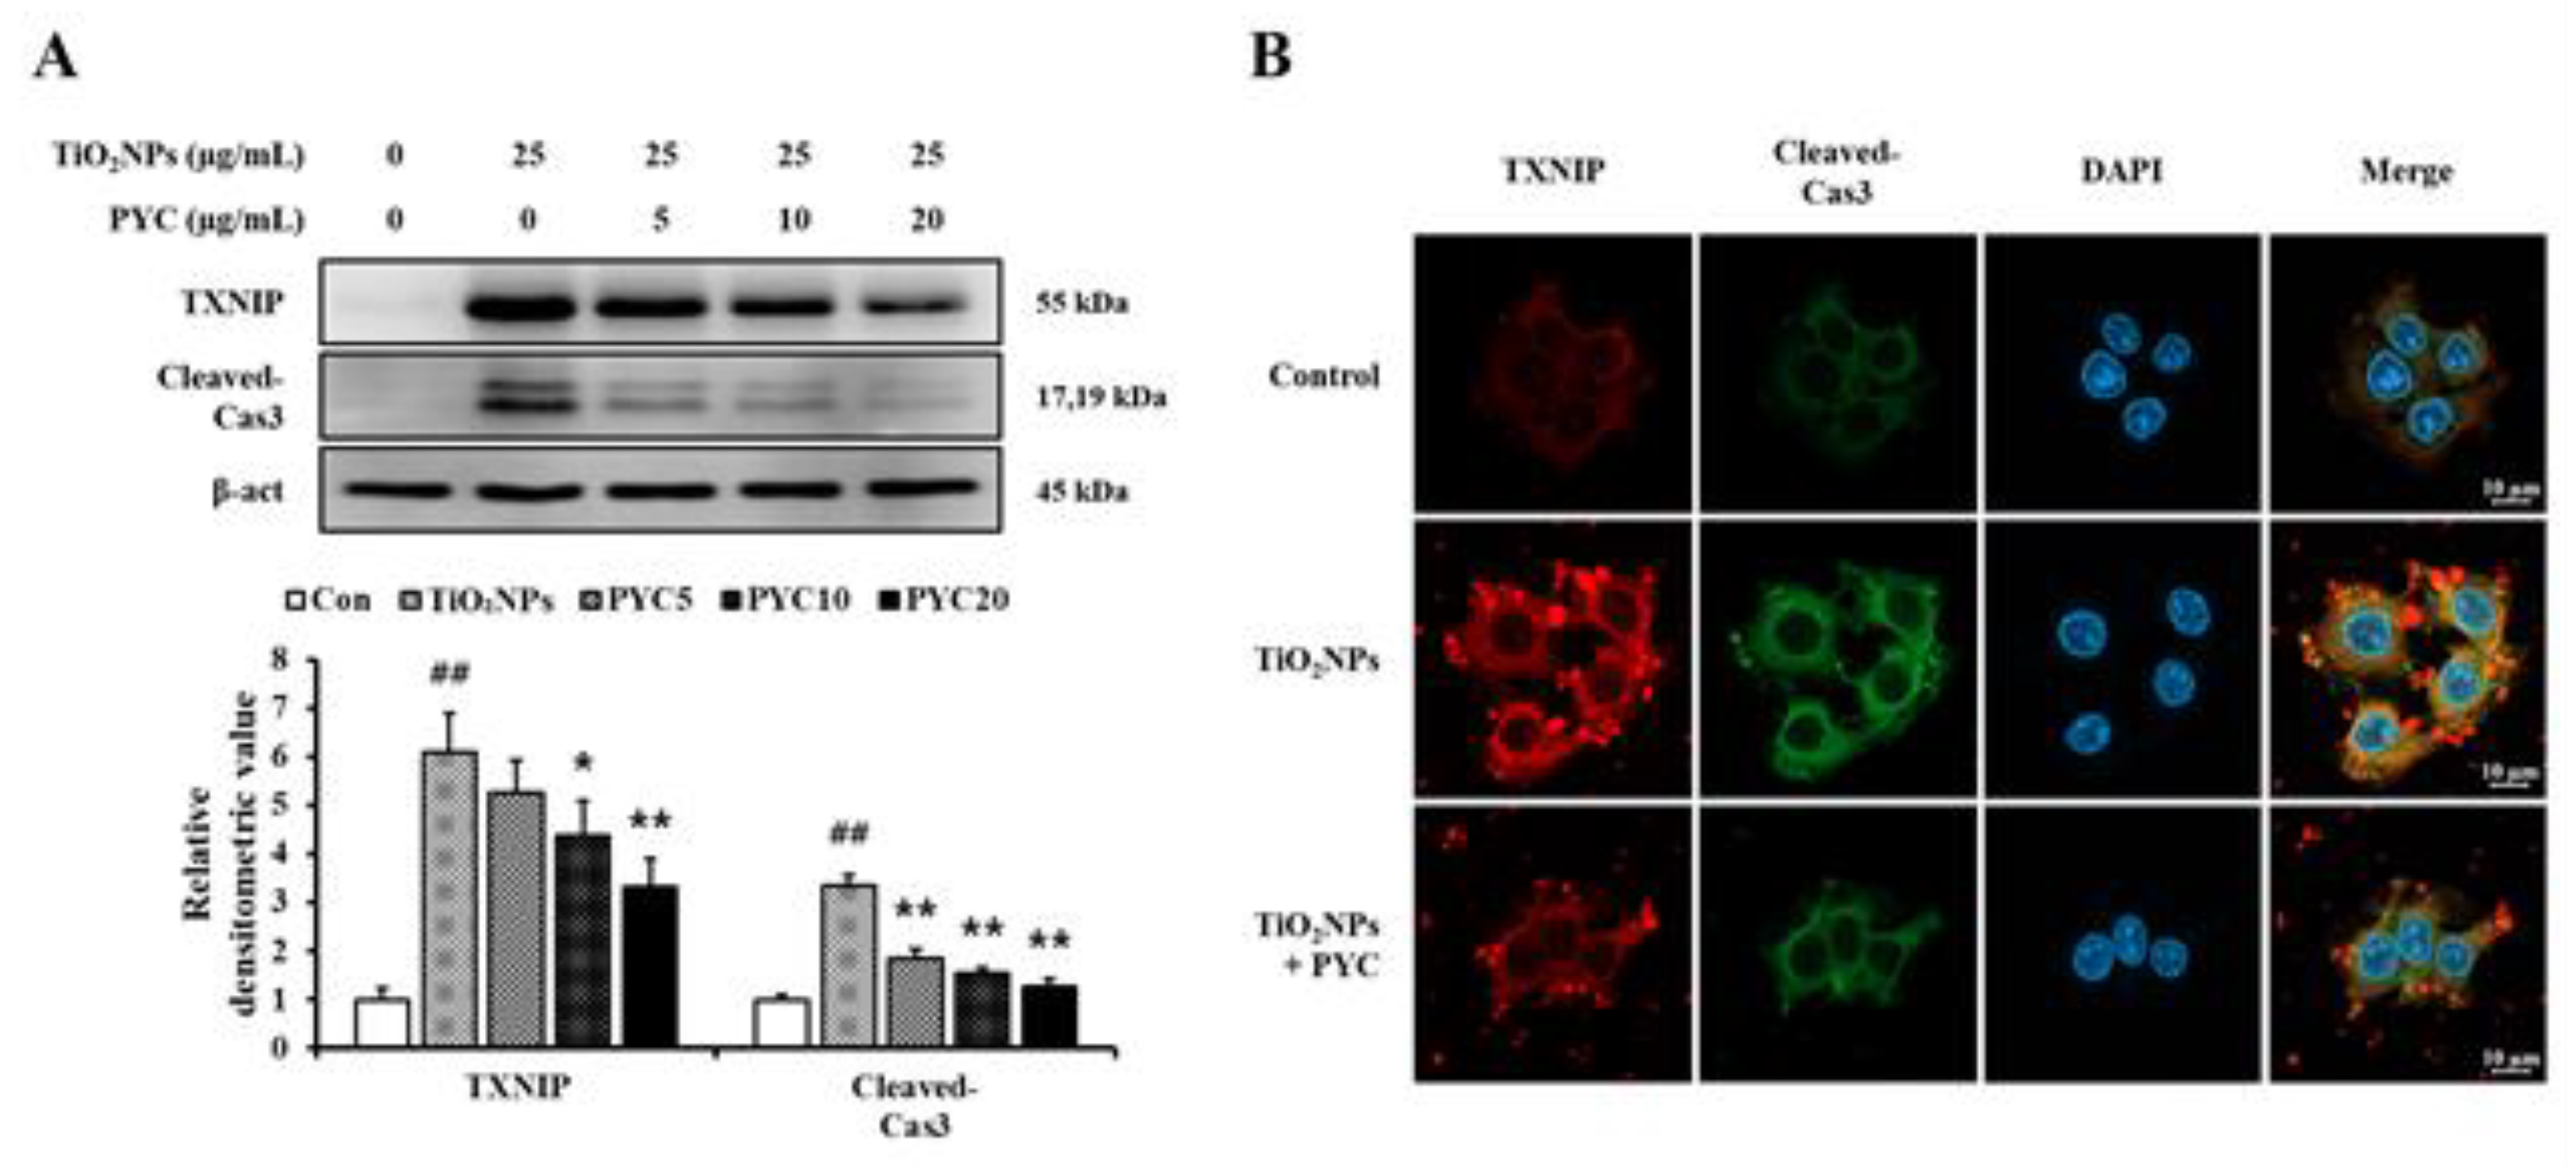
2NP-exposed cells, PYC treatment increased the expression of antioxidant enzymes and decreased the expression of TXNIP. PYC contains polyphenols and functions as a free radical scavenger, and the free radical scavenger N-acetyl cysteine and the antioxidant polyphenols inhibit TXNIP activity [
19,
35]. Taken together, these findings suggest that PYC is involved in TXNIP regulation and inhibits TXNIP-ROS-apoptotic signaling activated by TiO
2NPs.
Author Contributions
Conceptualization, C.M., I.-S.S. and J.-C.K.; methodology, J.-O.L., C.M., I.-S.S. and J.-C.K.; validation, W.-I.K., S.-W.P. and S.-J.L.; formal analysis, W.-I.K., S.-W.P. and S.-J.L.; investigation, J.-O.L.; resources, I.-S.S. and J.-C.K.; writing—original draft preparation, J.-O.L.; writing—review and editing, J.-C.K.; visualization, W.-I.K.; supervision, S.-H.K and J.-C.K.; funding acquisition, S.-H.K and J.-C.K. All authors have read and agreed to the published version of the manuscript.
Figure 1.
Effects of pycnogenol treatment on inflammatory cell counts in the BALF. VC, PBS intranasal instillation; TiO2NP, TiO2NP intranasal instillation; DEX, TiO2NP intranasal instillation + dexamethasone administration (1 mg/kg); PYC10 and 20, TiO2NP intranasal instillation + pycnogenol administration (10 and 20 mg/kg, respectively). Data are represented as means ± SD, n = 6. ## Statistical significance from the VC group, P < 0.01; *, ** Statistical significance from the TiO2NP group, P < 0.05 and < 0.01, respectively.
Figure 2.
Effects of pycnogenol treatment on proinflammatory cytokines levels in the BLAF. (A) TNF-α. (B) IL-1β. (C) IL-6. VC, PBS intranasal instillation; TiO2NP, TiO2NP intranasal instillation; DEX, TiO2NP intranasal instillation + dexamethasone administration (1 mg/kg); PYC10 and 20, TiO2NP intranasal instillation + pycnogenol administration (10 and 20 mg/kg, respectively). Data are represented as means ± SD, n = 6. ## Statistical significance from the VC group, P < 0.01; *, ** Statistical significance from the TiO2NP group, P < 0.05 and < 0.01, respectively.
Figure 3.
Effects of pycnogenol treatment on inflammatory responses in the lungs. Lung tissue is stained with H&E stain (×100). VC, PBS intranasal instillation; TiO2NP, TiO2NP intranasal instillation; DEX, TiO2NP intranasal instillation + dexamethasone administration (1 mg/kg); PYC10 and 20, TiO2NP intranasal instillation + pycnogenol administration (10 and 20 mg/kg, respectively). Data are represented as means ± SD, n = 6. ## Statistical significance from the VC group, P < 0.01; ** Statistical significance from the TiO2NP group, P < 0.01. Bar = 100 μm.
Figure 4.
Effects of pycnogenol treatment on mucus production in the lungs. Lung tissue is stained with PAS stain (×200). VC, PBS intranasal instillation; TiO2NP, TiO2NP intranasal instillation; DEX, TiO2NP intranasal instillation + dexamethasone administration (1 mg/kg); PYC10 and 20, TiO2NP intranasal instillation + pycnogenol administration (10 and 20 mg/kg, respectively). Data are represented as means ± SD, n = 6. ## Statistical significance from the VC group, P < 0.01, respectively; *, ** Statistical significance from the TiO2NP group, P < 0.05 and < 0.01, respectively. Bar = 50 μm.
Figure 5.
Effects of pycnogenol treatment on levels of MDA and glutathione in TiO2NPs-exposed mice. (A) MDA level in the lungs. (B) Glutathione level in the lungs. VC, PBS intranasal instillation; TiO2NP, TiO2NP intranasal instillation; DEX, TiO2NP intranasal instillation + dexamethasone administration (1 mg/kg); PYC10 and 20, TiO2NP intranasal instillation + pycnogenol administration (10 and 20 mg/kg, respectively). Data are represented as means ± SD, n = 6. ## Statistical significance from the VC group, P < 0.01; *, ** Statistical significance from the TiO2NP group, P < 0.05 and < 0.01, respectively.
Figure 6.
Effects of pycnogenol treatment on the expression of TXNIP and cleaved-Cas3 in TiO2NPs-exposed mice. (A) Expression of TXNIP and cleaved-Cas3 (×400, alveolar). (B) Quantitation of TXNIP- and cleaved-Cas3-positive cell. (C) Western blotting. (D) Relative densitometric values. VC, PBS intranasal instillation; TiO2NP, TiO2NP intranasal instillation; DEX, TiO2NP intranasal instillation + dexamethasone administration (1 mg/kg); PYC10 and 20, TiO2NP intranasal instillation + pycnogenol administration (10 and 20 mg/kg, respectively). Data are represented as means ± SD, n = 6. ## Statistical significance from the VC group, P < 0.01; *, ** Statistical significance from the TiO2NP group, P < 0.05 and < 0.01, respectively. Bar = 25 μm.
Figure 7.
Effects of pycnogenol treatment on mRNA expression of proinflammatory cytokines and antioxidant enzymes in TiO2NPs-induced NCI–H292 cells. (A) Cell viability. (B) TNF-α. (C) IL-1β. (D) IL-6. (E) SOD. (F) GR. (G) GPx. Data are represented as means ± SD, n = 3. ## Statistical significance from non-induced NCI-H292 cells, P < 0.01; *, ** Statistical significance from TiO2NPs-induced NCI-H292 cells, P < 0.05 and < 0.01, respectively.
Figure 8.
Effects of pycnogenol treatment on the expression of TXNIP and cleaved-Cas3 in TiO2NPs-induced NCI–H292 cells. (A) Western blotting. (B) Double-immunofluorescence staining. Bar = 10 μm. Data are represented as means ± SD, n = 3. ## Statistical significance from non-induced NCI-H292 cells, P < 0.01; *, ** Statistical significance from TiO2NPs-induced NCI-H292 cells, P < 0.05 and < 0.01, respectively.
Table 1.
Primer sequences for qRT-PCR.
Table 1.
Primer sequences for qRT-PCR.
| Target genes |
|
Sequence (5’ → 3’) |
Tm°C |
| TNF-α |
Forward |
CAA AGT AGA CCT GCC CAG AC |
59.3 |
| |
Reverse |
GAC CTC TCT CTA ATC AGC CC |
59.3 |
| IL-6 |
Forward |
ATG CAA TAA CCA CCC CTG AC |
57.3 |
| |
Reverse |
ATC TGA GGT GCC CAT GCT AC |
59.3 |
| IL-1β |
Forward |
AGC CAG GAC AGT CAG CTC TC |
61.4 |
| |
Reverse |
ACT TCT TGC CCC CTT TGA AT |
55.2 |
| GR |
Forward |
TTC CAG AAT ACC AAC GTC AAA GG |
58.8 |
| |
Reverse |
GTT TTC GGC CAG CAG CTA TTG |
59.8 |
| SOD |
Forward |
GGT GGG CCA AAG GAT GAA GAG |
61.7 |
| |
Reverse |
CCA CAA GCC AAA CGA CTT CC |
59.3 |
| GPx |
Forward |
CAG TCG GTG TAT GCC TTC TCG |
61.7 |
| |
Reverse |
GAG GGA CGC CAC ATT CTC G |
60.9 |
| GAPDH |
Forward |
CAA AAG GGT CAT CAT CTC TG |
55.2 |
| |
Reverse |
CCT GCT TCA CCA CCT TCT TG |
59.3 |
