1. Introduction
Patient experiences have emerged as a critical metric for assessing patient-centeredness and overall healthcare quality.[
1] Patient-centered care emphasizes the relationship between healthcare providers, patients (including their families and caregivers), and their collaborative journey throughout the healthcare process.[
2] This approach prioritizes patient involvement in treatment decisions and broader healthcare planning, fostering a sense of shared responsibility.[
3,
4]
The concept of patient experience encompasses the feelings and perceptions of patients, their families, and anyone involved in their care, regarding the care process, structure, and outcomes.[
4] A growing consensus acknowledges that integrating patient perspectives is vital to achieving high-quality care.[
5] Effective management of the patient journey, a crucial cross-functional healthcare process, ensures patient safety, efficiency, and optimal resource utilization. Conversely, poor flow can decrease productivity, increase safety risks, and diminish perceived quality [
6,
7]. Importantly, patient experience, a core quality aspect, focuses on valued aspects of care delivery like timely appointments, clear communication, and information access. Even with medical advancements, the patient's experience remains central to effective clinical services.[
8,
9]
While often interchangeably, "patient satisfaction" and "patient experience" represent distinct concepts. Patient satisfaction is directly linked to clinical outcomes, while patient experience encompasses a patient's interaction with a healthcare facility [
10]. Measuring this experience, however, remains complex due to the lack of a universal definition. Although "patient satisfaction" and "perceptions" are frequently substituted, patient experiences are considered less subjective. Factors like demographics, socioeconomic status, ethnicity, self-reported health, and care unit characteristics demonstrably influence these experiences [
11,
12].
Quality serves as a crucial factor in differentiation among private hospitals, given their provision of similar services [
13]. In the healthcare market, quality encompasses various significant dimensions for patients, including structural quality, clinical quality, proximity to home, and waiting times [
13,
14]. Additionally, although it may introduce some bias, customer satisfaction must be considered when analyzing a patient's choice, as the patient is the only participant in the healthcare process who experiences the entire journey [
6,
15].
Several validated instruments assess patient experience, including SERVQUAL, CAHPS®, and the Picker Patient Experience (PPE) Questionnaire [
16,
17,
18]. The original PPE serves as a standardized tool for measuring healthcare quality, encompassing 40 core items with the flexibility to adapt roughly 100 additional questions to the specific medical center under evaluation [
18].
The original PPE questionnaire, though comprehensive, lacked universality. To address this, the Picker Institute developed the PPE-15, a core set of 15 questions applicable across all hospitals and relevant to all patients. Derived from a larger patient experience questionnaire, the PPE-15 facilitates standardized comparisons, tracks experience changes over time and offers actionable insights through its easily interpreted scores. Building upon the PPE-15, Barrio-Cantalejo et al. developed and validated the PPE-33, an expanded instrument. This enhanced questionnaire incorporates new dimensions and items specifically addressing the relationship between hospitalized patients, the information provided, and their involvement in decision-making processes.[
19]
The present study aims to explore the potential of patient-reported data in enhancing the patient journey and identifying areas for improvement within the healthcare process. To achieve this objective, we will leverage a comprehensive patient experience assessment tool, the PPE-33.
2. Materials and Methods
2.1. Study Design and Settings
This study employed a multicenter, cross-sectional survey design utilizing a questionnaire-based approach. The data collection spanned two locations within the Hospital Clínica Biblica: San José, Costa Rica, and Santa Ana, Costa Rica. The survey targeted patients receiving treatment across the emergency department, surgery service, and inpatient department. The data collection period commenced on April 16th, 2024, and concluded on May 17th, 2024.
2.2. Inclusion and Exclusion Criteria
The study used a stratified random sample of 390 patients who visited the hospital between December 2023 and March 2024. To be eligible for the interview, the respondents must be over 18 years old and reside in Costa Rica. Once the sample was obtained from the hospital’s database, a group of professional interviewers contacted the selected patients via telephone, and their answers were recorded.
2.3. Data Collection
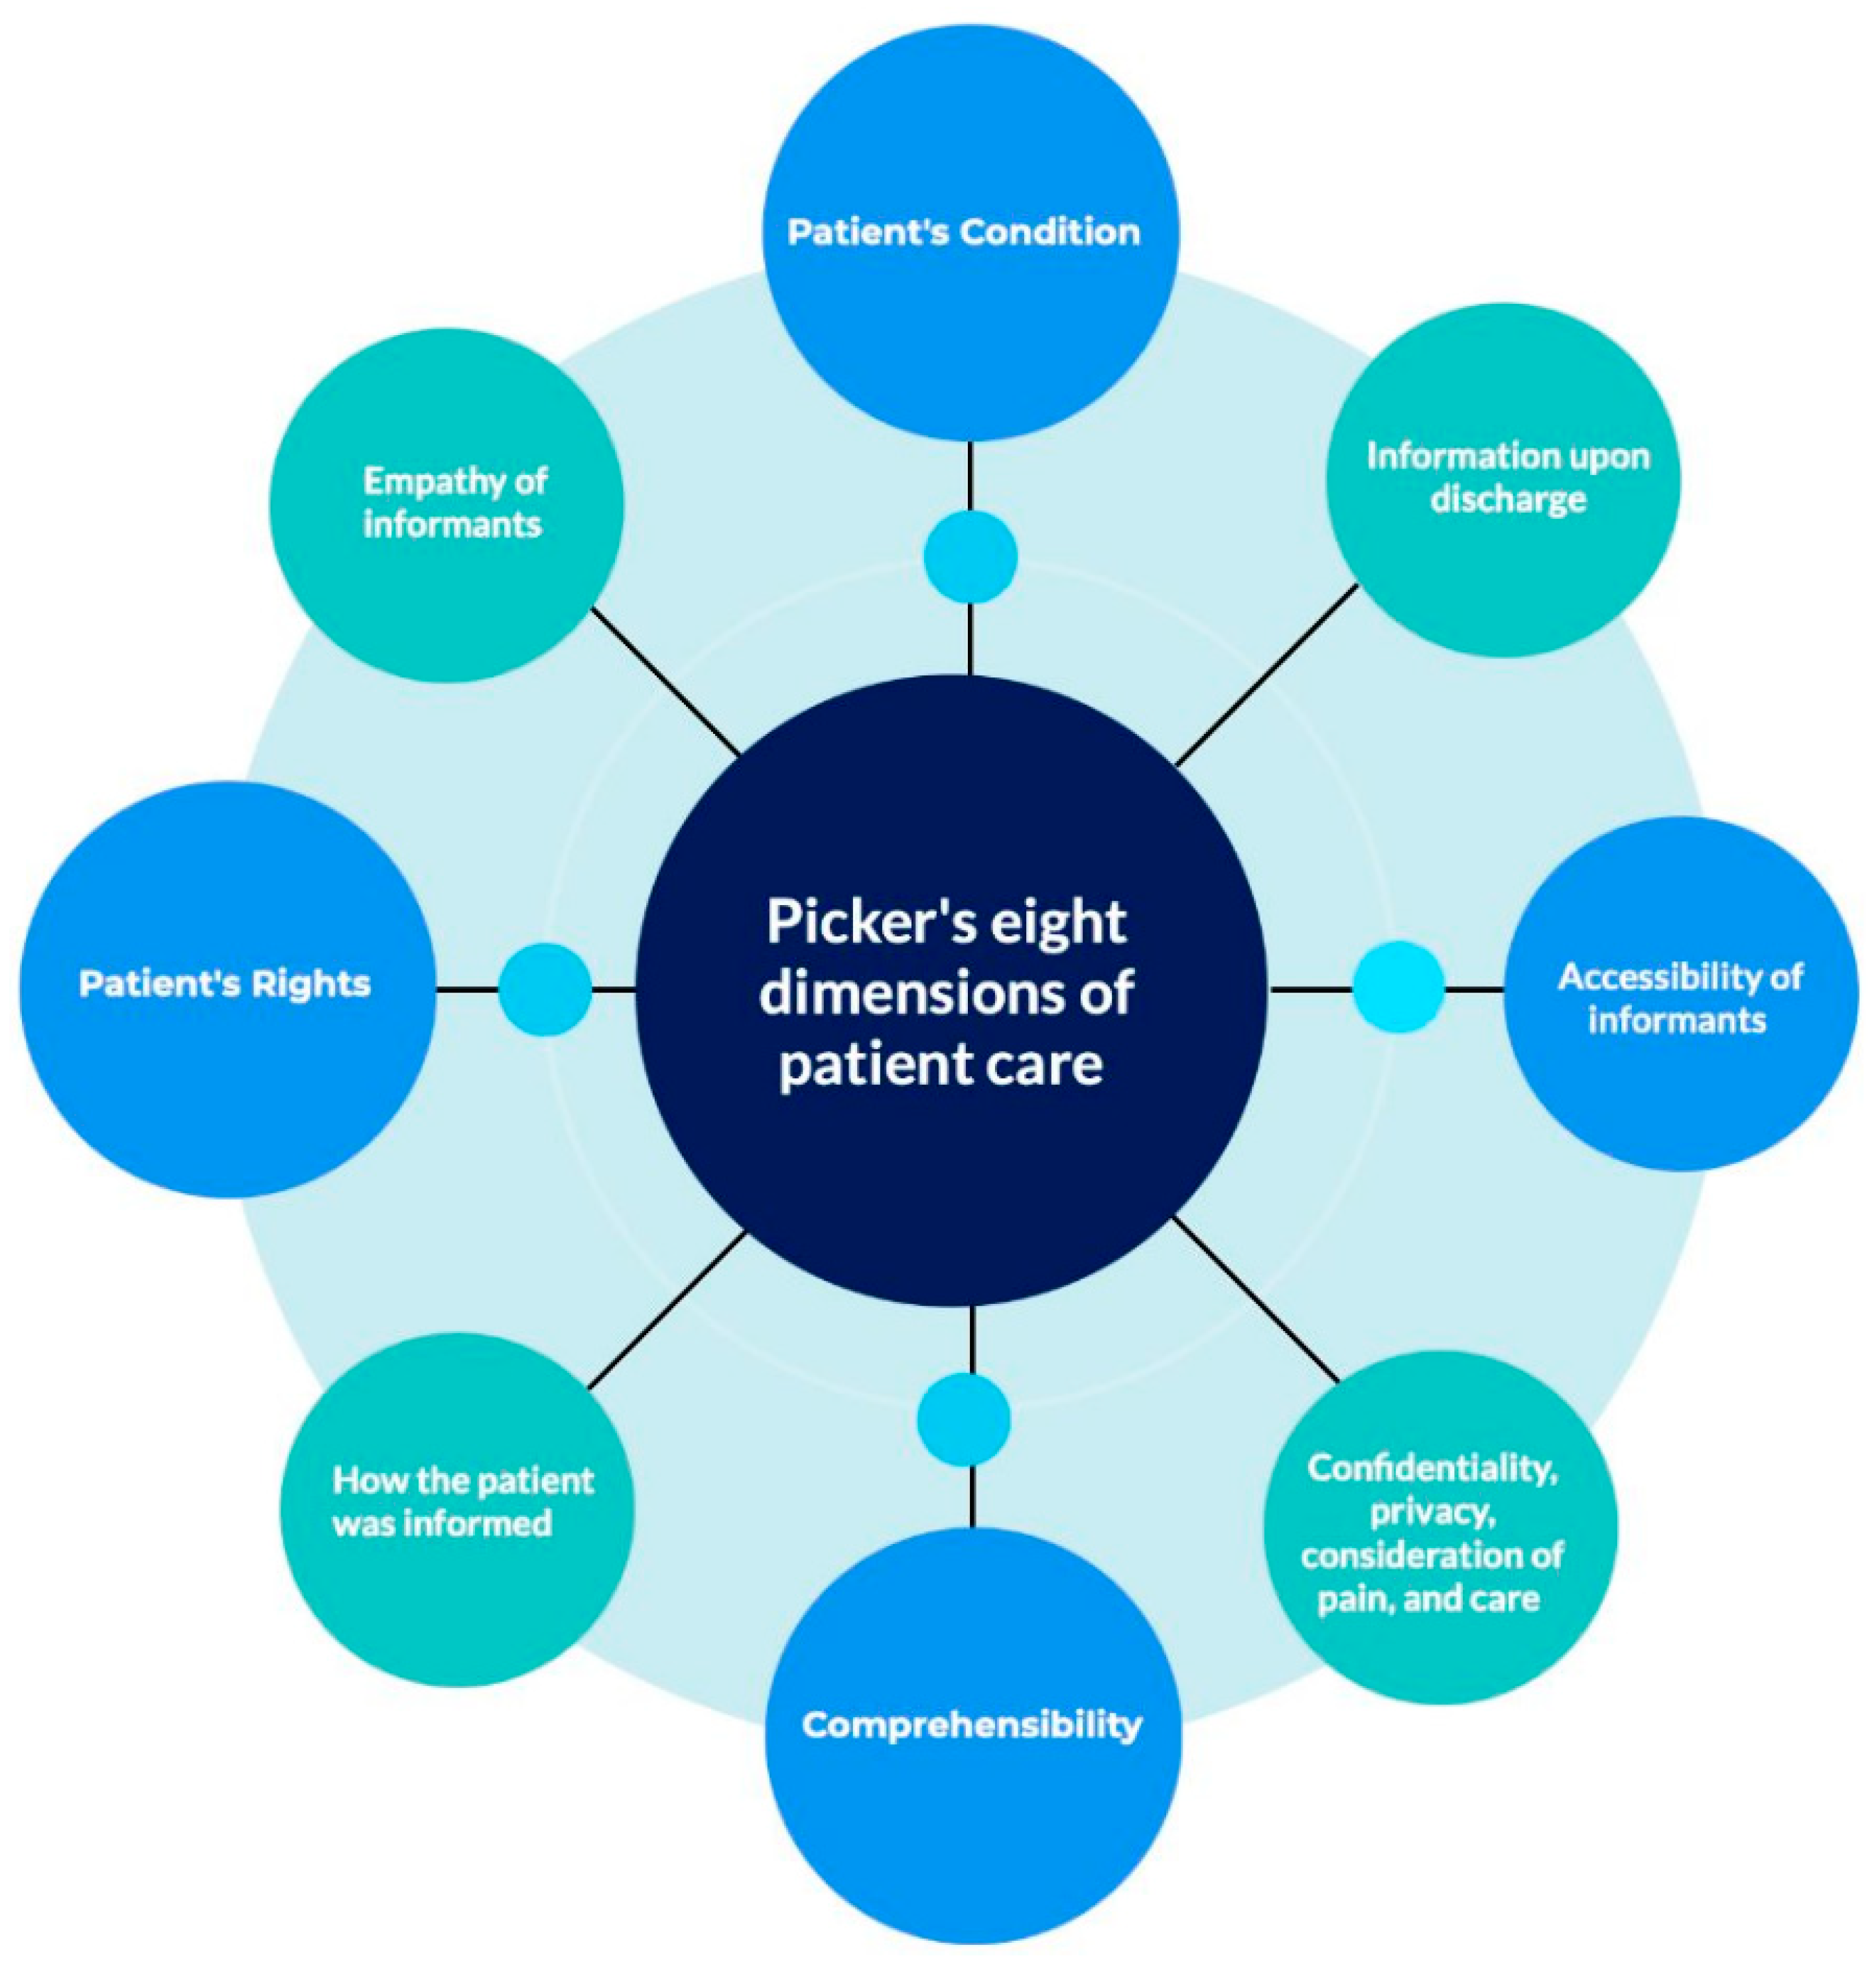
To assess patients' overall experience with received services, participants were administered the Picker Patient Experience Questionnaire-33 (PPE-33) [
19]. This instrument measures patient satisfaction across dimensions of patient care. These aspects encompass Patient Rights, Understanding of Patient Condition, Comprehensibility of Information Provided, Information Delivery Method, Empathy of Information Providers, Accessibility of Information Providers, Discharge Information, Confidentiality and Privacy, Pain Management and Care (
Figure 1) [
19].
Items numbered 21 and 22 were subjected to individual analysis due to the nature of the responses received. Participants in the study were provided with verbal assurance regarding the confidentiality of their responses. The objective of the data collection process, which was conducted during the interview, was also clarified to them. Furthermore, participants were granted the discretion to abstain from responding to any inquiry, should they wish to withhold certain information or if the inquiry was deemed irrelevant to their circumstances. This measure was implemented to respect the privacy of the participants and to ensure the integrity of the data collected.
2.4. Statistical Analysis
All variables (barring items 21 and 22) were recorded to assign a score to them, where a favorable answer by the respondent was given a value of 1 and a negative response meant 0 points were added to the overall score. This was done so that it was possible to obtain an average score for each participant and every item and dimension. These scores were then used to make comparisons between categories of the following variables: sex, age group, education level, marital status, and occupation status, and a combination of t-test and ANOVA was performed to determine whether there was a significant difference between these categories. Additionally, the individual scores of each item were tallied up to obtain the average dimension score and an overall patient satisfaction score. Finally, the average dimension score was contrasted between the three hospital services being analyzed, using the t-test and ANOVA to compare the different scores. An alpha of 5% was used across all statistical tests to determine significance. All statistical analysis was done in RStudio V 4.3.0.
3. Results
3.1. Patient Demographics
A comprehensive analysis was conducted on a total of 390 questionnaires. The demographic distribution of the participants revealed that 61.79% identified as female. Furthermore, a significant proportion, 56.15%, were within the age range of 18 to 44 years. In terms of educational attainment, 55.67% had reached an undergraduate level. The marital status of the participants indicated that 66.93% were married. Additionally, the employment status showed that 61.50% of the participants were gainfully employed. A detailed presentation of the demographic data can be found in
Table 1.
Table 1 illustrates a significant difference (p = 0,006) in the PPE-33 score solely concerning occupational status, with scores ranging from 68.54% to 86.00%. However, no noteworthy differences were detected based on sex or age, suggesting that the hospital consistently delivers high-quality service to all users, regardless of demographic factors.
3.2. Patient Experience Evaluation
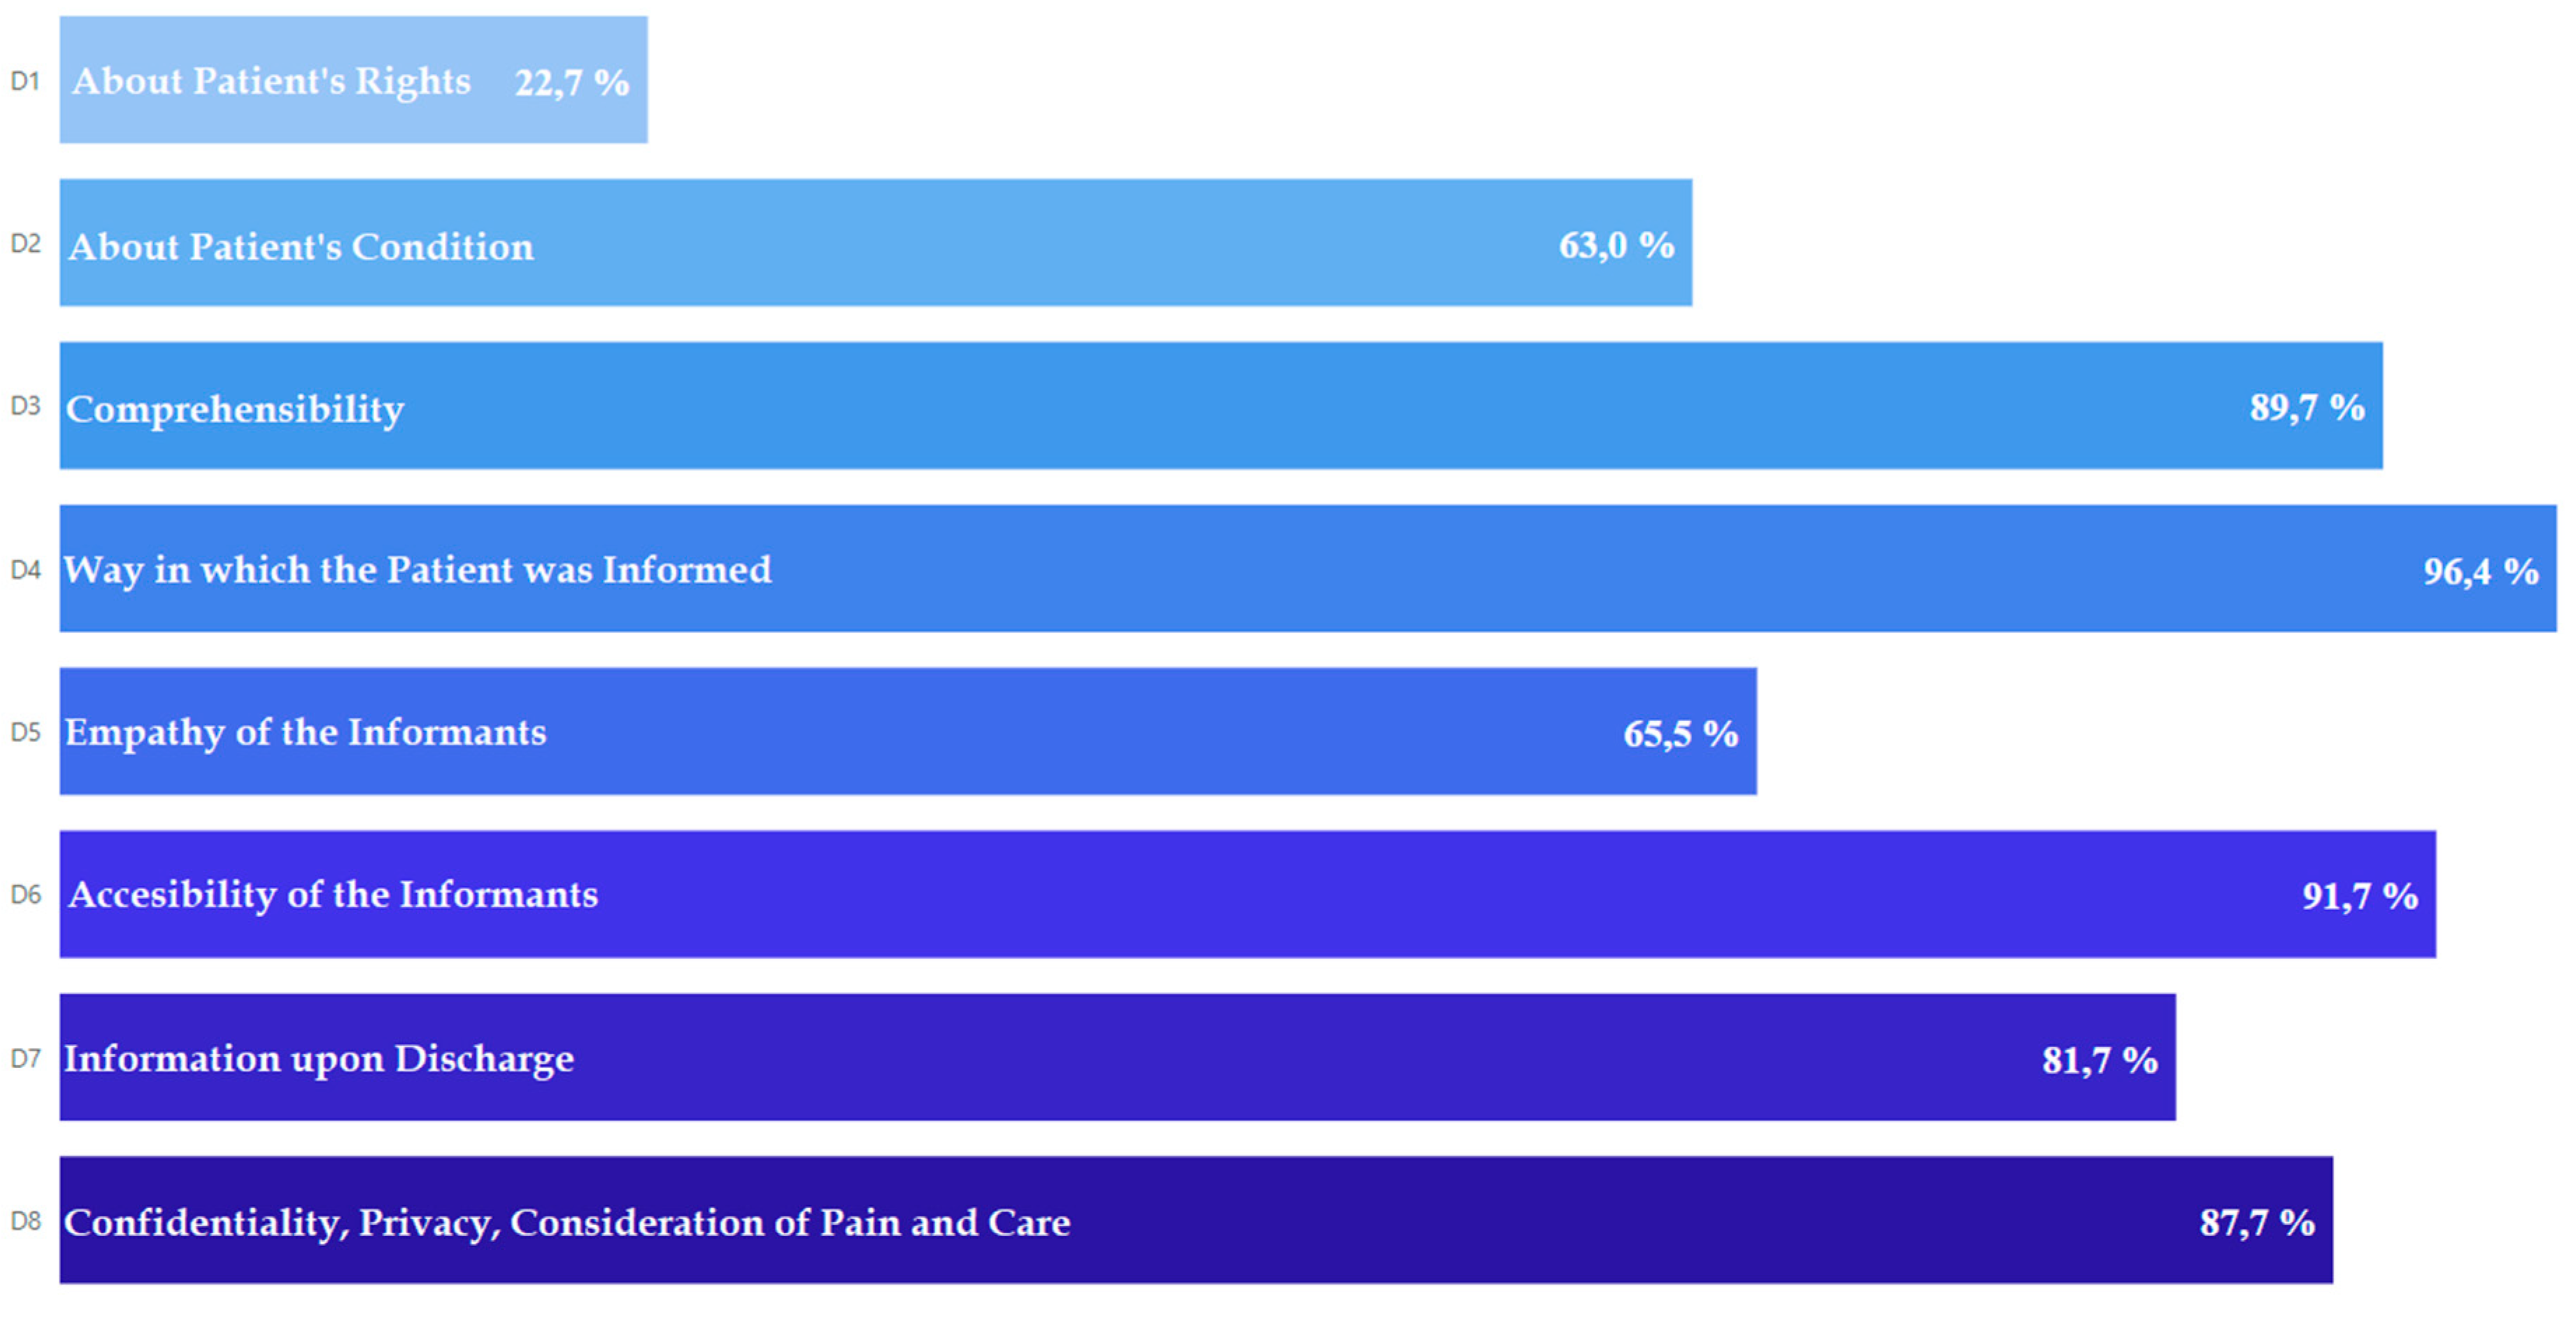
Figure 1 presents the overall distribution of scores for various dimensions of patient experience. The findings reveal high scores in dimensions related to how patients are informed (96.4%), accessibility of informants (91.7%), and compressibility (89.7%). However, the data also highlights areas for improvement in dimensions associated with information on patient rights (22.7%) and patient conditions (63.0%). Detailed results for all questionnaire items are provided in
Table 2.
Figure 2.
Percentage distribution of responses to the PPE-33 items by dimension.
Figure 2.
Percentage distribution of responses to the PPE-33 items by dimension.
3.2.1. Patient Rights
Assessment of patient rights knowledge emerged as the area with the lowest overall score (22.7%) within the broader evaluation. The survey findings revealed that less than a quarter of respondents (ranging from 17.9% to 25.4%) reported receiving information about key aspects of their patient rights.
3.2.2. Patient Condition
The "Patient Condition" dimension yielded an overall score of 63.0%. While a positive aspect emerged in that most patients (74.3%) reported receiving information about their condition or illness (P4), a concerning finding is that a significant portion (25.7%) did not. Information sharing regarding treatment effects (P5) reached 68.8%, indicating a gap for some patients who may not have received this crucial information. However, the most concerning finding within this dimension is the low percentage (45.9%) of patients who reported being informed about the potential risks of diagnostic tests (P6).
3.2.3. Comprehensibility
The "Comprehensibility" dimension achieved a positive overall score of 89.7%. A vast majority of patients reported receiving clear and understandable answers to their questions from both doctors (P7: 93.7%) and nurses (P8: 92.6%). This suggests effective communication practices are in place within the hospital. The survey also revealed a high percentage of patients (82.7%, P9) expressing a desire for more active participation in decision-making regarding their care and treatment.
3.2.4. Information Delivery
The "Information Delivery" dimension achieved a high overall score of 96.4%. This score reflects positive findings regarding communication consistency and patient consideration. The overwhelming majority of patients across both locations reported not experiencing contradictory information from healthcare providers (P10).
3.2.5. Empathy of Informants
The "Empathy of Informants" dimension yielded mixed results. While a positive aspect emerged in that a high percentage of patients (95.5%, P15) found the informed consent forms easy to understand, a concerning finding revealed that a significant portion of patients (ranging from 44.0% to 26.3%, P12 & P16) reported that doctors or nurses did not proactively address their anxieties or concerns regarding their health or treatment. Most patients (66.7%, P13) reported receiving a consent form for necessary procedures, and the majority who did (70.2%, P14) found explanations from professionals helpful. Additionally, a vast majority (90.3%, P17) indicated they were eventually able to find someone on staff to address their concerns.
3.2.6. Accessibility of Informants
The survey yielded positive results regarding the accessibility of healthcare providers. A high percentage of patients in both locations reported feeling encouraged by professionals to ask questions about their illness or any aspect related to it. Most patients found it easy to find a doctor to address their doubts (94.4%, P19). Similarly, a vast majority across locations reported that if their family or close ones wanted to speak with a doctor, they were given the opportunity (95.0%P20).
3.2.7. Information Upon Discharge
The "Information Upon Discharge" dimension yielded mixed results, highlighting areas for improvement in patient education practices. The positive aspect lies in many patients (94.6%, P24) understanding medication instructions. However, a concerning finding revealed that a significant portion (36.5%, P25) did not receive clear explanations about the potential side effects of their medications. Similarly, only around two-thirds of patients (71.4%, P26) reported being informed about potential warning signs related to their condition or treatment.
3.2.8. Confidentiality, Privacy, Consideration of Pain and Care
The survey yielded positive results across multiple dimensions encompassing patient confidentiality, privacy, pain management, and respectful communication. A strong majority of patients across both locations felt their privacy was consistently upheld during interactions with healthcare providers 95.2%, P28). Additionally, physicians made efforts to ensure discussions about patients' conditions remained private from other patients.
While over half of the patients (58.5%, P29) reported experiencing pain at some point during their stay, a vast majority (96.2%, P30) felt the hospital staff did everything they could to manage their discomfort effectively. Communication with patients regarding their health status appeared respectful and informative. Nearly all patients reported that healthcare professionals delivered information with tact (97.0%, P31) and dedicated sufficient time to provide clear explanations (94.8%, P32). Finally, an overwhelming majority of patients felt they were treated with respect throughout their hospital stay.
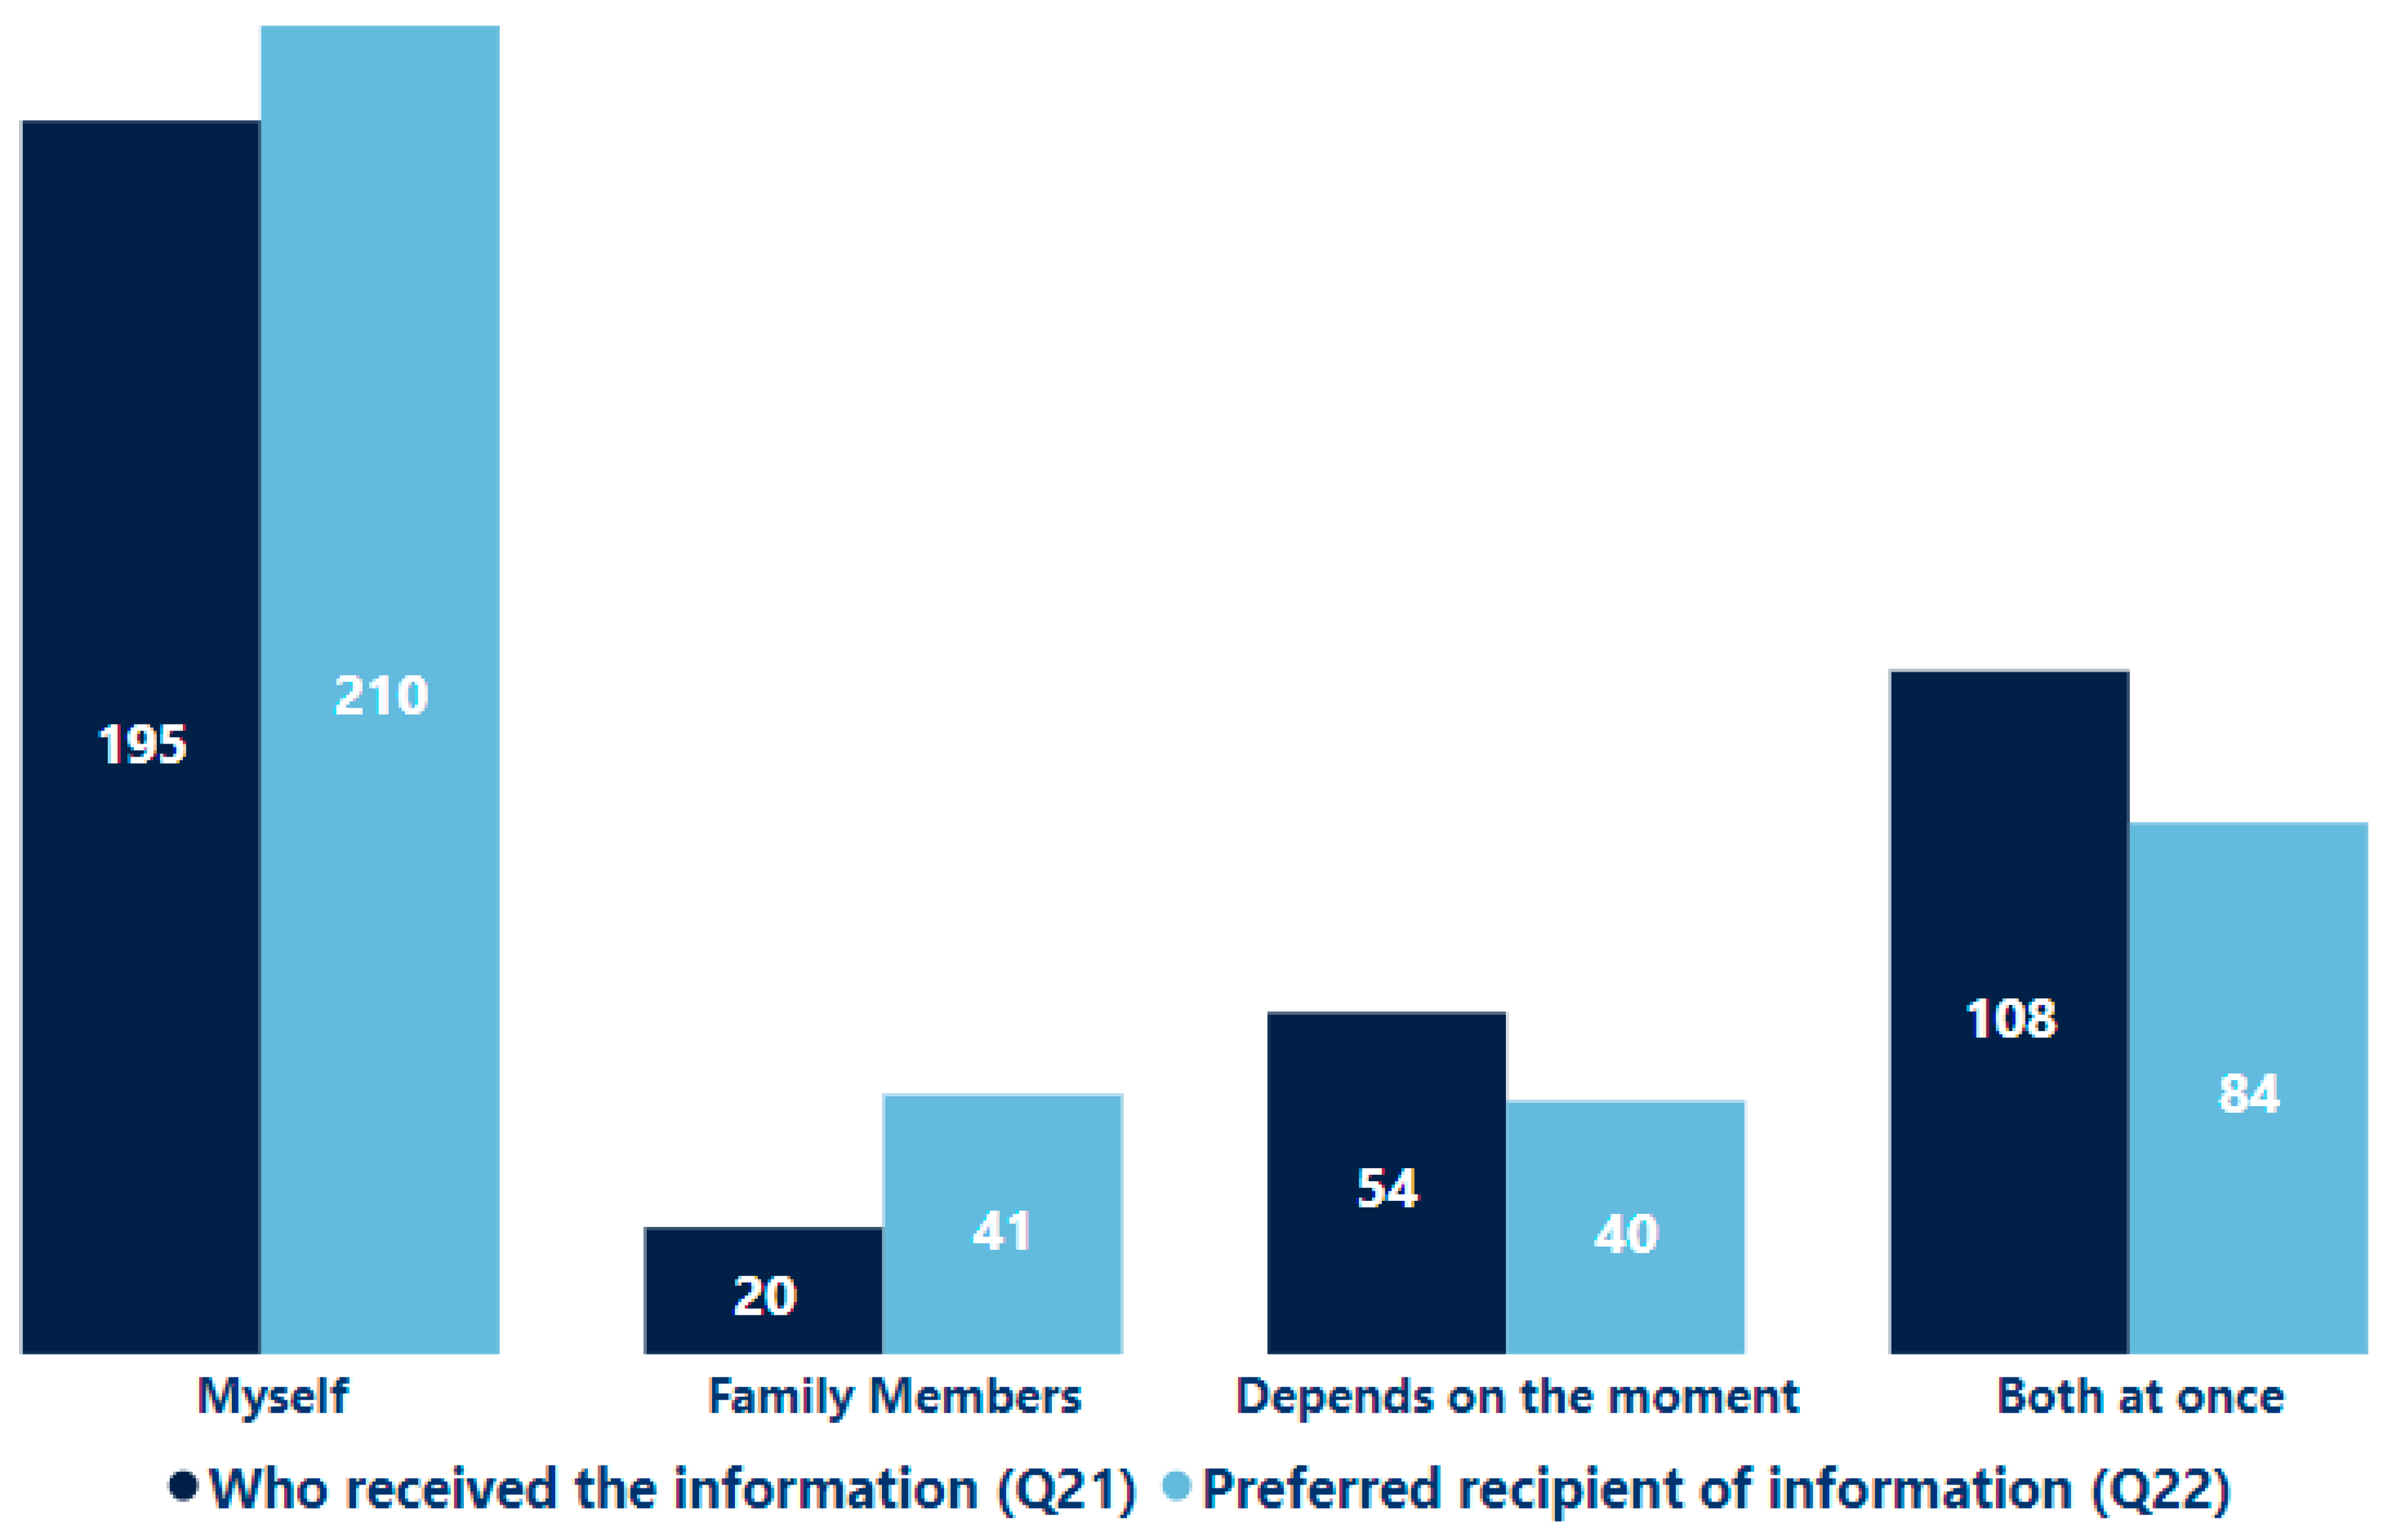
Figure 3 illustrates the distribution of responses to questions 21 and 22, which employed a distinct response format related to the delivery of information by healthcare personnel. Question 21 asked who typically received information during the patient's hospital stay. The results indicated that 51.79% of patients reported receiving the information directly, 5.38% stated it was given to their accompanying family members, 28.46% noted it was provided to both themselves and their family members, and 14.36% mentioned it depended on the situation. Question 22 sought to understand patients' preferences regarding who should receive the information. The responses revealed that 55.90% preferred to obtain the information themselves, 11.03% preferred it be given to a family member, 22.31% preferred both simultaneously, and 10.77% stated that it may vary depending on the situation.
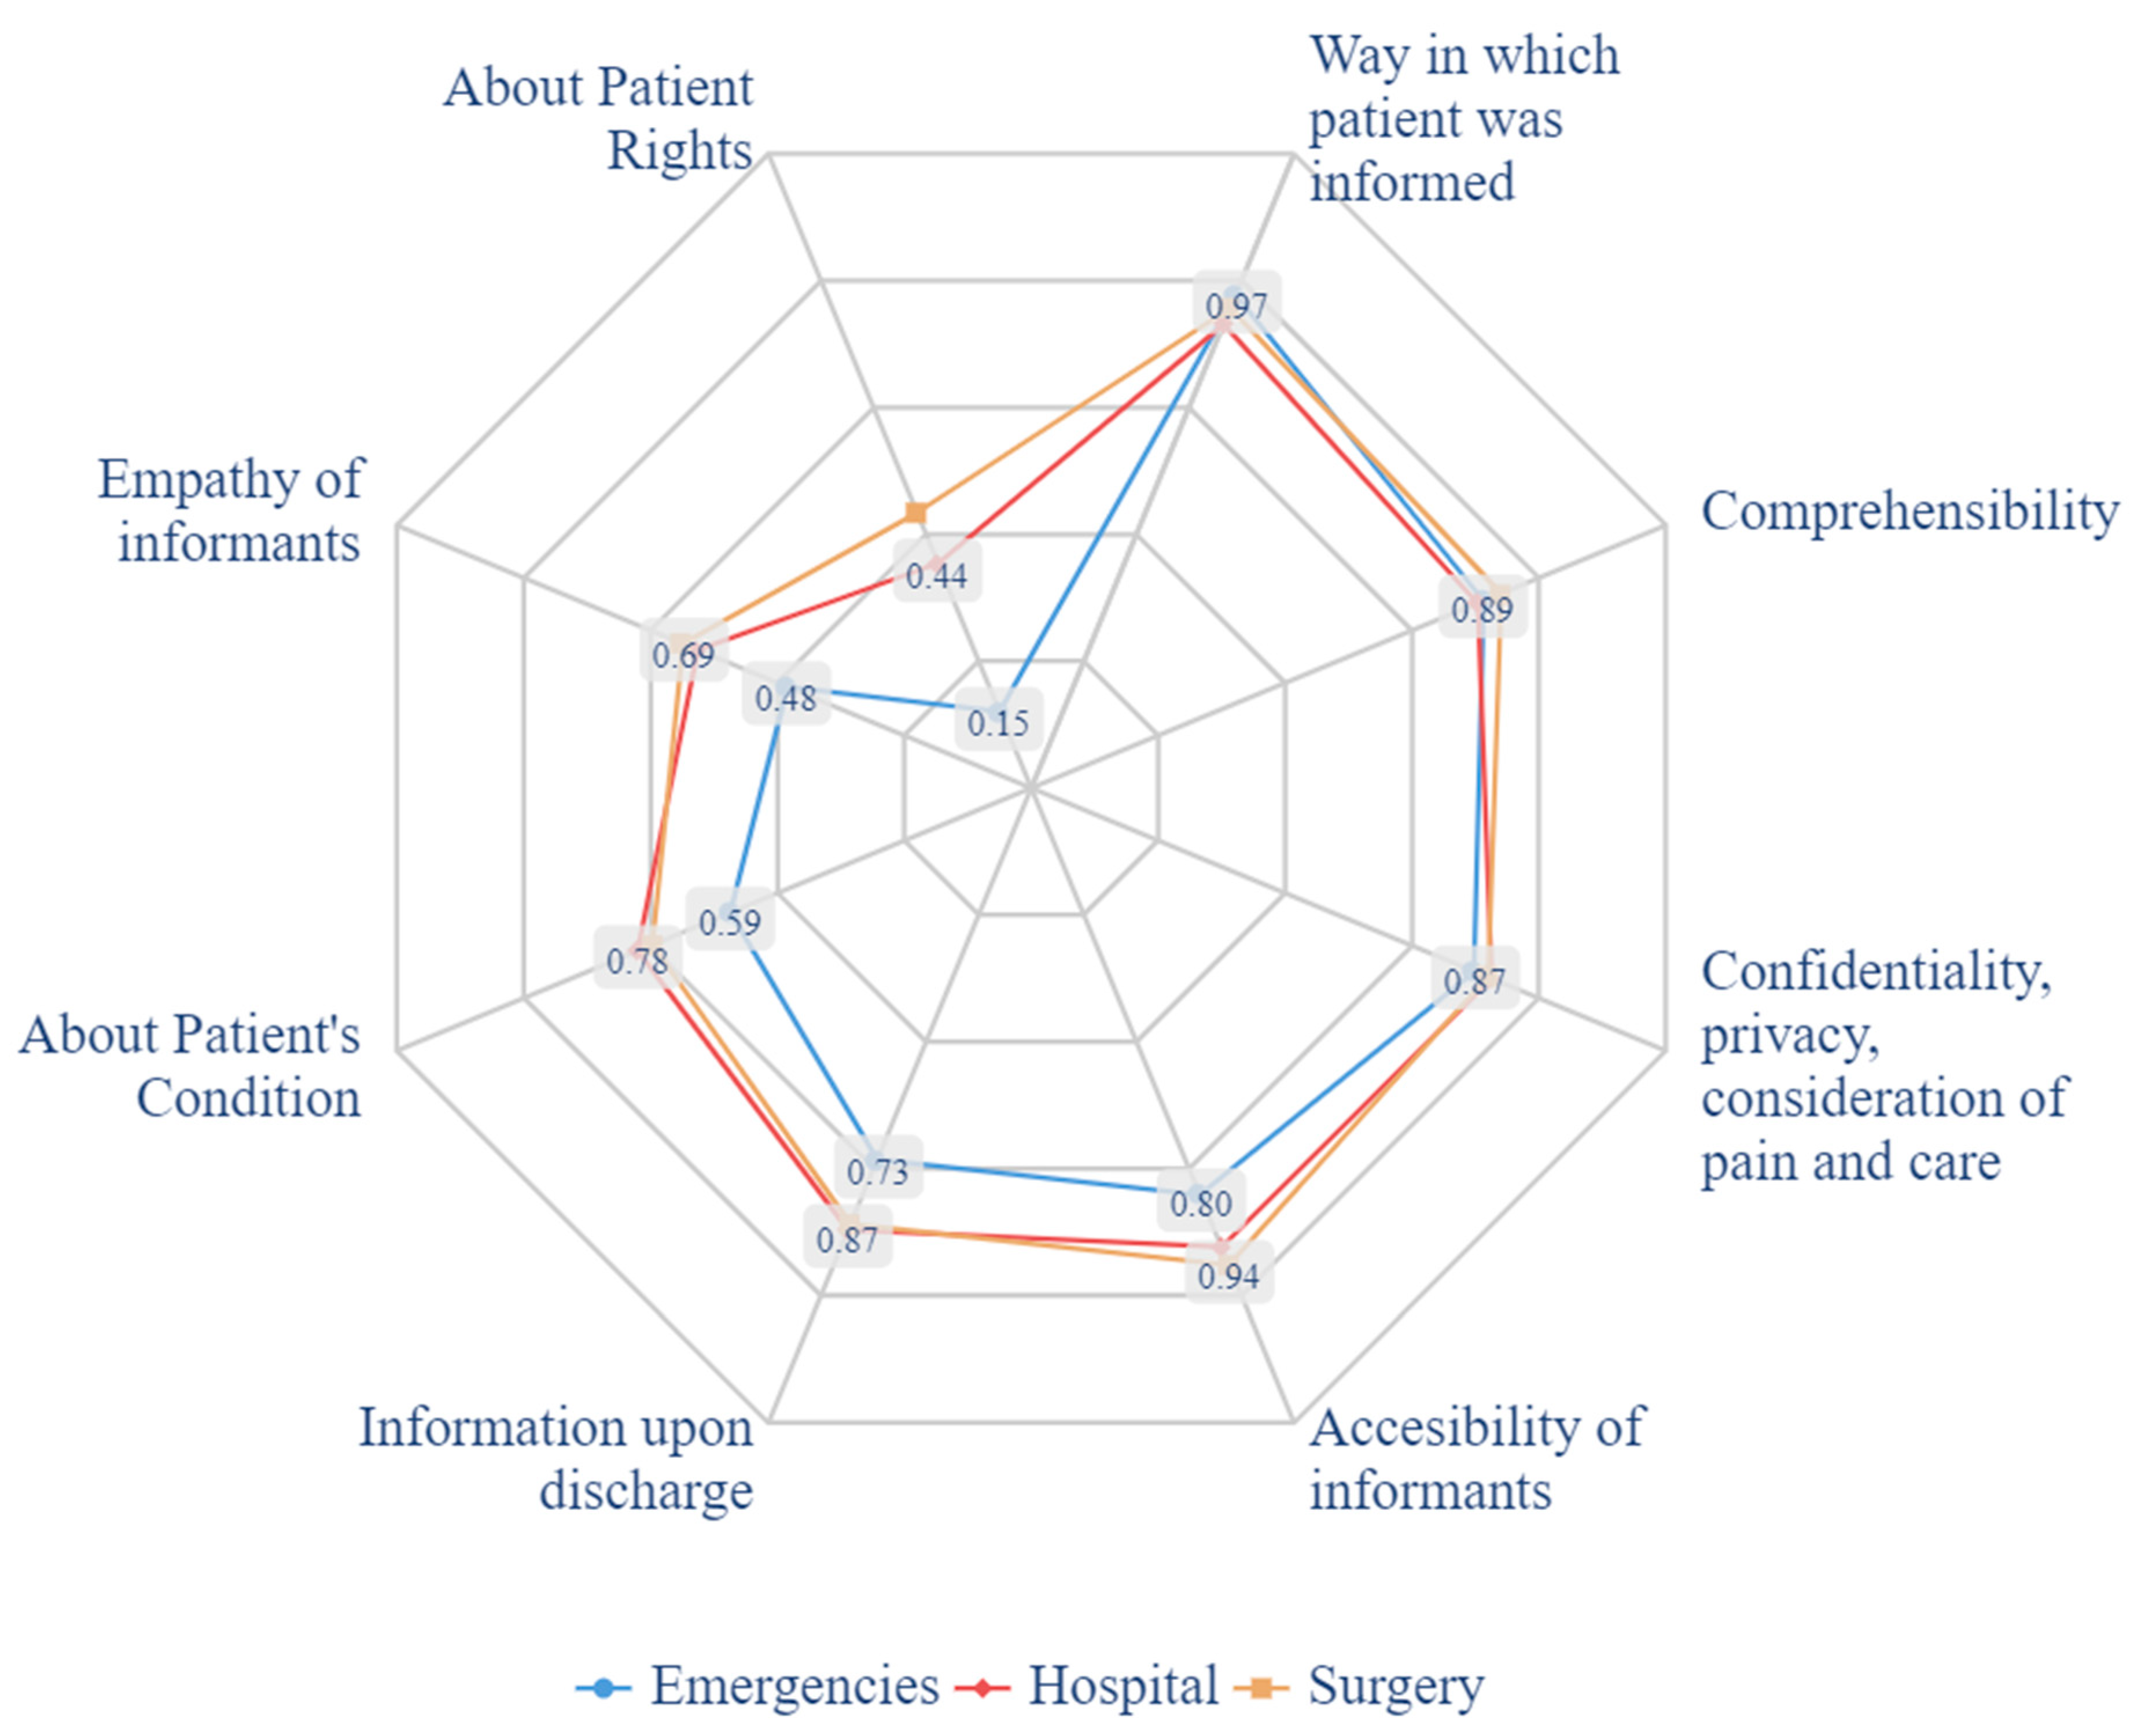
Figure 4 presents a stratified analysis of patient experience dimensions according to the location where medical care was provided (emergency department, surgery service, inpatient department). The emergency department exhibited lower scores compared to other care areas. This was particularly evident in the dimensions of "Patient Rights," "Empathy of Informants," and "About Patient Condition."
4. Discussion
The Picker Patient Experience Questionnaire was chosen as the instrument, owing to several advantages. The questionnaire is specifically engineered to evaluate patient experiences, thereby guaranteeing a direct assessment of the construct under consideration.[
20] Importantly, the instrument promotes international comparisons by being available in a translated and validated Spanish version, facilitating its utilization across a variety of populations.[
19,
20]
In broad terms, the acceptance level was high, demonstrating a satisfaction rate of 75.05%. Upon scrutinizing each dimension in greater detail, a significant disparity is observed between the information provided at the time of admission and the remaining aspects. The former dimension exhibited a satisfaction level of 47.32%, while the latter surpassed the 84% mark.
Such results can be attributed to numerous instances where the patient’s needs are prioritized, often leading to incomplete procedures. This is particularly evident in the emergency wing, which recorded the lowest value (39.53%). Furthermore, to promote sustainability and reduce paper consumption, the hospital transitioned from distributing the patient rights bill in a physical format to a digital one. This change may be contributing to the low figures, indicating a need to bolster communication in this area. This statement underscores a significant challenge faced by this department: it is tasked with the dual responsibility of efficiently managing medical emergencies,[
21] while simultaneously ensuring patient satisfaction and effective treatment. It is important to note that research has consistently demonstrated a negative correlation between the duration of a patient’s stay in the Emergency Department and their level of satisfaction. [
22]
In healthcare, patient experience in the Emergency Department (ED) is crucial and has garnered significant attention from various stakeholders, including healthcare providers, the patients themselves, hospitals, and regulatory bodies [
23]. The appropriate dissemination of information has been identified as a key factor influencing patient satisfaction.[
24] It has been observed that patients who were recipients of more comprehensive information expressed a higher degree of satisfaction with their visit to the emergency department. [
22]
Our study reveals that factors such as age, gender, marital status, employment status, educational level, and housing situation influence satisfaction levels, corroborating findings from another research.[
12] Notably, the only statistically significant association observed was with occupational status, where employed individuals displayed higher satisfaction compared to domestic workers. As established within the conceptual framework for patient satisfaction with primary care, sociodemographic characteristics, and health status are recognized as critical determinants. Furthermore, studies demonstrating a similar pattern suggest that factors related to accessibility and patient experience may carry more weight than the influence of non-modifiable characteristics.[
25]
The element of physical comfort is identified as a primary factor associated with satisfaction. In line with this, the experience of pain at discharge is linked with a decrease in patient satisfaction. Similar observations have been reported in the context of outpatient services, where inadequate symptom control results in diminished satisfaction levels.[
26] Although most of our patients experienced pain at some point during their visit, an overwhelming 96.15% felt that every effort was made to alleviate it.
Our findings shed light on the comparable levels of experience reported by both out-patients and inpatients throughout their respective visits. The study suggests that the random effect associated with the specific ward where patients were admitted had a minimal impact on their experiences. Our research advocates for the enhancement of the inpatient experience and overall satisfaction as a potent strategy to foster patient loyalty towards the hospital. This loyalty is a pivotal element in elevating the quality of healthcare services. It is through such commitment that we can truly transform the healthcare landscape.
Strenghts and Weaknesses
The current study's methodology may have inherent limitations. Several studies have identified crucial factors impacting patient satisfaction during hospitalization that were not captured by this instrument. For instance, accessibility of hospital infrastructure for families emerged as a significant theme influencing satisfaction in studies focused on both pediatric and adolescent patients.[
27]
Nevertheless, we acknowledge the significance of this study, particularly given the scarcity of literature pertaining to this subject in the context of Latin America. Furthermore, it paves the way for future projects and research endeavors aimed at enhancing patient care. This study, therefore, not only contributes to the existing body of knowledge but also catalyzes further exploration and improvement in this field.
5. Conclusions
The research concluded that most patients expressed satisfaction with their healthcare experience. However, a notable discrepancy was observed in the level of satisfaction concerning the information received at admission versus other care aspects. Factors such as prioritization of patient needs, communication about patient rights, sociodemographic attributes, health conditions, and physical comfort were identified as significant influencers of patient satisfaction. The study further revealed that the specific ward of admission did not significantly impact the inpatient experience. It was suggested that improvements in patient experience could potentially foster patient loyalty and enhance the quality of healthcare services
Author Contributions
For research articles with several authors, a short paragraph specifying their individual contributions must be provided. The following statements should be used “Conceptualization, (S.R-A) and (E.Z-M).; methodology, (E.Z-M).; software, (D.Q-L).; validation, (S.R-A) and (E.Z-M).; formal analysis (D.Q-L).; investigation, (D.Q-L); resources, (S.R-A).; data curation, X.X.; writing—original draft preparation, (A.F-M ).; writing—review and editing, (R.Q-V); (A.A-A) and (J.G-M).; visualization, (D.Q-L).; supervision(E.Z-M).; project administration (S.R-A) All authors have read and agreed to the published version of the manuscript.
Funding
This research received no external funding.
Conflicts of Interest
The authors declare no conflicts of interest.
References
- Bastemeijer CM, Boosman H, Zandbelt L, Timman R, Boer D de, Hazelzet JA: Patient Experience Monitor (PEM): The Development of New Short-Form Picker Experience Questionnaires for Hospital Patients with a Wide Range of Literacy Levels. PROM. 2020, 11:221–30. [CrossRef]
- Edgman-Levitan S, Schoenbaum SC: Patient-centered care: achieving higher quality by designing care through the patient’s eyes. Israel Journal of Health Policy Research. 2021, 10:21. [CrossRef]
- Baumann LA, Reinhold AK, Brütt AL: Public and patient involvement in health policy decision-making on the health system level – A scoping review. Health Policy. 2022, 126:1023–38. [CrossRef]
- Grocott A, McSherry W: The Patient Experience: Informing Practice through Identification of Meaningful Communication from the Patient’s Perspective. Healthcare. 2018, 6. [CrossRef]
- Bombard Y, Baker GR, Orlando E, et al.: Engaging patients to improve quality of care: a systematic review. Implementation Science. 2018, 13:98. [CrossRef]
- Gualandi R, Masella C, Viglione D, Tartaglini D: Exploring the hospital patient journey: What does the patient experience? PLoS ONE. 2019, 14:e0224899. [CrossRef]
- Haraden C, Resar R: Patient flow in hospitals: understanding and controlling it better. Frontiers of health services management. 2004, 20:3.
- Trbovich P, Vincent C: From incident reporting to the analysis of the patient journey. BMJ Quality & Safety. 2019, 28:169–71.
- Ben-Tovim DI, Dougherty ML, O’Connell TJ, McGrath KM: Patient journeys: the process of clinical redesign. Medical Journal of Australia. 2008, 188:S14–7.
- Min R, Li L, Zi C, Fang P, Wang B, Tang C: Evaluation of patient experience in county-level public hospitals in China: a multicentred, cross-sectional study. BMJ Open. 2019, 9:e034225. [CrossRef]
- Bertran MJ, Viñarás M, Salamero M, Garcia F, Graham C, McCulloch A, Escarrabill J: Spanish and Catalan translation, cultural adaptation and validation of the Picker Patient Experience Questionnaire-15. Journal of Healthcare Quality Research. 2018, 33:10–7. [CrossRef]
- Leonardsen A-CL, Grøndahl VA, Ghanima W, et al.: Evaluating patient experiences in decentralised acute care using the Picker Patient Experience Questionnaire; methodological and clinical findings. BMC Health Services Research. 2017, 17:685. [CrossRef]
- Zarei A, Arab M, Froushani AR, Rashidian A, Ghazi Tabatabaei SM: Service quality of private hospitals: The Iranian Patients’ perspective. BMC Health Serv Res. 2012, 12:31. [CrossRef]
- Berendes S, Heywood P, Oliver S, Garner P: Quality of Private and Public Ambulatory Health Care in Low and Middle Income Countries: Systematic Review of Comparative Studies. PLoS Med. 2011, 8:e1000433. [CrossRef]
- Pongsupap Y, Lerberghe WV: Choosing between public and private or between hospital and primary care: responsiveness, patient-centredness and prescribing patterns in outpatient consultations in Bangkok. Tropical Med Int Health. 2006, 11:81–9. [CrossRef]
- Parasuraman A, Zeithaml VA, Berry LL: SERVQUAL: A Multiple-Item Scale for Measuring Consumer Perceptions of Service Quality. Journal of Retailing. 1988, 12–40.
- Lee Hargraves J, Hays RD, Cleary PD: Psychometric Properties of the Consumer Assessment of Health Plans Study (CAHPS®) 2.0 Adult Core Survey. Health Services Research. 2003, 38:1509–28. [CrossRef]
- Jenkinson C: Patients’ experiences and satisfaction with health care: results of a questionnaire study of specific aspects of care. Quality and Safety in Health Care. 2002, 11:335–9. [CrossRef]
- Barrio-Cantalejo IM, Simón-Lorda P, Sánchez Rodríguez C, Molina-Ruiz A, Tamayo-Velázquez MI, Suess A, Jiménez-Martín JM: Adaptación transcultural y validación del Picker Patient Experience Questionnaire-15 para su uso en población española. Revista de Calidad Asistencial. 2009, 24:192–206. [CrossRef]
- López-Ibort N, Boned-Galán A, Cañete-Lairla M, Gómez-Baca CA, Angusto-Satué M, Casanovas-Marsal J-O, Gascón-Catalán A: Design and Validation of a Questionnaire to Measure Patient Experience in Relation to Hospital Nursing Care. Nursing Reports. 2024, 14:400–12. [CrossRef]
- Al-Ghabeesh SH, Thabet A, Rayan A, Abu-Snieneh HM: Qualitative study of challenges facing emergency departments nurses in Jordan. Heliyon. 2023, 9:.
- de Steenwinkel M, Haagsma JA, van Berkel ECM, Rozema L, Rood PPM, Bouwhuis MG: Patient satisfaction, needs, and preferences concerning information dispensation at the emergency department: a cross-sectional observational study. International Journal of Emergency Medicine. 2022, 15:5. [CrossRef]
- Aleksandrovskiy I, Ganti L, Simmons S: The Emergency Department Patient Experience: In Their Own Words. Journal of Patient Experience. 2022, 9:23743735221102455.
- Lang SC, Weygandt PL, Darling T, Gravenor S, Evans JJ, Schmidt MJ, Gisondi MA: Measuring the correlation between emergency medicine resident and attending physician patient satisfaction scores using press Ganey. AEM Education and Training. 2017, 1:179–84.
- Servetkienė V, Puronaitė R, Mockevičienė B, Ažukaitis K, Jankauskienė D: Determinants of patient-perceived primary healthcare quality in Lithuania. International journal of environmental research and public health. 2023, 20:4720.
- Seleznev I, Alibekova R, Clementi A: Patient satisfaction in Kazakhstan: Looking through the prism of patient healthcare experience. Patient Education and Counseling. 2020, 103:2368–72.
- Buclin CP, Uribe A, Daverio JE, et al.: Validation of French versions of the 15-item picker patient experience questionnaire for adults, teenagers, and children inpatients. Frontiers in Public Health. 2024, 12:.
|
Disclaimer/Publisher’s Note: The statements, opinions and data contained in all publications are solely those of the individual author(s) and contributor(s) and not of MDPI and/or the editor(s). MDPI and/or the editor(s) disclaim responsibility for any injury to people or property resulting from any ideas, methods, instructions or products referred to in the content. |
© 2024 by the authors. Licensee MDPI, Basel, Switzerland. This article is an open access article distributed under the terms and conditions of the Creative Commons Attribution (CC BY) license (http://creativecommons.org/licenses/by/4.0/).


