1. Introduction
In general, LIAs perform the quadrature demodulation of a signal with a proper carrier/modulation. The carrier used can be in very different frequency ranges, depending on the applications of the system. Since 2000, at ENEA C.R. Frascati Laboratories, measurement instruments based on LIA architecture have been developed in the medium/high carrier frequency range for use in laser interferometers [
1], RF reflectometers [
2], optical radars [
3], fluorescence measurements [
4] and bolometers [
5]. In high-frequency carrier applications, such as optical radar, a Field Programmable Gate Array (FPGA)-based architecture is mandatory. Conversely, in LPAS and fluorescence measurements, which are used in many other applications and scientific investigations, the carrier frequency can be very low. In this case, given the low carrier frequency (e.g. ~200 Hz), a sampling and processing frequency of 5ksps (5k samples per second) would be sufficient, as it is higher than the Nyquist frequency. Some low-cost LIAs, implemented using different hardware architectures, microcontrollers, and digital processing algorithms have been reported in the literature [
6,
7,
8,
9]; in our previous implementation we decided to develop a fully-digital microcontroller-based architecture [
4].
The research reported in this paper was part of the TESLA funded project “
Tecniche laser per la sicurezza di alimenti e acque” (Laser techniques for food and water safety) of Regione Lazio and was also related to the patented DIAL PAS system [
10]. In particular, the DIAL PAS system requires a synchronized Double-Frequency and Double-Channel LIA (DF-DC-LIA). For these reasons, an evolution of the LIA [
4] used in previous years for audio signals has been developed and described hereafter. This new version, called ENEA DSP Box Due, can work on two channels with two modulation frequencies. The main hardware differences with the previous architecture [
4] are the presence of a more powerful microcontroller board and a more advanced signal conditioning mezzanine, based on the ENEA project and developed by IT Systems – Rome - Italy, similarly to other
open-source instrumentations [
6,
7].
ENEA DSP Box Due, was specifically designed to allow a compact implementation of LPAS and fluorescence-based sensing systems for the detection of adulteration and contamination in food and drinking water. In this regard, heavy metals (HMs) represent one major class of contaminants in aqueous media that continuously accumulates in the environment due to the increasing man-made activity and intrinsic non-biodegradability. In fact, their ubiquitous presence can lead to a wide range of environmental problems and risks for human health [
11,
12]. For example, (Cu(II)), is an essential microelement involved in many biological processes, such as growth, metabolism and immune system [
13]. On the other hand, it tends to accumulate in fish (particularly in gills), where it causes a range of diseases and eventually death [
11]. More worryingly, in humans, extended exposure to Cu(II) can produce damage to kidneys and liver, gastrointestinal problems, and several neurodegenerative syndromes, such as Alzheimer’s and Parkinson’s diseases [
14]. Many recent investigations have demonstrated that effective sensing of copper in water can be easily achieved through the fluorescence response of carbon dots (CDs), carbon-based nanoparticles with peculiar optical properties [
15].
This paper describes the DSP Box Due developed for LPAS applications, its characterization with synthetic signals and the results of its use in fluorescence sensing of copper using CDs.
2. Principles, Materials and Methods
2.1. ENEA DSP Box Due Hardware
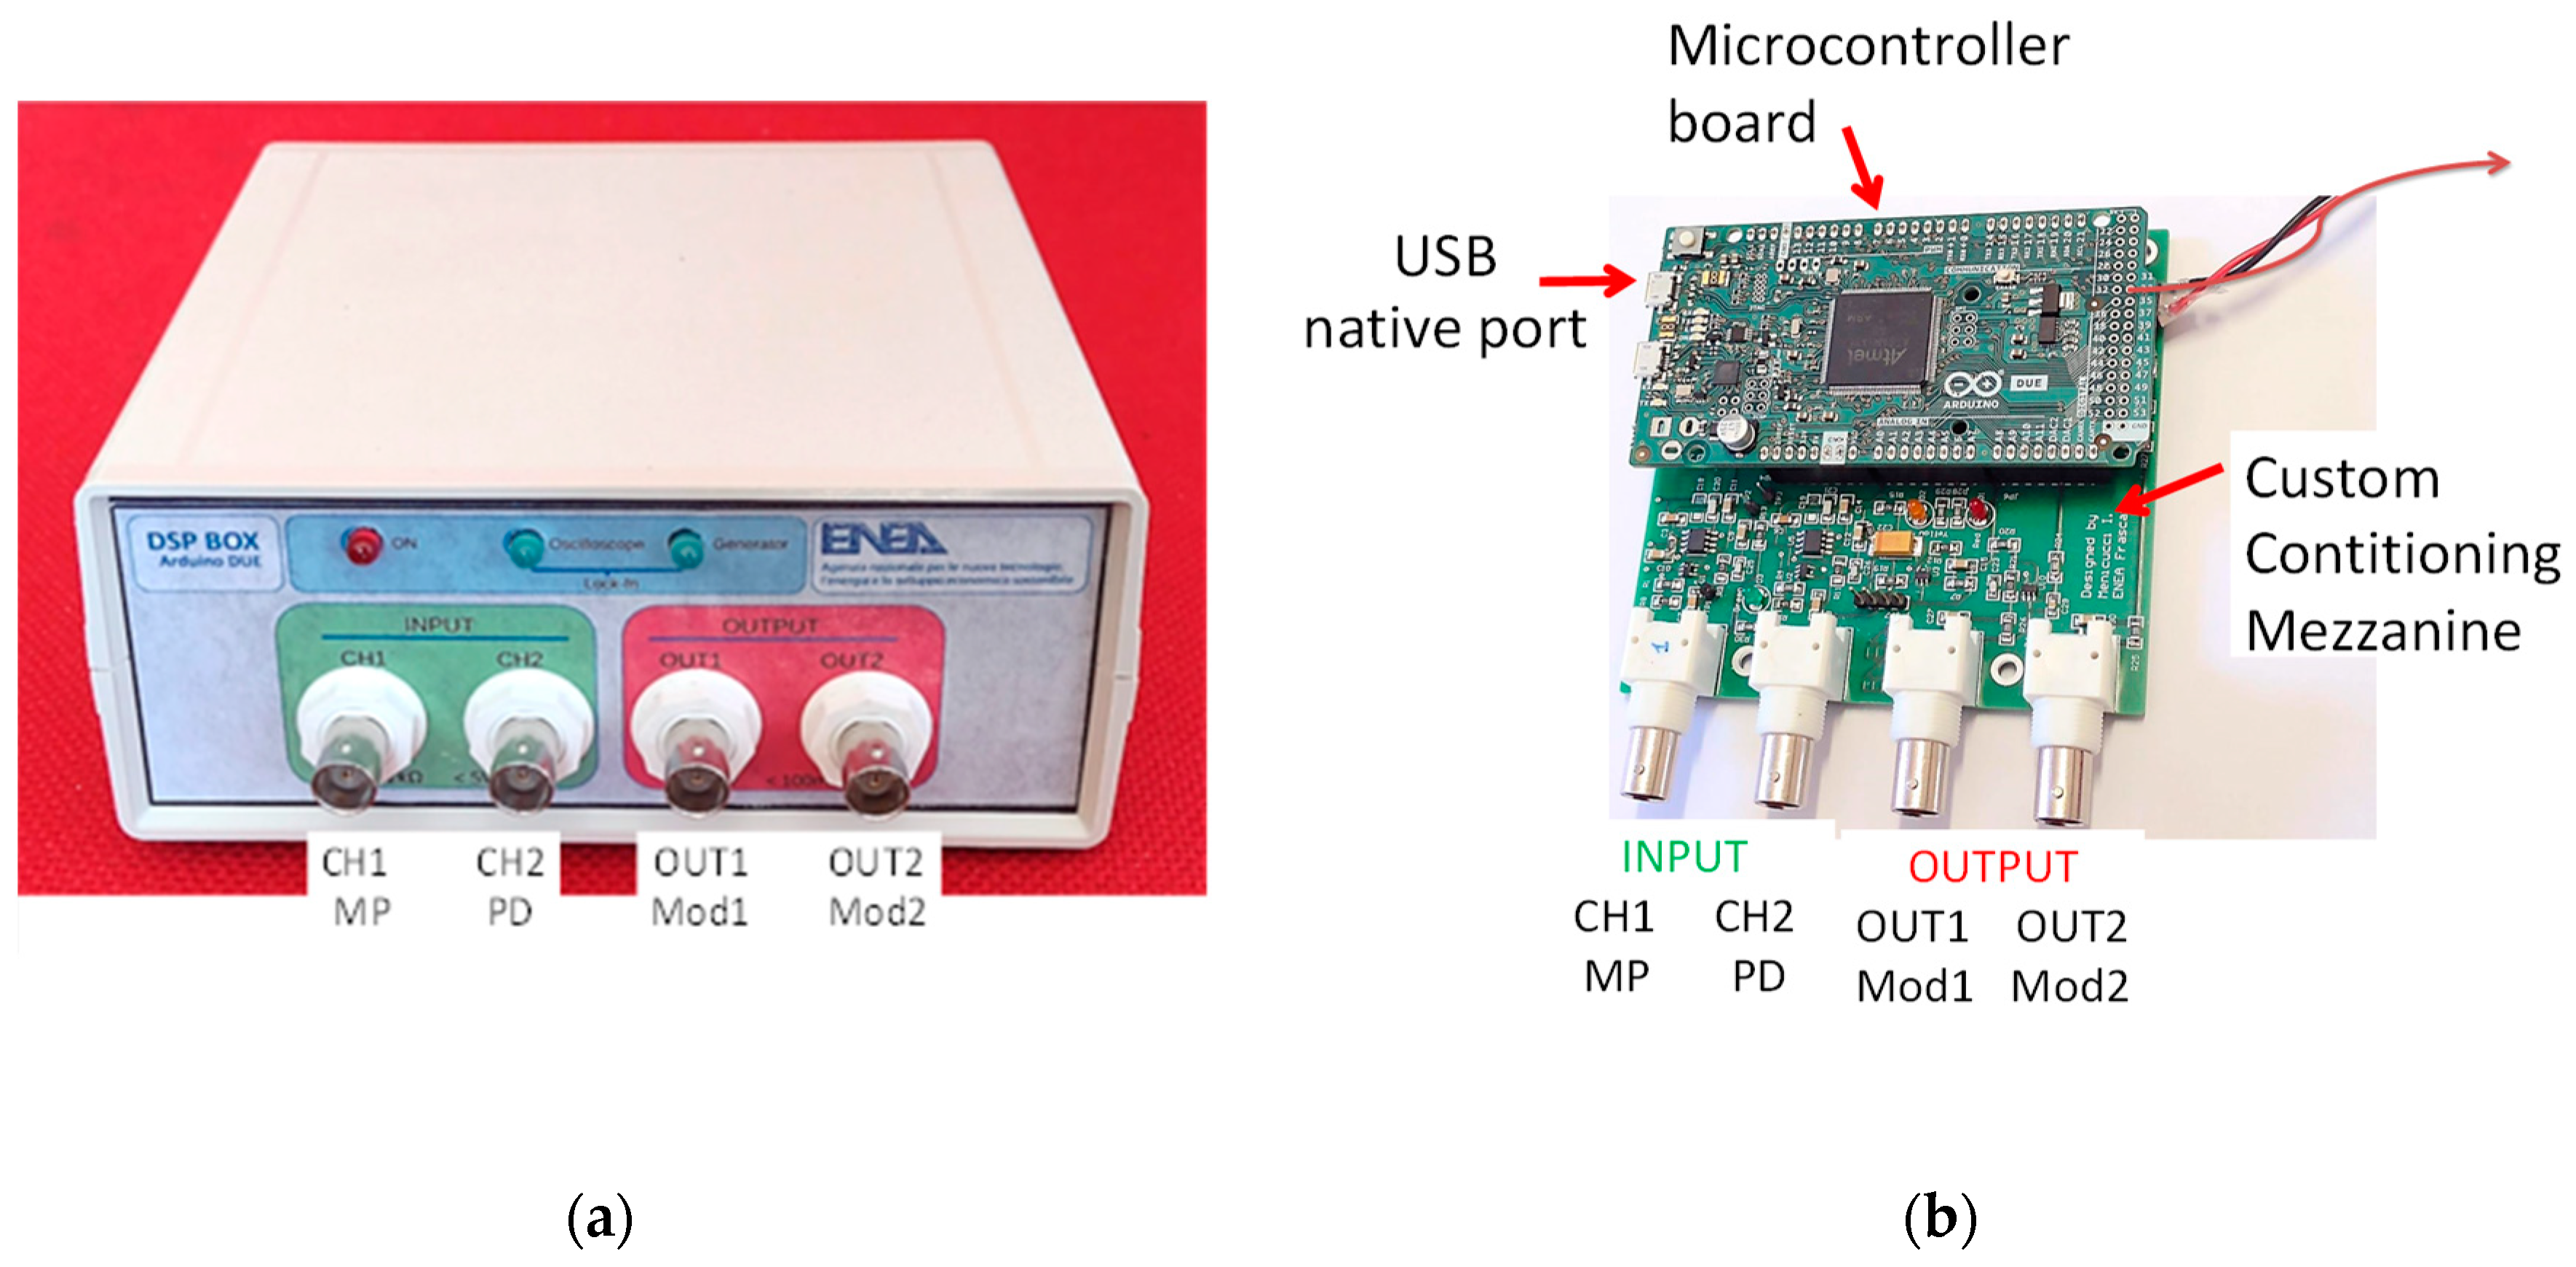
The ENEA DSP Box Due hardware consists of a microcontroller board and an Enea custom conditioning mezzanine. The technique used to implement the LIA functionality is fully-digital signal processing, similarly to the previous development [
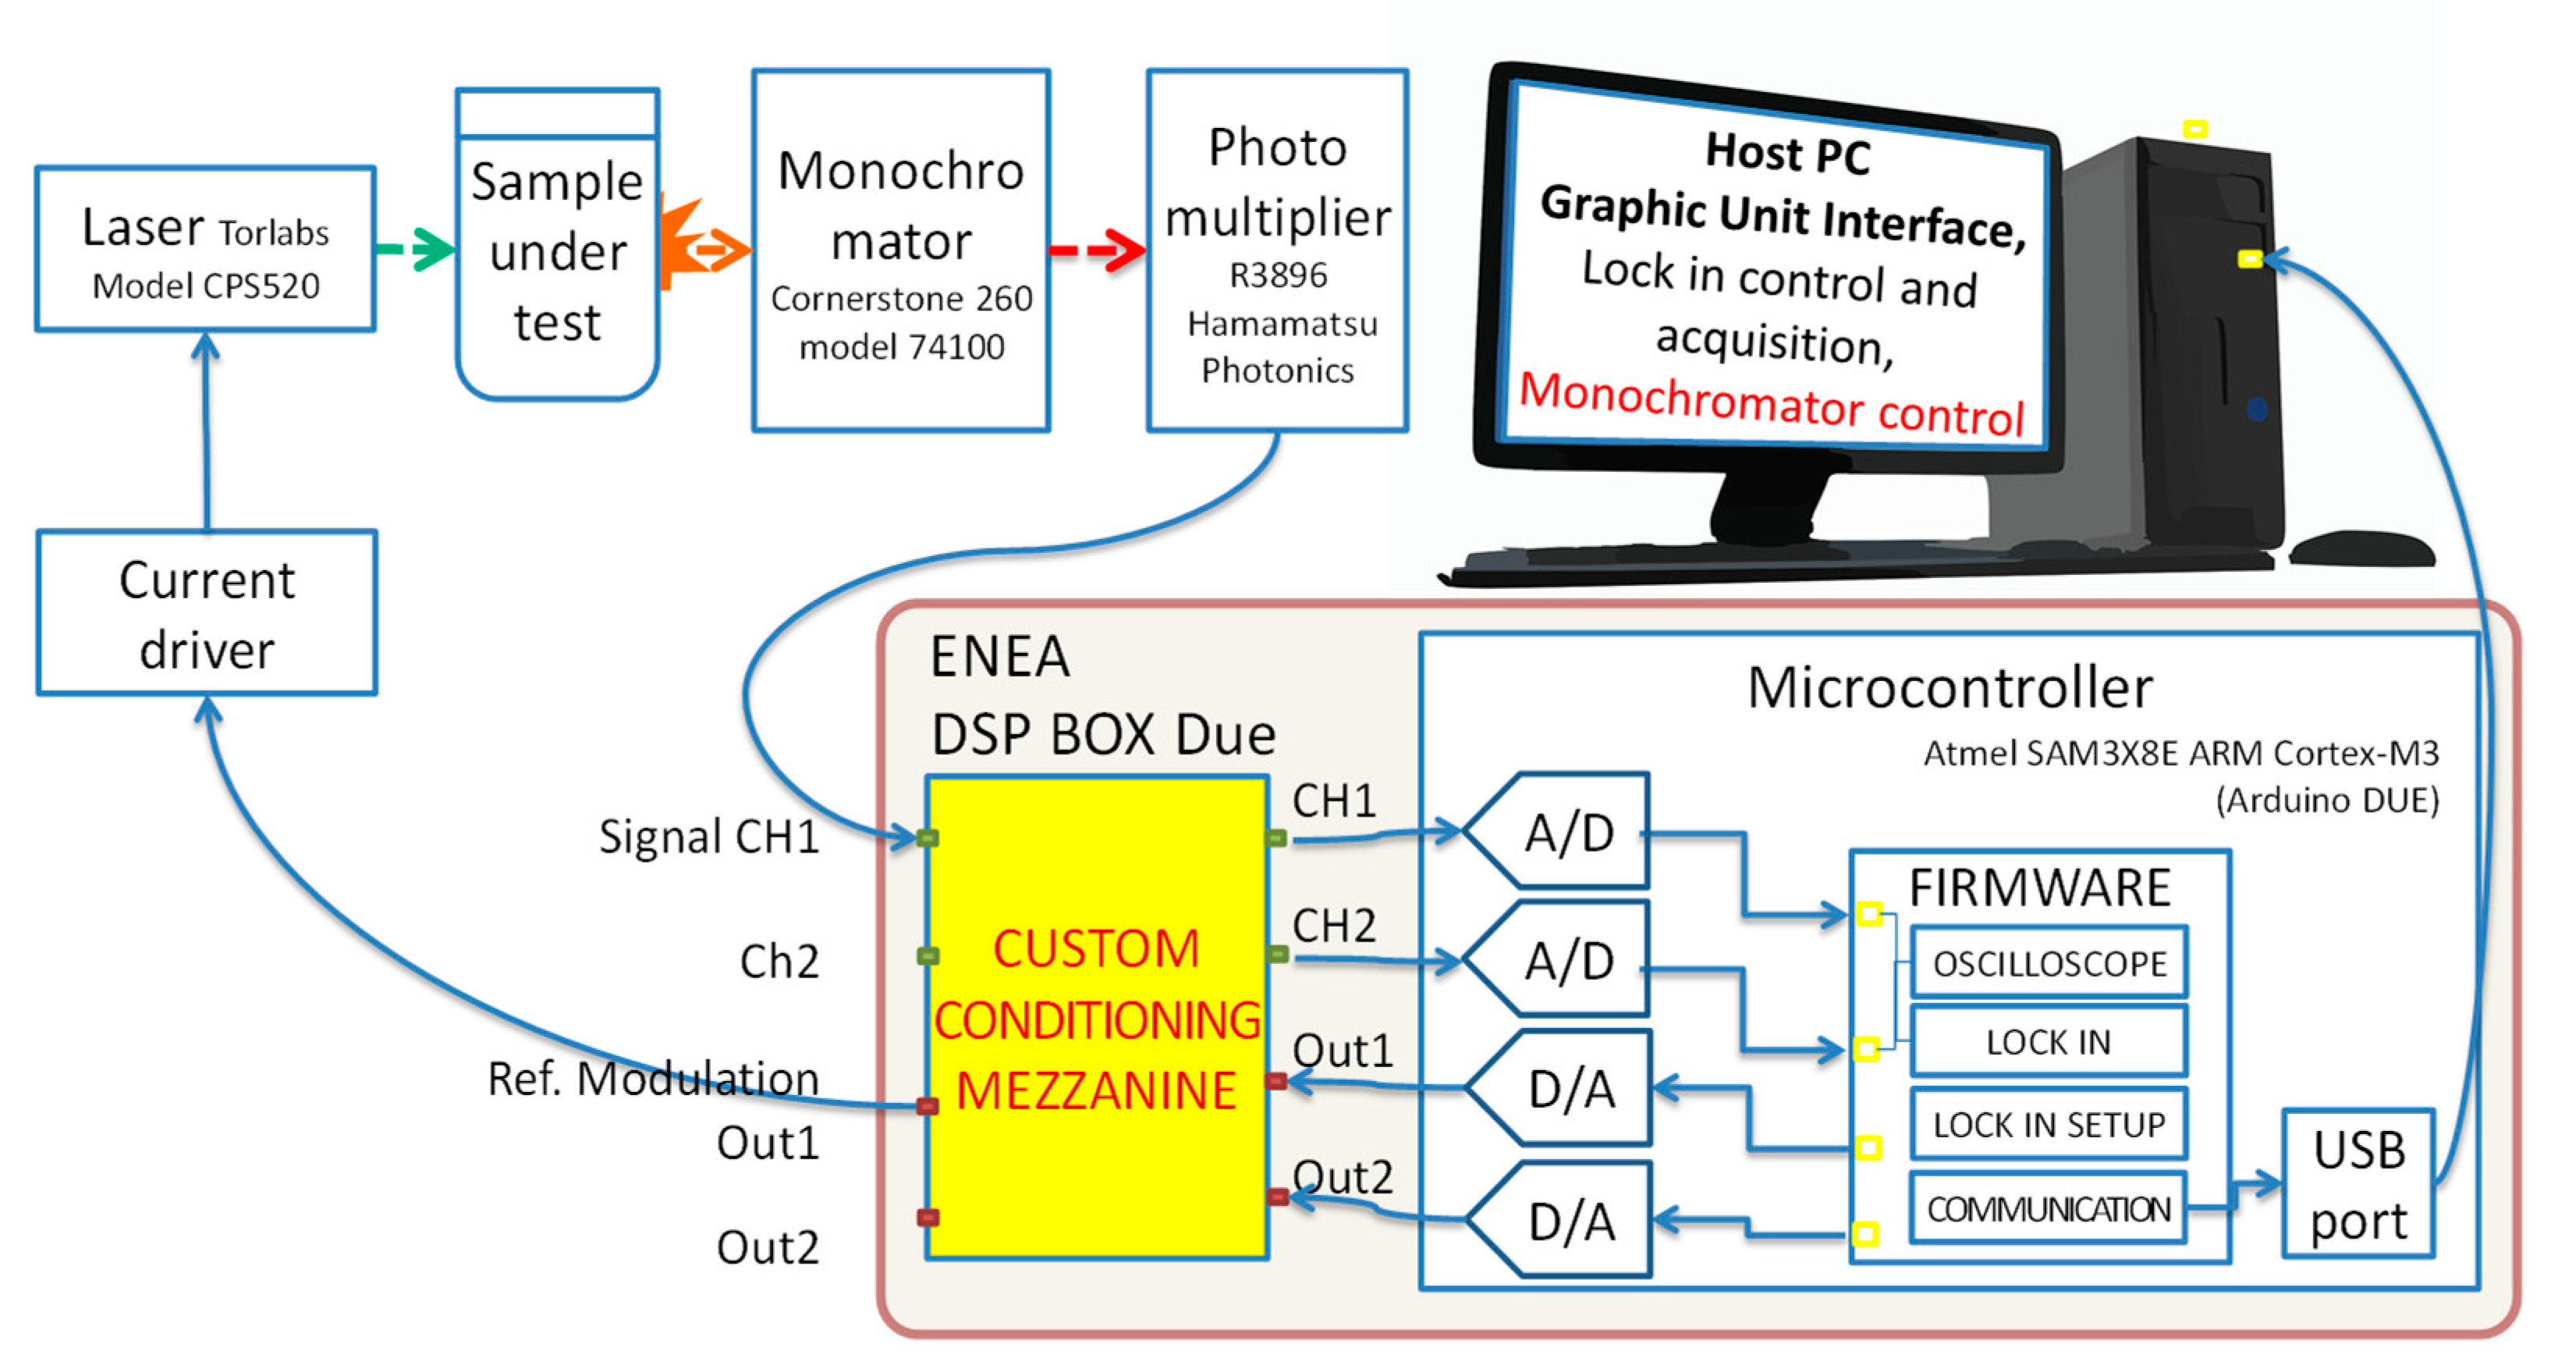
4]. The input signals are directly sampled and digitally processed by the microcontroller, reducing the problems of non-linearity, parameter variability, and filter implementation associated with analogue components (e.g. mixers). The microcontroller board (see
Figure 1) is the low-cost Arduino Due [
16], based on the 32-bit Atmel SAM3X8E ARM Cortex-M3 CPU microcontroller, having a 84MHz crystal-oscillator, 54 digital input/output pins (12 of which can be used as PWM outputs), 12 x 12-bits of resolution Analog to Digital Converter (ADC), 2 x 12-bits of resolution Digital to Analog Converter (DAC), 4 UARTs (hardware serial ports) an USB OTG capable connection.
The conditioning board consists of:
Two input channels CH1 and CH2
DC-block and a DC offset circuitry, necessary to pull up the input signal in case of negative signals, such as in the case of output from Photo Multiplier Tubes (PMTs),
Anti-aliasing low-pass filters,
Programmable Gain Amplifier (PGA model MCP6S21 ), necessary in the case of very low signal, outside the native range of the LIA,
Two output channels Out1 and Out2
2.2. Microcontroller Firmware
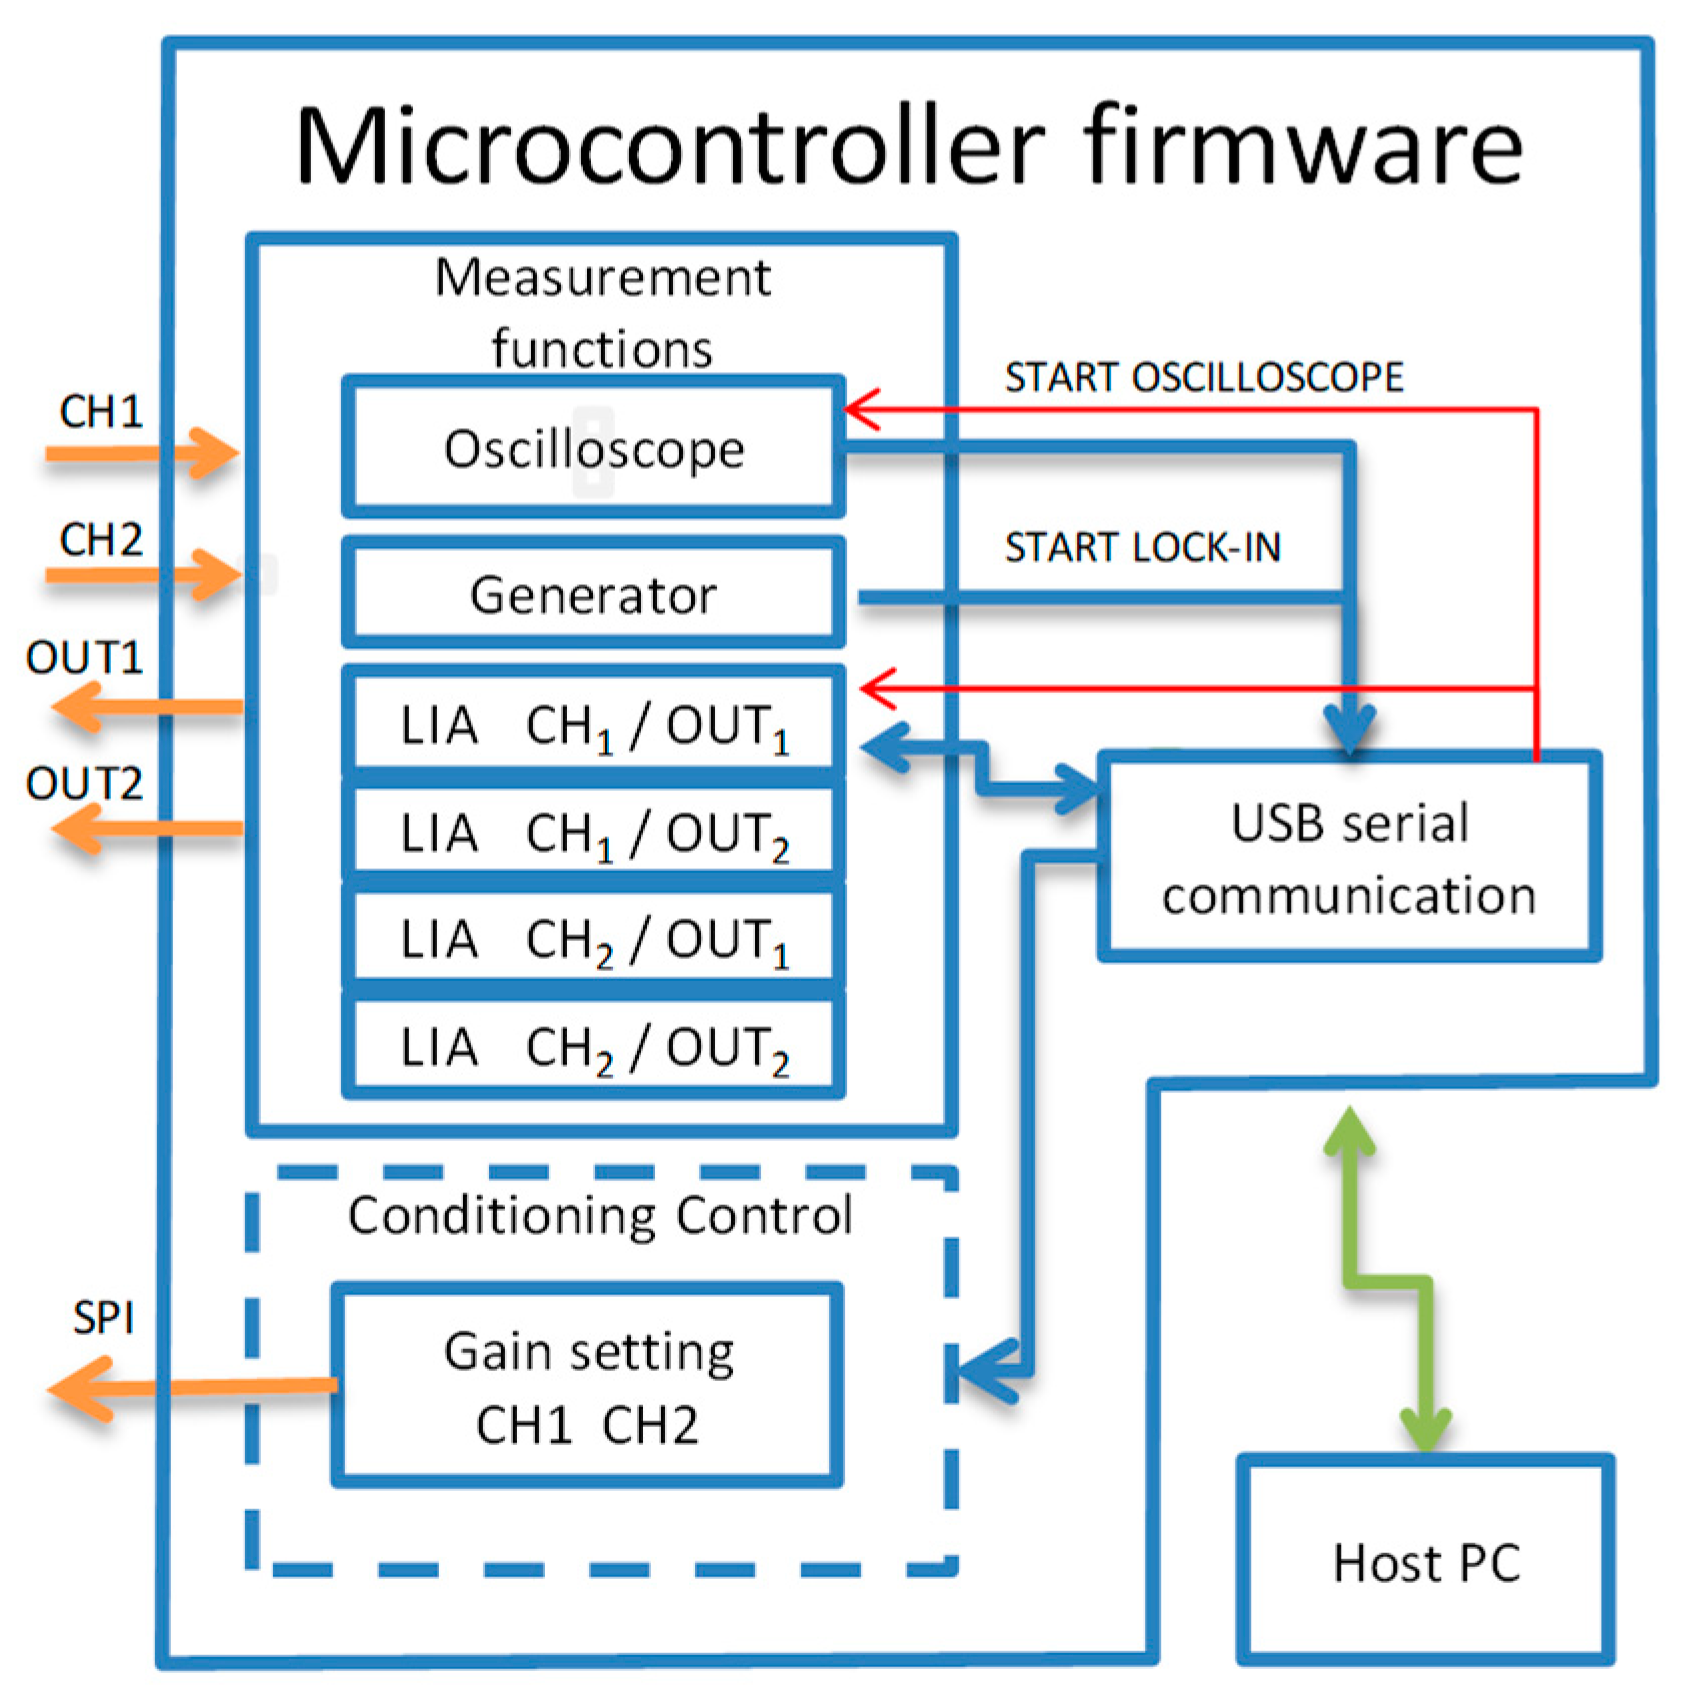
The firmware for the microcontroller (see
Figure 2 and
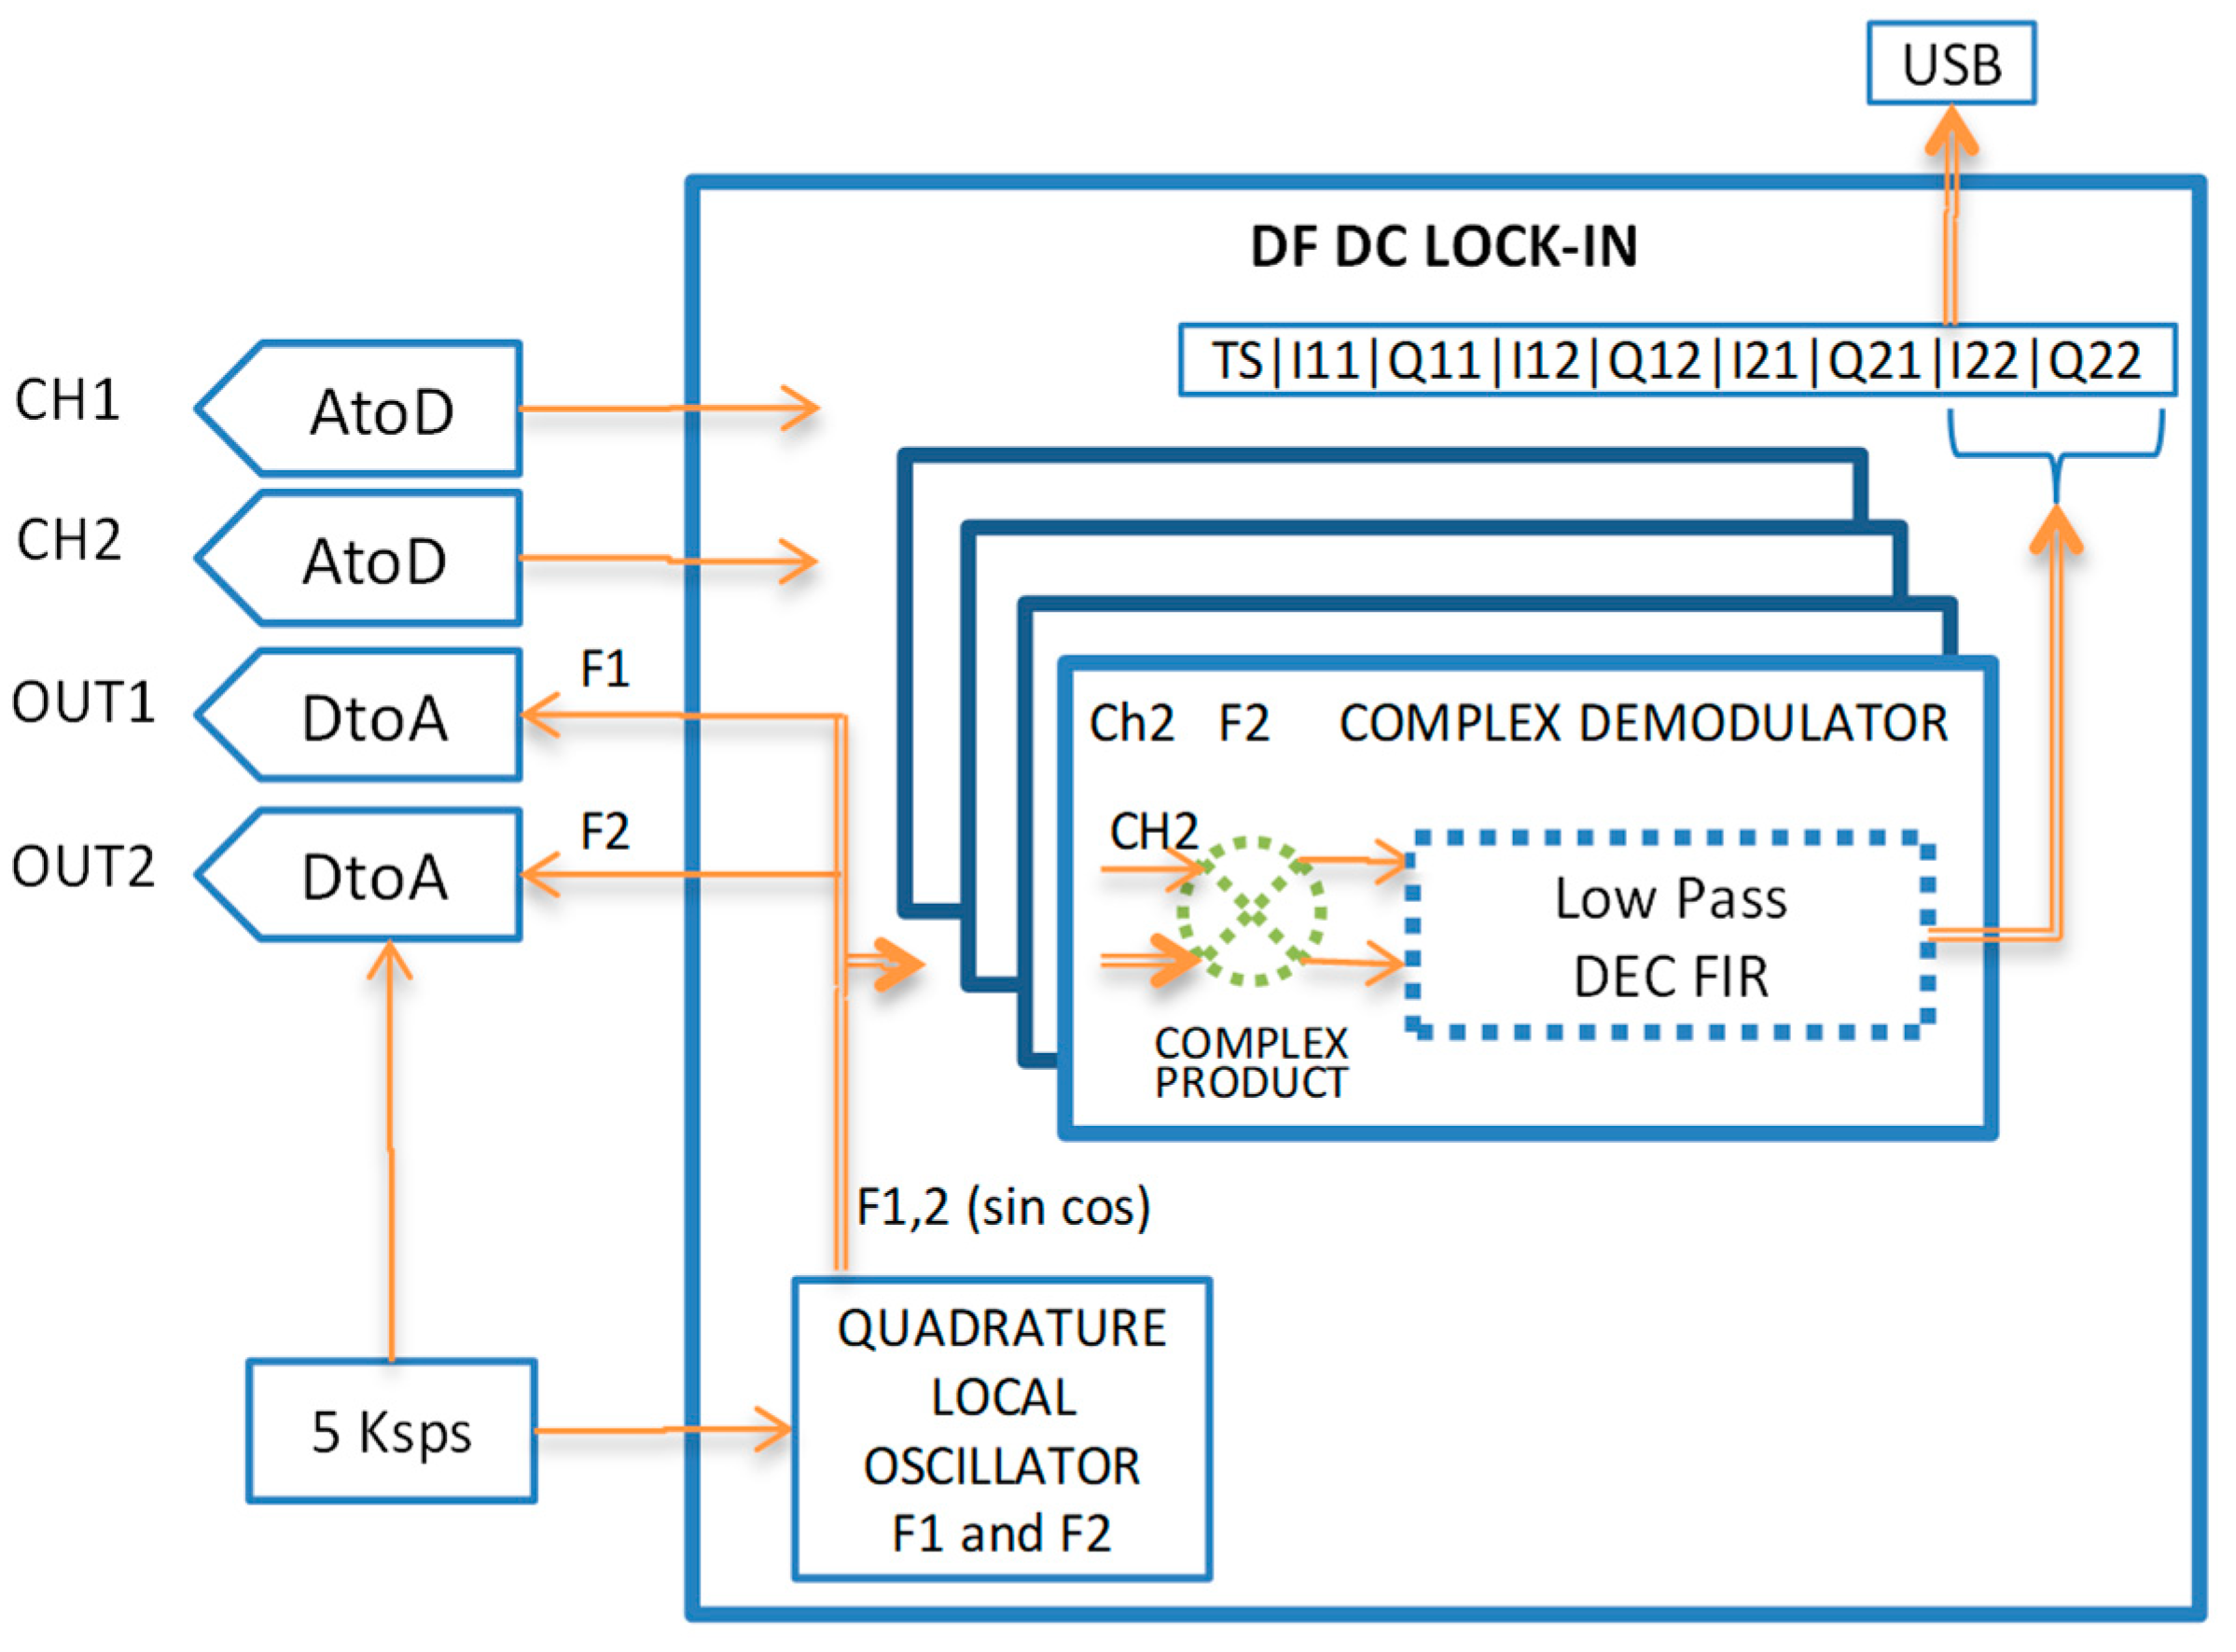
Figure 3) has been developed using the
Arduino IDE in C language and performs several functions:
Communication with the Host PC and PGA setup
Dual-channel oscilloscope
Dual channel generator
Quad LIA - frequency setting and measurements
Details of the functions listed above are given below:
Communication with the Host PC and PGA setup
The microcontroller board communicates settings and commands with the Host PC via Native (USB3 port) in serial protocol ( 250000 Baud ). Generic serial monitor software or the custom GUI described in section 2.3 must be installed on the Host PC. In addition, the microcontroller receives the desired settings for both PGAs from the Host PC and sends the SPI instructions to the PGAs on the conditioning mezzanine.
Dual-channel oscilloscope
The oscilloscope firmware acquires the CH1 and CH2 signals up to 10ksps. To guarantee the sampling rate, even in case of low throughput of the USB port, the microcontroller acquires the CH1 and CH2 signals and stores them in an array. When the array is full, the microcontroller stops the acquisition and sends the data to the host PC.
Dual channel generator
The generator firmware generates one sinusoidal signal for each output channel. The output frequency can be in the range DC-2.5kHz.
Quad LIA - frequency setting and measurements
The DSP Box Due implements the LIA algorithm in a digital way, similar to other FPGA-based designs [
1,
2,
3,
17], but the decision to use a microcontroller board instead of an FPGA board reduces the cost, the development, and the time required for possible upgrades.
The DSP Box Due generates two synthetic sinusoidal signals at the frequency F1 and F2, on channels Out1 and Out2, respectively. These two outputs are the reference signals for the DF-DC-LIA. The microcontroller firmware implements, for each input channel (sampled at 5ksps) and for both frequencies F1 and F2, a real-time quadrature demodulation with fully digital signal processing (see
Figure 3). A record containing the time stamp and the four complex components obtained by demodulating the input signals is sent to the
Host PC via the USB port.
2.3. Host PC Software and User Interface
The
Host PC is connected to the microcontroller board via USB port in serial protocol (
Figure 1 and
Figure 2). The microcontroller receives command strings (e.g. start_oscilloscope <<sampling freq>> or Lock_in_D_M <<Acq time, freq_Out_1 freq_Out_2, output_average) and responds by sending the relative Ch1/Ch2 acquired data, the Quad-LIA measures or acknowledges the setup operations to the
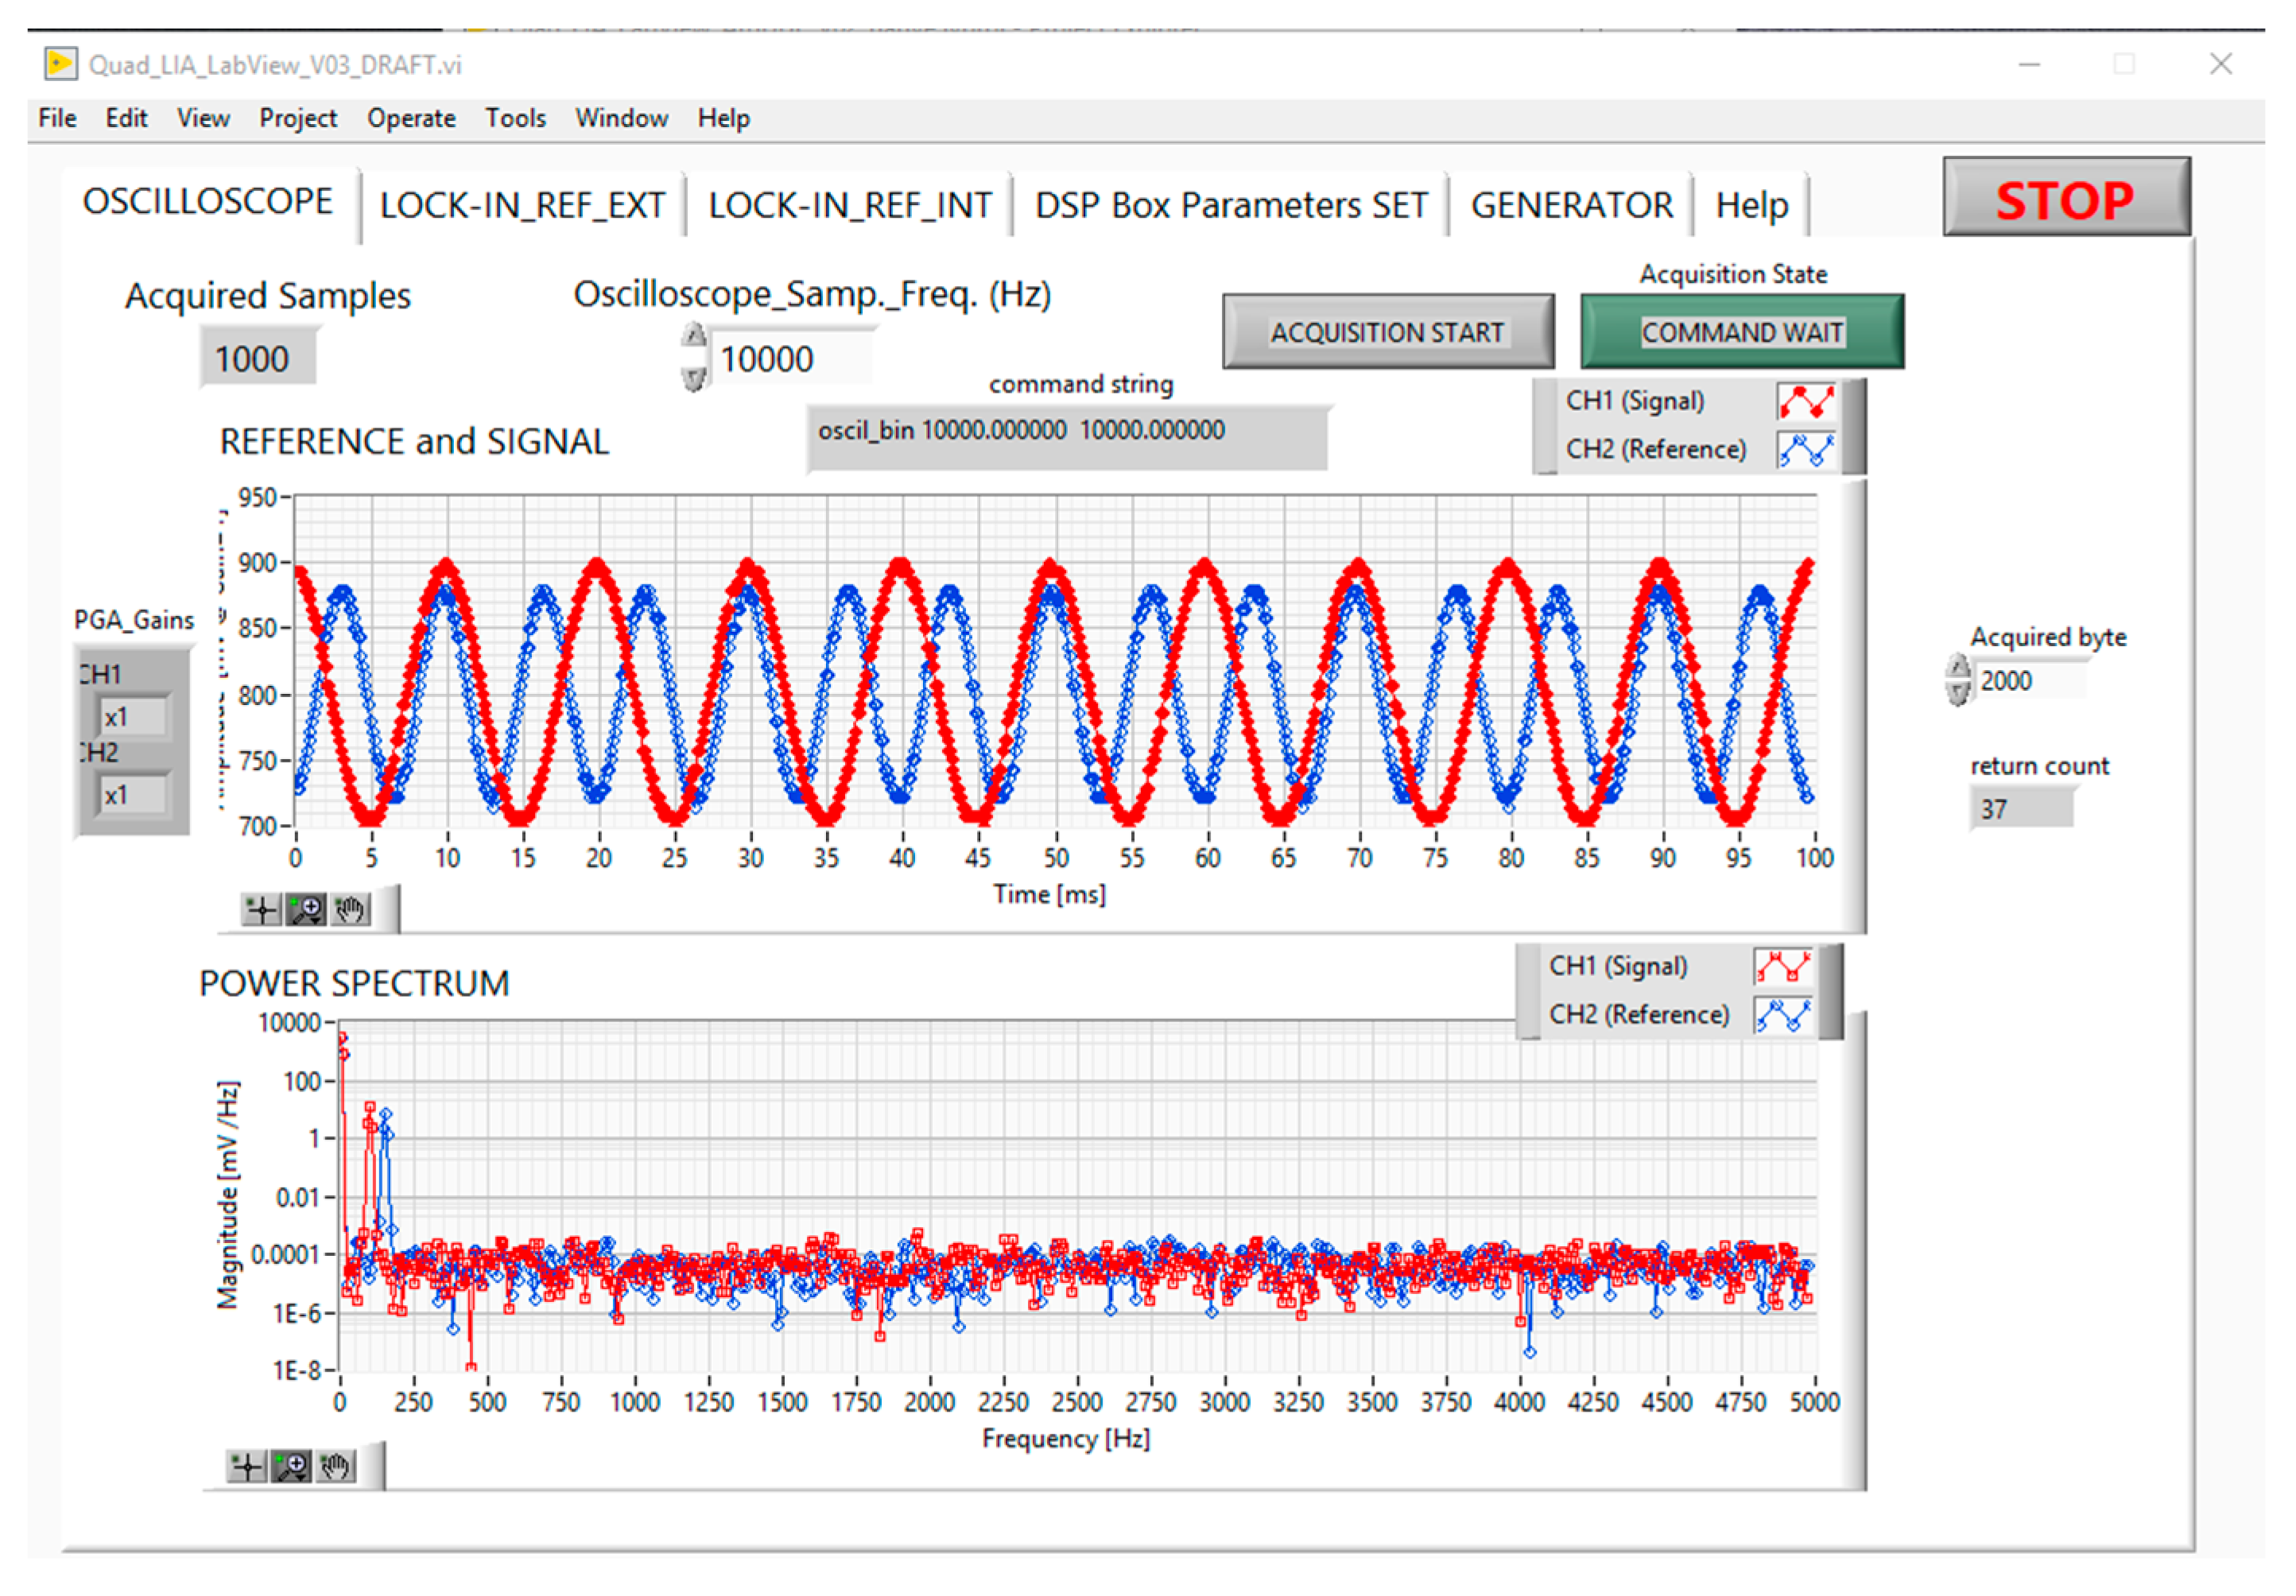
Host PC. It should be noted that the command strings can be sent to the microcontroller in command-line interface mode using generic software. In the present case, an easy-to-use Graphical User Interface (GUI) has been developed in the LabVIEW environment.
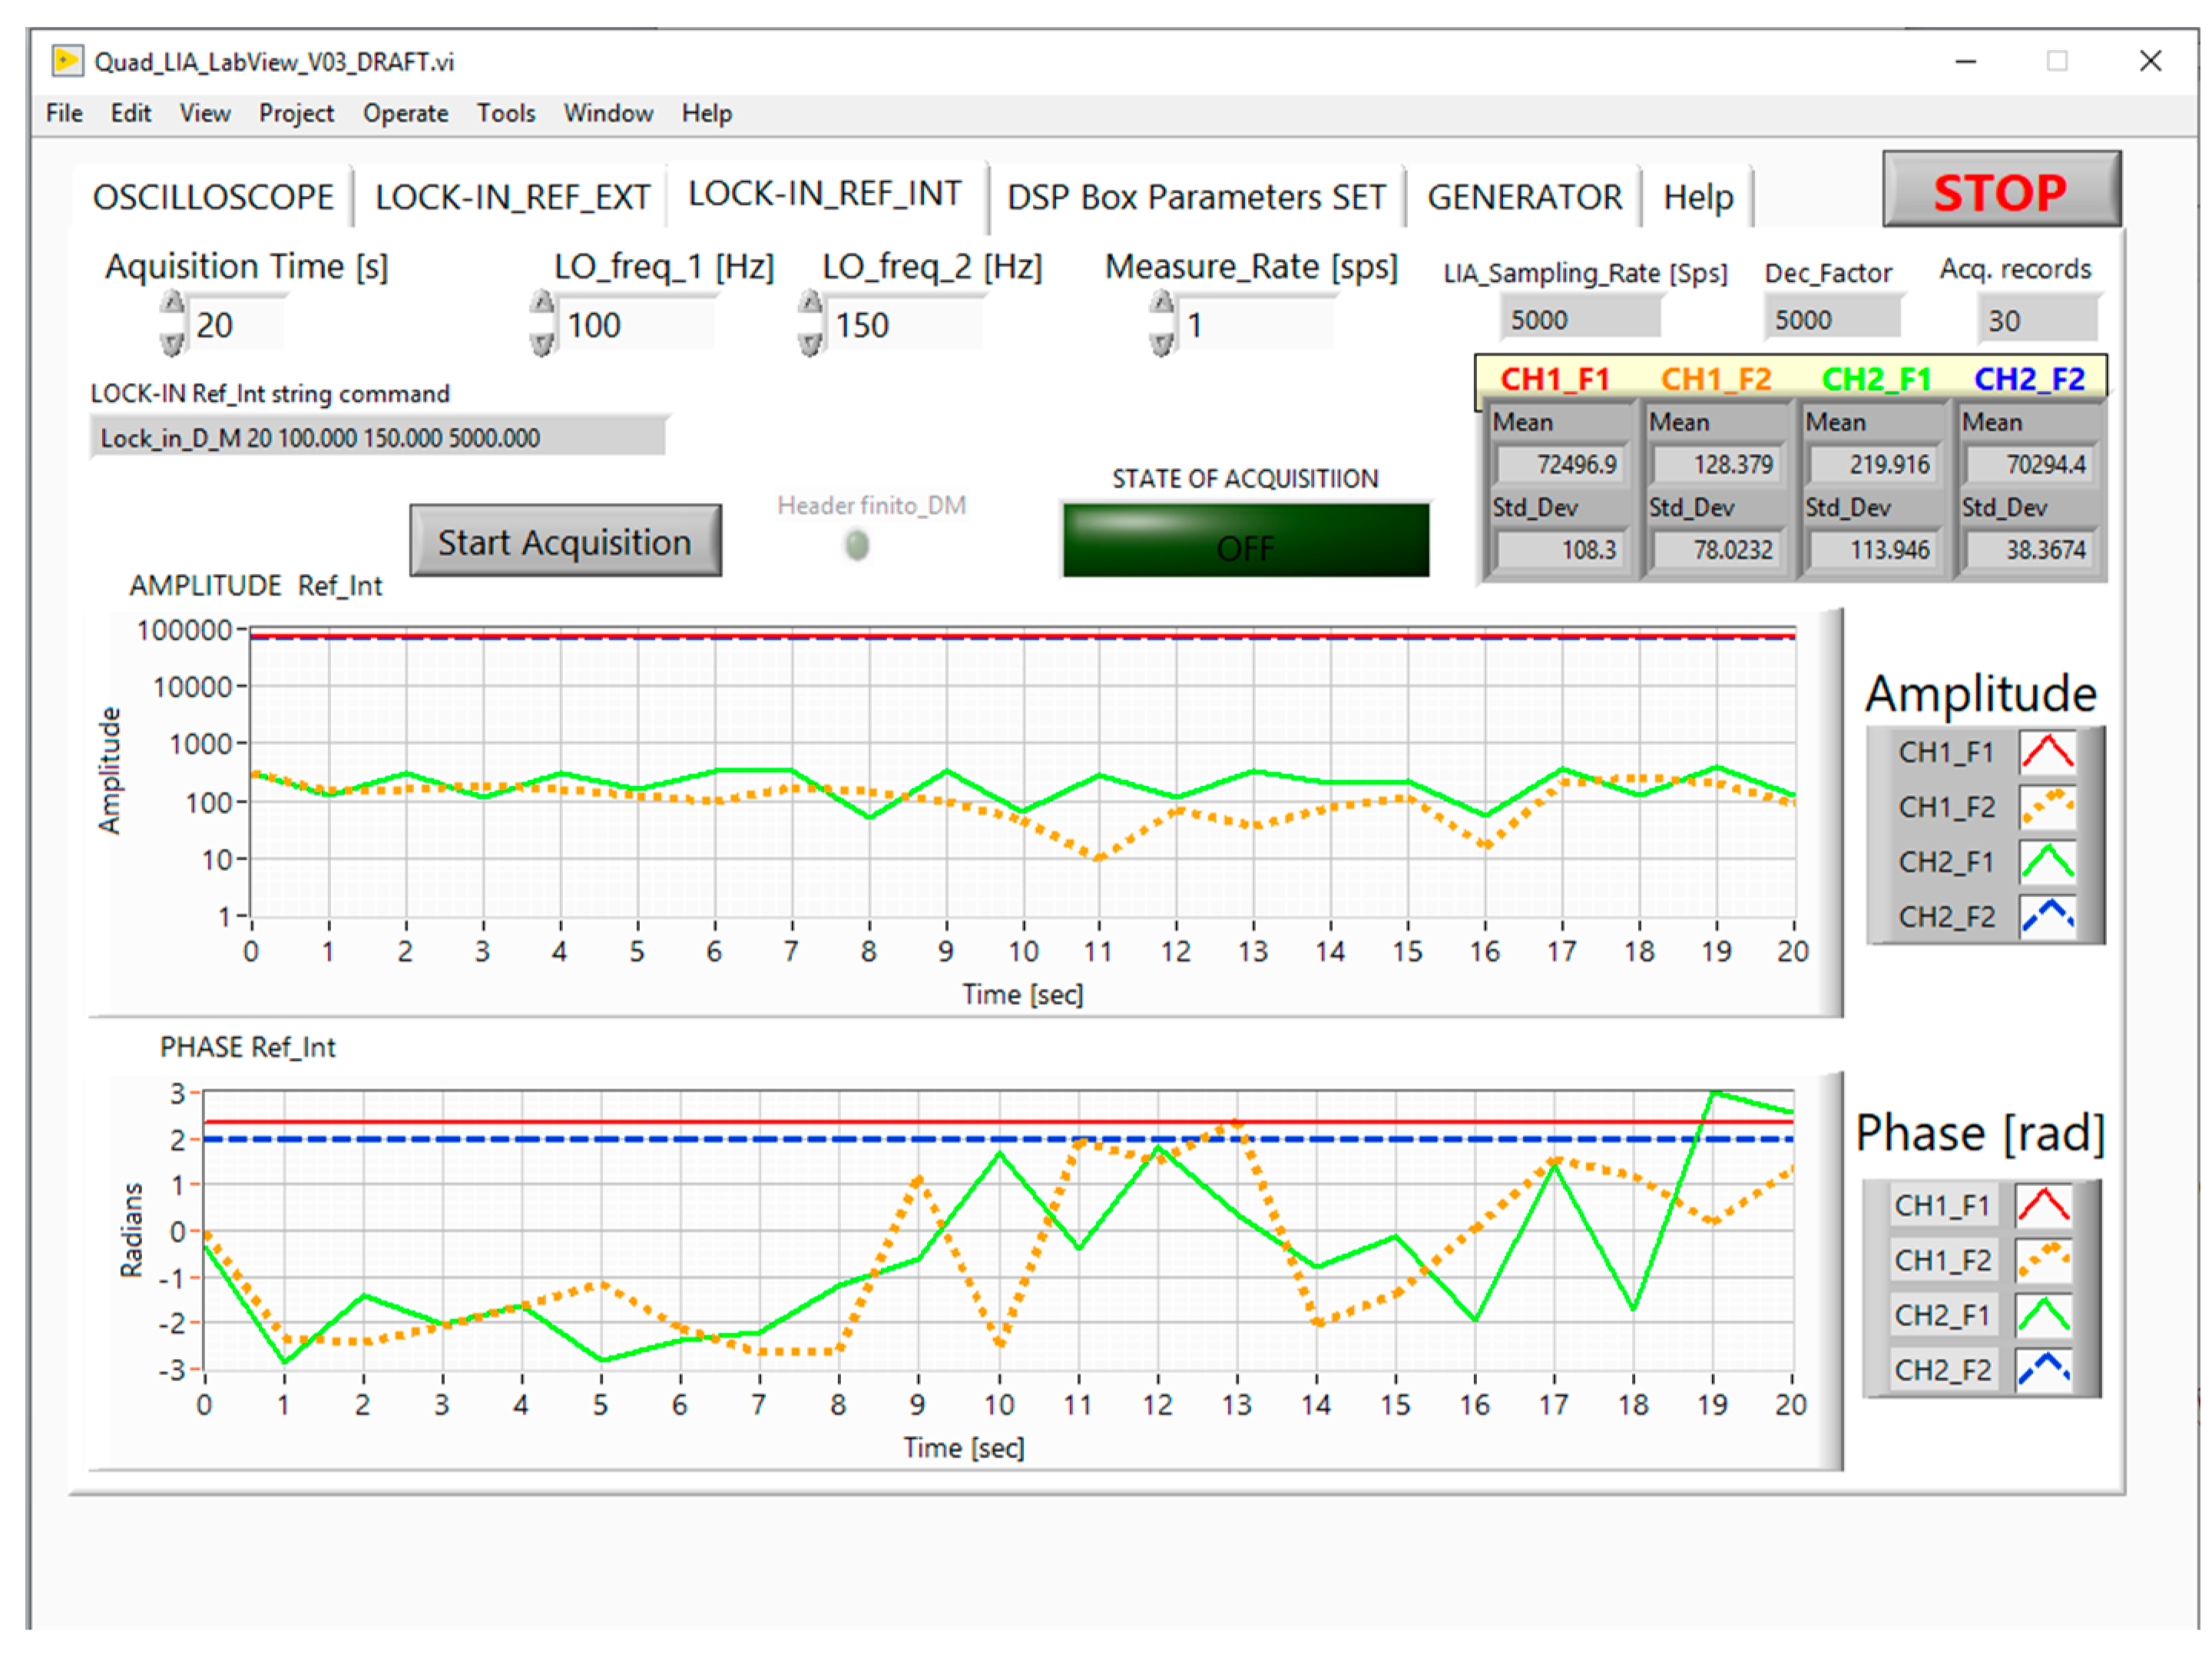
Figure 4 and
Figure 5 show the GUI for the Oscilloscope and Quad-LIA functions.
2.3.1. Oscilloscope GUI
Although the Quad LIA is the main function of the DSP Box Due, in order to check the input noise or the amplitude of the signal, an oscilloscope function has been implemented in the DSP Box Due. In particular, the Oscilloscope tab of the GUI turns the DSP Box Due into a two-channel oscilloscope with a sampling frequency of up to 10Ksps, and an input channel with variable gain (1, 2, 4, 5, 8, 10, 16 and 32 V/V).
Figure 4 shows the acquisition of two sinusoidal signals acquired at 10ksps, having different amplitudes and frequencies Ch1 (red curve) 200mVpp 100Hz and Ch2 (blue curve) 150mVpp 150Hz.
2.3.2. Quad-LIA GUI
Figure 5 shows the GUI for the Quad-LIA function. The input channels CH1 and CH2 are connected to the reference channels Out1 (100Hz) and Out2 (150Hz) respectively. In this case, the measured amplitudes CH1_F1 and CH2_F2 are at the high level (about 70000-72000 a.u.), unlike the amplitude of the crossed values CH1_F2 and CH2_F1 (less than 220 a.u.). In this arrangement, the phase for CH1_F1 and CH2_F2 is fixed, whereas the phase for CH1_F2 and CH2_F1 is almost chaotic, in agreement with theory.
2.3.3. Synthesis of Red Emitting Carbon Dots
The Red Emitting Carbon Dots (RECDs) for fluorescence measurements were prepared by using a standard one-step hydrothermal procedure, reported earlier [
18] with a slight modification. Briefly, an aqueous solution of the precursors in a ratio of (citric acid and urea = 1:2) was prepared in DMF (N-N, Dimethylformamide) solvent. Likewise, 4 g citric acid and 8 g urea were dissolved in 40 mL DMF solvent by sonication followed by heating at 180 ºC for 4 h in a 100 mL Teflon-lined stainless-steel autoclave. After natural cooling down of the reactor, the obtained product was then mixed with the 80 mL ethanol and centrifuged at 4500 rpm for 20 minutes to wash away the residual solvents and small organic molecules, the washing process was repeated twice.
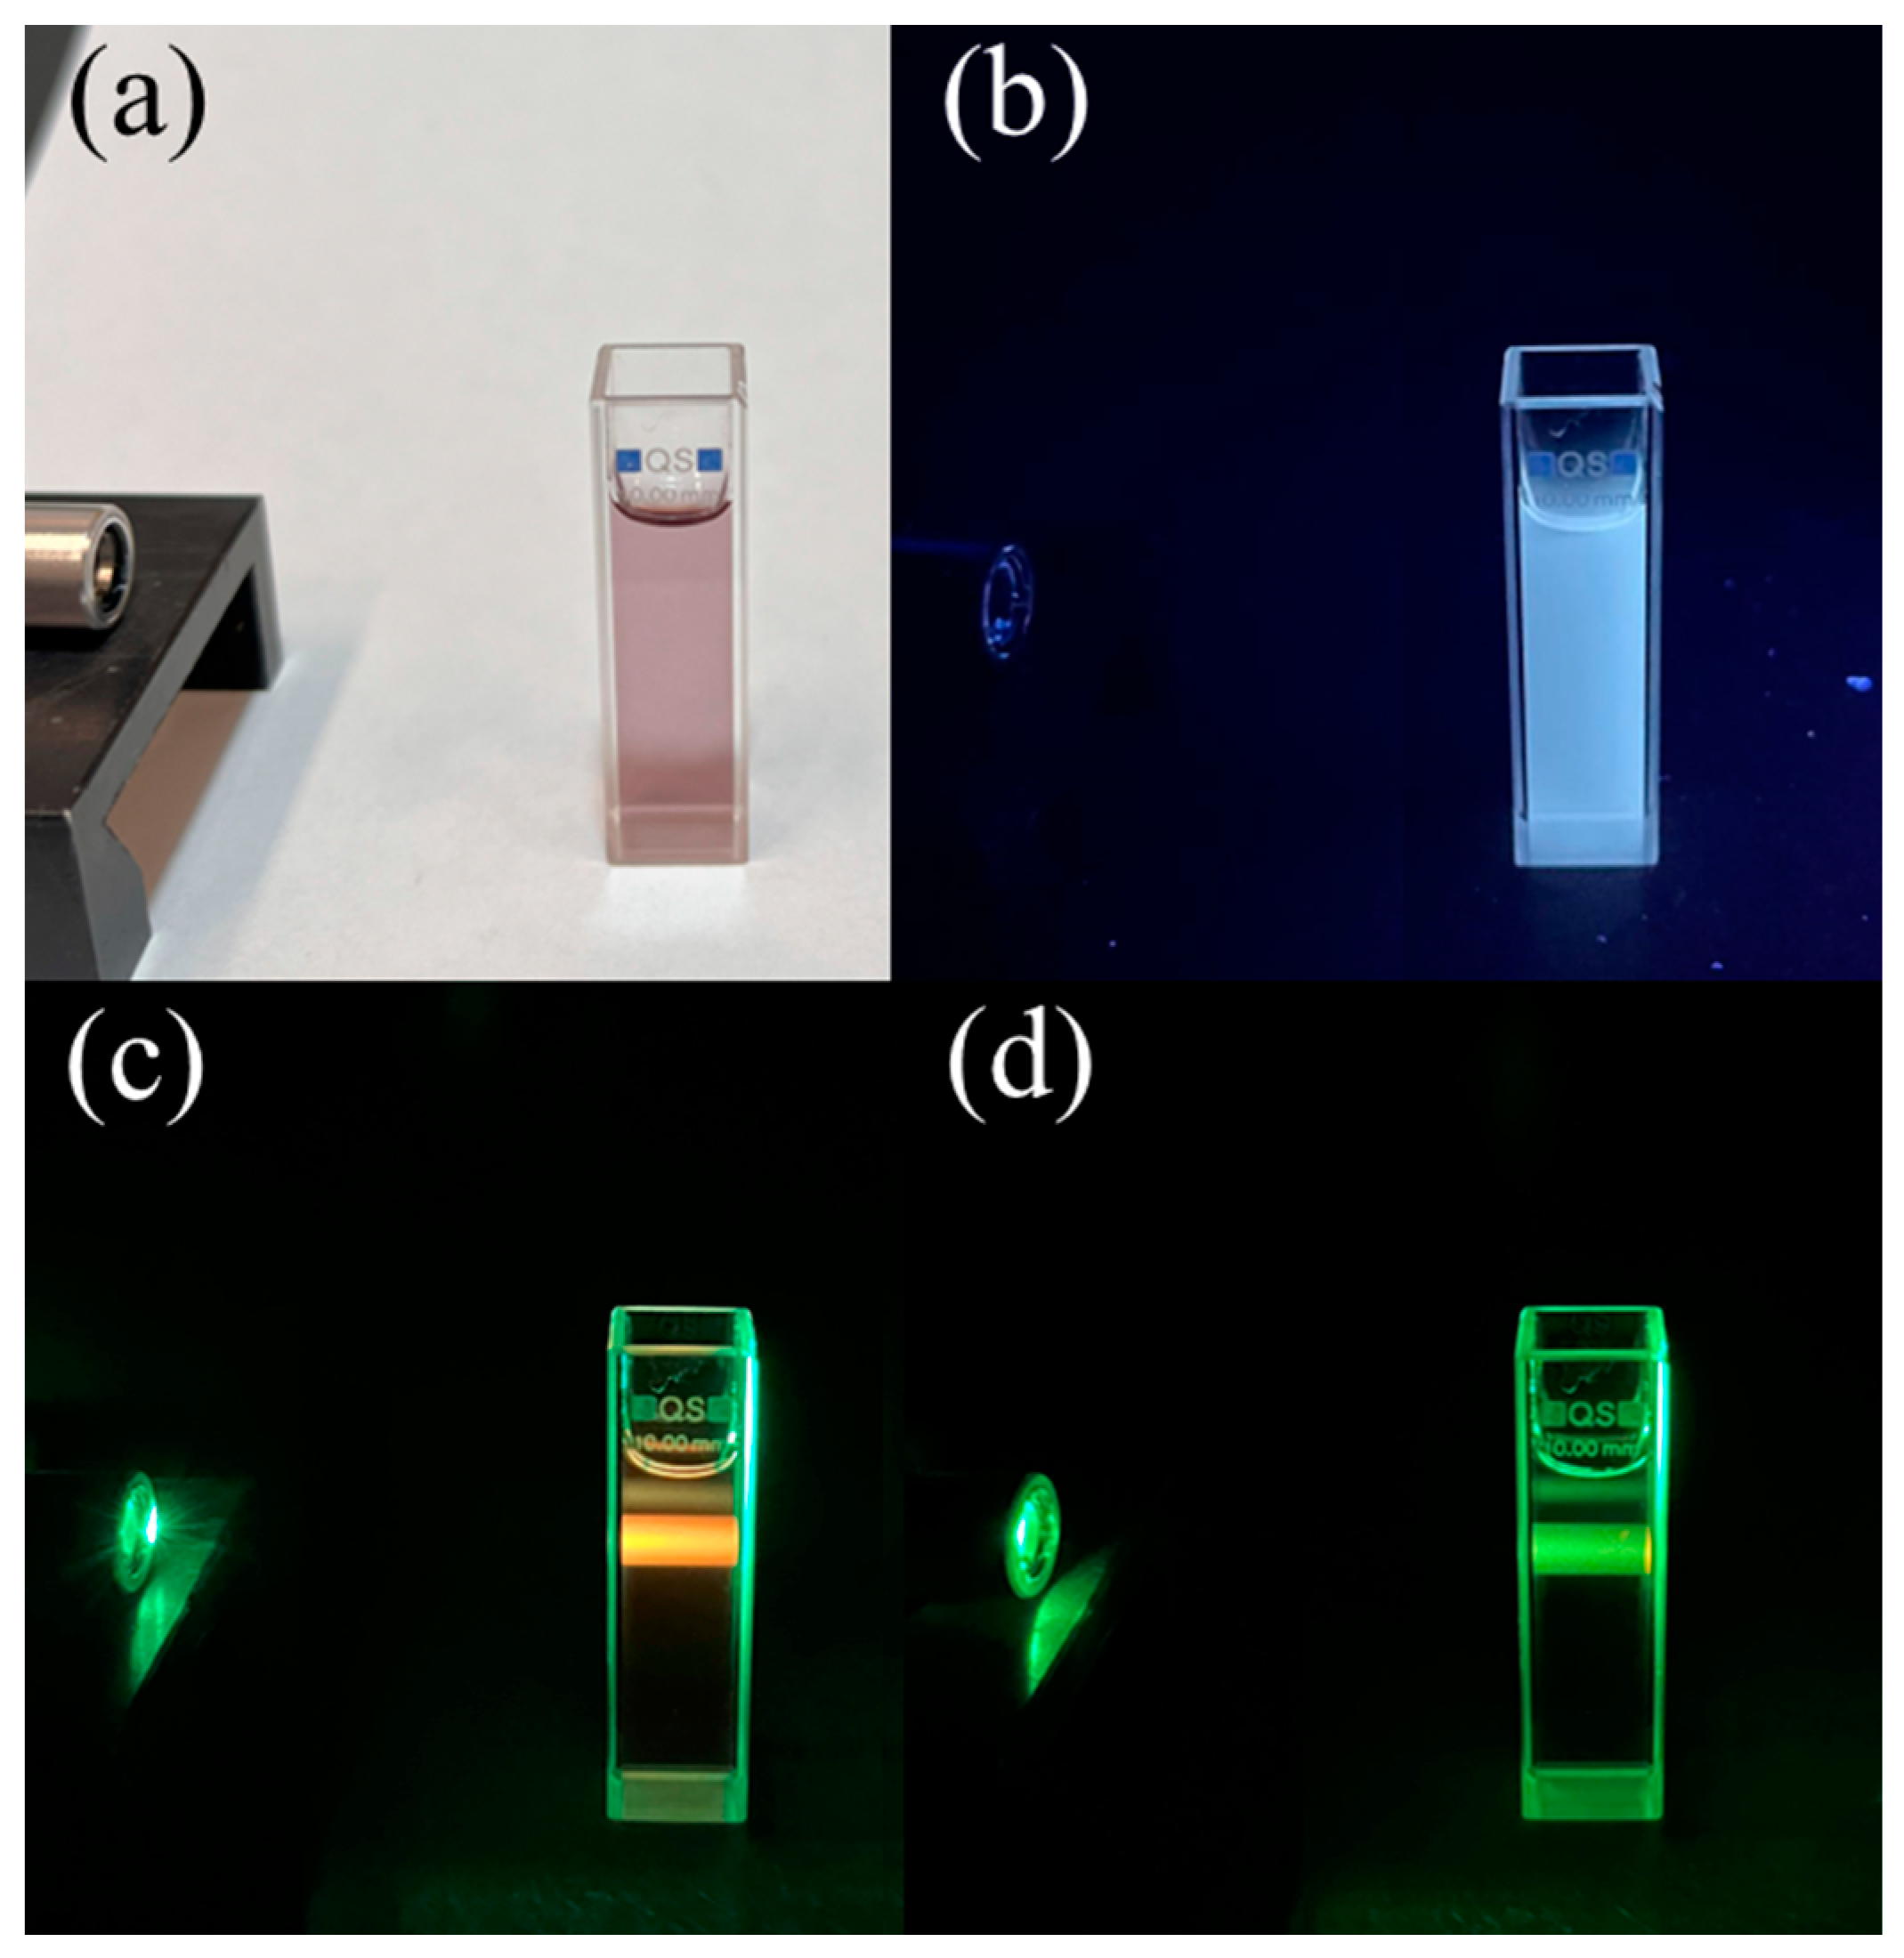
The resulting dark brown colored product has an additional fluorophore in the green region together with the red ones, which were eliminated by dissolving the precipitate in sodium hydroxide solution (50 mg/mL), sonication for 15 min and centrifugation at 4500 rpm for 30 min followed by washing with DI water. Afterward, the collected precipitate was further dissolved in hydrochloric solution (5 wt %), sonicate for 15 min and centrifuged at 4500 rpm for 30 min. The obtained black colored precipitation was re-dissolved in DI water and centrifuged at 4500 rpm for 30 min 3 times to remove residual hydrochloric acid. The precipitate was dried at room temperature in desiccator, re-dissolved in DI water and stored in freeze at 4 ºC as a stock solution for the following experiments. The sensing solution was prepared immediately before the tests by diluting the stock solution in DI water 1:100 in volume and appeared in white light as a transparent liquid with a slight purple color (see
Figure 6a). Under UV light the sensing solution emitted a white fluorescence (
Figure 6b) which became red under 520-nm excitation (
Figure 6c).
The sensitivity tests in water were carried out as follows. First, 1 mL of de-ionized (DI) water was mixed with 1 mL of RECDs-sensing solution by gently stirring for 20 s in order to prepare the reference (blank) solution, which was then used to record the reference fluorescence intensity. Then, the typical sensing experiment was performed in the presence of a heavy metal (HM). This was accomplished by mixing 1 mL of the specific copper solution in DI water at the proper ion concentration with 1 mL of RECDs-sensing solution, gently stirring for 20 s and then recording the sample fluorescence spectrum.
3. Experiments and Results
3.1. LIA Electrical Testing and Characterization
The main application of the ENEA DSP Box Due is the Quad-LIA functionality. In particular, for the Dial Pass application, the outputs of one or both channels (OUT1 and/or OUT2) are the reference for the laser modulation while the signals coming from the photodetector and/or the microphone are connected to the input channels CH1 or CH2 and demodulated with respect to the reference frequencies.
In the previous implementation of fully-digital low-frequency lock-in amplifier [
4], the LIA received both Reference and Signal as inputs to the system. In the present version of the ENEA DSP Box Due, the most relevant use of the LIA is within the
"internal reference" configuration. In this case, the reference sinusoids (synthetically generated by the DSP Box Due and output from OUT1 and OUT2) can be the input for the laser drivers, while the external signals CH1 and CH2 are the input for the DSP.
For this reason, we focused the characterization of the DSP Box Due LIA on the relationship between the measured amplitude and the input amplitude, by connecting the generic output OUT1/OUT2, to a resistive voltage divider and sending the output of the voltage divider as an input to channels CH1/CH2.
In such way, it is possible to obtain LIA input signals with different amplitudes but synchronized with the internal reference.
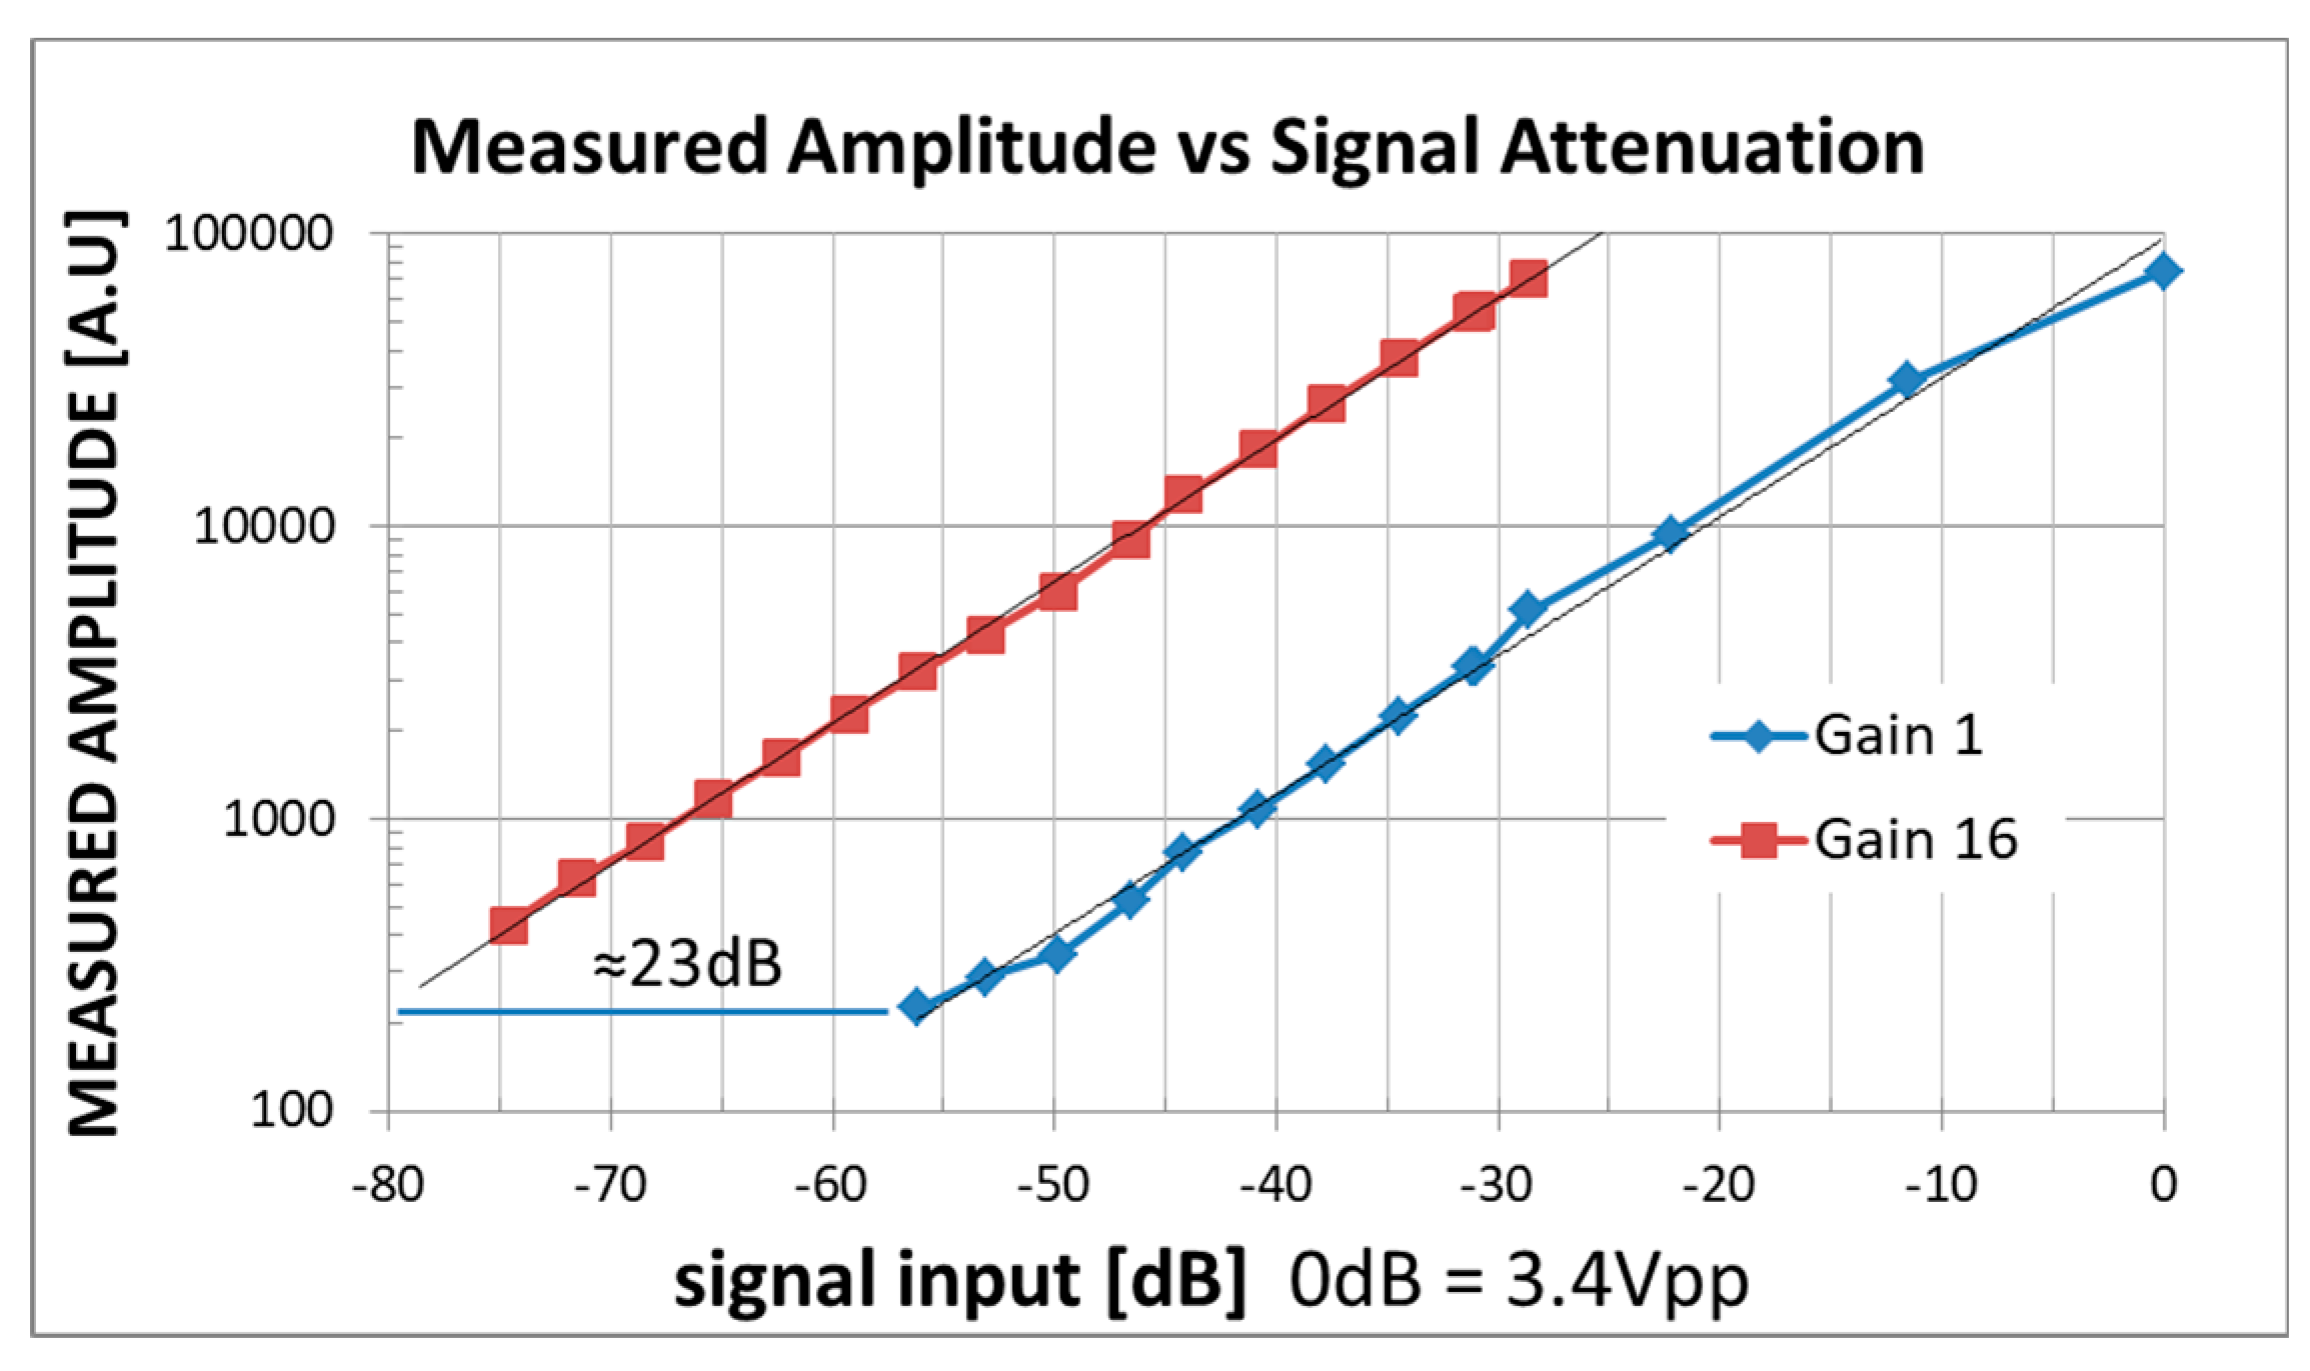
In particular, by varying the amplitude of the input signal, the relationship between the input signal and the measured amplitude has been measured (see
Figure 7).
Figure 7 shows the Measured_Amplitude vs the Signal Input Level at two PGA Gain settings (Gain=1 blue line and Gain=16 red line). The horizontal distance between the two interpolating lines is about 23dB, very close to the theoretical value 20∙log
10(∆Gain = 16)=24dB. As shown in
Figure 7, considering the use of the PGA, the DSP Box Due LIA provides coherent measurements in the input range from 0dB=3.4Vpp to -75dB ≈ 0.60 mVpp, which can be considered a good result also in relation to the low cost of the DSP Box Due. In fact, in the current version, the input bandwidth of the LIA is limited by the sampling rate to 2.5 kHz, while the maximum measurement output rate is 10sps; however, this is not a limitation for our applications.
3.2. Application to Photoluminescece Measurements
The ENEA DSP Box Due was also applied to the detection of the fluorescence signal in a sensing experiment for the presence of heavy metal ions in water. First, the performance of the DSP Box Due was compared to that of a commercial analog lock-in amplifier (Stanford Research 520) by using a standard laboratory setup [
19] for fluorescence measurements. This setup was equipped with a cheap 5V-powered laser diode (CPS520, Thorlabs, Milan, Italy) as light excitation source, an emission 25-cm monochromator (Cornerstone 260, Oriel Corp.) and a R3896 photomultiplier (Hamamatsu Photonics K.K.) for fluorescence detection (see
Figure 8).
A volume of 2 ml of water solution of red-emitting fluorescent carbon dots (RECDs) was used as the sensing medium and held in a fused-silica cuvette for excitation by the laser light. The fluorescence emission spectrum of the RECDs is reported in
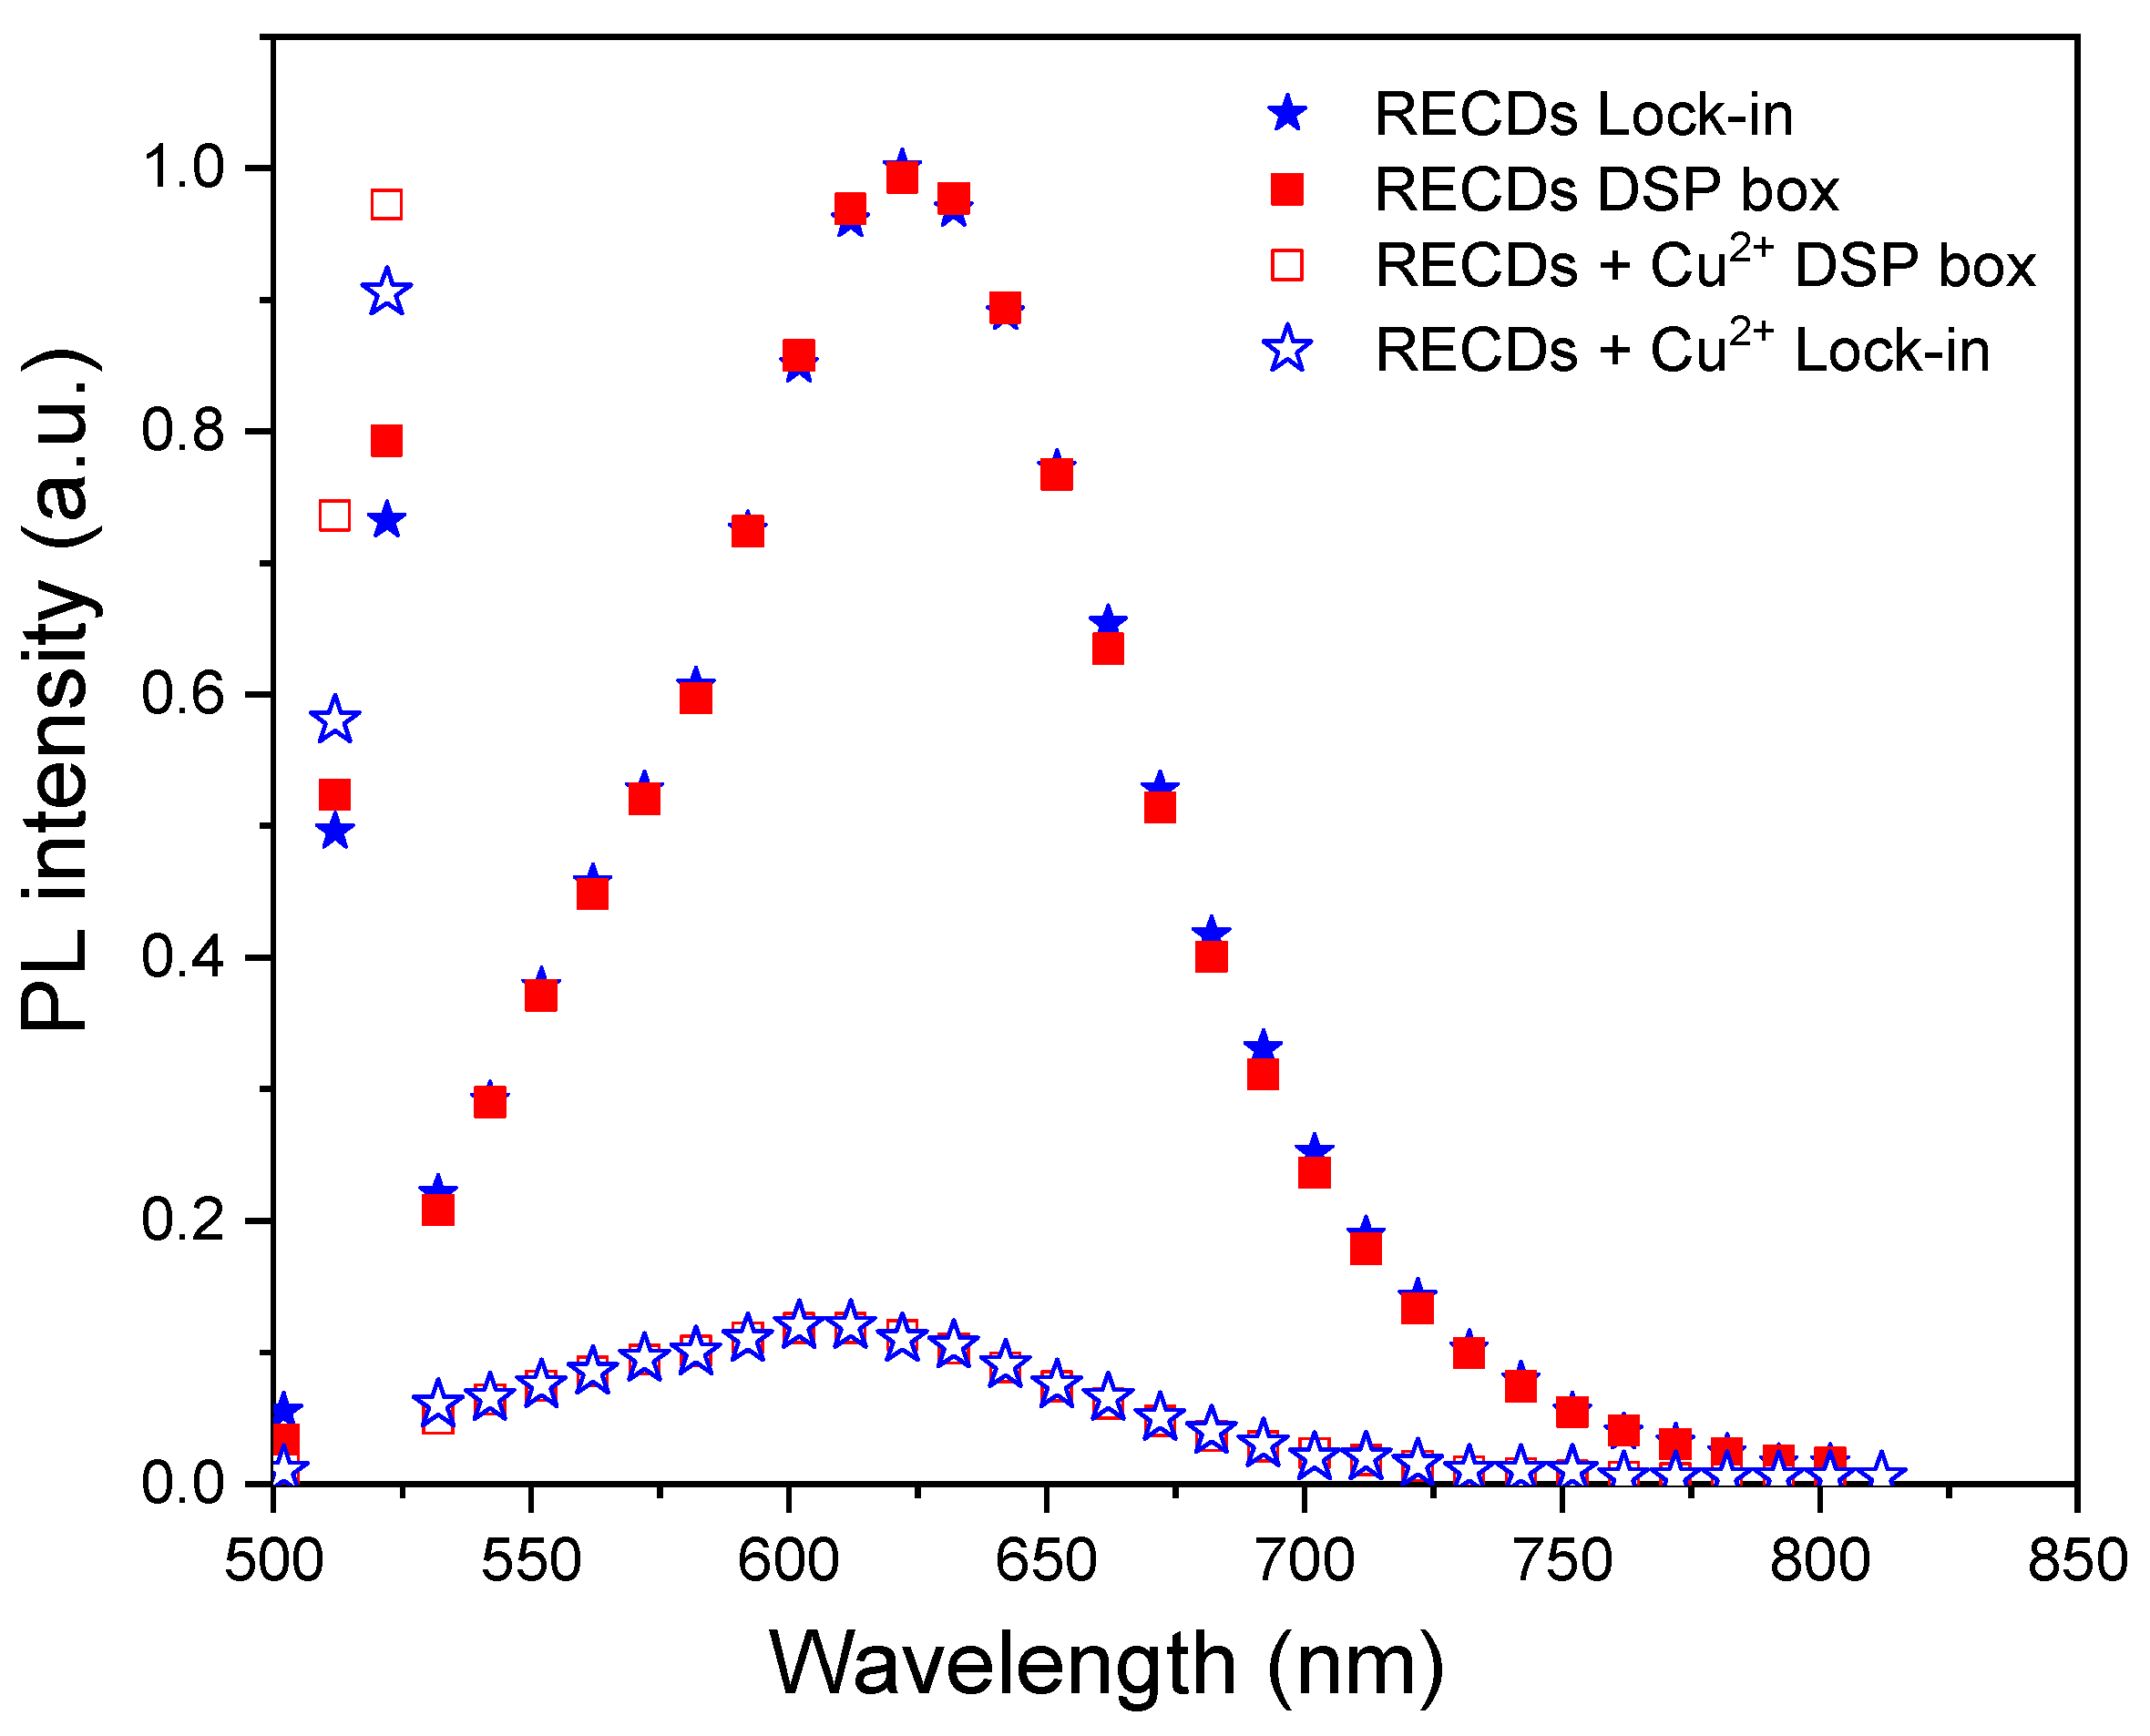
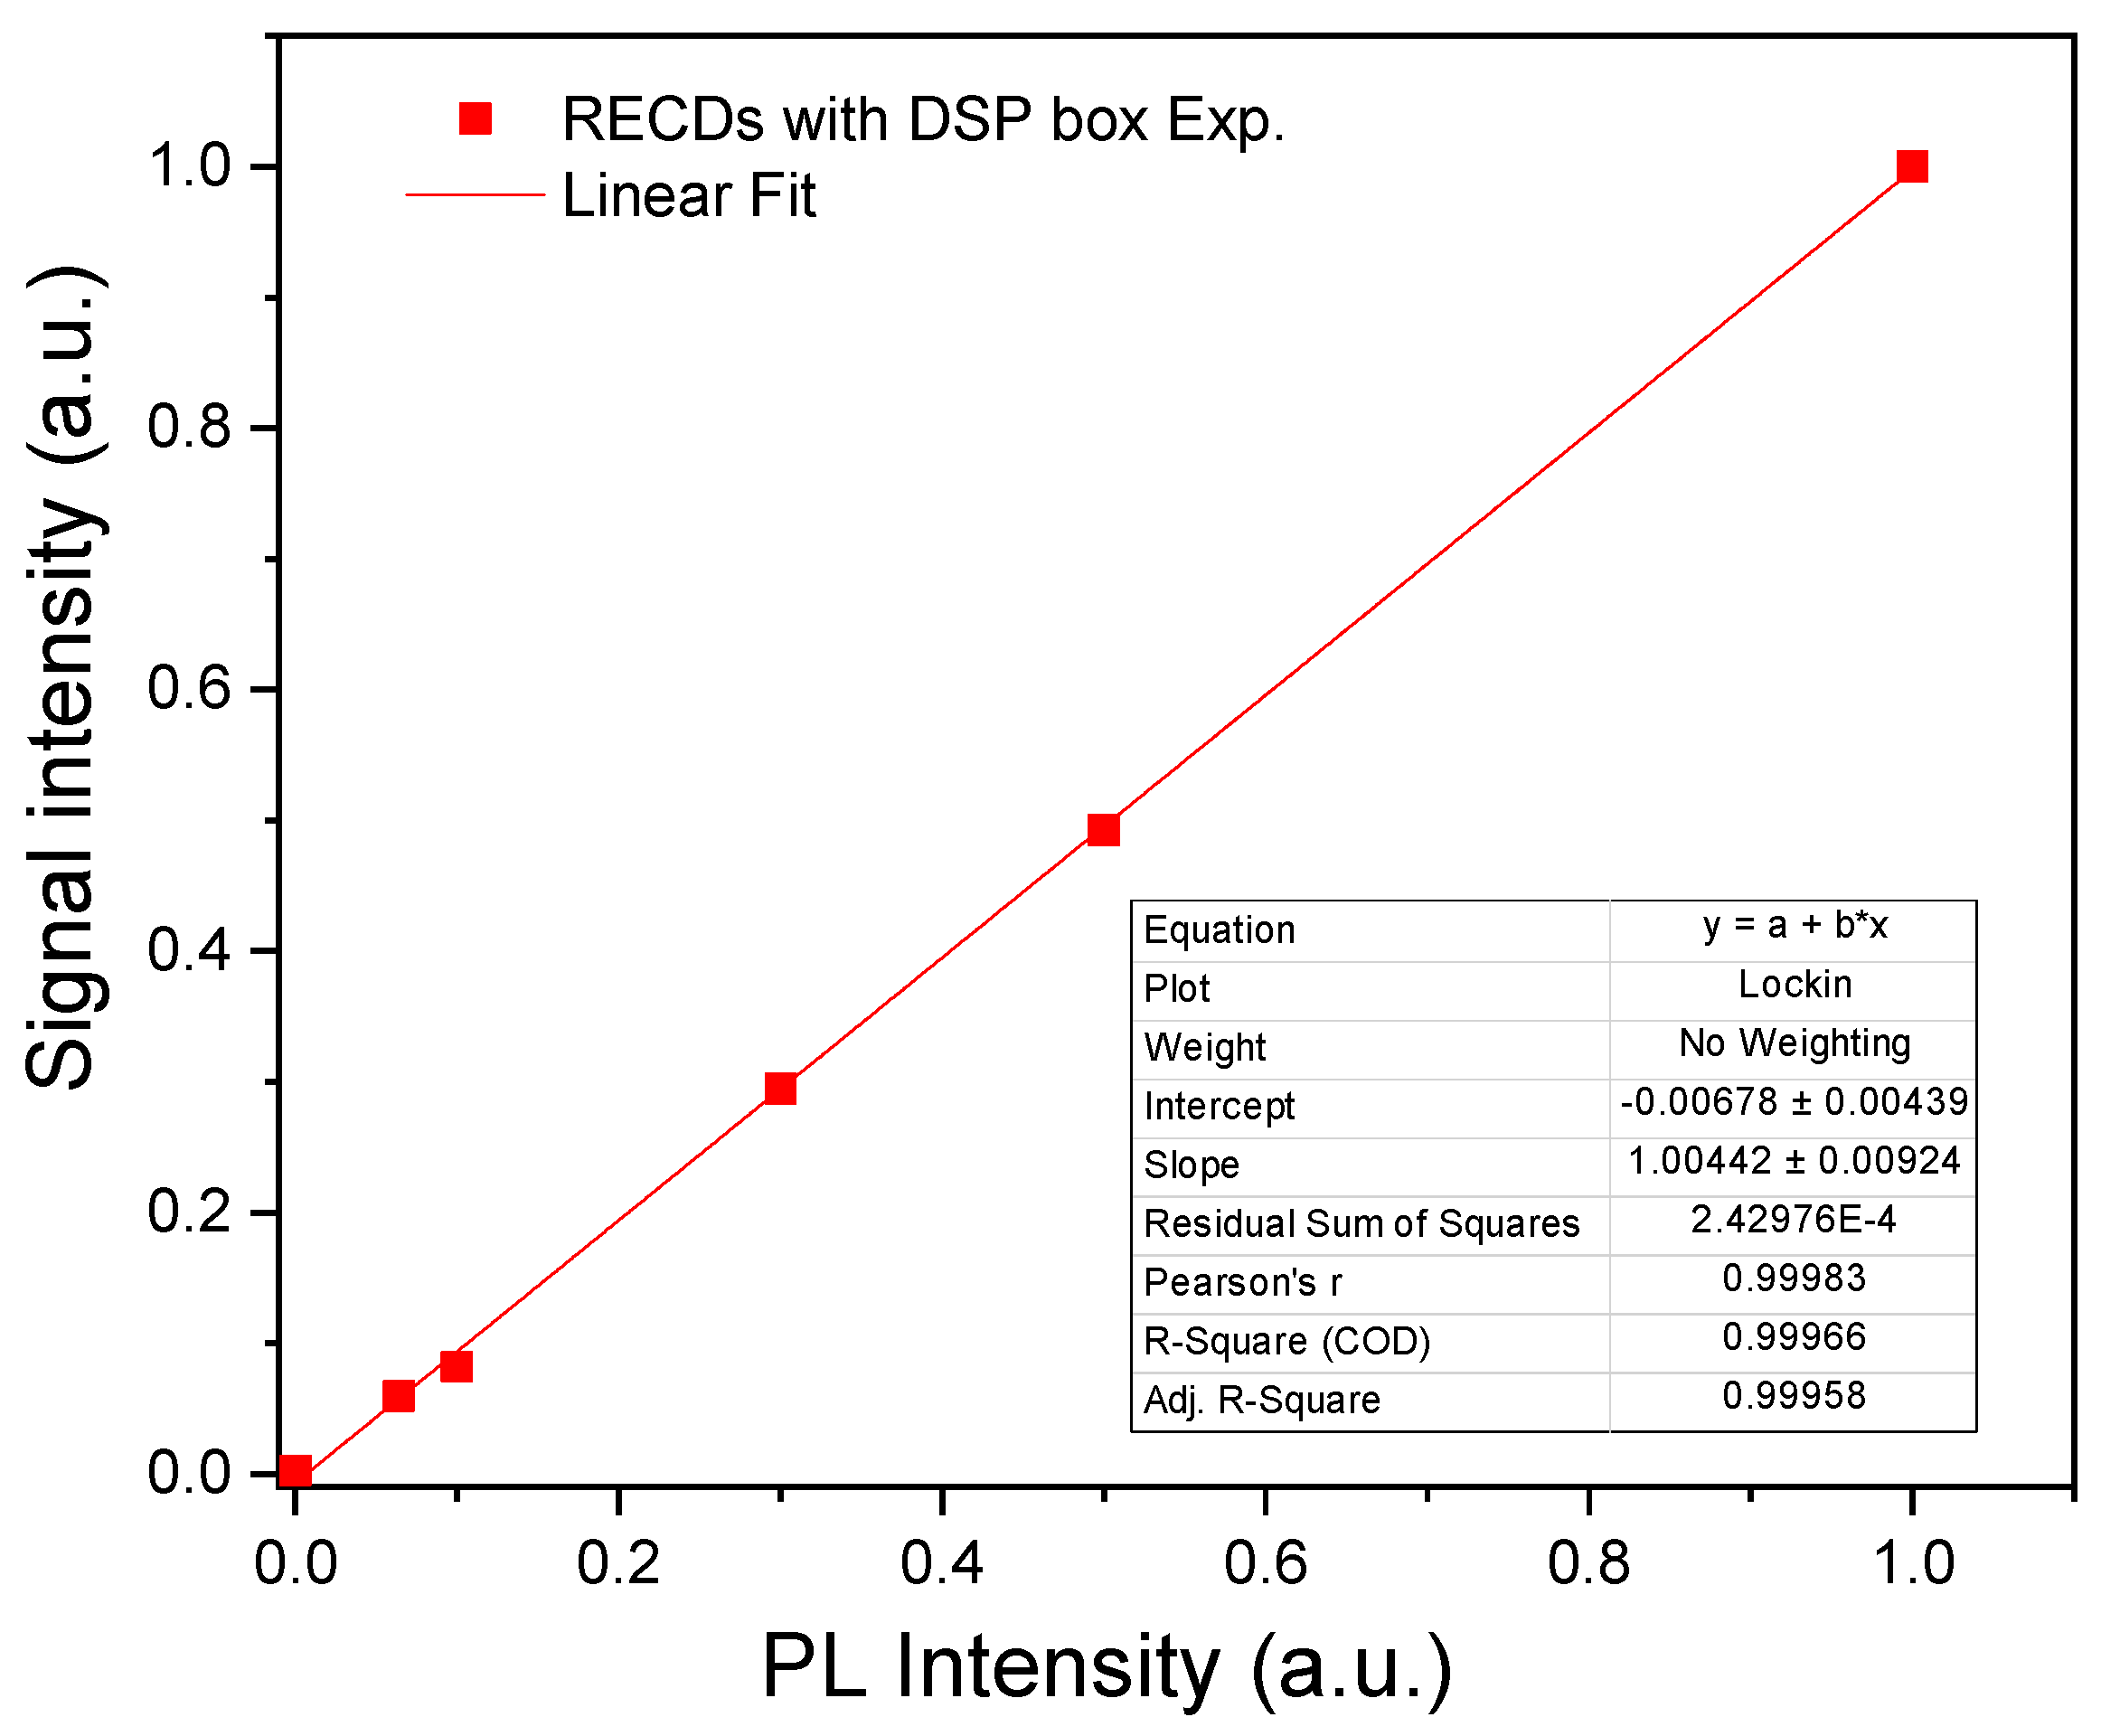
Figure 9 (solid red squares) as measured by using the DSP Box Due both for the modulation of the laser excitation and the revelation of the PMT signal with an integration time of 20 s. For comparison, the same spectrum was also measured by revealing the fluorescence signal with the commercial lock-in amplifier after modulation with a mechanical chopper (full blue stars). As can be seen, the agreement between the two sets of data is very good, demonstrating the validity of the present system. The linearity of the revelation through the DSP Box Due was tested by varying the fluorescence signal intensity through calibrated optical filters and the results (see
Figure 10) showed the good linearity of the response with R = 0.9997.
The sensing experiment was performed by adding 1 ml of water containing copper ions (Cu
2+ ) to the RECD solution so as to reach a final concentration of 100 μM Cu
2+. The interaction and binding of Cu
2+ with the RECDs produced a fast and remarkable decrease (quenching) of the fluorescence emission as shown in the photograph of
Figure 6d and represented in
Figure 9 by the empty squares and stars for detection with the DSP Box Due and commercial lock-in, respectively.
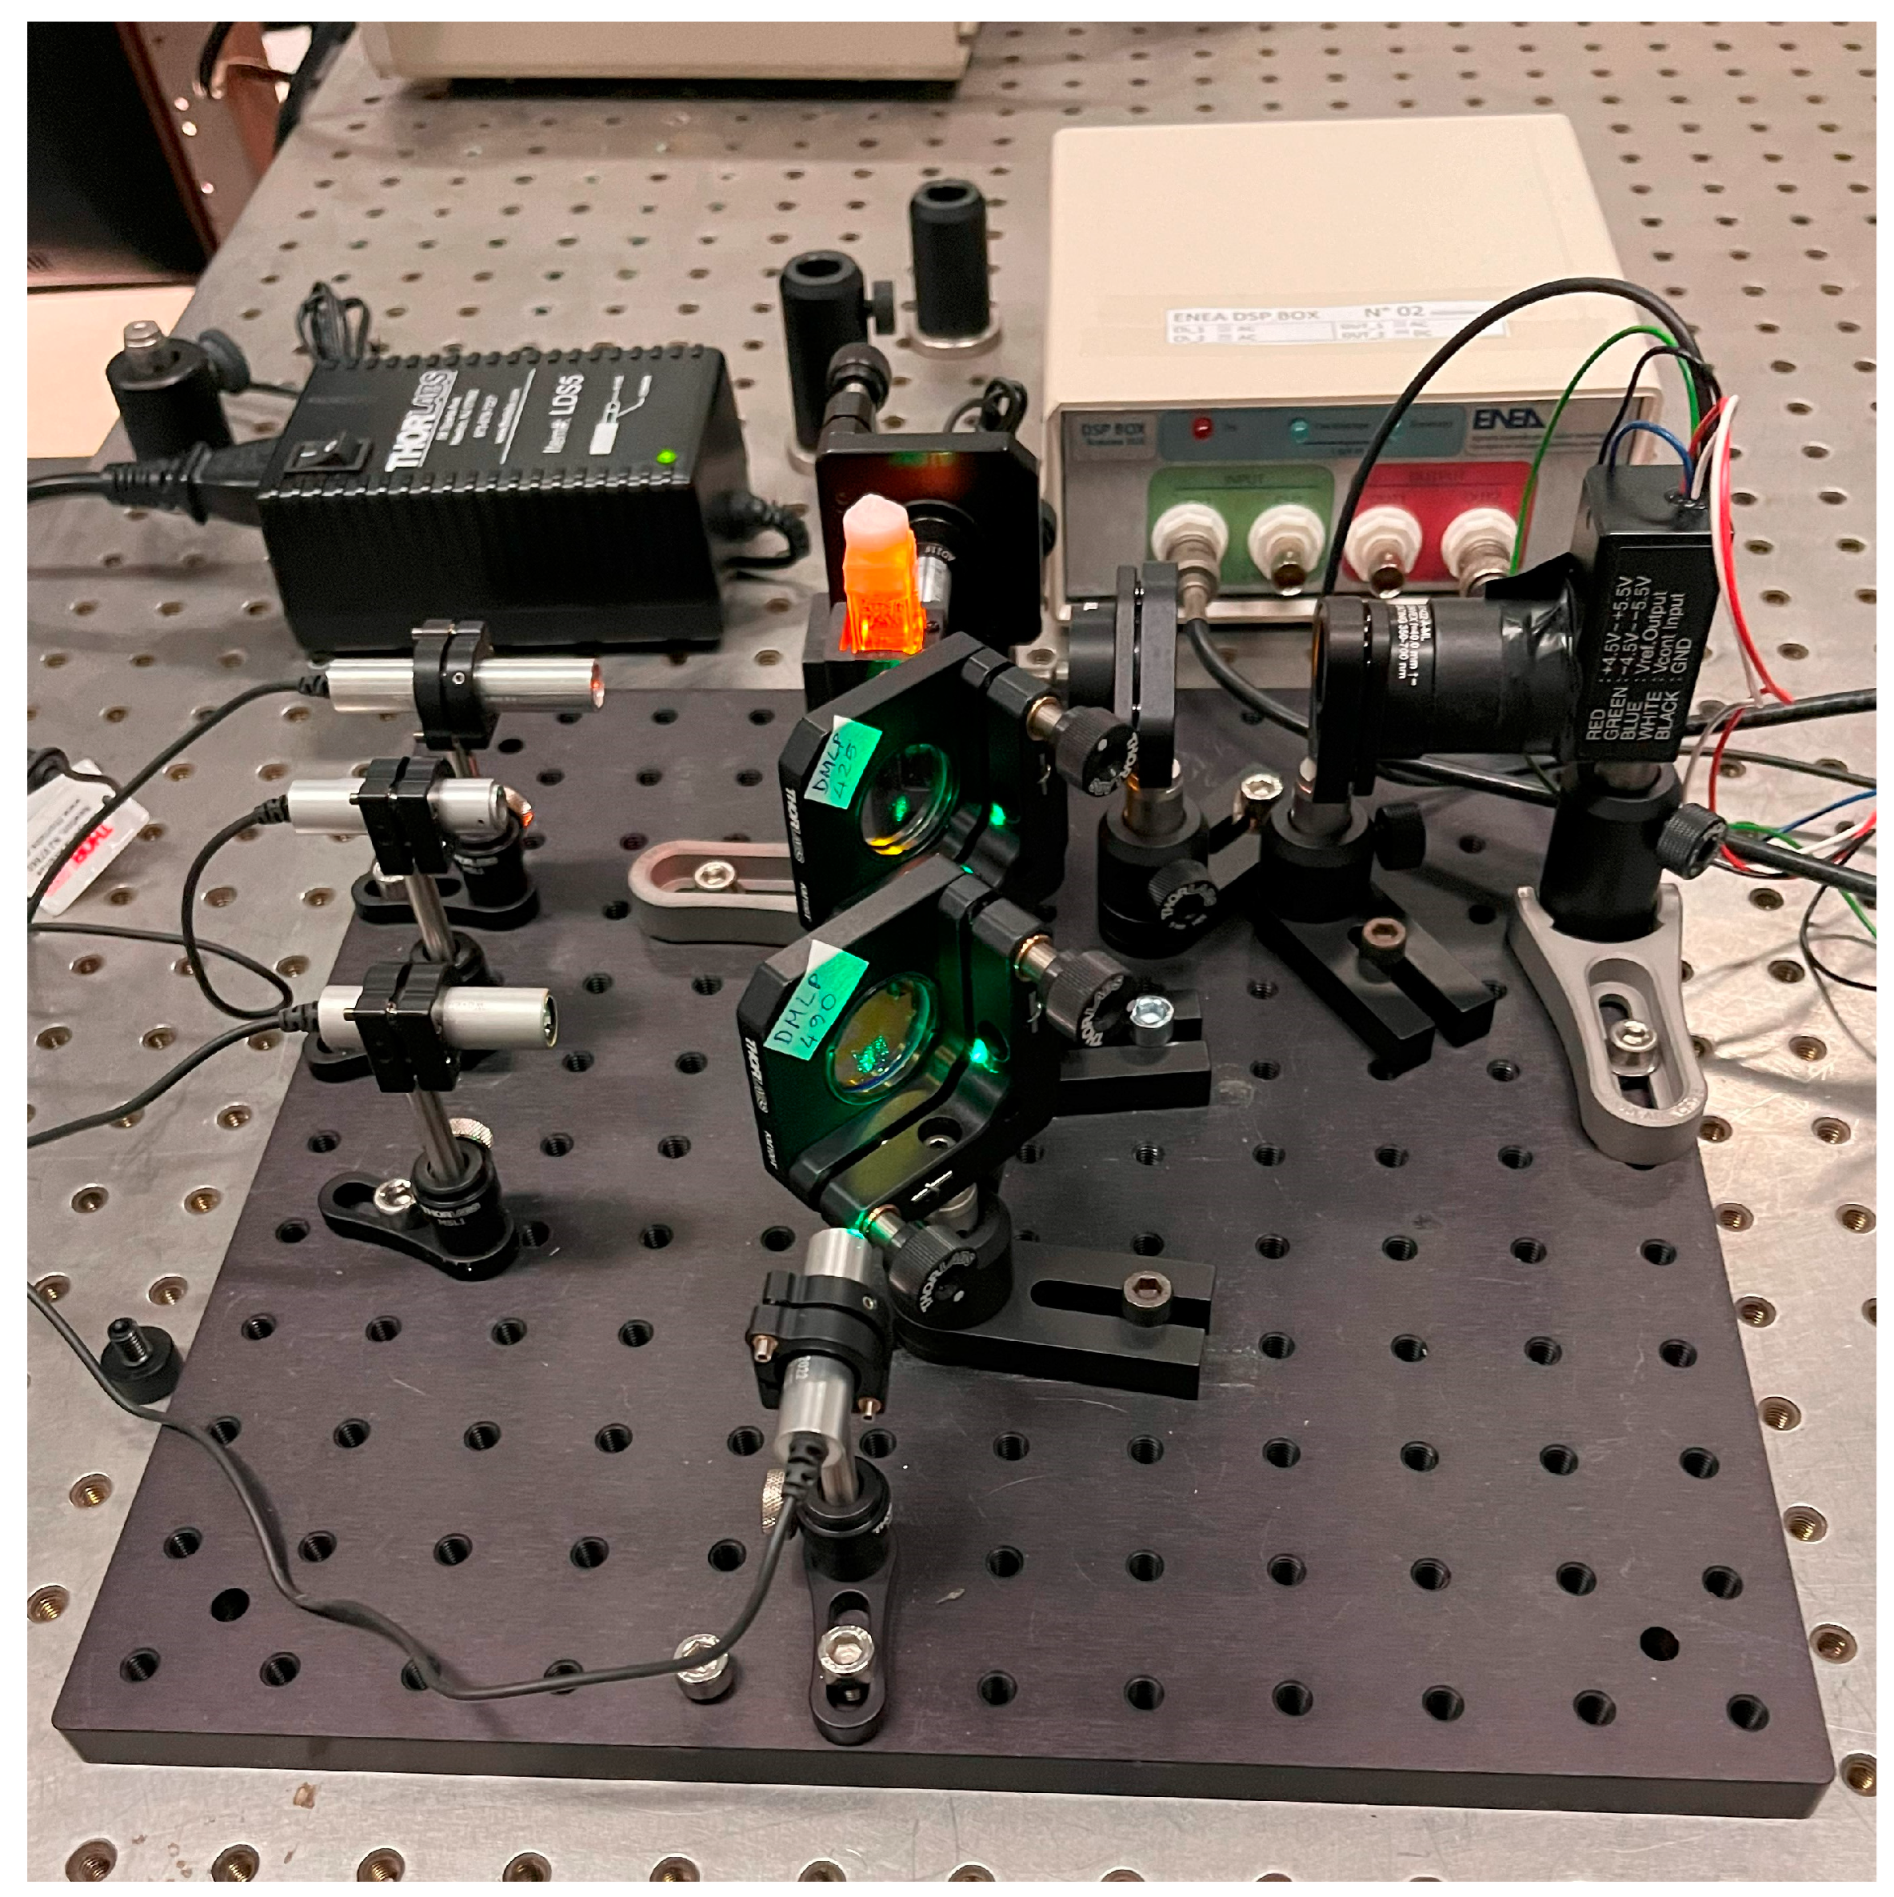
Inspired by these satisfactory results, a simple compact setup for sensing through fluorescence quenching was implemented (see
Figure 11) based on the same cheap 5V-supplied laser diode and a 5V-supplied photomultiplier (H10723-20, Hamamatsu Photonics K.K.).
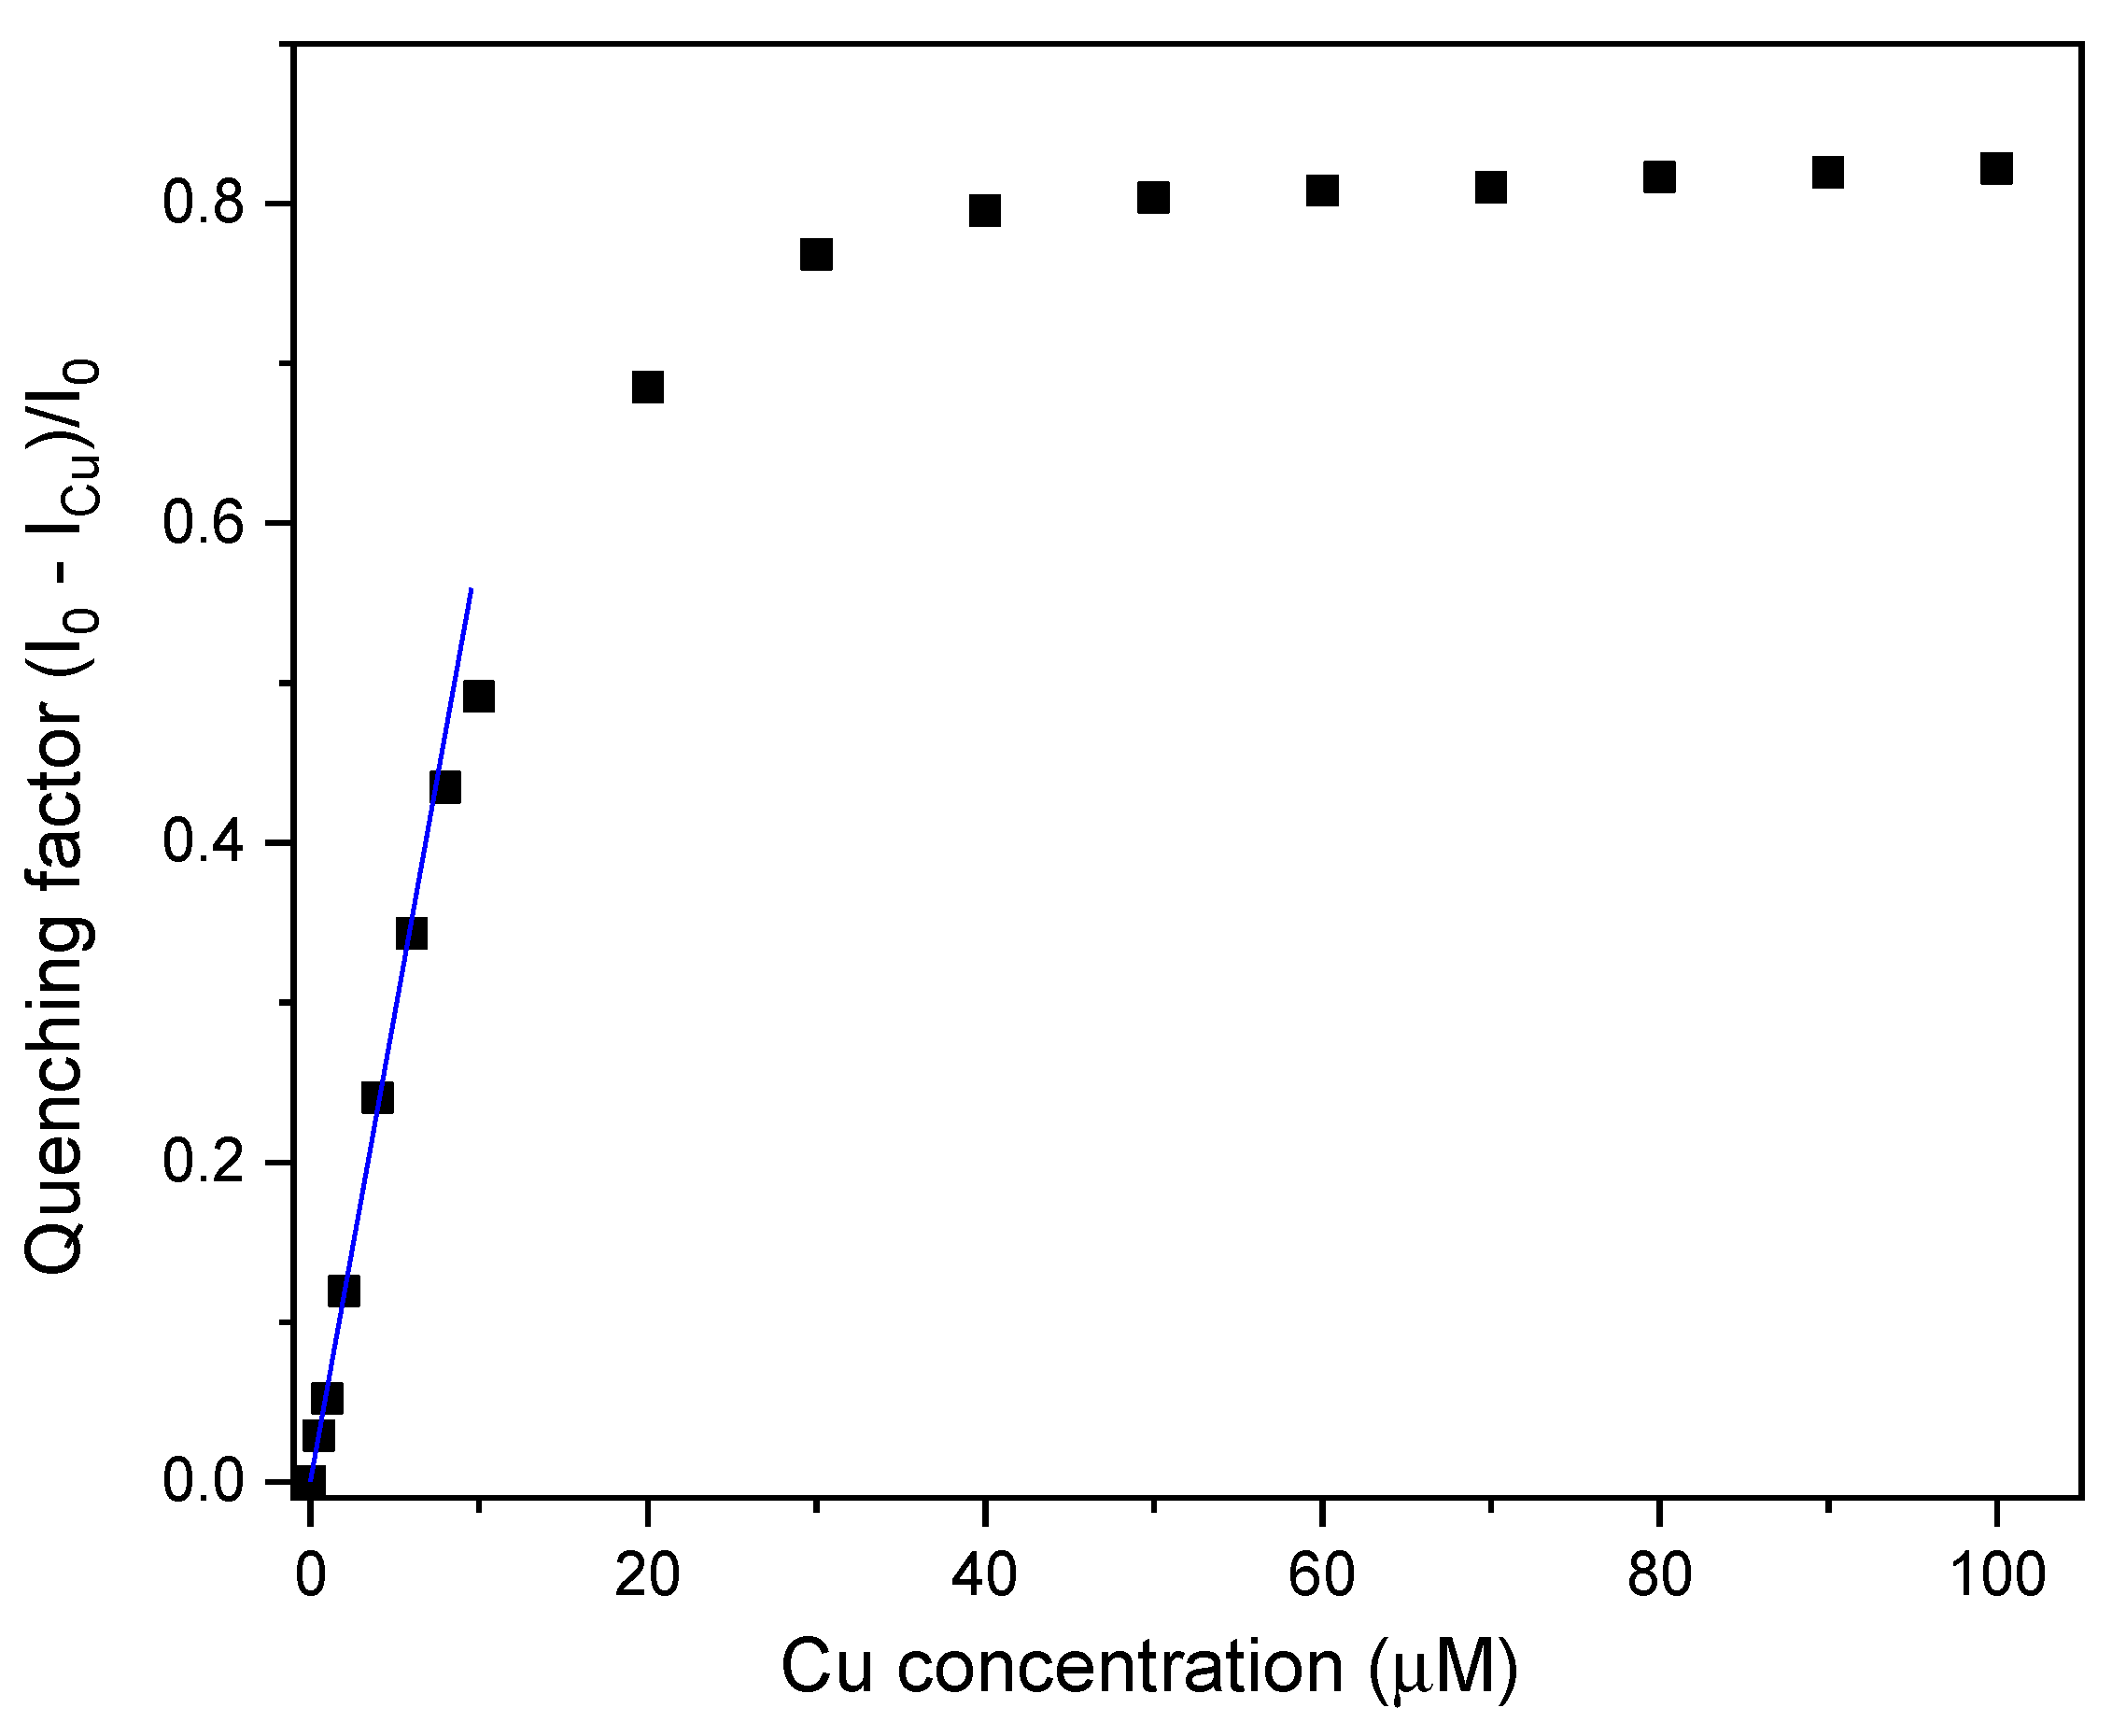
The calibration curve was then recorded using the compact setup by measuring the quenching factor of the RECDs as a function of copper ion concentration (see
Figure 12). As can be seen, the response was linear in the range 0.5 – 5 μM with a limit of detection (LOD) of 0.6 μM, which is well below the threshold limit of 30 μM set by the WHO guideline for Cu
2+.
4. Conclusions
For low frequency applications, the ENEA Frascati laboratories have developed a new very low-cost DSP Box, containing a double channel/double frequency QuadLIA, that can replace four expensive commercial LIAs. The DSP Box Due is based on a microcontroller board (Arduino DUE) and has been electrically characterized obtaining results compatible with the LPAS and fluorescence applications. The developed system has been tested in sensing applications through fluorescence analysis with good results, similar to those obtained with expensive commercial instruments. We believe that these results will help pave the way for a new generation of simple, portable and low-cost signal processing circuits and devices for use in a wide range of sensing systems. In particular, the field of wearable or disposable device technologies could benefit from the development of a new class of signal processing systems. Future experiments will include the use of the DSP Box Due in LPAS applications, in relation to the new portable LPAS systems, being designed for CBNR applications. Possible improvements to the ENEA DSP Box include the development of a new hardware based on a more powerful microcontroller, to allow signal processing beyond the audio bandwidth.
Author Contributions
Conceptualization, Luca Fiorani, Fabio Pollastrone Roberto Pizzoferrato; project administration, funding acquisition: Luca Fiorani; methodology, Fabio Pollastrone Roberto Pizzoferrato; software: Fabio Pollastrone; investigation, Ramanand Bisauriya, Fabio Pollastrone; supervision, Fabio Pollastrone, Roberto Pizzoferrato; writing—original draft preparation, Fabio Pollastrone, Roberto Pizzoferrato; writing—review and editing, Fabio Pollastrone, Roberto Pizzoferrato; data curation Ramanand Bisauriya, Claudio Ciceroni, Ivano Menicucci. All authors have read and agreed to the published version of the manuscript.
Funding
This research was partially funded by TESLA project (Laser Techniques for the Safety of Food and Water) funded by “Regione Lazio” (ERDF-ROP program, no. A0375-2020-36403, call “Gruppi di Ricerca 2020.
Data Availability Statement
no new data are available in addition to those reported in the paper.
Acknowledgments
We acknowledge the financial support by Regione Lazio through Progetto Gruppi di Ricerca POR FESR LAZIO 2014 – 2020 Id: A0375-2020-36403 according to G09493 of 14 July 2021. We would like to thank the ENEA Administrative staff, with focus on Mrs. Carla Cavalcariola involved in the financial management of the project.
Conflicts of Interest
The authors declare no conflicts of interest.
References
- C. Neri, F. Pollastrone and O. Tudisco, "Fully Digital implementation of a high dynamic fast Vector Voltmeter," 2009 23rd IEEE/NPSS Symposium on Fusion Engineering, San Diego, CA, 2009, pp. 1-4. [CrossRef]
- Tudisco, O., Lucca Fabris, A., Falcetta, C., Accatino, L., De Angelis, R., Manente, M., ... & Tuccillo, A. A. (2013). A microwave interferometer for small and tenuous plasma density measurements. Review of Scientific Instruments, 84(3). [CrossRef]
- Neri, C., Bartolini, L., Coletti, A., De Collibus, M. F., Fornetti, G., Lupini, S., ... & Talarico, C. (2002). Advanced digital processing for amplitude and range determination in optical RADAR systems [fusion reactor inspection]. IEEE transactions on nuclear science, 49(2), 417-422. [CrossRef]
- Pollastrone, F., Piccinini, M., Pizzoferrato, R. et al. Fully-digital low-frequency lock-in amplifier for photoluminescence measurements. Analog Integr Circ Sig Process (2023). [CrossRef]
- Pollastrone, F., Neri, C., Florean, M., & Ciccone, G. (2013). FTU bolometer electronic system upgrade. Fusion Engineering and Design, 88(6-8), 1441-1444. [CrossRef]
- Harvie AJ and de Mello JC (2023), OLIA: An open-source digital lock-in amplifier. Front. Sens. 4:1102176. [CrossRef]
- Maya, P.; Calvo, B.; Sanz-Pascual, M.T.; Osorio, J. Low Cost Autonomous Lock-In Amplifier for Resistance/Capacitance Sensor Measurements. Electronics 2019, 8, 1413. [CrossRef]
- Bengtsson, Lars E. "A microcontroller-based lock-in amplifier for sub-milliohm resistance measurements." Review of Scientific Instruments 83.7 (2012).
- Maya-Hernández, Paulina M.; et al. "An integrated low-power lock-in amplifier and its application to gas detection." Sensors 14.9 (2014): 15880-15899.
- https://192.107.61.76/BREVETTI/elenco.php?OK=Y&idDE=947 Luca Fiorani, Fabio Pollastrone, Marcello Nuvoli, Adriana Puiu, Ivano Menicucci N. Brevetto Italia 102021000032276 title “Un Apparato e un Metodo Fotoacustico per Rilevare un Analita in un Campione di un Materiale da Ispezionare.”.
- Mehta, J.; Bhardwaj, S.K.; Bhardwaj, N.; Paul, A.; Kumar, P.; Kim, K.H.; Deep, A. Progress in the biosensing techniques for trace-level heavy metals. Biotechnol. Adv. 2016, 34, 47–60.
- Zhang, L.; Shi, Z.; Jiang, Z.; Zhang, J.; Wang, F.; Huang, X. Distribution and bioaccumulation of heavy metals in marine organisms in east and west Guangdong coastal regions, South China. Mar. Pollut. Bull. 2015, 101, 930–937.
- Uauy, R.; Olivares, M.; Gonzalez, M. Essentiality of copper in humans. Am. J. Clin. Nutr. 1998, 67, 952S–959S.
- Song, Y.; Qu, K.; Xu, C.; Ren, J.; Qu, X. Visual and quantitative detection of copper ions using magnetic silica nanoparticles clicked on multiwalled carbon nanotubes. Chem. Commun. 2010, 46, 6572–6574.
- E] Lin, J.; Huang, X.; Kou, E.; Cai, W.; Zhang, H.; Zhang, X.; Liu, Y.; Li, W.; Zheng, Y.; Lei, B. Carbon dot based sensing platform for real-time imaging Cu2+ distribution in plants and environment. Biosens. Bioelectron. 2023, 219, 114848.
- Arduino project web site https://www.arduino.cc/ Arduino Due sub-page https://store.arduino.cc/products/arduino-due.
- Yao, Z.; Pan, J.; Yu, C.; Yuan, Z.; Chen, Q.; Sui, X. A Universal Digital Lock-in Amplifier Design for Calibrating the Photo-Detector Responses with Standard Black-Bodies. Sensors 2023, 23, 8902. [CrossRef]
- Qu, S. N., Zhou, D., Li, D., Ji, W. Y., Jing, P. T., Han, D., ... & Shen, D. Z. (2016). Toward efficient orange emissive carbon nanodots through conjugated sp (2)-domain controlling and surface charges engineering. [CrossRef]
- Pizzoferrato, R., Bisauriya, R., Antonaroli, S., Cabibbo, M., & Moro, A. J. (2023). Colorimetric and fluorescent sensing of copper ions in water through o-phenylenediamine-derived carbon dots. Sensors, 23(6), 3029. [CrossRef]
|
Disclaimer/Publisher’s Note: The statements, opinions and data contained in all publications are solely those of the individual author(s) and contributor(s) and not of MDPI and/or the editor(s). MDPI and/or the editor(s) disclaim responsibility for any injury to people or property resulting from any ideas, methods, instructions or products referred to in the content. |
© 2024 by the authors. Licensee MDPI, Basel, Switzerland. This article is an open access article distributed under the terms and conditions of the Creative Commons Attribution (CC BY) license (http://creativecommons.org/licenses/by/4.0/).
