1. Introduction
In century XVIII, Edward Jenner was responsible for conducting an experiment that would change society until nowadays, probably, forever. In 1796, Edward Jenner observed that people who lived with cows infected by cowpox did not get sick due to smallpox. After this observation, he inoculated a small dose of cowpox in an eight-year-old boy (James Phipps) who got sick and developed a mild form of the disease. After his recovery, Edward Jenner took a fatal dose of smallpox and introduced it to the kid. James Phipps became immune after the contact with cowpox and did not develop smallpox [
1,
2].
Smallpox vaccination paved the way for several other important vaccine development and application throughout history. The majority of developed vaccines work through the infusion of weakened pathogens into the organism, acting by destroying or weakening pathogens. The presence of these pathogens stimulates the immune system to produce antibodies that generate a preventive immunity response against a particular disease [
3]. The last epidemiological events showed that the application of large quantities of vaccine doses requires a very efficient vaccination strategy. For instance, against Rubella, the vaccination of teenage girls in the United Kingdom from 1971 to 1988 emphasized the reduction of susceptible individuals, ensuring that the maximum amount of women who acquired previous immunity before the reproductive age. Another strategy promoted the vaccination of two-year-old boys and girls, leading to a decrease in the positive cases of Rubella [
4].
More recently, the World population faced the pandemic of SARS-CoV-2, which caused profound changes in several aspects. Despite the virus’s fast spread and damage, the development of vaccines brought the hope of better days at record speed. During the COVID-19 pandemic, vaccine development and distribution have become crucial for limiting disease transmission [
5]. Four months after the community spread of the virus was announced, a SARS-CoV-2 vaccine first generation was developed
in silico. In July 2020, Moderna and Pfizer started large-scale phase II and III COVID-19 vaccine trials. In January 2021, just over a year after the first case of contamination by the new coronavirus, India approved the first DNA vaccine against SARS-CoV-2. In December 2022, there were 50 COVID-19 vaccine candidates approved by at least one country in the world [
6]. Knowing that the world is increasingly connected and the global population growth, investing in immunization strategies is crucial. In this context, it is also essential to consider the population composition and the structure of social networks [
7].
With science development, mathematical and computational models have been consolidated as efficient methods to estimate complex processes, such as infection dynamics [
8,
9,
10] or interactions between the human immune system and a pathogen [
11], for instance. One of these tools is Agent-based modeling (ABM), a powerful and very adaptable approach to exploring complex systems and reproducing the manifestations of emergent phenomena. Different empiric complex systems are studied using ABM [
12,
13,
14], including in the development of models involving vaccination strategies. In a study using ABM and analysis of empirical data [
15], authors studied scenarios with anti-vaccination (AV) movements considering contacts with medical practitioners and public vaccination campaigns, interpersonal communication, and the digital world’s influence. Another study merges genetic algorithm and ABM in a model that provides parameters for strategies of vaccination considering different population groups [
16]. It is of the utmost importance to search for advanced models and techniques involving the vaccination process since challenges such as development, affordability, accessibility, and acceptability remain very current challenges [
17,
18].
The present work employs a recently introduced model, the IABM (Immunity Agent-Based Model) [
19] to describe and analyze distinct vaccination scenarios, showing how infection curves vary in front of a vaccination process carried out before the occurrence of a new outbreak. The original IABM deals with the behavior of infection at the individual level (microscale), composed of innate and humoral immunological responses, and the social level (macroscale), which considers the community transmission of the pathogen. In this work, we add vaccinated individuals who exhibit a boost in their level of antibodies and study the dynamics between viral load, innate immune system response, and the work done by antibodies forming a microscopic dynamic within the model. Macroscopically, interpersonal interactions and epidemiological state transitions based on the SVEIR (
Susceptible-Vaccinated-Exposed-Infected-Recovered) [
21] model guide pathogen transmission between agents in the lattice.
The possibilities of reinfection were not considered in this study, since the reinfection rates of diseases such as COVID-19 and influenza, both diseases transmitted mainly by airways, are relatively low within a short period of time considering the circulation of the same variant of the virus [
20,
22,
23]. We studied a type of vaccine that does not fully guarantee the individual’s immunity but reduces the chance of infection and the severity of symptoms.
The remainder of this paper is organized as follows. In
Section 2, we provide a brief review of the main characteristics of the IABM. The methodology behind the model’s design is described in
Section 3, while
Section 4 presents the obtained results and an in-depth discussion of these findings. Finally,
Section 5 encapsulates the conclusions drawn from our study.
2. The Immunity Agent-Based Model (IABM)
The Immunity Agent-Based Model (IABM), detailed in our previous publication [
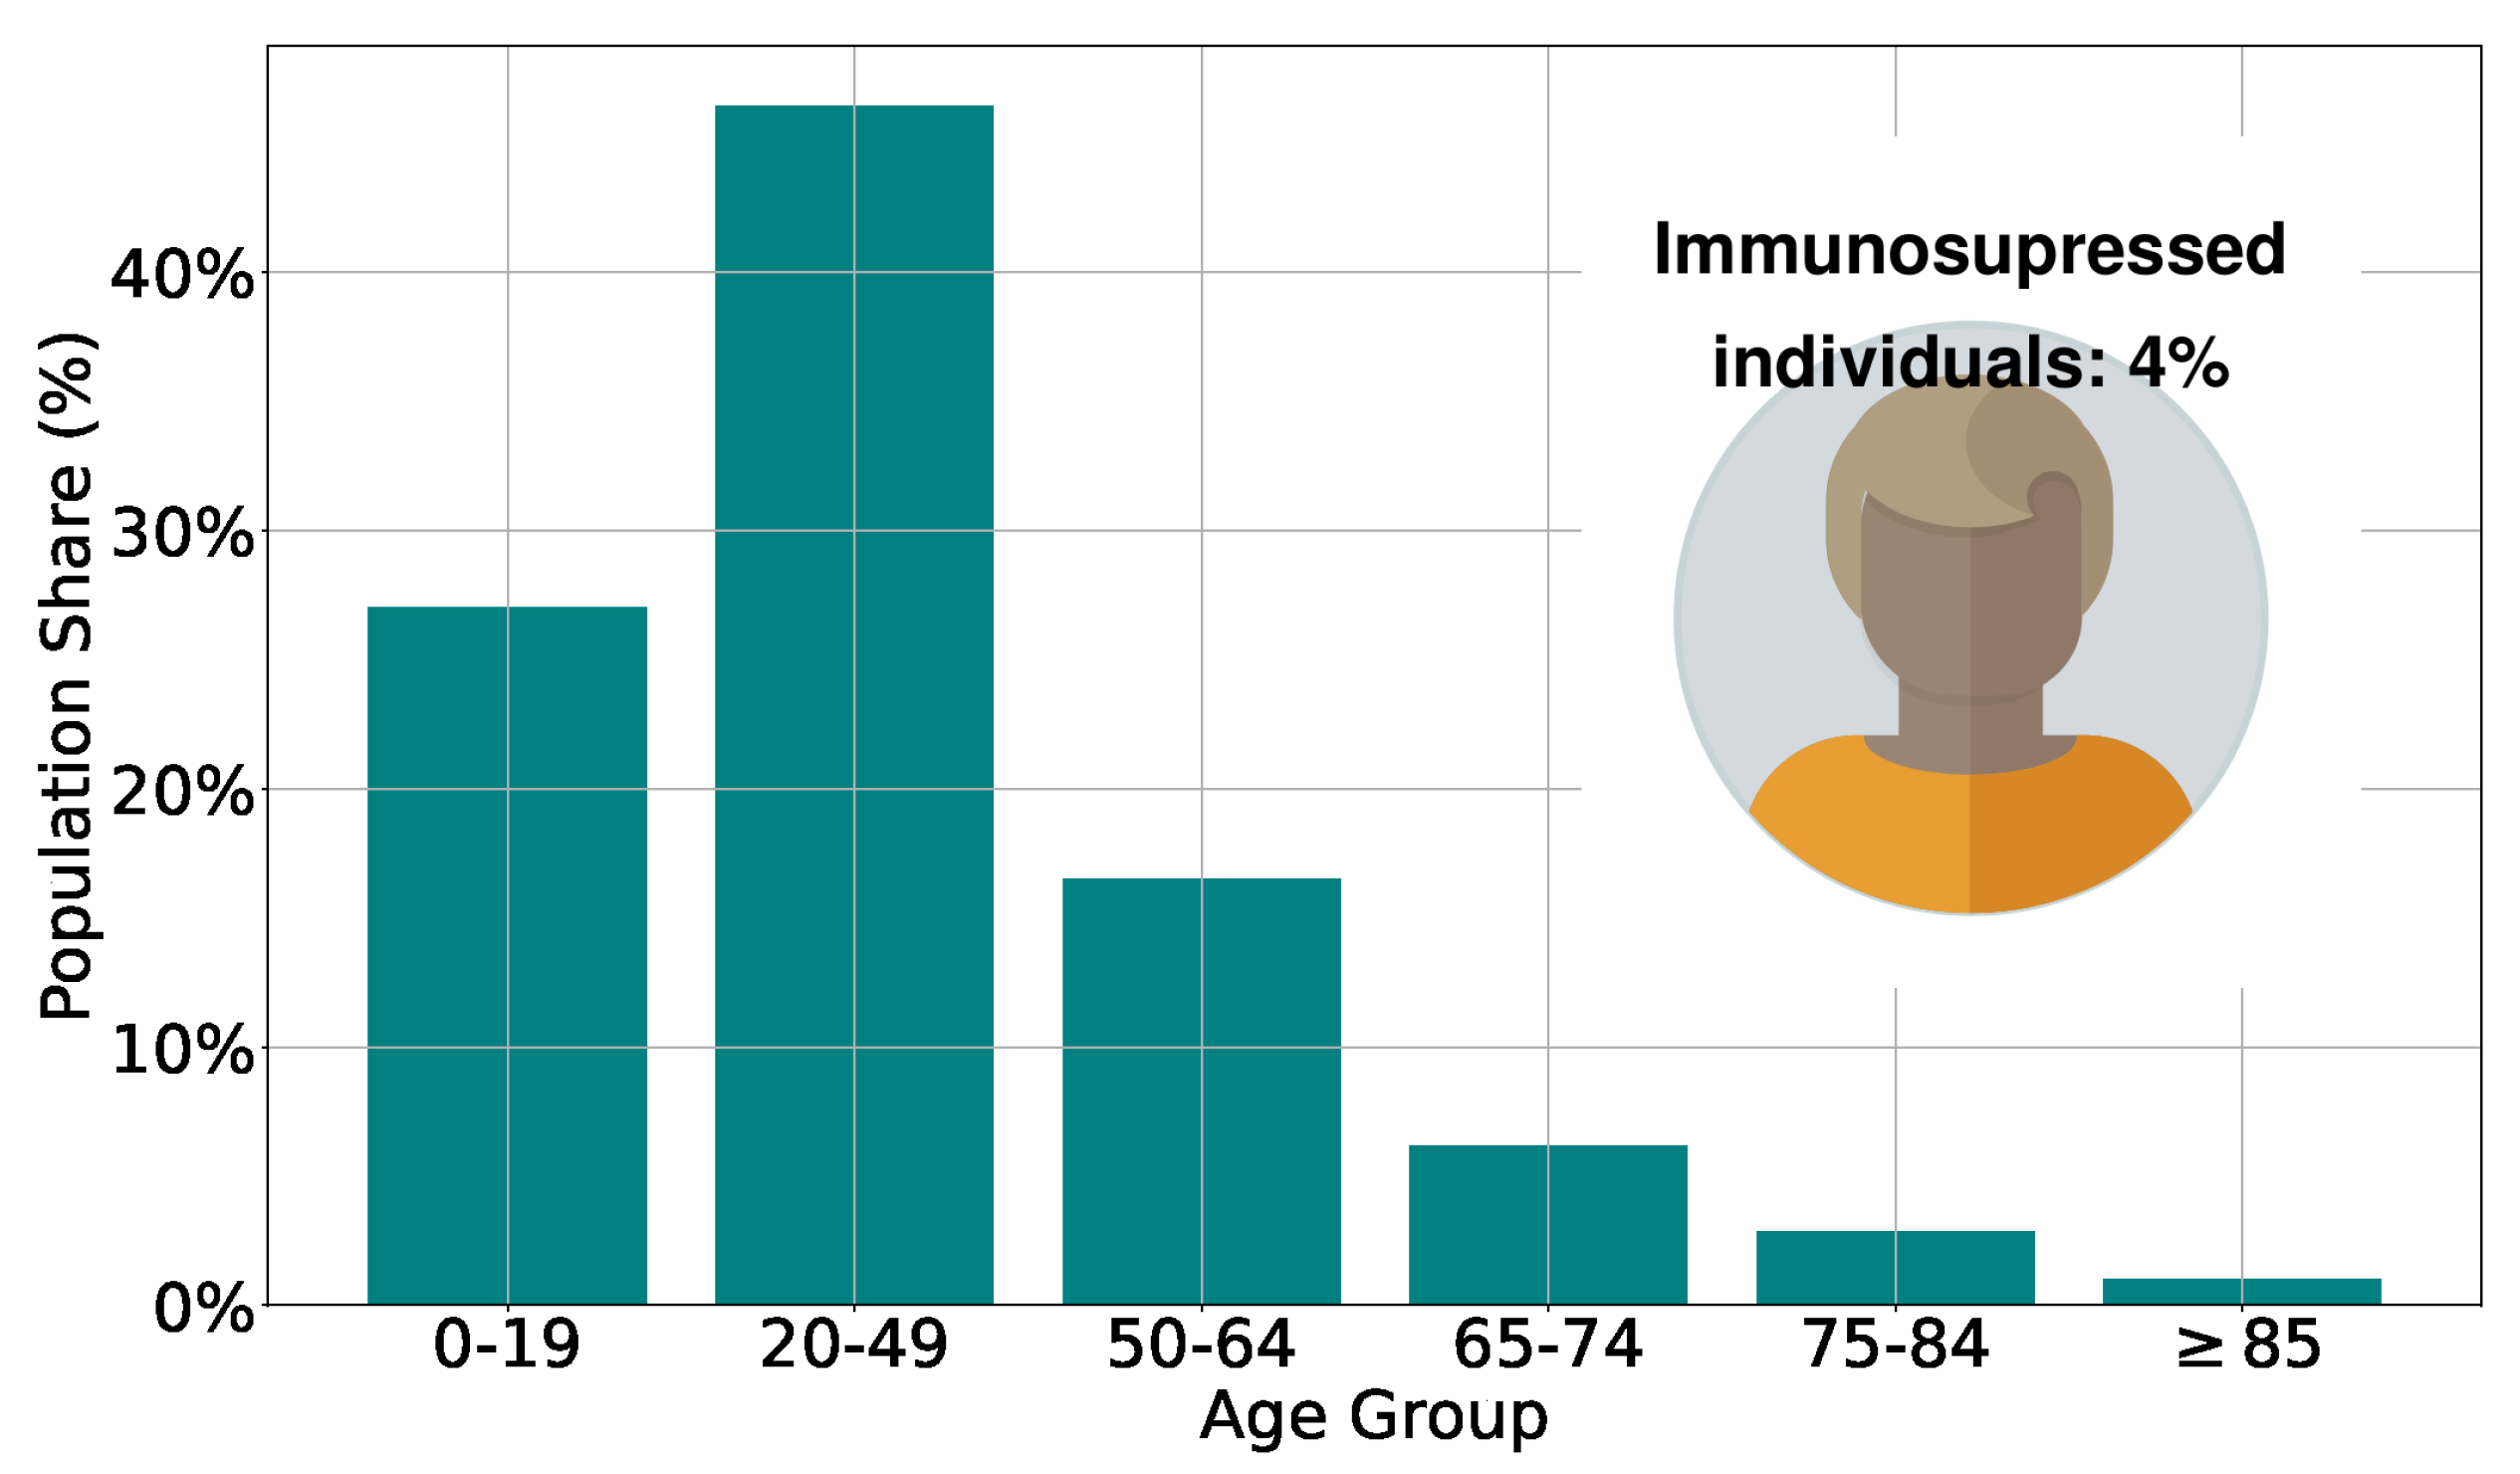
19], is a versatile tool for investigating airborne diseases caused by different pathogens. As in the previous work, here we study the spread of the virus, calibrating the model parameters considering COVID-19 characteristics (it is important to say that the calibration was carried out considering the original model, but the objective of this work is to provide analyses that support the definition of vaccination strategies that could be applied in immunization processes for different airborne diseases). The model stratifies the population by age, categorizing individuals into groups of 0–19, 20–49, 50–64, 65–74, 75–84, and older than 85, whose number of individuals in each range is based on the age pyramid of a real population [
24], as seen in
Figure 1. Additionally,
[
25] of the population represent the group of immunosuppressed individuals, whose innate and humoral response efficiencies are reduced in relation to an immunocompetent individual.
The model operates on two distinct levels: a microscopic level, focusing on interactions between immune system defense cells and invading pathogens, and a macroscopic level, where agents make social interactions, promoting airborne pathogen transmission. At this level, Epidemiological modeling of epidemiological state transitions is based on the SEIR (Susceptible-Exposed-Infected-Recovered) compartmental model. Our findings indicate the promising utility of the IABM, particularly in exploring vaccination scenarios. Unlike conventional models with predefined transition rates, the IABM captures the dynamic nature of transitions between epidemiological states, influenced by the intricate interplay between defense cells and pathogens. This feature results in a highly heterogeneous representation of real-world scenarios, enabling to simulate and analyze vaccination outcomes, for example.
In the IABM, the number of leukocytes [
28] bases the innate response (
) of each individual (agent) and immunocompromised individuals (individuals over 74 years of age and immunosuppressed individuals) present a reduction in the efficiency of the immune system about immunocompetent individuals. During the spread of the virus, individuals inhale a parcel of the virus particles expelled by infected individuals. After contact with the virus, the innate immune system reacts by capturing a viral particle with a scaled probability
, where
is a random variable uniformly distributed in the ranges
with
,
and
. These probability and parameter values were defined in order to represent the senescence effect of the immune system, with its efficiency decreasing as the age (
) of the individual increases, based on the probability of defense cells finding and destroying antigens [
29].
A time
[
30] was set
a priori for each agent, and this time signals the production of antibodies beginning, triggering the humoral response. The temporal variation of antibodies is
.
is the rate of antibodies production incited by the presence of the antigen in the body, forming the acute immune response. The long-last production of antibodies is made with a rate
. The viral particle is eliminated by antibodies with a rate
, with the consequent antibodies amount reduction due to the opsonization process [
31].
4. Results and Discussion
In this section, we report and discuss the results of extended simulations of the IABM considering distinct vaccination strategies. Similar to the original work [
19], the simulations start with three infected individuals with initial viral load following a normal distribution
. The parameters
and
were defined so that the dynamics begin with infected individuals whose viral load is close to their level of innate immune response.
We begin by analyzing the effects of the vaccination at the microscopic (individual) level. In
Figure 3, we show the temporal variation of the innate response level (
), viral load level (
), and humoral immunity level (
) for three agents, to exemplify the typical behaviors observed for all recovered individuals.
Figure 3(a) shows the typical variations for an unvaccinated individual that recovered after infection. Notice that the viral load of this individual reaches an impressive higher level when compared with a vaccinated individual (
Figure 3(c)), leading this individual to present symptoms during the active phase of the disease (due to the increase in the innate immunity response, the cytokine storm [
33]). In the second panel (
Figure 3(b)), a vaccinated individual became sick after contact with the virus. It is observed a float down in the innate response in the acute phase of the infection, with a rise and fall dynamic between viral load and humoral immunity levels. After recovery, the individual presented a reinforced humoral response, as observed in some real cases of people infected with SARS-CoV-2 [
34]. It is shown in
Figure 3(c) a typical behavior of a vaccinated individual that, even after having contact with the virus, the vaccine-induced immunity is enough to prevent the individual from getting sick, destroying the viral particle and keep the individual uninfected. In this case, the presence of the virus was eradicated before the minimal impact on their organism due to viral activity, with no reinforcement of the humoral immunity due to natural infection.
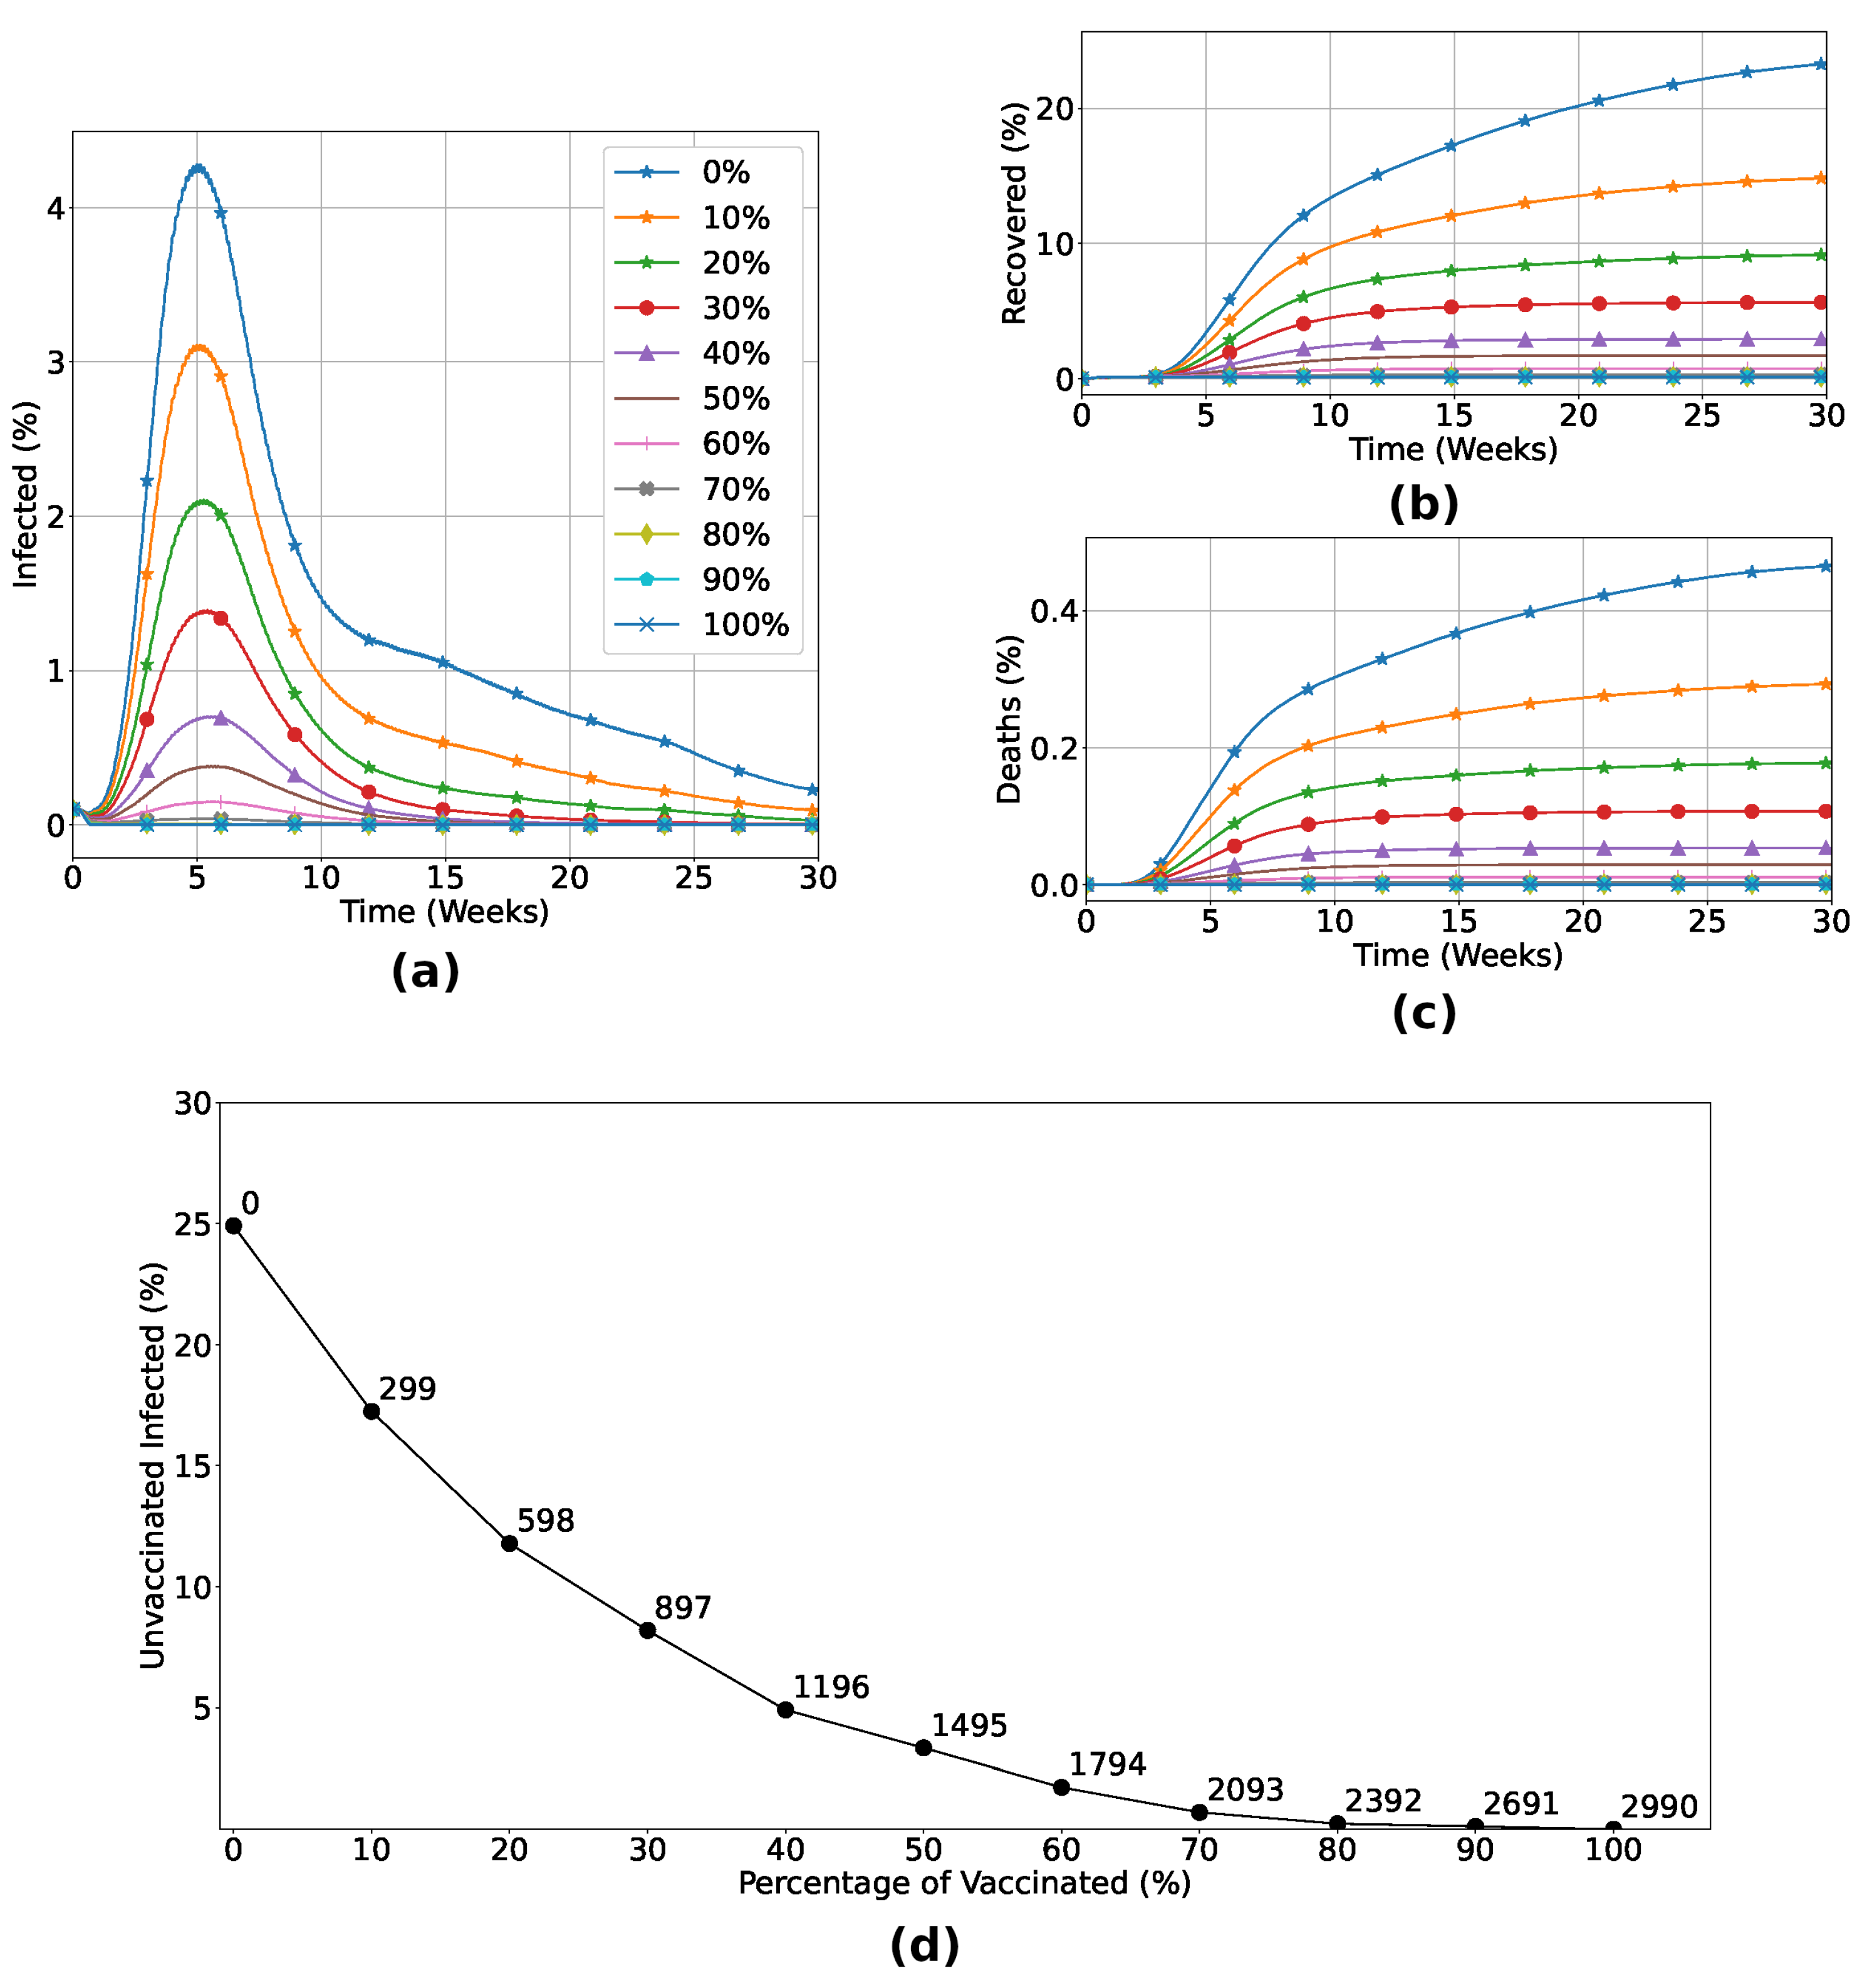
Now, we turn our attention to the macroscopic (population) level. In this first analysis, we consider that a fraction of the population is vaccinated at random, regardless of its spatial location, age, or immunological capabilities. Our results are detailed in
Figure 4. As expected, the number of infected individuals decreases when the fraction of vaccinated increases, resulting in a minor death rate, as shown in
Figure 4(a-c). In particular, for the vaccine efficiency used, the number of dead individuals vanishes for vaccination rates above 70%. This is a consequence of the herd immunity effect, as can be seen from the data in
Figure 4(d) where we observe an exponential reduction of infection of unvaccinated individuals while the number of vaccinated individuals increases. With 70% of the total individuals vaccinated, less than 2% of the unvaccinated group became infected, highlighting the indirect protection due to the vaccinated individuals in the lattice.
Until this point, we considered that vaccines are available to all individuals. However, for a new emerging disease, there may not exist a large number of doses available at hand due to the developing and manufacturing time and/or costs. In such cases, when only a small fraction of the population will be inoculated, an important question that arises is: which strategies, taking into account the heterogeneity of the population, will be more successful in reducing the number of infected and deaths? In the next subsection, we will apply the IABM to investigate three additional strategies.
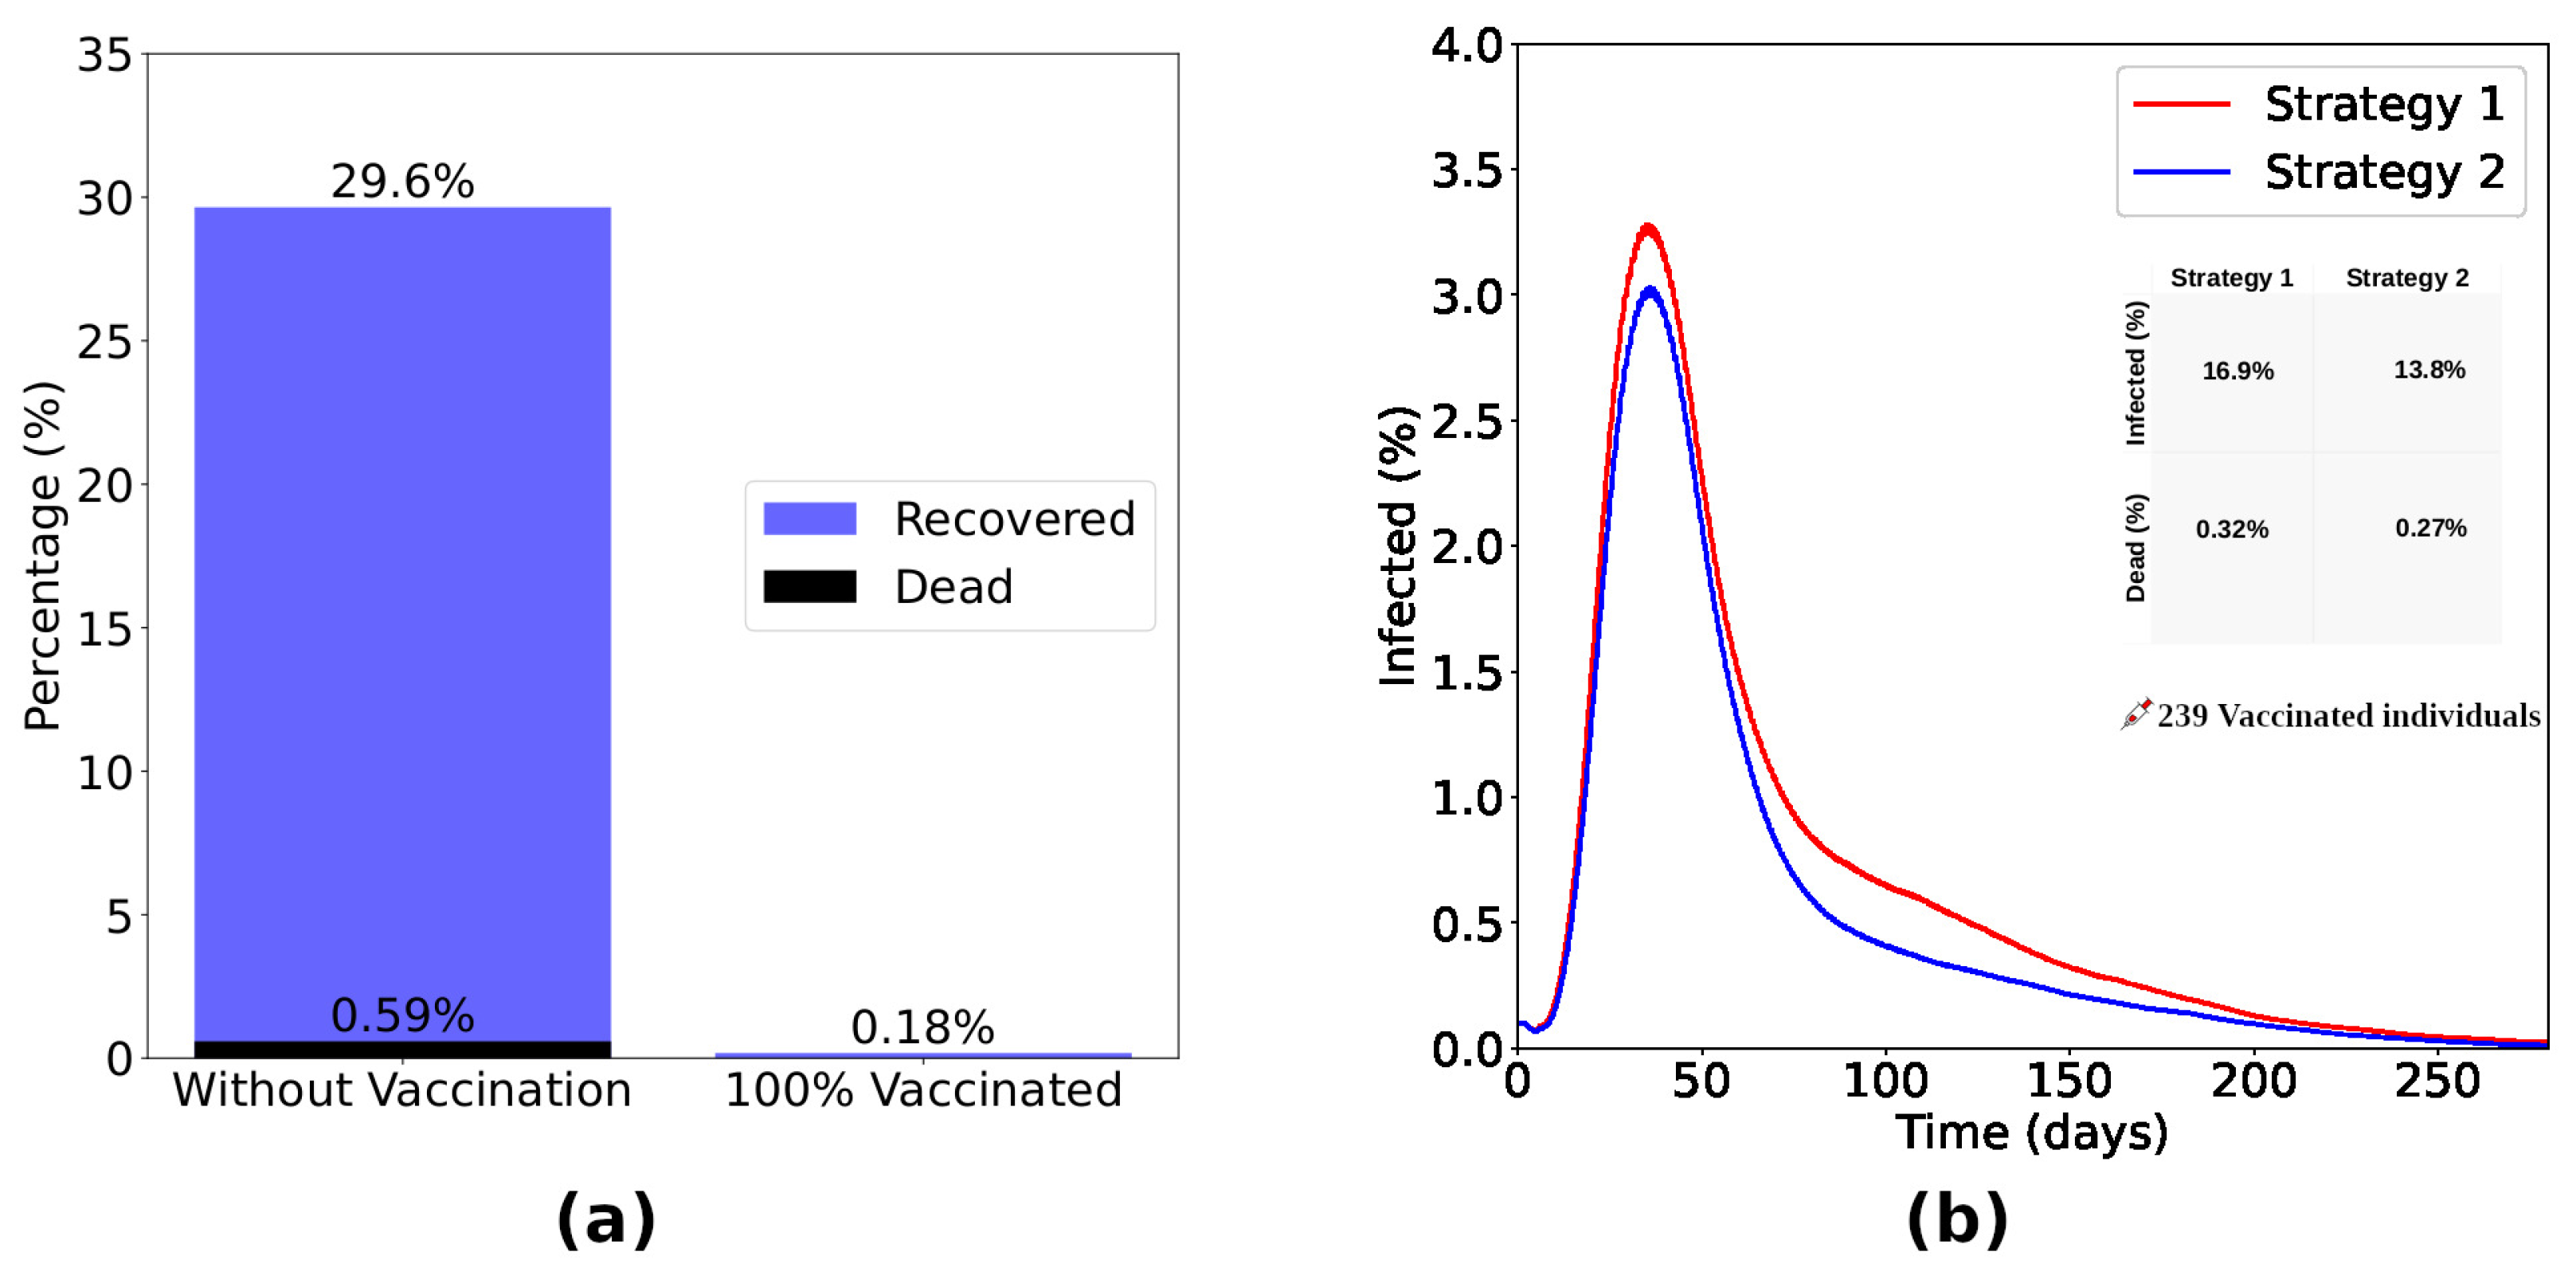
The results obtained from the Strategy 2 are shown in
Figure 5. Panel
Figure 5(a) presents the difference between a scenario without vaccination and a scenario considering the vaccination of 100% of immunocompromised (Strategy 2). Without vaccination,
of immunocompromised become infected, with the death of
of the same group. Vaccinating
of these individuals, the percentage of infected drops drastically to
without deaths in this group. Now, considering the application of the same number of doses in each strategy, we show the time evolution of the fraction of infected individuals (
Figure 5(b)) considering strategies 1 and 2. We observe that Strategy 2 is more efficient in reducing the number of infected and dead individuals. Looking in detail, we note that Strategy 2 reduced the number of infected people by
and the number of deaths by
compared to Strategy 1.
In Strategy 2, all immunocompromised individuals were vaccinated. Distributing and applying this same amount of doses randomly among individuals in the lattice (Strategy 1), 24.6% of immunocompromised people were infected, while the mortality rate was 0.5%. Thus, when we analyzed individuals in this group in a scenario in which doses were randomly distributed across the lattice, Strategy 2 showed a 99.3% reduction in the number of infected individuals and a 100% reduction in deaths compared to Strategy 1.
Now, we turn to the effects of the strategies that rely on the spatial distribution of the population.
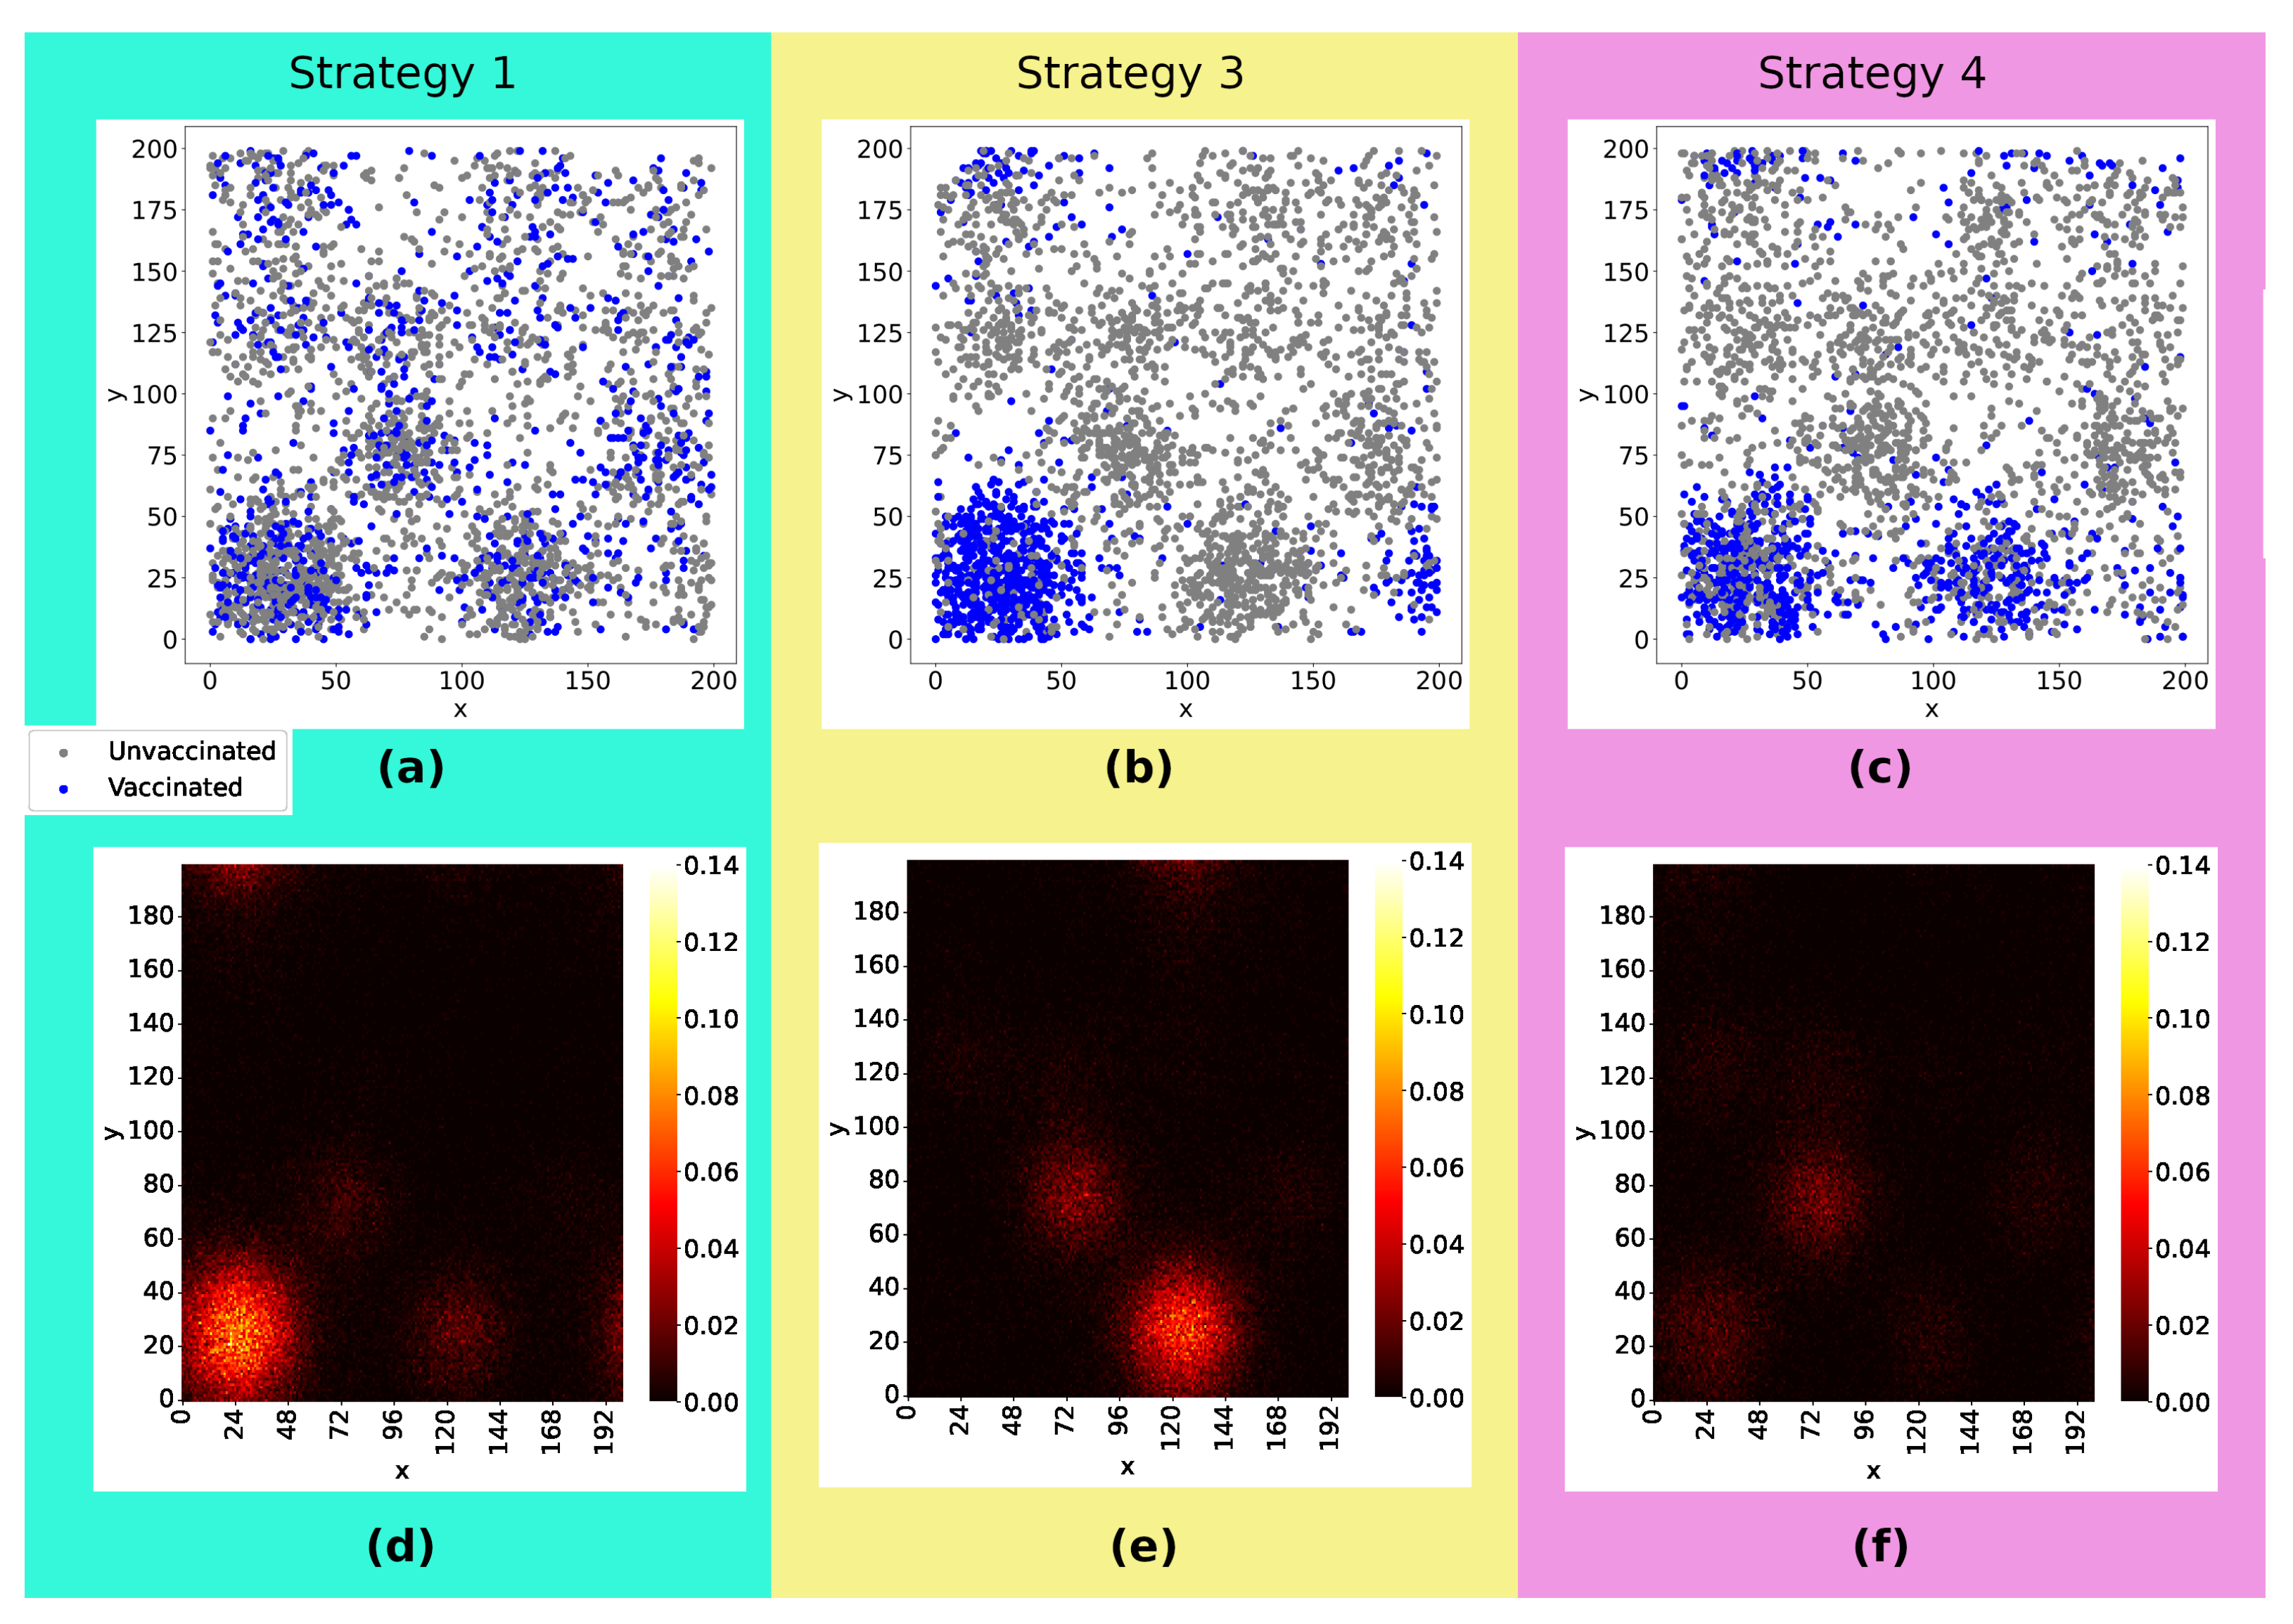
Figure 6((a-c)) illustrate how the vaccines were distributed: In Strategy 1, the doses were equally distributed across the lattice, whereas in Strategy 3, the doses were distributed only in the two denser sub-regions, and in Strategy 4, they are distributed solely in the denser sub-region. The snapshot in
Figure 6((d-f)) depicts heatmaps with the sum of infected, dead, and recovered individuals as well as their spatial distribution 20 weeks after the start of viral spread. Comparing the three strategies, we can notice that Strategy 1 was a less effective strategy, with a higher concentration of infected individuals in the densest sub-region and with viruses reaching more regions of the lattice. The number of infected considering Strategy 3 and 4 is lower than in the first case, with the majority of cases concentrated in the second densest sub-region of the lattice when the doses are distributed only in the denser sub-region (Strategy 3). Strategy 4 emerges as the strategy for best controlling viral spread.
Comparing Strategies 1 and 3 (
Figure 7(a)), the process focusing on the vaccination of individuals initially located in the denser sub-region of the lattice (Strategy 3) reduced the number of infected in
and the number of deaths in
about Strategy 1. As shown in
Figure 7(b), Strategy 4, focused on the individuals initially located in the two denser sub-regions of the lattice, reduced the number of infected in
and the number of deaths in
about Strategy 1. It shows us that vaccination strategies focused on denser regions are more effective than the random distribution (as proposed in Strategy 1). Furthermore, it is important to vaccinate individuals encountered in the denser sub-regions and also consider the neighboring sub-regions to obtain even more efficient results. Comparing Strategies 3 and 4, Strategy 4 reduced the number of infected and dead by 50% compared to Strategy 3, as seen in
Figure 7(c) .
Let’s now delve deeper into the impact of vaccination on unvaccinated individuals as vaccination rates increase considering the spatial strategies.
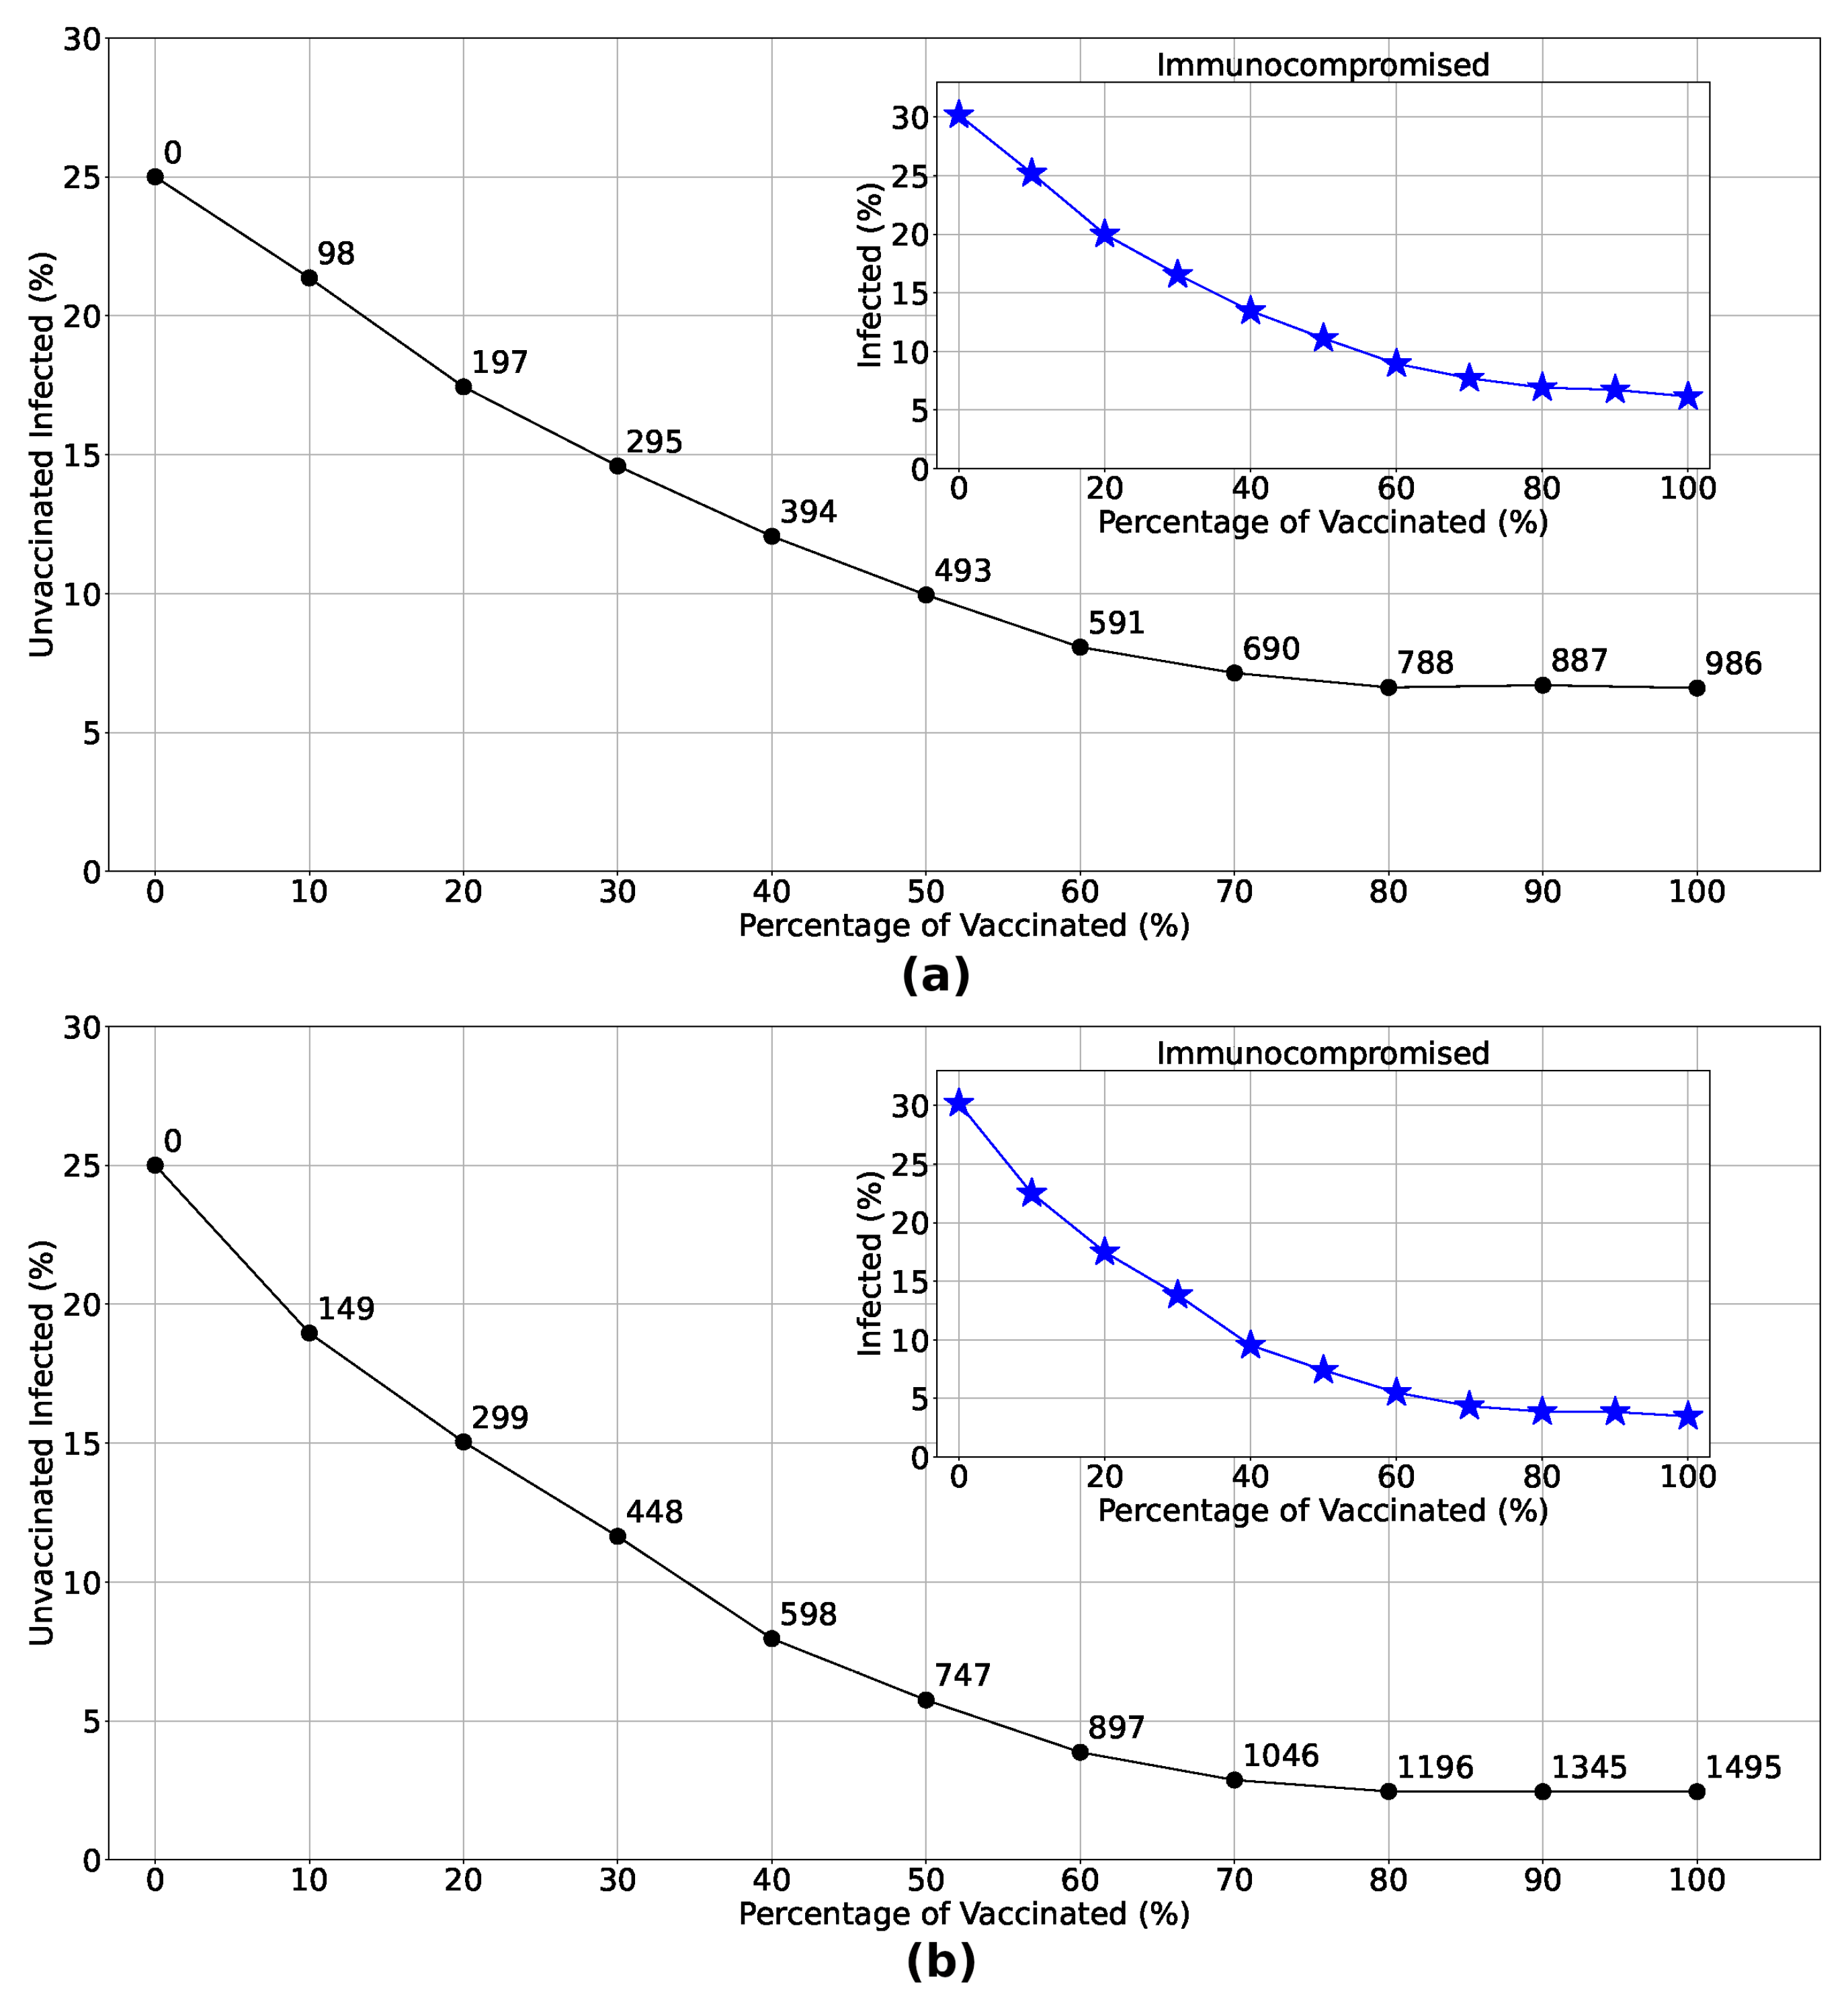
Figure 1 illustrates the exponential decrease in the percentage of unvaccinated infected individuals with the implementation of Strategies 3 and 4. The insets demonstrate a notable reduction in the number of immunocompromised individuals infected when these strategies are employed. Examining the distribution of doses in each strategy (numbers highlighted in the main graphs), it becomes clear that focusing vaccination efforts solely in the most densely populated region yields infection rates comparable to those observed in Strategy 4, particularly when doses are limited. This underscores the effectiveness of prioritizing vaccine distribution and administration in densely populated regions, especially in areas with constrained vaccine availability.
Although Strategies 3 and 4 proved to be more efficient in reducing the number of infected and dead individuals, random vaccination (Strategy 1) is also valuable. It also significantly decreased the number of infected individuals compared to a scenario without vaccines. Furthermore, we reinforce that adopting strategies focused on specific regions can reduce logistical costs and mitigate limitations related to the accessibility, affordability, and acceptability of vaccines, especially in scenarios of low vaccine availability (as occurred with COVID-19, for example).
5. Conclusions
We live in an increasingly interconnected society, where interpersonal interactions and our involvement with nature intensify every day. The increase in these interactions could bring humans into contact with previously unknown pathogens. This fierce social activity causes these same pathogens to evolve and acquire different characteristics, thanks to a process called biological pressure. In this sense, society must continue to develop technologies and innovations, developing and improving defense strategies against the actions of these microorganisms.
We saw that the application of the IABM model to study vaccination strategies allows us to analyze scenarios in which a previously vaccinated individual still has a chance of being infected, depending on the conditions imposed on them, as can be seen in
Figure 3. The methods used in this model are unprecedented, as a vaccinated individual can become infected depending on the dynamics between their immune system and the invading pathogen. The robustness of the model and its credibility are clear in
Figure 4, a scenario where different vaccination percentages are applied. We observed that by increasing the number of inoculated doses, the number of infected and dead people decreases drastically, with no viral spread when at least
of the population is previously vaccinated. The Panel shown in
Figure 4(d) shows the effect of herd immunity, with an exponential reduction in the number of unvaccinated infected people in relation to the increase in the vaccination rate, due to the indirect protection generated by those who receive the vaccine.
In order to analyze strategies considering an insufficient number of vaccines for the entire population, we carried out extensive simulations considering four vaccination strategies, as described in
Table 1. Considering vaccination of immunocompromised people, we observed a drastic reduction in infection and mortality rates in this group, with a decrease of
in the number of infected people and
in the number of deaths over Strategy 1, that a random vaccination process applies to the general population, as seen in
Figure 5.
Strategies targeting spatial disparities were also analyzed, comprising Strategies 3 and 4, whose dose distribution is illustrated in panels
Figure 6(b,c). Observing the
Figure 6(d–f), we see that strategies focused on denser regions are more efficient, generating less viral spread and, consequently, fewer infected and dead people. Drawing a parallel between Strategies 3 and 4 and comparing them with Strategy 1, as seen in
Figure 7, we see that a vaccination strategy that includes the densest region and its neighborhood (Strategy 4) is more efficient than a strategy that focuses only on the densest region (Strategy 3), reducing the number of infected by
and the number of deaths by
, compared to a reduction of
in the number of infected people and
in deaths over Strategy 1. In a scenario considering a greater quantity of doses available, Strategy 4 reduced the number of infected and dead people by 50% when compared to Strategy 3. In another aspect, when the number of available doses is smaller, we observe in
Figure 1 that the number of unvaccinated infected people and the infection rate of immunocompromised people are very close in both strategies, corroborating that, in a scenario of scarce doses, the most efficient strategy should focus on sub-regions with larger agglomerations. In addition to reducing the percentage of infected people observed in vaccination strategies focused on specific sub-regions, these strategies are also beneficial when considering logistical costs, storage and transportation of doses, and limitations related to the accessibility, affordability, and acceptability of vaccines.
Defining increasingly efficient public policies is extremely necessary. In an interconnected society, with complex challenges and the imminent occurrence of new outbreaks, epidemics, and pandemics, it is mandatory to invest in the development of robust models and techniques that provide knowledge and methods that make human life safer, to reduce deaths, economic costs, and losses expenses associated with logistics, and ensuring the survival of our society in the face of an active process of disease spread. In a more specific context, we must develop solid and efficient vaccination strategies, taking into account the indirect protection of those who, for some reason, cannot be vaccinated.
Figure 1.
Population age structure adopted in the model, based on an empiric population [
24]. Immunosuppressed individuals represent
[
25] of the total population.
Figure 1.
Population age structure adopted in the model, based on an empiric population [
24]. Immunosuppressed individuals represent
[
25] of the total population.
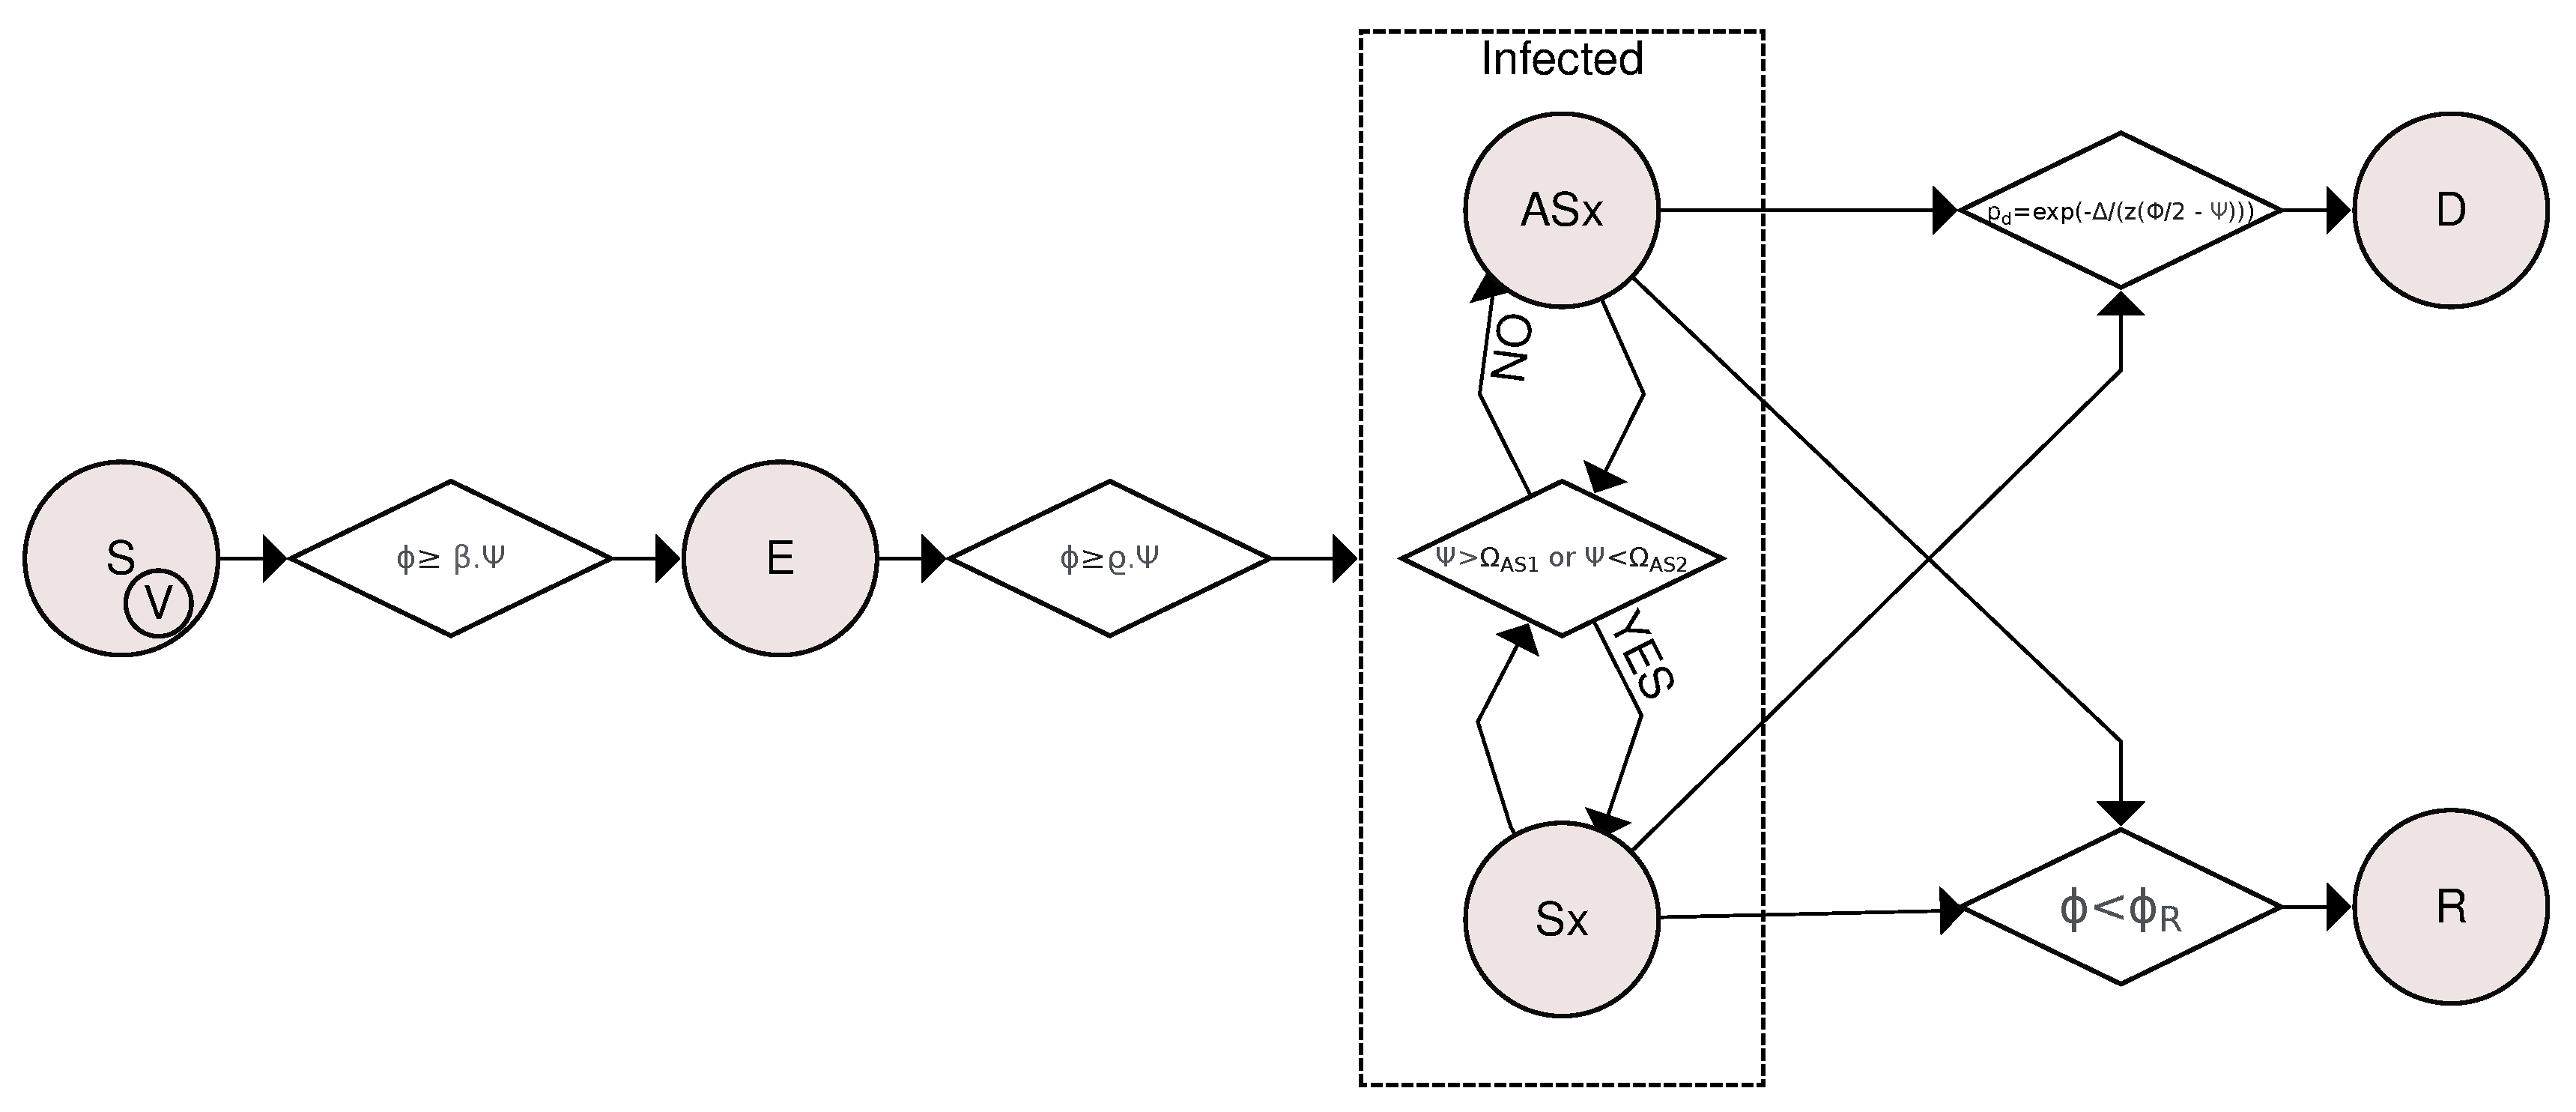
Figure 2.
Flowchart of compartmental transitions based on the SVEIR (Susceptible-Vaccinated-Exposed-Infected-Recovered) model. Transitions are determined by considering the viral load and how the organism fights the pathogen through innate and humoral immune responses. A susceptible or vaccinated individual is exposed if their viral load is greater than or equal to , where is a rate and is the level of the individual’s innate response. If for at least 12 hours straight, an exposed individual becomes infected. The Asymptomatic⟷Symptomatic transition was based on how the innate response is affected by viral activity, becoming symptomatic if the immune response is exacerbated ( ) or if the immune system is weakened (). Otherwise, the individual is considered asymptomatic. Asymptomatic and symptomatic individuals are likely to die or recover if their viral load is less than .
Figure 3.
Typical variation of Innate Response (
), Viral Load (
) and Humoral Response (
) for three distinct situations:
(a) is an unvaccinated individual that recovered after infection,
(b) is a vaccinated individual that got sick and recovered and
(c) a vaccinated individual that not got sick. We see that, in
(a), an unvaccinated individual can reach much higher viral load levels when compared to a vaccinated individual, leading to the appearance of symptoms. We observe in
(b) a float down in the innate response in the acute phase of the infection, with a rise and fall dynamic between the viral load and the levels of humoral immunity of the vaccinated individual who ends up being infected by the virus. After recovery, the individual presented a reinforced humoral response, as observed in some real cases of people infected with SARS-CoV-2 [
34]. In
(c), we see the typical behavior of a vaccinated individual who, even after having contact with the virus, the immunity induced by the vaccine is sufficient to prevent him from becoming sick, destroying the viral particles and keeping the individual uninfected.
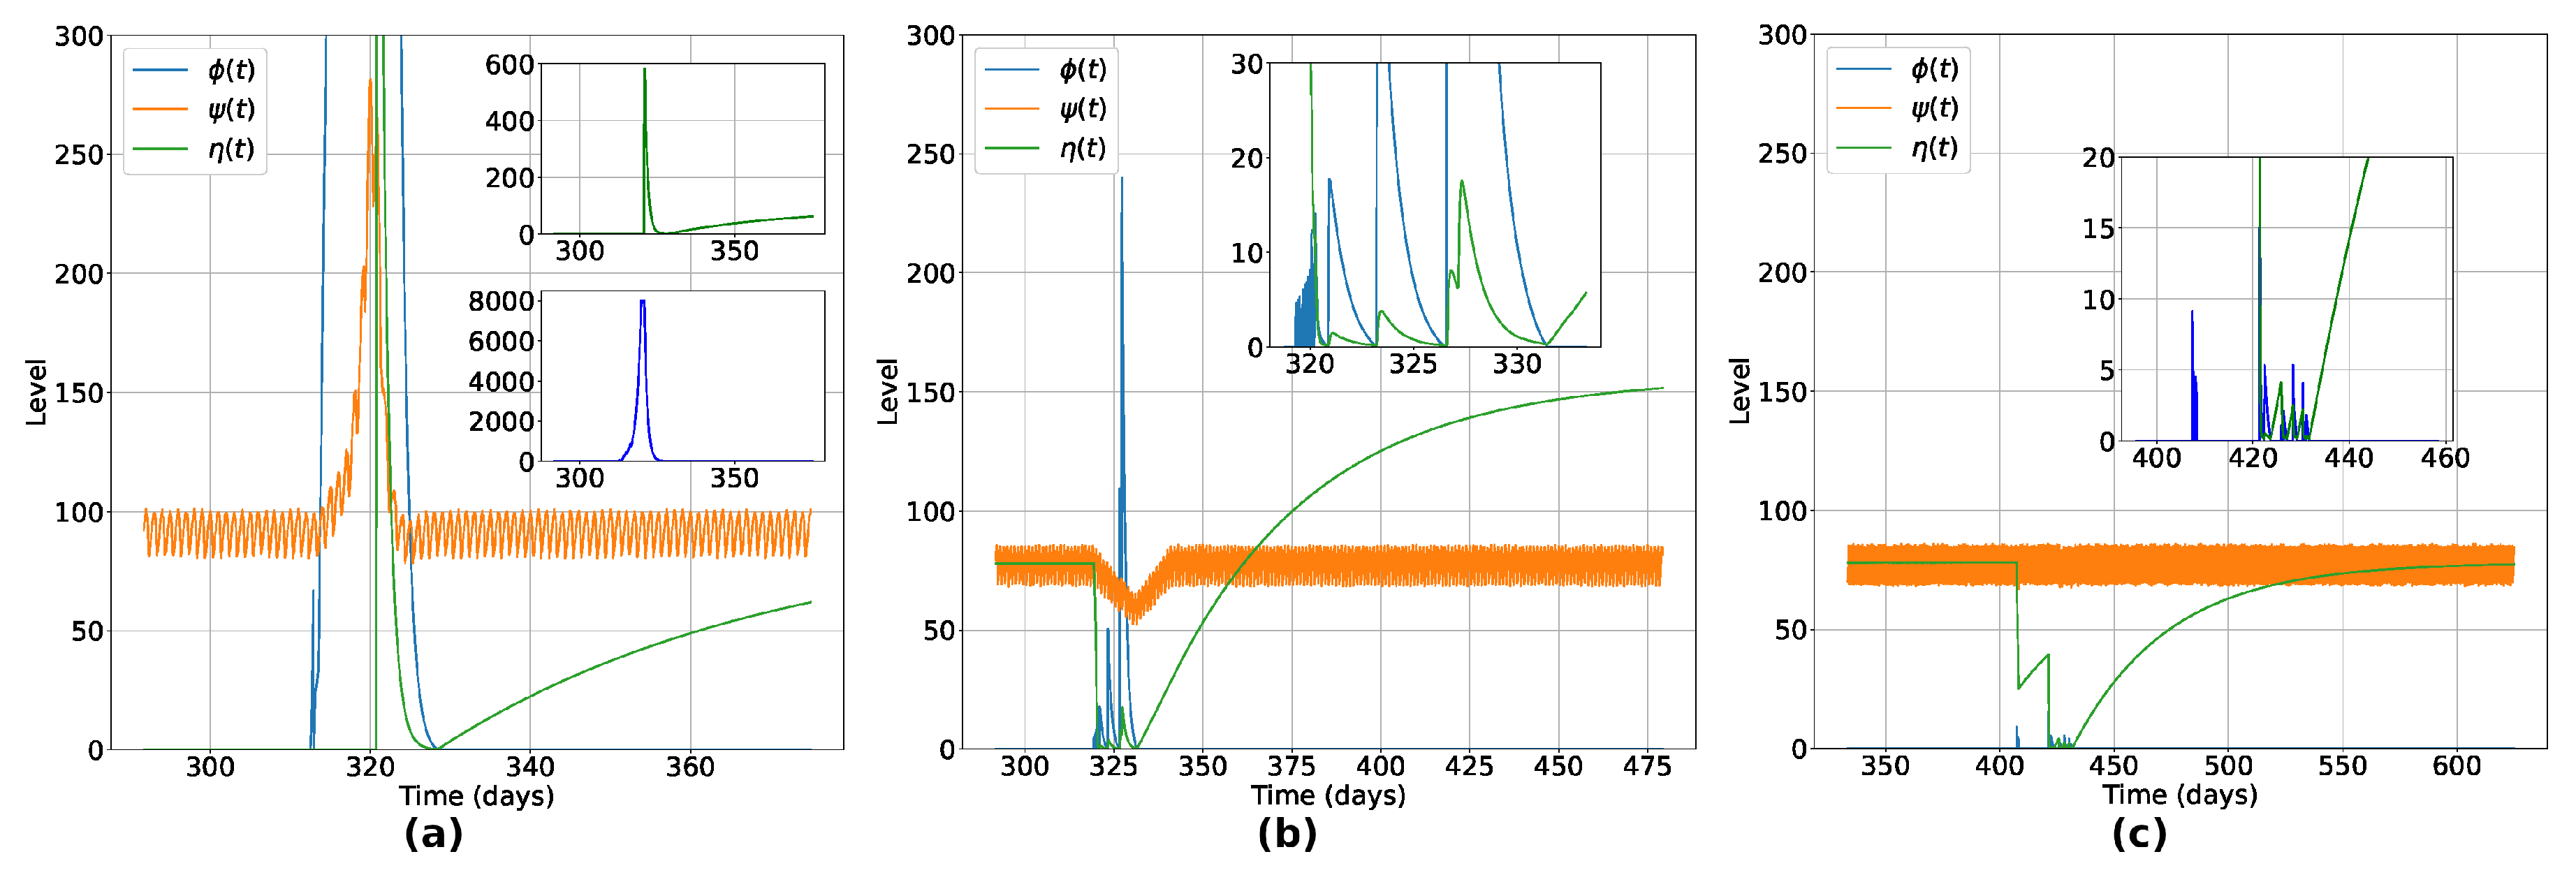
Figure 4.
Percentage of infected ((a)), recovered ((b)) and dead ((c)) individuals considering Strategy 1. Panel (d) shows the variation in the percentage of unvaccinated individuals who become infected in relation to the increase in the number of vaccinated individuals. The number of doses is highlighted at each point of the graph. (a), (b) and (c) certify that the vaccination process inserting a non-zero level of humoral immunity induces the reduction of infected and dead individuals, vanishing the outbreak with rates of vaccination greater than 70%. Panel (d) shows the herd immunity effect, with exponential reduction of infection of unvaccinated individuals while the number of vaccinated individuals increases. In particular, for the vaccine efficiency used, with 70% of the total individuals vaccinated, less than 2% of the unvaccinated group became infected, highlighting the indirect protection due to the vaccinated individuals in the lattice.
Figure 5.
The bar chart shown in (a) presents the difference between a scenario without vaccination and a scenario considering the vaccination of 100% of immunocompromised individuals (Strategy 2). Without vaccination, of the immunocompromised became infected, with the death of of the same group. Vaccinating of these individuals, the percentage of infected drops drastically to without deaths in this group. Considering the application of the same number of doses, the curves of infected ((b)) considering Strategies 1 and 2 show that Strategy 2, focused on the immunocompromised individuals, was more efficient in reducing the number of infected and dead. Observing the inset, we notice that Strategy 2 reduced the number of infected in and the number of dead in about Strategy 1.
Figure 6.
Panels ((a)-(c)) show the initial position of agents, differentiating vaccinated (blue points) from unvaccinated (gray points) individuals. The same amount of doses were applied in the three cases. Panels ((d)-(f)) present heatmaps with the position of each infected and the concentration of infected individuals per site 20 weeks after the viral spread has started, constructed by taking the average of 300 experiments. Comparing the three strategies, we can notice that Strategy 1 was less effective, with a higher concentration of infected individuals in the densest sub-region and the virus reaching further. The number of infected considering Strategy 3 and 4 is lower than in the first case, with the majority of cases concentrated in the second densest sub-region of the lattice when the doses are distributed only in the denser sub-region ((e)) and more effective control of viral spread in Strategy 4 ((f)). Rate of vaccination: 10%.
Figure 7.
Comparing Strategies 1 and 3 ((a)), the process focusing on vaccinating individuals initially located in the denser sub-region of the lattice (Strategy 3) reduced the number of infected by and the number of deaths by about Strategy 1. As shown in (b), Strategy 4, focused on vaccinating individuals initially located in the two denser sub-regions of the lattice, reduced the number of infected by and the number of deaths by about Strategy 1. It shows us that Strategies of vaccinating focused in denser regions are more effective than random distribution (as proposed in Strategy 1). As seen in (c), it is important to vaccinate individuals encountered in the denser sub-regions, also considering the neighboring sub-regions to obtain even more efficient results. With the same number of doses, Strategy 4 reduced the number of infected and dead by 50% compared to Strategy 3.
Figure 8.
Variation in the percentage of unvaccinated infected given the increase in the vaccination rate considering Strategy 3 (Panel (a)) and Strategy 4 (Panel (b)). Analyzing the number of doses administered in each strategy (numbers highlighted at each point in the main graphs), we see that vaccinating only in the densest region resulted in infection rates for low vaccination percentages very similar to those observed in Strategy 4, given the same number of doses. This further corroborates that focusing on the distribution and administration of vaccines in the most crowded regions is the most efficient strategy in a scenario with few doses available. This is also reflected in the protection of immunocompromised individuals, as seen in the insets.
Table 1.
Description of the group(s) vaccinated in each vaccination strategy.
Table 1.
Description of the group(s) vaccinated in each vaccination strategy.
| Strategy |
Vaccinated group |
| Strategy 1 |
General population, not considering spatial and individual’s characteristics (random vaccination). |
| Strategy 2 |
Immunocompromised individuals. |
| Strategy 3 |
Individuals initially located in the denser sub-region of the lattice. |
| Strategy 4 |
Individuals initially located in the two denser sub-regions of the lattice. |
