1. Introduction
Improving vehicle efficiency presents a considerable challenge for contemporary manufacturers due to the necessity of complying with governmental regulations and environmental standards that aim to combat global warming. Significant portions of the emissions that have an adverse impact on the environment arise from petrol-powered vehicles that utilize fossil fuels.
In the 1930s, there was a limited number of vehicles due to underdeveloped technology. These vehicles were slower and had lower speeds than those powered by internal combustion engines [
1]. However, substantial advancements in propulsion technology, especially in the areas of electricity and electronics, have enabled electric vehicles to become a cutting-edge technology in the automotive industry. The automotive sector is presently creating and executing solutions to satisfy environmental protection demands, particularly regarding eco-design. Control systems are being created to improve the conversion of energy and enhance the efficiency of engines and transmission systems in electrically driven vehicles. These cars may run on energy from photovoltaic, wind, or biomass according to global criteria [
2].
The integration of electric vehicles is becoming increasingly important and attractive. Many due to its numerous advantages and low-maintenance costs covet this technology. The car can be used as a chemical energy storage system in the battery, which can then be redistributed as electrical energy [
3].
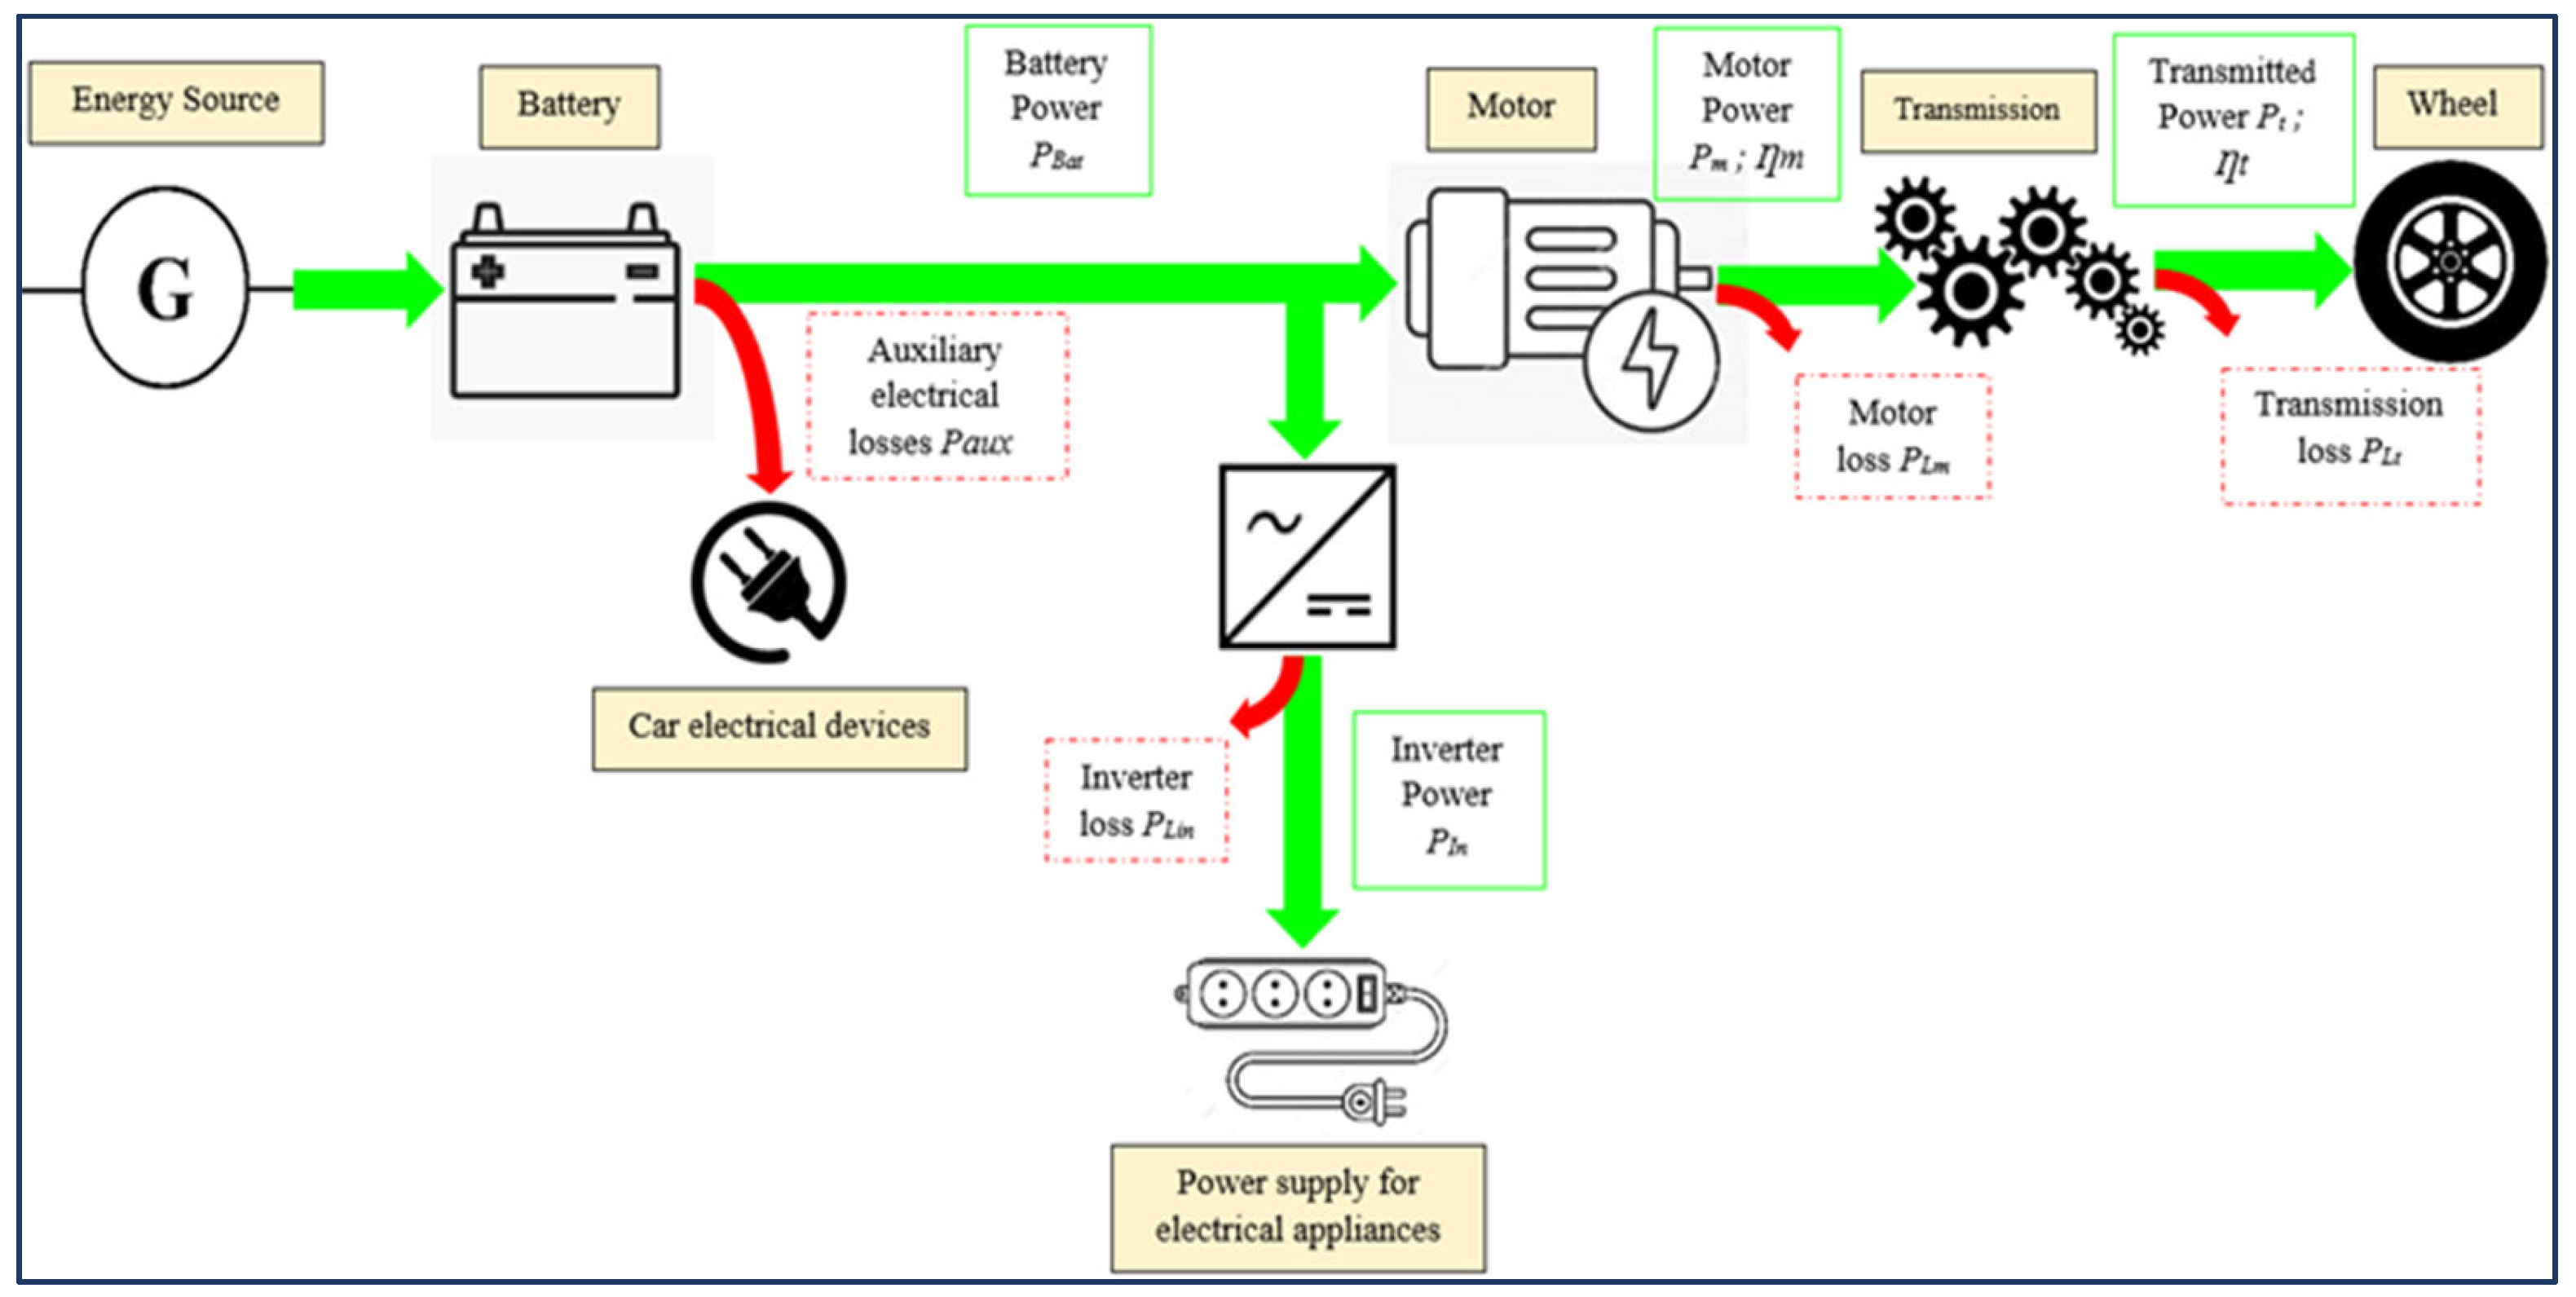
The battery is an essential component for an electric vehicle since it replaces the fuel tank in a vehicle with a combustion engine. The battery stores energy produced by an electrical source. This energy is then supplied to an inverter, which converts the direct current into alternating current and sends it to the motor, which subsequently drives the wheels to propel the vehicle [
4]. During this process, energy is dissipated. The motor's torque and speed are converted [
5] into the required mechanical power for the vehicle to move during the transmission process. Between the inverter, motor, and transmission, electrical and mechanical energy losses occur [
6]. These losses are dependent on the operating and usage conditions of these three components.
For an electric vehicle, electrical equipment is a source of dissipated energy. Similarly, resistance to motion such as rolling resistance, aerodynamics, gradient resistance and acceleration resistance also contribute to energy dissipation. Therefore, reducing these losses provides an opportunity to make electric vehicles more efficient [
7].
Extensive research is currently dedicated to enhancing the capabilities of electric vehicles. Mechanical transmission-based models have been created to this end [
8]. The research paper [
9,
10] [
11] offers a technique for programming gear changes in electric vehicles, which aims to optimize the gearshift points and establish speed increase or decrease points that will enable the motor to function optimally. The study demonstrates that this speed optimization leads to a marked improvement in vehicle performance. An improvement to enhance the dynamic performance of electric vehicles [
12] [
13] [
14] has been suggested via a two-speed transmission with a drive motor. Researchers have examined a novel two-speed Inverse Automated Manual Transmission (I-AMT) [
15] and, as a result of optimization, gear shifts are executed seamlessly with the aid of anticipatory control.
A study [
16] was conducted to develop an optimization strategy for speed programs to increase the energy efficiency of electric vehicles. The researchers used Pontryagin's minimum principle and numerical methods to linearize speed, taking into account both power and distance travelled. A further model entails controlling the energy of an electric vehicle's battery through an approach that relies on Dynamic Programming (DP) [
17]. This technique aims to minimize the battery's energy consumption, enhancing its longevity.
A system design is presented in this study to enhance comprehension of the power dissipating components of the system. To obtain the equation giving the motor torque, an electromechanical model of the BLDC motor is created. Then, vehicle modelling is conducted to consider the dynamic outcome during its travel and the resistances to be surmounted. The engine power and torque values are quantified subsequently to evaluate the vehicle's performance with dynamic parameters. The battery and photovoltaic system are modelled, with the determination of power lost to assess the remaining power available to other devices. To observe the electric vehicle prototype's electrical behavior, simulations are conducted on MATLAB/SIMULINK.
2. Materials and Methods
2.1. Description of the Prototype Design
This vehicle's prototype is an electric propulsion system that uses renewable energy sources such as photovoltaics, an alternator, and mains charging. The photovoltaic system comprises solar panels and a regulator. The batteries store energy as chemical energy, powering the BLDC motors and a controller that manages the motor's speed. The motors are integrated into the wheels. The pedals operate the alternator, which supplements the photovoltaic system.
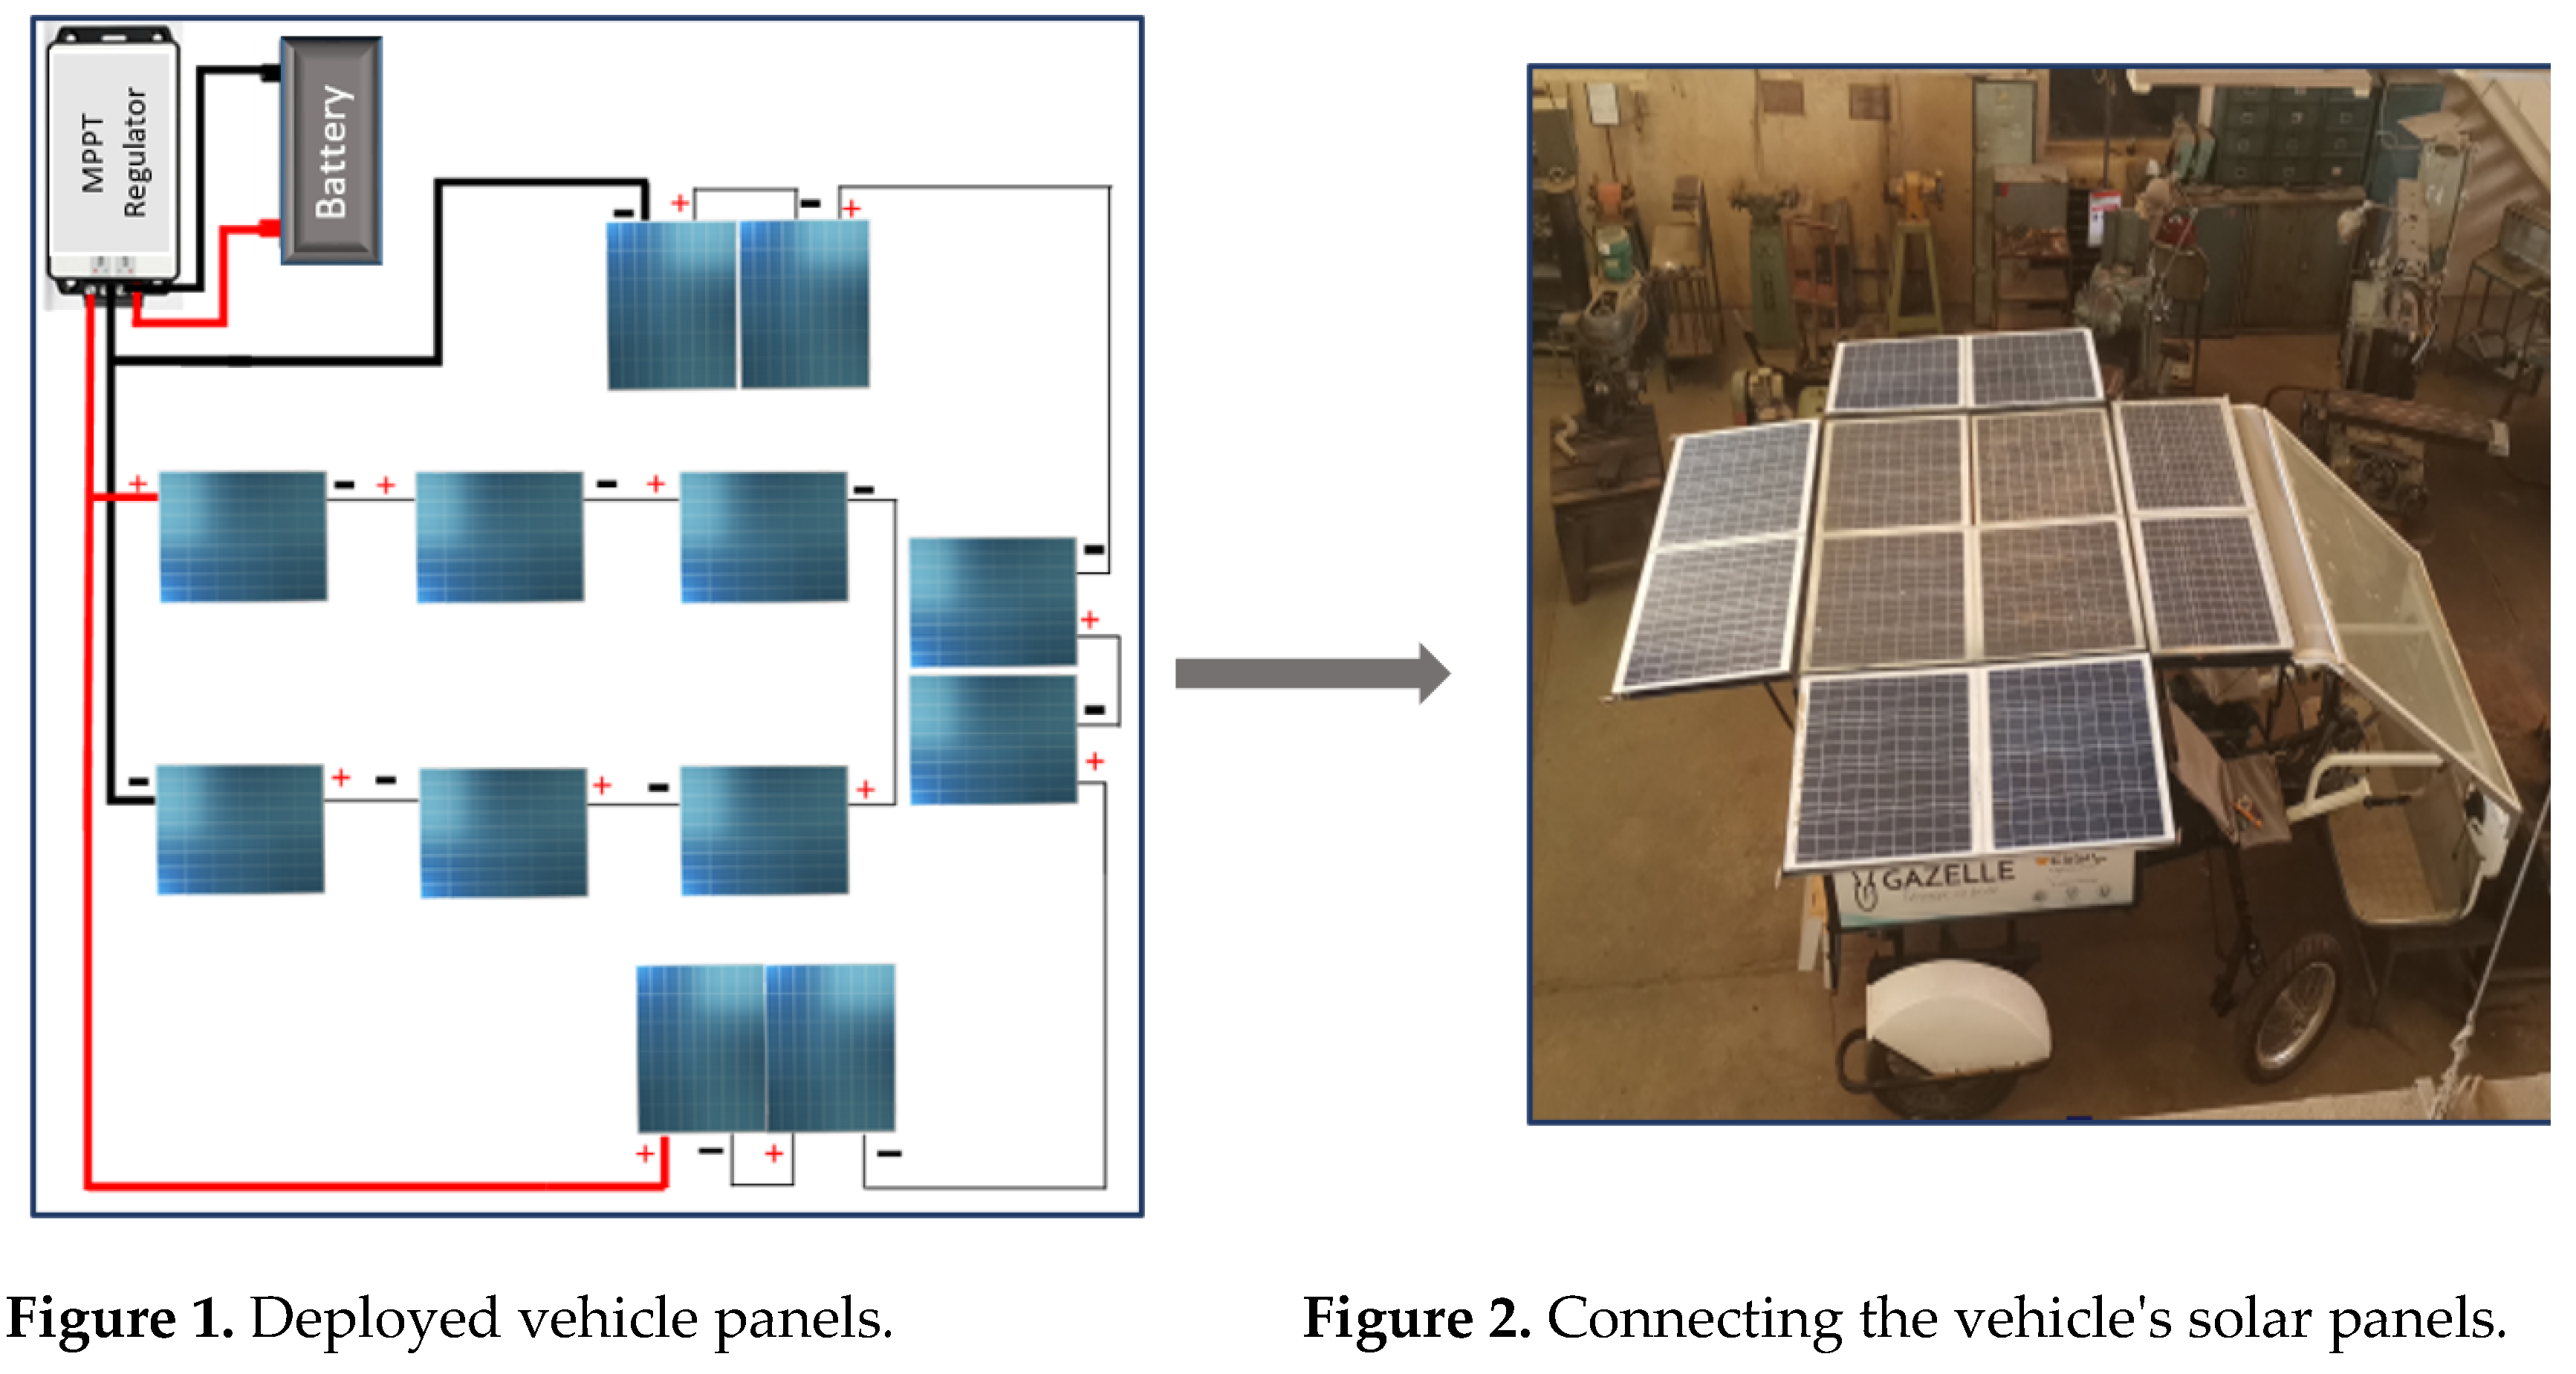
The circuit that generates electrical energy comprises twelve photovoltaic panels divided into two compartments. Each compartment is connected in series to achieve a nominal voltage of 48 V. To sustain a maximum load current of 7 A, the two compartments are subsequently connected in parallel while maintaining the voltage at 48 V. The MPPT regulators manage each compartment. The alternator, powered by the mechanical energy, additionally replenishes the battery through an AC-DC converter. In addition, the circuit comprises protective devices such as relays and fuses.
Sixteen cells were used, each with a nominal voltage of 3.65 V and a capacity of 100 Ah. Therefore, the nominal voltage of the 16 cells is 58.4 V, resulting in an energy output of 5120 Wh, of which 4000 Wh is usable. The nominal voltage is attained through a charged voltage of 3.65 V per cell.
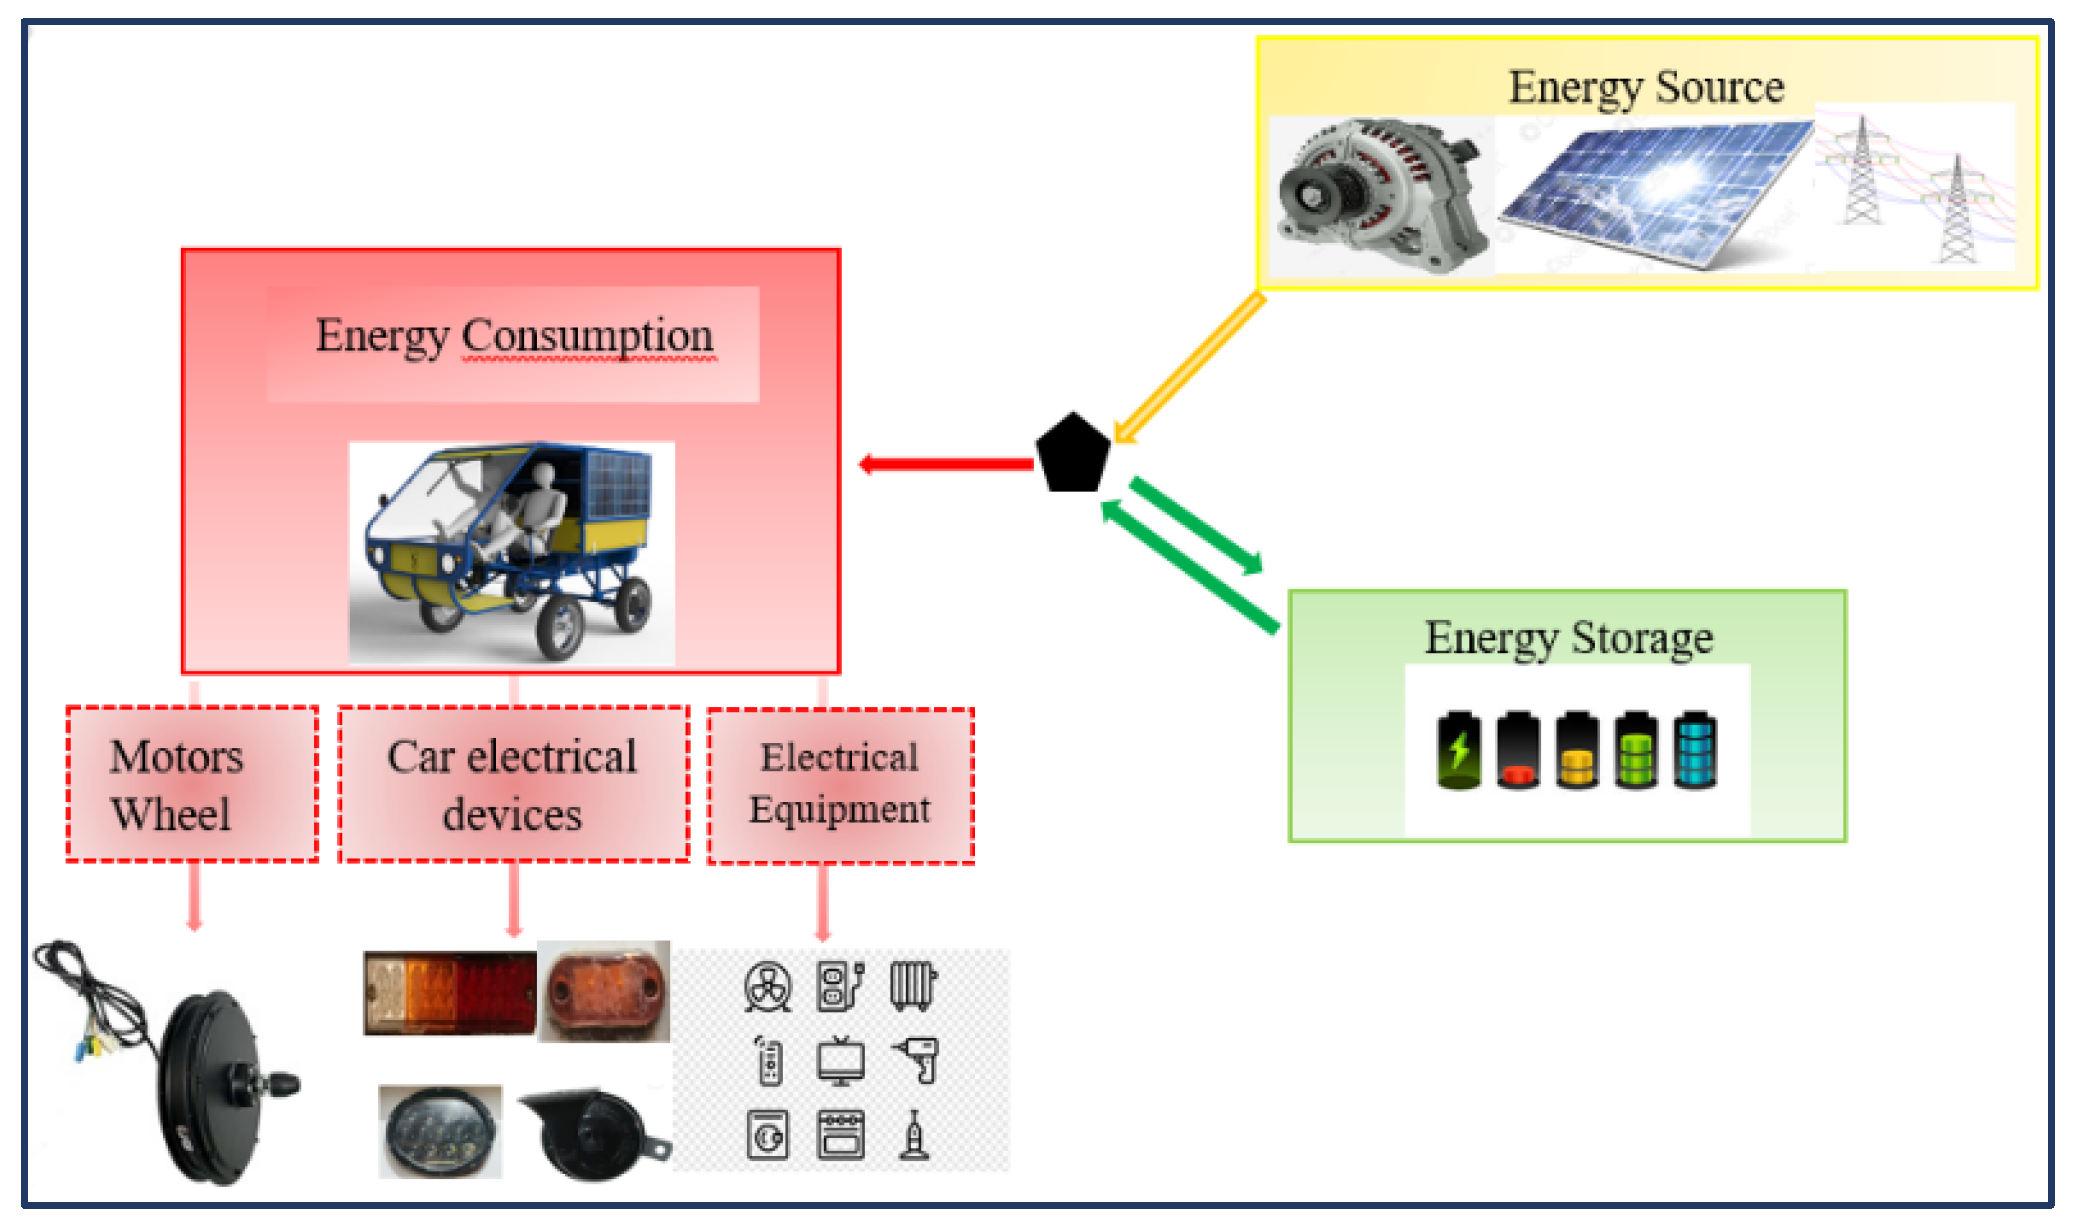
Figure 3.
Vehicle energy usage.
Figure 3.
Vehicle energy usage.
The figure below shows the system composed of the following elements
Three energy sources, namely a photovoltaic source, a mains electricity source and a mechanical source produced by the alternator;
An energy storage component, which is the battery.
The electric motor is the primary element consuming energy produced by an electric vehicle. The remaining energy is used by various vehicle equipment such as lights and horn, while household electrical appliances use the rest
2.2. Mechanical and Electrical Model
Once a battery is charged in an electric vehicle and during movement, many different losses are observed. Similarly, we have losses in the motor, as previously stated [
18]. Losses in the electric motor include Ohmic losses, ferrous losses, diffusion losses, and mechanical losses [
19].
In electric propulsion, mechanical and electrical losses are significant during movement from the battery to the transmission and on to the wheels. Some studies [
20,
21] have explored performance while considering these losses. It is also crucial to design and control a loss-minimization system that considers the characteristics of electric vehicle components, their technology, and the movement conditions and use cases. The electrical accessories of the vehicle also consume power.
Figure 4.
Electrical vehicle components.
Figure 4.
Electrical vehicle components.
2.2.1. Electric Motor Modelling
Brushless BLDC technology is used for the motors. [
22,
23] (Brushless Direct Current). These are synchronous motors that rotate at the same speed as the voltage source that powers them. Two types of control are available. [
24] As with synchronous motors, for steady-state operation, we employ scalar control based on the static model of the motor [
5,
25], and for the instantaneous regime, we have vector control based on the dynamic model.
Motor control connects the battery and the motor enabling the battery to power the motor through the throttle mechanism. The control system further converts the DC power supplied by the battery to AC, facilitating current switching in the stator windings of the AC motor. Technical term abbreviations are clarified during their first usage.[
26].
Taking G as the transmission ratio and Cm as the brushless motor torque, we will obtain.
Or the angular velocity and angular acceleration are given by the following equations:
The torque associated with the angular speed of the motor is then written as:
Replacing
Ca with its formula in equation (3) yields the equation and efficiency η, with the angular acceleration being:
If the length is denoted by
l, the radius of the coil by
rr , the number of turns by n, the magnetic field by
B, and the current by
I, then the torque of the motor can be calculated through the following equation:
Note ɸ the total flux passing through the coils.
It is a constant of the motor that depends on the number of coils in the windings, the number of pole pairs, and other design parameters of the motor.
According to Equation (8), the motor torque is proportional to the induced current I and depends on the motor power supply voltage Vs and the induction resistance Rm following Ohm's law. If the motor functions as a generator, it generates a voltage named Vm.
With
vm being the velocity of magnetic field lines, the motor has two armatures and
n turns, its value is obtained by:
with
One can use the constant
Km as in the torque equation to obtain:
This voltage opposes the supply voltage and reduces the current in the motor; thus, the voltage difference is:
According to the previous equations:
This relationship shows that the current decreases as the angular velocity increases.
Table 1 shows the power constants [
19] in the BLDC motor depending on the operating power.
The main characteristics of the motor are given in the table below 2:
Table 2.
main characteristics of the motor.
Table 2.
main characteristics of the motor.
| Motor loss |
Motor 2-5 kW |
Motor 100 kW |
| Nominal speed |
N |
560 rpm |
| Nominal torque |
C |
51.58 N.m |
| Nominal voltage |
V |
48 V |
| Nominal Current |
I |
7 A |
| efficient |
Ƞ |
85 % |
| Power factor |
Cos ψ |
0.9 |
| Operating power |
Pem |
3000 |
| Inductance |
L |
0.8 H |
| Iron loss coefficient |
|
0,1 |
| Copper loss factor |
|
1,5 |
| Wind loss coefficient |
|
10-5
|
| Speed |
v |
58.62 rad/s |
| Resistance |
R |
6.85 Ω |
| Constant losses |
C |
20 |
Let us substitute this value into the couple's equation.
2.2.2. Vehicle Dynamics Modelling
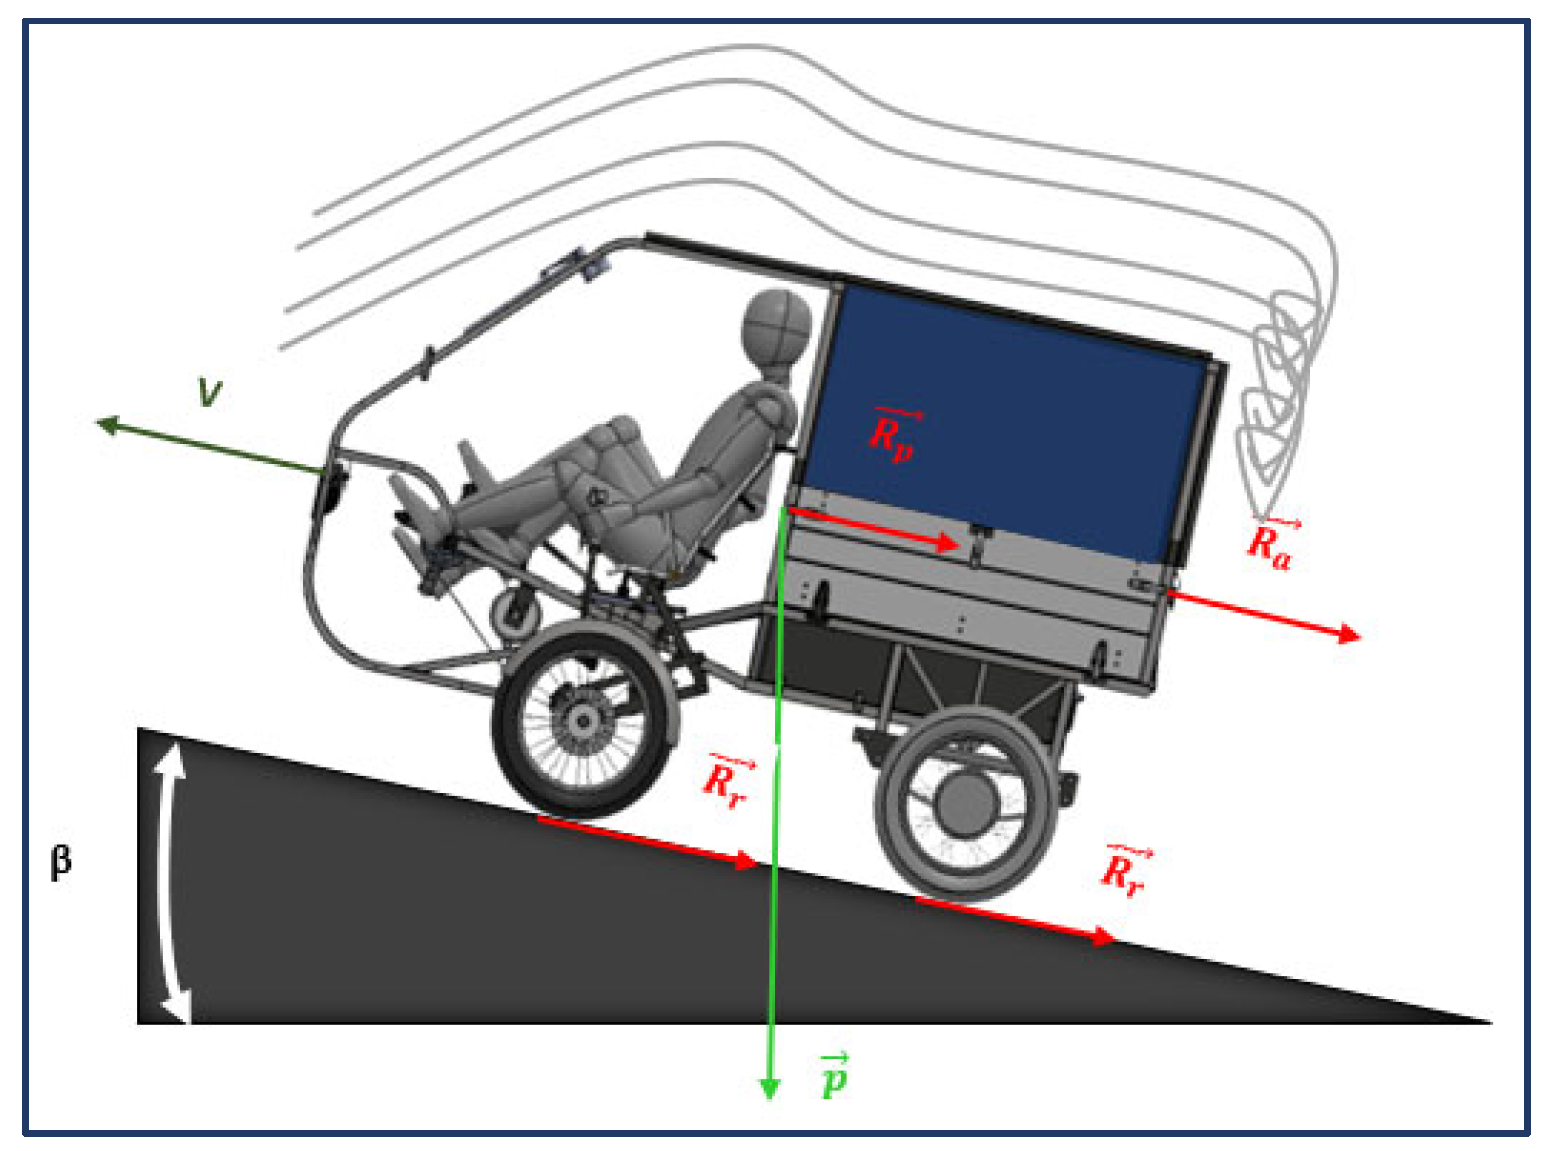
Three main parameters [
27]that prevent the vehicle from moving out of position, assuming uniform movement, are:
Figure 5.
Model of the vehicle.
Figure 5.
Model of the vehicle.
Figure 6.
Forces acting on the vehicle.
Figure 6.
Forces acting on the vehicle.
Each parameter creates a force that resists the movement of the electric vehicle, resulting in a torque that acts against the wheels [
28]. Thus, the theorem of dynamic resultant in the assumption of uniform motion provides:
In this equation, m represents the vehicle's mass, v is the electric vehicle's linear speed, and β is the incline angle of the slope. Fr is the sum of the resistance forces.
Resistants [
19,
29,
30] that vehicles must overcome to move are:
For aerodynamics resistance:
For Acceleration resistance:
For Slope resistance:
The resistive torque,
Cr, is the total of the resistive torques generated by each resistor that needs to be overcome. This value can be obtained using the following equation:
According to prior formulas, the torque can be calculated by substituting values and linking each resistance to its corresponding resisting torque:
For a Brushless motor with constant power, one will have.:
By using the obtained equations, we can deduce the following equation by substituting into the equation (22):
The equations (1) and (3) give, when replacing
et
:
For the value of
Im, the mass exceeding 5% of the total mass is taken into consideration.
By substituting equation (2) and (19) into equation (31), we obtain:
2.2.3. Battery Model
It is crucial to understand and quantify the power of the battery. The following equation gives us the relation for determining the power in the battery.
The available stored power is represented by PBat, while PBat.init represents the value of available power at a voltage of 48V and system current before use. The alternator also serves as a mechanical source with a power of 400W.
As previously described, power losses are primarily due to the forces required to move the vehicle. Another portion of the power loss Paux results from the use of auxiliary components in the vehicle and is estimated to be 100 W.
For the purposes of battery modelling in electric vehicle applications, we consider it as an equivalent circuit. [
31]the static model. The battery has a nominal voltage of 48 V.
where is
E the potential difference across the capacitor,
VCO is the open circuit voltage and
Rb is the internal resistance. The open circuit voltage is a function of:
Ou Tbat represents the battery temperature, while SOC indicates the battery's state of charge.
Therefore, the state of charge of the battery is provided [
32] by the following relationship:
Considering an interval in which the battery's state of charge is measured [
33], We take e as the 10 km interval, i.e. after every 10 km we measure the state of the battery, which gives [
34].
The battery's state of charge is the percentage of electrical charge that remains after it has been used. This characteristic is estimated by measuring the battery's current and voltage. It is a non-measurable attribute for a specific battery [
35]. However, estimation methods [
36] are used to determine its estimated value.
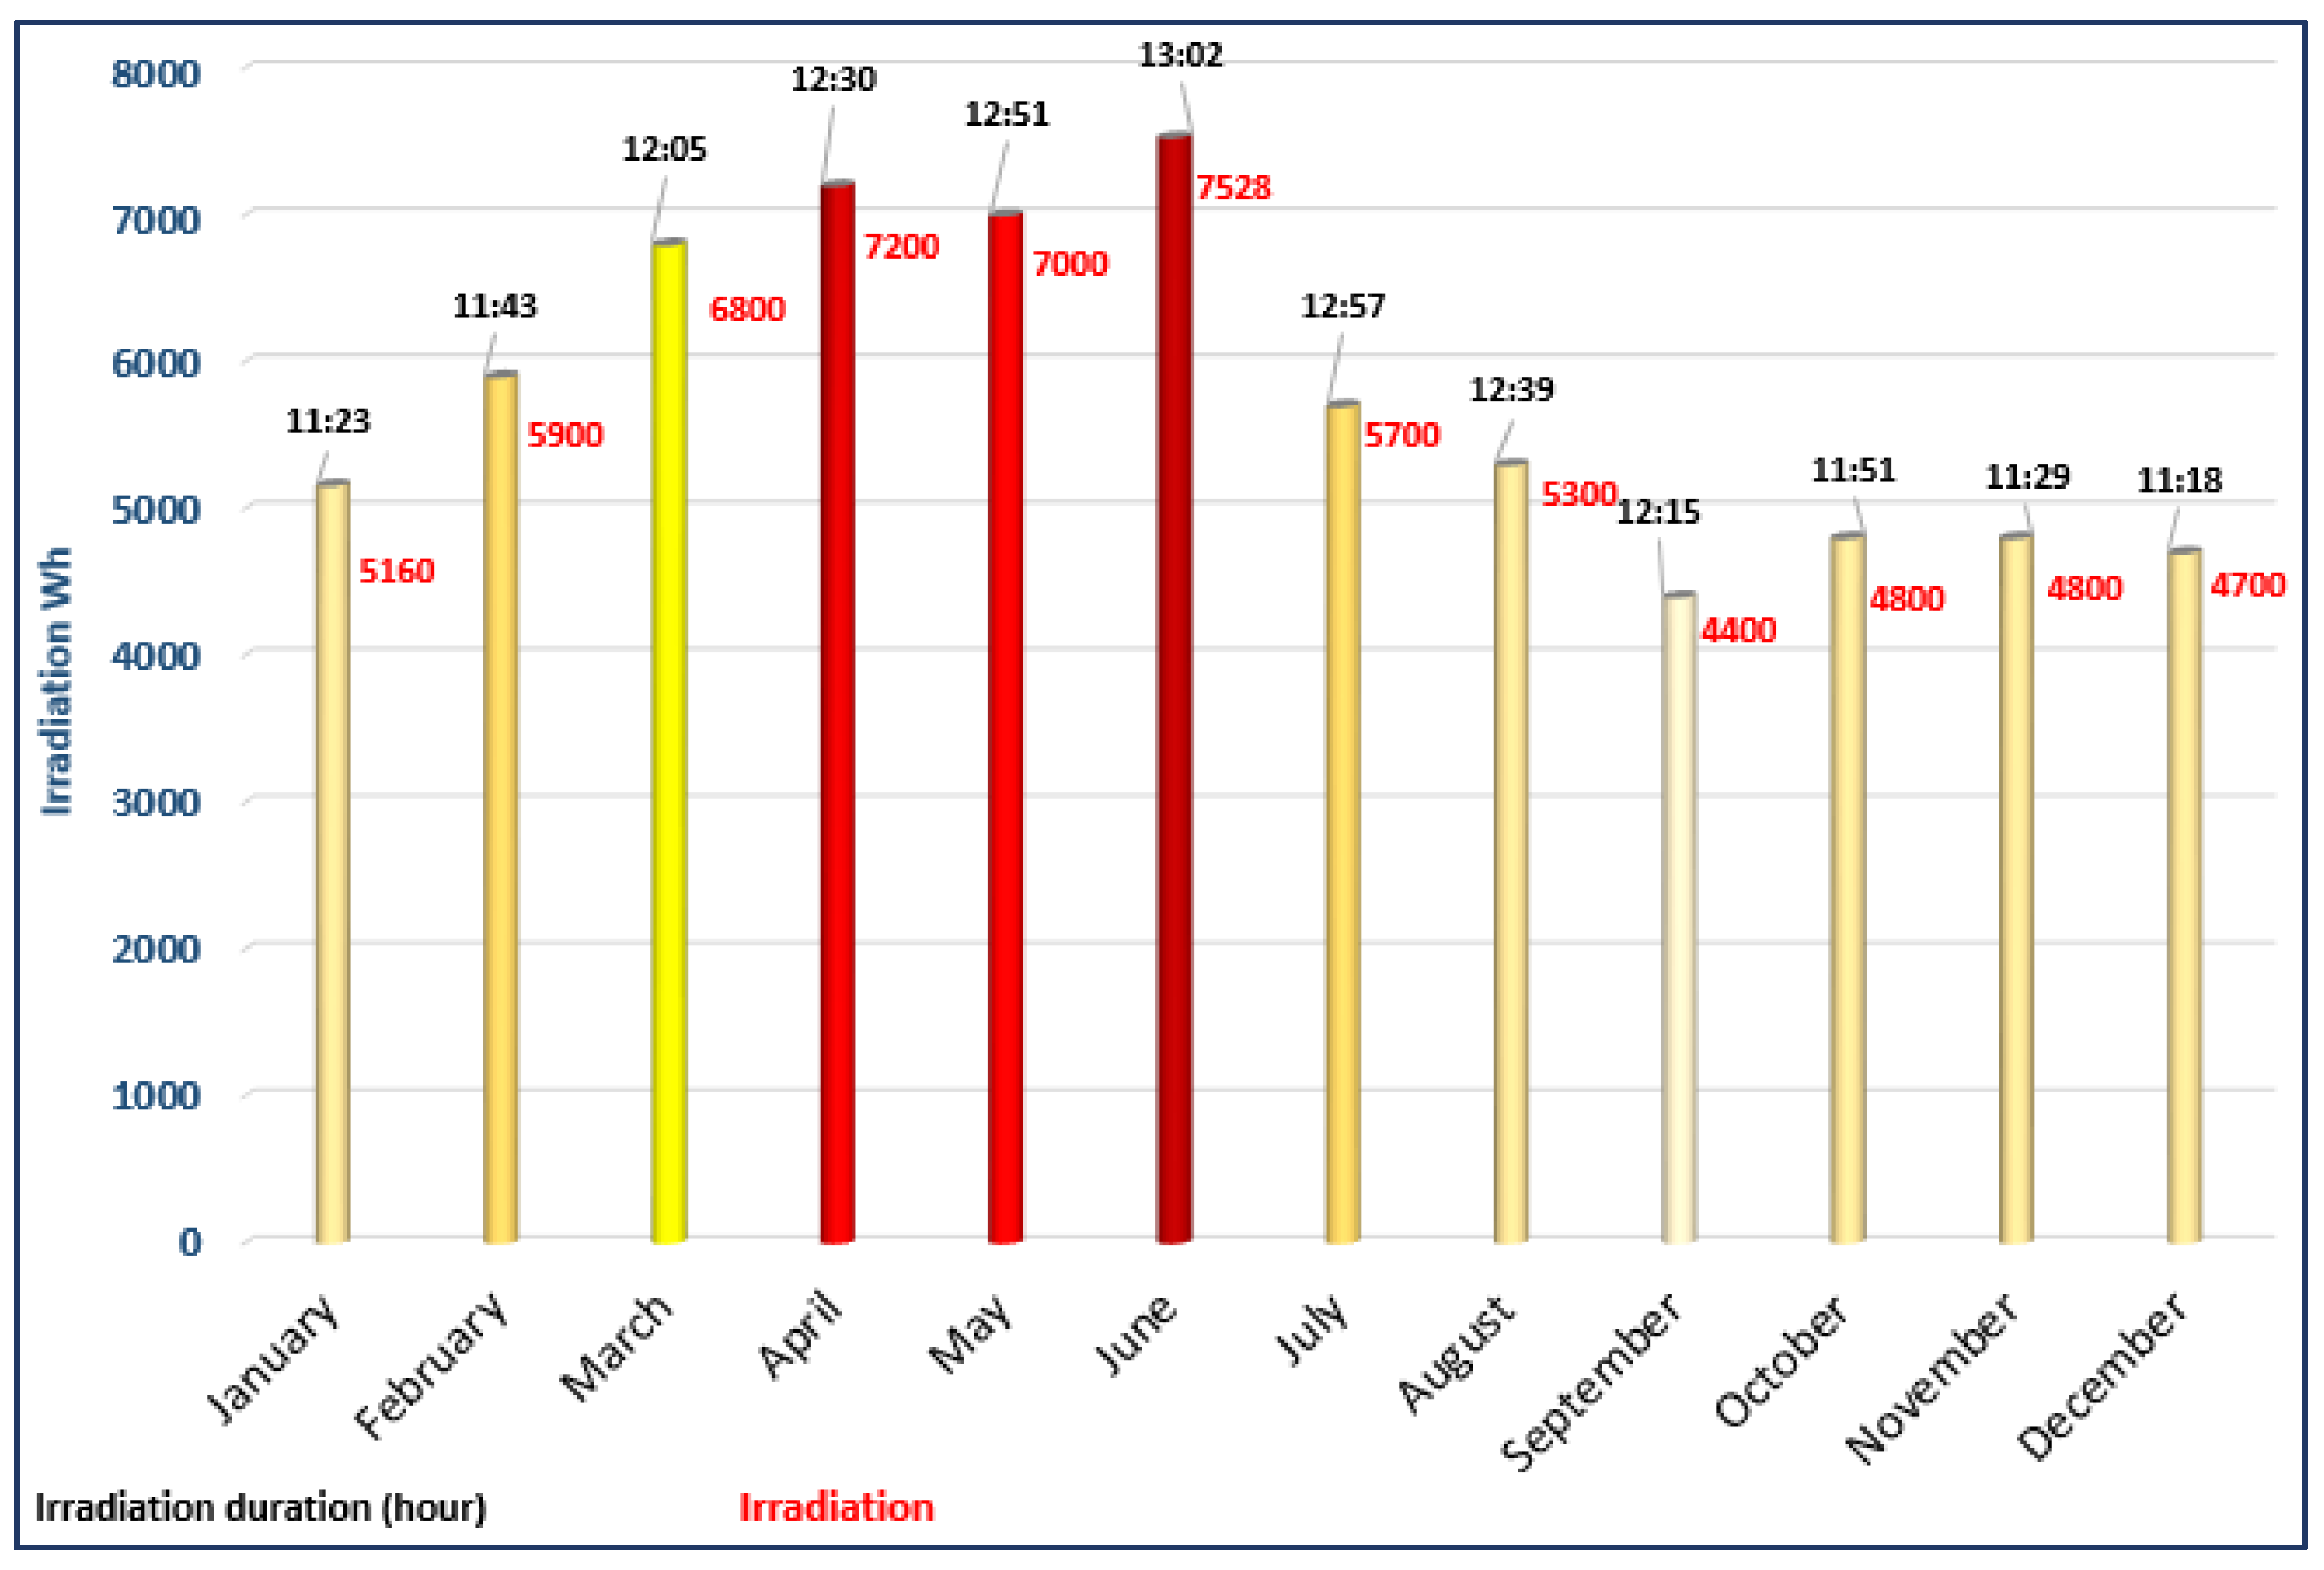
To determine the total power, we calculate the power received by the photovoltaic panels [
37]. For the area under consideration, the irradiation is 1000 W/m2. For the considered area, the irradiation is 1000 W/m2. This power is influenced by multiple geographic and climatic parameters [
38,
39] as shown in table 4.
Figure 7.
Irradiation and Irradiation Duration in Senegal [41].
Figure 7.
Irradiation and Irradiation Duration in Senegal [41].
Figure 8.
Direct Normal Irradiation of Senegal [
40].
Figure 8.
Direct Normal Irradiation of Senegal [
40].
Figure 9.
Global horizontal irradiation of Senegal [
40].
Figure 9.
Global horizontal irradiation of Senegal [
40].
The following tables give the solar irradiation components for the location and geographical coordinates.
Table 3.
Localisation.
| Parameter |
Symbol |
| Country |
Senegal |
| Site |
Dakar |
| Lattitude |
14.71° |
| Longitude |
-17.4° |
| Max. temp |
36 °C |
| Min. temp |
12 °C |
Table 4.
Irradiation Parameters.
Table 4.
Irradiation Parameters.
| Parameter |
Symbol |
Value |
| Photovoltaic surface |
Spv |
5,1122 m2 |
| Horary angle |
ω |
46 |
| Declination (June) |
δ |
23°27' |
| Duration of sunshine |
Dj |
9h |
| Height of the Sun |
h |
45,86 ° |
| Length of day |
D |
13 h |
| Fraction of insolation |
σ |
0,69 |
| Altitude |
z |
30 m |
| Diffuse radiation component on a horizontal plane |
Dh |
476,76 W/ m2 |
| Diffuse radiation component on a vertical plane |
Dv |
375,38 W/ m2 |
| Component of direct radiation on a horizontal plane |
Sh |
893,24 W/ m2 |
| Component of direct radiation on a vertical plane |
Sv |
837,23 W/ m2 |
| Global radiation per day of clear sky on the vertical plane oriented 15°. |
Gv |
1313,99 W/ m2 |
| Energy received |
Q |
7528,6 Wh/m2 |
| Received Power |
Preçue.pv |
4276,4 W |
The maximum alternator power
PAlt is 400 W, and the motor power is obtained using the equation:
3. Results and Discussion
3.1. Photovoltaic System Simulation
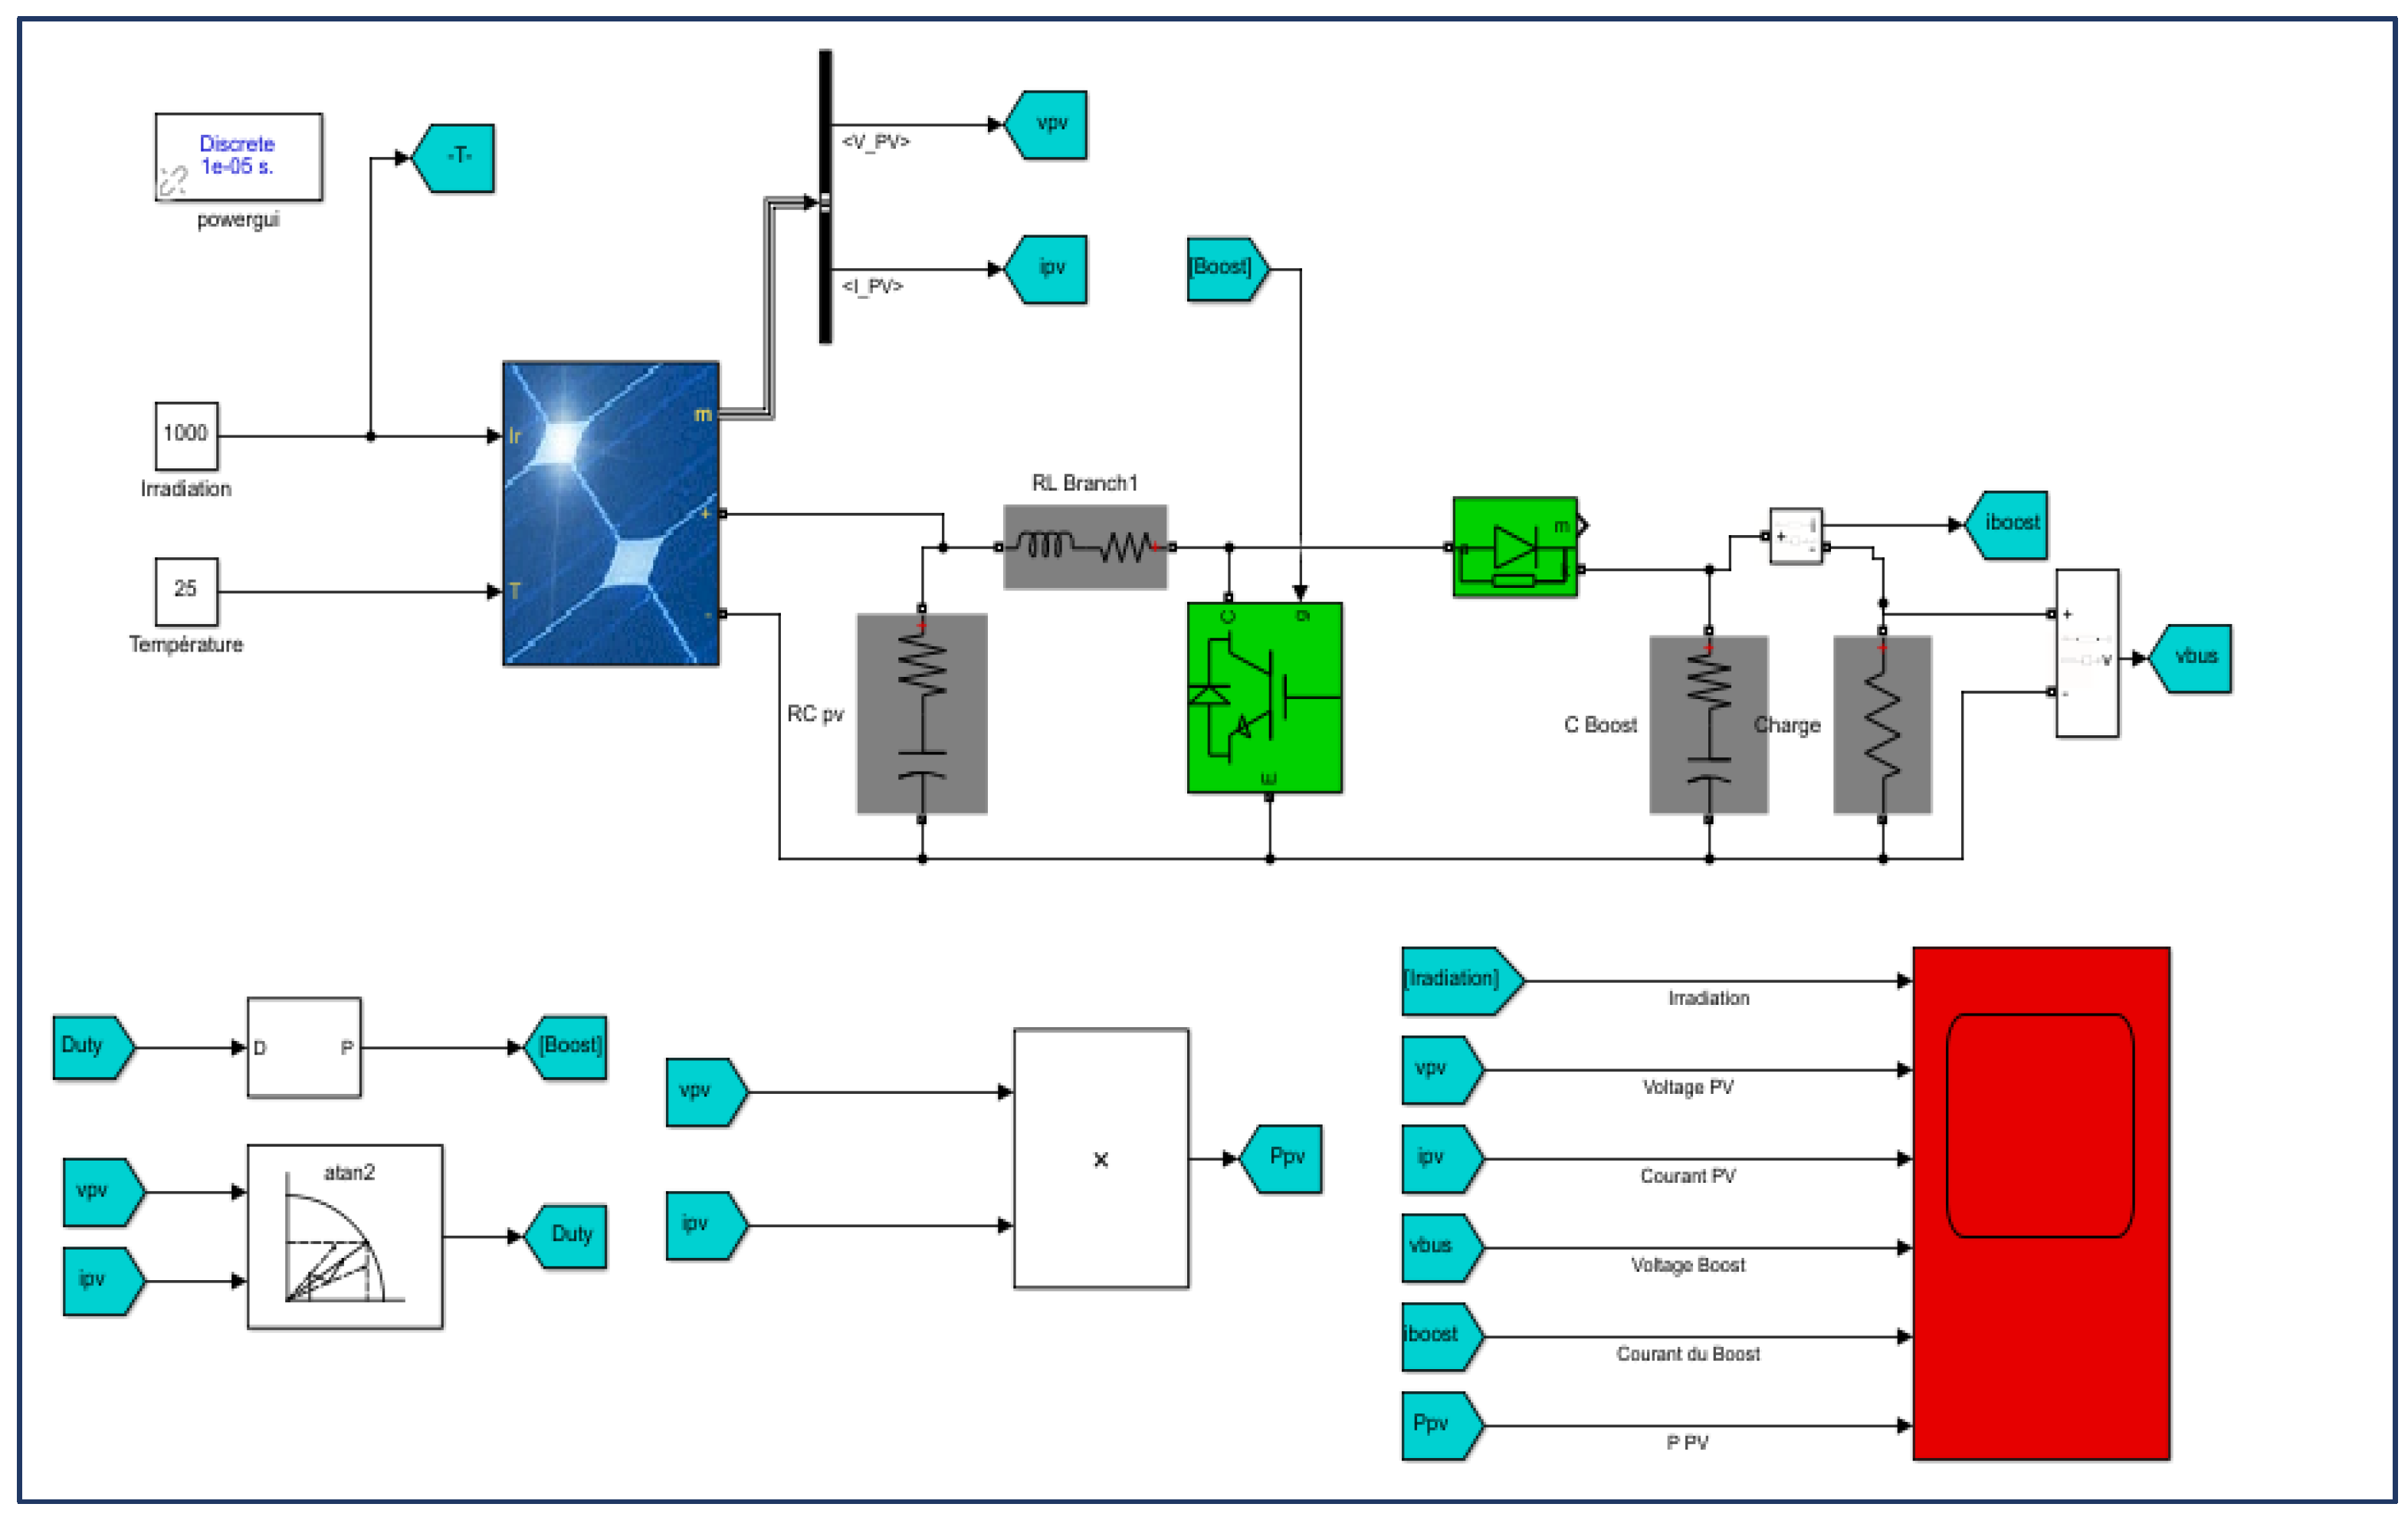
The system is simulated using MATLAB/SIMULINK, so the voltage is visualised in each component of the photovoltaic system.
Figure 10.
Simulation Diagram of the Photovoltaic System.
Figure 10.
Simulation Diagram of the Photovoltaic System.
Figure 11.
Photovoltaic Parameter Variations Curves.
Figure 11.
Photovoltaic Parameter Variations Curves.
The simulation was conducted using MATLAB, particularly SIMULINK. The assumed solar irradiance is 1000 W/m at a temperature of 25°C. The voltage curve of the PV panel variation indicates that the voltage is rectified at the output of the converter. Moreover, the curve shows that the MPPT regulator has a peak corresponding to the maximum power point. The output voltage is maintained at 50 V. The inverter imposes output voltages in the form of modulated square waves, but the use of an inductor acts as a filter. The capacitor plays a critical role in this system as it helps to maintain a stable operating point. The variation curve of the voltage is smoothed and filtered by the capacitor. The power gathered by the solar panels is approximately 4000 W as shown by the P PV curve, confirmed by the last column of
Table 4.
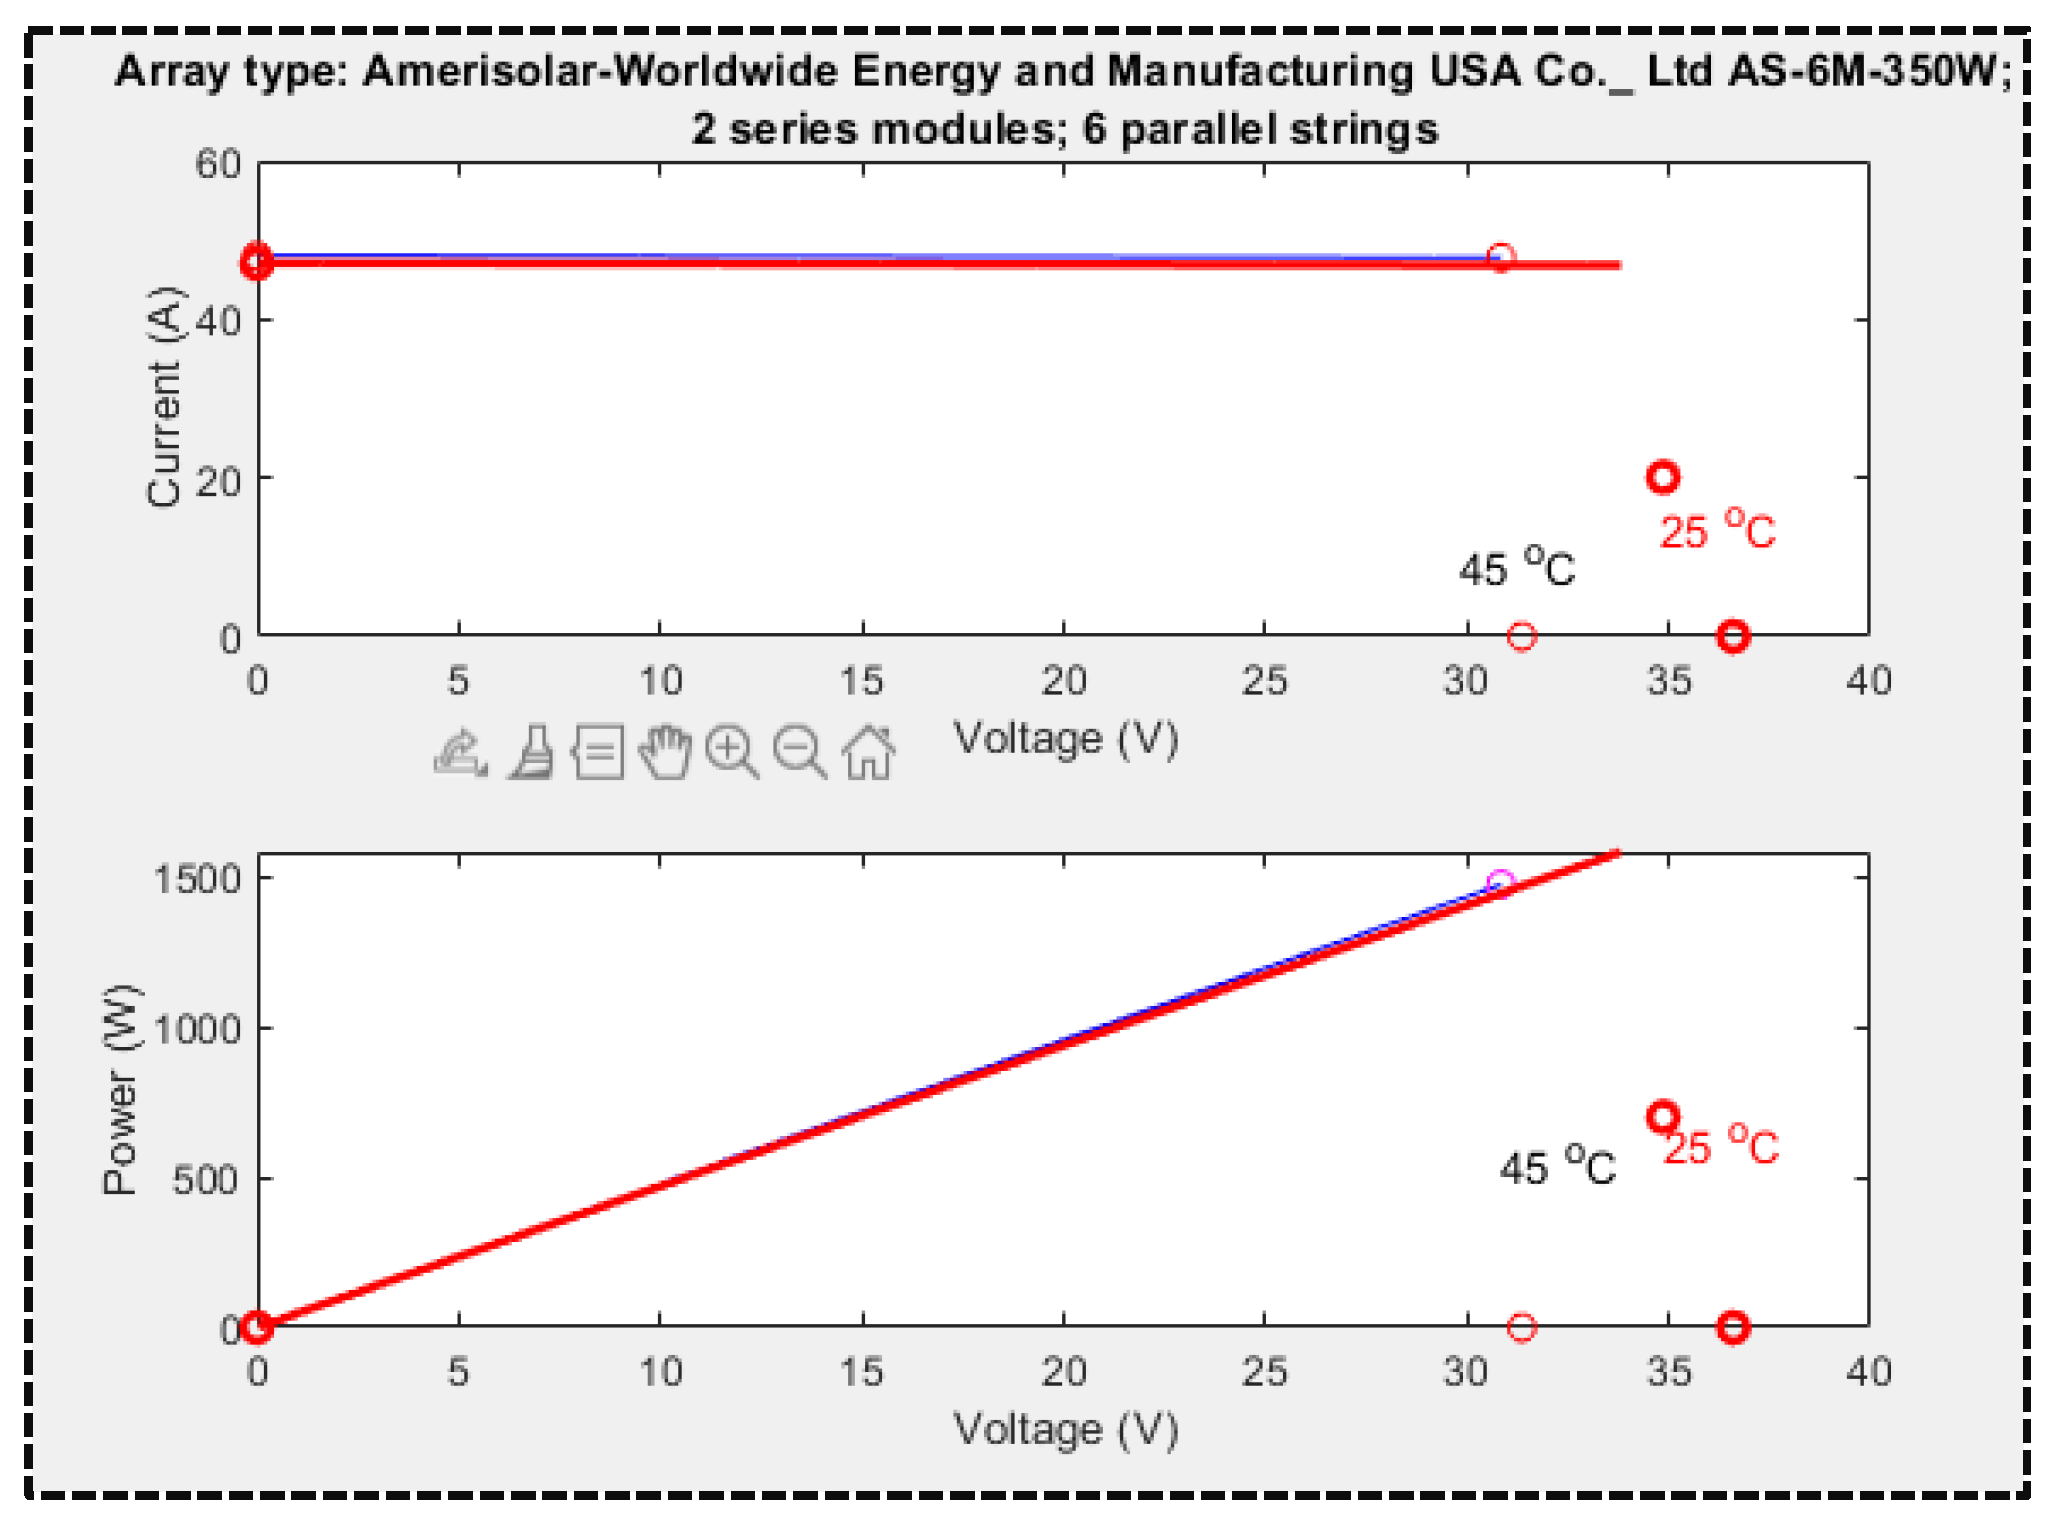
The power and current variations at the regulator are provided by the following figure, with an output current of 48 A. The panels are split into two compartments mounted in series. Each compartment is made up of 6 panels in parallel.
Figure 12.
Power and Voltage at the Regulator Level.
Figure 12.
Power and Voltage at the Regulator Level.
3.2. Dynamics Model Simulation and Discussion
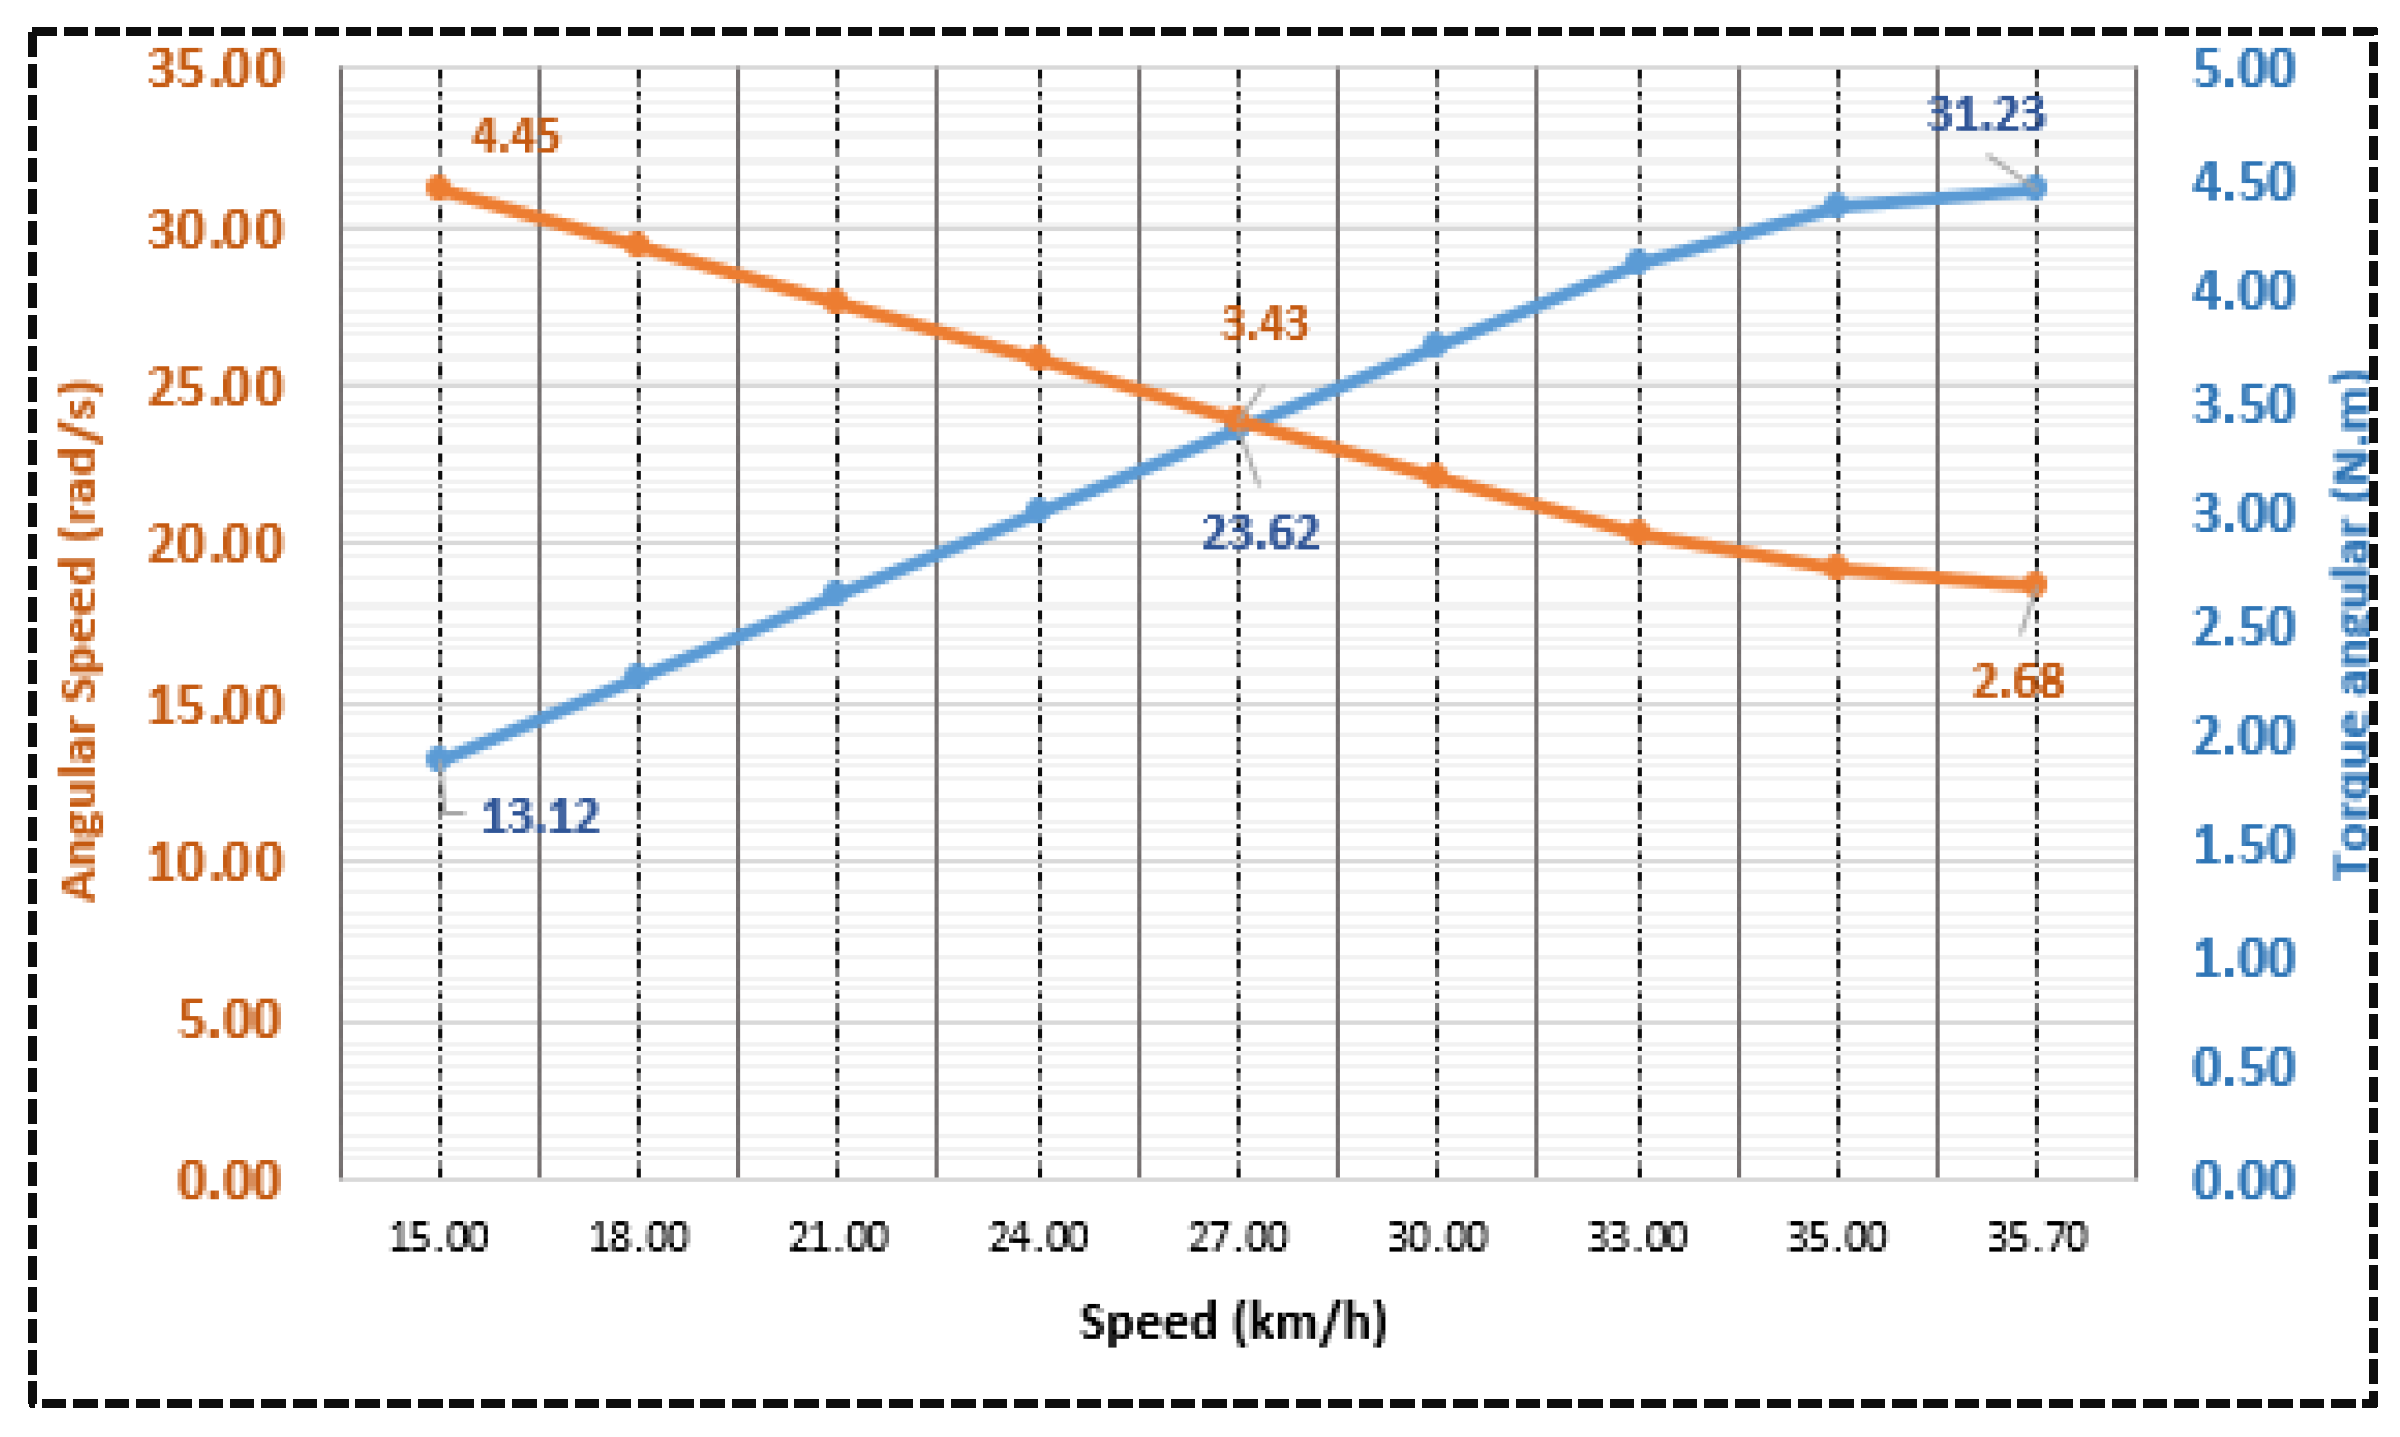
Figure 14 depicts the relationship between the angular velocity and torque of an electric vehicle as a function of its linear velocity. The data indicates that torque is inversely proportional to the angular speed and exhibits a smooth variation. The motor's minimum angular speed, at 2.68 rad/s, results in the maximum torque of 4.45 N.m, as illustrated in
Figure 10.
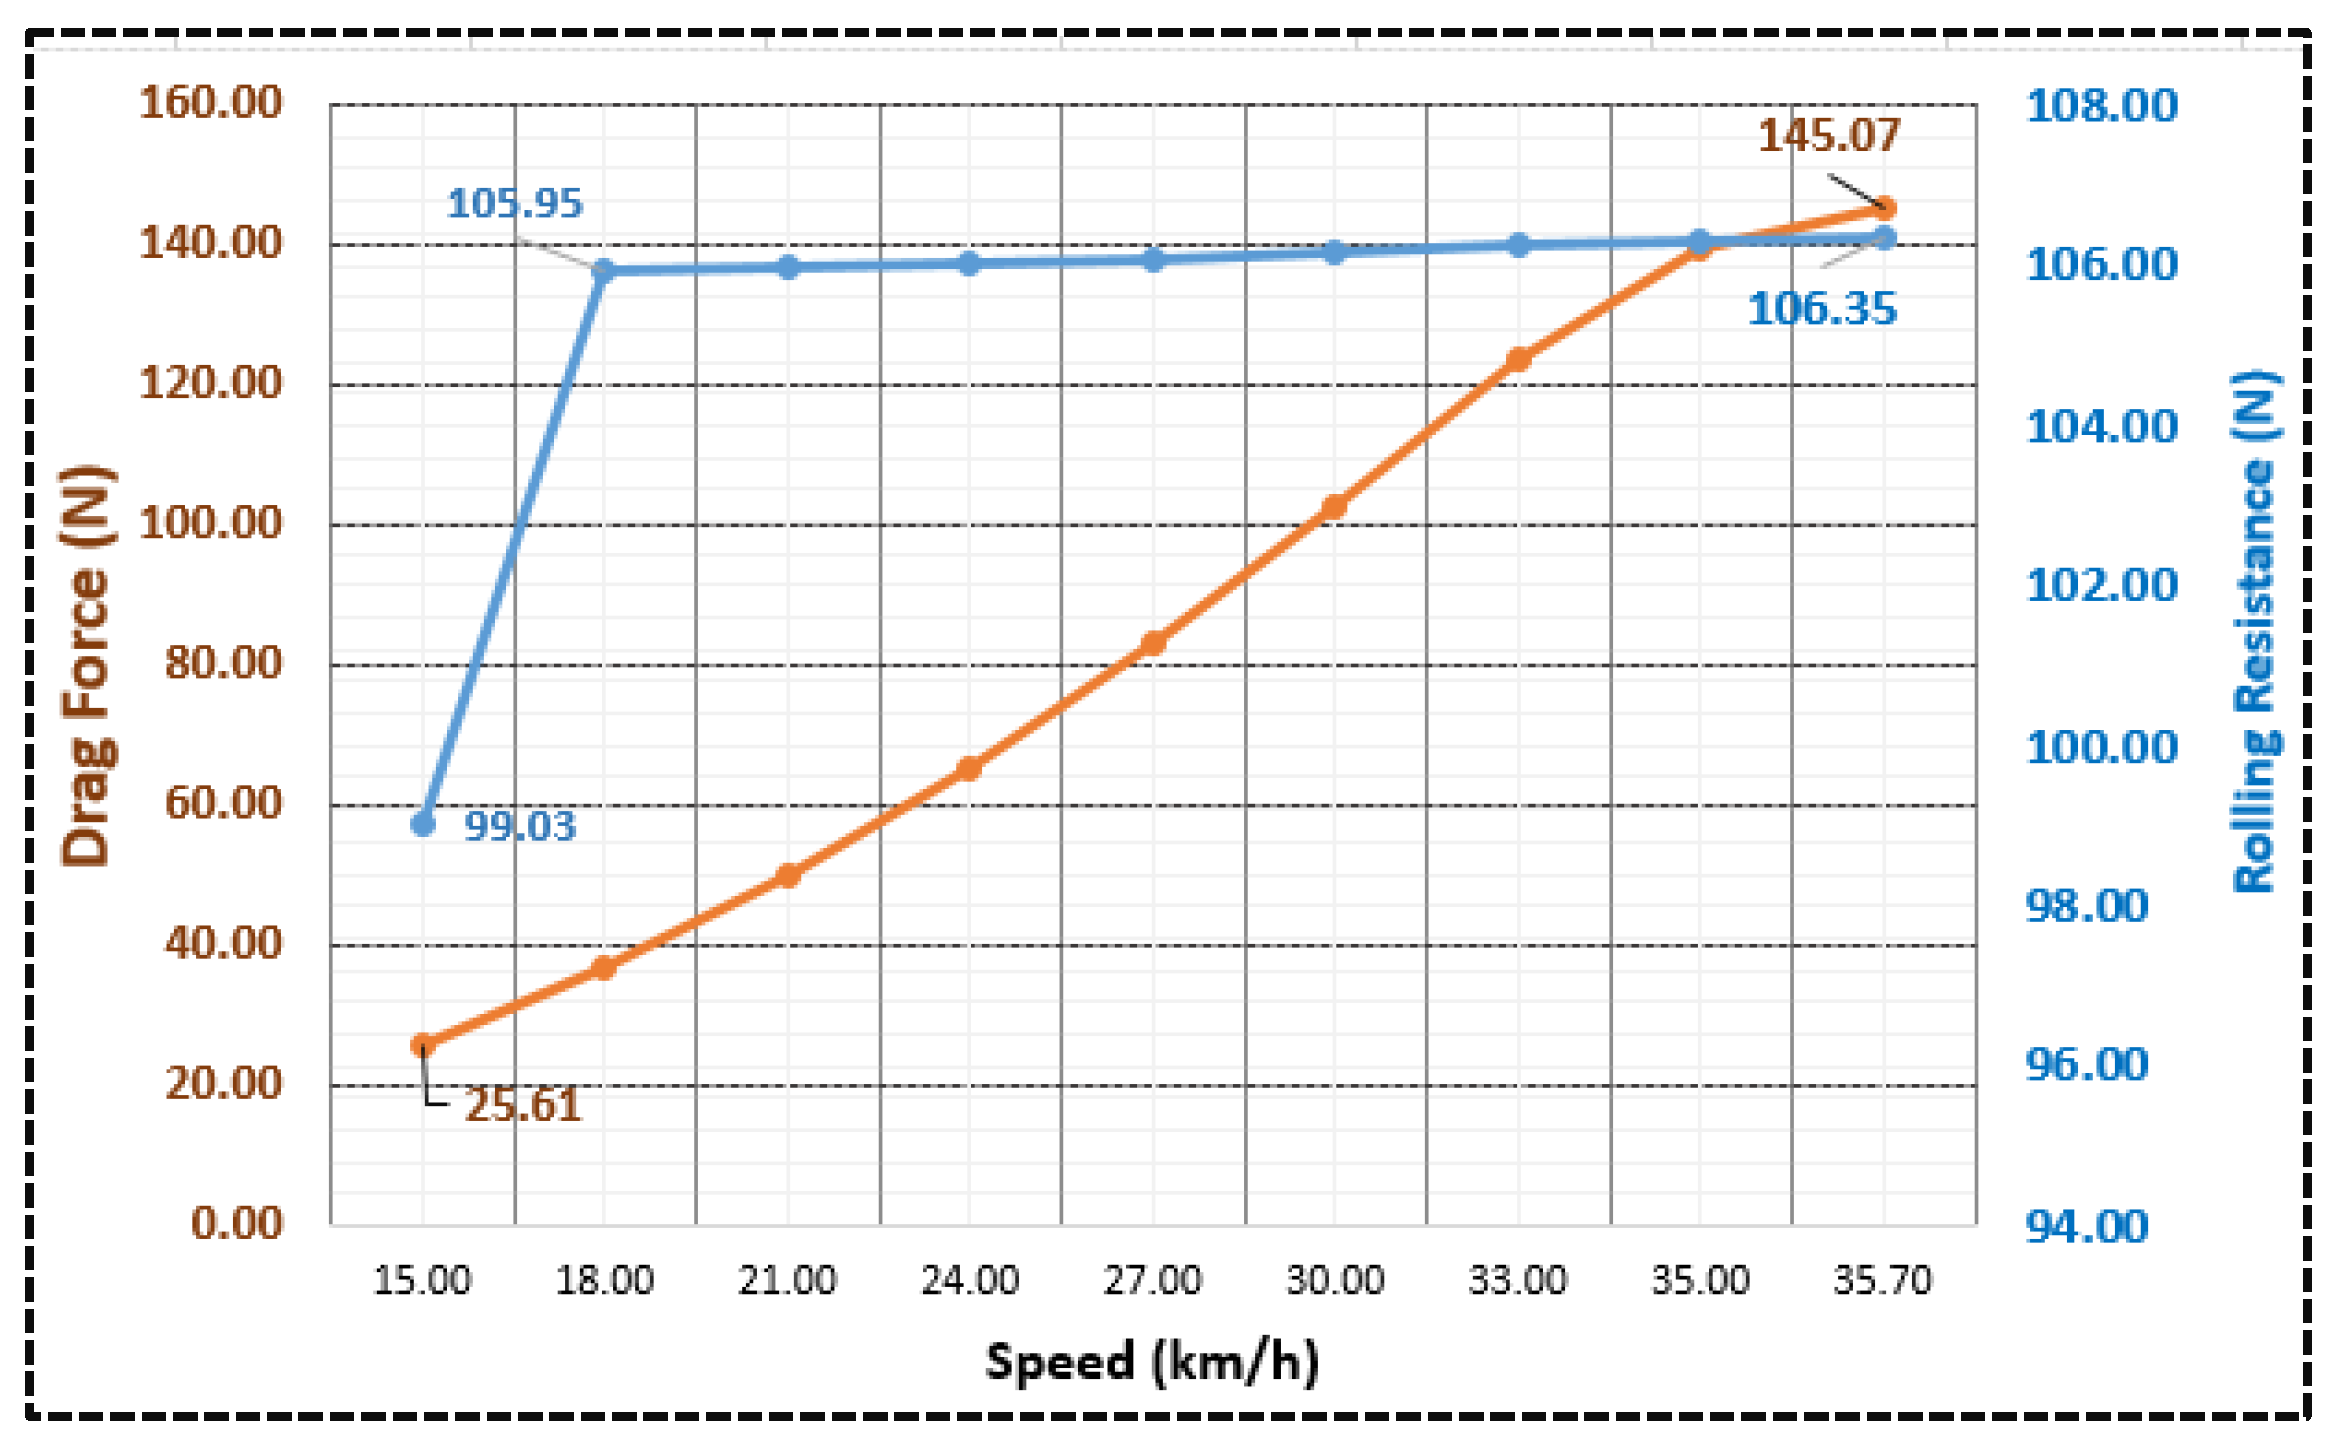
Figure 14 illustrates that at speeds exceeding 18 km/h, the rolling resistance remains almost constant, with an average value of 106 N. Additionally, the air resistance grows exponentially with the speed, culminating at 145 N when the velocity reaches its maximum. Noticeably, the power dissipated when cruising on a flat road with uniform motion derives predominantly from aerodynamic factors.
Figure 13.
Variation of angular speed and angular torque.
Figure 13.
Variation of angular speed and angular torque.
Figure 14.
Varying degrees of resistance.
Figure 14.
Varying degrees of resistance.
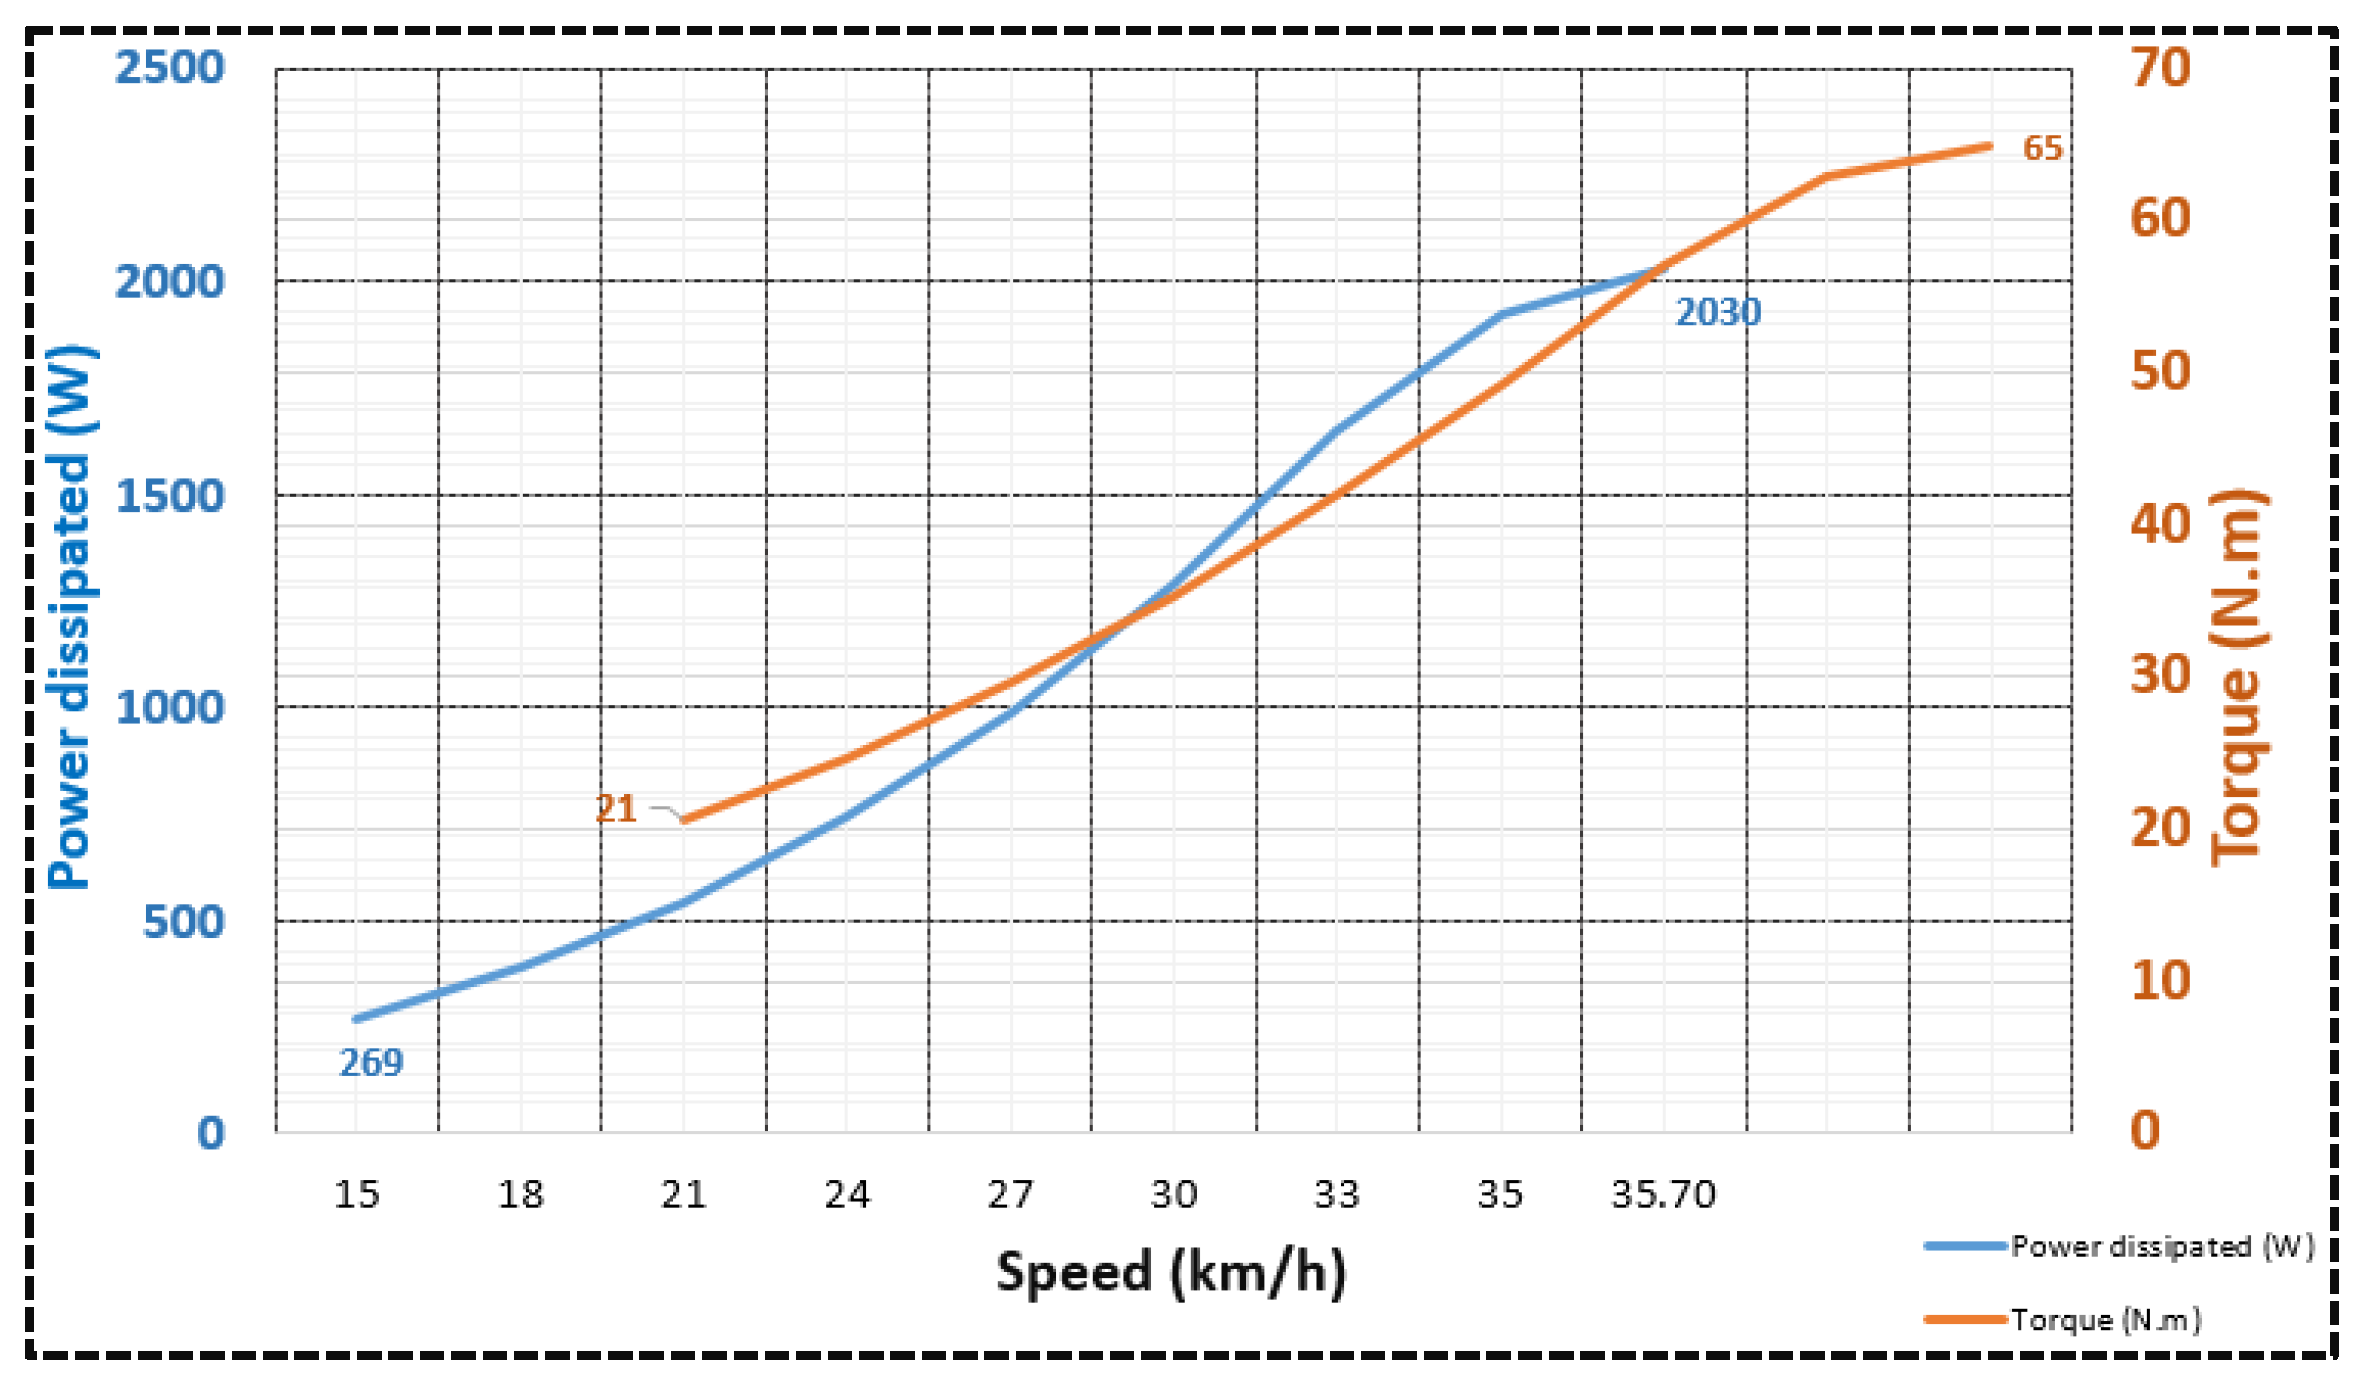
Figure 16 shows the development of torque and power. Torque increases with power and reaches a value of 51.5 N.m in the first few seconds of acceleration, as shown in
Figure 17 and
Figure 14 at a maximum speed of 35.7 km/h. The corresponding power is 2030 W. The corresponding power is 2030 W. The corresponding power is 2030 W.
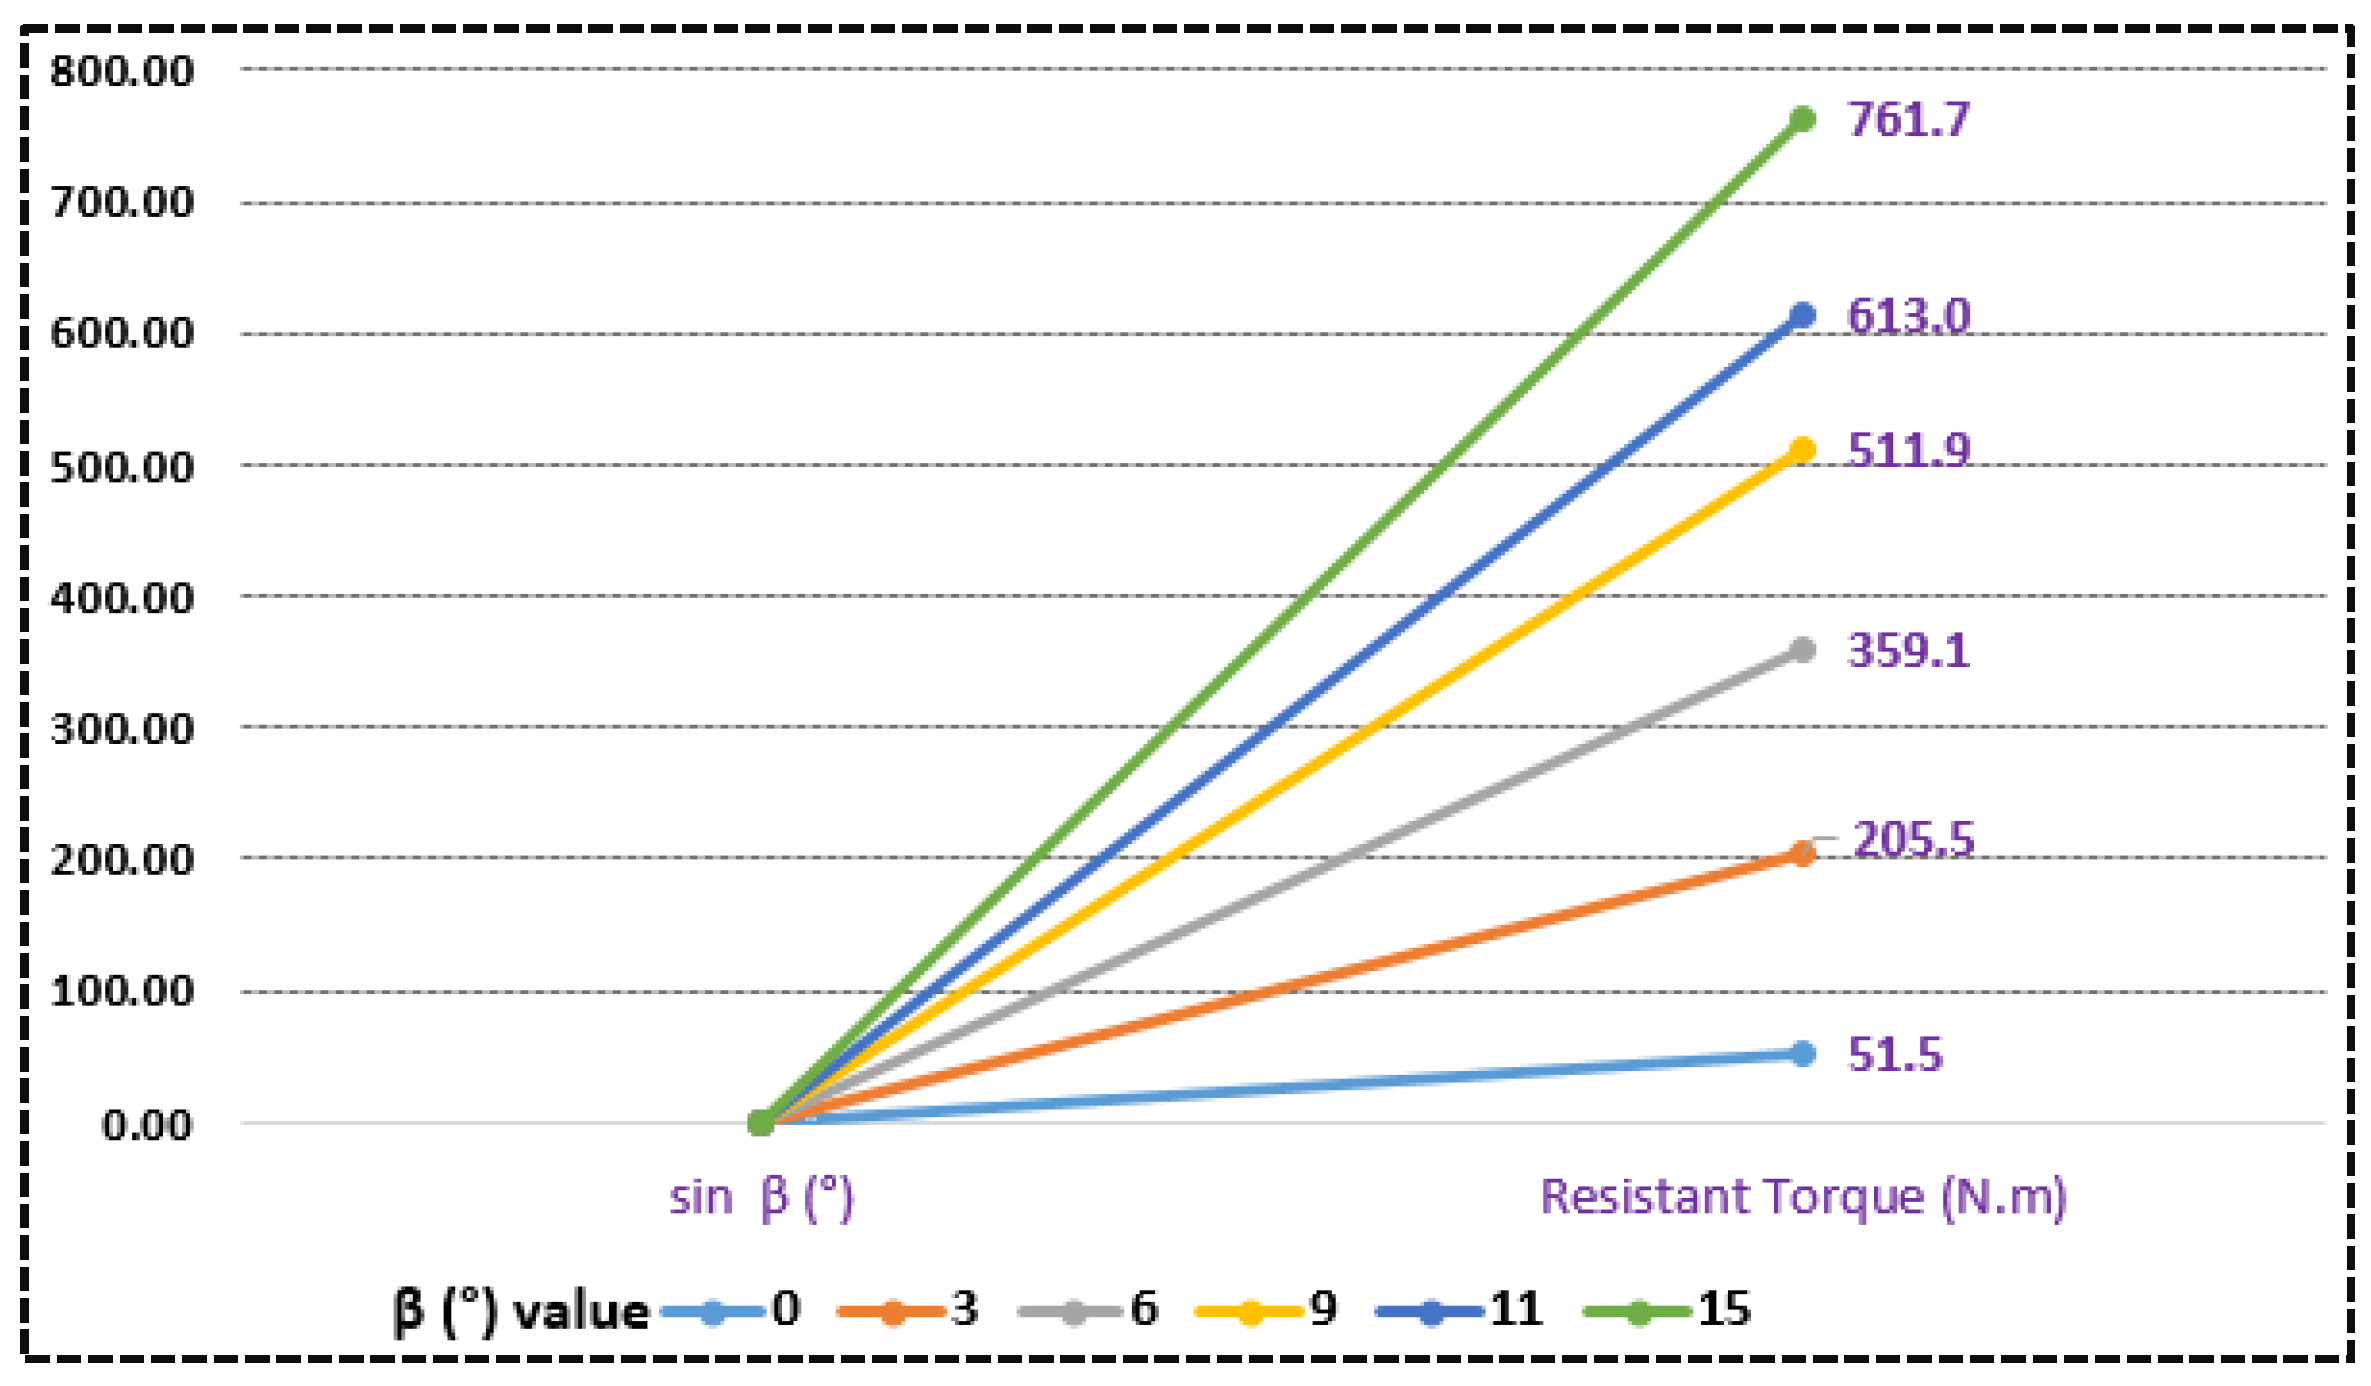
Figure 15 shows the torque value for different values of angle
β. This torque increases exponentially with the slope of the road.
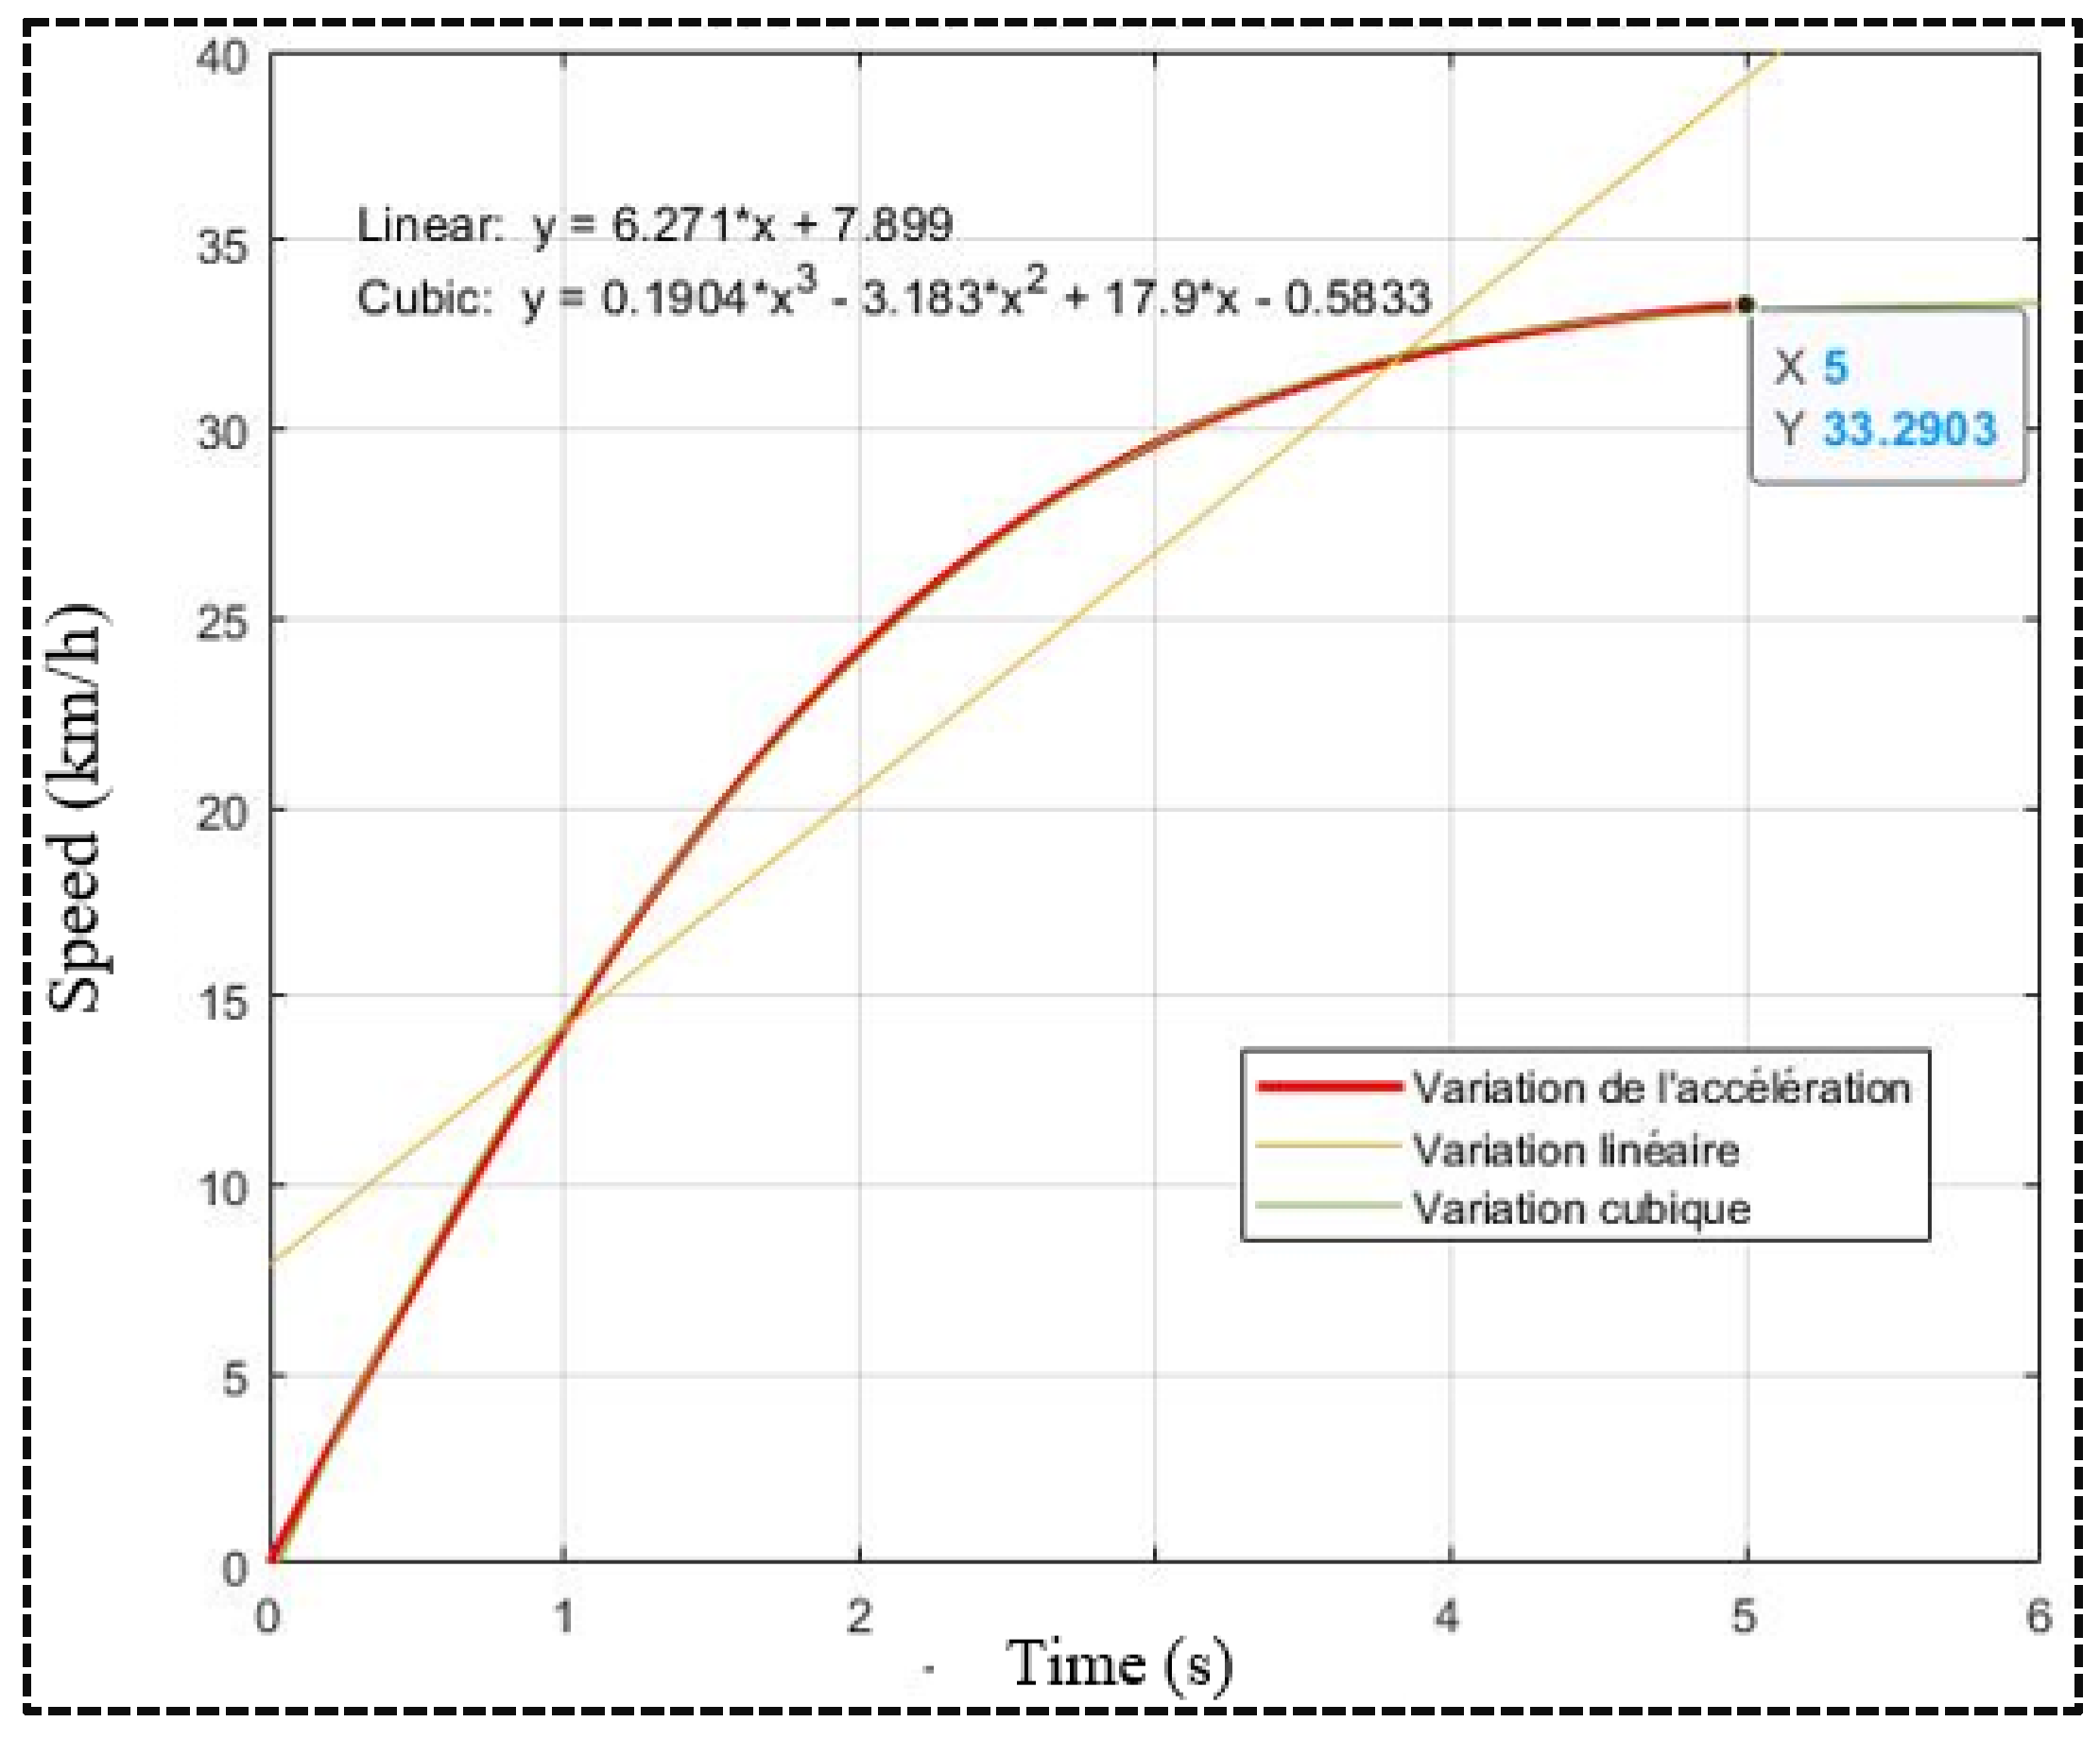
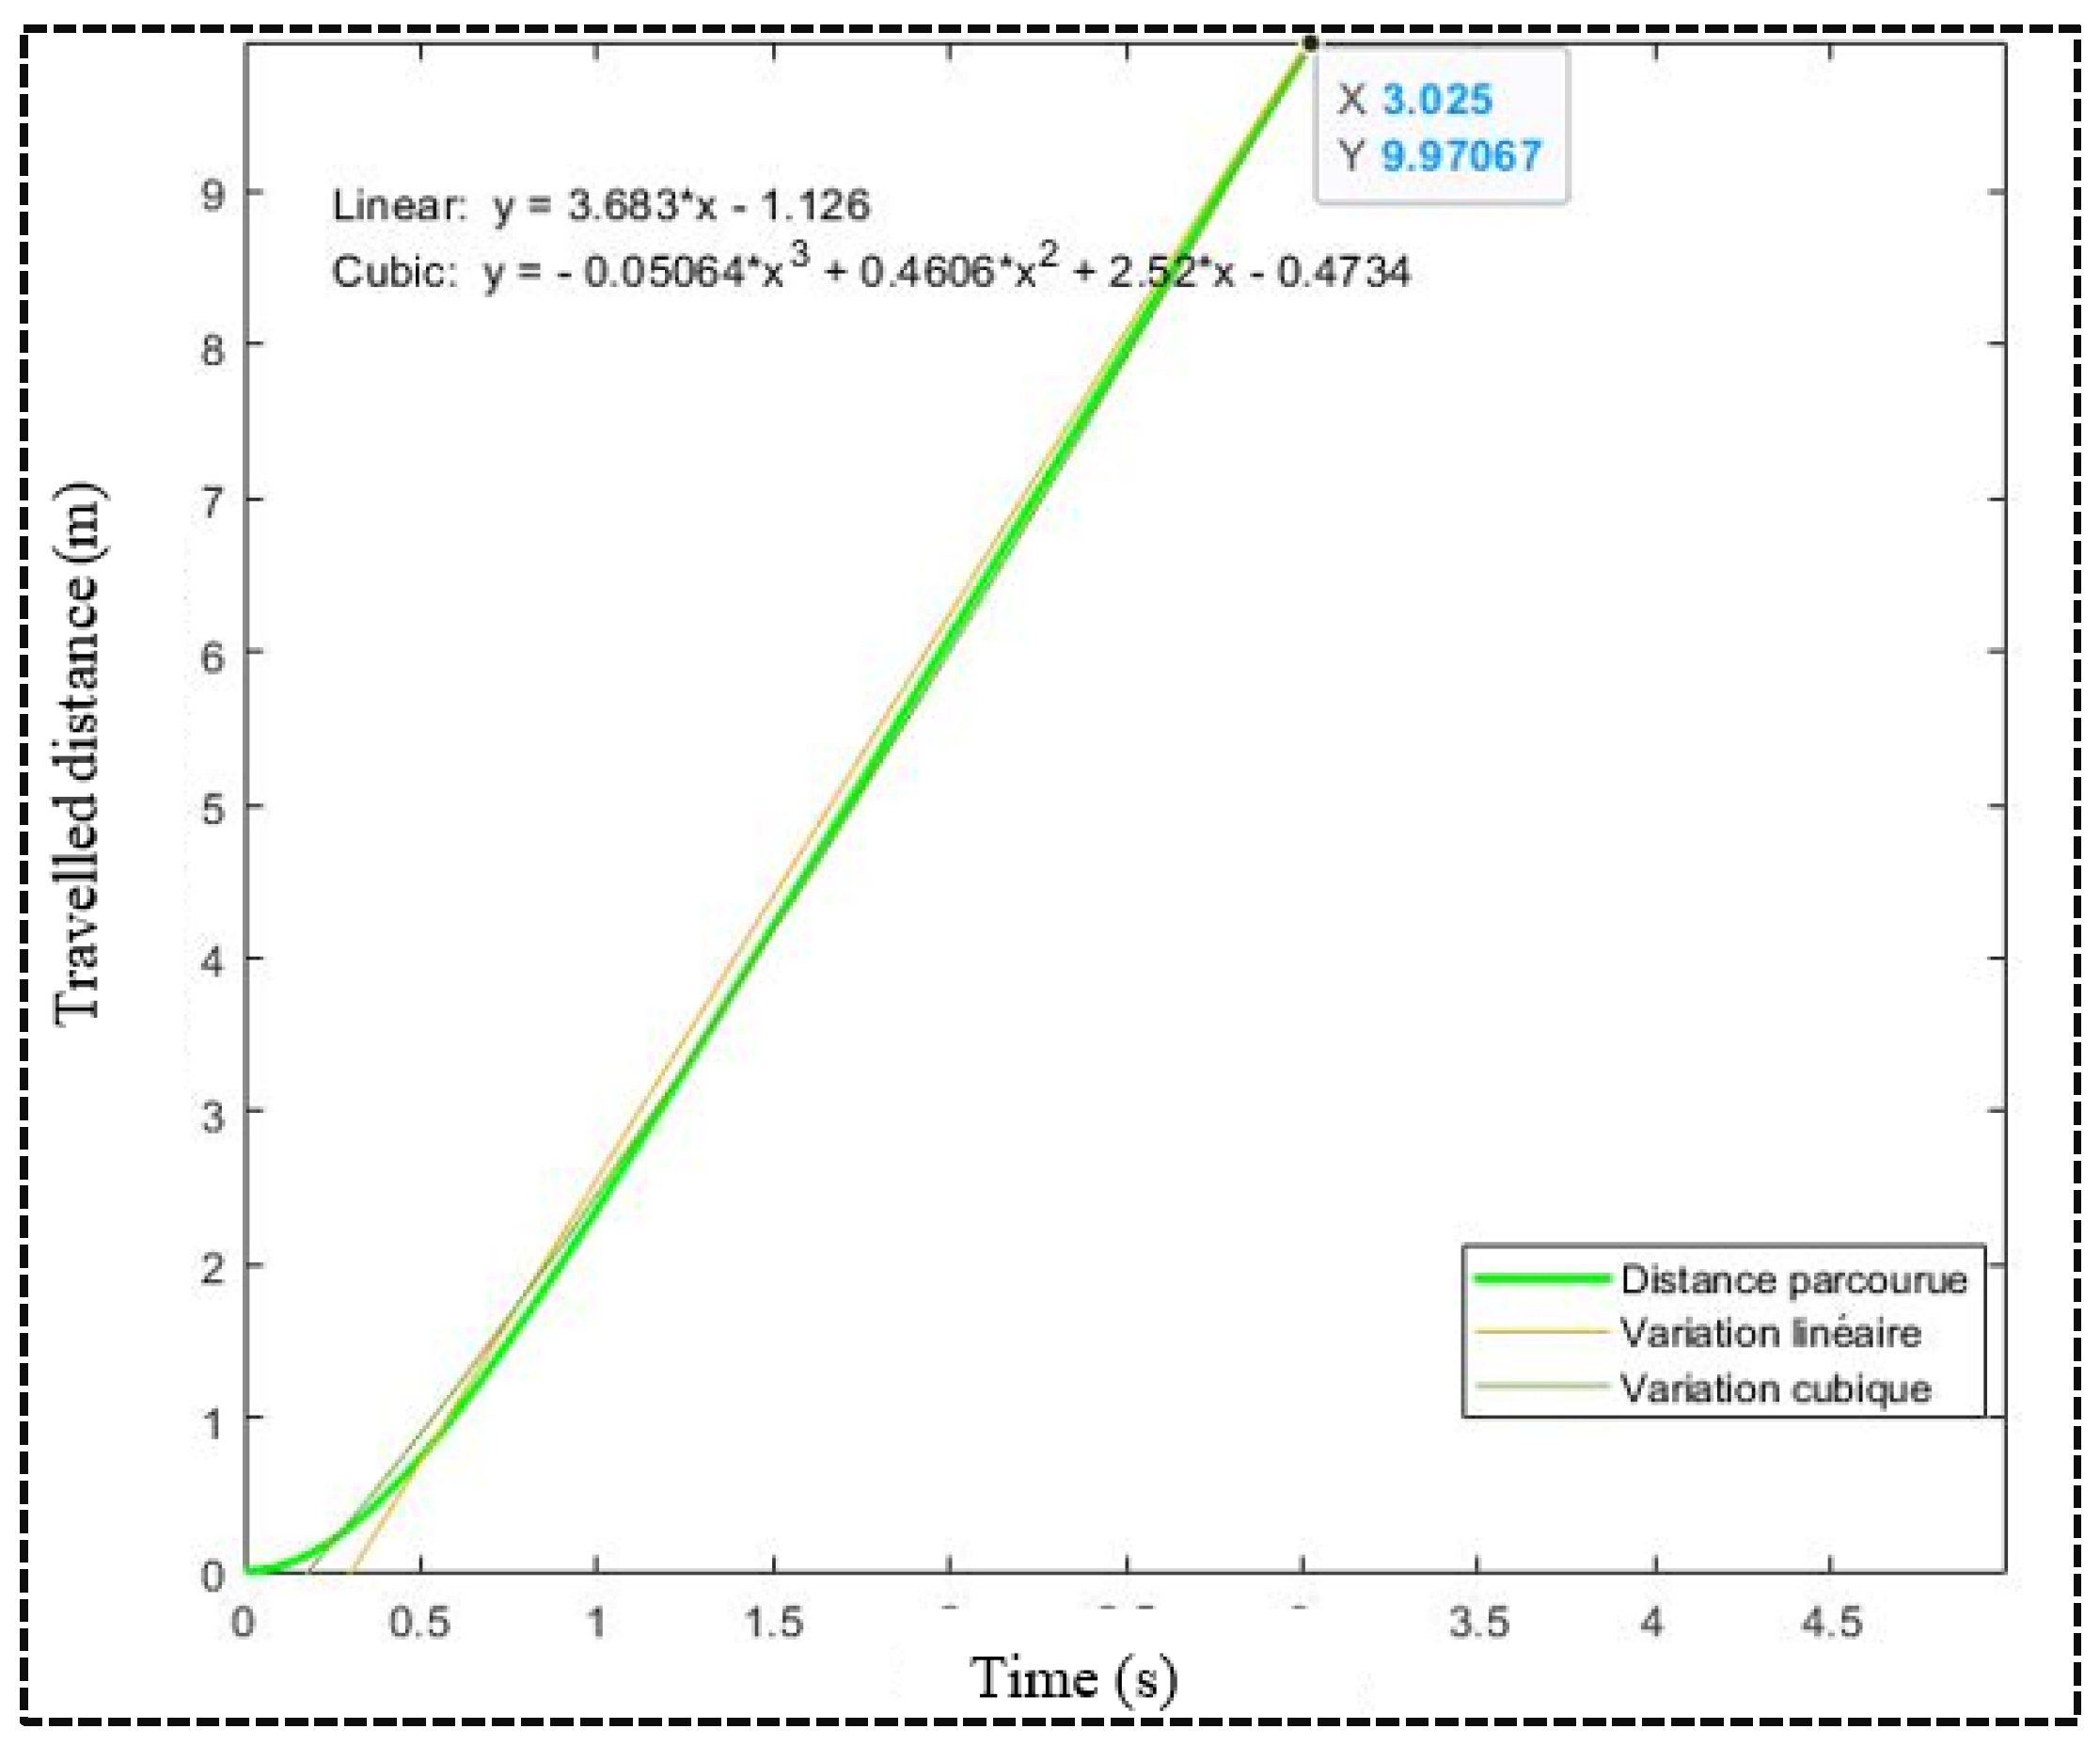
Figure 17 and
Figure 18 depict the electric vehicle's distance and acceleration against time. The acceleration leads to a speed of 33 km/h within 5 seconds and covers a distance of 10 m in 3 seconds.
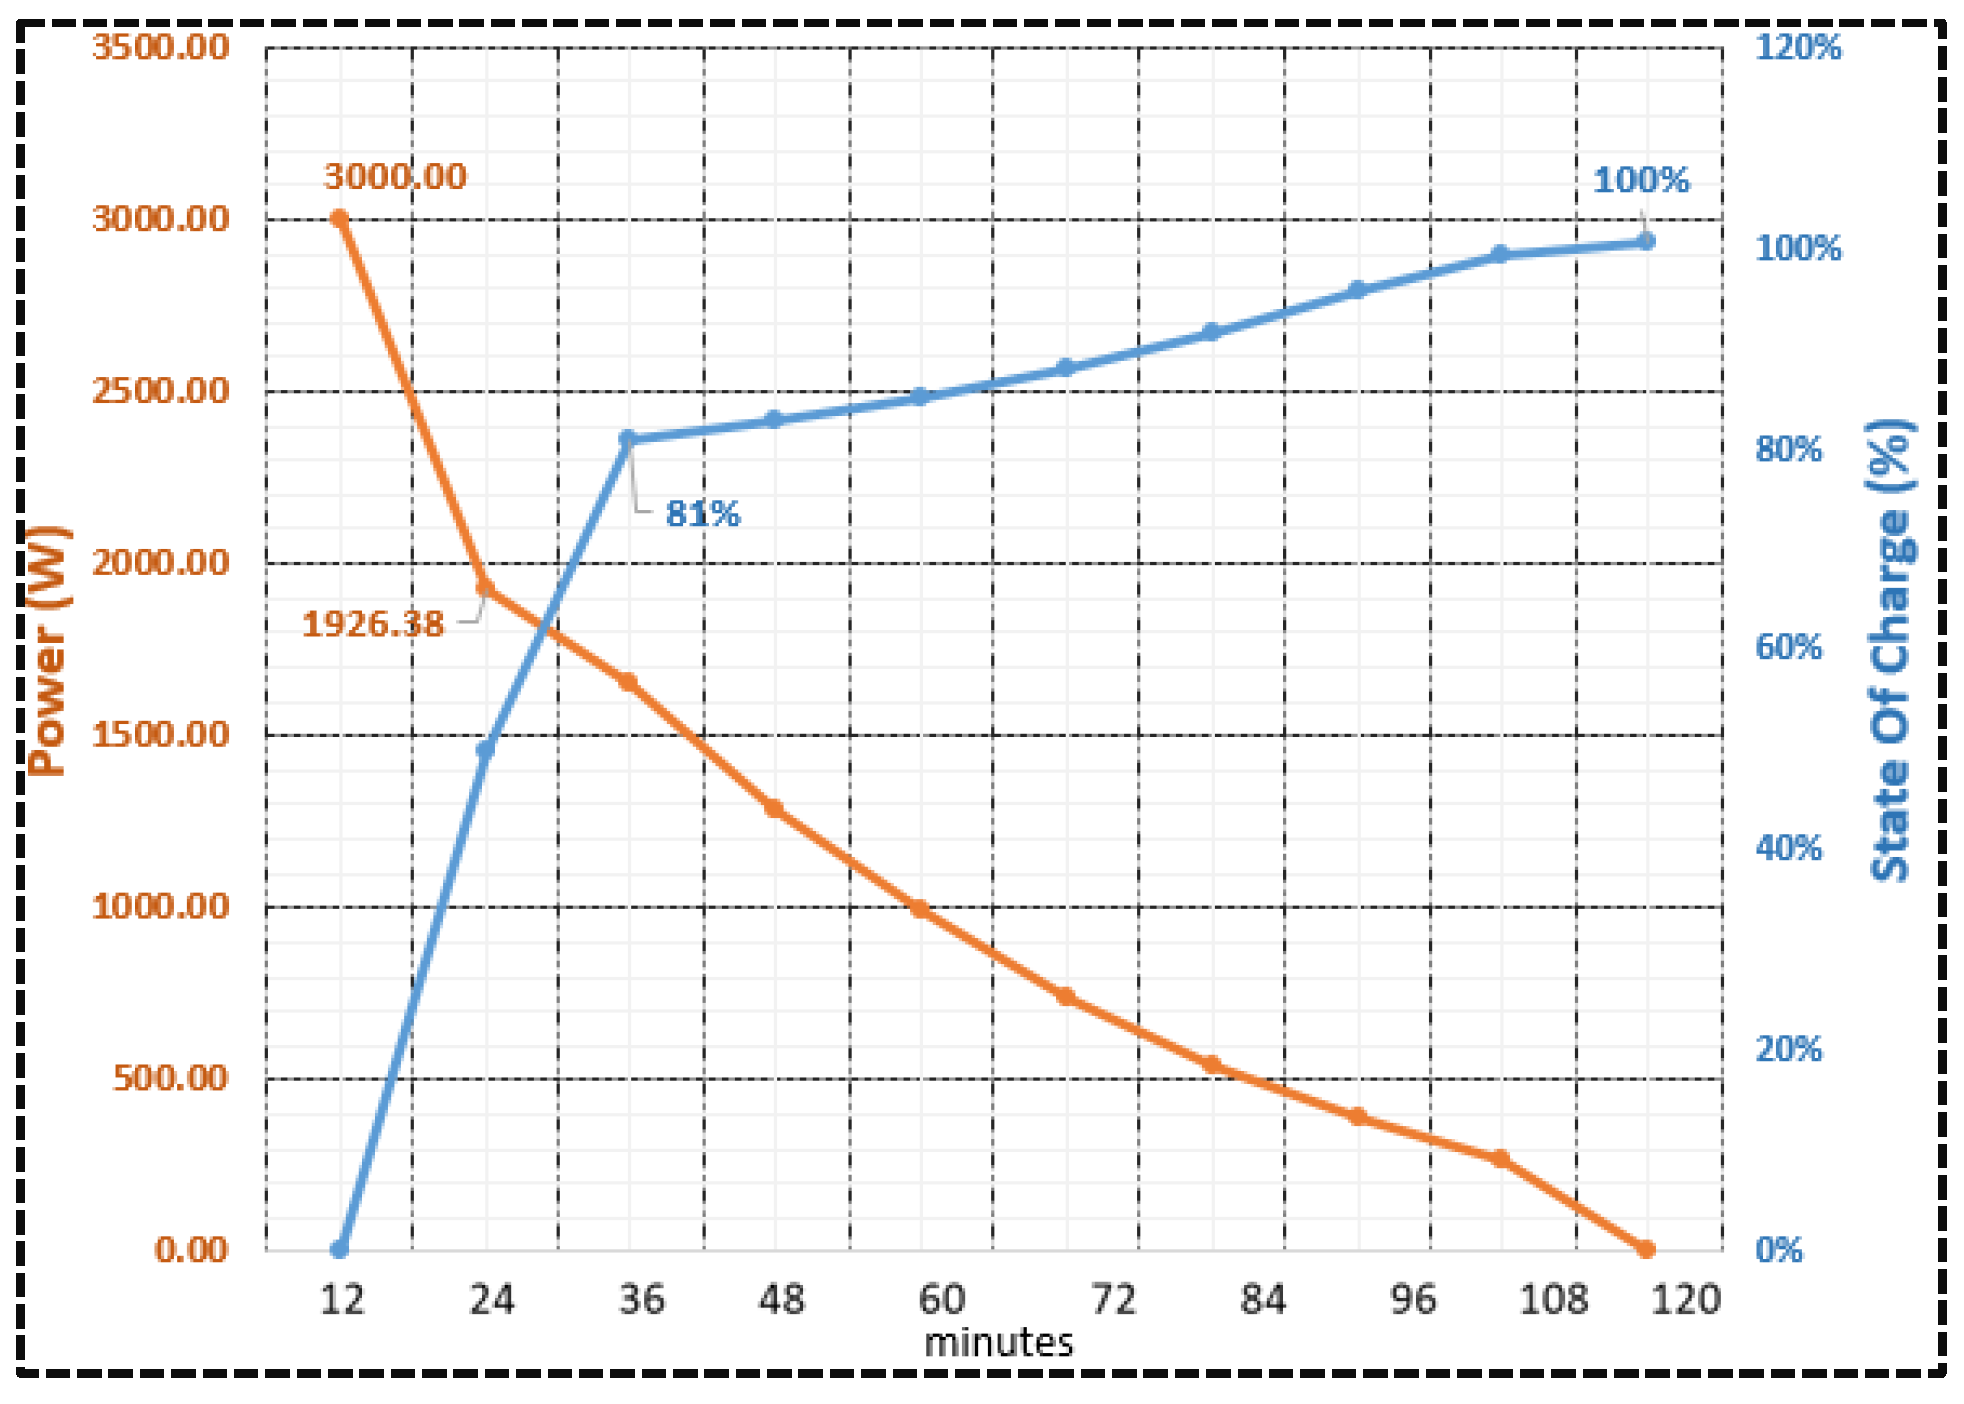
Figure 19 illustrates the battery's state of charge, indicating that a battery charged up to 81% equals a usable power of 2400 W. The battery undergoes a steady charging process from this percentage until it attains full charge.
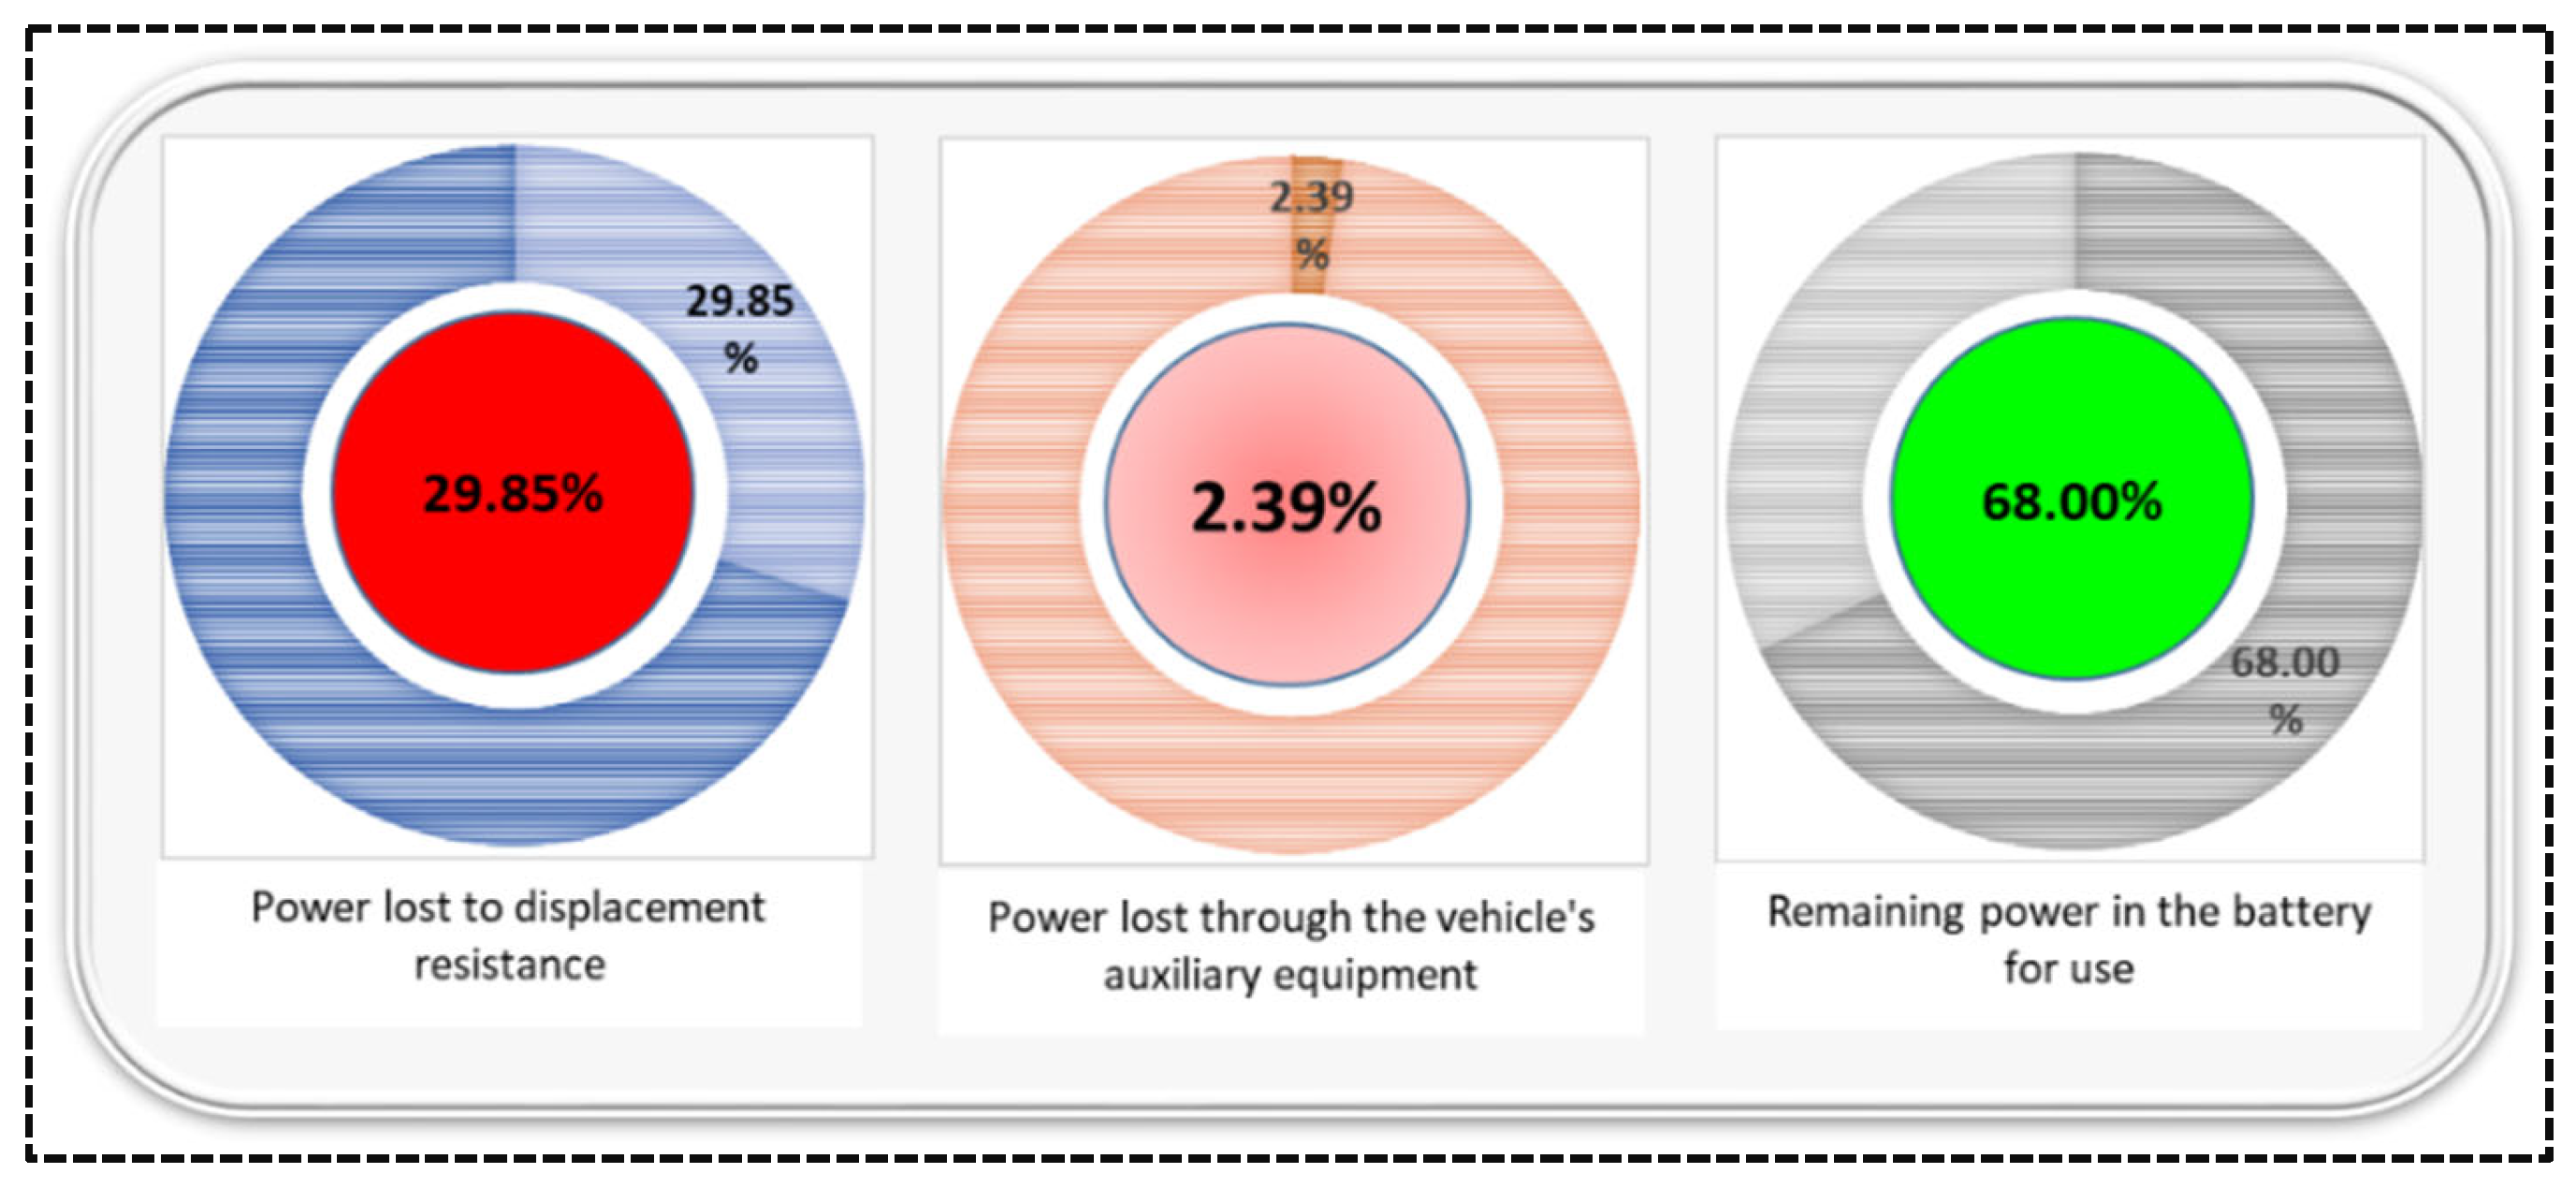
The rolling resistance and air resistance dissipate 2030 W of power, which is 29.85% of the total power on a level road. The power dissipated by the vehicle's electrical components is estimated at 2.39%, which is 200 W. The remaining portion of power is intended for use in operating other domestic appliances.
4. Conclusion
This article presents a model for assessing the performance of electric vehicles. The torque varies the power, reaching a maximum value during acceleration in the first few seconds. At t=5 seconds, the vehicle moves 10 meters during acceleration under travel conditions at a speed of 33 km/h. The maximum torque value is 51.34 N.m when the angular velocity is zero. The power lost due to air resistance is greater than the power lost due to rolling resistance on a flat road with β=0° and at maximum velocity. The dissipated power by the resistors to be overcome is 2030 W, and the power lost in the electrical components is estimated at 100 W. The transmission ratio is 1 because the motors are integrated into the wheels, so the selected speed value is the value transmitted to the wheels. The parameters examined in this article have been analyzed based on their electrical and mechanical characteristics. During the battery charge, at 81%, the charging stabilizes and corresponds to a power of 2400 W after having undergone an accelerated charge from 0% to 80% and a power increase from 0 to 2400 W.
Author Contributions
Sidy Mactar Sokhna: Conceptualization, Methodology, Software, Writing– original draft; Sory Diarra: Visualization, Validation; Mohamed El Amine Ait Ali: Visualization, Investigation, Writing– review & editing, Writing – original draft, Validation; Souleye Faye: Visualization, Validation; Vincent Sambou: Visualization, Validation; Mohamed Agouzoul: Visualization, Validation.
Data Availability Statement
The raw data supporting the conclusions of this article will be made available by the authors on request.
Acknowledgements
We would like to express our gratitude to M. El Hadj Maguette CISSE, the project sponsor, for granting us this opportunity to enhance our expertise. We extend our thanks to the entire GAZELLE project team, who we consider our colleagues and collaborator.
Conflicts of Interest
The authors declare no conflicts of interest.
References
- C. C. Chan, “An Overview of Electric Vehicle Technology.”.
- C. Waldman, S. Gurusubramanian, L. Fiorentini, and M. Canova, “A model-based supervisory energy management strategy for a 12V vehicle electrical system,” Control Eng Pract, vol. 44, pp. 20–30, Nov. 2015. [CrossRef]
- G. Ferro, F. Laureri, R. Minciardi, and M. Robba, “An optimization model for electrical vehicles scheduling in a smart grid,” Sustainable Energy, Grids and Networks, vol. 14, pp. 62–70, Jun. 2018. [CrossRef]
- K. Kwon, J. H. Lee, and S. K. Lim, “Optimization of multi-speed transmission for electric vehicles based on electrical and mechanical efficiency analysis,” Appl Energy, vol. 342, Jul. 2023. [CrossRef]
- G. H. Raeisi Hasanhendoei, E. Afjei, M. Naseri, and S. Azad, “Automatic and real time phase advancing in BLDC motor by employing an electronic governor for a desired speed-torque/angle profile,” e-Prime - Advances in Electrical Engineering, Electronics and Energy, vol. 4, p. 100111, Jun. 2023. [CrossRef]
- T. Halmeaho et al., “Experimental validation of electric bus powertrain model under city driving cycles,” IET Electrical Systems in Transportation, vol. 7, no. 1, pp. 74–83, Mar. 2017. [CrossRef]
- F. Chiara and M. Canova, “A review of energy consumption, management, and recovery in automotive systems, with considerations of future trends,” Proceedings of the Institution of Mechanical Engineers, Part D: Journal of Automobile Engineering, vol. 227, no. 6. SAGE Publications Ltd, pp. 914–936, 2013. [CrossRef]
- P. Spanoudakis, N. C. Tsourveloudis, L. Doitsidis, and E. S. Karapidakis, “Experimental research of transmissions on electric vehicles’ energy consumption,” Energies (Basel), vol. 12, no. 3, Jan. 2019. [CrossRef]
- B. Zhu et al., “Gear shift schedule design for multi-speed pure electric vehicles,” Proceedings of the Institution of Mechanical Engineers, Part D: Journal of Automobile Engineering, vol. 229, no. 1, pp. 70–82, Jan. 2015. [CrossRef]
- K. Kwon, J. Jo, and S. Min, “Multi-objective gear ratio and shifting pattern optimization of multi-speed transmissions for electric vehicles considering variable transmission efficiency,” Energy, vol. 236, p. 121419, Dec. 2021. [CrossRef]
- Y. D. Setiawan Liauw, M. Roozegar, T. Zou, A. Morozov, and J. Angeles, “A topology-change model of multi-speed transmissions in electric vehicles during gear-shifting,” Mechatronics, vol. 55, pp. 151–161, Nov. 2018. [CrossRef]
- B. Gao, Q. Liang, Y. Xiang, L. Guo, and H. Chen, “Gear ratio optimization and shift control of 2-speed I-AMT in electric vehicle,” Mech Syst Signal Process, vol. 50–51, pp. 615–631, Jan. 2015. [CrossRef]
- W. Zhang, J. Yang, and W. Zhang, “Influence of a New Type of Two-Speed Planetary Gear Automatic Transmission on the Performance of Battery Electric Vehicles,” Energies (Basel), vol. 15, no. 11, Jun. 2022. [CrossRef]
- Y. Liu, D. Gao, K. Zhai, Q. Huang, Z. Chen, and Y. Zhang, “Coordinated control strategy for braking and shifting for electric vehicle with two-speed automatic transmission,” eTransportation, vol. 13, p. 100188, Aug. 2022. [CrossRef]
- Y. Liu, D. Gao, K. Zhai, Q. Huang, Z. Chen, and Y. Zhang, “Coordinated control strategy for braking and shifting for electric vehicle with two-speed automatic transmission,” eTransportation, vol. 13, Aug. 2022. [CrossRef]
- L. Guo, B. Gao, and H. Chen, “Online Shift Schedule Optimization of 2-Speed Electric Vehicle Using Moving Horizon Strategy,” IEEE/ASME Transactions on Mechatronics, vol. 21, no. 6, pp. 2858–2869, Dec. 2016. [CrossRef]
- T. Liu, Y. Zou, D. Liu, T. Liu, Y. Zou, and D. Liu, “Energy management for battery electric vehicle with automated mechanical transmission,” 2016.
- Ş. Bayraktar and Y. Turgut, “Experimental and statistical analysis of the effects of punching and laser cutting methods on induction motor efficiency and total magnetic losses in silicon lamination sheets,” J Magn Magn Mater, vol. 572, Apr. 2023. [CrossRef]
- James. Larminie and J. Lowry, Electric vehicle technology explained. John Wiley & Sons, 2012.
- R. Gong, Q. Gong, H. Che, and Z. Zhang, “Numerical Investigation on Churning Loss Torque and Oil Distribution of Reducer Based on Lattice Boltzmann Method,” Tribology Transactions, vol. 64, no. 5, pp. 968–979, 2021. [CrossRef]
- A. Tikadar, D. Johnston, N. Kumar, Y. Joshi, and S. Kumar, “Comparison of electro-thermal performance of advanced cooling techniques for electric vehicle motors,” Appl Therm Eng, vol. 183, p. 116182, Jan. 2021. [CrossRef]
- L. Sun, “Low speed sensorless control method of brushless DC motor based on pulse high frequency voltage injection,” Alexandria Engineering Journal, vol. 61, no. 8, pp. 6457–6463, Aug. 2022. [CrossRef]
- N. Mohanraj and R. Sankaran, “Converter Control Strategy for Torque Ripple Minimization in BLDC Motor,” Energy Procedia, vol. 117, pp. 951–957, Jun. 2017. [CrossRef]
- R. Zhang and L. Gao, “The Brushless DC motor control system Based on neural network fuzzy PID control of power electronics technology,” Optik (Stuttg), vol. 271, p. 169879, Dec. 2022. [CrossRef]
- B. TAN, X. GUO, J. ZHAO, X. DING, and W. FANG, “An internal power angle control strategy for high-speed sensorless brushless DC motors,” Chinese Journal of Aeronautics, vol. 35, no. 11, pp. 309–321, Nov. 2022. [CrossRef]
- R. İnan, B. Aksoy, and O. K. M. Salman, “Estimation performance of the novel hybrid estimator based on machine learning and extended Kalman filter proposed for speed-sensorless direct torque control of brushless direct current motor,” Eng Appl Artif Intell, vol. 126, p. 107083, Nov. 2023. [CrossRef]
- A. S. Mohammed, A. Olalekan Salau, B. Sigweni, and A. M. Zungeru, “Conversion and performance evaluation of petrol engine to electric powered three-wheeler vehicle with an onboard solar charging system,” Energy Conversion and Management: X, vol. 20, p. 100427, Oct. 2023. [CrossRef]
- “BAE 685-Electric Vehicle Technology-150-328 (1)”.
- C. C. Chan, “An Overview of Electric Vehicle Technology.”.
- “Electric_Vehicle_Development_Strategy_and_Key_Technology_An_Overview”.
- C. Arbizzani, F. De Giorgio, and M. Mastragostino, “Battery parameters for hybrid electric vehicles,” Advances in Battery Technologies for Electric Vehicles, pp. 55–72, Jan. 2015. [CrossRef]
- J. T. B. A. Kessels, M. Koot, B. de Jager, P. P. J. van den Bosch, N. P. I. Aneke, and D. B. Kok, “Energy management for the electric powernet in vehicles with a conventional drivetrain,” IEEE Transactions on Control Systems Technology, vol. 15, no. 3, pp. 494–505, May 2007. [CrossRef]
- C. C. Oosthuizen, “Energy optimisation of a solar vehicle for South African conditions.” [Online]. Available: https://tel.archives-ouvertes.fr/tel-03150589.
- S. V. Nourbakhsh Borujerd et al., “Fuzzy logic approach for failure analysis of Li-ion battery pack in electric vehicles,” Eng Fail Anal, vol. 149, Jul. 2023. [CrossRef]
- A. Perner and J. Vetter, “Lithium-ion batteries for hybrid electric vehicles and battery electric vehicles,” Advances in Battery Technologies for Electric Vehicles, pp. 173–190, Jan. 2015. [CrossRef]
- “Messier_Pascal_MScA_2019 BATERIE”.
- X. Liao, R. Zhu, M. S. Wong, J. Heo, P. W. Chan, and C. Y. T. Kwok, “Fast and accurate estimation of solar irradiation on building rooftops in Hong Kong: A machine learning-based parameterization approach,” Renew Energy, vol. 216, p. 119034, Nov. 2023. [CrossRef]
- Diahovchenko, L. Petrichenko, I. Borzenkov, and M. Kolcun, “Application of photovoltaic panels in electric vehicles to enhance the range,” Heliyon, vol. 8, no. 12, Dec. 2022. [CrossRef]
- S. Sagaria, G. Duarte, D. Neves, and P. Baptista, “Photovoltaic integrated electric vehicles: Assessment of synergies between solar energy, vehicle types and usage patterns,” J Clean Prod, vol. 348, May 2022. [CrossRef]
- “Solar resource maps and GIS data for 200+ countries | Solargis.” Accessed: Nov. 20, 2023. [Online]. Available: https://solargis.com/maps-and-gis-data/download/senegal.
|
Disclaimer/Publisher’s Note: The statements, opinions and data contained in all publications are solely those of the individual author(s) and contributor(s) and not of MDPI and/or the editor(s). MDPI and/or the editor(s) disclaim responsibility for any injury to people or property resulting from any ideas, methods, instructions or products referred to in the content. |
© 2024 by the authors. Licensee MDPI, Basel, Switzerland. This article is an open access article distributed under the terms and conditions of the Creative Commons Attribution (CC BY) license (http://creativecommons.org/licenses/by/4.0/).

