Preprint
Article

3D Simulation-Driven Design of a Microfluidic Immunosensor for Real-Time Monitoring of Sweat Biomarkers

Altmetrics

Downloads

134

Views

69

Comments

0

A peer-reviewed article of this preprint also exists.

Submitted:

05 July 2024

Posted:

10 July 2024

You are already at the latest version

Alerts
Abstract
This study presents the design and comprehensive 3D multiphysics simulation of a novel microfluidic immunosensor for real-time, non-invasive monitoring of pro-inflammatory biomarkers in human sweat. The patch-like device, designed using COMSOL Multiphysics, integrates magnetofluidic manipulation with direct-field capacitive sensing. The sensor comprises two distinct units: an immunocomplex enhancement unit, employing a series of microcoils to optimize the binding efficiency, reaction kinetics, and homogeneity of biomarker-magnetic nanoparticle (MNP) interactions, thereby enhancing the sensor's specificity; and a layered capacitive sensing unit, designed to concentrate and detect biomarker-tagged MNPs, thus amplifying sensitivity. Simulations of the capacitive sensing unit revealed a substantial sensitivity increase of up to 42.48\% at an 85\% MNP concentration within the detection zone. These findings highlight the potential of the proposed immunosensor for efficient and precise real-time biomarker monitoring, which may facilitate early disease diagnosis and enable personalized healthcare interventions.
Keywords: 
Subject: Engineering  -   Bioengineering

1. Introduction

Proinflammatory pathologies, a complex and growing concern in healthcare, have been brought into sharp focus by the COVID-19 pandemic [1,2]. The urgent need for early disease detection has intensified the search for reliable, non-invasive diagnostic tools.
Traditional methods like RT-PCR and cell cultures, while sensitive, are often impractical for widespread use due to their high cost and time-intensive nature [3,4,5]. Microfluidic biochips have emerged as a promising alternative, offering cost-effectiveness and rapid analysis of diverse biofluids for biomarkers like antigens, cytokines, and enzymes [6,7,8,9,10,11,12,13,14].
Among various sensing techniques, magnetic sensing has garnered significant attention due to its high sensitivity, resistance to interference, and versatility [15,16,17,18,19,20]. The integration of magnetic nanoparticles, microfabrication, and lab-on-a-chip technology has led to the development of advanced magnetic biosensors like Hall effect sensors, magneto-inductive sensors, and others [21,22,23,24,25].
Capacitive sensing, known for its label-free detection and fast response, has also seen progress in recent years, with applications in cancer biomarker detection and glucose monitoring [26,27,28,29]. However, existing capacitive sensors often suffer from limitations in sensitivity and dynamic range due to factors like the fringing field effect and passivation layer thickness [27,30,31].
Our research addresses these limitations with a novel device utilizing Direct-Field Capacitive Sensing (DF-CS), maximizing interaction volume between a uniform electric field and the sample. We employ advanced 3D multiphysics modeling to integrate magnetofluidic manipulation with capacitive sensing of biomarker-tagged magnetic nanoparticles (MNPs). This integration enhances reproducibility through controlled MNP manipulation, improves precision through optimized signal acquisition, and increases efficiency by streamlining biomarker capture and detection. To our knowledge, this is the first design combining these functionalities on a microfluidic platform. This paper presents a detailed analysis of 3D simulation results, showcasing the sensor’s enhanced performance under various conditions and its potential for real-world applications.
The sensor comprises two distinct units. Unit I (Preparation Stage) uses a coil array to generate a magnetic field, concentrating biomarker-bound MNPs, improving specificity, and optimizing immunocomplex formation, accelerating the assay process. Unit II (Detection Zone) captures these complexes and channels them into a capacitive sensing structure, where MNPs induce a measurable capacitance change directly correlating to biomarker concentration. Strategically placed metallic electrodes maximize the signal-to-noise ratio for sensitive detection.
This compartmentalized design not only combines magnetic and capacitive sensing but also optimizes the detection process, minimizing cross-contamination and interference. This results in a biosensor with high sensitivity, specificity, and speed, addressing the limitations of existing technologies and offering a powerful tool for the early diagnosis and management of proinflammatory pathologies.

2. Overview

2.1. Problem Formulation

Our study addresses the pressing need for continuous, real-time monitoring of pro-inflammatory biomarkers in human sweat. Such monitoring can provide valuable insights into an individual’s physiological state and early warning signs of inflammation-related conditions. To achieve this, we have designed a novel wearable microfluidic immunosensor patch, illustrated in Figure 1. This biosensor features a dual-unit structure to optimize the efficiency and accuracy of biomarker detection.
Unit (I), as detailed in Figure 1(b), serves as the initial stage of sample introduction in the biosensor. It incorporates an array of coils that generate a localized magnetic field. This magnetic field strategically traps and pre-concentrates magnetic nanoparticles (MNPs) functionalized with antibodies specific to the target pro-inflammatory biomarkers within the microfluidic channel. The pre-concentration step significantly enhances the biosensor’s specificity by increasing the probability of successful interactions between the MNPs and target biomarkers present in the sweat sample. In addition, the coils induce microfluidic mixing, ensuring a homogeneous distribution of both biomarkers and MNPs throughout the microfluidic channel. This uniform distribution creates an optimized environment for the efficient formation of immunocomplexes, which occur when the target biomarkers bind to their corresponding antibodies on the MNPs. By promoting efficient immunocomplex formation, the coils within Unit (I) accelerate the overall assay speed, enabling faster detection of biomarkers.
Unit (II), depicted in Figure 1(c), acting as the selective detection zone of the biosensor, features an upper coil that captures the biomarker-tagged MNPs from Unit (I). The captured MNPs are then precisely guided into a microfluidic channel embedded within a dielectric domain defined by dual parallel electrodes. This configuration forms a capacitive structure, where the presence of biomarker-tagged MNPs induces a measurable change in capacitance. This change occurs because the dielectric material within the domain interacts with the electric field differently when MNPs are present due to their unique electrical properties. By precisely measuring this capacitance shift, the sensor indirectly quantifies the concentration of target biomarkers. The strategic placement of metallic electrodes within the dielectric domain plays a crucial role in maximizing the signal-to-noise ratio, ensuring accurate and reliable detection of even minute quantities of biomarkers.
The compartmentalized design, featuring distinct units for binding and detection, offers notable advantages over conventional single-unit biosensors. This separation of functions provides greater control over the assay conditions, minimizes cross-contamination and non-specific interactions, and ultimately enhances the overall performance and reliability of the biosensor. Consequently, this innovative design is well-suited for the continuous, real-time monitoring of pro-inflammatory biomarkers in wearable applications.
To validate and optimize the design of our proposed biosensor, we developed a comprehensive 3D model (Figure 1(d)). This model encompasses three distinct domains, each simulating a specific physical process occurring within the device:
  • Magnetic Field Domain: This domain focuses on calculating the magnetic field distribution generated by the coils. Accurate prediction of the magnetic field is crucial for understanding how MNPs are manipulated and trapped within the microfluidic channels.
  • Fluid Dynamics Domain: This domain simulates the behavior of the biofluid (sweat) within the microfluidic channels, considering the complex interactions between the fluid, MNPs, and channel walls. This simulation helps optimize channel geometry and flow conditions for efficient biomarker capture.
  • Electrical Domain: This domain analyzes the electrical behavior of the system, particularly the capacitive response resulting from the presence of MNPs within the dielectric domain. Precise modeling of the electrical properties ensures accurate biomarker quantification.
By utilizing the finite element method (FEM) in COMSOL Multiphysics V 6.0, we numerically solve the governing equations for the magnetic, fluidic, and electric fields. This comprehensive simulation approach offers valuable insights into the biosensor’s operational dynamics. We can use these insights to iteratively refine the design, ultimately improving sensitivity and specificity, and bringing us closer to realizing a wearable biosensor that empowers individuals with real-time health monitoring capabilities.

2.2. Physics and Mathematical Framework of the Biosensor

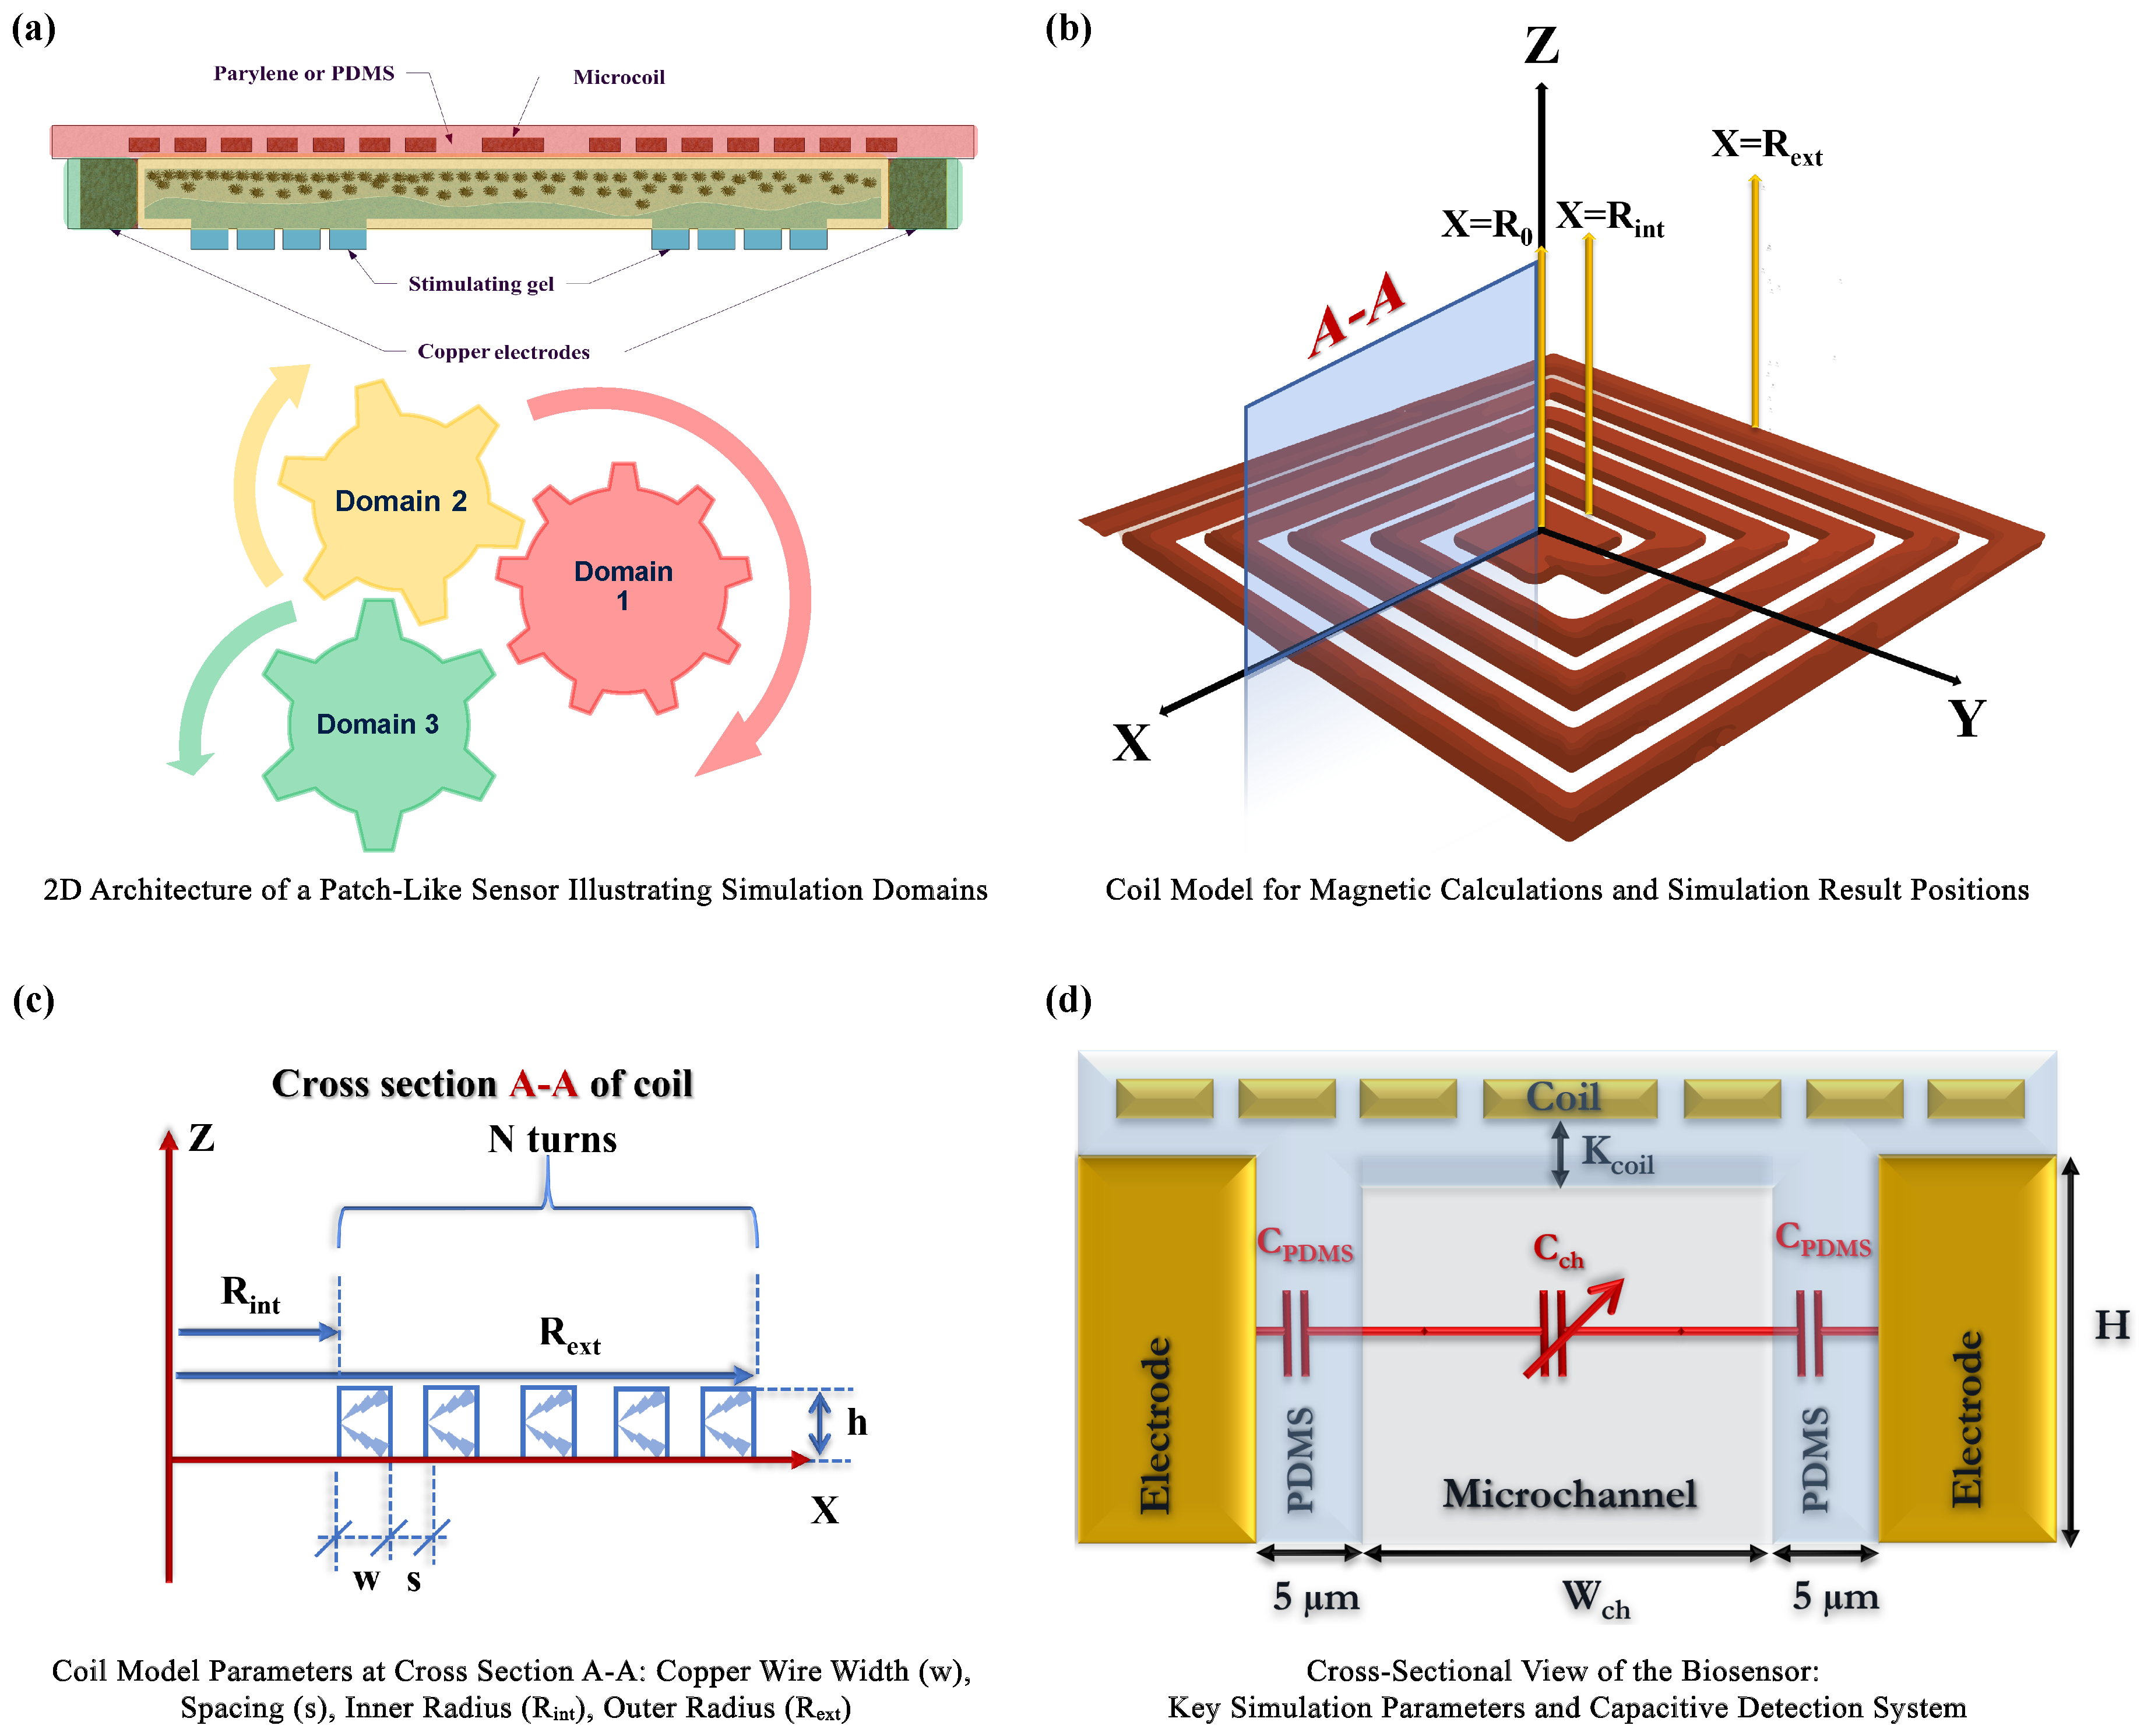
Expanding upon the introduction and design description, we delve into the fundamental physical and mathematical principles underpinning the microfluidic immunosensor’s operation. This in-depth analysis, focusing on the three critical domains visualized in Figure 2(a), provides a rigorous understanding of the sensor’s functional mechanisms.
Domain 1: Planar Coils
Domain 1 focuses on characterizing the magnetic field generated by the coils within the biosensor. To optimize magnetic field strength while minimizing power consumption, we evaluated four distinct copper planar coil designs (Figure 2(b) and Figure 2(c)), each varying in outer radius and turn count (R500 to R2000). All designs maintained consistent copper wire dimensions (width (w) = 10 μ m, height (h) = 10 μ m, and a separation between adjacent wires (s) = 10 μ m) to ensure a fair comparison.
We harnessed Maxwell’s equations to accurately predict the magnetic field distribution around the coils. The magnetic vector potential (A), which enables the derivation of the magnetic flux density (B) and magnetic field strength (H), is defined as: [32]
B = × A
Furthermore, the Ampere-Maxwell equation, incorporating current density (J), provides a comprehensive framework for modeling the electromagnetic behavior of the coils: [32]
× H = J
The relationship between magnetic flux density (B), magnetic field strength (H), and the medium’s properties is described by: [32]
B = μ 0 μ r H
where μ 0 = 4 π × 10 7 N / A 2 is the magnetic permeability in free space, and μ r is the relative permeability of the medium.
For accurate simulation of electromagnetic fields within the coil devices, we employed quadratic discretization in the Finite Element Method (FEM). This method, utilizing second-degree polynomial approximations, offers higher accuracy and a better representation of complex magnetic field distributions compared to traditional linear discretization methods.
To quantify coil efficiency, we used the power merit factor ( ( M p ), a critical metric relating maximum magnetic field strength ( B max ) to electrical power consumption ((P)), which is the product of voltage (U) and current (I). By carefully selecting coil dimensions and operational parameters through simulation, we aimed to strike an optimal balance between field intensity and power consumption for long-term device reliability and performance.
Domain 2: Microfluidic Platform
In Domain 2, our focus shifts to the microfluidic platform, where the dynamics of sweat flow and MNP transport are crucial. We model the flow of sweat, primarily composed of water, through the microchannel using the incompressible Navier-Stokes equations
The behavior of MNPs within this flow is of paramount importance. These nanoparticles experience magnetofluidic forces arising from the interaction between their magnetic properties and the external magnetic field gradient. By meticulously accounting for these forces, along with viscous drag forces (modeled using Stokes’ law), we gain valuable insights into the MNP trajectories and their interactions with the channel walls. This knowledge is essential for optimizing capture efficiency and ensuring controlled MNP delivery to the detection zone.
The governing incompressible Navier-Stokes equation for our fluid dynamics simulation, incorporating the velocity vector u , fluid density ρ , pressure gradient P , dynamic viscosity η , and external forces F , is given by: [33]
ρ u t + ρ ( u · ) u = P + η 2 u + F
The magnetofluidic force F map on the MNPs is quantified by: [34]
F map = 1 4 π μ r μ 0 D 3 μ r , p μ r μ r , p + 2 μ r H 2
This equation indicates that the magnetofluidic force is proportional to both the cube of the particle diameter D and the gradient of the squared magnetic field intensity H 2 . For the drag force F D , acting on a spherical MNP with diameter D, we apply Stokes’ law: [35]
F D = 18 η ρ p D 2 m p u v p
where η denotes the fluid’s viscosity ( Pa · s ), m p the mass of the particle (kg), v p the particle velocity vector (m/s), and ρ p the density of the particle ( kg / m 3 ).
To solve the complex equations governing particle motion within the fluid flow, we employ the Generalized alpha method (GAM). This advanced numerical technique excels at managing the temporal evolution of the system, meaning it can accurately capture how the motion of the MNPs changes over time within the dynamic fluidic environment. GAM also effectively suppresses spurious oscillations, which are numerical artifacts that can arise in simulations and compromise the accuracy of the results. By mitigating these oscillations, GAM ensures the stability of our simulations and the reliability of the data they produce.
Domain 3: Capacitive Electrodes
The final domain, Domain 3, focuses on the capacitive sensing mechanism that underlies the biosensor’s detection capabilities. By strategically arranging metallic electrodes within the microfluidic channel, we create a capacitor that is highly sensitive to changes in capacitance induced by the presence of MNPs, as shown in Figure 2(d). This direct-field capacitive sensing approach offers significant advantages in terms of sensitivity.
The capacitance (C) of the system is primarily governed by the dielectric properties of the materials between the electrodes, as described by the equation: [36]
C ϵ 0 ϵ r d A
where ϵ 0 represents the vacuum permittivity, ϵ r is the relative dielectric constant of the material between the electrodes, A denotes the electrode area ( m 2 ), and d is the electrode separation distance ( m ).
As MNPs accumulate in the detection zone, they alter the effective dielectric constant ( ϵ r ), leading to a measurable change in capacitance ( Δ C ), quantified by:
Δ C = ϵ 0 ϵ r , after A d ϵ 0 ϵ r , before A d
This expression highlights the sensor’s sensitivity to changes in biomarker concentrations, as these changes are reflected in MNP-induced variations in dielectric properties.
To further refine our model, we consider the microfluidic channel’s structure and estimate the equivalent capacitance ( C e q ) of the biosensor, taking into account the PDMS walls and the variable channel capacitance (Figure 2(d)):
C e q = ϵ 0 ϵ r , PDMS ϵ r , ch ϵ r , PDMS d ch + 2 ϵ r , ch d PDMS A
Here, ϵ r , PDMS and ϵ r , ch represent the dielectric constants of PDMS and the channel, respectively. This comprehensive model, integrating both direct-field capacitive sensing and magnetic trapping, provides a robust framework for understanding and optimizing the detection and quantification of MNP-tagged biomarkers.
In practical terms, if the initial capacitance without MNPs is ( C 0 ) , and the capacitance changes to (C) after the introduction of MNP-biomarker complexes, the change in capacitance ( Δ C ) can be calculated using Equation 8. This ( Δ C ) value serves as a unique fingerprint for the specific biomarker concentration within the sweat sample.
To translate this fingerprint into a quantitative measurement of biomarker concentration, we utilize a pre-established calibration curve. This curve is generated by meticulously measuring the change in capacitance ( Δ C ) across a range of known concentrations of the target biomarker during the biosensor’s development phase. By referencing this curve, we can accurately determine the unknown concentration of the biomarker in a new sweat sample. This is achieved by simply matching the measured ( Δ C ) value from the new sample to the corresponding concentration on the calibration curve. This approach allows for precise and reliable determination of biomarker levels in real-world samples.

2.3. Implementation Details

Given the complex interplay of electromagnetic, fluidic, and nanoparticle dynamics within our biosensor, a robust numerical simulation strategy was essential. COMSOL Multiphysics, with its versatile capabilities, proved instrumental in realizing this strategy, allowing us to model the intricate interactions meticulously. The simulation process involved the seamless integration of three distinct modules within COMSOL Multiphysics:
  • AC/DC Module for Electromagnetic Field Simulation: This module was employed to rigorously simulate the electromagnetic landscape within the biosensor. By applying Maxwell’s equations, we accurately characterized both the magnetic fields generated by the coils and the electric fields across the electrodes. This precise simulation of electromagnetic fields is fundamental to understanding their interplay with biological media, ultimately determining the efficacy of MNP detection.
  • CFD Module for Fluid Dynamics Analysis: To model the intricate flow of biofluids, particularly sweat, through the microchannels, we harnessed the Computational Fluid Dynamics (CFD) Module. By solving the Navier-Stokes equations, we captured the nuances of fluid behavior, including velocity profiles, and pressure gradients. This comprehensive understanding of fluid dynamics proved essential for optimizing microchannel design and ensuring efficient biomarker and MNP transport.
  • Particle Tracing Module for Nanoparticle Dynamics Investigation: The Particle Tracing Module enabled us to simulate the dynamic behavior of magnetic nanoparticles within the microfluidic environment. By considering the forces acting upon the MNPs, including magnetic forces and viscous drag, we predicted their trajectories and interactions with the surrounding fluid and channel walls. This analysis was pivotal for understanding the mechanisms underlying MNP capture, concentration, and ultimately, biomarker detection.
The efficacy and accuracy of these simulations hinged on selecting appropriate design parameters and material constants. Table 1 and Table 2 provide a comprehensive overview of these parameters, encompassing variables such as coil current, electrode height, nanoparticle diameter, channel dimensions, and material properties. The values in these tables were not arbitrary but were carefully determined through a combination of experimental data, literature review, and preliminary simulations. This meticulous approach ensured that our simulations accurately reflected the real-world behavior of the biosensor, allowing us to make informed design decisions and optimize its performance.

3. Results and Discussion

3.1. Optimizing coil Configurations: Balancing Efficiency and Functionality

Microfluidic biosensors often rely on magnetic fields to manipulate magnetic nanoparticles (MNPs) for various functions. Integrated planar coils offer distinct advantages over traditional permanent magnets in this context. Their magnetic fields can be dynamically controlled and adjusted by varying the input current, enabling precise manipulation of MNPs within the microfluidic system. Moreover, unlike permanent magnets, coils do not exhibit residual magnetism when deactivated, preventing unintended MNP aggregation or interference. Building on our prior research on coil design [37,38,39,40], which are capable of creating broader trapping zones and more uniform magnetic fields essential for advanced magnetofluidic applications. We also clearly delineate the distinct roles of coils optimized for MNP trapping versus those designed for MNP detection.
Magnetic Field Analysis:
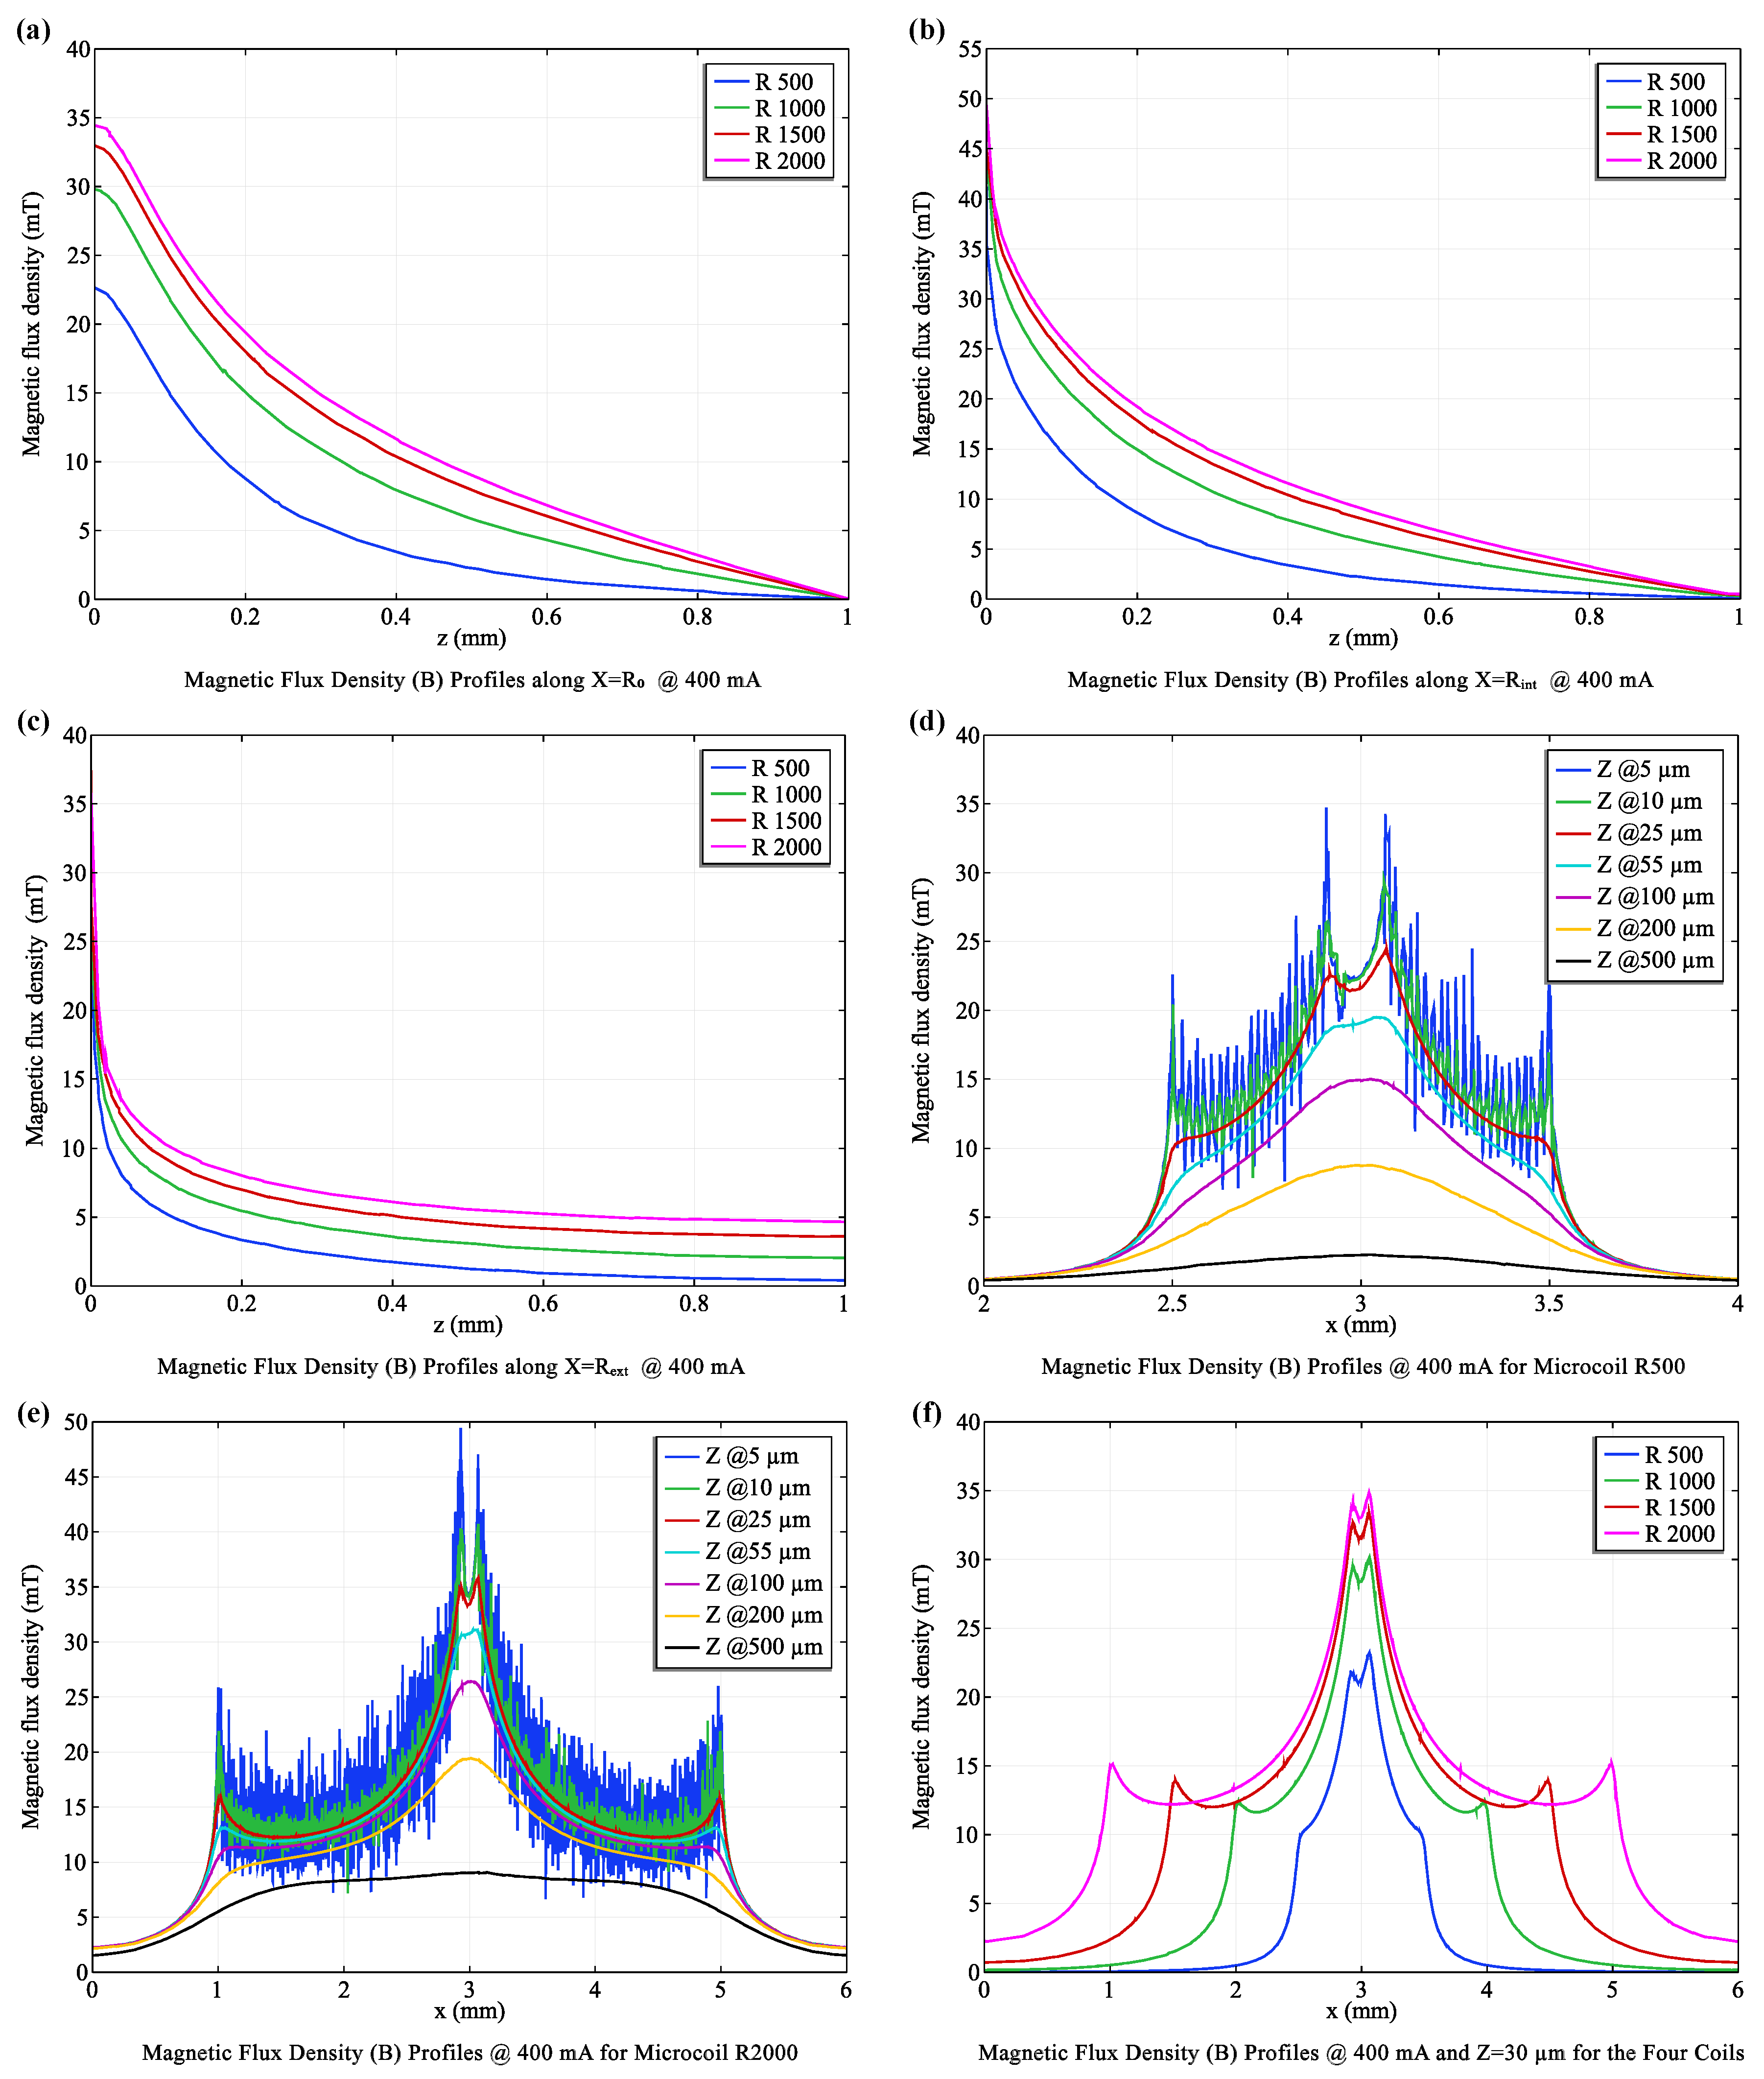
We rigorously analyzed four single-coil configurations (R500 to R2000), applying a constant current of 400 mA and assessing the magnetic flux density (B) in both vertical ( B z ) and horizontal ( B x ) directions at various positions along the microfluidic channel (Figure 3). Our goal was to understand the strength, uniformity, and directionality of the magnetic field generated by each coil design. The results confirmed the Biot-Savart Law, which predicts an inverse relationship between magnetic field strength and distance from the current-carrying conductor. This relationship is evident in the 1 x curve approximation observed in Figure 3(a)-(c), demonstrating a decay in magnetic flux density with increasing distance from the coil surface.
To quantify these observations, we conducted statistical analyses of the magnetic flux density at three key positions relative to the coils:
  • X = R 0 : Directly above the coil center, the R2000 coil (with more turns) generated a significantly stronger B z (20.58 mT) compared to the R500 coil (10.05 mT), demonstrating the influence of coil turns on field strength.
  • X = R i n t : At an intermediate distance, this trend persisted, with the R2000 coil maintaining a higher B z (21.92 mT) than the R500 coil (11.58 mT).
  • X = R e x t : Even at the furthest distance, the R2000 coil produced a stronger B z (9.42 mT) compared to the R500 coil (5.19 mT).
Importantly, the magnetic flux density exhibited higher uniformity closer to the coil surface (X ≈ R 0 ). This finding is crucial for MNP trapping applications, as it ensures a consistent magnetic force on MNPs within the trapping zone. In summary, our analysis reveals a clear trend of decreasing magnetic flux density with increasing distance from the coil, aligning with electromagnetic principles. The larger R2000 coil consistently produced higher flux densities, translating to a broader and more effective trapping zone, ideal for the MNP Trapping Unit (Unit I).
Optimal Field Uniformity:
While generating a strong magnetic field is important for effective MNP manipulation, field uniformity is equally crucial to ensure consistent behavior across all particles. Our analysis revealed that the coil’s magnetic field exhibited the highest degree of uniformity at a distance of approximately 30 μ m from the coil surface (Figure 3(d)-(f)). This optimal distance is attributed to the "rippling effect," where the close proximity of coil turns leads to minor variations in current density, resulting in slight fluctuations in the magnetic field intensity. To mitigate this rippling effect, we incorporate a small spacer layer between the coil and the fluid, typically achieved through the microfluidic channel design. This spacer layer ensures that the MNPs within the trapping zone experience a more uniform magnetic field, minimizing unwanted torque or rotational forces that could disrupt their alignment and movement.
Maintaining uniform field strength is essential for various applications. For instance, in our biosensor, it ensures the consistent and predictable movement of MNPs towards the detection zone, facilitating efficient biomarker capture. It also enables controlled interactions between MNPs and other biomolecules or sensor surfaces, crucial for accurate detection and analysis.
Power Efficiency Considerations:
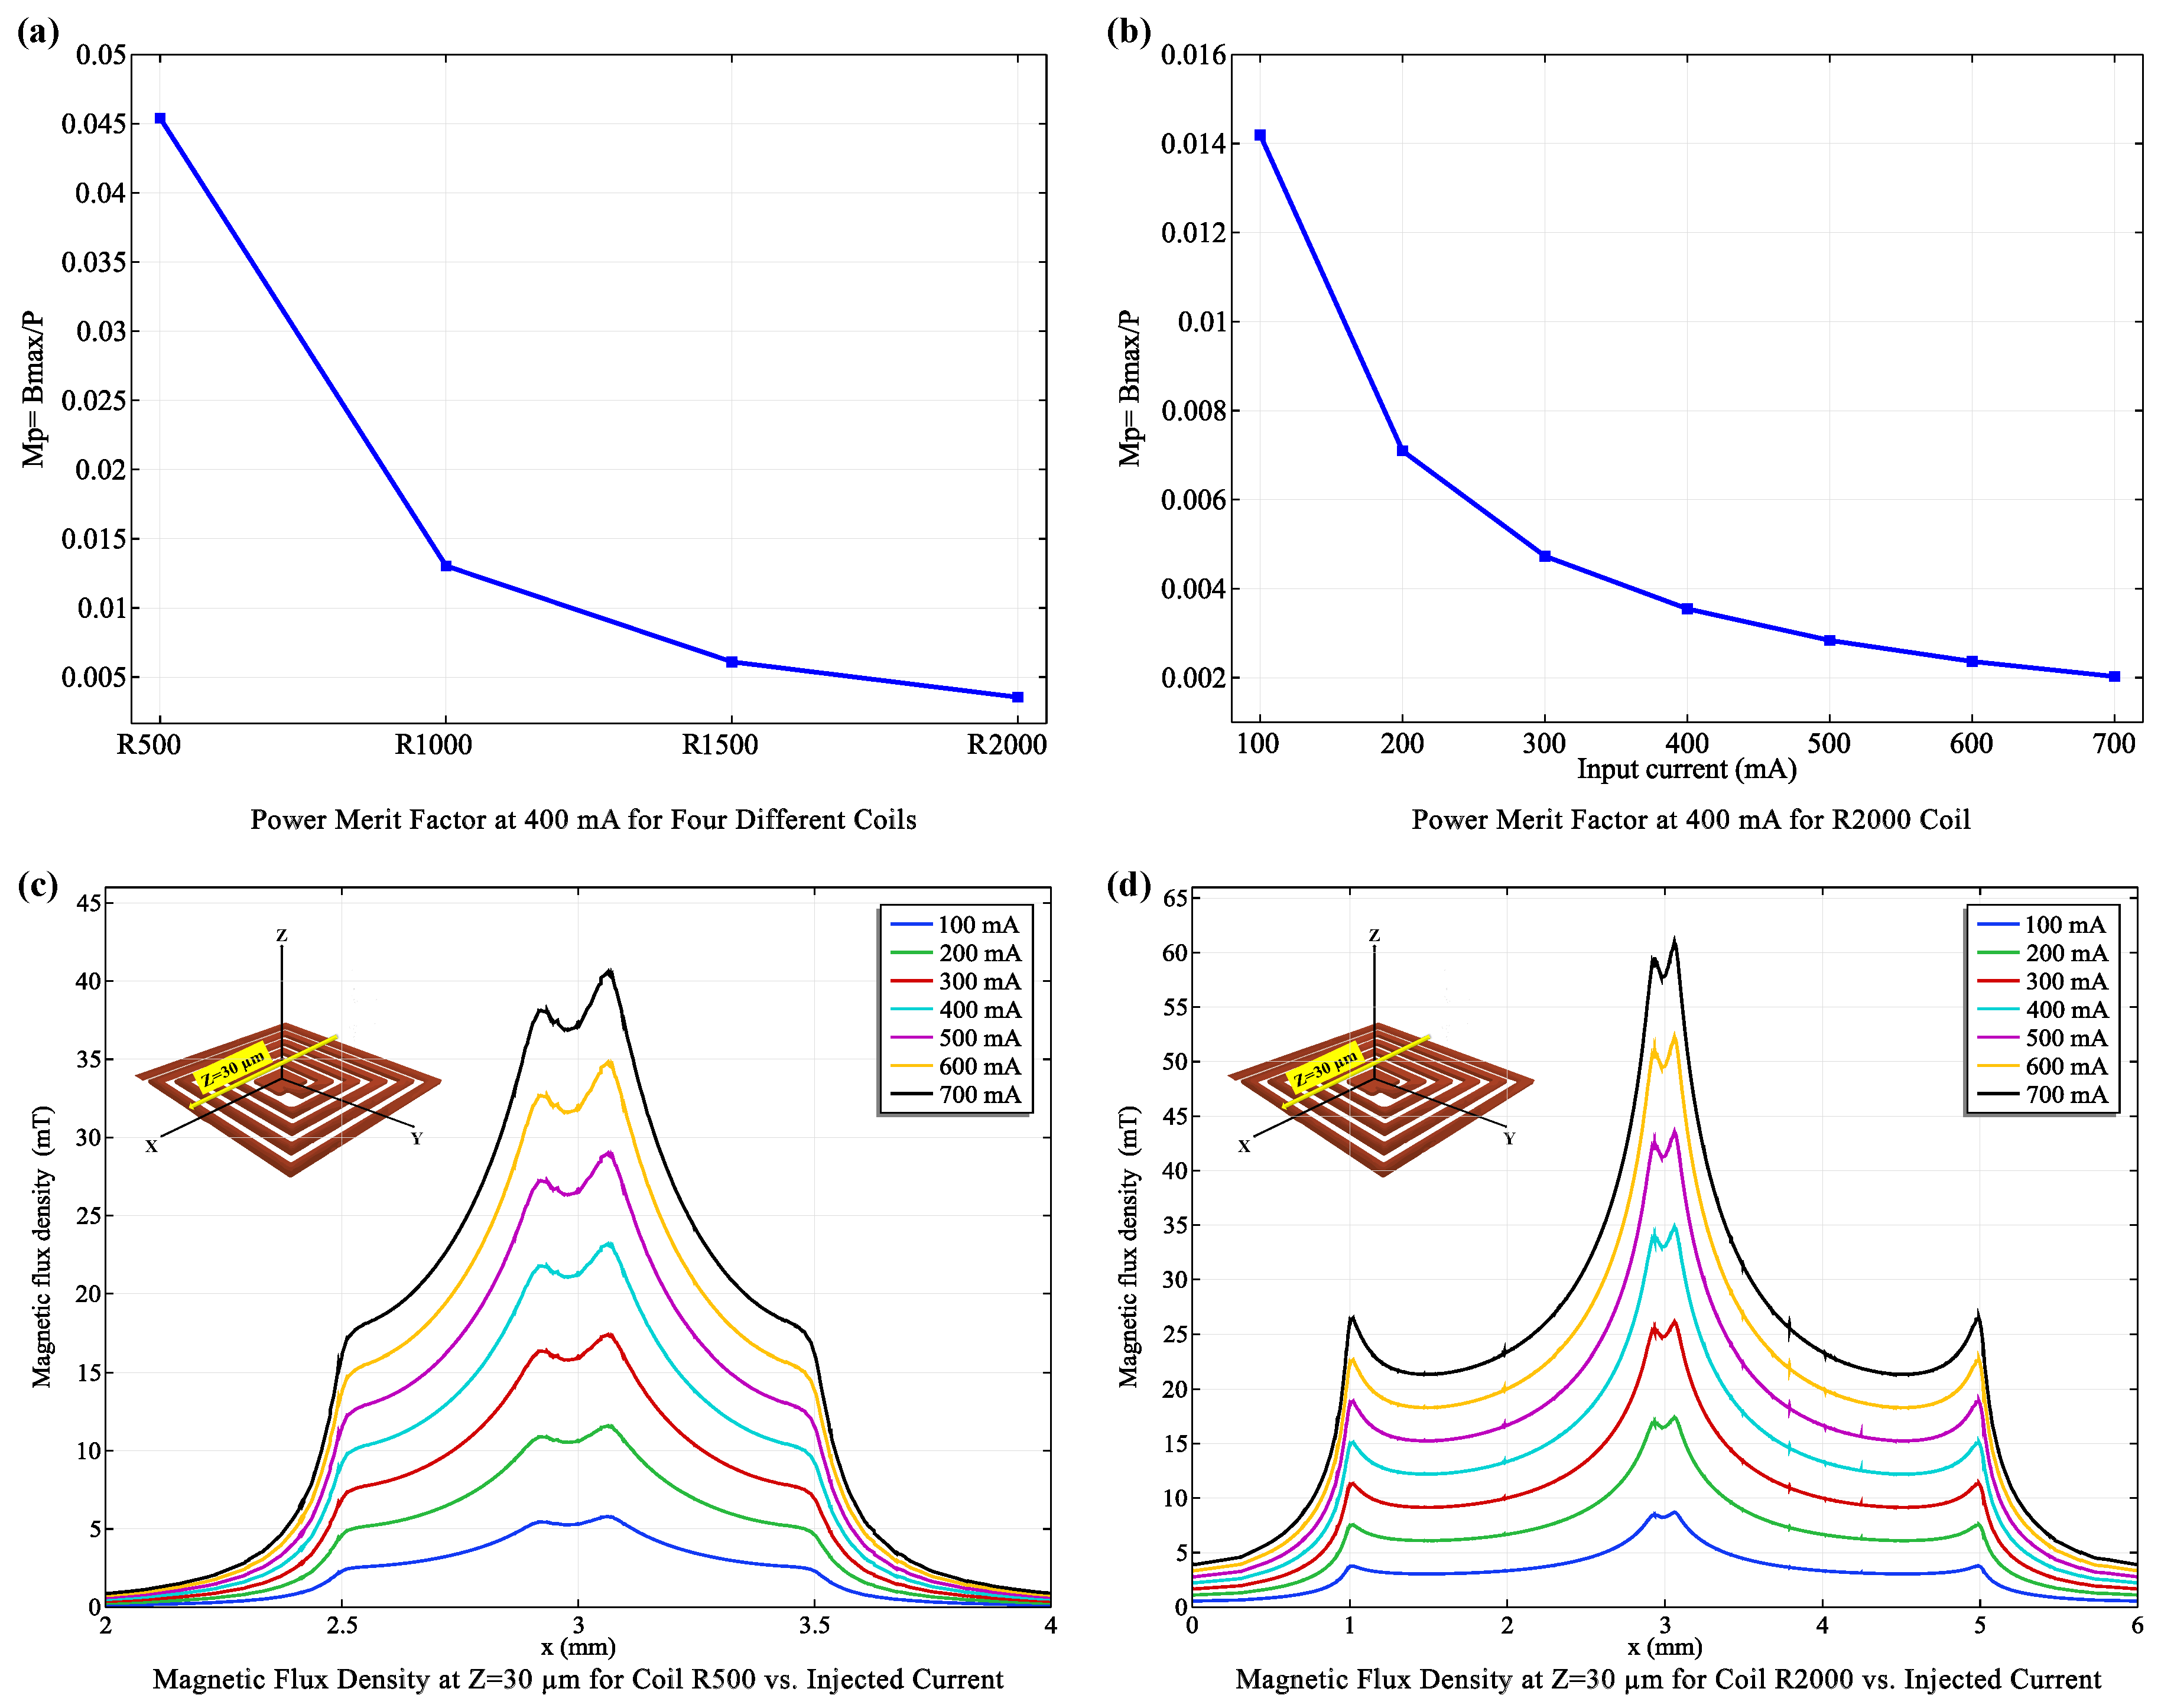
Although the R2000 coil excels at generating strong magnetic fields, the smaller R500 coil demonstrates superior power efficiency, as evidenced by its higher Power Merit Factor ( ( M p ) (Figure 5(a)). This makes the R500 coil a more suitable choice for the MNP Detection Unit (Unit II), where a smaller field strength is sufficient for MNP capture, and minimizing power consumption is crucial for extending the battery life of wearable devices.
We also observed that the power efficiency of the R2000 coil is inversely proportional to the applied current (Figure 5(b) and (d)). While higher currents increase the magnetic field strength, they also lead to reduced power efficiency. This trade-off underscores the importance of carefully balancing field strength and power consumption to optimize the overall performance of the biosensor. Our analysis suggests that a sustainable operational current range for the R2000 coil, specifically in the MNP Trapping Unit (Unit I), lies between 100 mA and 400 mA. Within this range, the coil can generate a sufficiently strong magnetic field for effective MNP trapping while maintaining acceptable power consumption levels.
Tailoring Coils to Specific Functions:
Our findings underscore the importance of tailoring coil design to specific functions within the biosensor. The comparative analysis between the R500 and R2000 coils ( Figure 4) reveals that the R2000 coil, with its greater number of turns, generates a 20% stronger magnetic flux density under the same current (400 mA). This enhancement translates to a significantly wider trapping zone, which is crucial for effectively capturing and concentrating MNPs. Notably, both coils exhibit exceptionally high magnetic flux densities in their central region, a result of the abrupt directional changes in current flow at the coil corners.
In summary, the R2000 coil, characterized by its strong and broad magnetic field, is ideally suited for the MNP Trapping Unit (Unit I), where its enhanced field strength maximizes MNP capture and concentration. Conversely, the R500 coil, with its superior power efficiency and smaller field, is better suited for the MNP Detection Unit (Unit II). In this unit, a smaller field is sufficient for MNP capture, and the R500 coil’s energy efficiency is prioritized to extend the battery life of the wearable device.
By strategically selecting and optimizing coil configurations based on their specific roles within the biosensor, we can significantly enhance the overall performance, sensitivity, and energy efficiency of our wearable device. This tailored approach not only improves the current capabilities of the biosensor but also lays the groundwork for future advancements in wearable health monitoring technologies.
In the following section, we will delve into the simulation results concerning fluid dynamics and magnetic trapping efficiency, further elucidating how variations in coil geometry and fluid flow dynamics influence MNP trapping and detection within biosensing systems.

3.2. Fluid Dynamics and Magnetic Trapping Performance in Microfluidic Platform

Our study employs computational fluid dynamics (CFD) simulations and magnetic field modeling to investigate the dynamic interplay between coils and fluid flow within microfluidic environments. These simulations are crucial for understanding how coil configuration and fluid dynamics influence the trapping of magnetic nanoparticles (MNPs), a critical aspect of biosensor functionality.
Optimizing Microchannel Alignment:
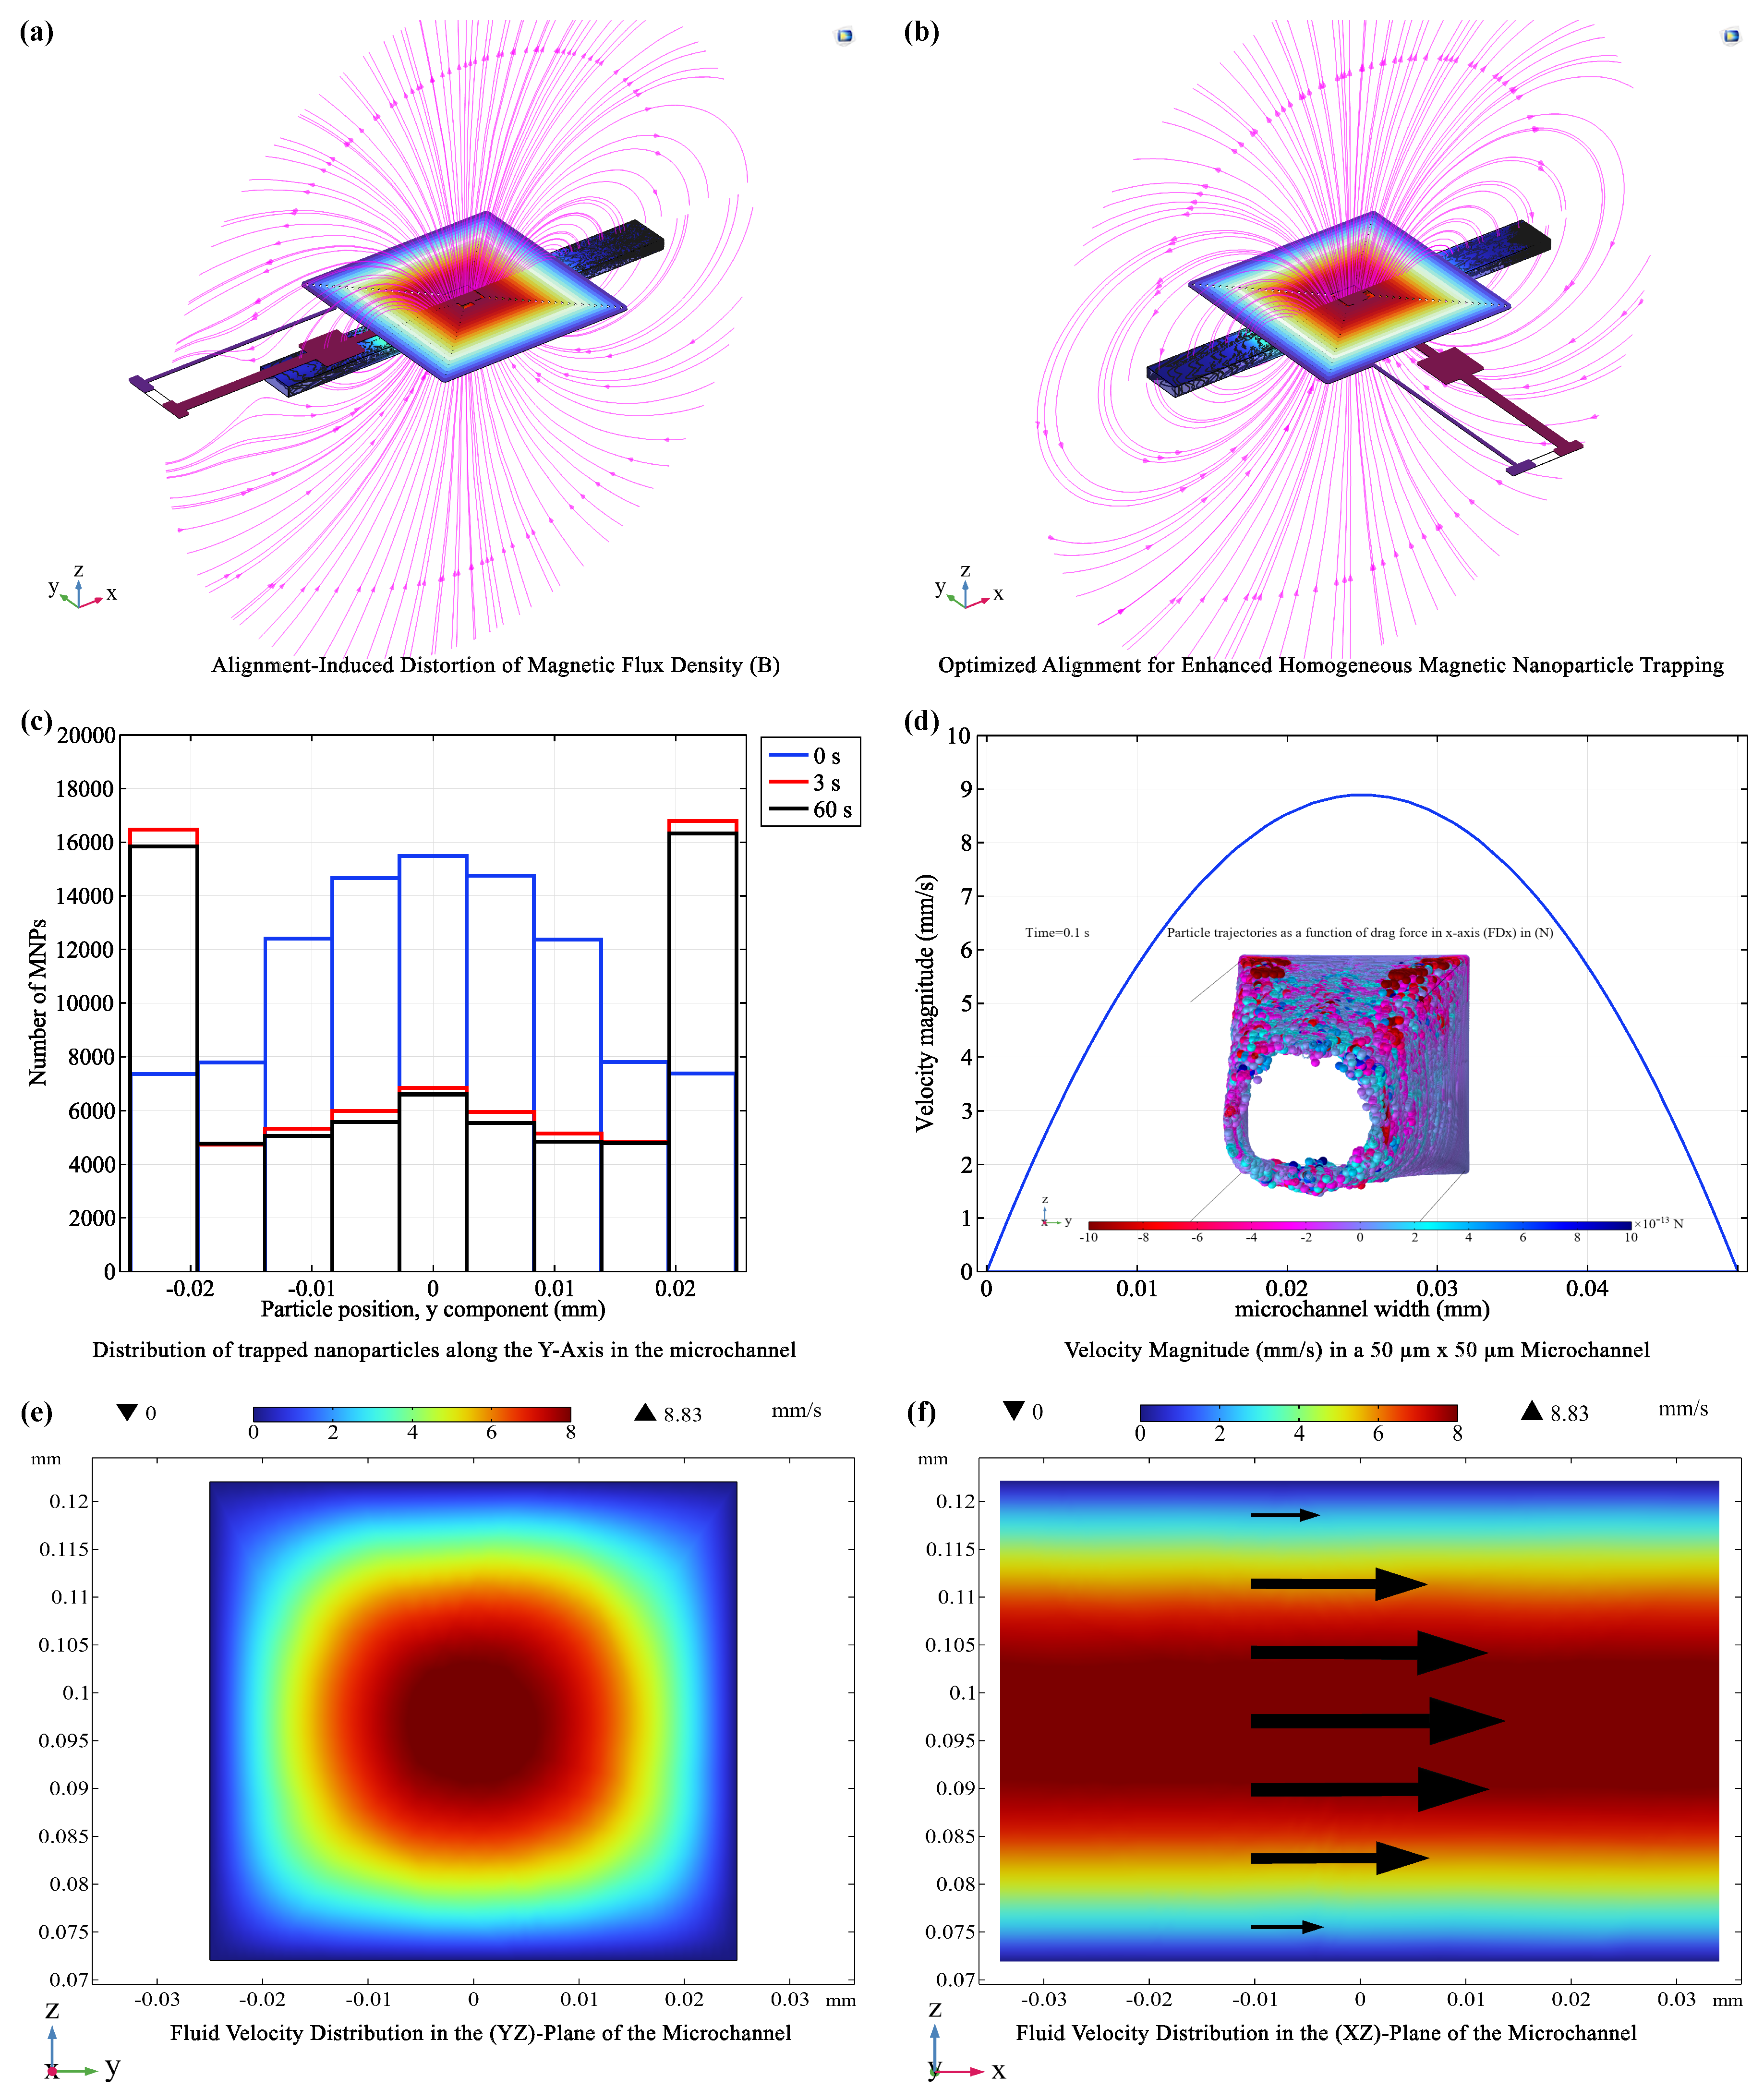
Our findings reveal that the placement of the microchannel relative to the coil significantly impacts trapping efficiency. Figure 6(a) illustrates that a channel positioned directly beneath the coil, parallel to the vias, creates a non-uniform magnetic field. This non-uniformity leads to uneven MNP trapping, as the magnetic forces acting on the particles vary depending on their position within the channel. Conversely, aligning the microchannel perpendicular to the vias (Figure 6(b)) results in a more uniform magnetic field across the channel width. This uniformity significantly improves the homogeneity of MNP trapping, as confirmed by analyzing the distribution of MNPs at different time points during the simulation (Figure 6(c)).
Fluid Dynamics and MNP Trapping:
In the optimized microfluidic channel setup ( 50 × 50 μ m ), a laminar flow regime is established (Figure 6(d)). In laminar flow, the fluid moves in smooth, parallel layers with minimal mixing between them. The velocity profile within the channel is parabolic, meaning the fluid flows fastest at the center and slows down towards the walls (Figure 6(e)-(f)). This variation in flow velocity across the channel width is known as a velocity gradient.
The MNPs within the channel are subjected to two competing forces. The first is the magnetofluidic force, which arises from the interaction between the MNPs’ magnetic properties and the external magnetic field gradient generated by the coil. This force pulls the MNPs towards regions of higher magnetic field strength, typically located near the coil center. The second force is the drag force, caused by friction between the MNPs and the surrounding fluid. This force opposes the movement of the MNPs and is stronger where the fluid velocity is higher (i.e., at the channel center).
The interplay between these two forces determines the MNPs’ behavior. As they flow through the channel, MNPs experience an increasing magnetofluidic force as they approach the channel walls due to the steeper magnetic field gradient in these regions. Simultaneously, the drag force weakens due to the decreasing fluid velocity near the walls. The result is a net force that drives the MNPs towards the channel walls, where they accumulate due to minimal flow velocity. This accumulation effectively increases their concentration and facilitates their capture (Figure 6(d) inset).
Coil Performance in Trapping Efficiency:
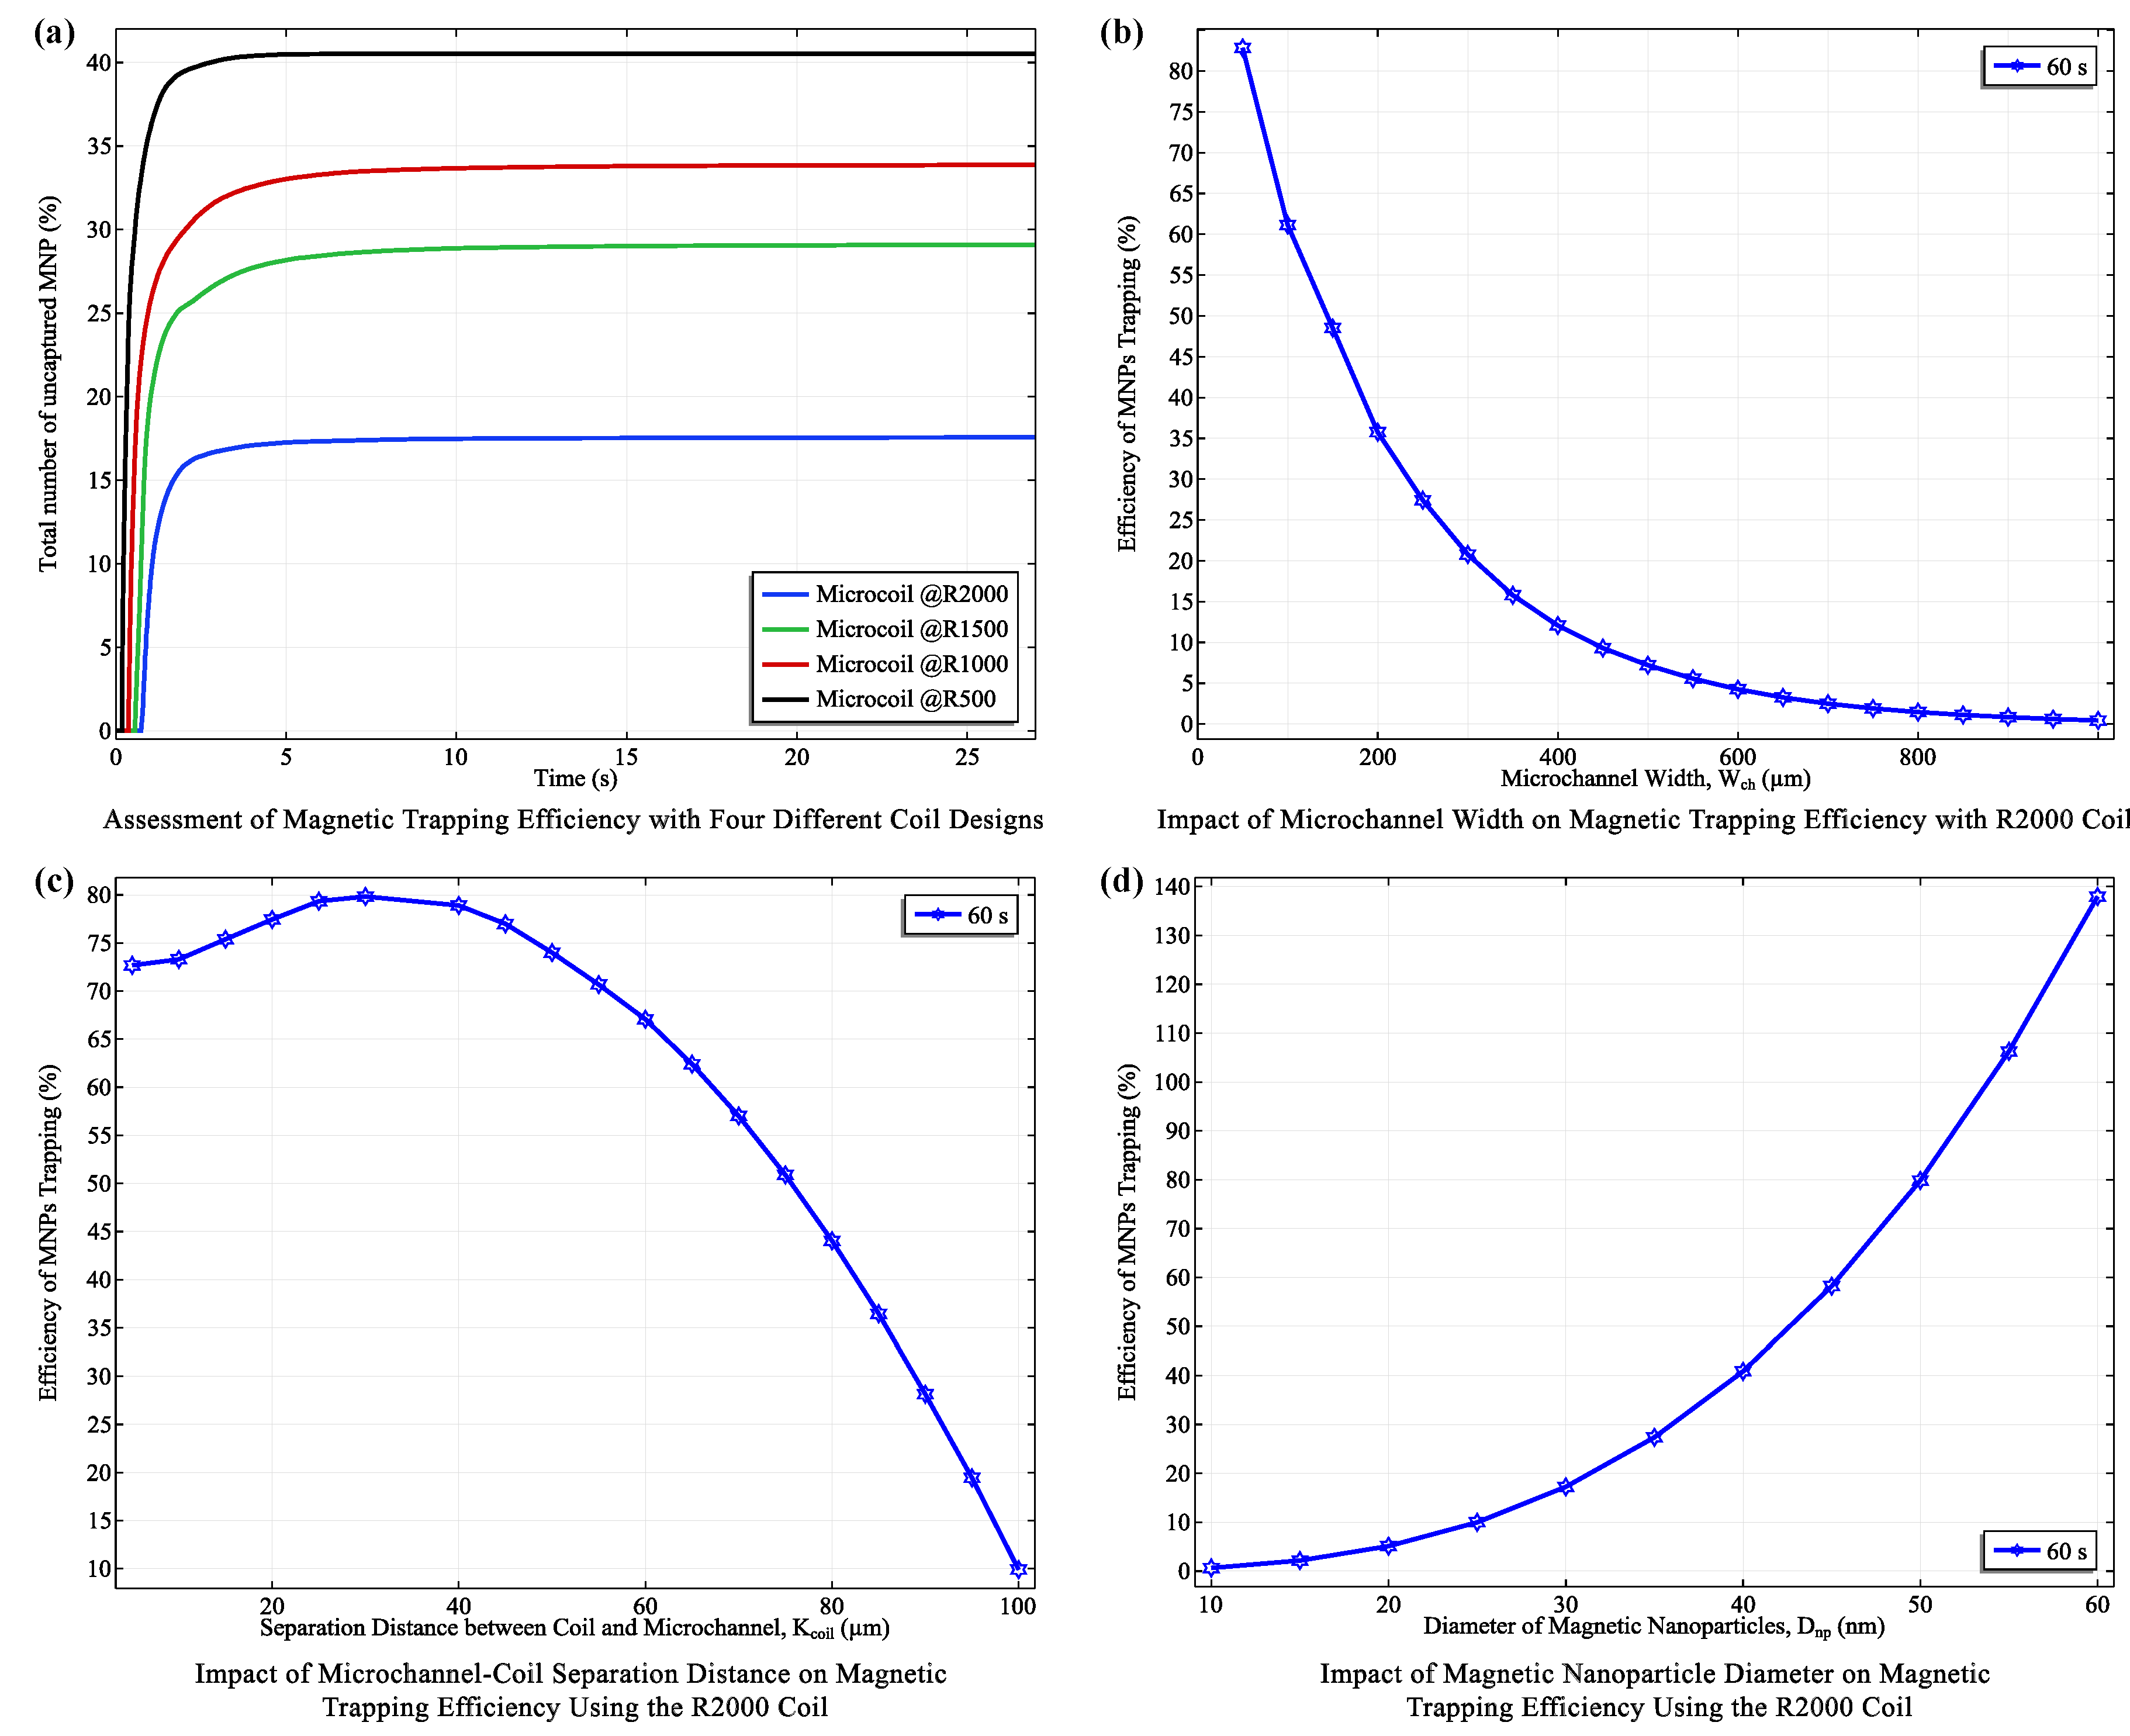
Building on the coil configurations optimized in the previous section for field strength and power efficiency, we systematically evaluated their trapping performance. Notably, the R2000 coil, with its larger size and stronger magnetic field, achieved the highest mean trapping efficiency of 82 . 83 % . The R1500, R1000, and R500 coils followed with efficiencies of 72 . 20 % , 67 . 35 % , and 60 . 18 % , respectively. Additionally, the R2000 coil demonstrated the lowest standard deviation ( 2 . 20 % ), indicating a more consistent trapping process. Remarkably, all coils achieved a steady-state trapping regime rapidly, within 1 to 10 seconds, with the R2000 coil achieving this in just 1 s.
To further optimize trapping, we investigated the impact of microchannel width and coil-to-channel distance using the R2000 coil. We observed a significant negative correlation between microchannel width (ranging from 50 μ m to 1000 μ m ) and trapping efficiency. The efficiency decreased sharply from 82.83% at a 50 μ m width to a mere 0.44% at a 1000 μ m width (Figure 7(b)), with channel width explaining approximately 73.3% of the variance in trapping efficiency. This highlights the crucial role of channel dimensions in magnetic trapping systems.
The enhanced trapping efficiency in narrower microchannels is due to the characteristics of the magnetic field generated by the planar coil. Narrower channels concentrate the magnetic flux, resulting in higher flux density within the channel (Figure 6(b)). Additionally, the magnetic field gradient (the rate of change of field strength with respect to distance) becomes steeper in narrower channels. This steeper gradient exerts a stronger force on MNPs, thereby enhancing their capture and retention.
Our investigation also extended to the effect of the microchannel-coil separation distance ( K coil ) on trapping efficiency using the R2000 coil (Figure 7(c)). We found that the highest efficiency (82.83%) occurred at K coil = 30 μ m , consistent with the optimal distance predicted based on magnetic field profiles where the "rippling effect" of the magnetic field is minimized. As the separation increased beyond 30 μ m , efficiency dropped rapidly due to the weakening magnetic field.
Finally, we explored the impact of nanoparticle diameter ( D NP ) on trapping efficiency under the R2000 coil at 400 mA (Figure 7(d)). Results aligned with theoretical predictions, showing increased trapping efficiency with larger diameters. This is because the magnetofluidic force is proportional to ( D NP 3 ), while the drag force is inversely proportional to ( D NP 2 ). Therefore, larger MNPs experience a stronger magnetic force relative to drag, leading to more efficient trapping.
Having determined optimal parameters through this comprehensive optimization process, we establish the following ideal settings for magnetic trapping: 50 μ m microchannel width, 30 μ m coil-to-channel separation, and 50 nm MNP diameter. These conditions ensure maximal magnetic trapping performance and uniformity in field strength, setting the stage for the next phase of our study, focusing on the innovative capacitive detection system.

3.3. Capacitive Sensing Performance and Implications

Having optimized the coil configurations and investigated the fluid dynamics of magnetic nanoparticle (MNP) trapping, we shift our focus to integrating capacitive sensing technology into our biosensor. This approach synergistically combines magnetic trapping with direct-field capacitive detection to enhance biomarker monitoring sensitivity by detecting MNPs bound to target biomarkers. Based on our prior analysis, the R500 coil, with its superior power efficiency and sufficient trapping capability, was selected for the Trapping & Detection unit (II).
Electrode Material Selection:
The choice of electrode material significantly influences the biosensor’s overall performance, sensitivity, and cost. In this study, we systematically evaluated two common electrode materials, copper and gold, immersed in a medium with a relative permittivity ( ε r ) closely approximating that of sweat ( ε r 80 ). This medium was selected to simulate the real-world operating conditions of the biosensor, as sweat is the target biofluid for biomarker analysis.
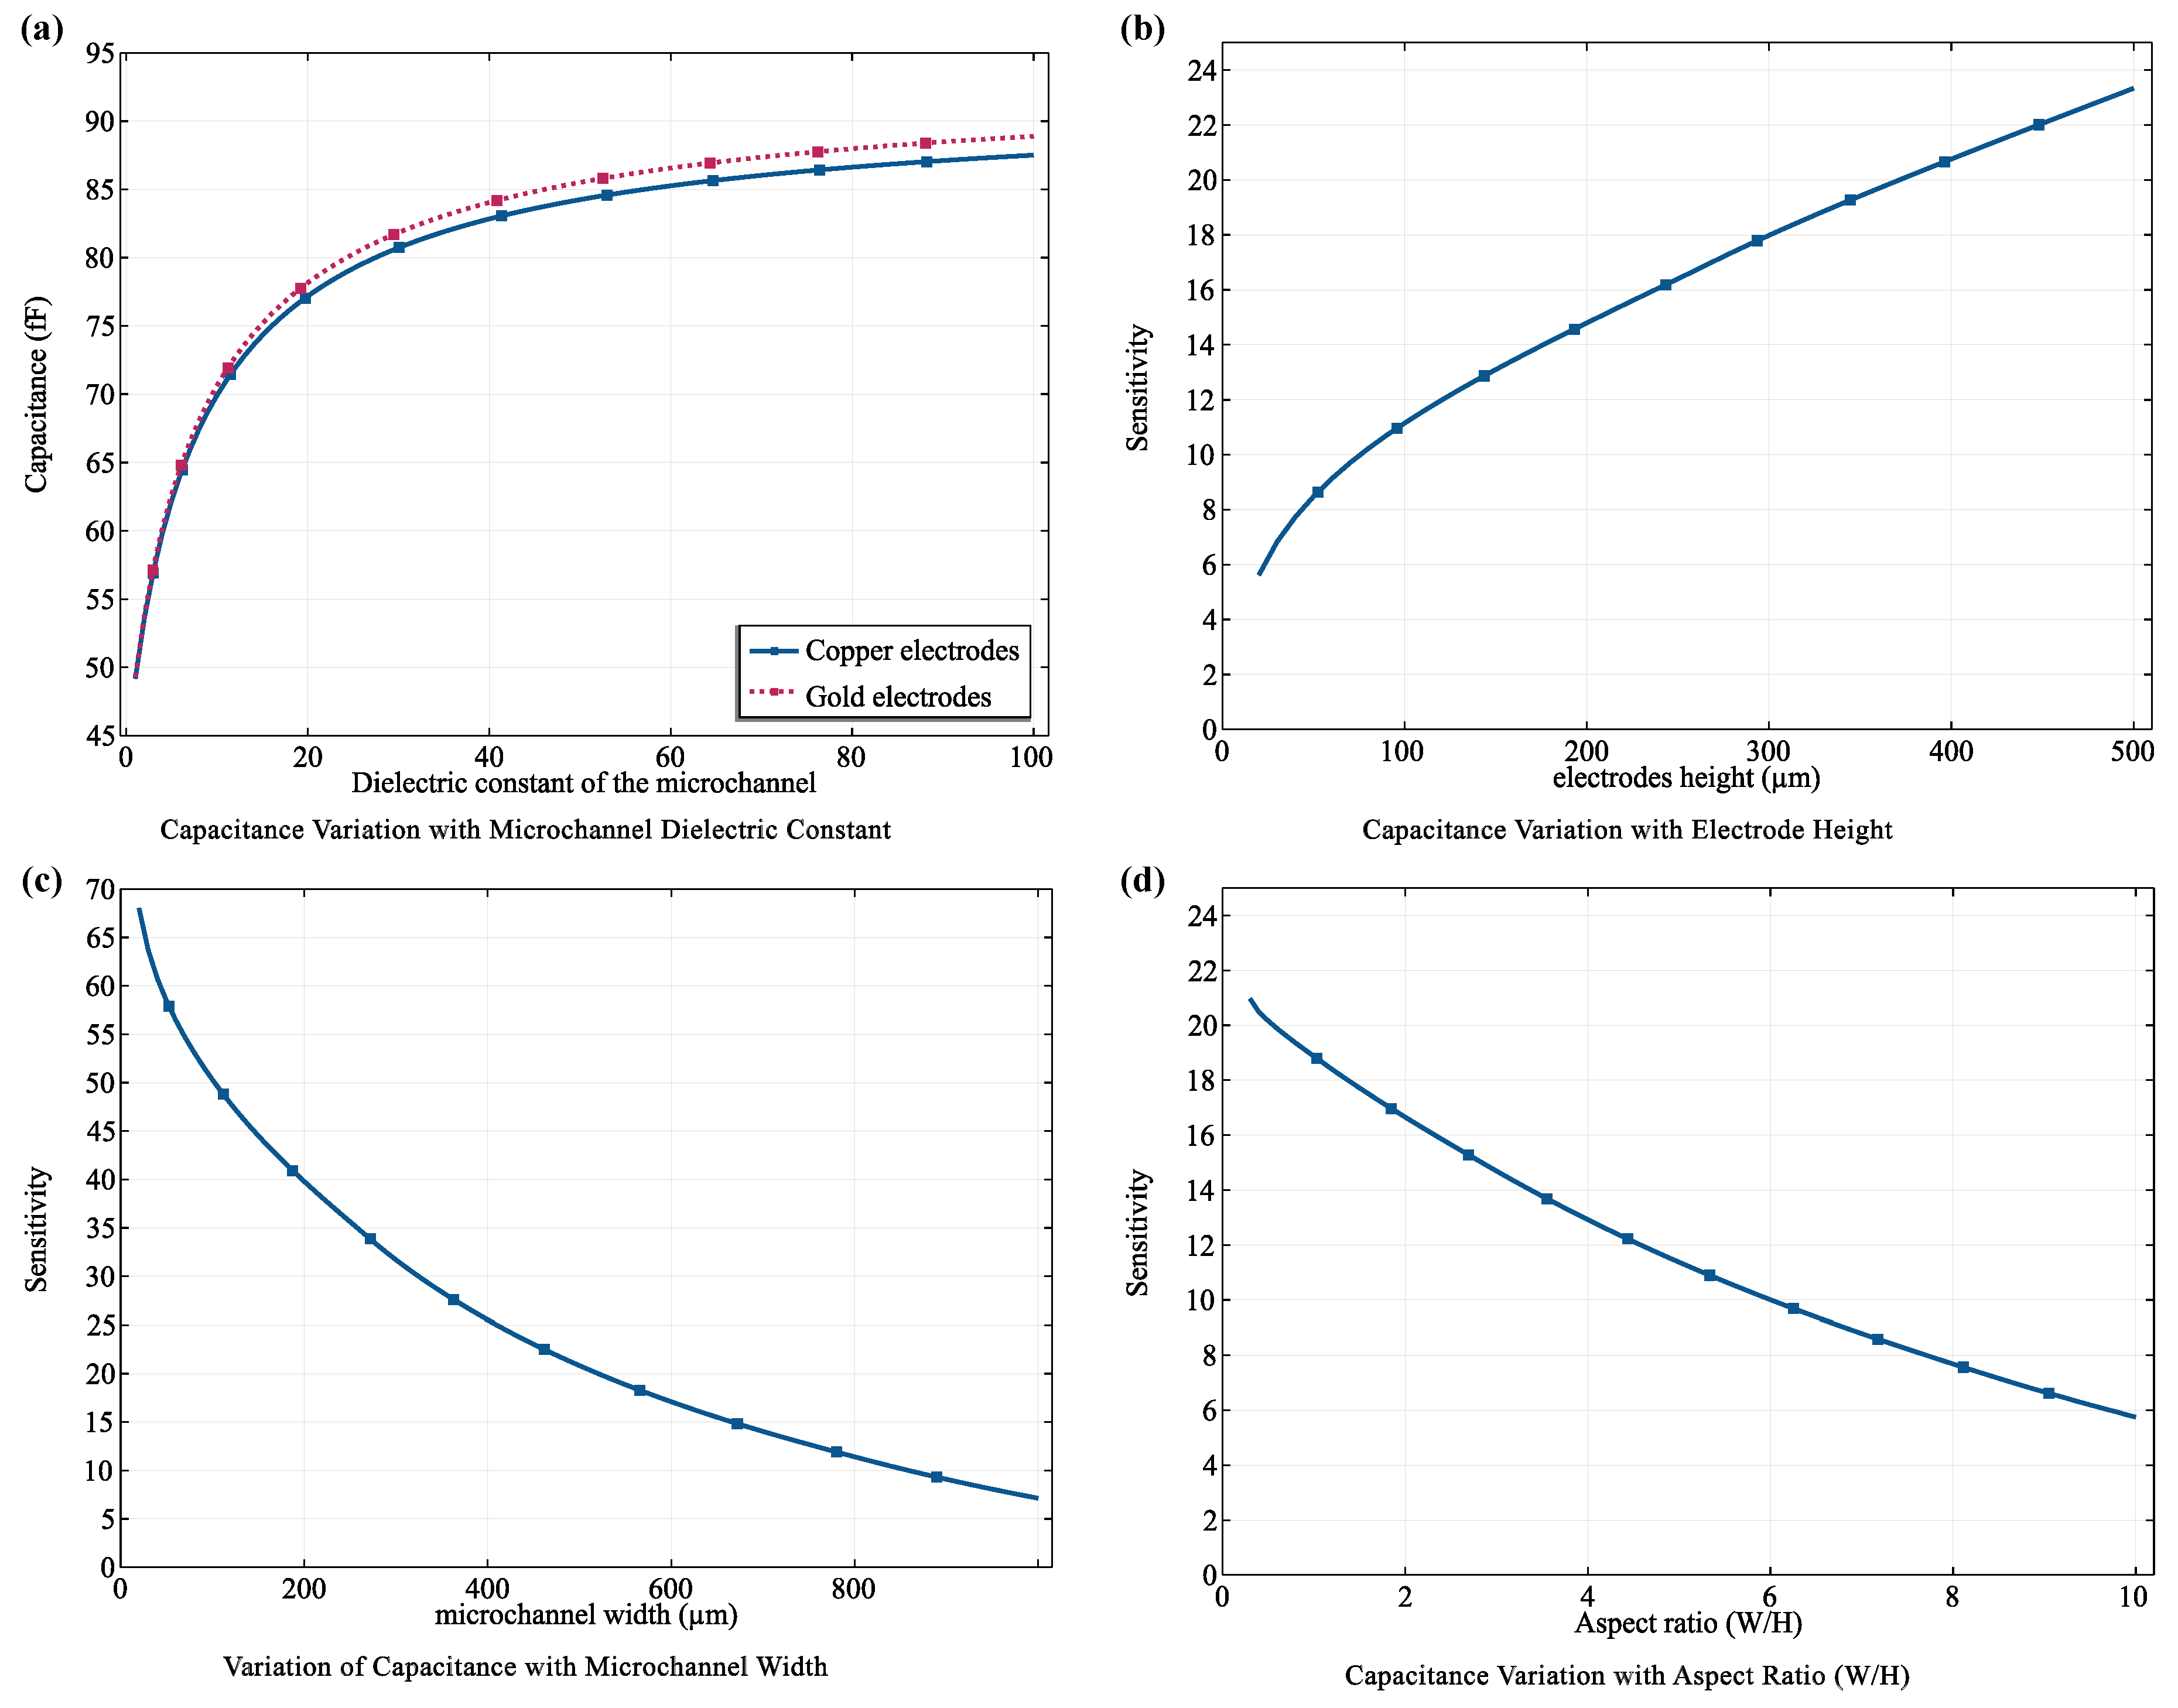
Our evaluation focused on the change in capacitance ( Δ C ) induced by the presence of the fluid within the detection zone. This change is directly related to the dielectric properties of the fluid. Both copper and gold electrodes demonstrated a substantial increase in capacitance compared to air( ε r = 1 ), indicating their ability to effectively detect changes in the dielectric properties of the surrounding medium. Specifically, copper electrodes exhibited a 76.19% increase in capacitance, while gold electrodes achieved a slightly higher increase of 78.46%.
While the difference in sensitivity between copper and gold was minimal, the cost disparity between the two materials was significant. Copper was selected for our biosensor, aligning with our goal of developing an affordable device for practical healthcare applications.
Optimization of Electrode Geometry:
To maximize the sensitivity of our biosensor to magnetic nanoparticles (MNPs) and, consequently, the biomarkers they bind, we systematically investigated the impact of electrode geometry on capacitive sensing performance. Our analysis focused on two key parameters: electrode height (H) and microchannel width (W), with the aim of optimizing the capacitance, which is directly proportional to the electrode area (A = H × L, where L is the electrode length).
Figure 8(b) demonstrates a clear positive correlation between electrode height (H) and the sensor’s response. This is consistent with the fundamental principle of capacitance, where a larger electrode area (resulting from increased height) leads to a higher capacitance. This increased capacitance translates to greater sensitivity in detecting changes induced by the presence of MNPs within the detection zone.
Conversely, Figure 8(c) illustrates a negative correlation between microchannel width ( W ch ) and capacitive sensitivity. This observation can be attributed to the influence of the inter-electrode gap (d). A wider microchannel increases d, which, in turn, reduces the overall capacitance and diminishes the sensor’s ability to detect subtle changes in response to MNPs. This inverse relationship underscores the importance of carefully selecting microchannel width to balance sensitivity with other design considerations, such as efficient MNP capture.
To achieve an optimal balance between sensitivity and practical considerations like microfabrication constraints and efficient MNP capture, we determined an aspect ratio W H of 1 to be ideal (Figure 8(d)). By setting the aspect ratio to 1, we strike a compromise that allows us to design electrodes with high sensitivity while maintaining practical feasibility for microfabrication processes and ensuring efficient MNP capture.
Based on these optimization results, we finalized the electrode dimensions to be 50 µm × 50 µm, with a detection zone length of 500 µm. This configuration ensures adequate coverage of the detection zone, allowing for optimal interaction between the magnetic field generated by the upper coil and the MNPs within the microchannel. The chosen length of 500 µm provides a sufficient electrode area for capturing MNPs and detecting changes in capacitance due to their presence, enhancing the biosensor’s ability to accurately detect and quantify biomarkers in diverse testing scenarios.
Impact of MNP Properties and Concentration on Capacitive Detection:
The relative permittivity ( ϵ r ) of commercially available magnetic nanoparticles (MNPs), such as Fe3O4 and MnFe2O4, can vary. Therefore, we simulated the biosensor’s performance across a range of ϵ r values (10-40) to understand its impact on sensitivity.
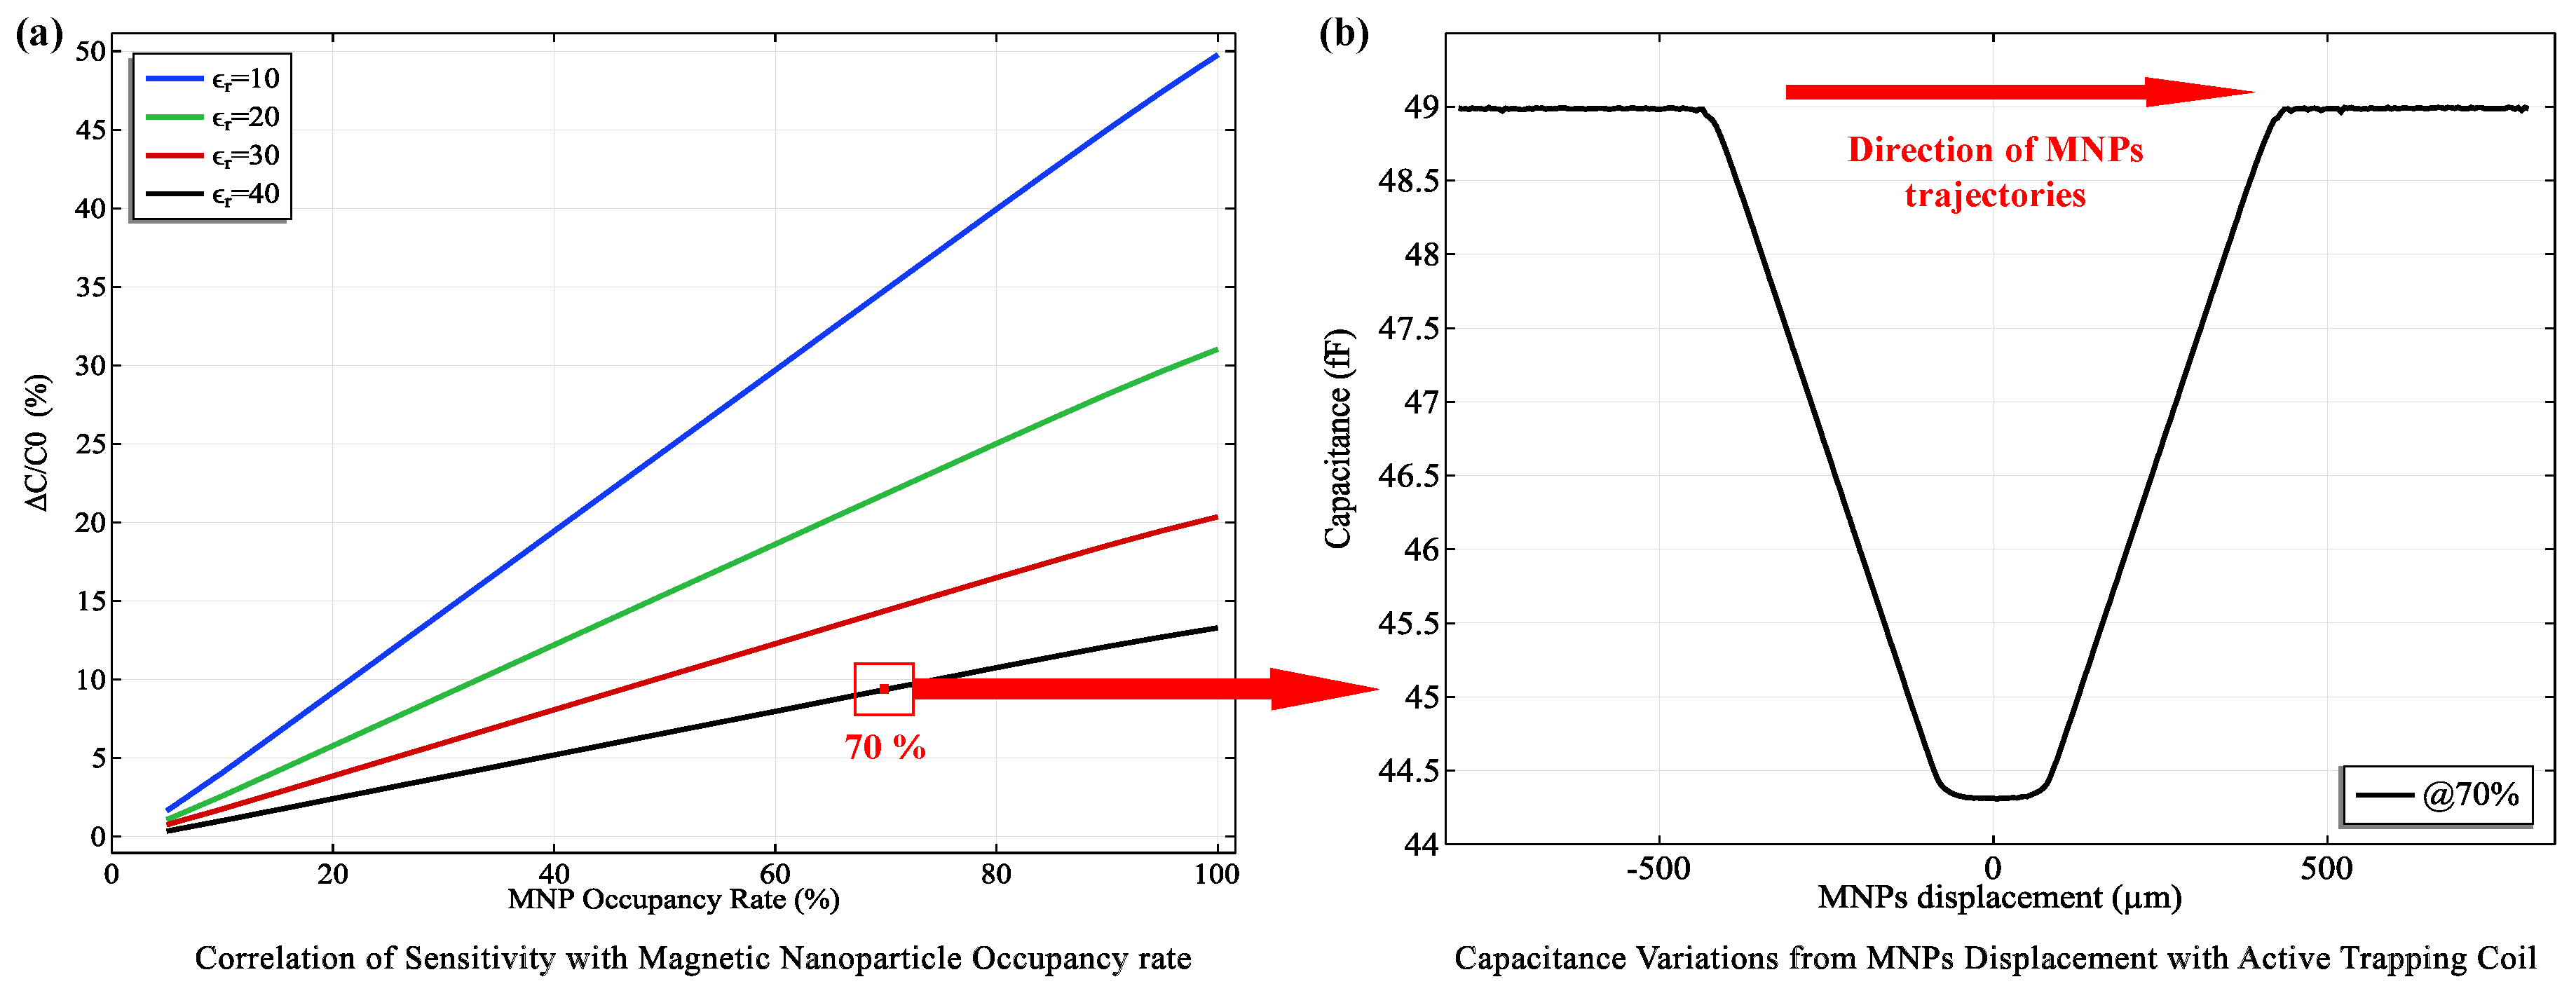
Figure 9(a) shows that sensitivity increased as ϵ r decreased, with a notable enhancement at higher MNP concentrations within the detection zone. This trend aligns with theoretical predictions, indicating that MNPs with lower ϵ r values produce a more substantial change in the effective dielectric constant of the detection zone. This, in turn, results in a greater change in capacitance, which the biosensor can readily detect and quantify. Specifically, we observed a significant increase in sensitivity from 9.01% at ϵ r = 40 to 33.54% at ϵ r = 10 . Moreover, at a constant ϵ r of 10, increasing the MNP concentration within the detection zone from 50% occupancy to 85% occupancy further enhanced the sensitivity from 24.57% to 42.48%. These results, which closely align with theoretical predictions based on Equation 9, underscore the biosensor’s ability to detect and quantify biomarkers across a wide range of MNP concentrations, making it suitable for dynamic biomarker monitoring applications.
To further assess the biosensor’s detection capabilities, we examined the influence of MNP displacement within the detection zone on capacitance (Figure 9(b)). Initially, without MNPs, the capacitance remained stable with an average value of 48 . 98 fF (standard deviation: 0 . 036 fF ). Activating the R500 coil, chosen for its high trapping efficiency and favorable power merit factor ( ( M p ), led to the introduction of MNPs into the detection zone. This resulted in a significant decrease in capacitance, which stabilized at 44 . 37 fF (standard deviation: 0 . 095 fF ). The mean capacitance reduction of 4 . 60 fF provides compelling evidence of the biosensor’s ability to dynamically detect changes in the presence of MNPs. Upon deactivation of the R500 coil, the trapped MNPs were released, and the capacitance returned to its initial stable state, highlighting the biosensor’s reliability and repeatability.
This analysis showcases the successful integration of the R500 microcoil with capacitive sensing, demonstrating high sensitivity for detecting magnetic nanoparticle (MNP)-tagged biomarkers. The biosensor’s ability to dynamically respond to varying MNP concentrations, coupled with its reliable performance, highlights its potential as a versatile tool for a wide range of biomedical applications. The optimized microcoil design facilitates the synergy between magnetic trapping and capacitive detection, enabling precise capture, concentration, and quantification of MNP-tagged biomarkers. This integrated approach opens new avenues for the development of advanced diagnostic tools and personalized healthcare solutions.

4. Conclusion

In this study, we have presented the development and comprehensive 3D multiphysics simulation of a novel microfluidic immunosensor for real-time, non-invasive monitoring of pro-inflammatory biomarkers in human sweat. By integrating magnetofluidic manipulation and direct-field capacitive sensing within a dual-unit design, we achieved significant advancements in both the sensitivity and specificity of biomarker detection.
Our simulations demonstrated that the strategic placement of microcoils optimizes MNP trapping and concentration, leading to a substantial increase in sensitivity of up to 42.48% at an 85% MNP occupancy within the detection zone. The dual-unit architecture enhances the overall performance by minimizing potential interferences, thereby ensuring the accuracy and reliability of the sensor.
This level of performance underscores the potential of our device for the early diagnosis and personalized management of diseases characterized by elevated pro-inflammatory biomarkers. Furthermore, the versatility of the underlying principles extends beyond immediate healthcare applications, opening avenues for adaptation to environmental sensing, bioprocess control, and other fields requiring non-invasive, real-time monitoring of biological markers.
The demonstrated specificity and dynamic operation of our immunosensor, along with its promising simulation results, suggest that this technology could serve as a foundational model for the next generation of wearable diagnostic devices.
Future work will focus on experimental validation of the simulation results and further refinement of the device design to enhance its clinical applicability. Additionally, we will explore the integration of multiple biomarker detection capabilities to expand the diagnostic potential of the immunosensor platform.

Conflicts of Interest

The authors declare no conflict of interest.

References

  1. Organization, W.H. WHO announces COVID-19 outbreak a pandemic, 2020.
  2. Johns Hopkins Coronavirus Resource Center. COVID-19 Map. Johns Hopkins Coronavirus Resource Center, 2024. Accessed: 2024-20-04.
  3. Cho, B.; Lee, S.H.; Song, J.; Bhattacharjee, S.; Feng, J.; Hong, S.; Song, M.; Kim, W.; Lee, J.; Bang, D. Nanophotonic cell lysis and polymerase chain reaction with gravity-driven cell enrichment for rapid detection of pathogens. ACS Nano 2019, 13, 13866–13874.
  4. Tombuloglu, H.; Sabit, H.; Al-Khallaf, H.; Kabanja, J.H.; Alsaeed, M.; Al-Saleh, N.; Al-Suhaimi, E. Multiplex real-time RT-PCR method for the diagnosis of SARS-CoV-2 by targeting viral N, RdRP and human RP genes. Scientific Reports 2022, 12, 1–10.
  5. Prabowo, B.A.; Cabral, P.D.; Freitas, P.; Fernandes, E. The challenges of developing biosensors for clinical assessment: a review. Chemosensors 2021, 9, 299.
  6. Liu, J.; Xu, Y.; Cheng, J. Biochips under COVID-19: a new stage of well-grounded development and accelerated translation. Science Bulletin 2022.
  7. Bontekoe, E.; Brailovsky, Y.; Hoppensteadt, D.; Bontekoe, J.; Siddiqui, F.; Newman, J.; Iqbal, O.; Reed, T.; Fareed, J.; Darki, A. Upregulation of inflammatory cytokines in pulmonary embolism using biochip-array profiling. Clinical and Applied Thrombosis/Hemostasis 2021, 27, 10760296211013107.
  8. Noushin, T.; Tabassum, S. WRRIST: a wearable, rapid, and real-time infection screening tool for dual-mode detection of inflammatory biomarkers in sweat. In Proceedings of the Microfluidics, BioMEMS, and Medical Microsystems XX. SPIE, 2022, Vol. 11955, p. 1195502.
  9. Chen, W.L.; Jayan, M.; Kwon, J.S.; Chuang, H.S. Facile open-well immunofluorescence enhancement with coplanar-electrodes-enabled optoelectrokinetics and magnetic particles. Biosensors and Bioelectronics 2021, 193, 113527.
  10. Mohammadi, M.H.; Mulder, S.; Khashayar, P.; Kalbasi, A.; Azimzadeh, M.; Aref, A.R. Saliva Lab-on-a-chip biosensors: Recent novel ideas and applications in disease detection. Microchemical Journal 2021, 168, 106506.
  11. Chen, M.; Liao, T.; Zeng, L.; Zeng, Z.; Yang, Q.; Wang, G. Plasmonic Gold Chip for Multiplexed Detection of Ovarian Cancer Biomarker in Urine. Chemical Research in Chinese Universities 2022, 38, 935–940.
  12. Wang, C.; Wang, C.; Qiu, J.; Gao, J.; Liu, H.; Zhang, Y.; Han, L. Ultrasensitive, high-throughput, and rapid simultaneous detection of SARS-CoV-2 antigens and IgG/IgM antibodies within 10 min through an immunoassay biochip. Microchimica Acta 2021, 188, 1–15.
  13. Li, J.; Li, Z.; Dou, Y.; Su, J.; Shi, J.; Zhou, Y.; Wang, L.; Song, S.; Fan, C. A nano-integrated microfluidic biochip for enzyme-based point-of-care detection of creatinine. Chemical Communications 2021, 57, 4726–4729.
  14. Burdó-Masferrer, M.; Díaz-González, M.; Sanchis, A.; Calleja, Á.; Marco, M.P.; Fernández-Sánchez, C.; Baldi, A. Compact Microfluidic Platform with LED Light-Actuated Valves for Enzyme-Linked Immunosorbent Assay Automation. Biosensors 2022, 12, 280.
  15. Xie, X.; Gong, M.; Zhang, Z.; Dou, X.; Zhou, W.; Li, J.; Zhu, M.; Du, Y.; Xu, X. Optimization of an electrical impedance flow cytometry system and analysis of submicron particles and bacteria. Sensors and Actuators B: Chemical 2022, 360, 131432.
  16. Haghayegh, F.; Salahandish, R.; Zare, A.; Khalghollah, M.; Sanati-Nezhad, A. Immuno-biosensor on a chip: a self-powered microfluidic-based electrochemical biosensing platform for point-of-care quantification of proteins. Lab on a Chip 2022, 22, 108–120.
  17. Chiu, W.H.; Kong, W.Y.; Chueh, Y.H.; Wen, J.W.; Tsai, C.M.; Hong, C.; Chen, P.Y.; Ko, C.H. Using an ultra-compact optical system to improve lateral flow immunoassay results quantitatively. Heliyon 2022, p. e12116.
  18. Narita, F.; Wang, Z.; Kurita, H.; Li, Z.; Shi, Y.; Jia, Y.; Soutis, C. A review of piezoelectric and magnetostrictive biosensor materials for detection of COVID-19 and other viruses. Advanced Materials 2021, 33, 2005448.
  19. Cunha, A.P.; Henriques, R.; Cardoso, S.; Freitas, P.P.; Carvalho, C.M. Rapid and multiplex detection of nosocomial pathogens on a phage-based magnetoresistive lab-on-chip platform. Biotechnology and Bioengineering 2021, 118, 3164–3174.
  20. Giouroudi, I.; Kokkinis, G. Recent advances in magnetic microfluidic biosensors. Nanomaterials 2017, 7, 171.
  21. Uddin, S.M.; Sayad, A.; Chan, J.; Skafidas, E.; Kwan, P. Design and Optimisation of Elliptical-Shaped Planar Hall Sensor for Biomedical Applications. Biosensors 2022, 12, 108.
  22. Salvador, M.; Marqués-Fernández, J.L.; Bunge, A.; Martínez-García, J.C.; Turcu, R.; Peddis, D.; García-Suárez, M.d.M.; Cima-Cabal, M.D.; Rivas, M. Magnetic Nanoclusters Increase the Sensitivity of Lateral Flow Immunoassays for Protein Detection: Application to Pneumolysin as a Biomarker for Streptococcus pneumoniae. Nanomaterials 2022, 12, 2044.
  23. Sun, X.c.; Lei, C.; Guo, L.; Zhou, Y. Sandwich immunoassay for the prostate specific antigen using a micro-fluxgate and magnetic bead labels. Microchimica Acta 2016, 183, 2385–2393.
  24. Chugh, V.K.; Wu, K.; Nair, A.; di Girolamo, A.; Schealler, J.; Vuong, H.; Davies, W.; Wall, A.; Whitely, E.; Saha, R.; et al. Magnetic Particle Spectroscopy-Based Handheld Device for Wash-Free, Easy-to-Use, and Solution-Phase Immunoassay Applications. In Proceedings of the Frontiers in Biomedical Devices. American Society of Mechanical Engineers, 2020, Vol. 83549, p. V001T10A011.
  25. Gao, Y.; Huo, W.; Zhang, L.; Lian, J.; Tao, W.; Song, C.; Tang, J.; Shi, S.; Gao, Y. Multiplex measurement of twelve tumor markers using a GMR multi-biomarker immunoassay biosensor. Biosensors and Bioelectronics 2019, 123, 204–210.
  26. Couniot, N.; Afzalian, A.; Van Overstraeten-Schlögel, N.; Francis, L.; Flandre, D. Capacitive biosensing of bacterial cells: Analytical model and numerical simulations. Sensors and Actuators B: Chemical 2015, 211, 428–438.
  27. Wang, L.; Veselinovic, M.; Yang, L.; Geiss, B.J.; Dandy, D.S.; Chen, T. A sensitive DNA capacitive biosensor using interdigitated electrodes. Biosensors and Bioelectronics 2017, 87, 646–653.
  28. Weaver, S.; Mohammadi, M.H.; Nakatsuka, N. Aptamer-functionalized capacitive biosensors. Biosensors and Bioelectronics 2023, 224, 115014.
  29. Huang, L.; Zhang, C.; Ye, R.; Yan, B.; Zhou, X.; Xu, W.; Guo, J. Capacitive biosensors for label-free and ultrasensitive detection of biomarkers. Talanta 2023, p. 124951.
  30. Liu, D.; Zhou, L.; Huang, L.; Zuo, Z.; Ho, V.; Jin, L.; Lu, Y.; Chen, X.; Zhao, J.; Qian, D.; et al. Microfluidic integrated capacitive biosensor for C-reactive protein label-free and real-time detection. Analyst 2021, 146, 5380–5388.
  31. Subramani, I.G.; Ayub, R.; Gopinath, S.C.; Perumal, V.; Fathil, M.; Arshad, M.M. Lectin bioreceptor approach in capacitive biosensor for prostate-specific membrane antigen detection in diagnosing prostate cancer. Journal of the Taiwan Institute of Chemical Engineers 2021, 120, 9–16.
  32. Furlani, E.P. Permanent magnet and electromechanical devices: materials, analysis, and applications; Academic Press: New York, 2001.
  33. Bird, R.B.; Curtiss, C.F.; Armstrong, R.C.; Hassager, O. Dynamics of polymeric liquids, volume 2: Kinetic theory; Wiley: New York, 1987.
  34. Jones, T.B. Dielectrophoresis and magnetophoresis. Electromechanics of particles 1995, pp. 34–82.
  35. Kirby, B.J. Micro-and nanoscale fluid mechanics: transport in microfluidic devices; Cambridge University Press: New York, 2010.
  36. Mark, J.E. Polymer data handbook; Oxford University Press, 2009.
  37. Ammar, M.; Smadja, C.; Phuong Ly, G.T.; Tandjigora, D.; Vigneron, J.; Etcheberry, A.; Taverna, M.; Dufour-Gergam, E. Chemical engineering of self-assembled Alzheimer’s peptide on a silanized silicon surface. Langmuir 2014, 30, 5863–5872.
  38. Lefebvre, O.; Cao, H.H.; Cortés Francisco, M.; Woytasik, M.; Dufour-Gergam, E.; Ammar, M.; Martincic, E. Reusable embedded microcoils for magnetic nano-beads trapping in microfluidics: magnetic simulation and experiments. Micromachines 2020, 11, 257.
  39. Lefebvre, O.; Smadja, C.; Martincic, E.; Woytasik, M.; Ammar, M. Integration of microcoils for on-chip immunosensors based on magnetic nanoparticles capture. Sensing and Bio-Sensing Research 2017, 13, 115–121.
  40. Cao, H.H. The fabrication process of microfluidic devices integrating microcoils for trapping magnetic nano particles for biological applications. Theses, Université Paris Sud - Paris XI, 2015.
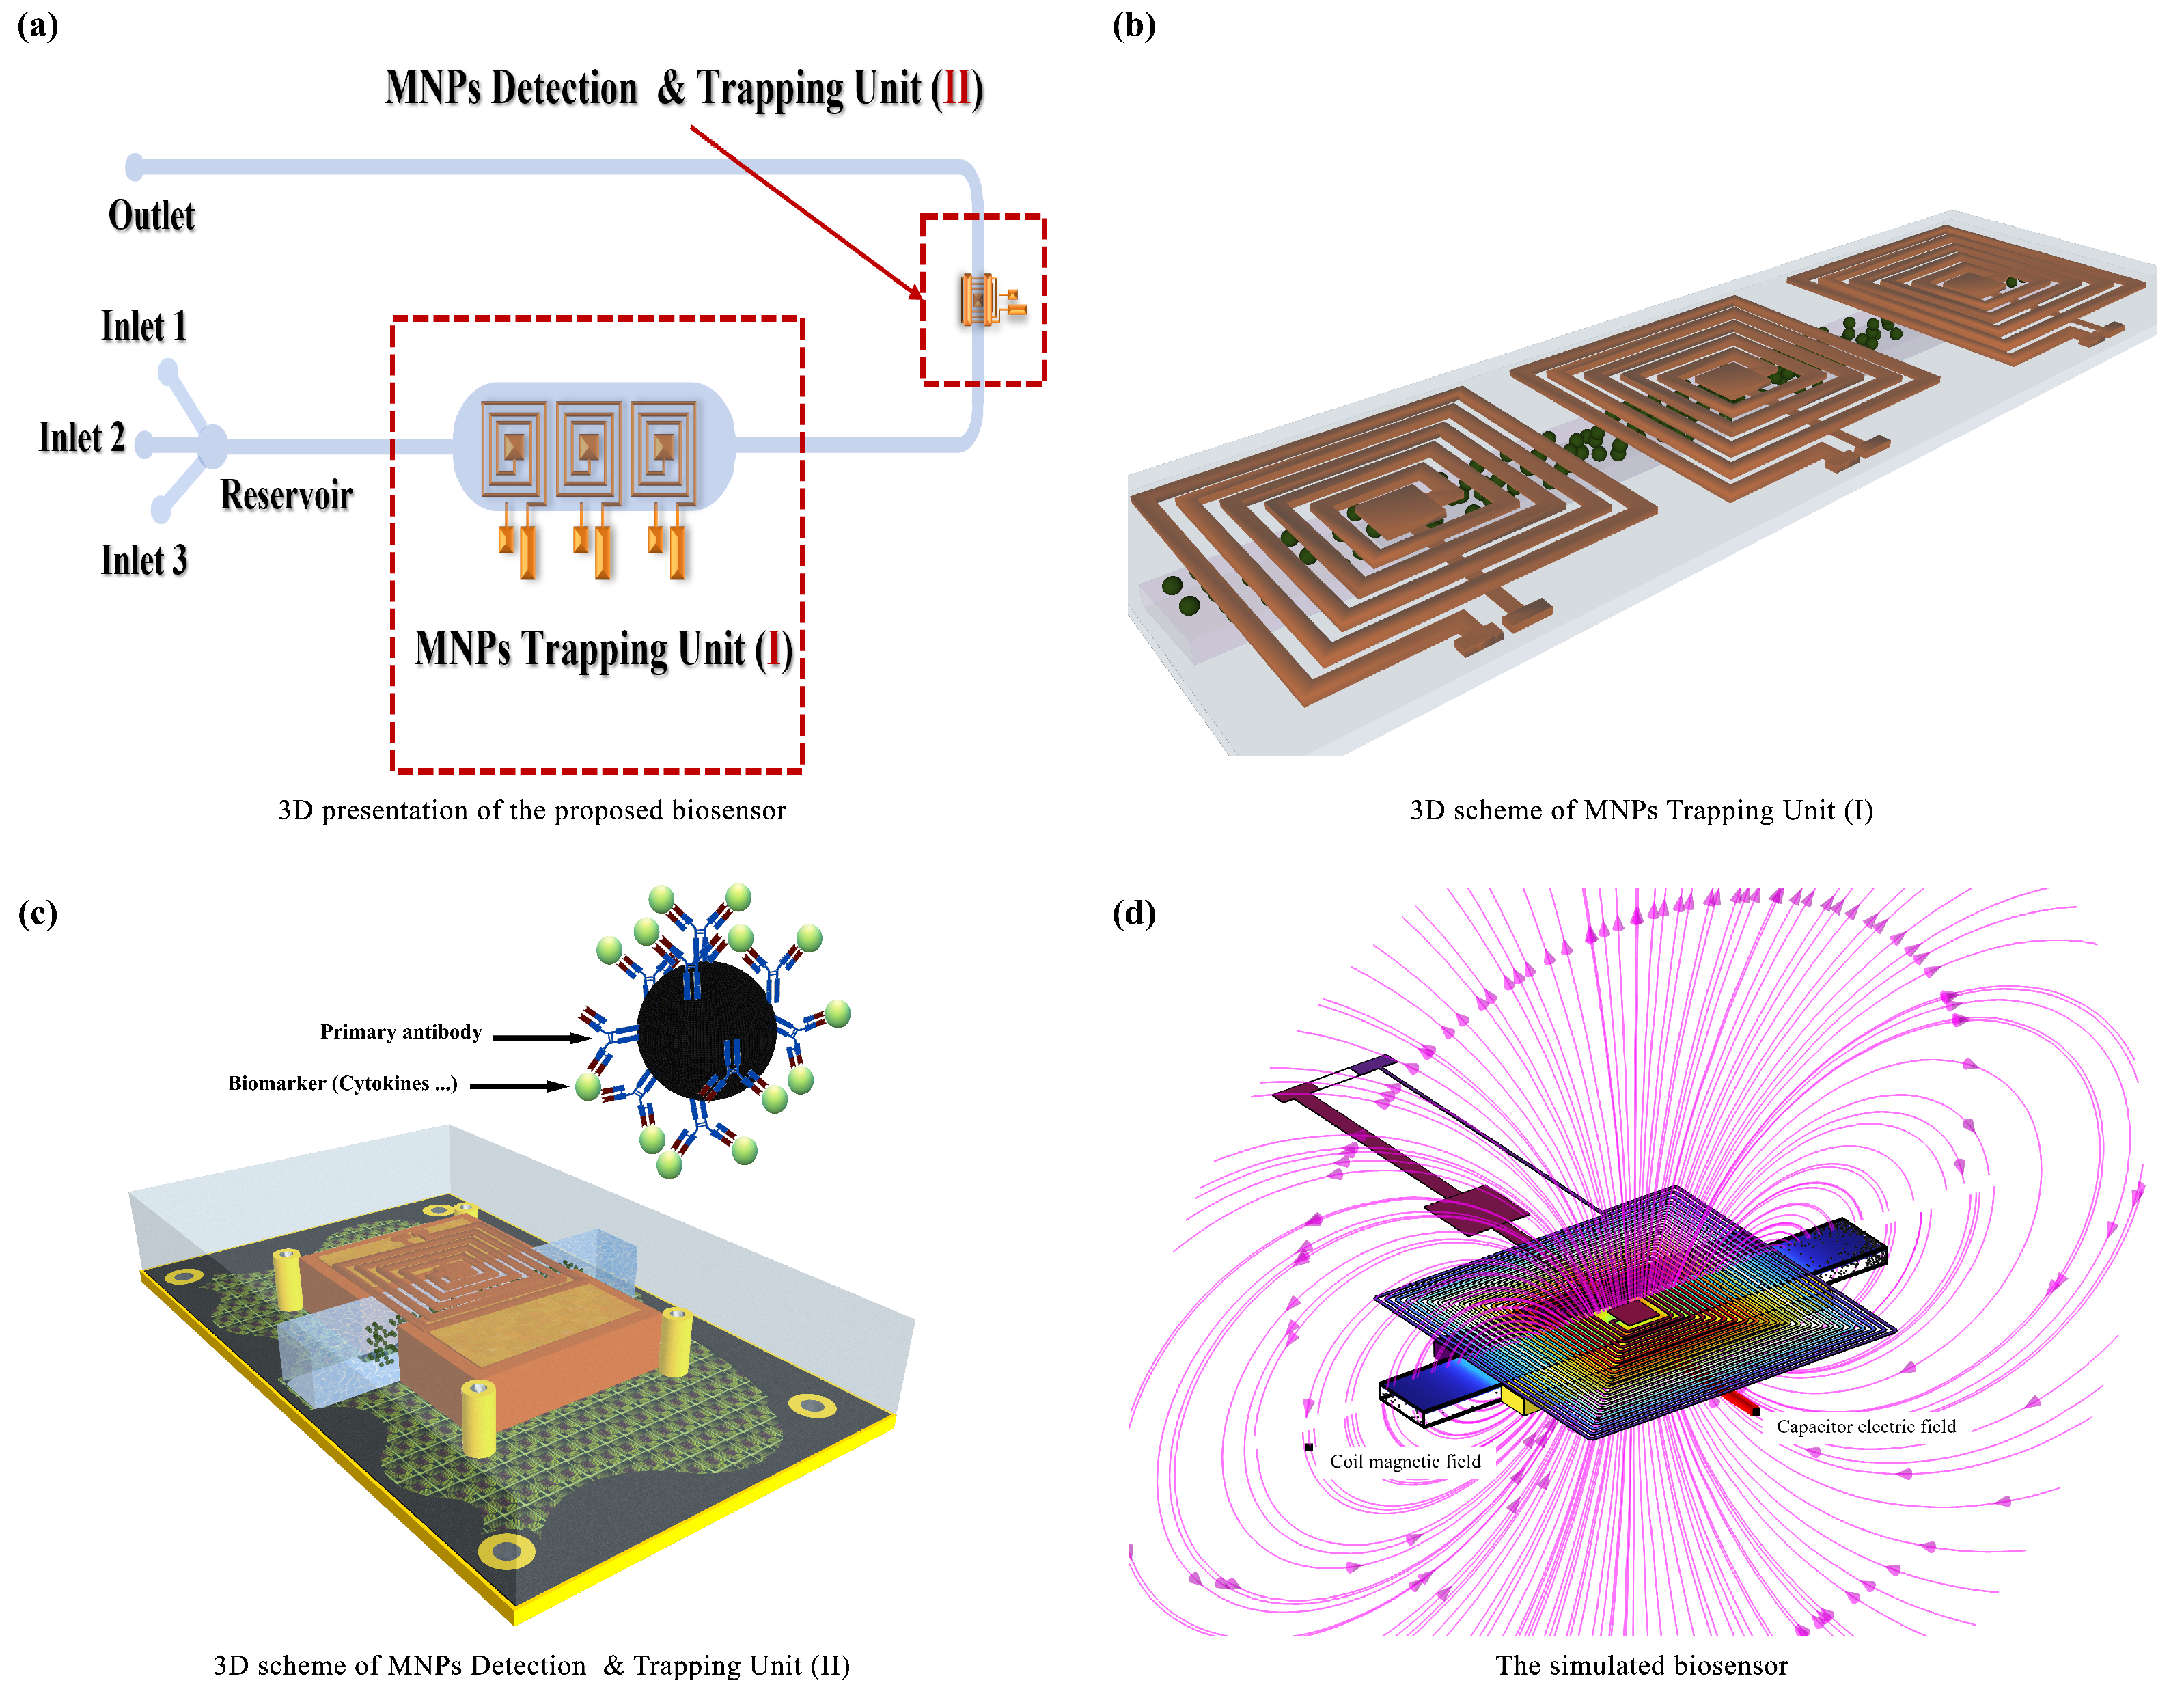
Figure 1. Key components of the proposed microfluidic immunosensor. (a) Overview of the sensor design, showcasing the primary and secondary units. (b) 3D layout of the MNPs Trapping Unit (I), featuring a serial coil configuration. (c) 3D schematic of the MNPs Detection and Trapping Unit (II), detailing the use of functionalized MNPs. (d) COMSOL Multiphysics-generated 3D model demonstrating the operational dynamics of the biosensor.
Preprints 111347 g001
Figure 2. Simulation model of a patch-like sensor. (a) 2D architecture illustrating simulation domains. (b) Detailed coil model used for magnetic field calculations, indicating specific positions utilized in simulations. (c) Coil parameters at cross section A-A, detailing copper wire width (w), spacing (s), inner radius ( R int ), and outer radius ( R ext ). (d) Cross-sectional view that highlights key simulation parameters and the capacitive detection system.
Preprints 111347 g002
Figure 3. Magnetic flux density profiles across paths and coils. (a) Magnetic field profile along R 0 for four coils, emphasizing the central field strength. (b) Field characteristics internal to the coils along R int . (c) Peripheral field behavior along R ext , illustrating field distribution at the coil edges. (d) Magnetic flux density (B)-profile for the R 500 coil, and (e) for the R 2000 coil, measured across seven distinct z-paths. (f) Combined profiles at Z = 30 μ m , determining the optimal Z-position for maximizing flux density while minimizing field ripple.
Preprints 111347 g003
Figure 4. Magnetic flux density maps across different planes and coils. (a) Magnetic flux density in the x z -plane for the R 500 coil, illustrating field distribution. (b) x z -plane map for the R 2000 coil, showing detailed B-field gradients. (c) Magnetic flux density in the x y -plane for the R 500 coil, depicting field uniformity. (d) x y -plane map for the R 2000 coil, highlighting enhanced magnetic density concentration at both corners and the center.
Preprints 111347 g004
Figure 5. Analysis of Power Merit Factors and Magnetic Flux Density based on Injected Current. (a) Power merit Factor comparison for four coils at 400 mA, highlighting performance differences. (b) Power merit Factor evaluation for the R 2000 coil across various current values to assess efficiency. (c) Magnetic flux density profiles for the R 500 coil at different current levels. (d) Magnetic flux density profiles for the R 2000 coil at various currents, correlated with the power merit factors discussed above.
Preprints 111347 g005
Figure 6. Impact of Microchannel Configurations on Fluid Dynamics and MNPs Trapping. (a) Asymmetric magnetic field within the microchannel and its influence on MNPs trapping. (b) Optimization of alignment for enhanced homogeneous MNPs trapping, achieving near-symmetric fields. (c) Spatial distribution of trapped MNPs along the Y-axis within the microchannel, captured at three distinct time points. (d) Fluid velocity profile across the channel height; inset shows MNPs positions at t = 0 . 1 s alongside the drag force expression, illustrating particle deceleration. (e) Fluid velocity map in the Y Z -plane. (f) Fluid velocity map in the X Z -plane, highlighting regions of highest velocity.
Preprints 111347 g006
Figure 7. Analysis of Magnetic Trapping Efficiency Under Varied Conditions. (a) Comparative efficiency across four different coils, highlighting performance disparities. (b) Variation in magnetic trapping efficiency of the R 2000 coil across different microchannel widths, measured at 60 seconds. (c) Efficiency trends at varying distances between the microchannel and the R 2000 coil, observed at 60 seconds. (d) Dependency of magnetic trapping efficiency on the diameter of magnetic nanoparticles using the R 2000 coil, assessed at 60 seconds.
Preprints 111347 g007
Figure 8. Comprehensive Analysis of the Capacitive Detection System. (a) Variation of capacitance as a function of dielectric constant for electrodes made from gold and copper, illustrating the electrostatic responsiveness of each material. (b) Sensitivity analysis of electrode height, showing how capacitance changes with increasing electrode dimensions. (c) Impact of electrode width on capacitance, demonstrating the inverse relationship between electrode width and capacitive sensitivity. (d) Analysis of the effect of aspect ratio ( W H ) on system performance to identify optimal electrode dimensions for enhanced detection efficiency.
Preprints 111347 g008
Figure 9. Capacitive Sensing Performance of the Novel Biosensor. (a) Graph illustrating the sensitivity of the biosensor as a function of magnetic nanoparticle (MNP) occupancy within the detection zone after trapping. (b) Capacitance response curve showing changes as MNPs are displaced within the detection zone, highlighting the biosensor’s dynamic response to variations in MNP concentration.
Preprints 111347 g009
Table 1. Key Design Parameters for COMSOL Simulations
Parameter Description Symbol Value Range
Current in the coil I coil 100 mA – 700 mA
Electrode height H 20 μ m – 500 μ m
Nanoparticle diameter D np 10 nm – 60 nm
Coil-to-channel separation K coil 5 μ m – 100 μ m
Microchannel width W ch 50 μ m – 1000 μ m
Microchannel height H ch 50 μ m
Electrodes Voltage U 5V
coil wire height H wire 10 μ m
coil wire width W wire 10 μ m
Fluid flow rate Q 1 μ l/min
Table 2. Key Material Constants for COMSOL Simulations
Material Property Symbol Value
Copper Electrical conductivity σ C u 59.6 MS/m (1)
Gold Electrical conductivity σ A u 41 MS/m (1)
Density of sweat ρ f l u i d 1000 kg/m3 (2)
Dynamic viscosity of sweat η f l u i d 10 3 P a · s (3)
PDMS Electrical conductivity σ P D M S 1.7 × 10 12 S / m (4)
PDMS Relative permittivity ϵ r , P D M S 2.7 (4)
Permeability of magnetite nanoparticles μ r , N P 5000 (5)
Dielectric constant of MNPs ϵ r , medium 10 - 40 (6)
1A table of electrical conductivity of common materials. Available at: https://www.thoughtco.com/table-of-electrical-resistivity-conductivity-608499.
2Mark, J.E.: Polymer Data Handbook. Oxford University Press, 2009.
3Robinson, S., Robinson, A.H.: Chemical composition of sweat. Physiological Reviews, 1954.
4"PDMS Properties", Massachusetts Institute of Technology, available at: https://www.mit.edu/~6.777/matprops/pdms.htm.
5T. N. H. Nguyen et al., "Quantifying the complex permittivity and permeability of superparamagnetic iron-oxide nanoparticles". Available: https://aip.scitation.org/doi/10.1063/1.4917489.
6S. Sahoo et al., "Enhanced Thermal Conductivity and Dielectric Properties of Iron Oxide". Available: https://www.nature.com/articles/s41598-017-03273-z.
Disclaimer/Publisher’s Note: The statements, opinions and data contained in all publications are solely those of the individual author(s) and contributor(s) and not of MDPI and/or the editor(s). MDPI and/or the editor(s) disclaim responsibility for any injury to people or property resulting from any ideas, methods, instructions or products referred to in the content.
Copyright: This open access article is published under a Creative Commons CC BY 4.0 license, which permit the free download, distribution, and reuse, provided that the author and preprint are cited in any reuse.
Prerpints.org logo

Preprints.org is a free preprint server supported by MDPI in Basel, Switzerland.

Subscribe

© 2024 MDPI (Basel, Switzerland) unless otherwise stated