1. Introduction
In mountain-gorge areas, the modern tectonism is intense and the landscapes have been eroded violently by rivers. Influenced by the special seismic geological environment and complex mechanical conditions, the rock mass of the high rock slope has undergone intense supergene transformation and formed a large number of fractured rocks which contain more structure planes and joint cracks. In addition to the external force, the rock mass is more prone to creep. The creep of high rock slopes is a general concept. We need to take into account not only the creep properties of the rock material itself in a narrow sense, but also the influence of external factors on it, such as seismic effects. Although the initial mechanical state of the slope is in equilibrium, the long-term self-weight and external force will make the distribution of stress field and mechanical parameters of the slope change continuously. Starting from the localized high stress level zone of the rock mass, after a long period of creep, the slope gradually develops into instability. When the shear failure occurs, the slope structure is unstable and sliding failure may bring huge impacts and disasters to people's life and property safety. After a period of creep, the slope in the seismic region is easy to undergo large deformation due to seismic action, which will lead to stress redistribution of the rock mass. The slope will undergo creep deformation different from that before the earthquake. The whole process of mechanical response from creep to earthquake and creep after earthquake is very complex. Then there’s great theoretical value and practical research significance to carry out risk research work on such slopes.
At present, the numerical simulation method has proved to be an effective tool to simulate the creep process of high rock slopes. Zhang et al. [
1], Dong et al. [
2], Li et al. [
3], and Zhou et al. [
4] deeply studied the creep characteristics of high rock slopes and developed diverse creep models. Sun et al. [
5], Zhen et al. [
6], Bao et al. [
7], Li et al. [
8], Jiang et al. [
9] and Lei et al. [
10]focused on the creep acceleration stage of rocks of slopes and deeply probe into the nonlinear fluid mechanics. They proposed many nonlinear creep models which can better reflect the damage of rocks of slopes in the accelerated stage of creep. In terms of the effect of external forces on creep development, Bao et al. [
11], Chen et al. [
12], Vallet et al. [
13] and Paul et al. [
14] explored the trend of long-term creep development of slopes considering rainfall conditions. Delchiaro et al. [
15] and Luo et al. [
16] analyzed the process of creep deformation and failure of slopes under the action of river cutting through practical slope cases. Li et al. [
17],Dong et al. [
18] analyzed the process of creep deformation evolution of slopes under excavation by 3D numerical simulation. From the above, most of studies focused on the creation and selection of constitutive models. In terms of external forces, scholars focused on rainfall, river cutting, engineering activities. However, there are few numerical studies on the long-term creep response of high rock slope under earthquake action. This paper will fill this gap.
Currently, domestic and foreign scholars have conducted in-depth and detailed researches on the post-earthquake dynamic response of rock slopes and obtained rich research results. However, traditional studies on the seismic dynamic response of rock slopes only focused on the seismic effects in the horizontal direction and ignored those in the vertical direction [
19,
20]. In fact, results of existing studies show that vertical seismic action has a great influence on the seismic response of rock slopes [
21,
22,
23,
24,
25,
26]. So both horizontal and vertical seismic waves should be considered in the dynamic analysis of rock slopes. General research methods are mainly divided into the following categories: theoretical analysis, physical model test and numerical simulation, etc. [
27,
28,
29,
30]. The numerical simulation method is widely used in the seismic analysis of rock slopes because of its advantages of not being restricted by site, repeatability, and solving the seismic problem of slope efficiently and quickly [
31,
32,
33,
34]. The dynamic time-history analysis method is generally used in numerical simulation [
35]. Most researchers considered the single earthquake when they discussed the law of deformation and failure of rock slopes under earthquakes. Less attention has been paid to the effect of cumulative damage on the dynamic response of slopes under multiple earthquakes, which may lead to a significant decrease in slope stability. A few scholars made a preliminary exploration [
36,
37,
38], which mainly focused on the study of the stability of rock slopes under frequent micro-earthquakes, but lacks the study of the response of rock slopes under multiple earthquakes with different intensities. There are relatively few related studies, which are mainly due to the limitation of shaking table test equipment and methods consuming a lot of time and cost. In this paper, FLAC3D is used to carry out the numerical simulation, which can help us comprehensively and efficiently predict the cumulative damage behaviors of slope rocks under multiple seismic actions.
In conclusion, the present research results can not reflect the dynamic response characteristics of high rock slopes under multiple earthquake actions, nor can they fully consider characteristics of the long-term creep response of high rock slopes under earthquake actions. Therefore, to research characteristics of the long-term creep response of high rock slopes considering the cumulative effect of bidirectional earthquakes, this paper takes a slope in Nujiang River Basin in southwest China as an example. Using FLAC3D finite element software, in the case of multiple actions of earthquakes with different peak accelerations and long-term creep at the same time, the process of experiencing multiple earthquakes during the 100-year creep process is simulated to analyze deformation characteristics and dynamic response laws of the high rock slope. This research could provide references for the prevention and treatment of geological disasters of similar slopes in the Nujiang River Basin of southwest China.
2. Study Area
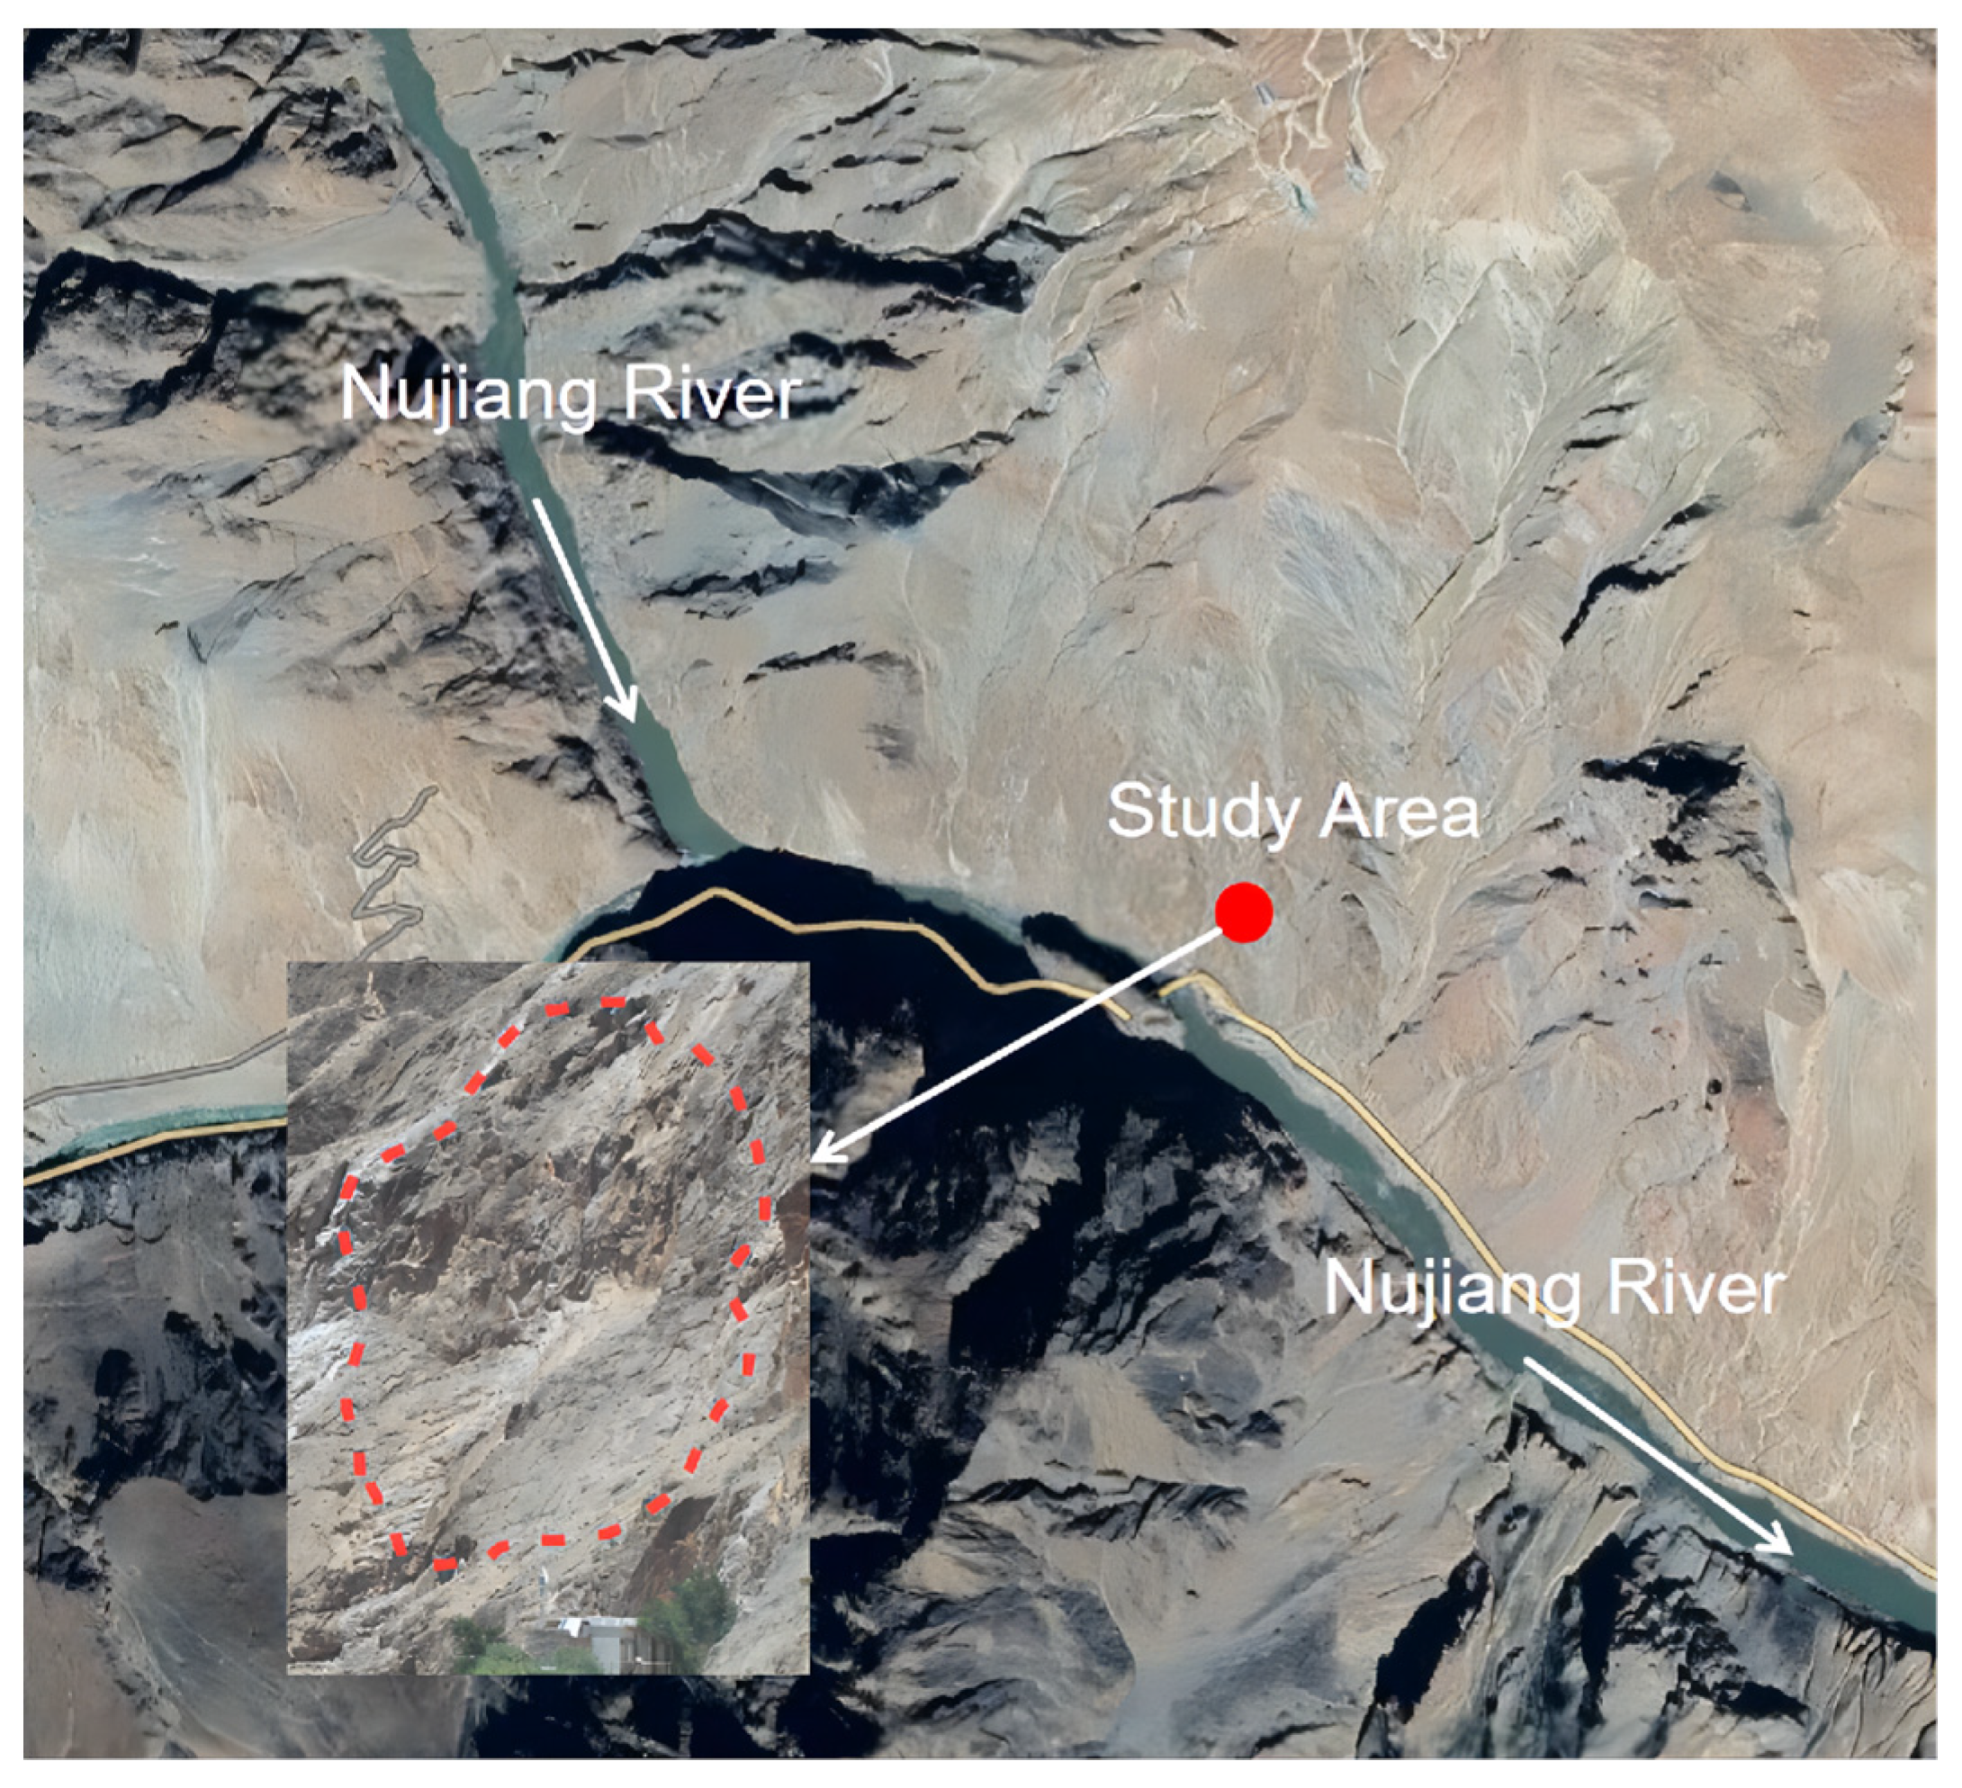
Nujiang River is one of the largest rivers in southwest China, originating from the Qinghai-Tibet Plateau and flowing through Yunnan and the Tibet region. The study area is located upstream of Nujiang River and flows through Baxoi County, Milin County in the Tibet. The slope is only 200 meters away from Nujiang River (
Figure 1). The study area is located in a stretch of river with a deep valley and steep hills on both sides. The geological profile of the slope is shown in
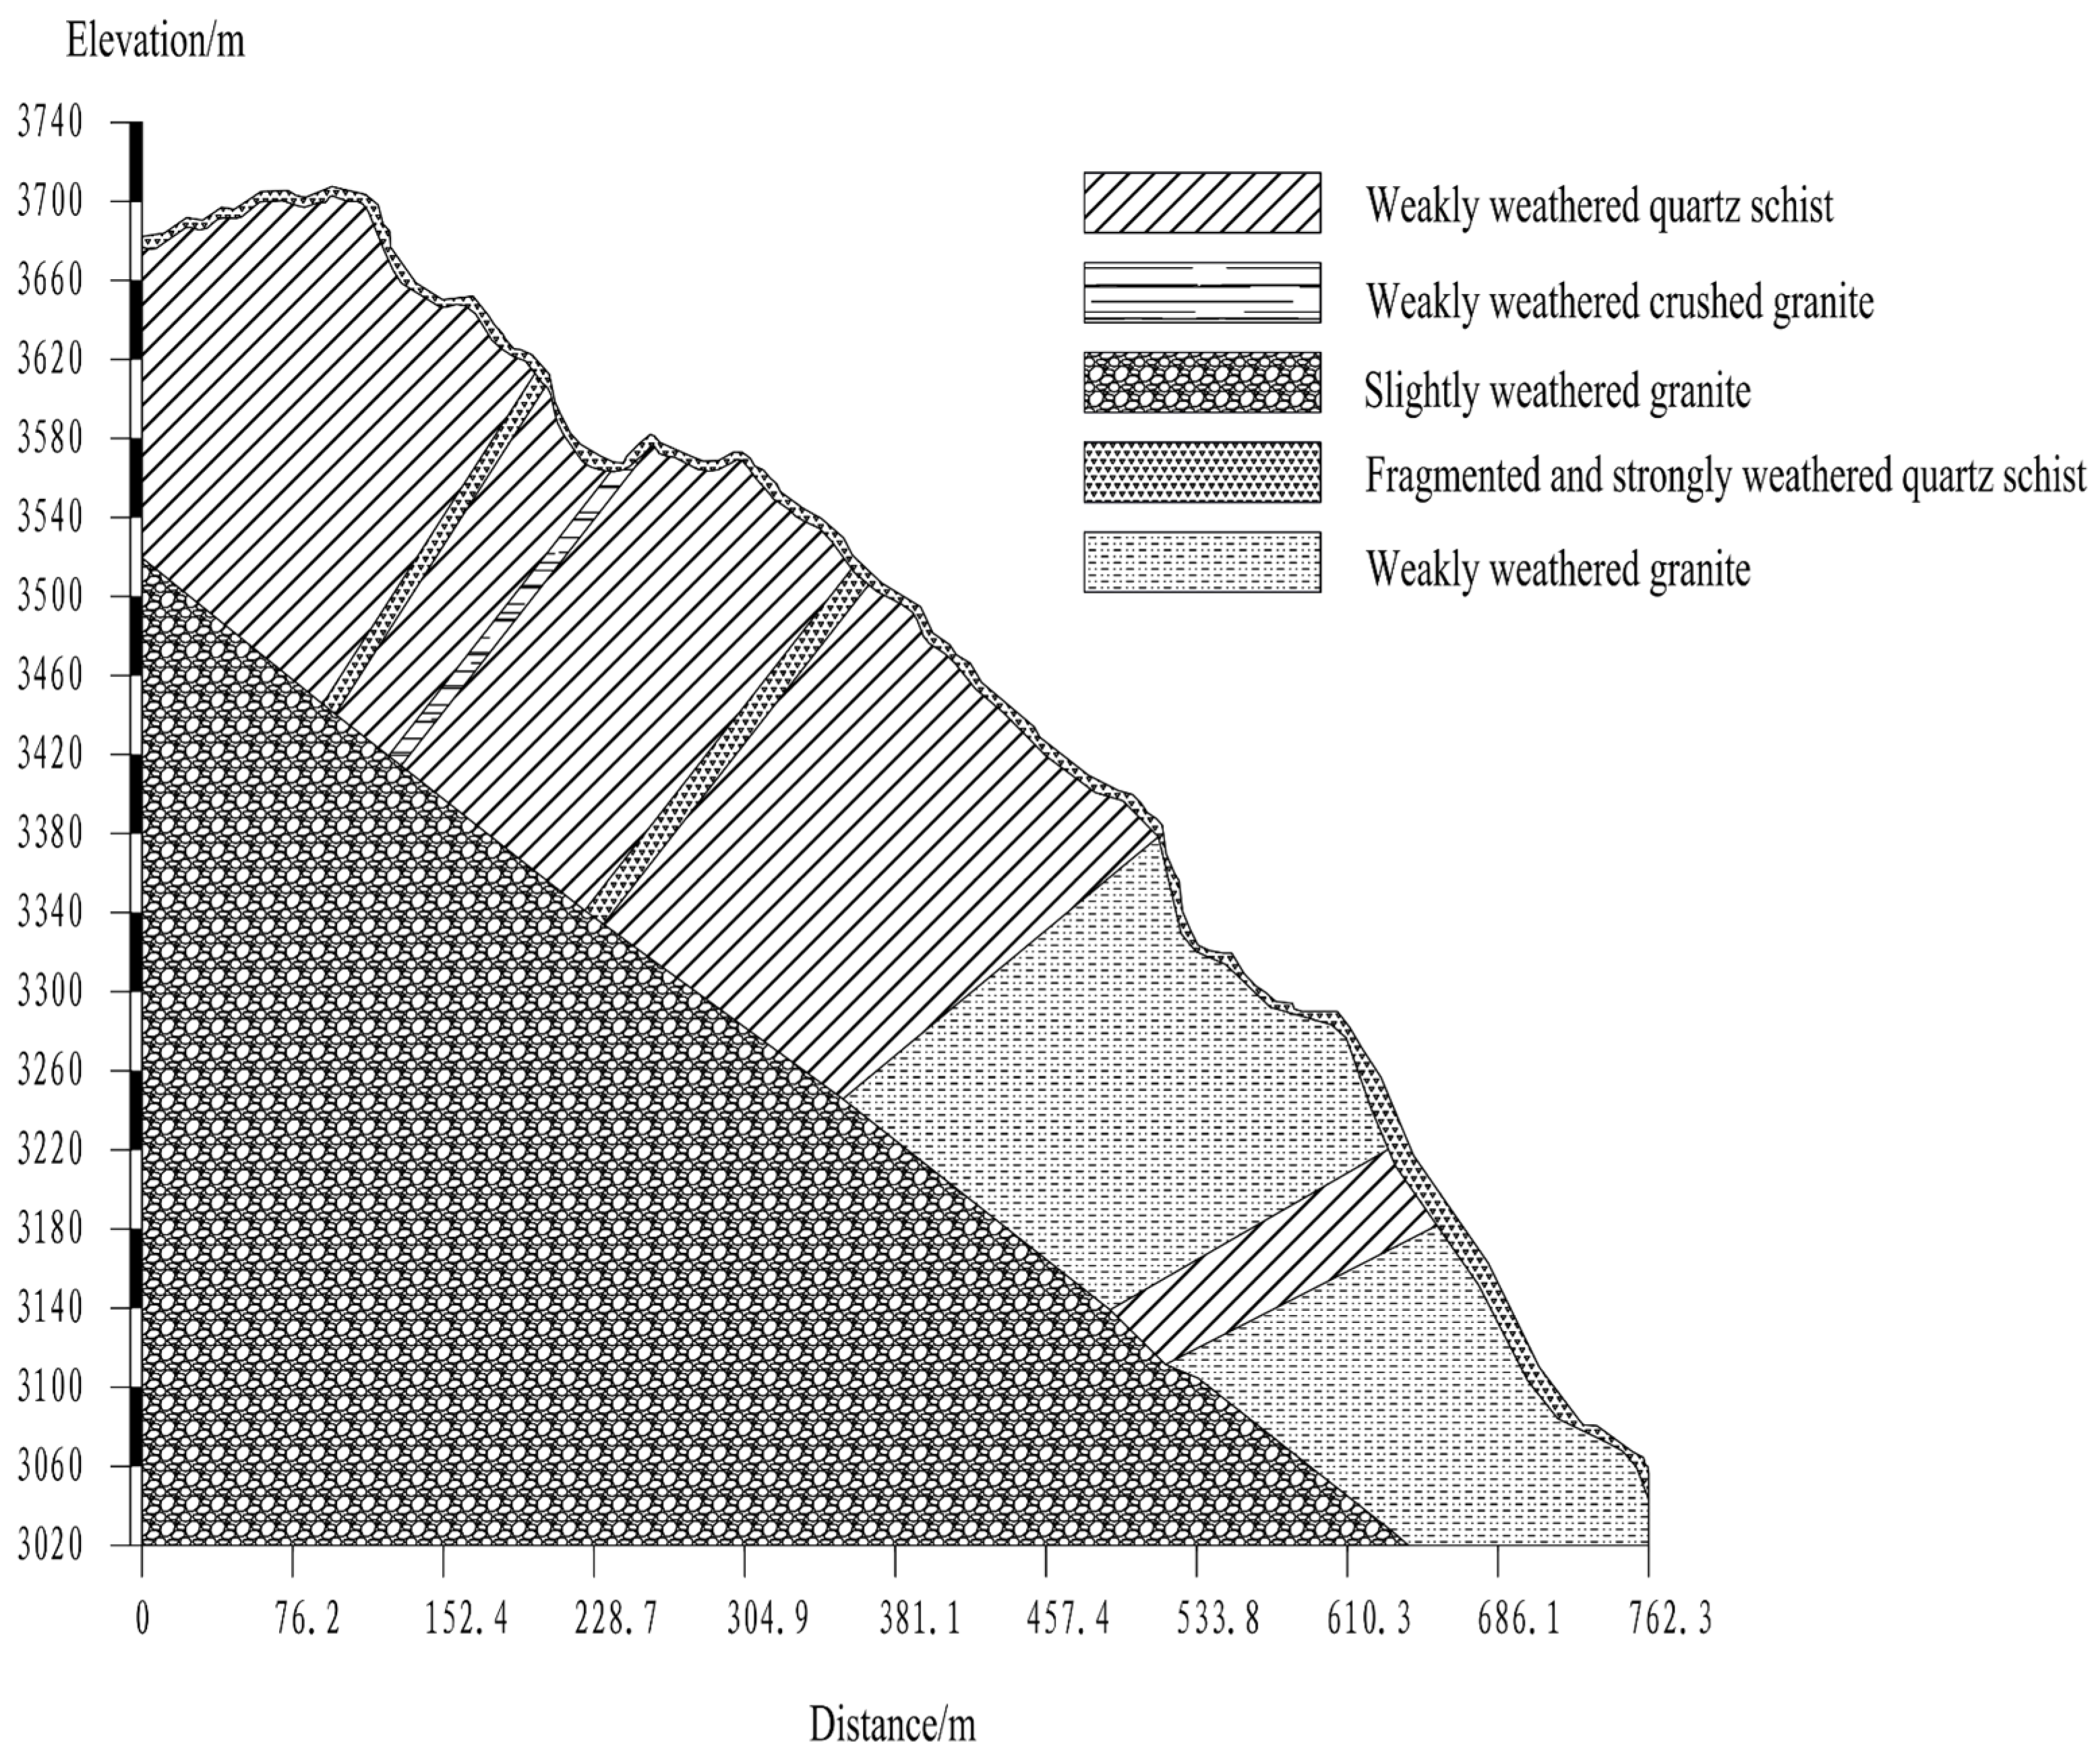
Figure 2. The topography of the slope is narrow and long, sloping gradually from east to west. The slope angle is about 46°. The layer of the rock is inclined at a low angle along the direction of the river. The rock and soil mass of the slope presents a reverse dip structure. The stratigraphy that occurs from top to bottom of the slope is fragmented and strongly weathered quartz schist, weakly weathered quartz schist, weakly weathered crushed granite, weakly weathered granite, and slightly weathered granite. The overlying bedrock is mainly fragmented and strongly weathered quartz schist, which is more seriously affected by weathering, and the fissure surface is rough and mostly gray-yellow. The thickness of the layer is generally about 10m and the rock quality is softer, easily broken by hammering. Its compressive strength is lower than that of other rocks, with a depth of 373m and a dip angle of 52°-67°.
According to the division of seismic zones in Tibet, the study area is related to the central Tibetan seismic zone, the Himalayan seismic zone, and the Xianshui river-Diandong seismic zone in the Qinghai-Tibet seismic zone. For the central Tibetan seismic zone, as of 2020, a total of 510 earthquakes with magnitude (M) greater than 4.75 have occurred in this zone, including 63 earthquakes of magnitude 6-6.9, 7 earthquakes of magnitude 7-7.9, and 2 earthquakes of magnitude greater than 8. For the Himalayan seismic zone, as of 2020, a total of 1,402 earthquakes with magnitude (M) greater than 4.7 have been recorded, including 142 earthquakes of magnitude 6-6.9, 24 earthquakes of magnitude 7-7.9, and 9 earthquakes of magnitude greater than 8. For the Xianshui river-Diandong seismic zone, as of 2020, a total of 763 earthquakes of magnitude greater than 4.7 have been recorded, including 109 earthquakes of magnitude 6-6.9, 32 earthquakes of magnitude 7-7.9, and one earthquake of magnitude greater than 8. These three fault zones have been active since 1930, so the seismicity of the region in the next 100 years is considered at a relatively active level with the possibility of breeding and generating strong earthquakes.
Based on this geological background, the region has strong neotectonic movement and relatively fragile geological conditions. The seismic activity has become one of the important influences affecting the long-term creep of slopes in the upper part of Nujiang River Basin.
3. Computational Model and Method
3.1. Computational Model
In this paper, the explicit finite difference software FLAC3D is used for the numerical simulation, which can efficiently and accurately simulate the static or dynamic response in geotechnical engineering. Due to the large workload of calculating the actual slope model, this paper adopts the generalized model for the study. According to the results of geological investigation, the real slope morphology of the slope is simulated by contour data, and then the geological profile (
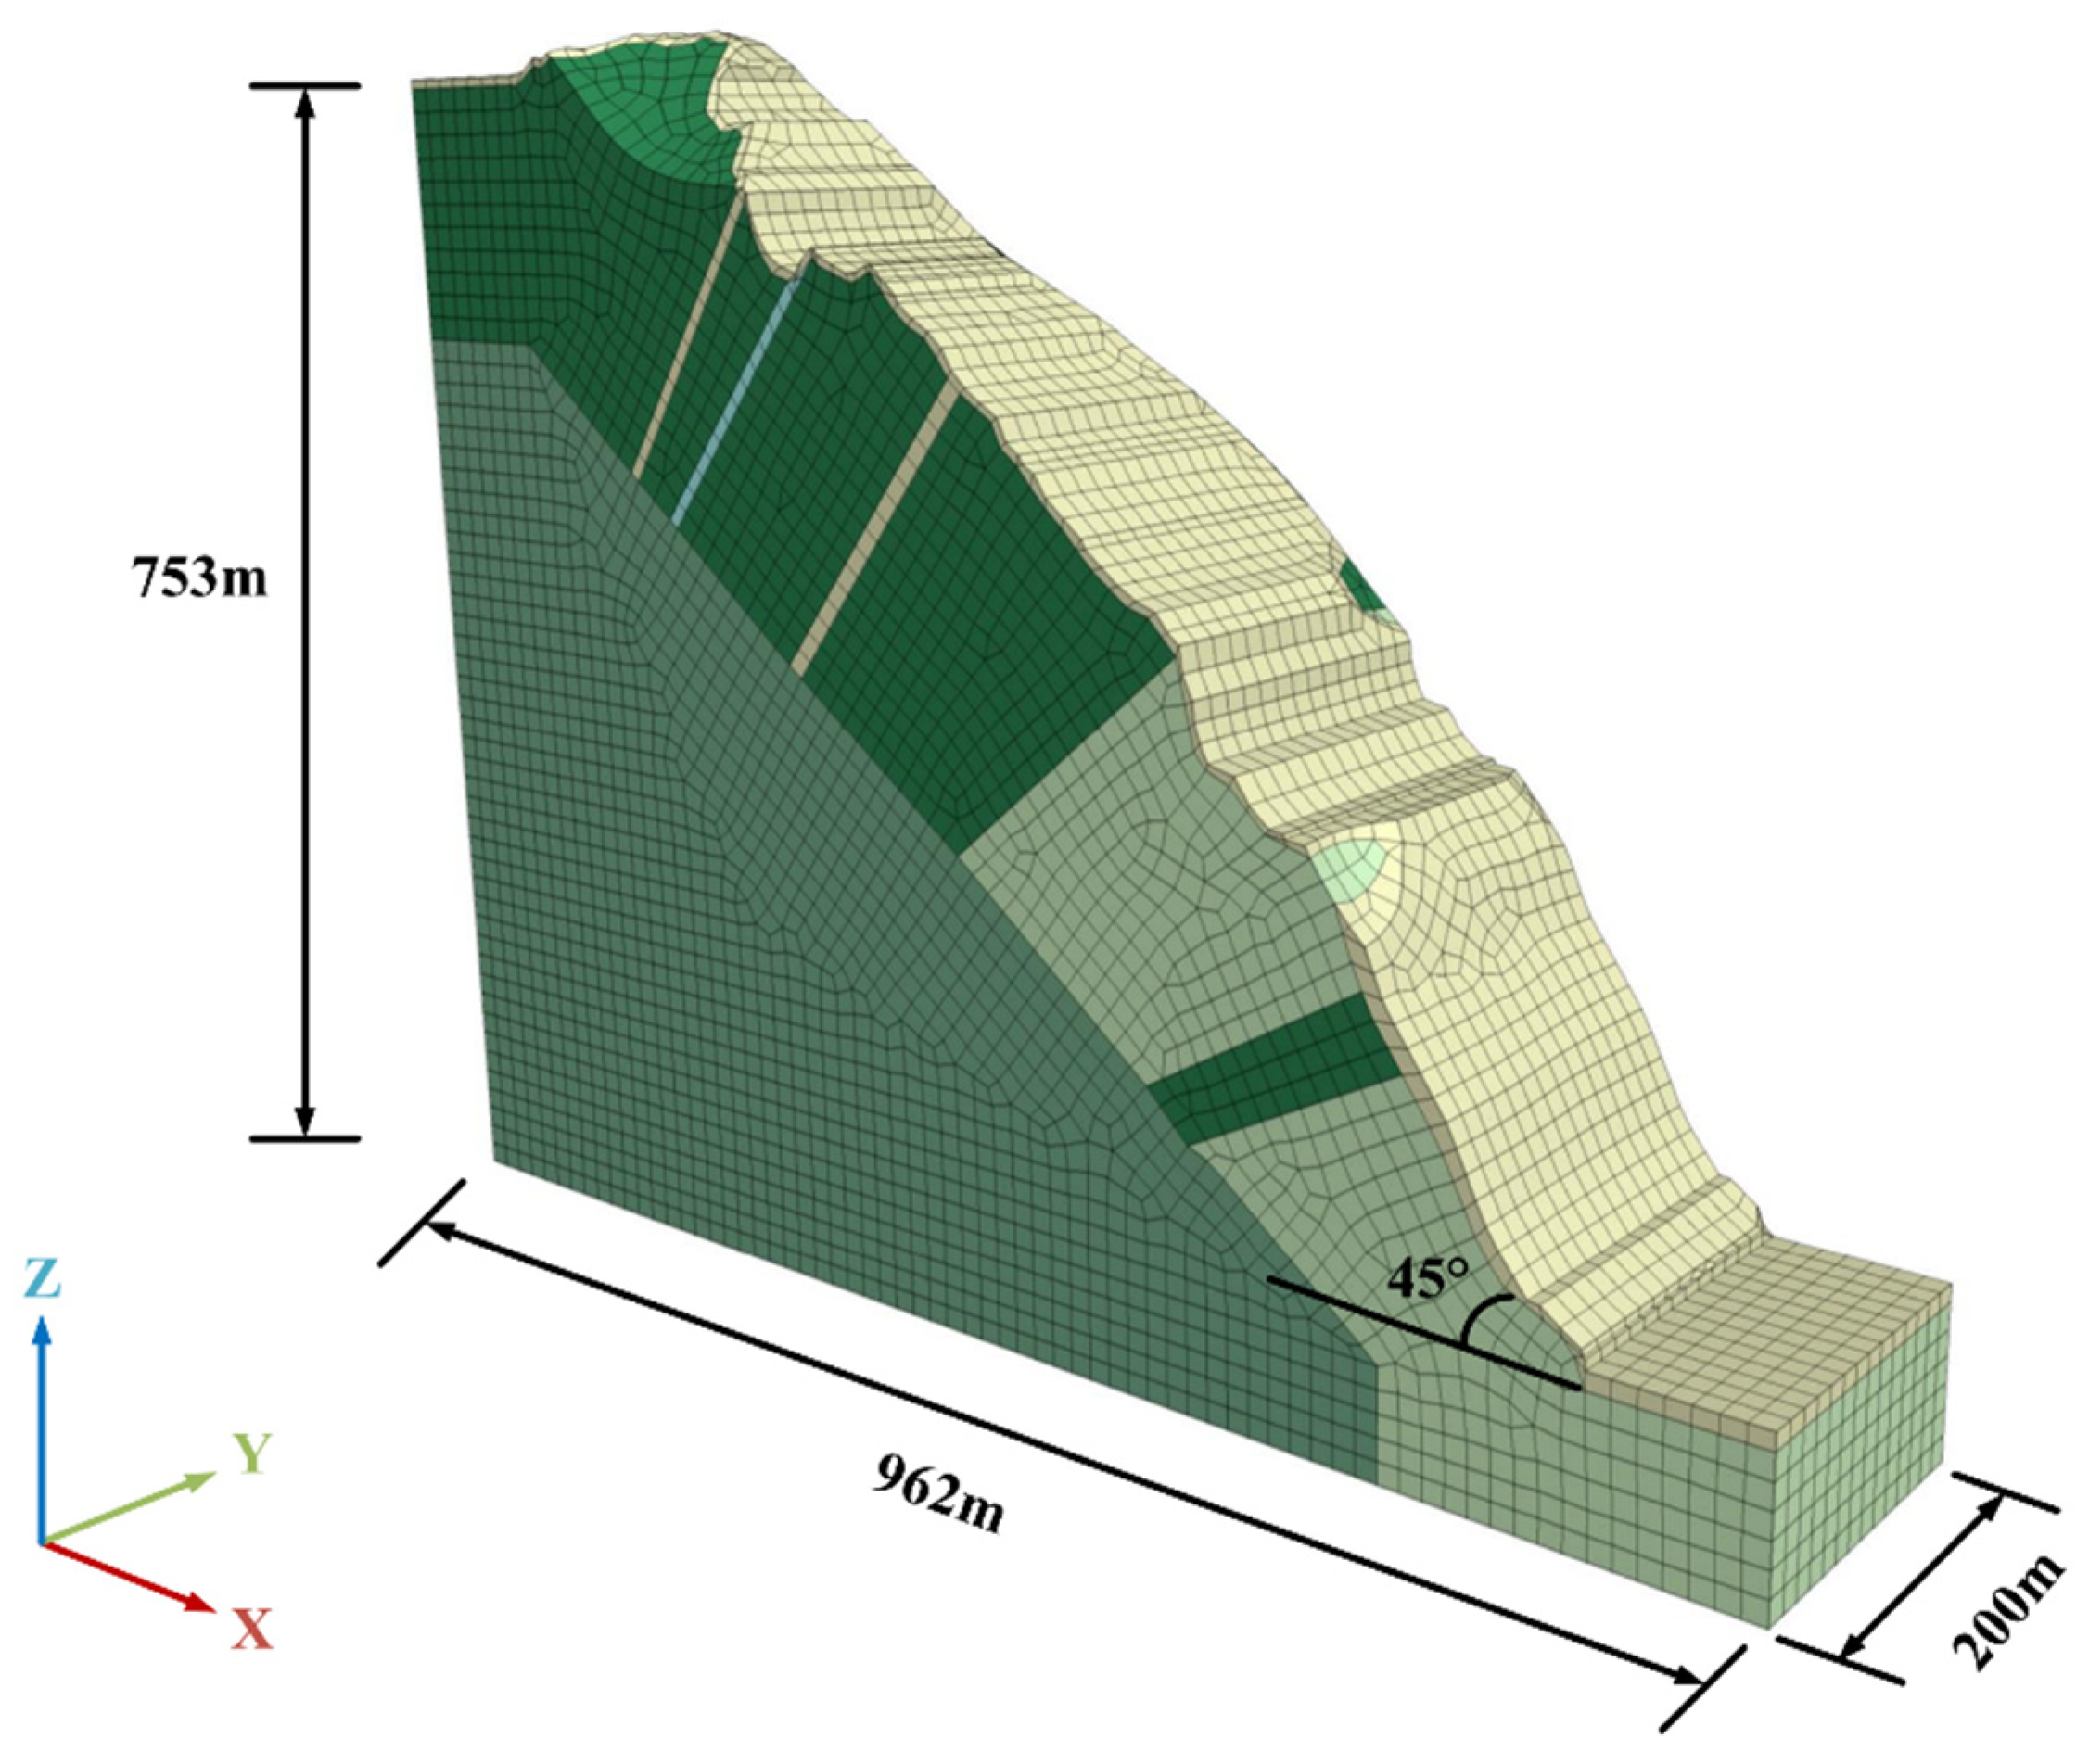
Figure 2) is divided into five strata as a prototype. Among them, fragmented and strongly weathered quartz schist is a soft rock, which is formed in the tectonic fragmentation zone, and the thickness of the rock layer is 10m. Other rocks are harder and have larger rock parameters. Dimensions and meshes of the simple model of the slope are shown in
Figure 3. The length of the model is about 962m (X-axis direction), the height is about 753m (Z-axis direction), the width is about 200m (Y-axis direction), and the slope is about 46°. In order to facilitate the division of units, the three-dimensional model uses all hexahedral units, and the slope model has a total of 41,743 units and 39,583 nodes.
The mesh size has an impact on the accuracy of the dynamic computational analysis [
33]. Lysmer pointed out [
39] that in order to more accurately characterize the propagation of seismic waves in the numerical model, the model cell size needs to satisfy the following equations (Equation (1)):
Where:
—Maximum size of model unit;
—The wavelength corresponding to the highest frequency in the seismic wave.
Calculated from the above equation (Equation (1)), the wavelength corresponding to the highest frequency in the seismic wave is 127.75m. The maximum grid size of the model unit is 12.775~15.969m. Considering the balance between computational accuracy and time consumption, the maximum grid size of the model unit is set to 14m.
3.2. Parameter and Constitutive Model
In order to simulate the deformation of the slope realistically, according to the results of field investigations and indoor tests, physical and mechanical parameters of rocks and mechanical parameters of creep are shown in
Table 1 and
Table 2, respectively.
In the numerical model, the rocks can be divided into two categories. One is the hard rock without considering creep calculation, and the other is the soft rock considering creep calculation. The soft rock has low compressive strength, obvious rheological properties, and large creep deformation, which often causes slope instability and damage. It generally has transient elasticity, transient plasticity, viscoelasticity and viscoelasticity. Burgers-Mohr model built in FLAC3D can comprehensively describe the viscoelastic-plastic properties of the medium, and can describe the whole process of the rock creep curve, including the attenuation creep, the uniform creep stage and the accelerated creep stage. Several scholars have proved through researches that the Burgers-Mohr model can well describe the creep properties of soft rocks [
40,
41,
42]. According to the above analysis, in the creep calculation, the fragmented and strongly weathered quartz schist (hereafter referred to as the cataclastic rock) has characteristics of rock body fragmentation and softer rock. The cataclastic rock is considered as a soft rock that will undergo creep and is simulated by the Burgers-Mohr model. Other rocks with larger rock parameters are not considered to undergo creep, so they are simulated by the Mohr-Coulomb model.
For the dynamic calculation, the Burgers-Mohr model is used in the form of viscoelastic increments and satisfies the following relationship (Equation (2)). In the dynamic calculations, the creep calculation switch is off, which is equivalent to a creep time step of 0. The viscous progenitor in the Burgers-Mohr model does not effectively represent the time of the mechanical behavior of the material, and the unit exhibits an elastoplastic stress-strain relationship, which behaves in the same way as an elastoplastic material.
Where:
—Total strain;
—Wavelength corresponding to the highest frequency in the seismic wave;
—Plastic body strain;
—Maxwell shear modulus;
—Kelvin shear modulus;
—Kelvin viscosity factor;
—Maxwell coefficient of viscosity.
When
= 0, Equation (2) is converted to Equation (3):
For the Mohr-Coulomb model, the strain increment is decomposed into an elastic part and a plastic part according to the elastoplastic theory, satisfying the following equations (Equation (4)):
Where:
—Strain increment;
—Strain of elastic partial;
—Strain of plastic partial;
The expression based on Hooke's law is as follows (Equation (5)):
Combining Equation (4) and Equation (5), the Mohr-Coulomb model satisfies the following relationship (Equation (6)):
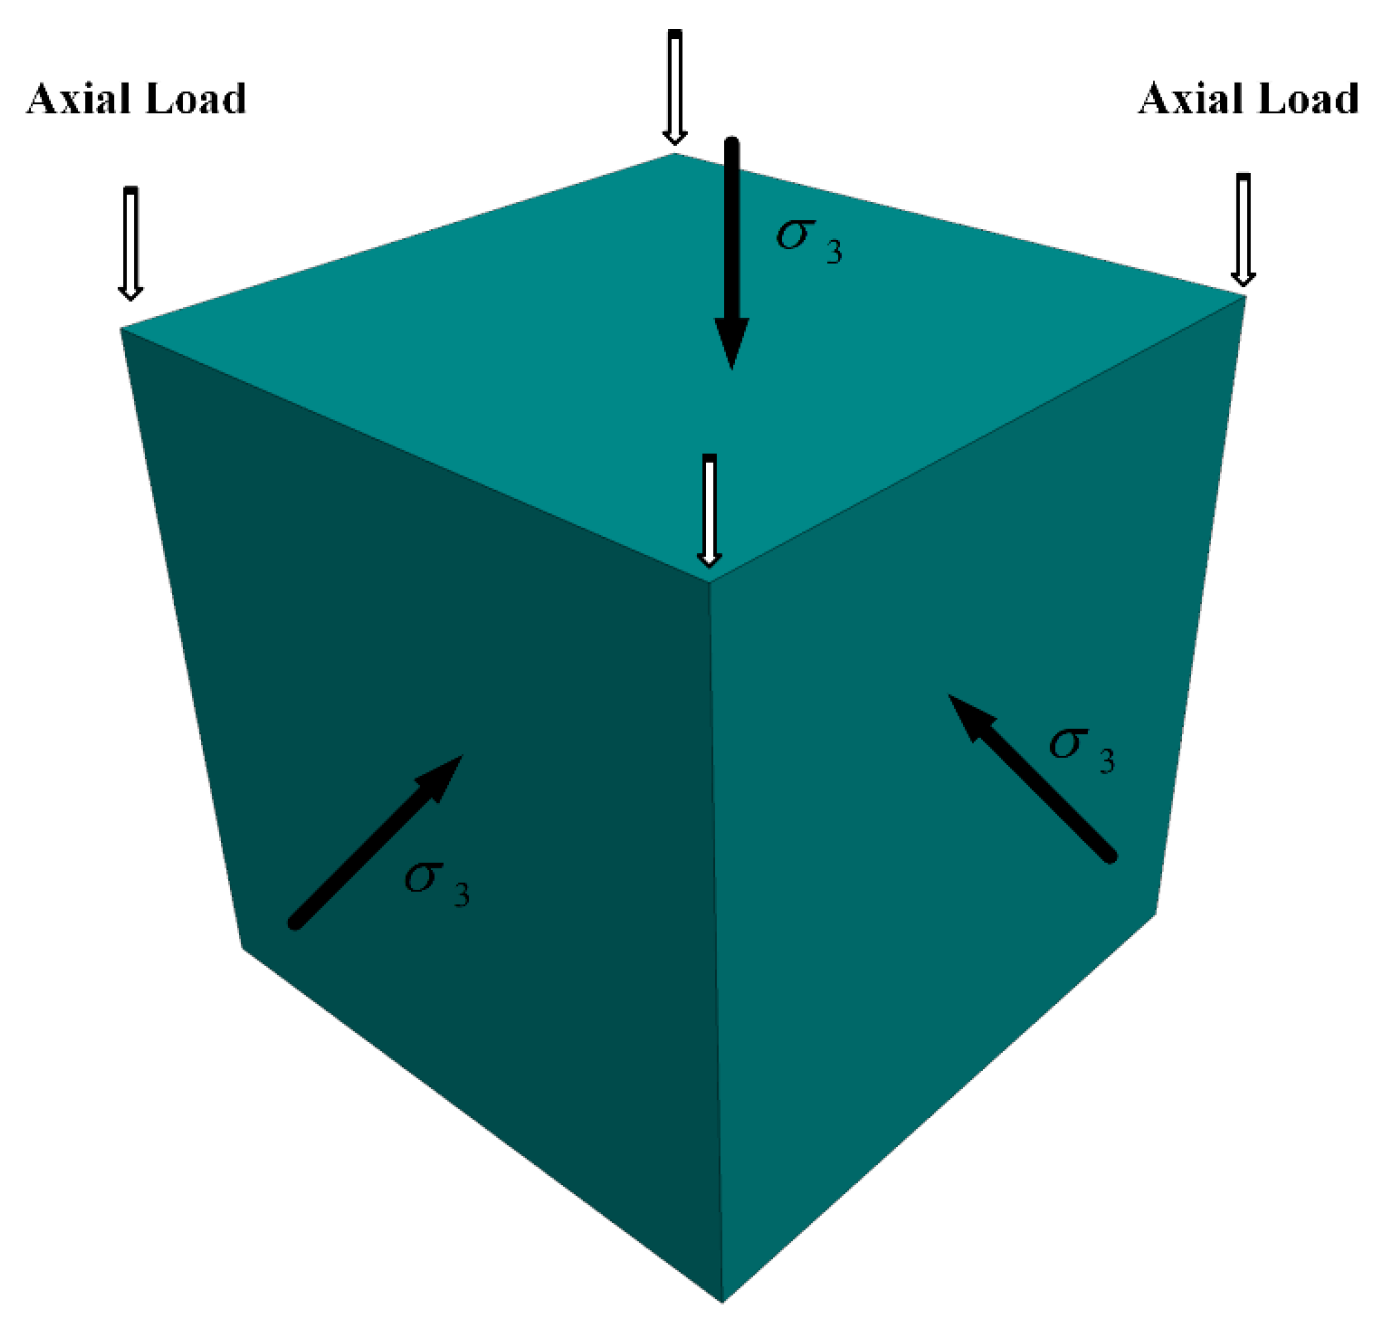
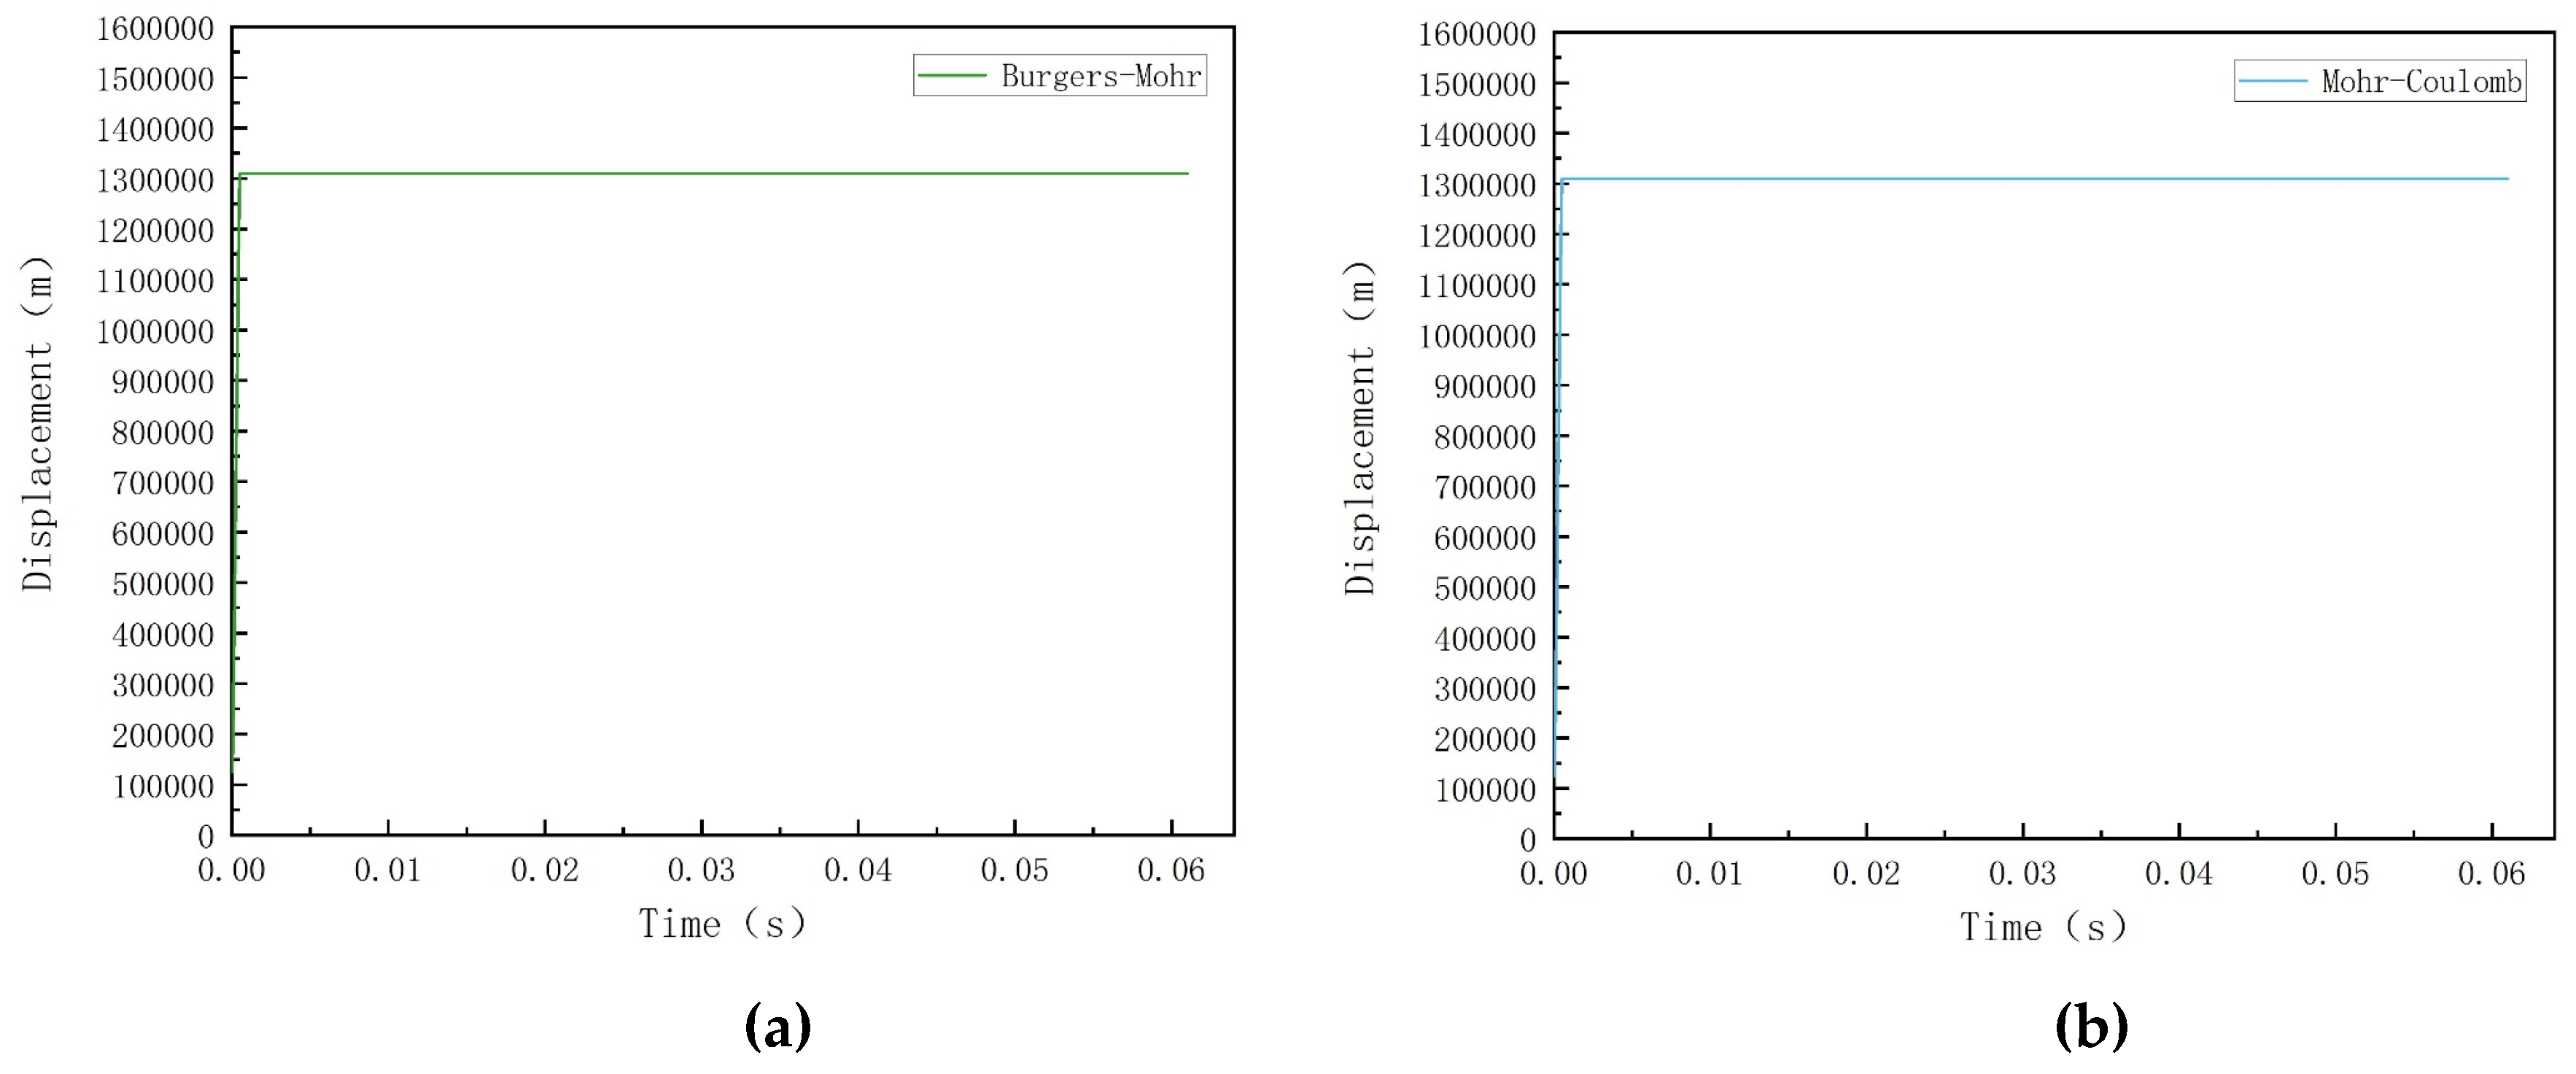
Through Equation (3) and Equation (6), it can be seen that the Burgers-Mohr model exhibits the same properties as the Mohr-Coulomb model. Therefore, all rocks are assigned the Mohr-Coulomb model in the dynamic calculation. To further verify the reasonableness of the selection of the principal structure, this paper uses FLAC3D software to conduct conventional triaxial compression tests of the rock, utilizing a single unit with a total of 8 nodes and 4 nodes on the fixed bottom surface, applying the same circumferential pressure in the X, Y and Z directions to the unit and axial pressure along the Z-axis direction, as shown in
Figure 4. The Burgers-Mohr model and Mohr-Coulomb model are assigned respectively. Results show that the displacement is almost the same (
Figure 5), which verifies the rationality of the selection of the constitutive model.
3.3. Boundary Condition and Layout of Monitoring Points
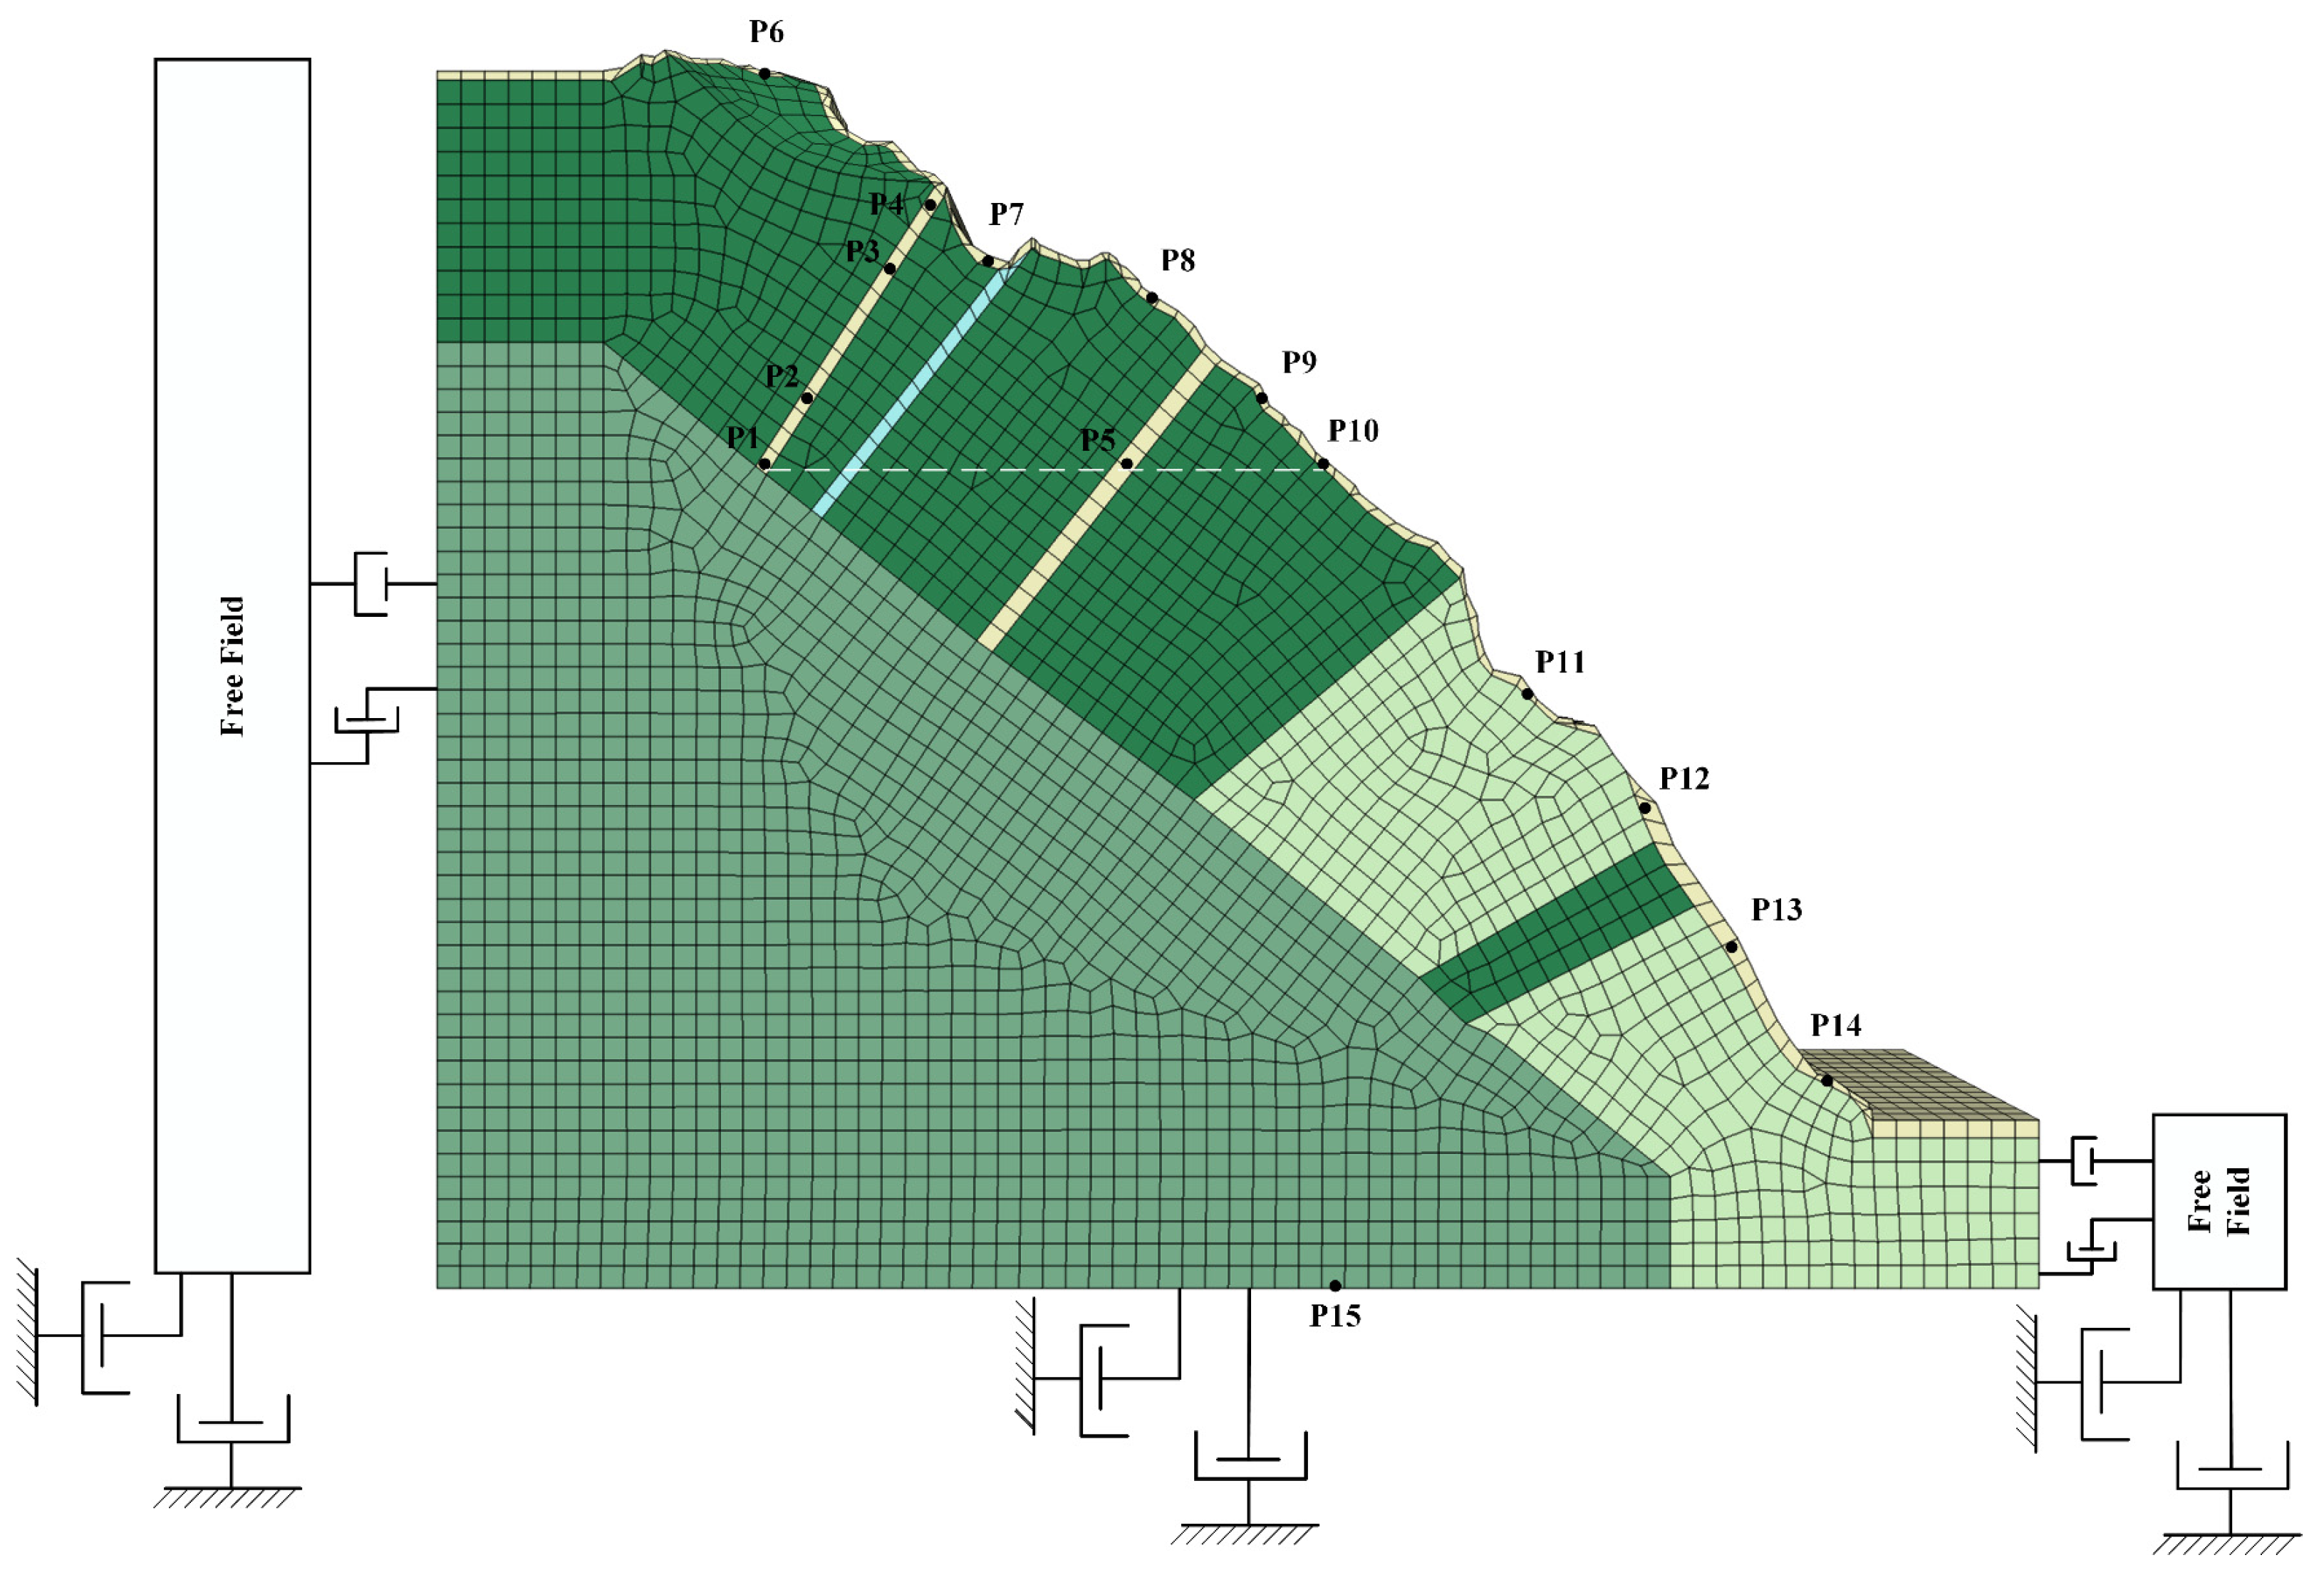
When seismic action is carried out, the static calculation is carried out first, and then the dynamic calculation is analyzed. For static calculation, the initial stress field generated by the self-weight of the rock mass is considered. The four sides in X direction and Y direction are normal constraints. The bottom is fixed constraints and the top of the slope is a free boundary. For dynamic calculation, the use of quiet boundary and free-field boundary can avoid the problem of wave reflection on the boundary. The research object is a rock slope. The bedrock modulus is large and the bottom is the rigid foundation. So the quiet boundary is used at the bottom. Four sides of the model in the X direction and Y direction use free-field boundaries, as shown in
Figure 6.
The layout of monitoring points for the slope model is shown in
Figure 6. Nine monitoring points (P6-P14) are set at the slope surface. Another five monitoring points (P1-P5)
are set inside the slope and one monitoring point (P15) is set at the bottom of the slope.
3.4. Ground Vibration Synthesis and Input
In order to try to ensure the accuracy of calculation results, this paper adopts Rayleigh damping. The critical damping ratio of geotechnical materials is generally taken as 2% to 5%. The minimum critical damping ratio is taken as 0.04. The center frequency is taken as the superposition of the input frequency and the system's self-oscillation frequency.
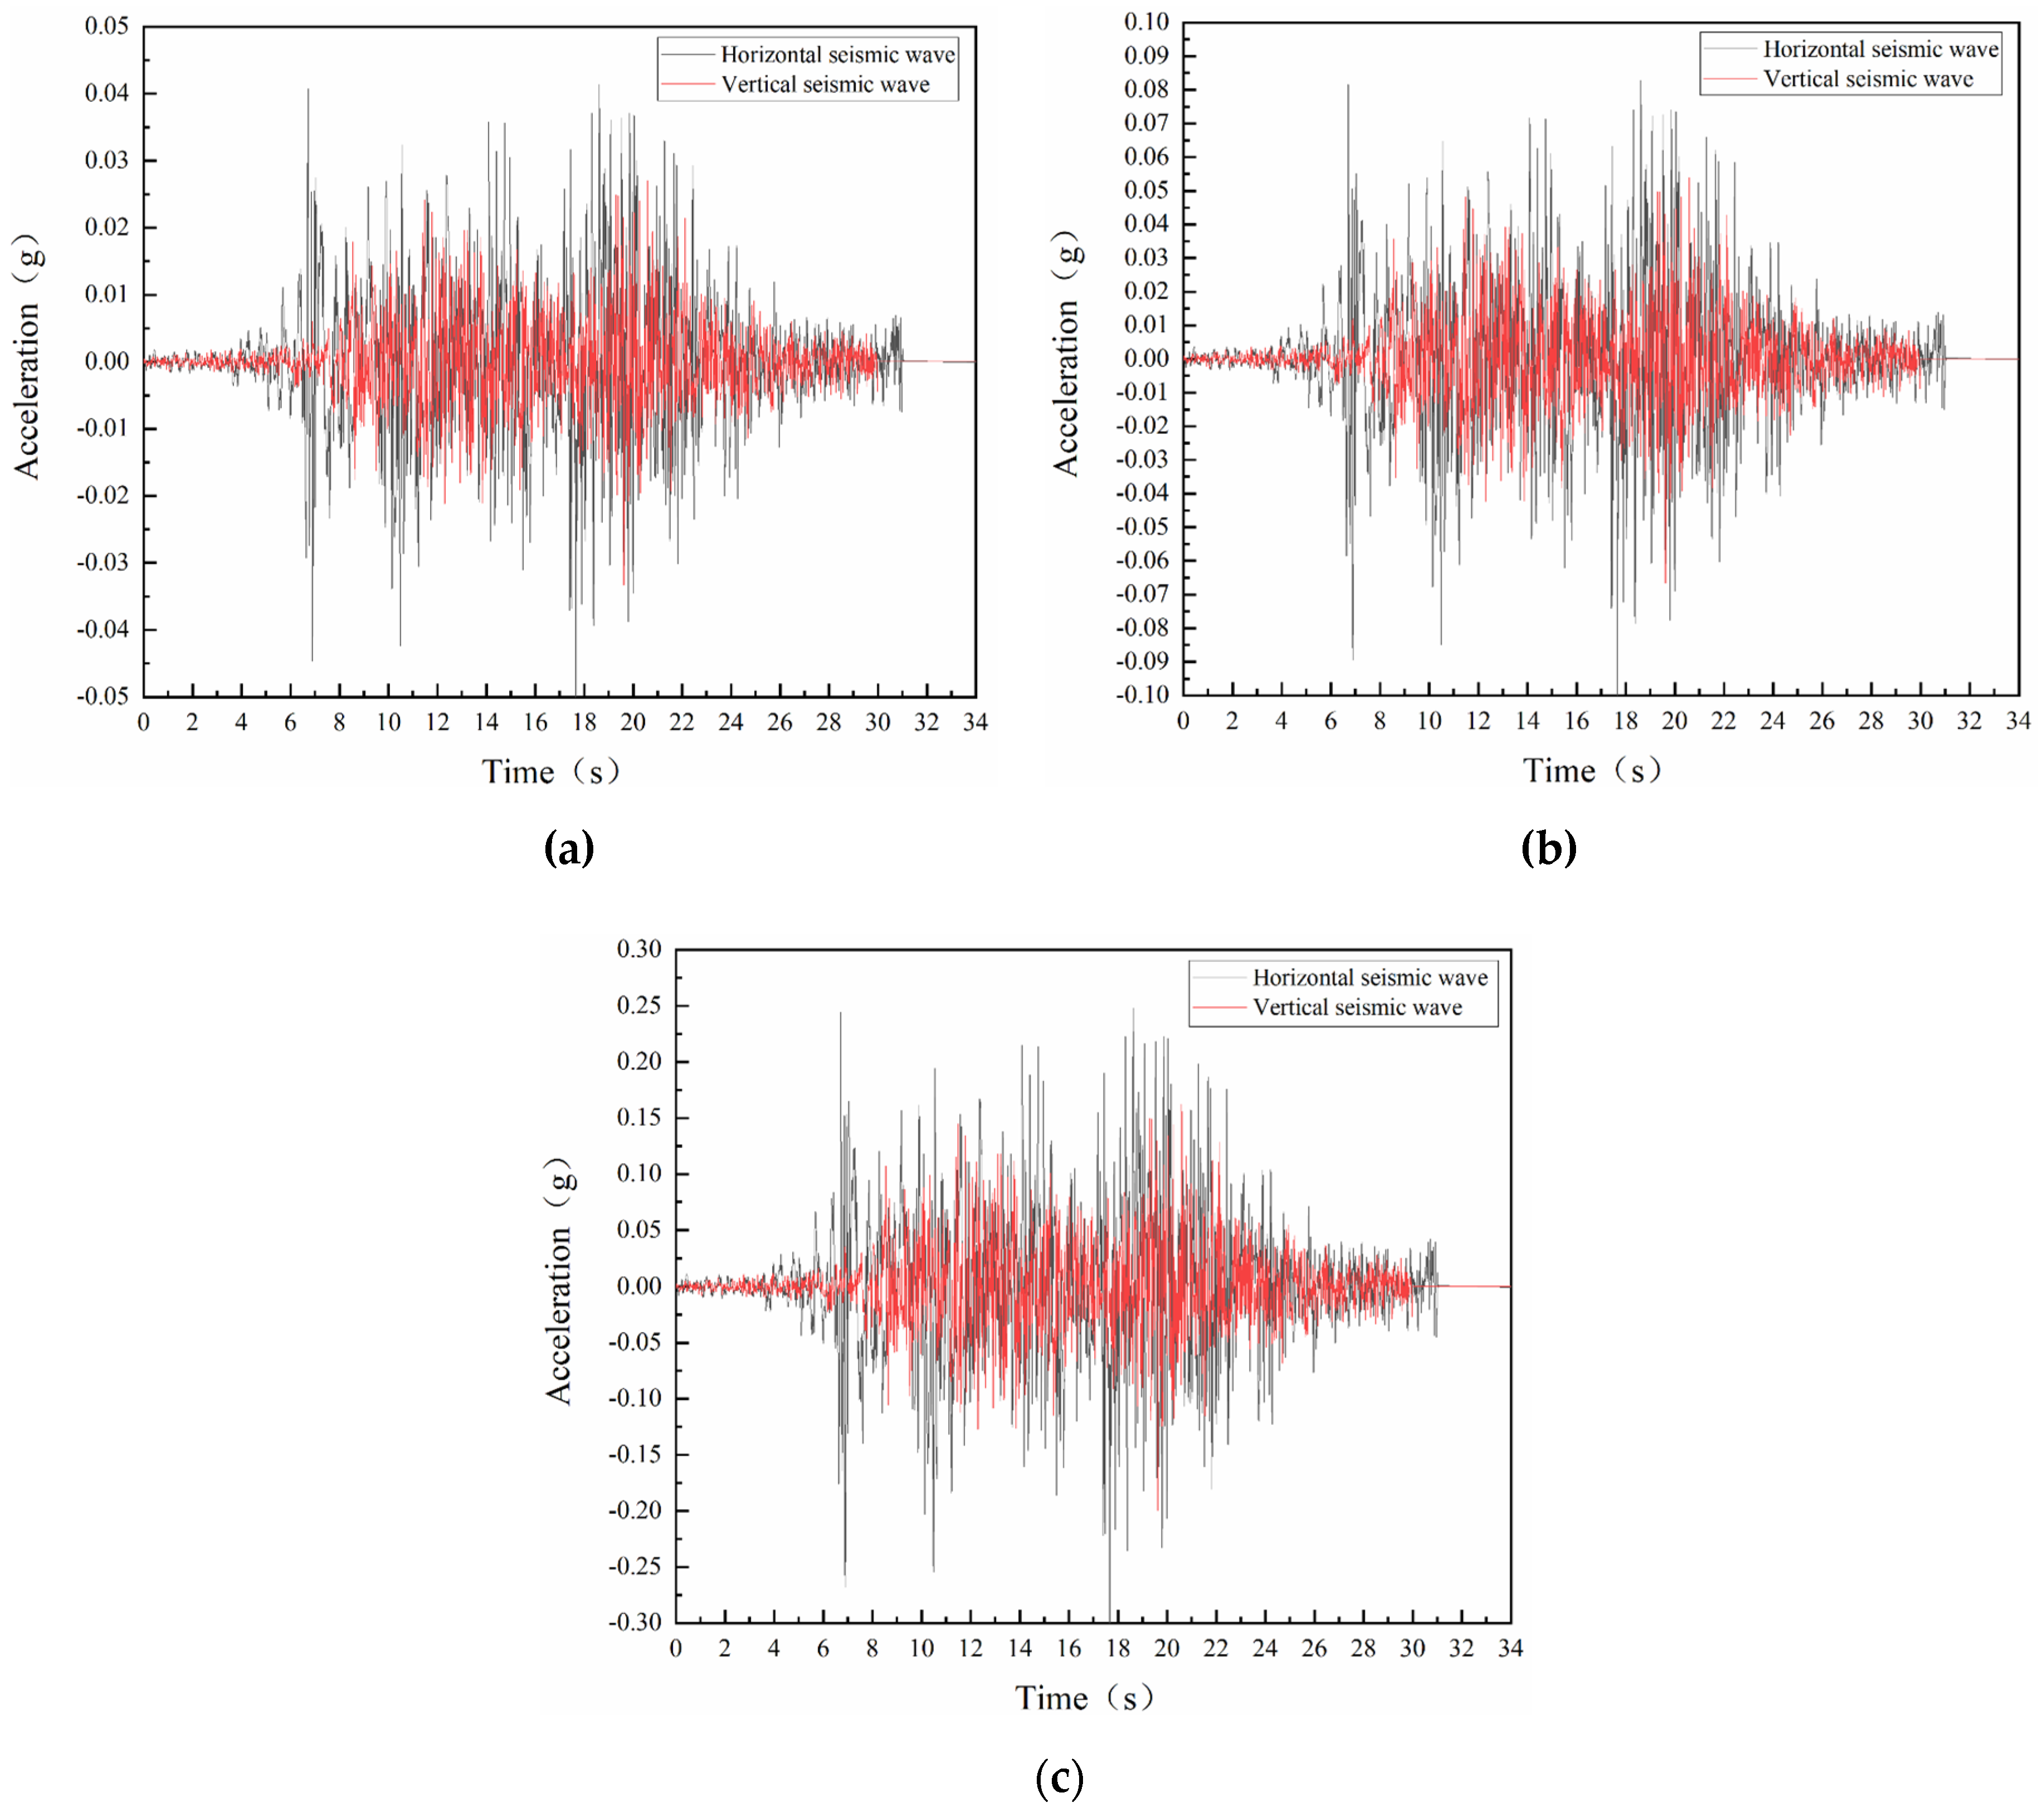
According to the seismic ground motion parameter zonation map of China (GB18306 2015), the site of the slope belongs to a Class II site. The basic seismic intensity is VII degree and the basic peak seismic acceleration is 0.1g. In order to be close to the actual situation, considering that the Wenchuan earthquake has a large impact on the area where the slope is located, this paper selects the E-W direction component and the vertical component of the Wenchuan wave as the inputs of the horizontal and vertical ground motion respectively, and intercepts the area where the ground motion effect is most concentrated in the mainshock portion. The simulation time is set to 34s, and Seismosignal is used for filtering and baseline correction. Earthquake groups are divided into three groups which are the frequent earthquake, the design earthquake and the rare earthquake, corresponding to intensity of 6 degrees, 7 degrees and 8 degrees respectively. The corresponding peak accelerations (amplitudes) of horizontal earthquakes are 0.05 g, 0.1 g and 0.3 g respectively. The peak acceleration of vertical ground motion is taken as a 2/3 value. The seismic acceleration time range converted to stress time range is loaded at the bottom of the slope and input vertically upward from the bottom boundary of the model. The horizontal and vertical acceleration time-range curves for different peak accelerations are shown in
Figure 7.
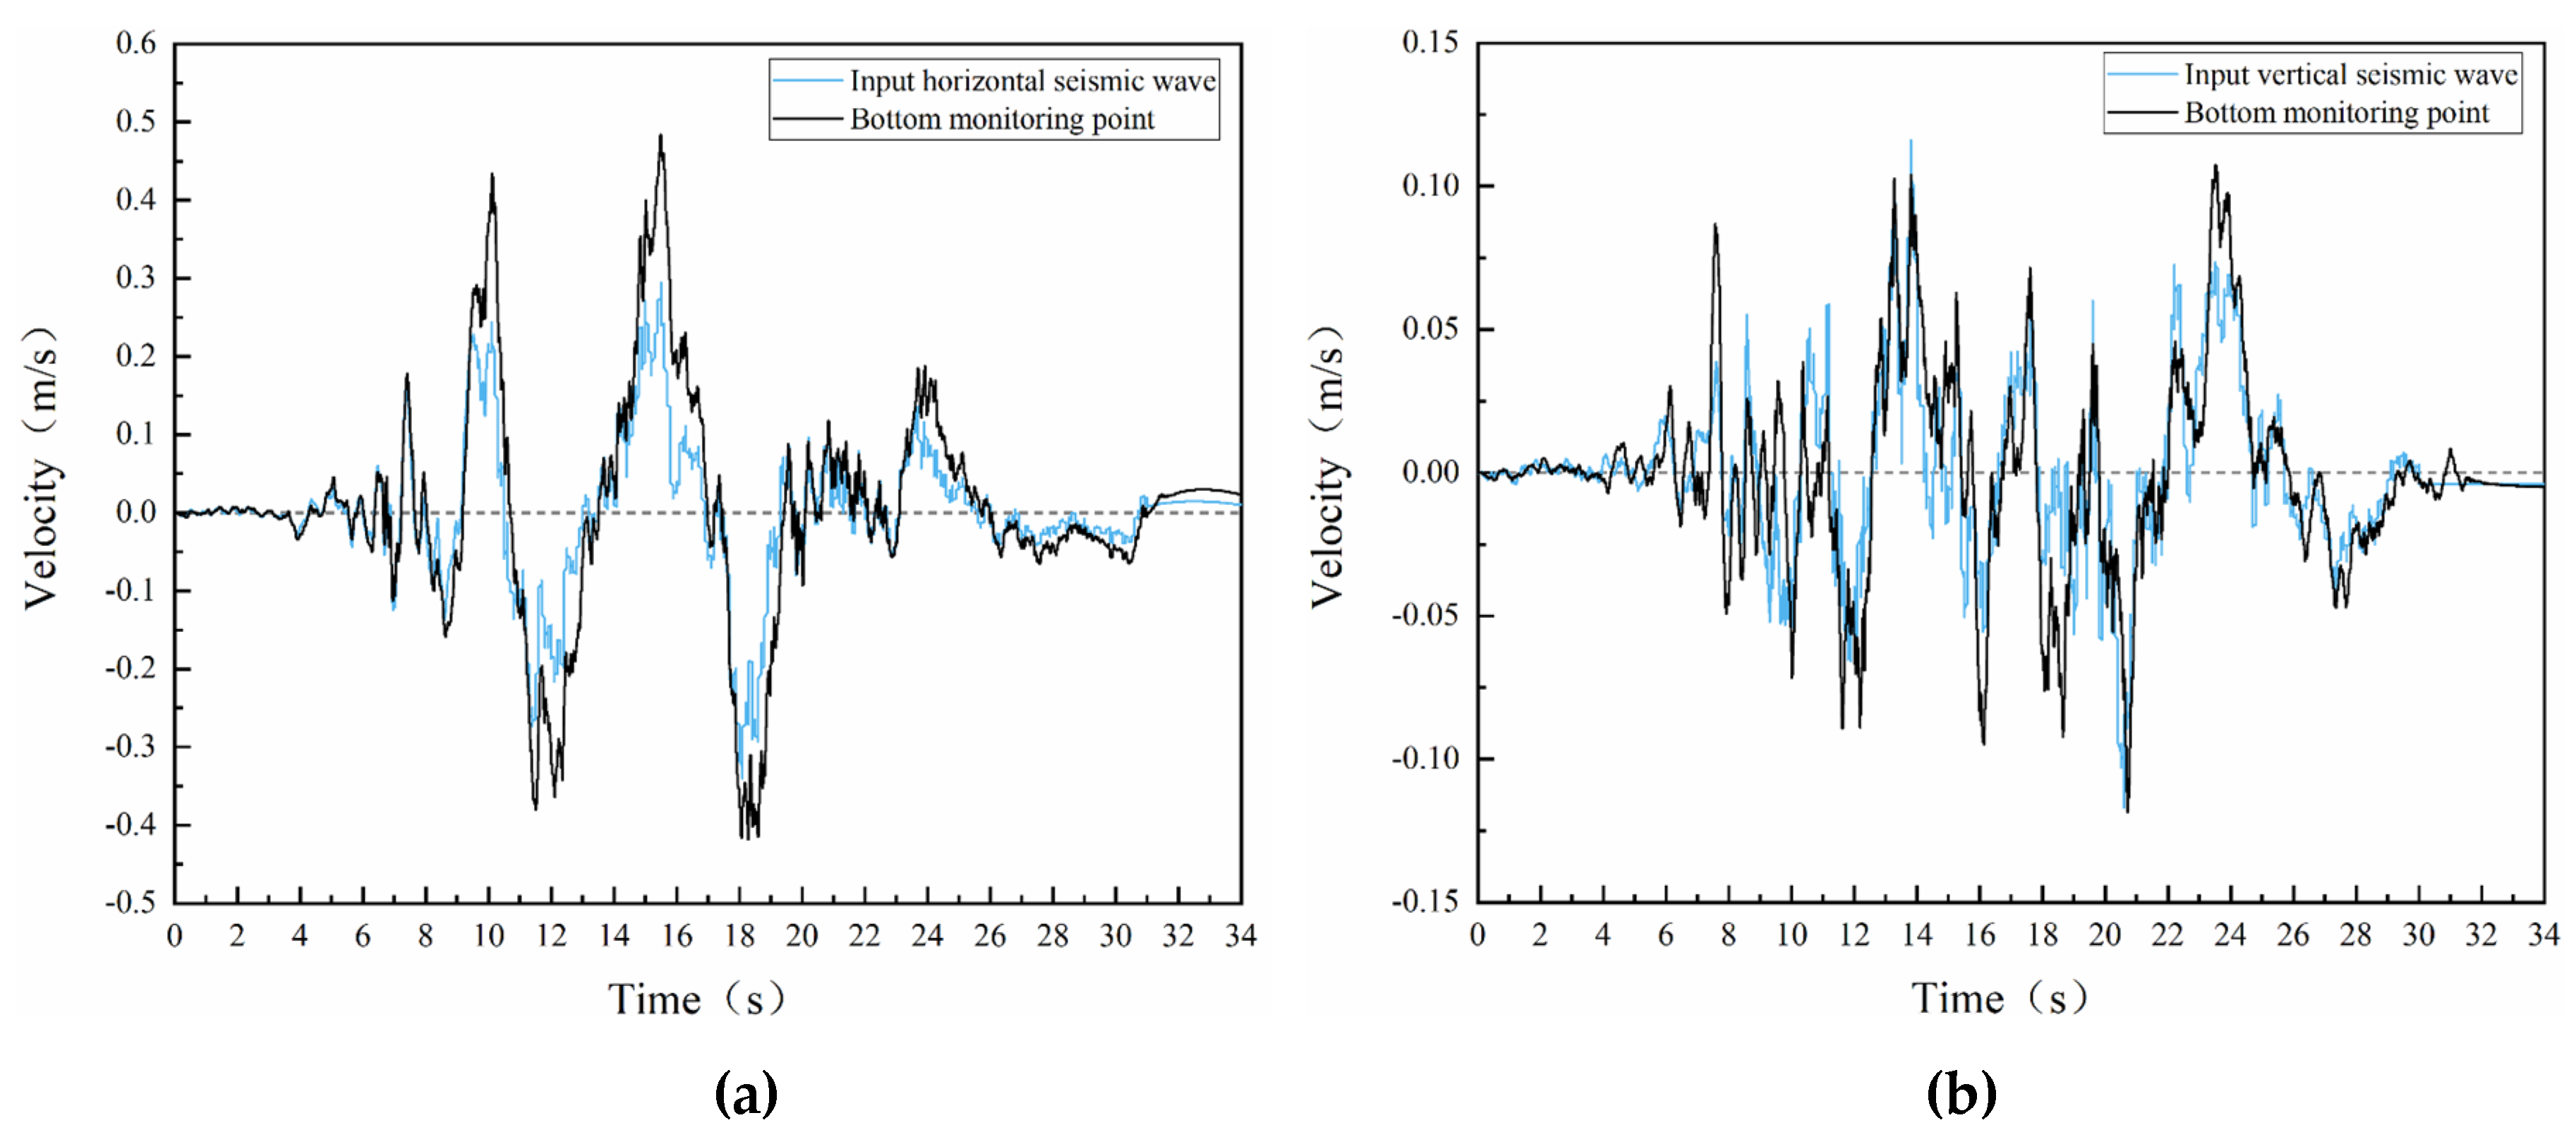
The monitoring point P15 is set at the bottom of the model to verify whether the modeling and seismic wave input are correct or not, by comparing the velocity time range of the monitoring point at the bottom with the velocity time range of the input seismic wave. Taking the working condition of amplitude 0.05g as an example (
Figure 8), in the horizontal and vertical directions, the velocity time course monitored at the bottom point P15 and the velocity time course of the input seismic wave are basically the same, which indicates that the model is built correctly and the ground motion is input in the correct way.
3.5. Design of Computational Scenarios
In this paper, different peak accelerations are used as the control factor to analyze the change rule of the dynamic response of the slope under the action of bidirectional ground motion. According to the data of the seismological bureau and the geological exploration, we can count the earthquakes which have a great influence on the area where the slope is located in the past 100 years (
Table 3). A total of four earthquakes have affected the site in the area with an intensity of VI degrees, a total of three earthquakes have affected the site in the area with an intensity of VII degrees, and a total of two earthquakes have affected the site in the area with an intensity of VIII degrees. Therefore, three sets of working conditions are designed at amplitudes of 0.05g, 0.1g, and 0.3g respectively. Seismic and creep modes of action for different amplitudes s are shown in
Table 4.
The calculation procedure is divided into the following steps:
(1) Firstly, an elastic constitutive model is assigned to rocks, the gravity load is applied to the model, and calculation is carried out until equilibrium in order to obtain the initial stress field of the slope; (2) The initial displacement is cleared to zero, and the Mohr-Coulomb model is assigned to simulate the natural condition; (3) The Mohr-Coulomb model is assigned to all rocks, and the dynamic calculation is carried out by applying bidirectional ground motion at the bottom of the slope; (4) In the creep calculation, the Burgers-Mohr model is applied to the fragmented and strongly weathered quartz schist. The Mohr-Coulomb model is applied to other rocks.
4. Results and Discussions
4.1. Analysis of Long-Term Creep Response of Slope before Earthquake
4.1.1. Stress Field
As shown in
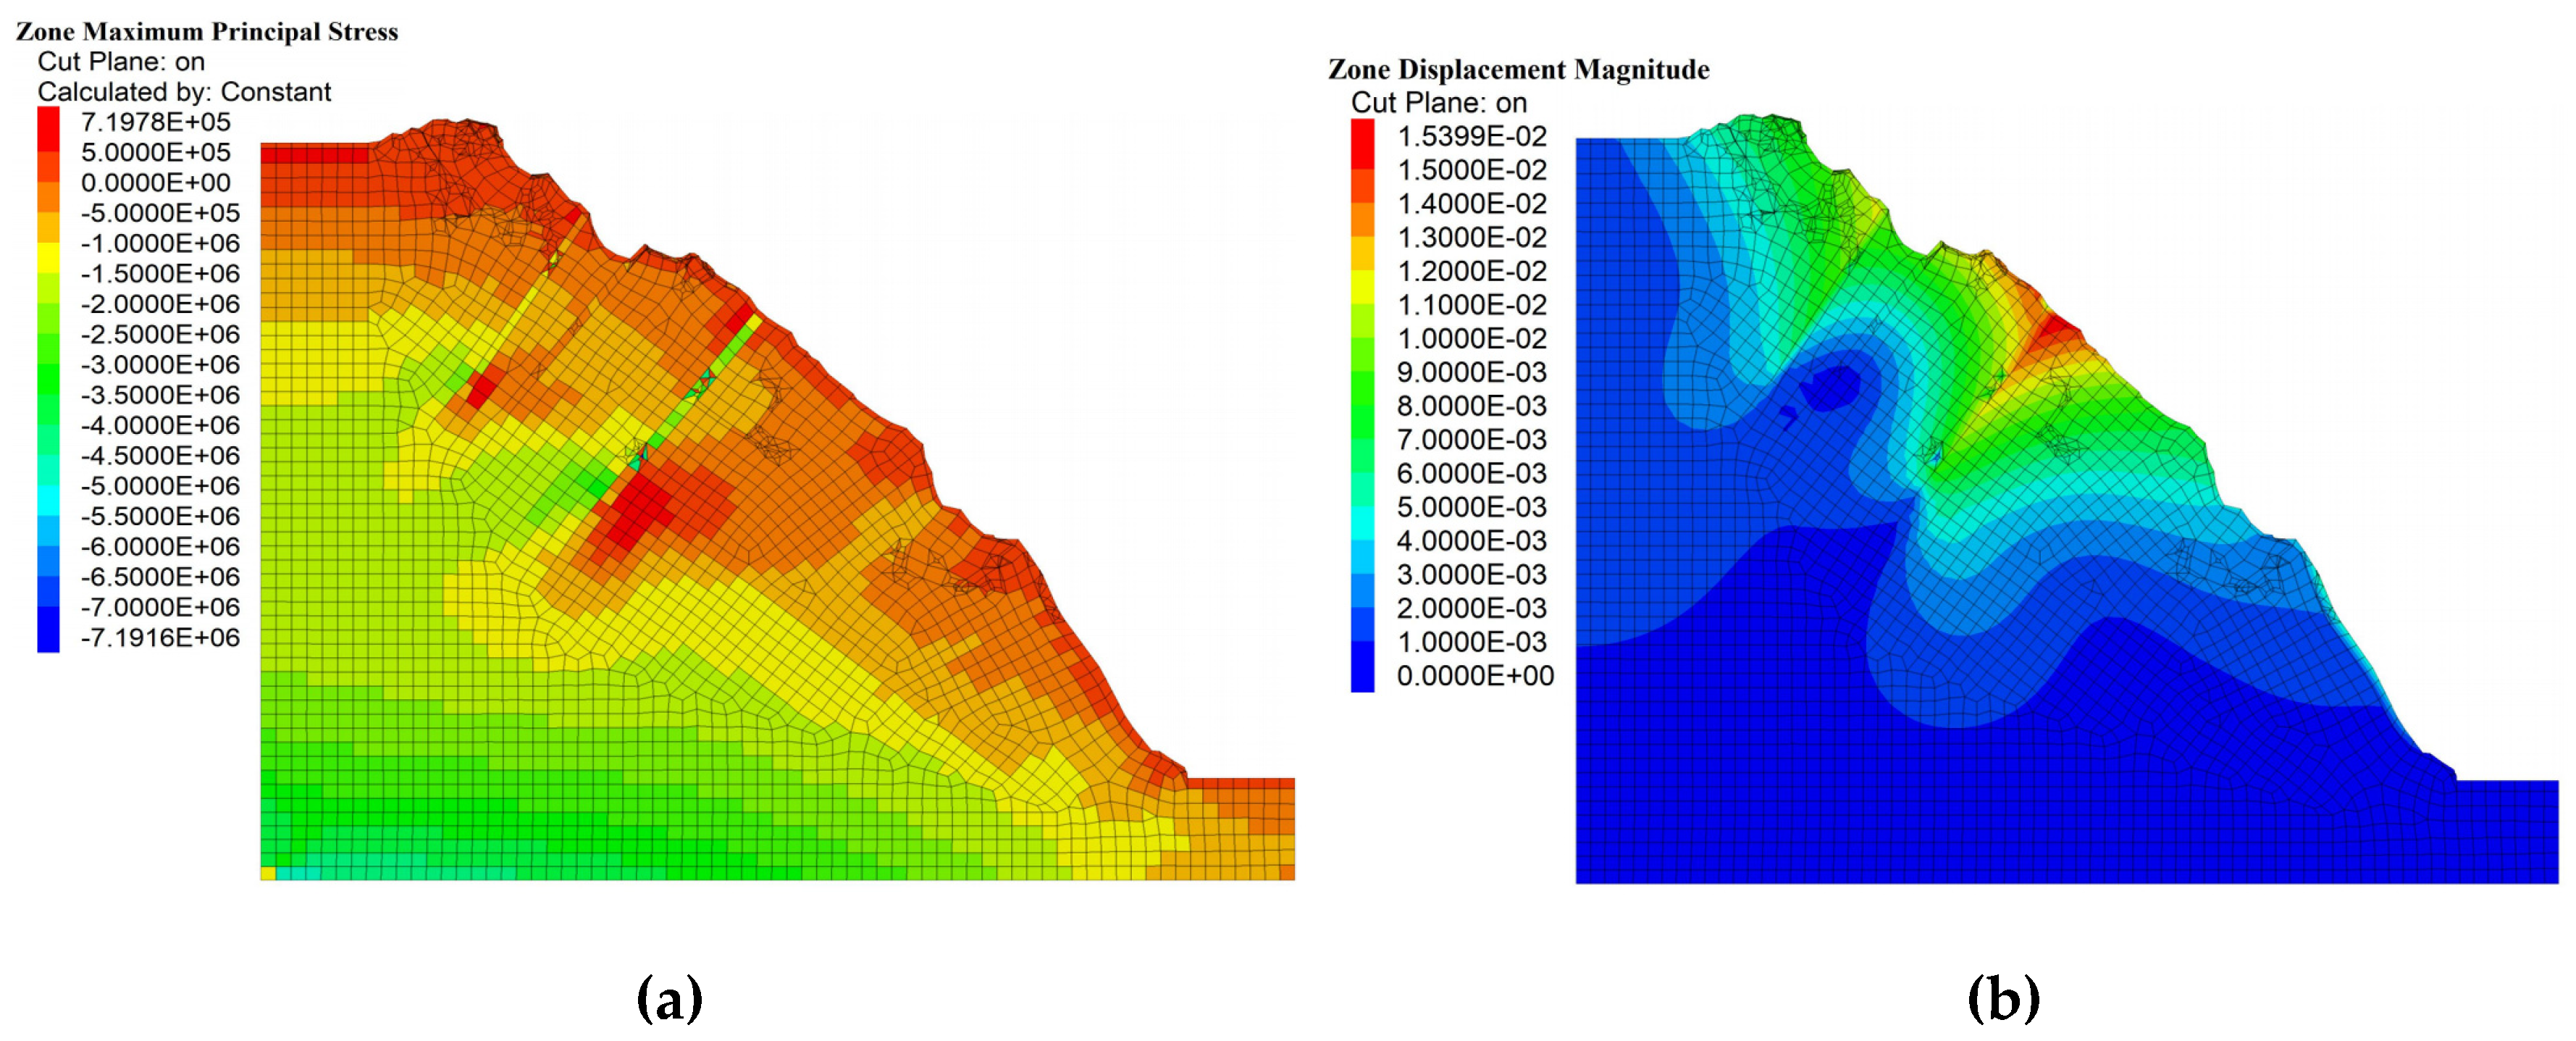
Figure 9, outside of the cataclastic rock and its influence range, the overall compressive area of the slope accounts for a relatively large proportion of the slope and it shows a more obvious layering phenomenon. Due to the self-weight stress, the compressive stress increases with the slope height decreasing. The compressive stress is about 0~7.16 MPa. The maximum principal stress is 7.19 MPa. It occurs in the middle of the cataclastic rock belt near the middle of the slope because of the small grid division and the element distortion. Its impact can be ignored. Tensile stress mainly appears at the junction of cataclastic rocks with weakly weathered quartz schists and slightly weathered granites, as well as fractured rock mainly at the slope surface of the side slope. The tensile stress is about 0~0.719MPa.
4.1.2. Displacement Field
As shown in
Figure 9, creep occurs mainly in the cataclastic rock distribution region. The maximum displacement reaches 15.39 mm. The maximum creep area is located in the cataclastic rock zone near the middle of the slope. Compared with other rocks, cataclastic rocks have lower compressive strength and more fragmentation, and their discontinuities and fissures are more widely distributed. Therefore, more significant creep deformation will occur in cataclastic rocks. Combined with
Figure 9(a), the maximum displacement appears in the area of a large distribution of cataclastic rocks which are more broken and looser. The stress is smaller. So the maximum principal stress value is relatively small.
4.2. Analysis of Long-Term Creep Response of Slope under Seismic Action
4.2.1. Stress Field
In
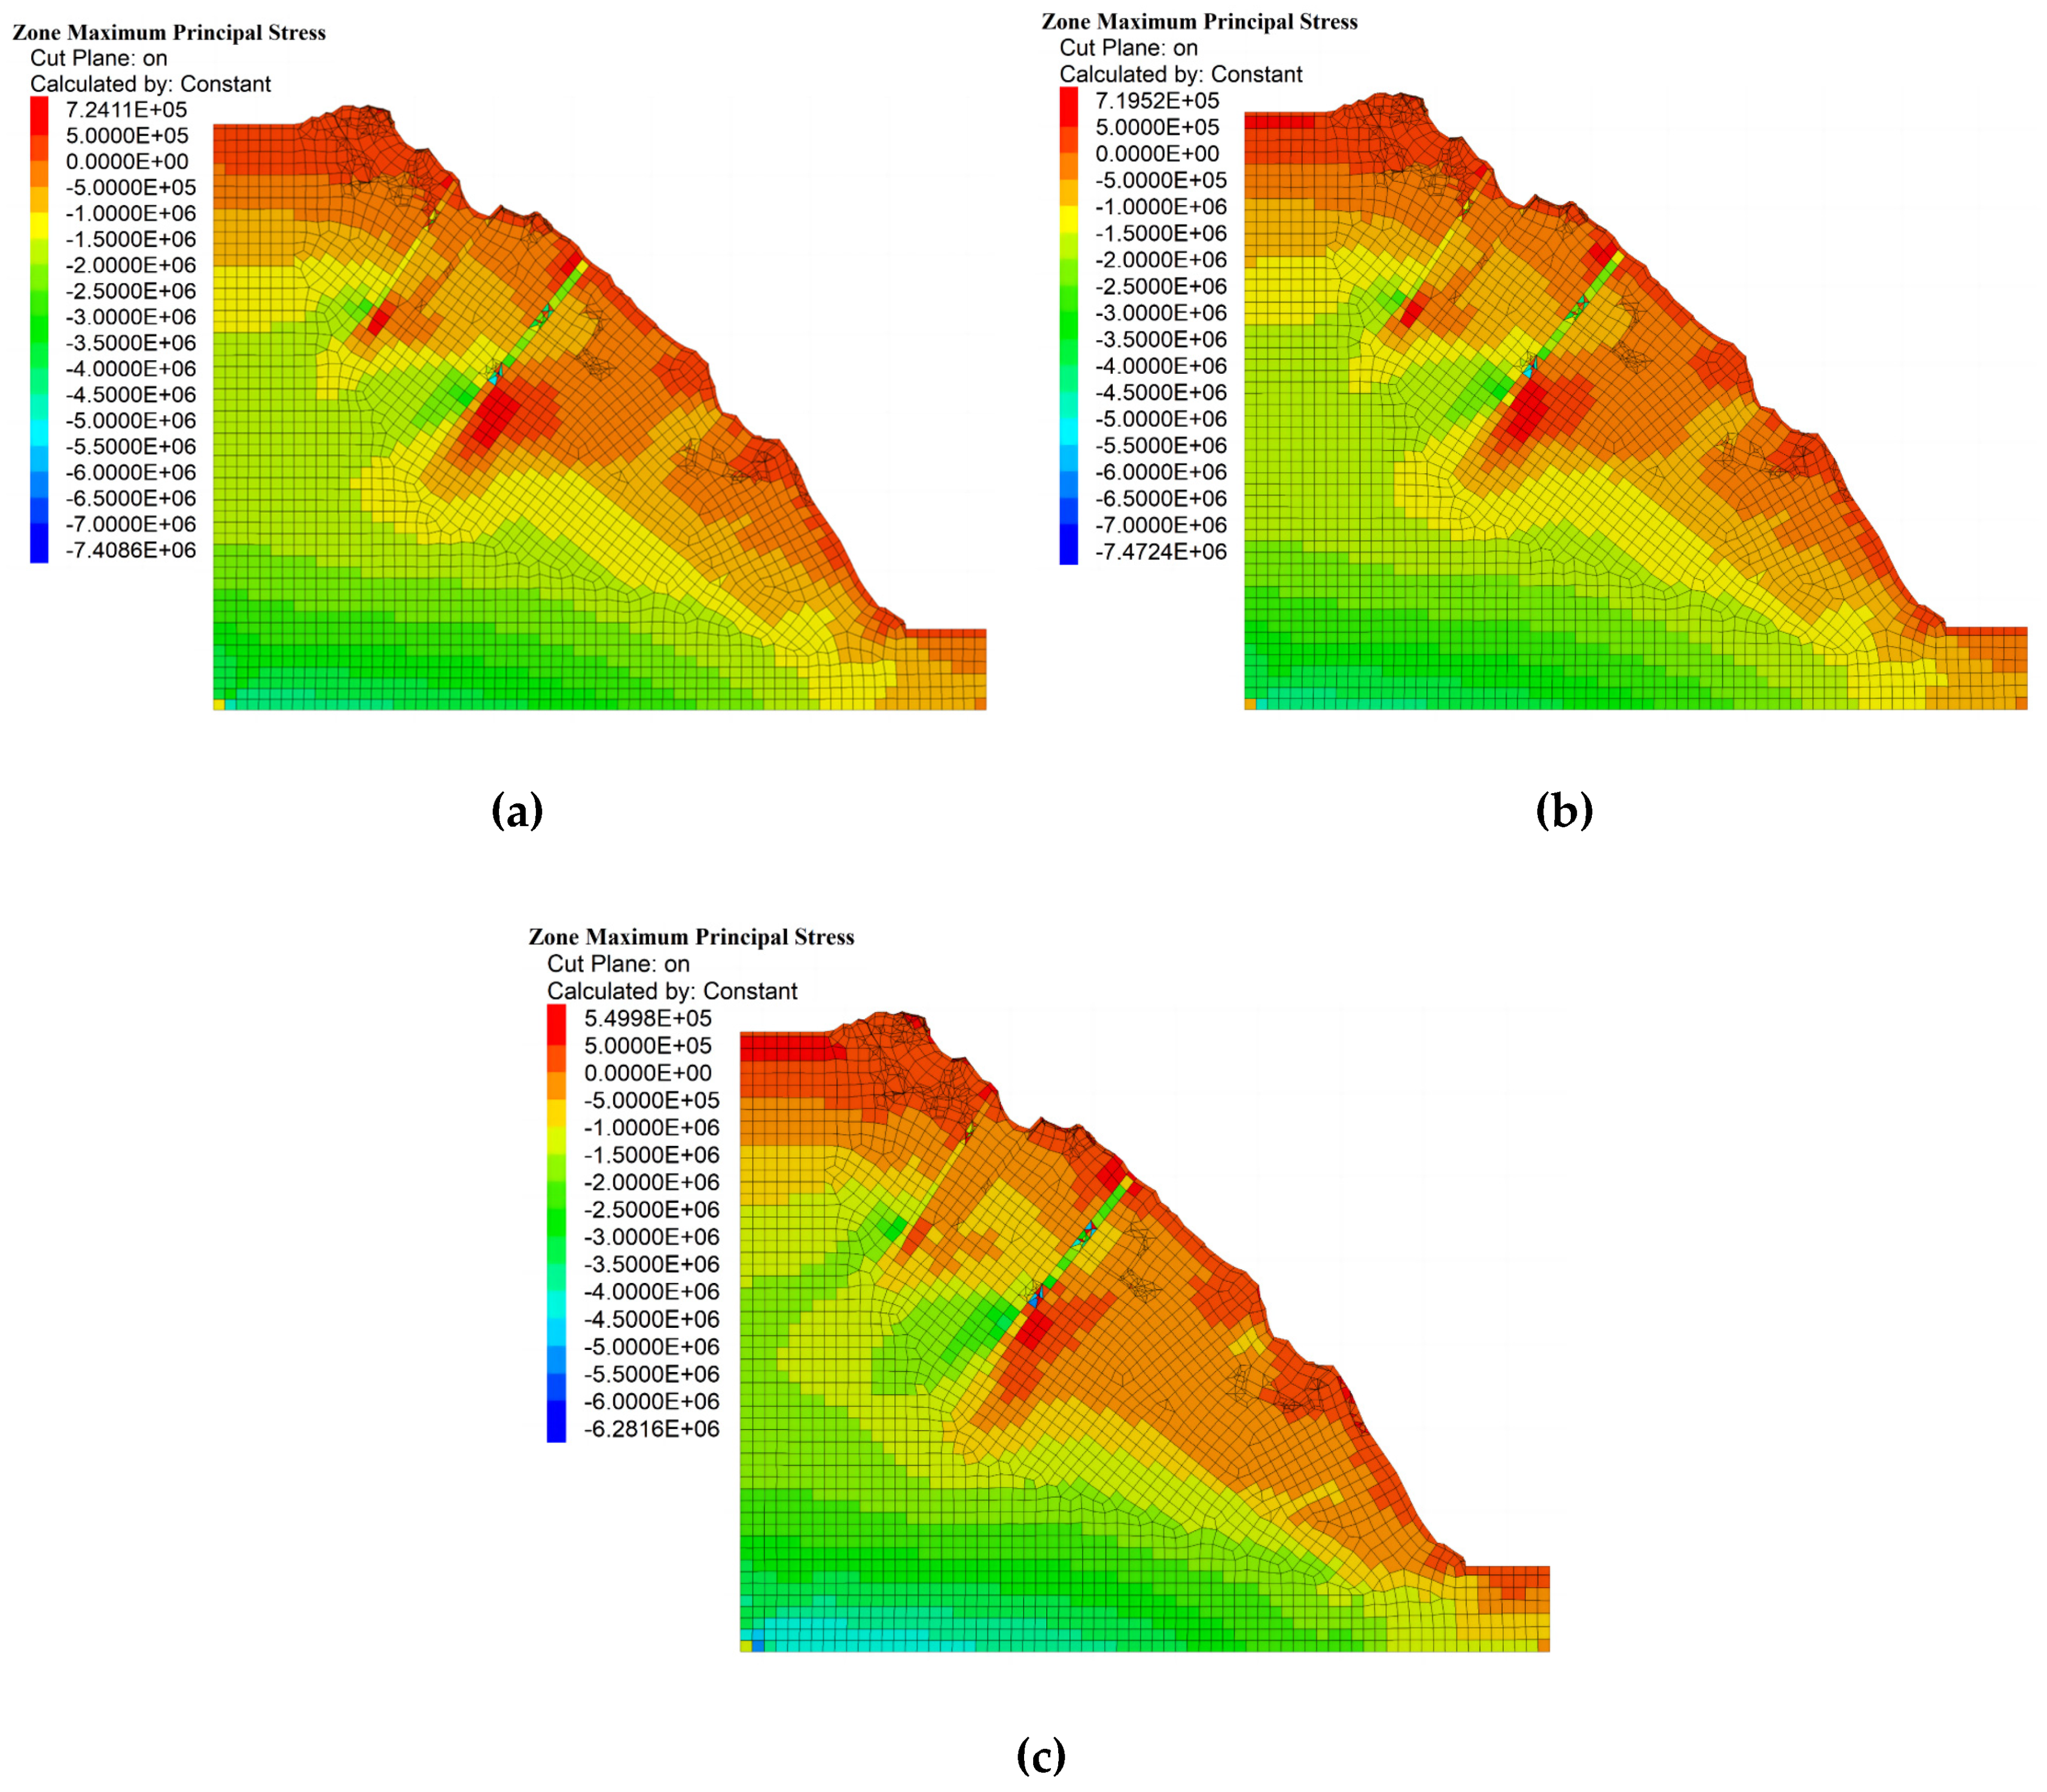
Figure 10, the stress field shows obvious stress concentration in the localization of the slope, especially at the foot of the slope, the top of the slope, and the demarcation line of the rock structure (unloading zone). Geotectonic activities, crustal changes, and other geologic changes may cause stress accumulation in specific areas, forming areas of high-stress concentration.
Due to the influence of rock structure, lithology, and slope morphology, the maximum principal stress distribution of the slope shows the phenomenon of tensile and compressive stress conversion, which is specifically found at the junction of the cataclastic rocks with weakly weathered quartz schists, slightly weathered granites, and in the local area of the fracture zone. The difference of deformation characteristics and the limit of deformed continuous static equilibrium conditions lead to the transformation of tension and compression stress at the interface of three kinds of rocks. A smaller range of tensile stress is distributed in the area of cataclastic rocks, mainly in the middle of the slope surface, where the slope morphology protrudes outwards. That indicates that cataclastic rocks with strong unloading and relaxation may potentially undergo destructive deformations if further impacts are caused by external unfavorable factors. Large tensile stress appears at the shoulder of the slope. Because under the earthquake action, the acceleration near the top of the slope increases rapidly, resulting in instantaneous tensile load which may cause tearing. At three different amplitudes, the overall compressed area of the slope is larger, and the stress contour shows a more pronounced stratification phenomenon. Under the influence of self-weight stress, the maximum principal stress of the slope gradually increases from top to bottom. Excluding the influence of unit distortion, the maximum compressive stress appears at the bottom of the bedrock.
Comparing the maximum principal stress under natural and seismic conditions (
Figure 9(a) and
Figure 10), when the amplitude increases, the overall maximum principal stress shows a decreasing trend. The seismic action causes the rock structure to become looser and more fragmented, resulting in reduced stress. In particular, the maximum stress value is reduced by 12.6% compared with the natural working condition at amplitude 0.3g. The slope shear strength decreases and the risk of slope instability increases.
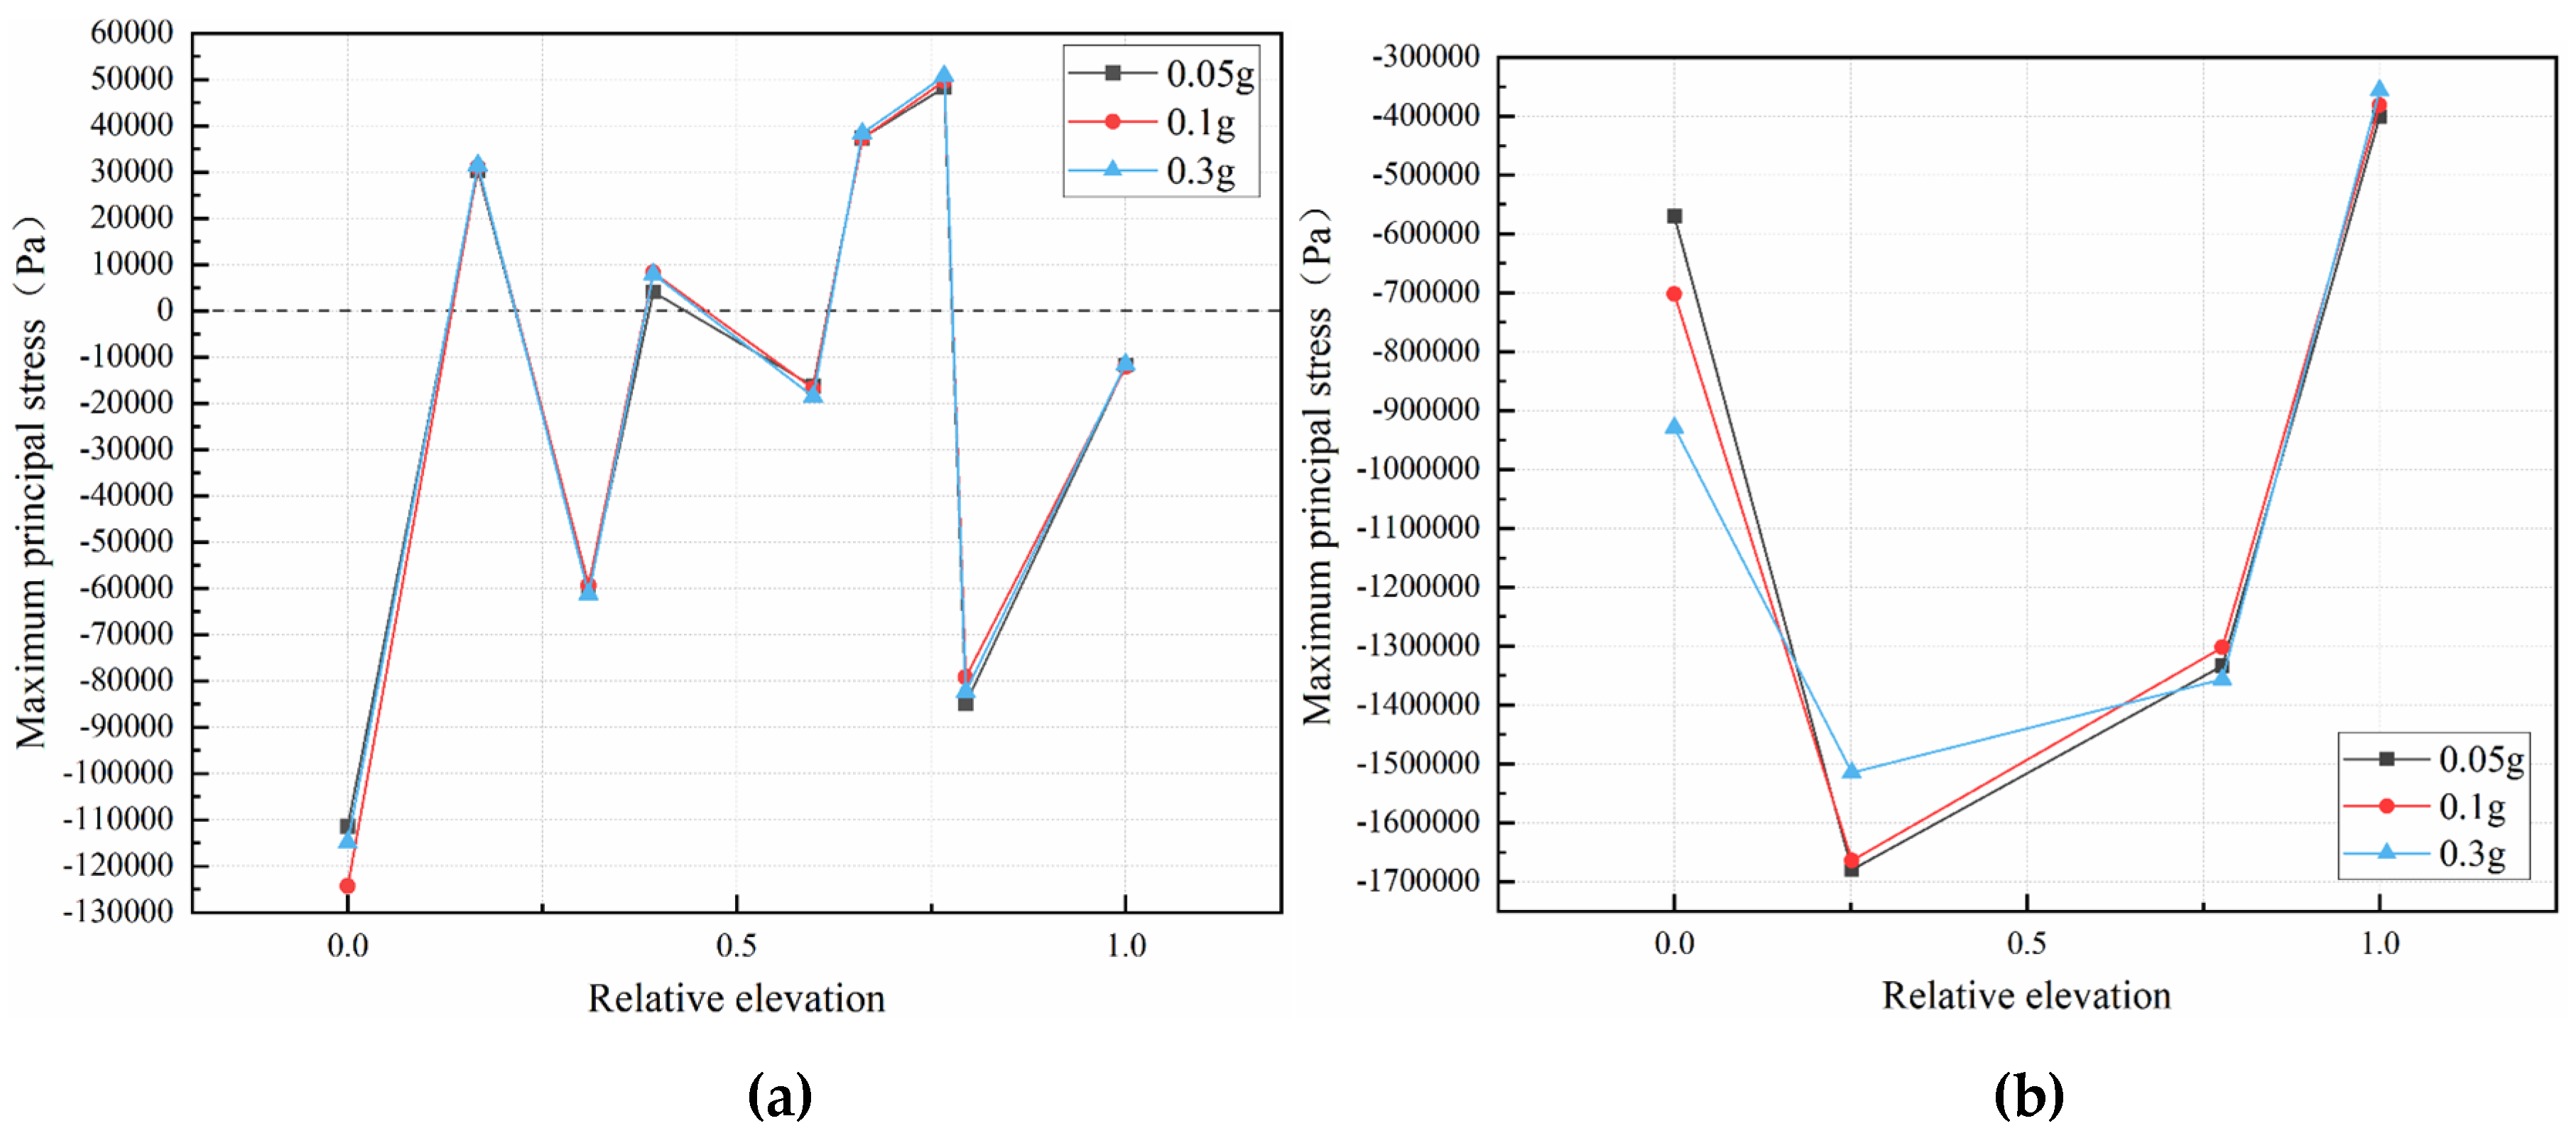
The maximum principal stress at the end of the entire seismic and creep cycle is chosen as the analytical index for
Figure 11. This relative elevation is defined as the ratio of the actual slope height h to the total slope height H.
From
Figure 11(a), at three amplitudes, the curves of maximum principal stress with relative elevation for the slope surface have the same pattern. However, the difference in stress values is not significant, indicating that the amplitude change has a small effect on the maximum principal stress distribution on the slope surface. The maximum compressive stress all occurs at the foot of the slope and the maximum tensile stress all occurs in the middle of the slope. If there are further negative external factors affecting it, the greater tensile stress may pull the upper rock mass and push the lower rock mass to move.
From
Figure 11(b), at three amplitudes, the trend of the variation of the maximum principal stress with elevation at the vertical monitoring points in the slope is consistent, all of which are compressive stress, showing an increasing and then decreasing trend. Due to the proximity of monitoring points p3 and p4 to the open face, there is a process of stress release, resulting in a rapid decrease in stress.
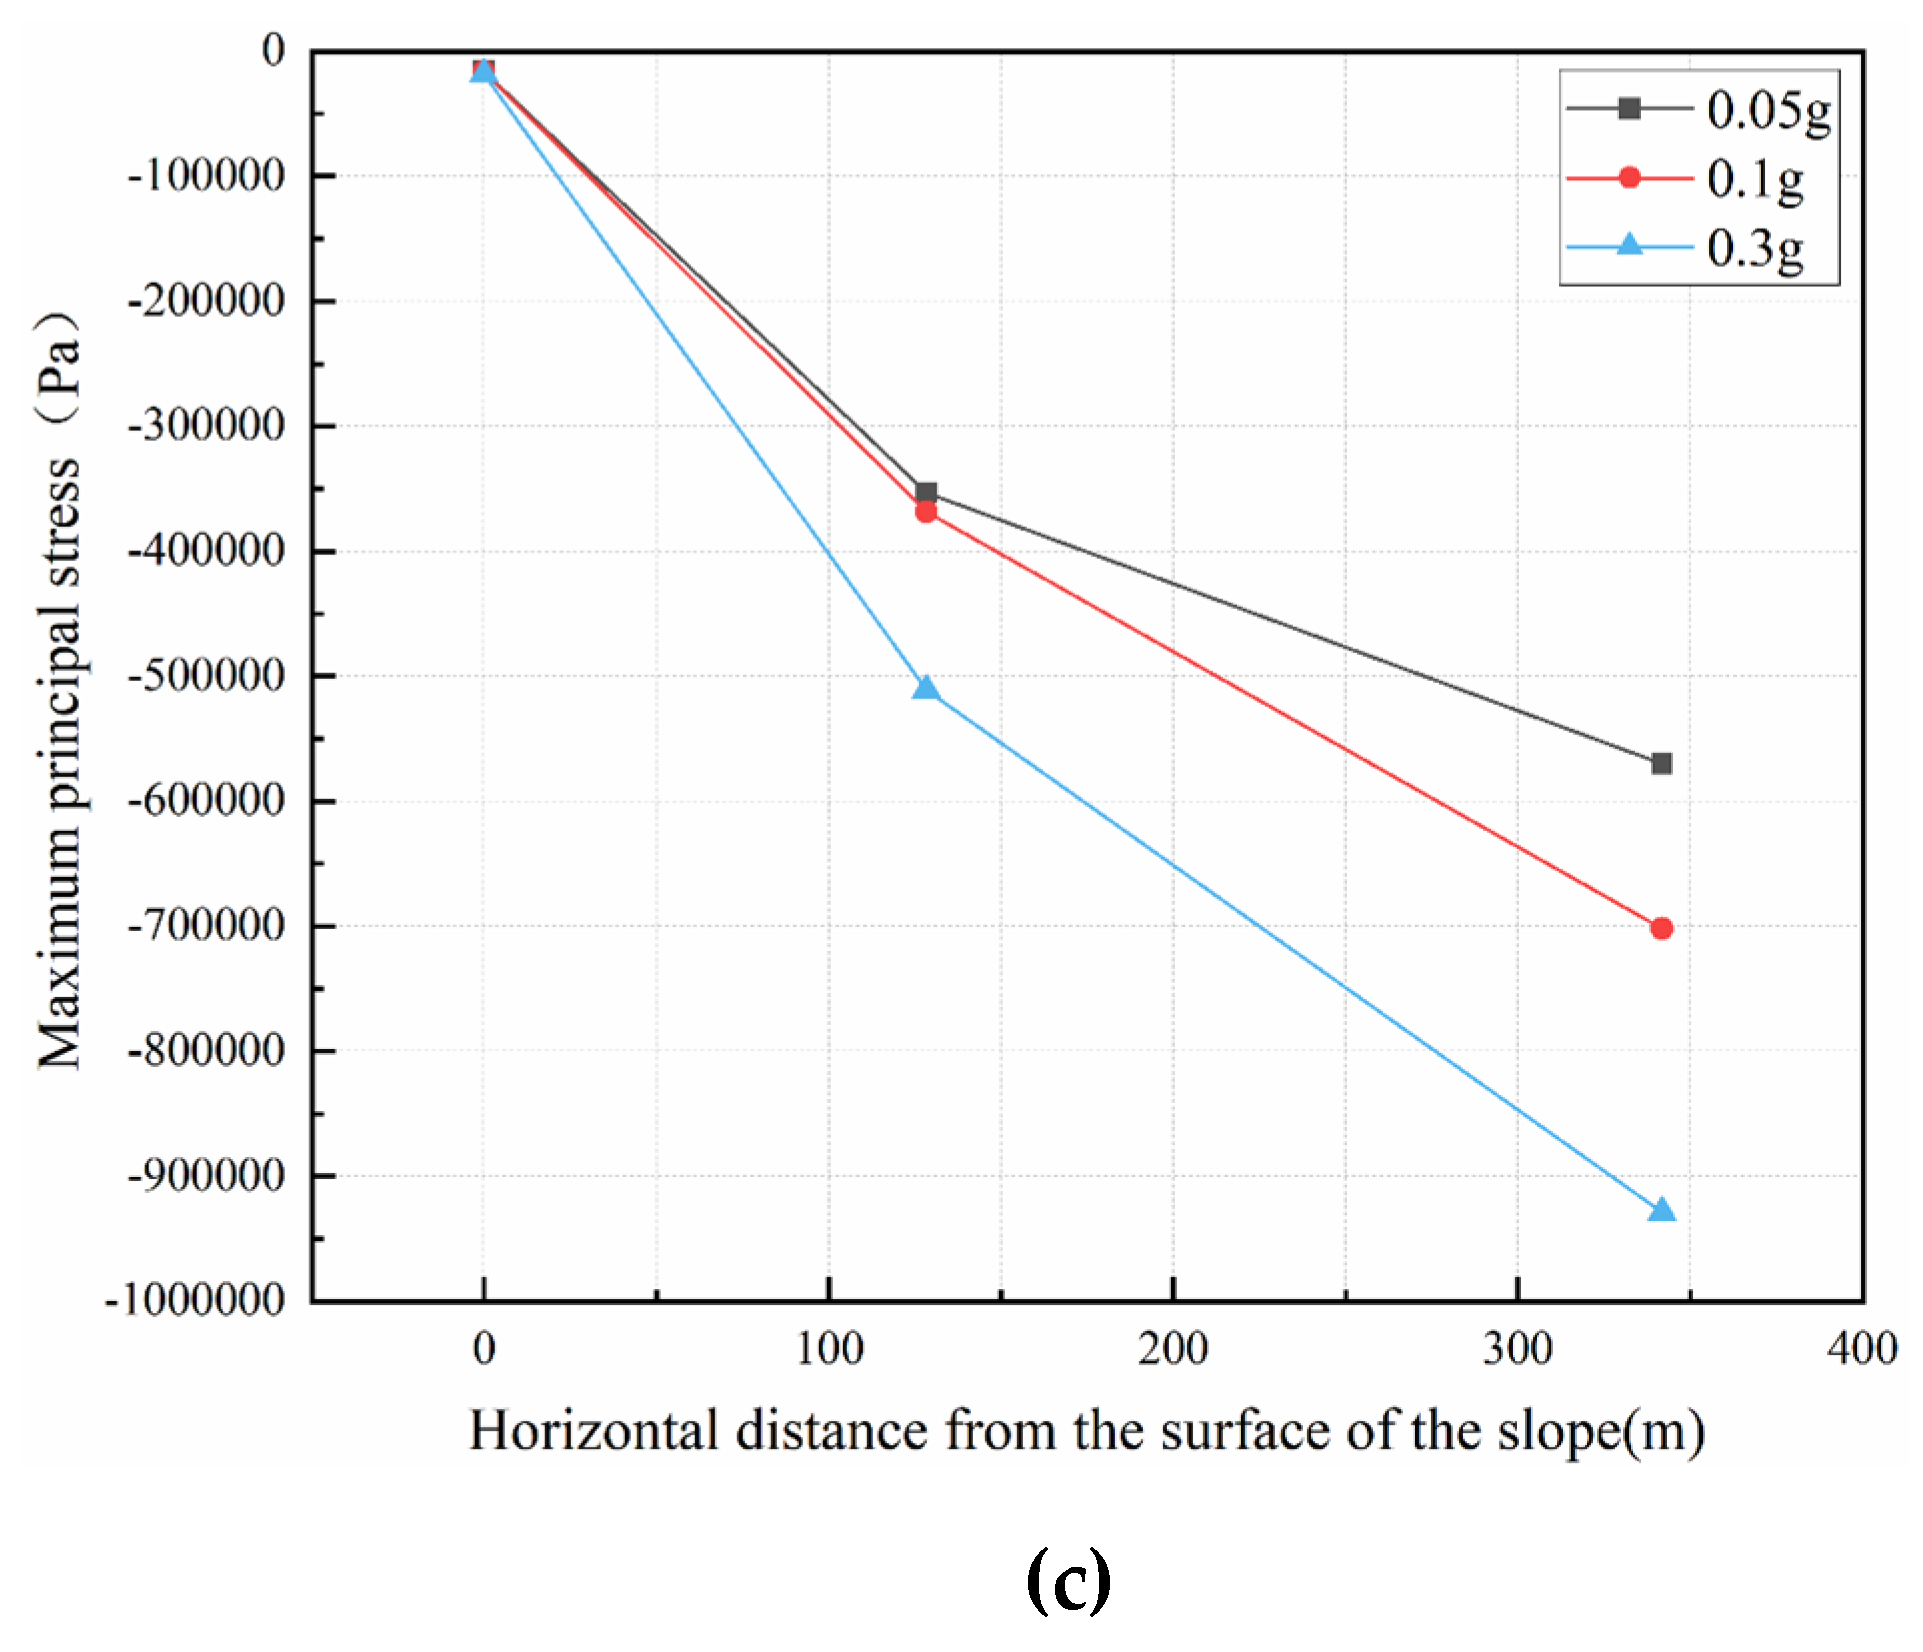
From
Figure 11(c), at three amplitudes, the variation trend of the maximum principal stress at the horizontal monitoring points in the slope with respect to elevation is similar, and all are compressive stress. As the amplitude increases, the rate of stress change becomes larger and the maximum principal stress is ranked as follows: 0.3g > 0.1g > 0.05g. The maximum principal stress decreases more rapidly as the slope surface is approached. It reaches a minimum value at the slope surface because stress releases near the critical surface. The presence of tensile and compressive stress at the monitoring points on the slope face and compressive stress at monitoring points inside the slope indicates that the slope face is more unstable compared to the interior of the slope.
4.2.2. Displacement Field
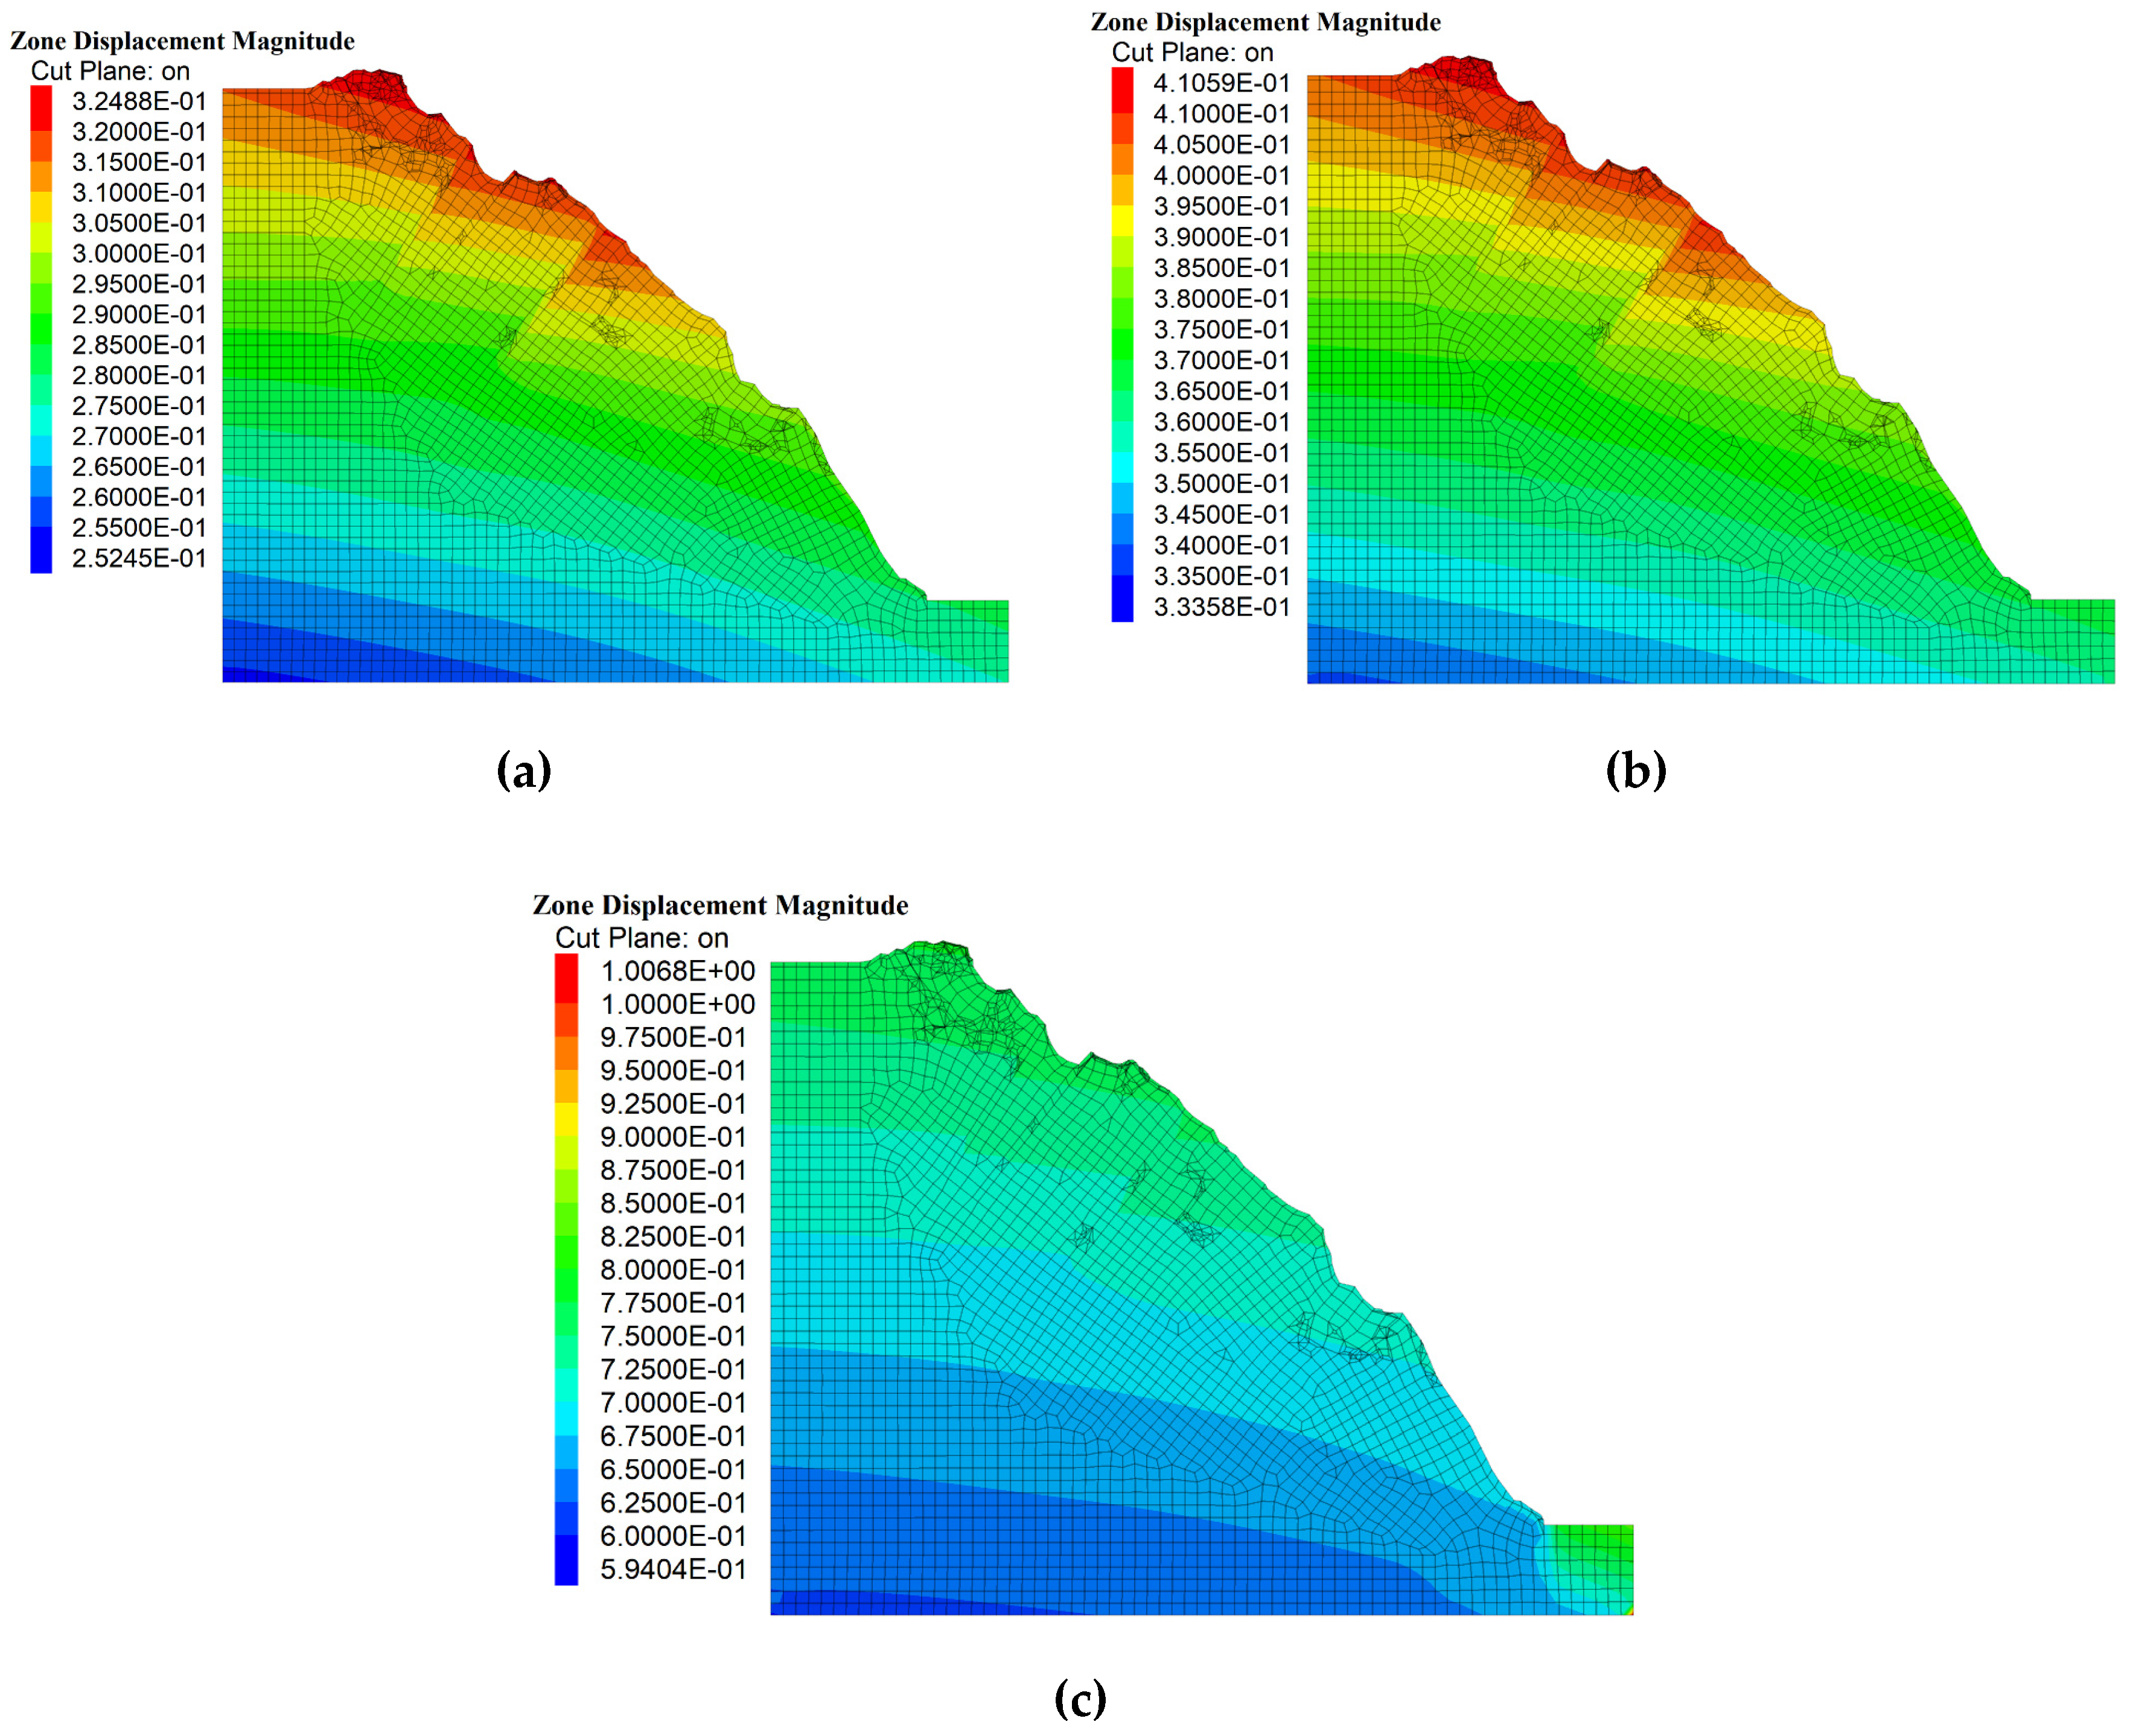
Through
Figure 9 (b) and
Figure 12, it can be seen that there is a significant difference in the displacement contour of the slope under natural and seismic conditions. This phenomenon may be related to the propagation characteristics of seismic waves, rock material properties, and terrain features. During the earthquake process, seismic waves propagate from bottom to top, causing the redistribution of internal stress and displacement in the slope. The initial stage of displacement shows significant fluctuations and gradually increases. As the seismic activity proceeds, the displacement changes gradually slow down and slowly reach a steady state, forming a permanent displacement. The permanent displacement still exists after the earthquake ends and shows significant differences from the displacement field under the non-earthquake condition. Characteristics of slope materials, such as the shear modulus and the damping ratio, will change. Terrain features may cause amplification effects of seismic waves, which will also affect the distribution of the displacement field.
With the increase of the amplitude, the overall displacement of the slope shows an increasing trend: amplitude 0.3g > amplitude 0.1g > amplitude 0.05g > natural working condition. The distribution of permanent displacement is in a step-like pattern, mainly distributed on the shoulder, top, and shallow part of the slope, while the displacement response in the middle and lower part of the slope is relatively small. The maximum displacement occurs at the top of the slope, indicating that earthquakes have the greatest impact on the upper-middle part, which is often the starting point for cumulative earthquake damage and crack development. After multiple earthquakes, the slope has experienced accumulated damage on the surface and inside the slope. If there are further adverse external factors in the future, it may lead to large-scale landslides and destruction.
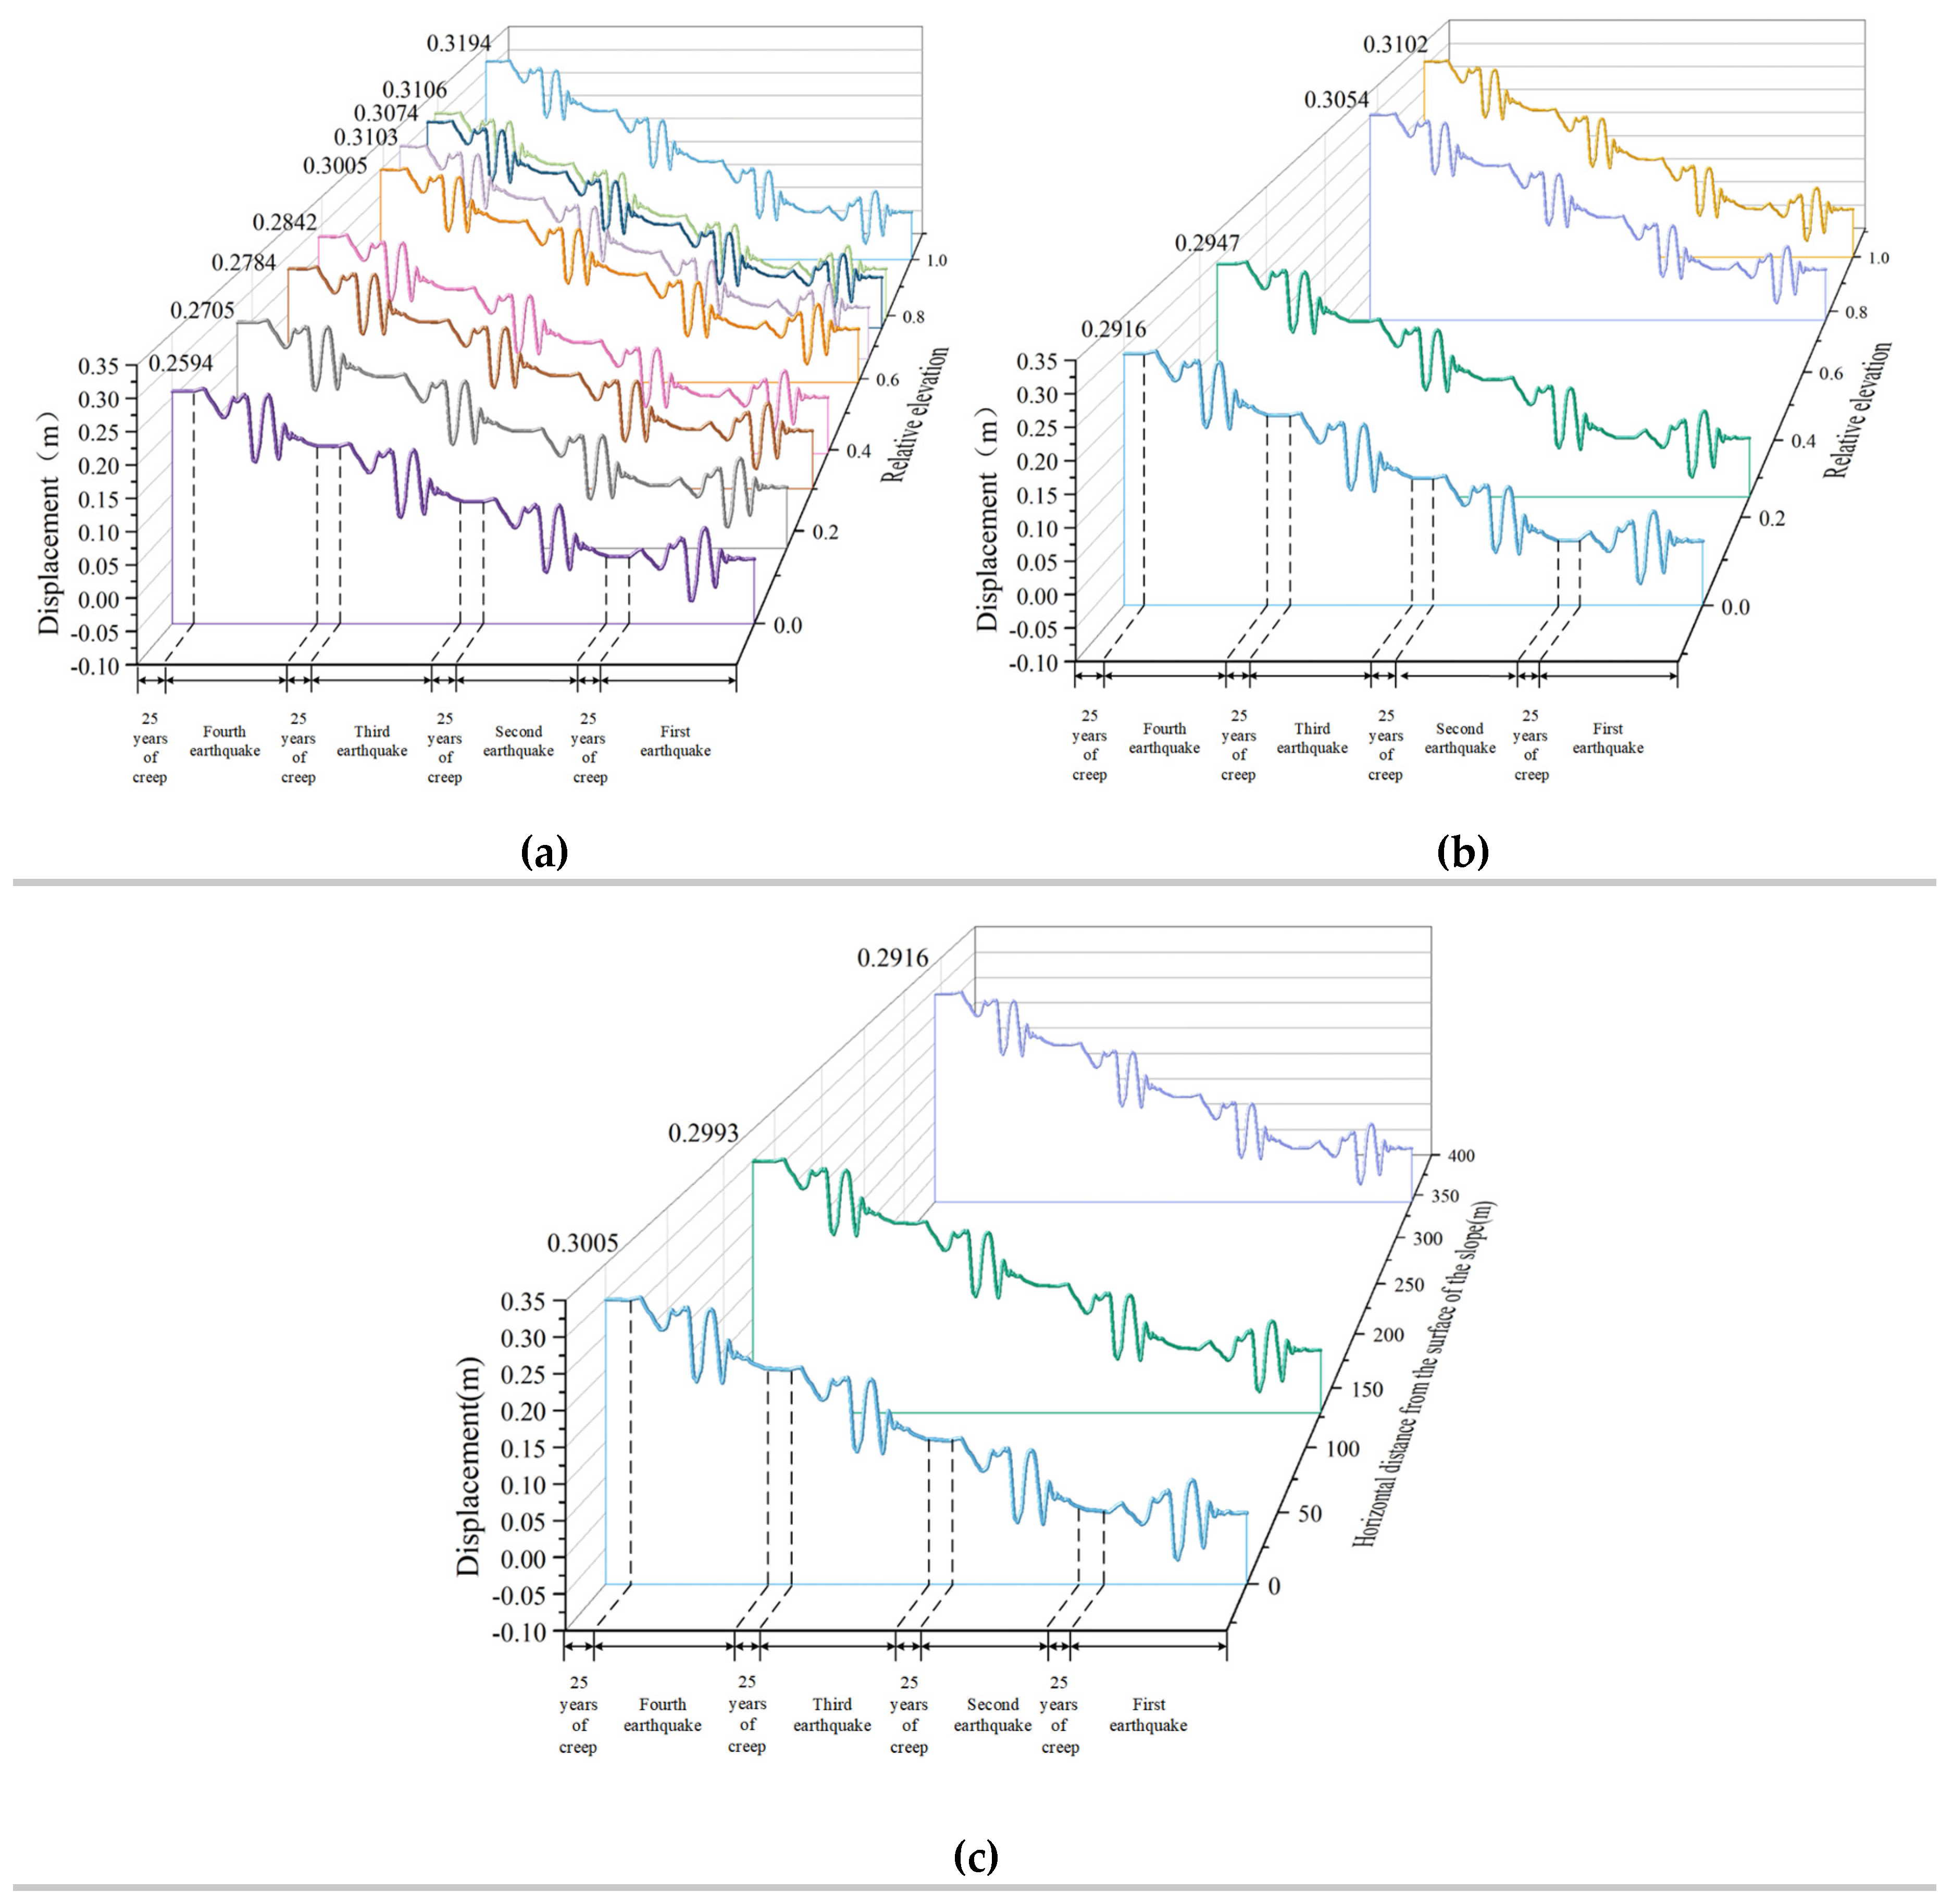
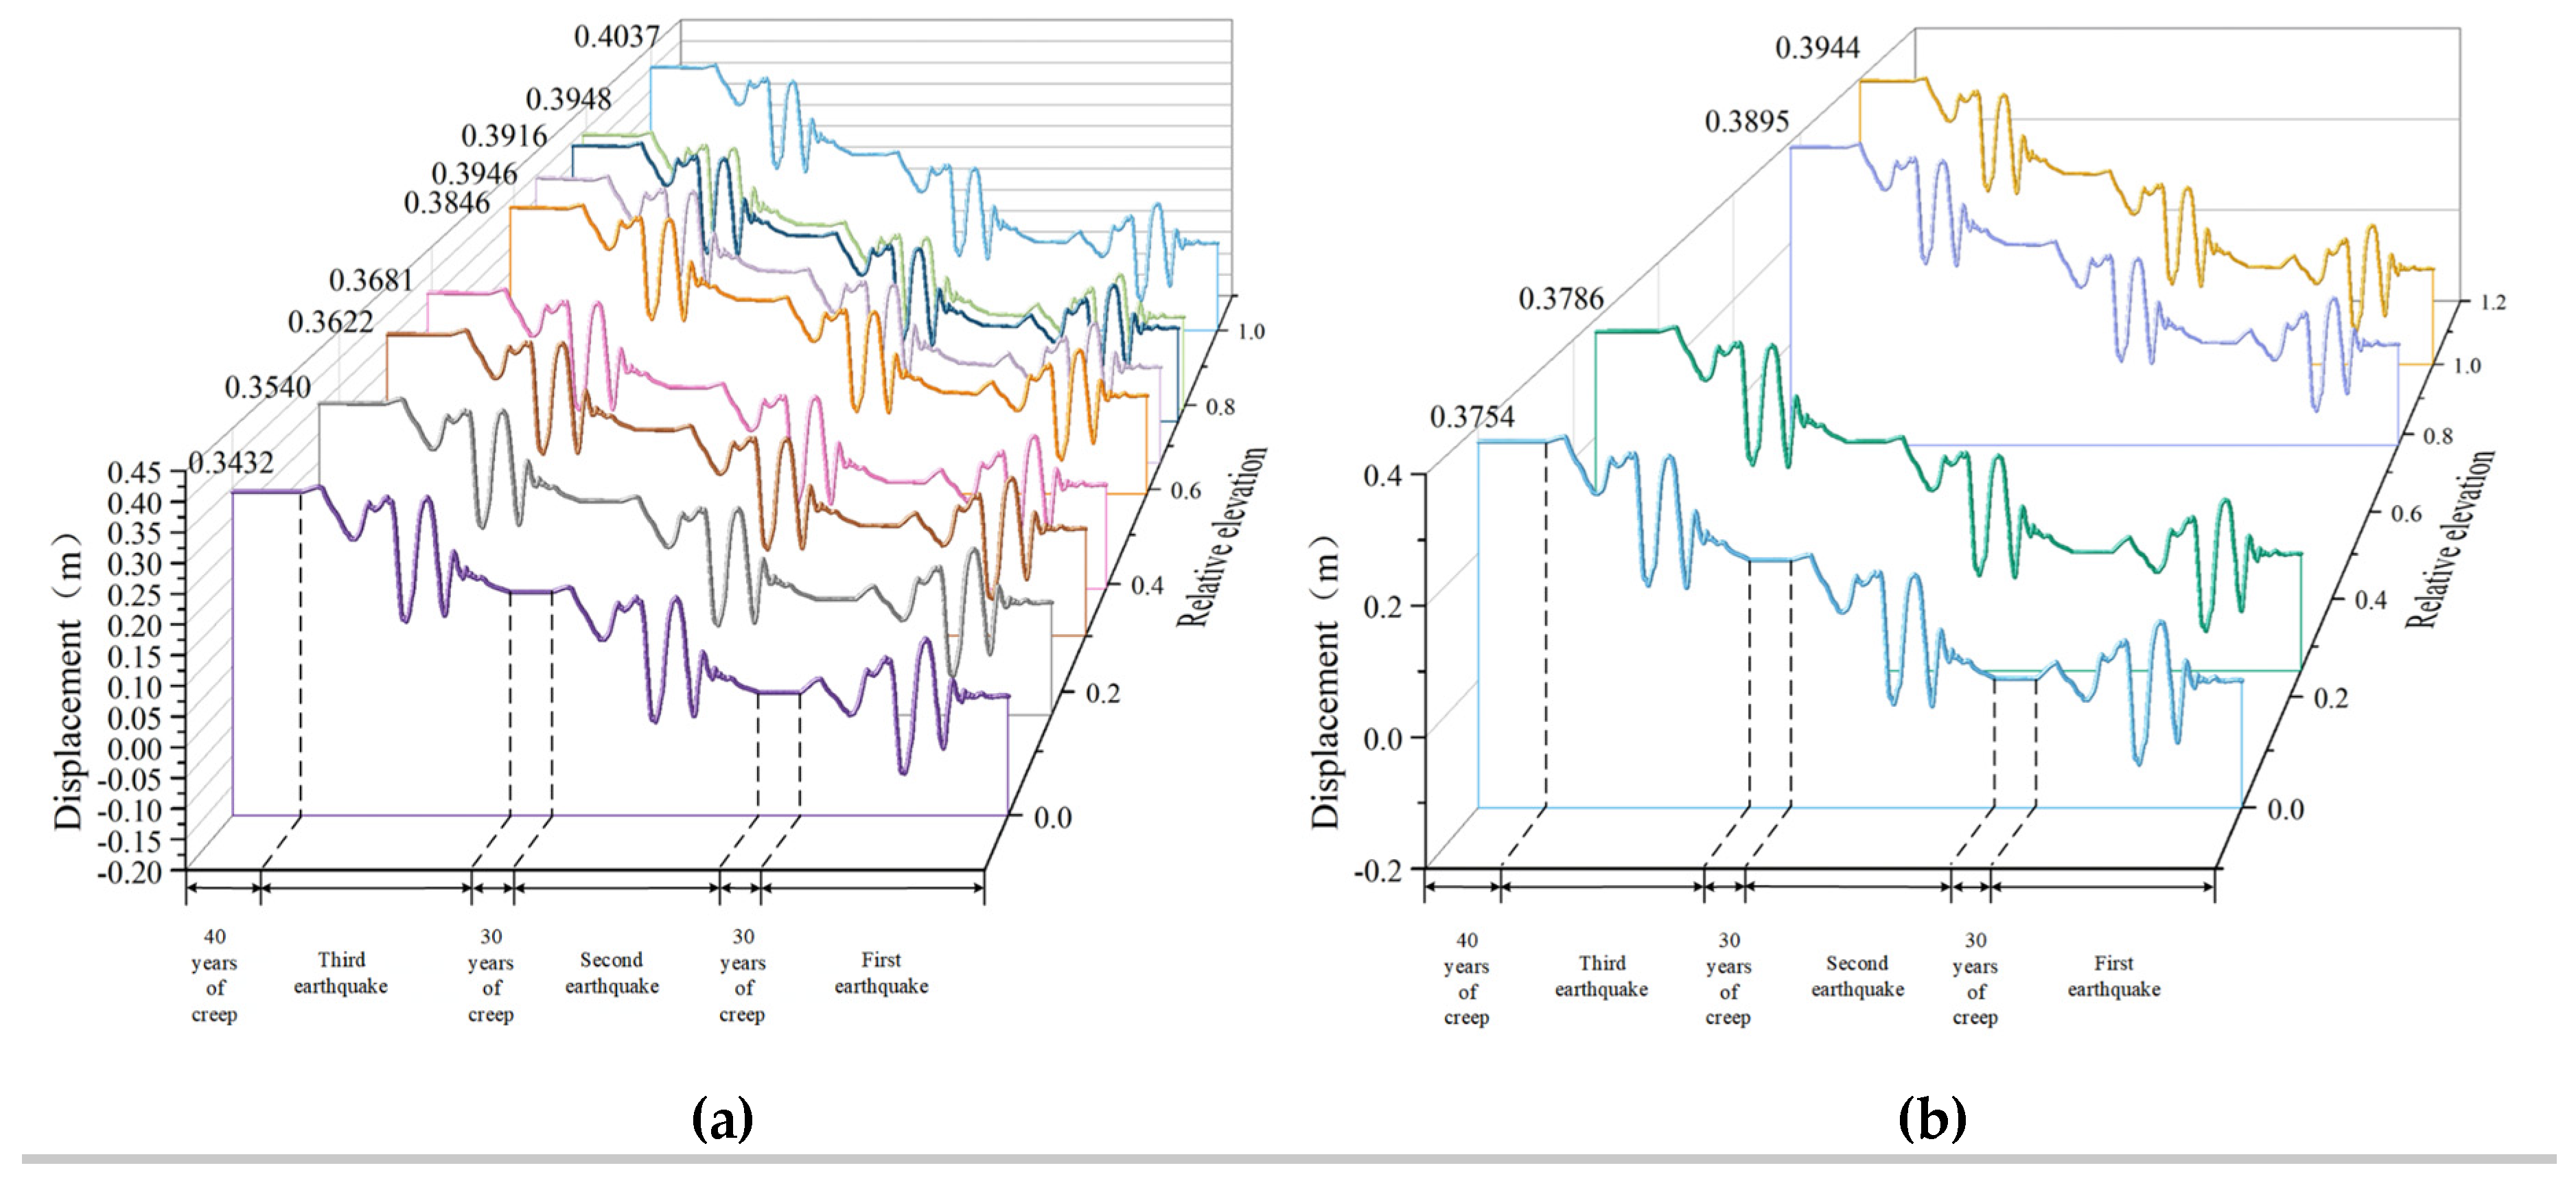
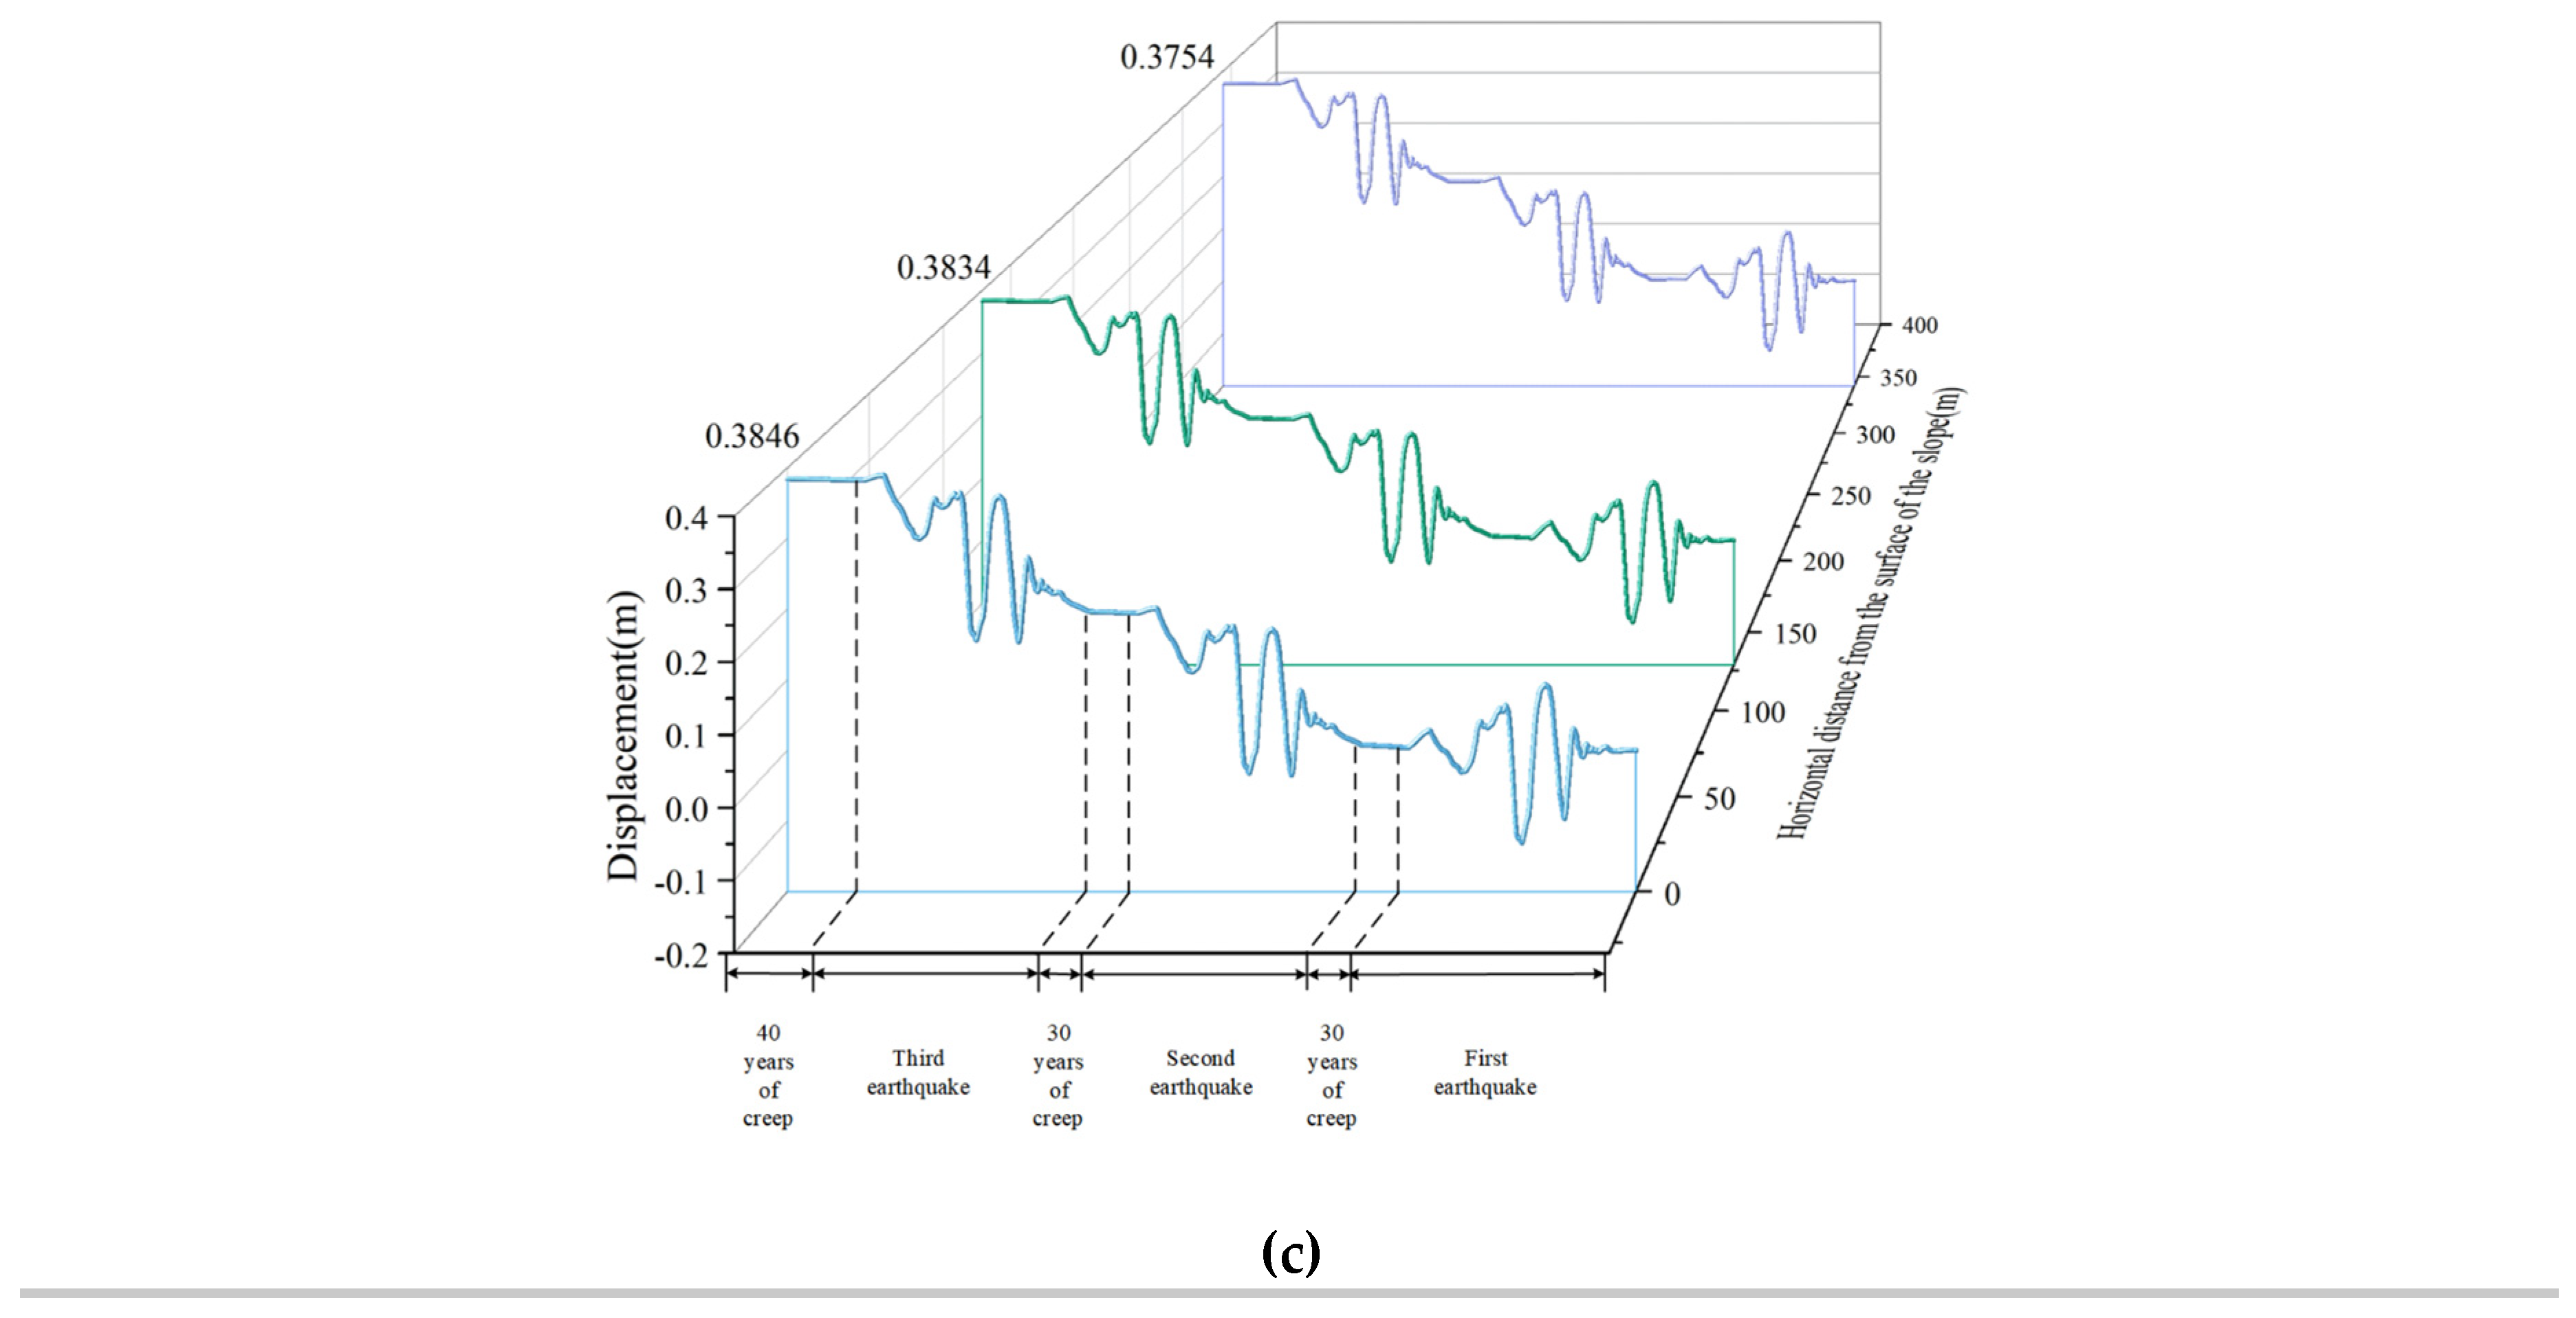
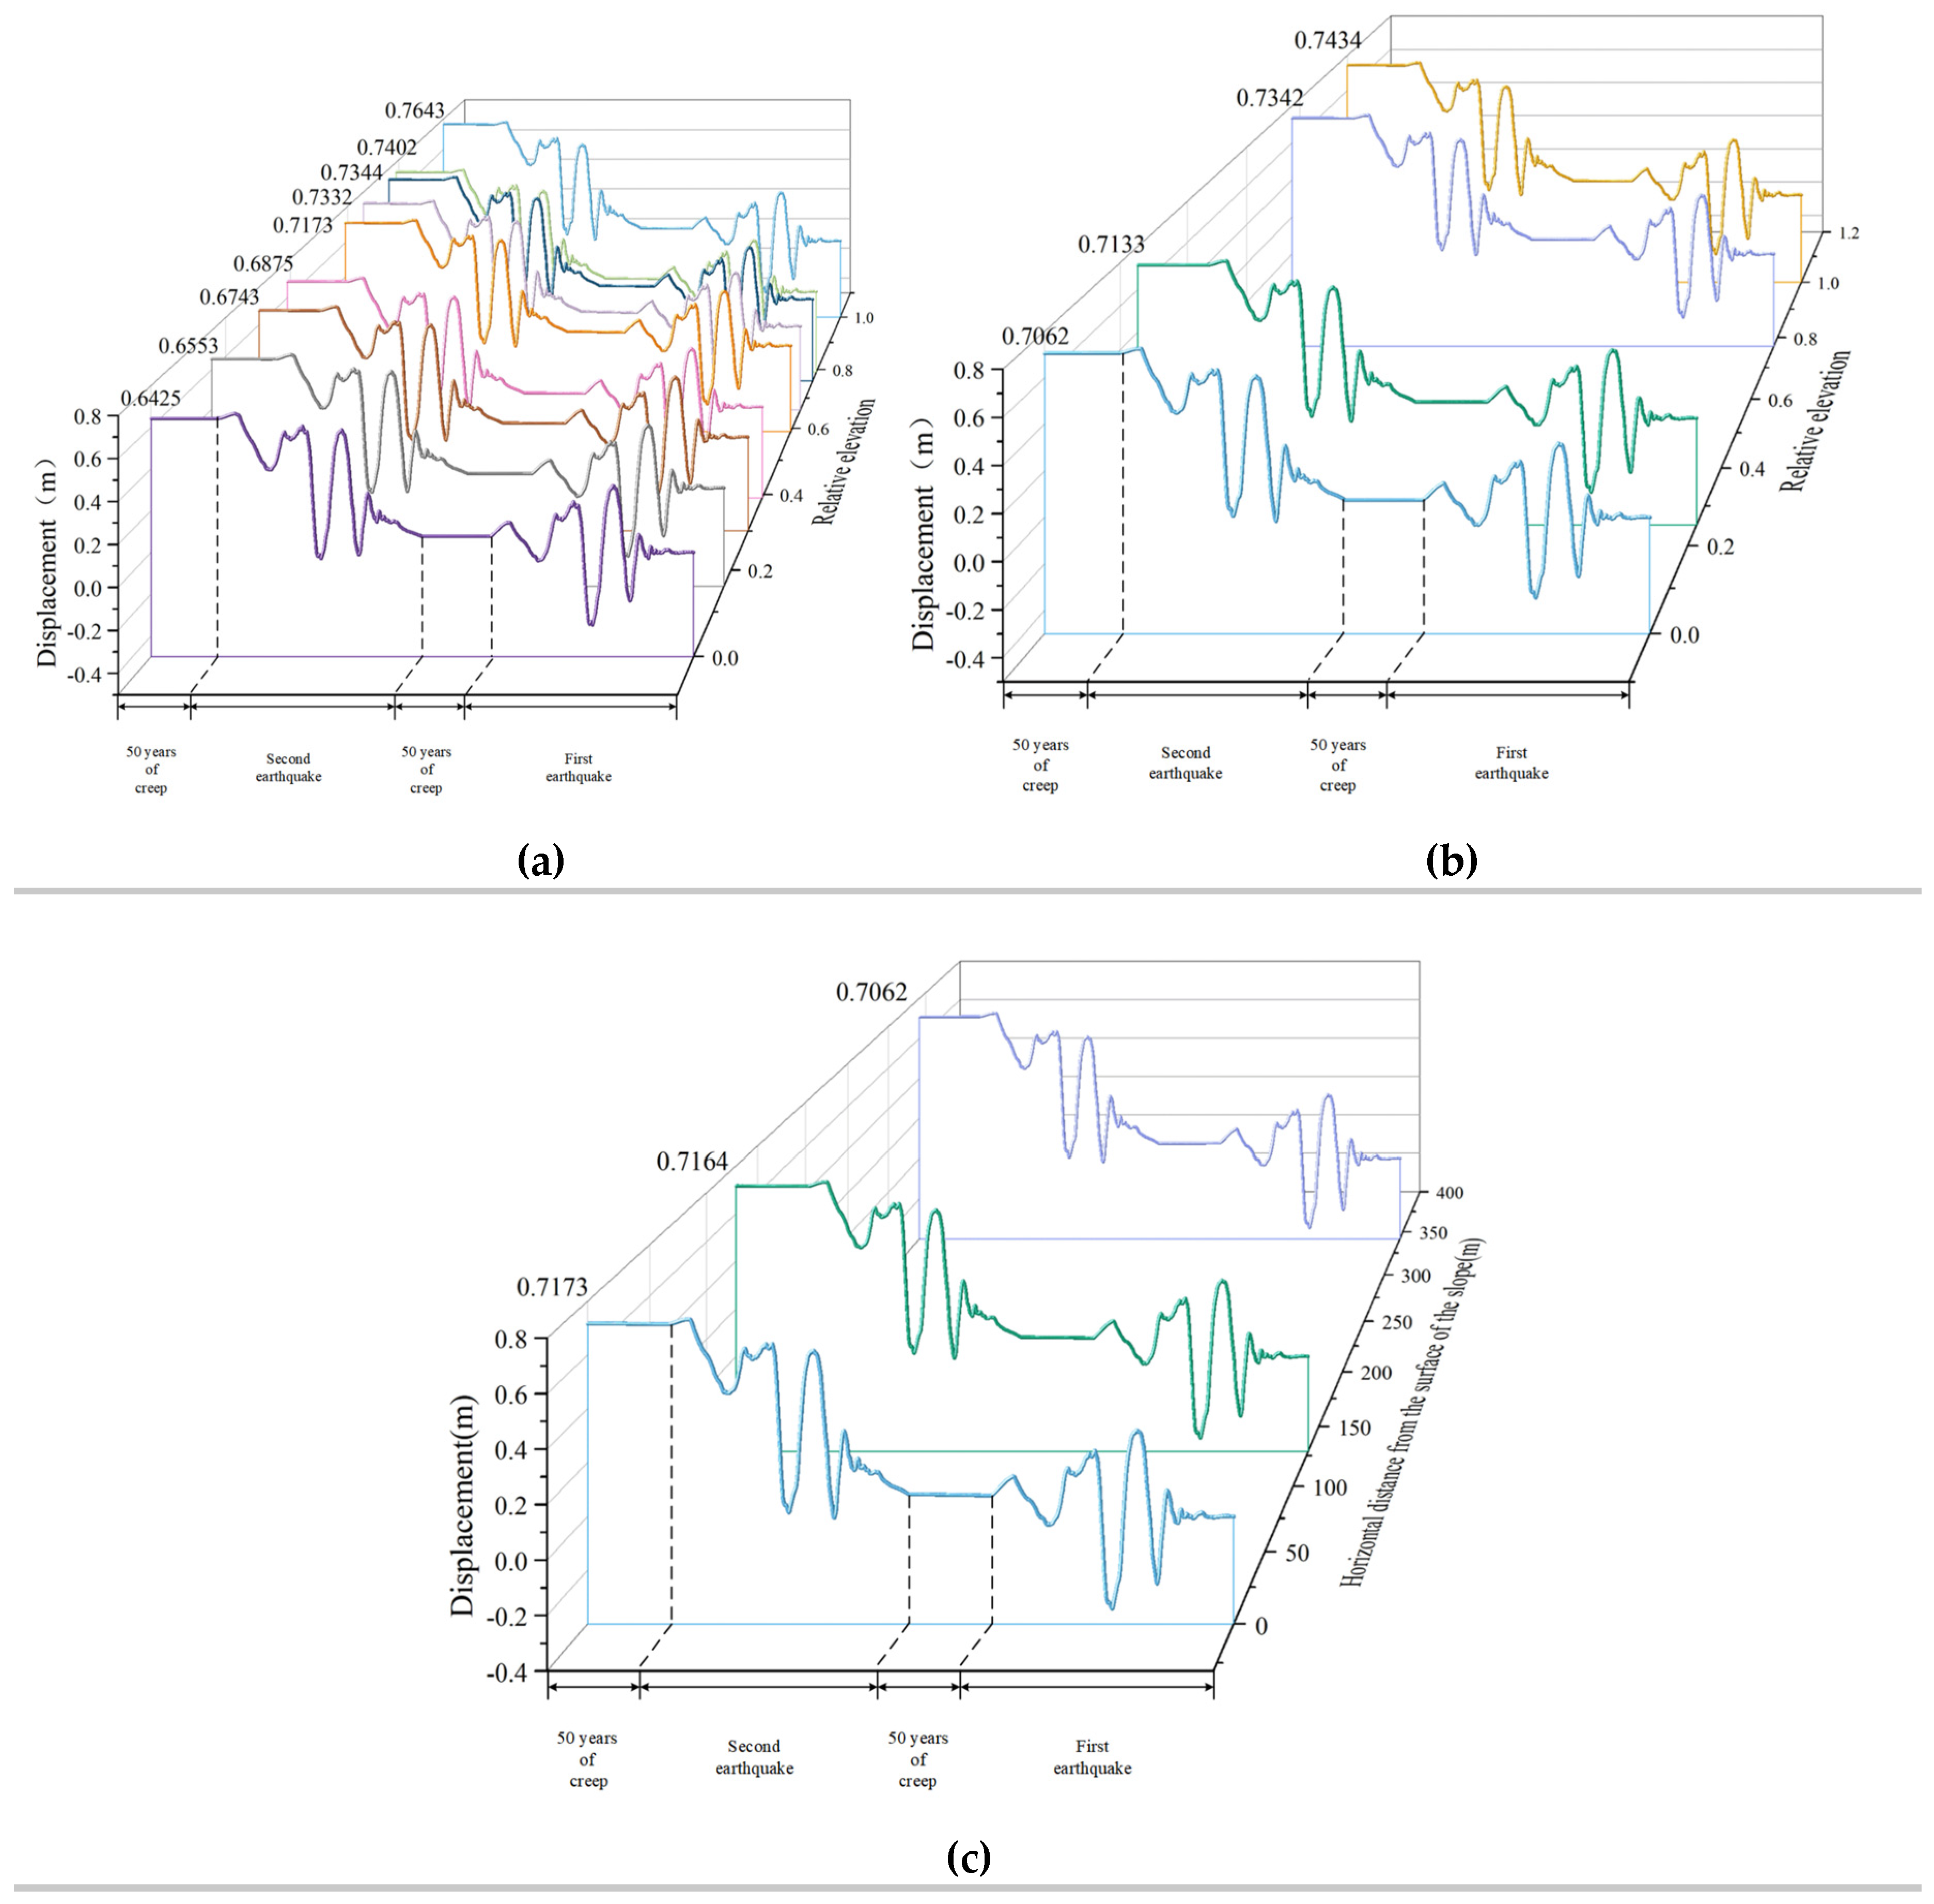
To further investigate the response law of slope displacement under seismic loading, nine monitoring points at different elevations in the vertical direction of the slope surface (P6-P14), four monitoring points at different relative elevations in the vertical direction of the slope (P1-P14), and three monitoring points at the same elevation in the horizontal direction of the slope (P1, P5, P10) are selected.
As shown in
Figure 13,
Figure 14 and
Figure 15, with the continuous effects of earthquakes and creep, the displacement of the slope shows a continuously increasing trend, exhibiting a certain rhythm. With the increase of amplitudes of seismic waves, the influence of seismic waves gradually increases, and the deformation increases. Each monitoring point displacement is positive which indicates that the slope as a whole is moving outward.
From
Figure 13 (a) and
Figure 14 (a), at the amplitude of 0.05g and 0.1g, along the vertical direction of the slope, with the increase of height, the displacement first increases, decreases slightly at monitoring point p8 and then increases again, reaching the maximum value at the top of the slope. From
Figure 15 (a), at the amplitude of 0.3g, the displacement continues to increase with the increase of height and reaches its maximum value at the top of the slope. Regardless of the amplitude, the slope displacement exhibits a significant elevation effect. Combining with
Figure 11(a), the maximum principal stress value at the top of the slope is smallest and the shear strength is lower which lead to the maximum displacement at the top of the slope.
From
Figure 13 (b),
Figure 14 (b) and
Figure 15 (b), at three amplitudes, the displacement of cataclastic rocks shows an increasing trend with the increase of elevations. Regardless of whether it’s the monitoring point inside the slope or on the slope surface, there is a clear elevation effect. Combining with
Figure 11(b), the displacement value is maximum at the point where the elevation is maximum. The monitoring point is close to the edge of the slope, where the stress release effect is more significant. Therefore, the corresponding maximum principal stress is the smallest.
From
Figure 13 (c),
Figure 14 (c) and
Figure 15 (c), at three amplitudes, as the horizontal distance from the slope surface decreases, displacement gradually increases. The displacement value at the monitoring point on the slope's free face reaches its maximum, exhibiting a clear trend towards the slope. Combining with
Figure 11(c), the displacement near the free face of the slope reaches the maximum. Because there is a stress relief effect at the critical surface. It’s consistent with the pattern of vertical monitoring points on the slope surface and inside the slope.
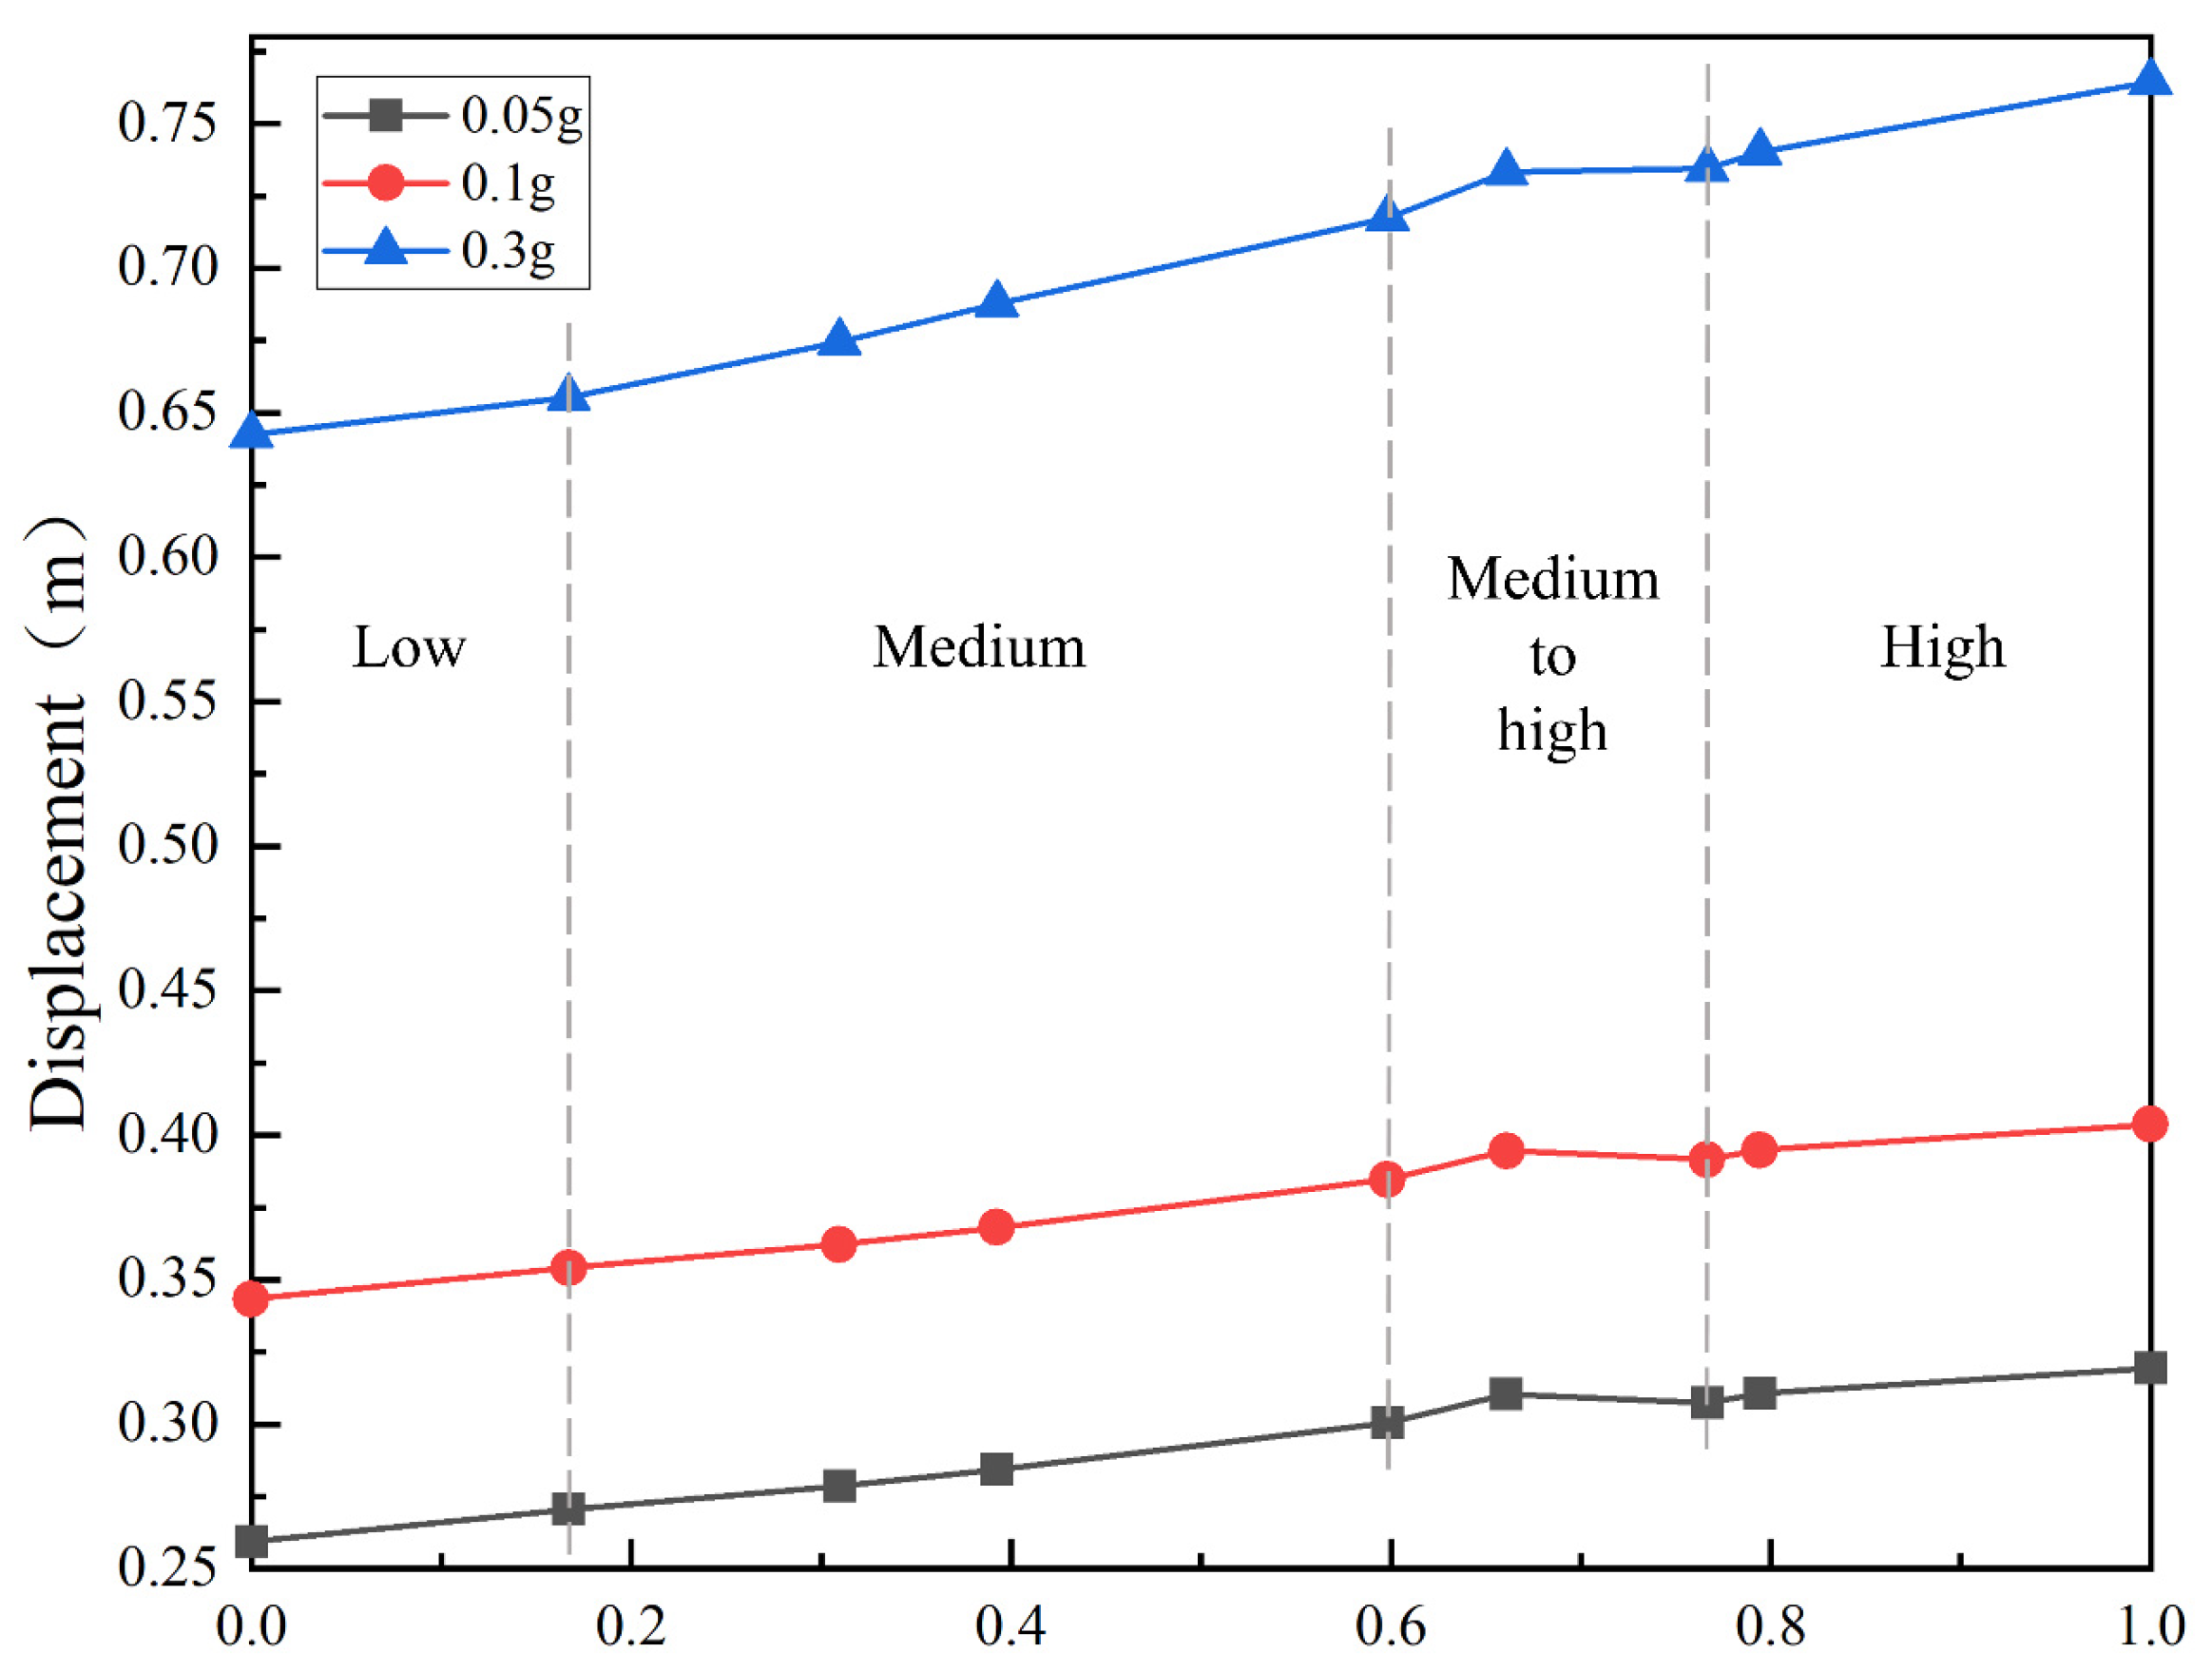
From
Figure 16, by observing the slope of the displacement change curve, it can be concluded that in the region of relative elevation 0-0.16, the displacement change is not significant; in the region of relative elevation 0.16-0.59, the displacement in the middle of the slope increases rapidly; in the region of relative elevation 0.59-0.76, the increase of the displacement slows down; in the region of relative elevation 0.76-1, the rate of the increase of the displacement increases. It suggests that the earthquake has a greater impact on the central and the top region of the slope. The rate of increase of the folded line corresponding to the amplitude of 0.3 is faster and the curves corresponding to the other two amplitudes have relatively slower increases. Therefore, when the magnitude is larger, the seismic effect on the slope is more significant.
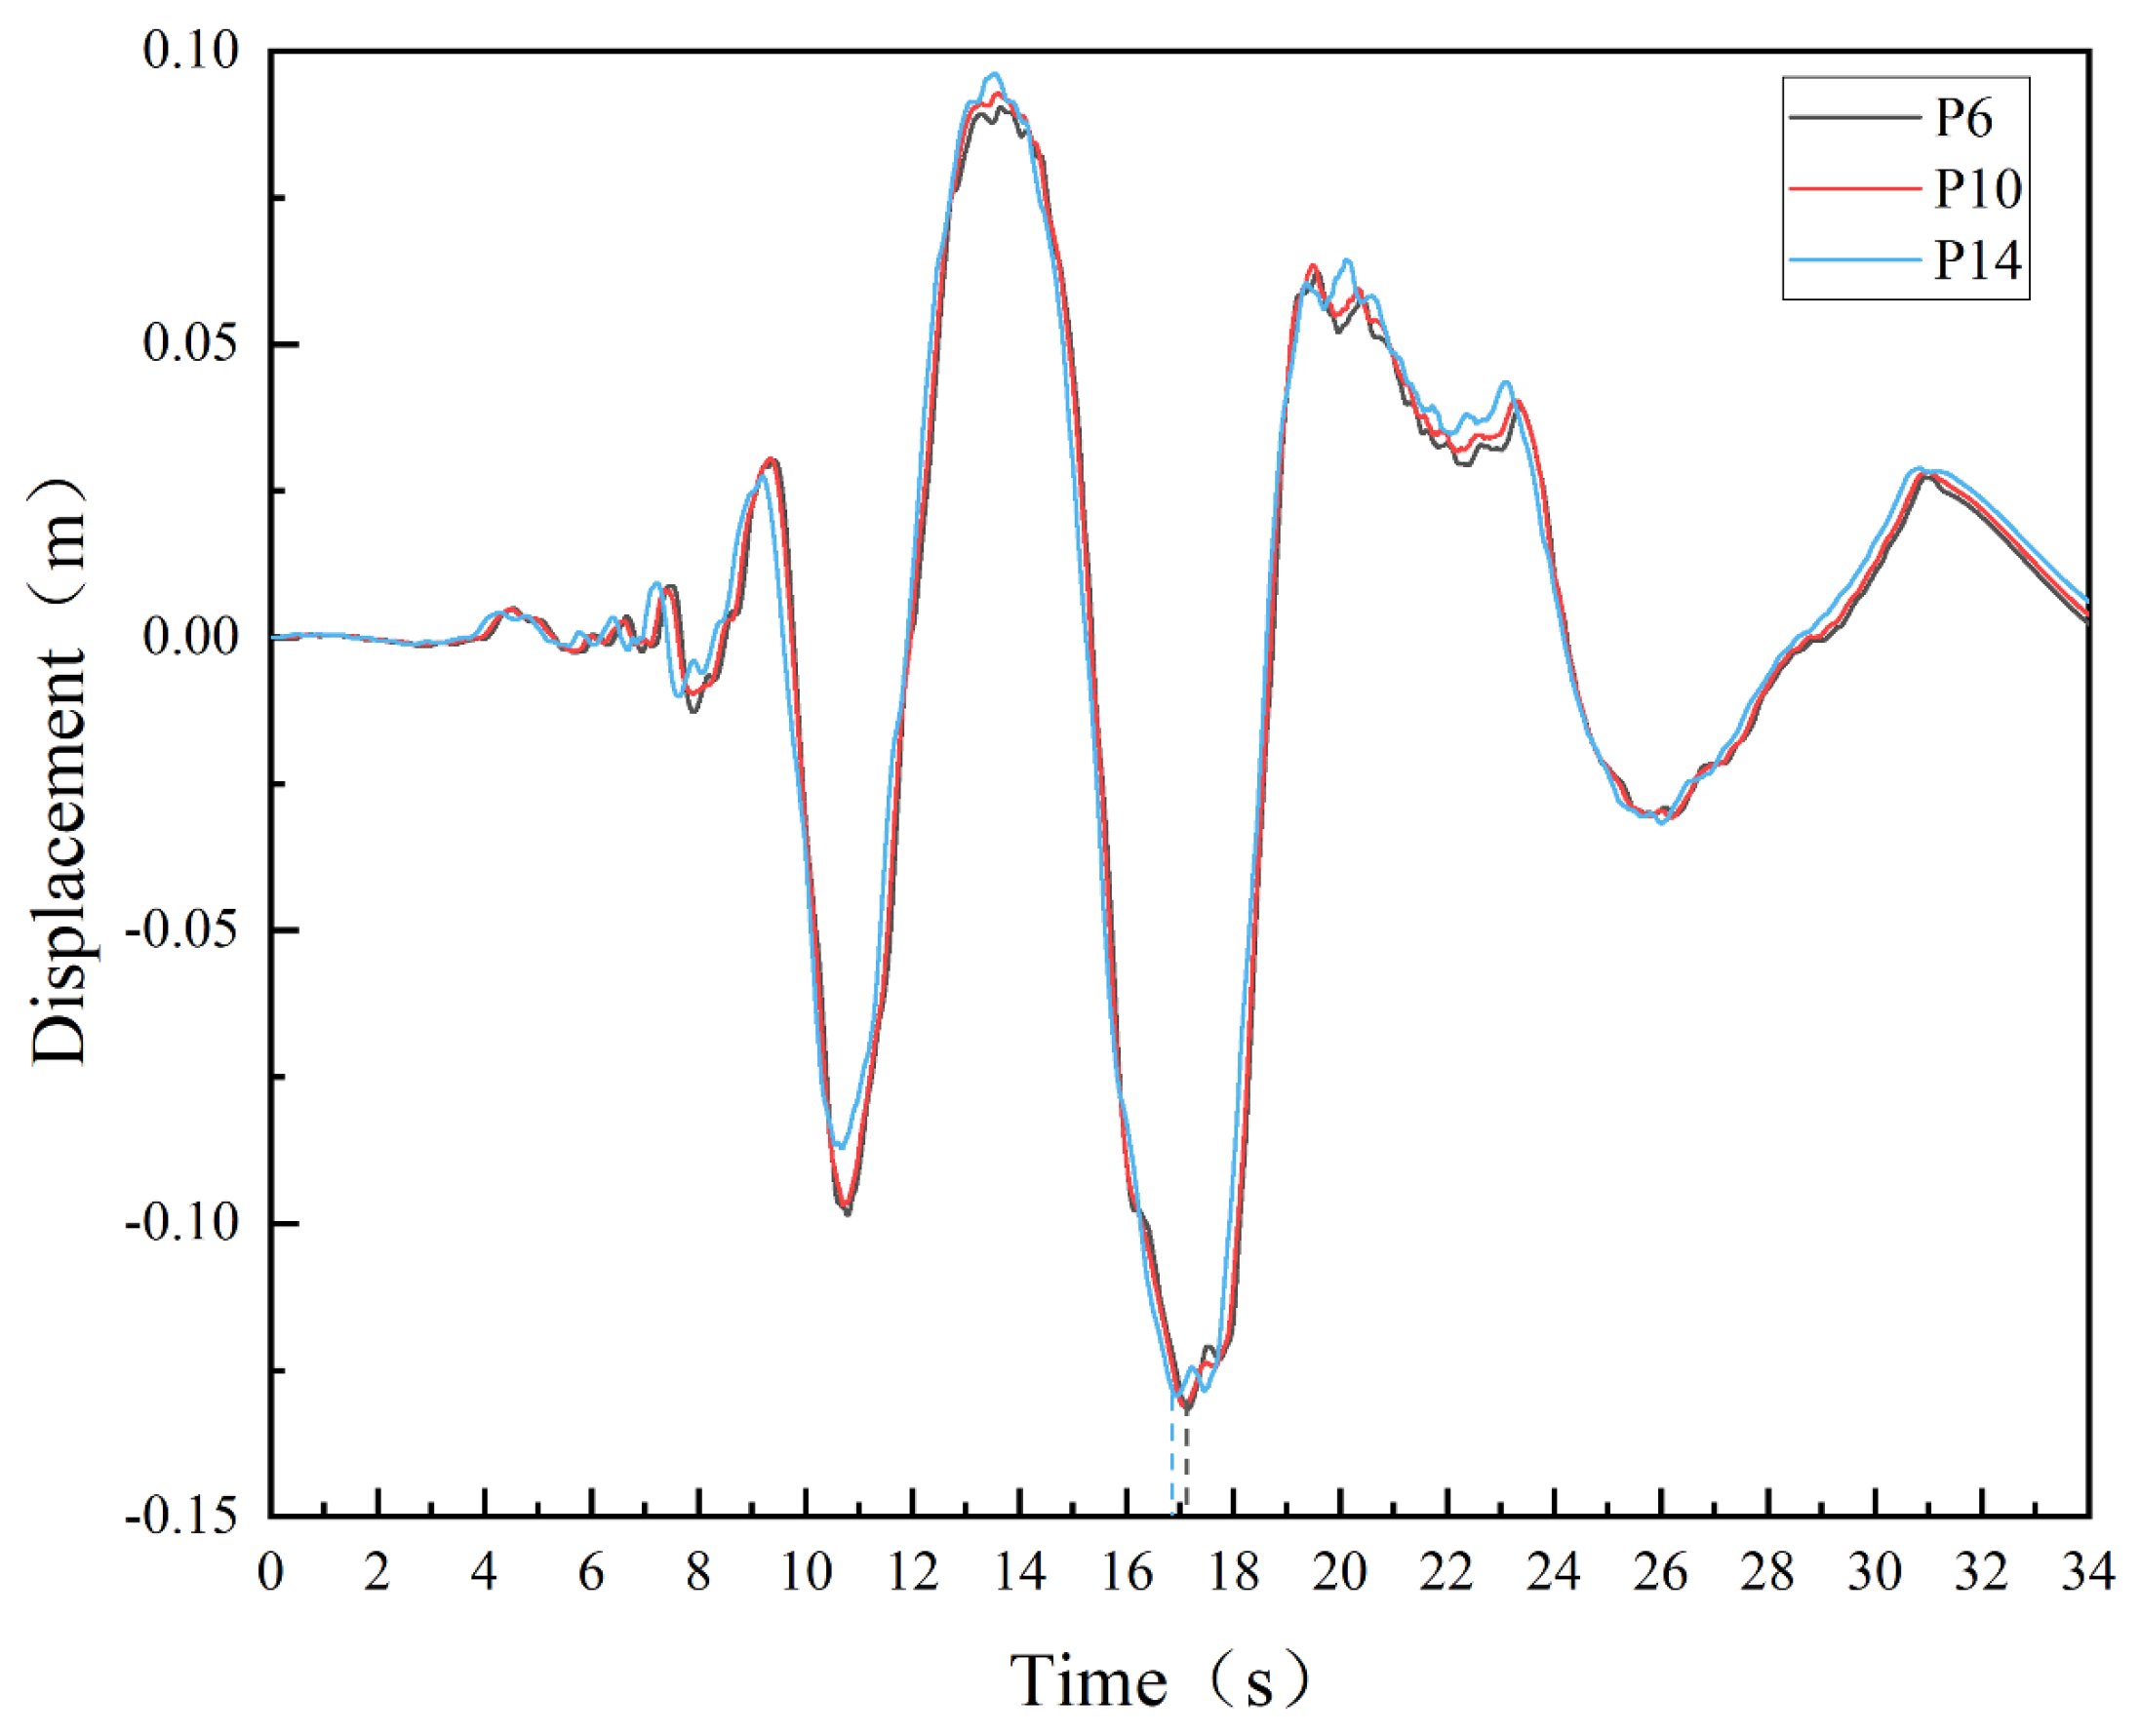
From
Figure 17, as the seismic wave is transmitted, the displacement of each node will oscillate. The displacement waveforms of three monitoring points are consistent and the peak displacement appears close to each other. The moment of peak displacement in the horizontal direction is very close to the moment of peak acceleration of the input horizontal seismic wave. The monitoring point at the top of the slope (p6) shows a slightly delayed time of the peak displacement compared to the peak displacement at the foot of the slope. The process of seismic wave propagation exhibits a delayed effect due to the inertia. The greater the height of the slope is, the more pronounced the delayed effect becomes, and we need to consider the deformation differences of the slope more.
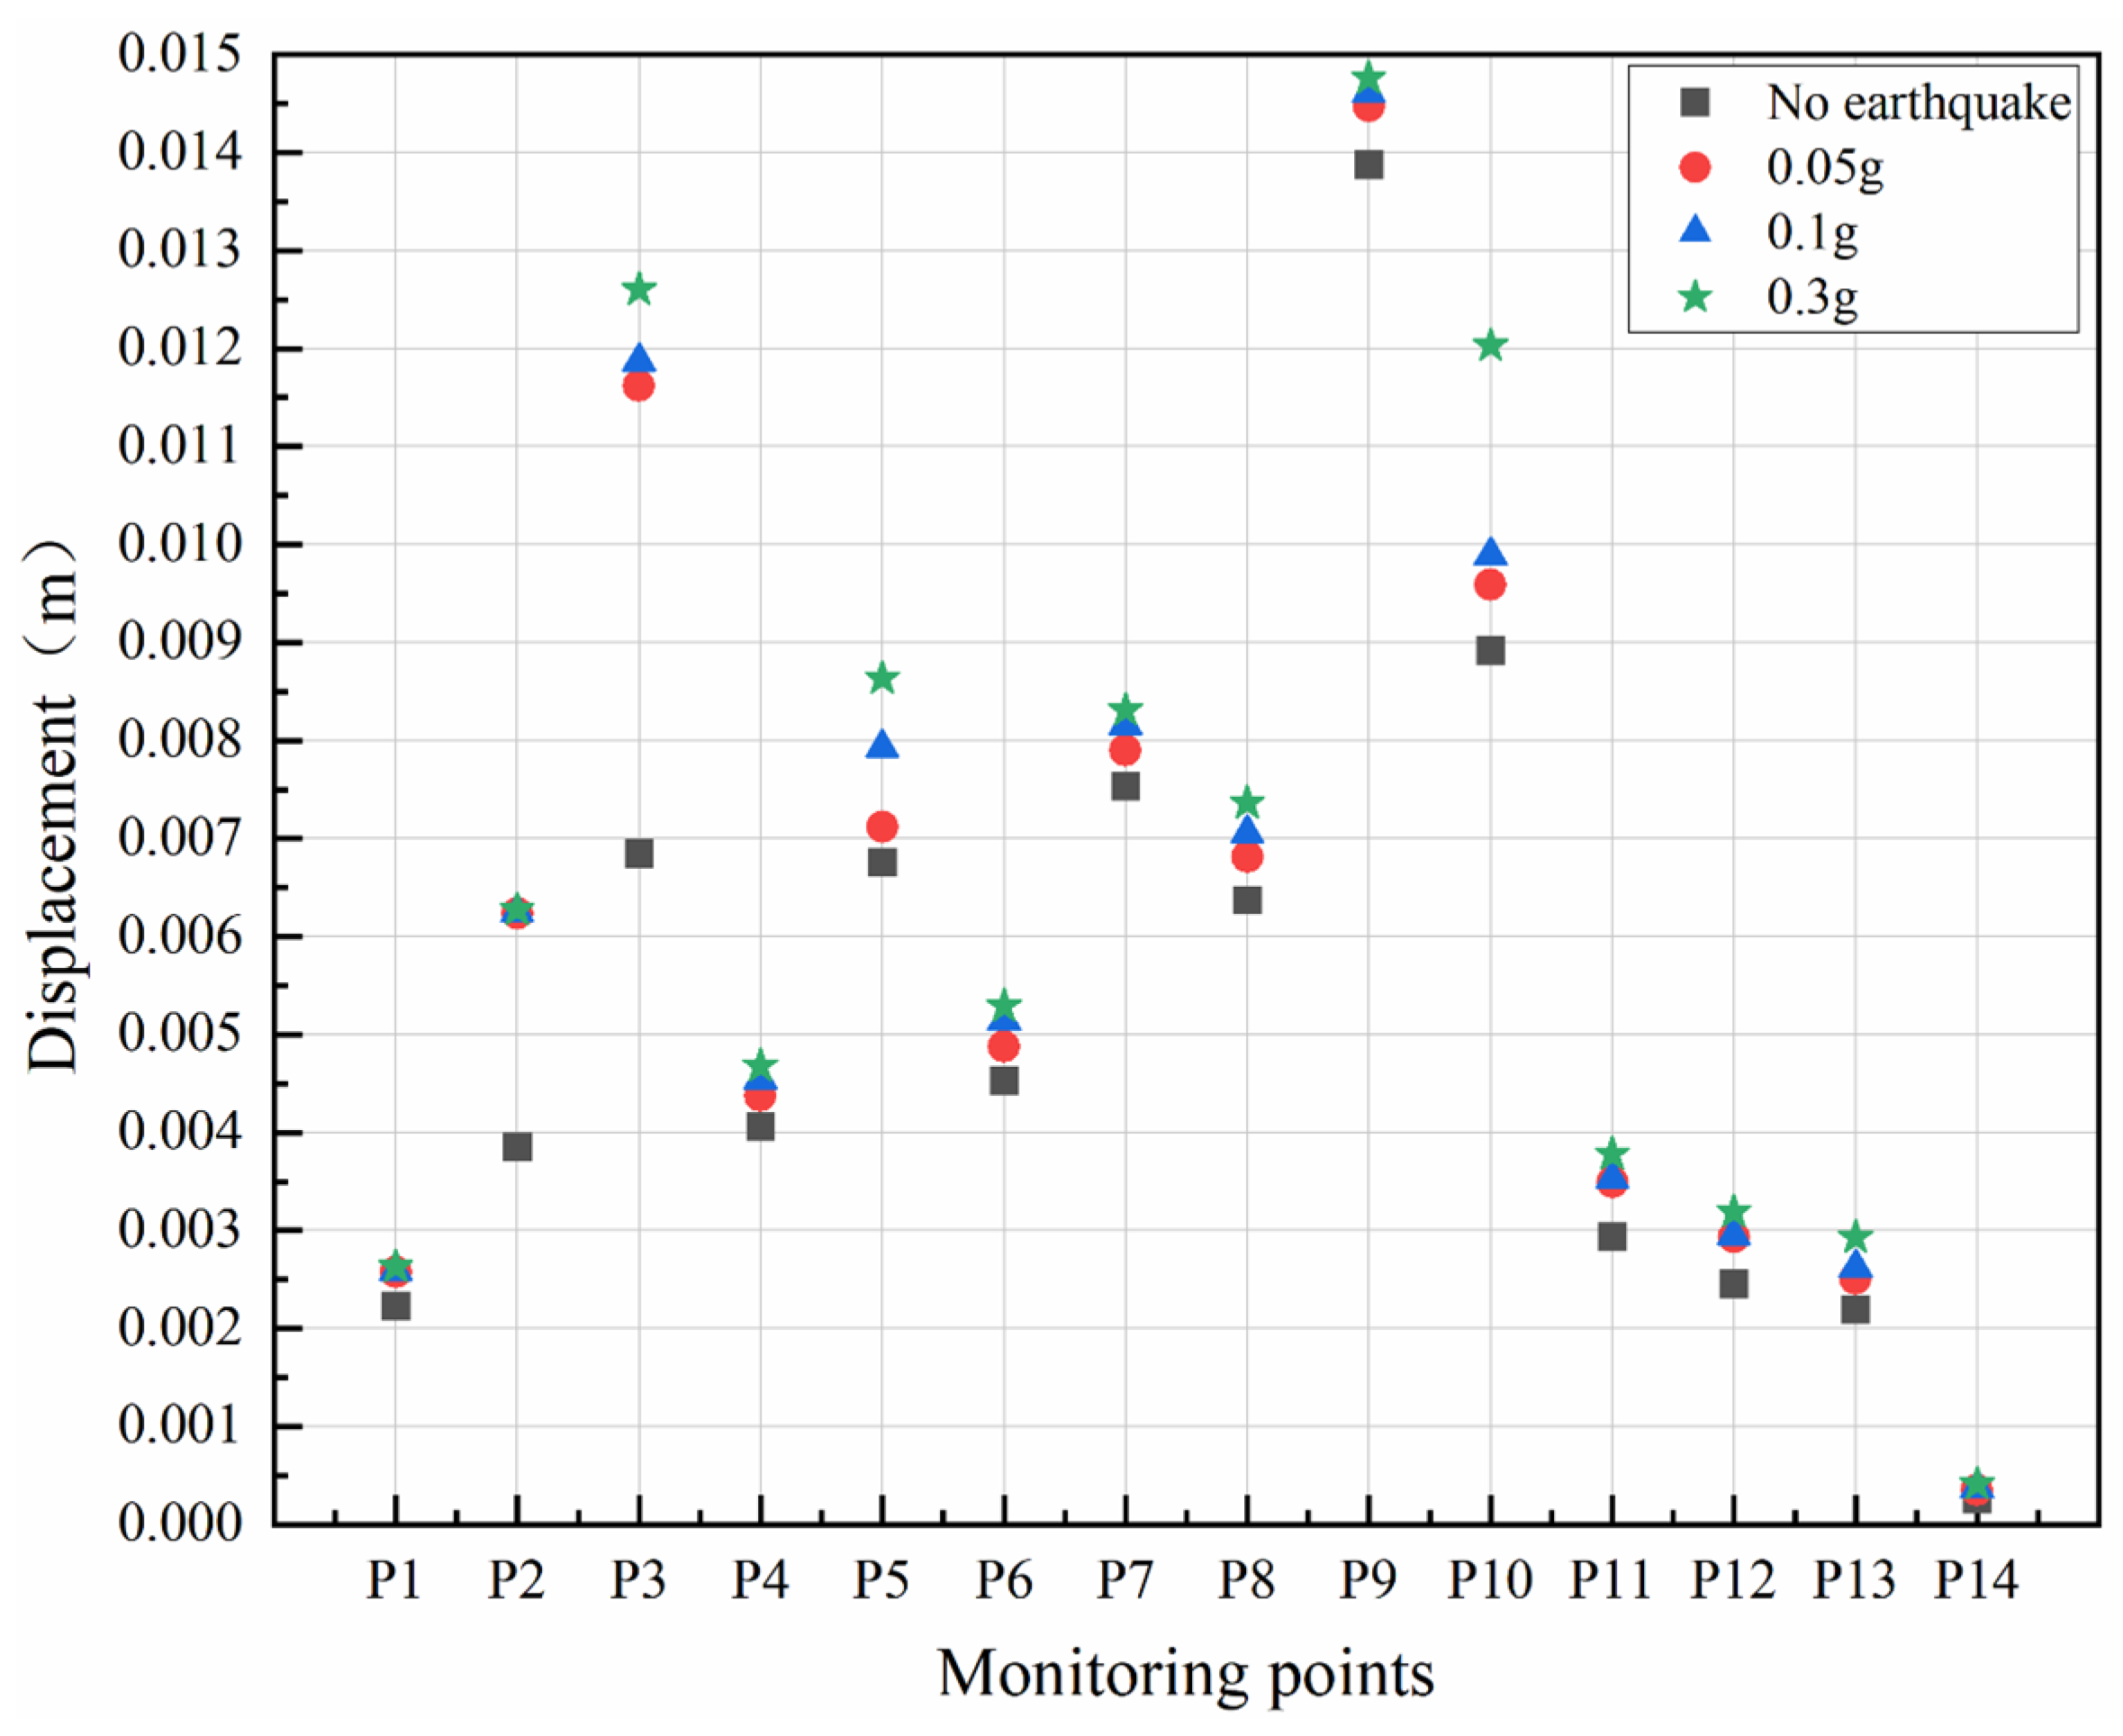
To investigate the effect of seismic actions on creep, the comparison of 100-year creep displacement under the natural working condition and earthquakes of different amplitudes is conducted (
Figure 18). The 100-year creep displacement ranks as follows: amplitude 0.3 g > Amplitude 0.1 g > amplitude 0.05 g > natural working condition. It shows that the earthquake will promote the development of creep. With the increase of the amplitude, creep displacement shows an increasing trend. For the monitoring points on the slope surface, the creep displacement in the middle of the slope is larger than that in the top and bottom of the slope. For the monitoring points in the slope, the creep displacement of the middle and upper region is larger than that of other regions. This indicates that the earthquake had the greatest impact on the middle of the slope surface, which is consistent with the pattern throughout the end of the seismic and creep cycle.
4.2.3. Dynamic Response of Acceleration
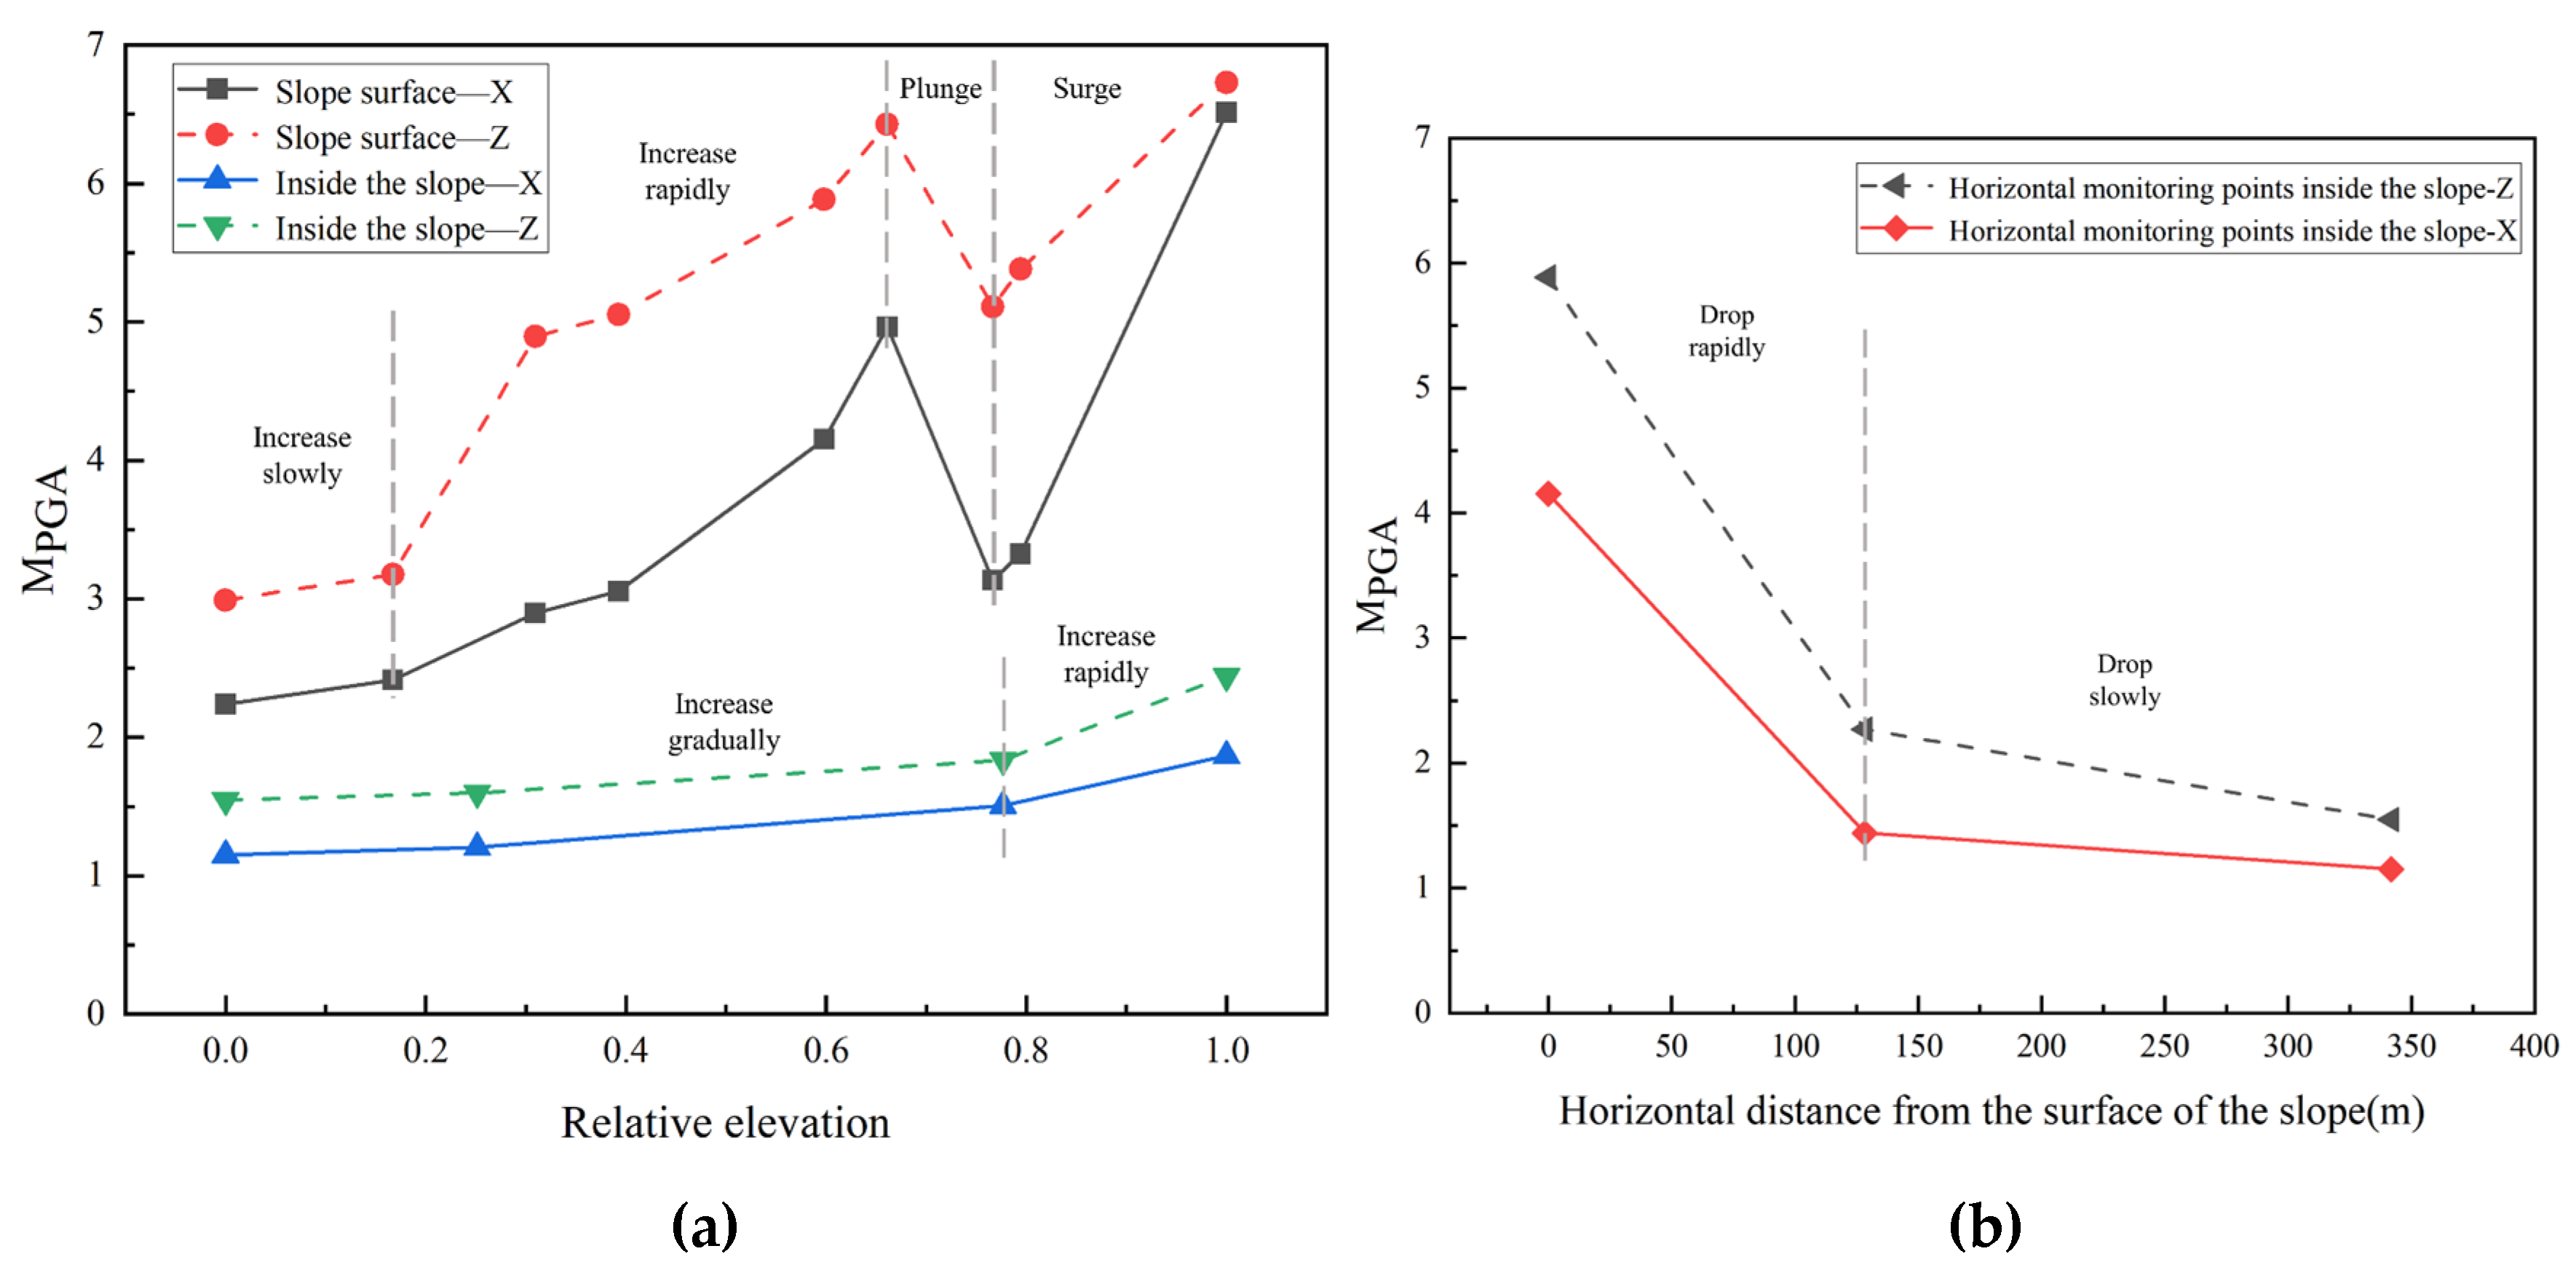
In order to describe the acceleration response law of the slope, the PGA amplification factors (M
PGA) is chosen as the analyzing index which is defined as the ratio of the peak acceleration response of each monitoring point to the peak acceleration of the input seismic wave [
33]. When the amplitude is 0.1g, the M
PGA for monitoring points in the vertical and horizontal directions is shown in
Figure 19.
From
Figure 19, the M
PGA shows obvious amplification with increasing relative elevation in the vertical direction of the slope, and the amplification shows nonlinearity and segmentation at different elevations. When the slope height is less than 1/5, the M
PGA increases slowly at first; from 1/5 to 3/5 of the slope height, the M
PGA increases dramatically; from 3/5 to 4/5 of the slope height, the M
PGA experiences a significant decline. The reason may be the reflection and refraction of the slope and the fractured weak zone, which leads to the energy concentration in this area of the slope; from 4/5 to the top of the slope height, the acceleration is amplified rapidly, reaching a maximum at the top of the slope, where seismic waves are reflected and superimposed many times, making the amplification effect of seismic waves more intense. It is often where the cumulative destruction of earthquakes and the development of fractures begin. The above phenomena show that the acceleration increment in the middle and upper part of the slope is larger and the seismic response is stronger. It can be seen that the influence of earthquakes on the slope is mainly concentrated in the middle and the top of the slope. It’s necessary to strengthen these two parts of the slope, which can reduce the acceleration growth rate. In the horizontal direction of the slope, the M
PGA also shows the nonlinear elevation amplification effect and the overall trend of the folding line is consistent with the vertical direction. However, when the height of the slope is over 4/5, the M
PGA in the horizontal direction increases faster than that in the vertical direction. The effect of earthquake action on the response of horizontal acceleration is more significant here. Observing the vertical monitoring points in the slope, the changes of the M
PGA in horizontal and vertical directions are basically the same. With the increase of relative elevation, the M
PGA reaches the maximum value near the air face where the response is obviously stronger than that near the monitoring point inside the slope, showing a surface-trend effect.
From
Figure 19(b), as the slope surface approaches, the M
PGA increases continuously, the amplification rate becomes larger, and the amplification effect of seismic waves becomes stronger. It shows an obvious tendency to the surface.
Both on the slope surface and in the slope, the M
PGA of the vertical direction is obviously larger than that of the horizontal direction, which is basically consistent with other scholars' research results [
43,
44]. The self-oscillation frequency of the slope is similar to the superior frequency of the vertical input seismic wave. The resonance phenomenon of the slope is triggered, resulting in the acceleration amplification effect in the horizontal direction being smaller than that in the vertical direction.
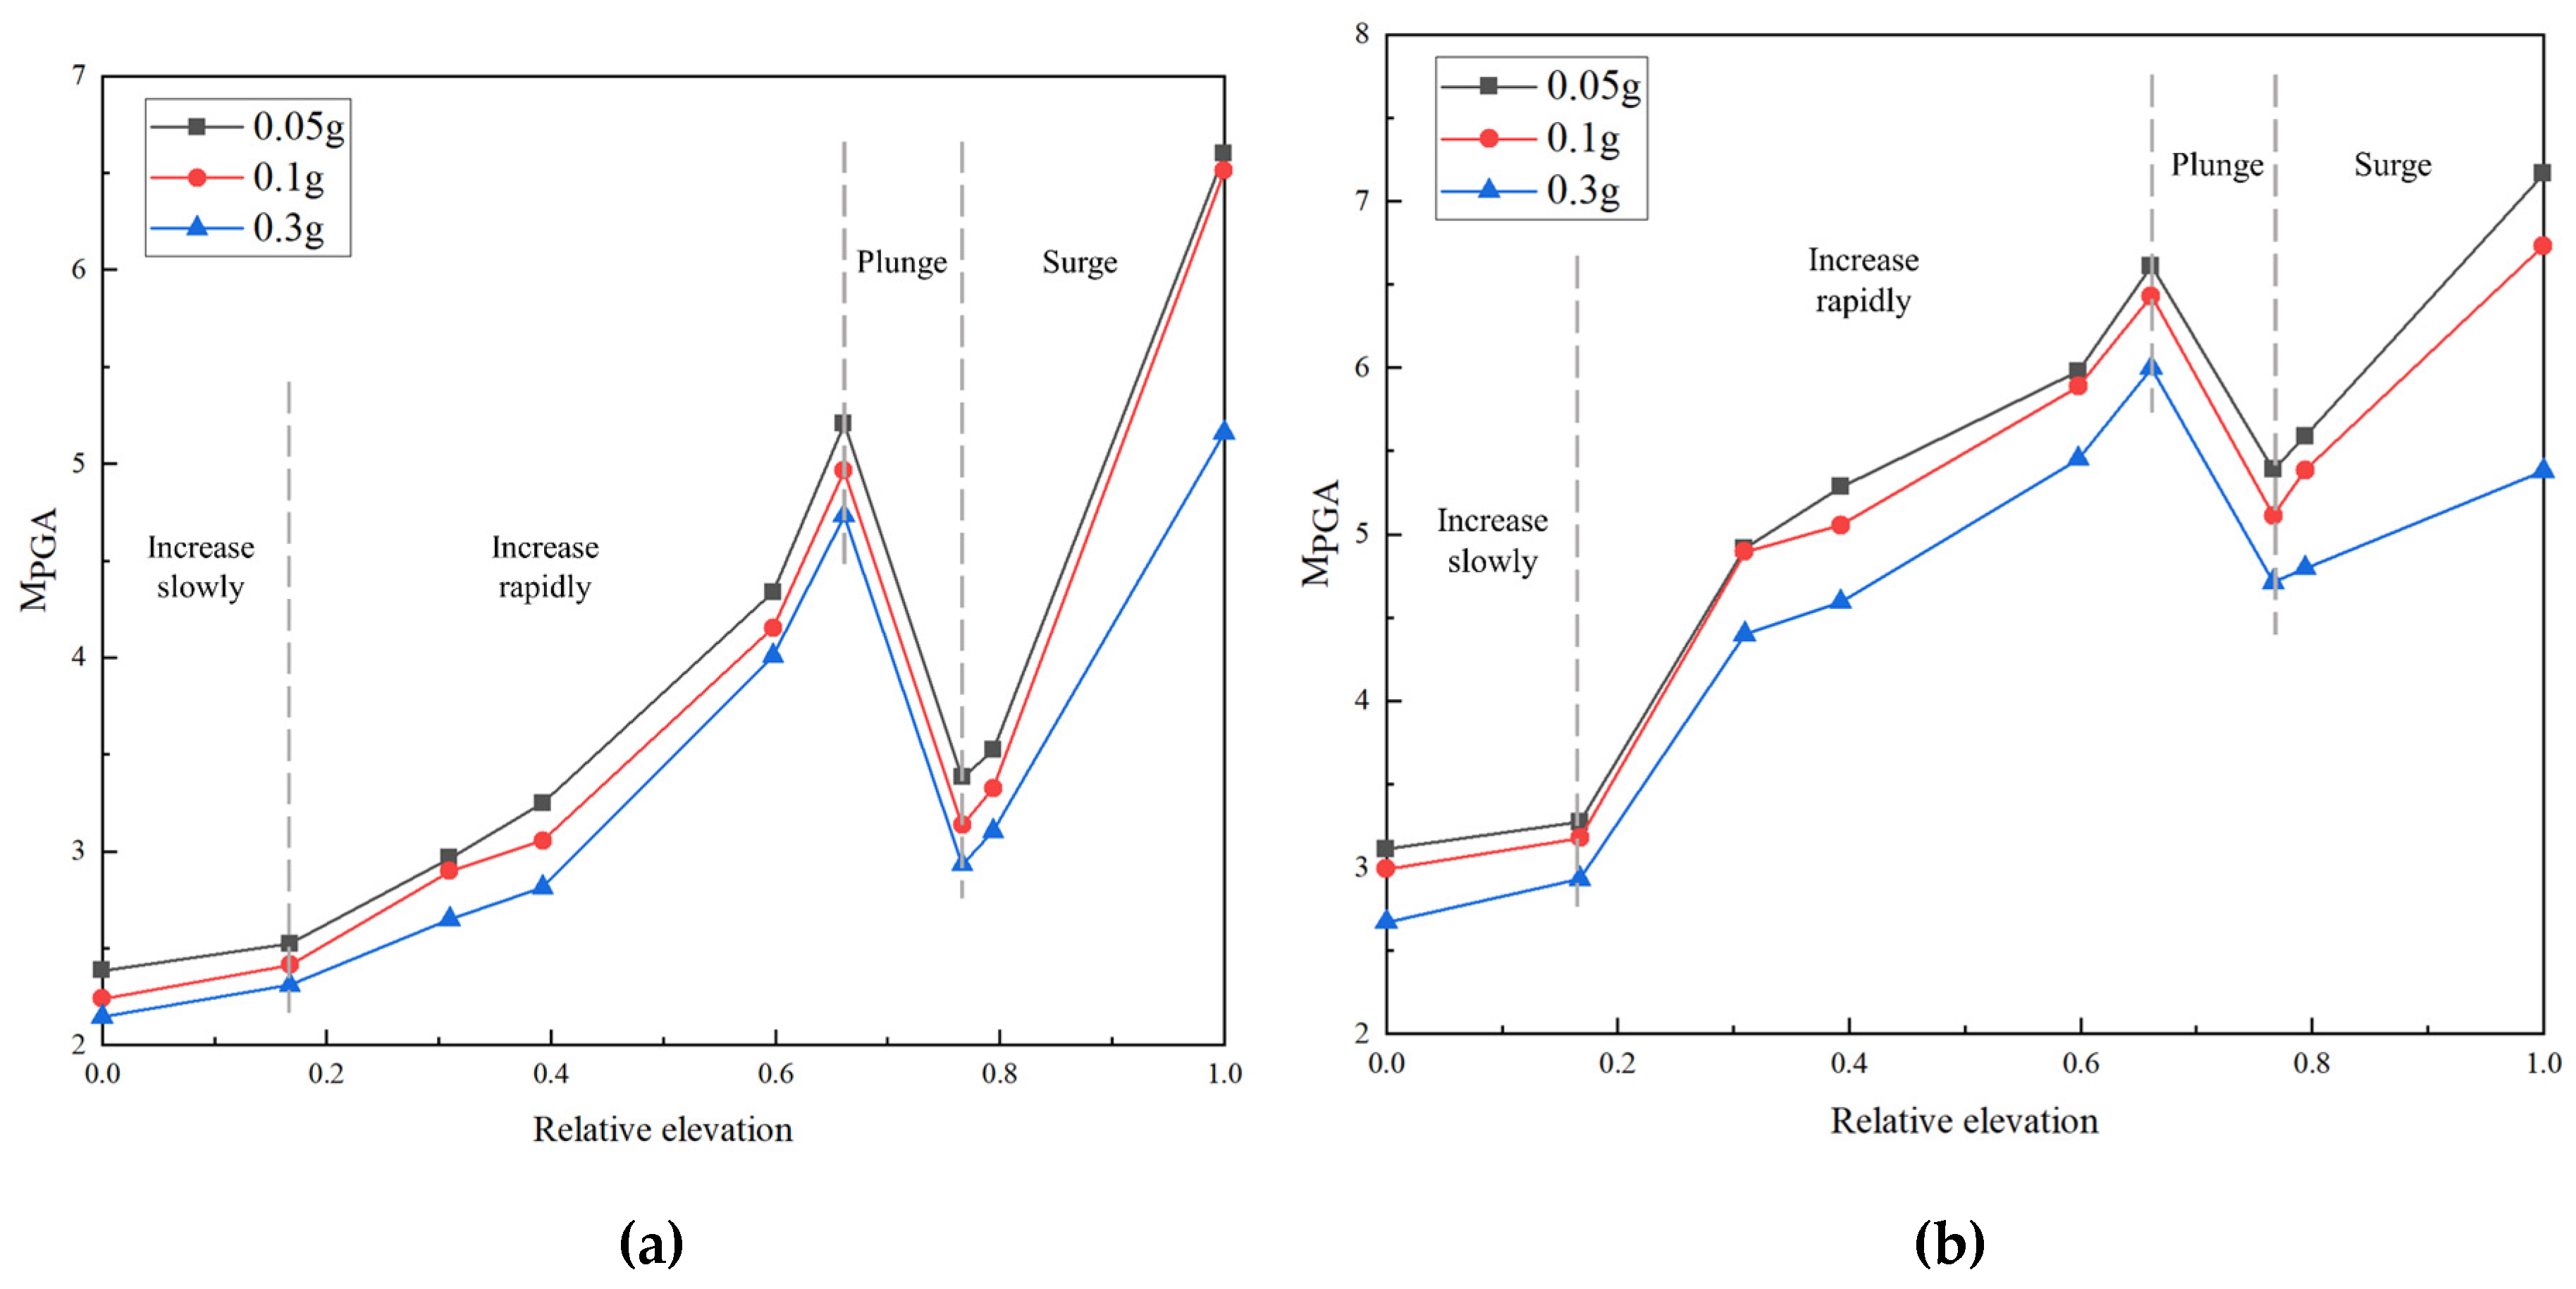
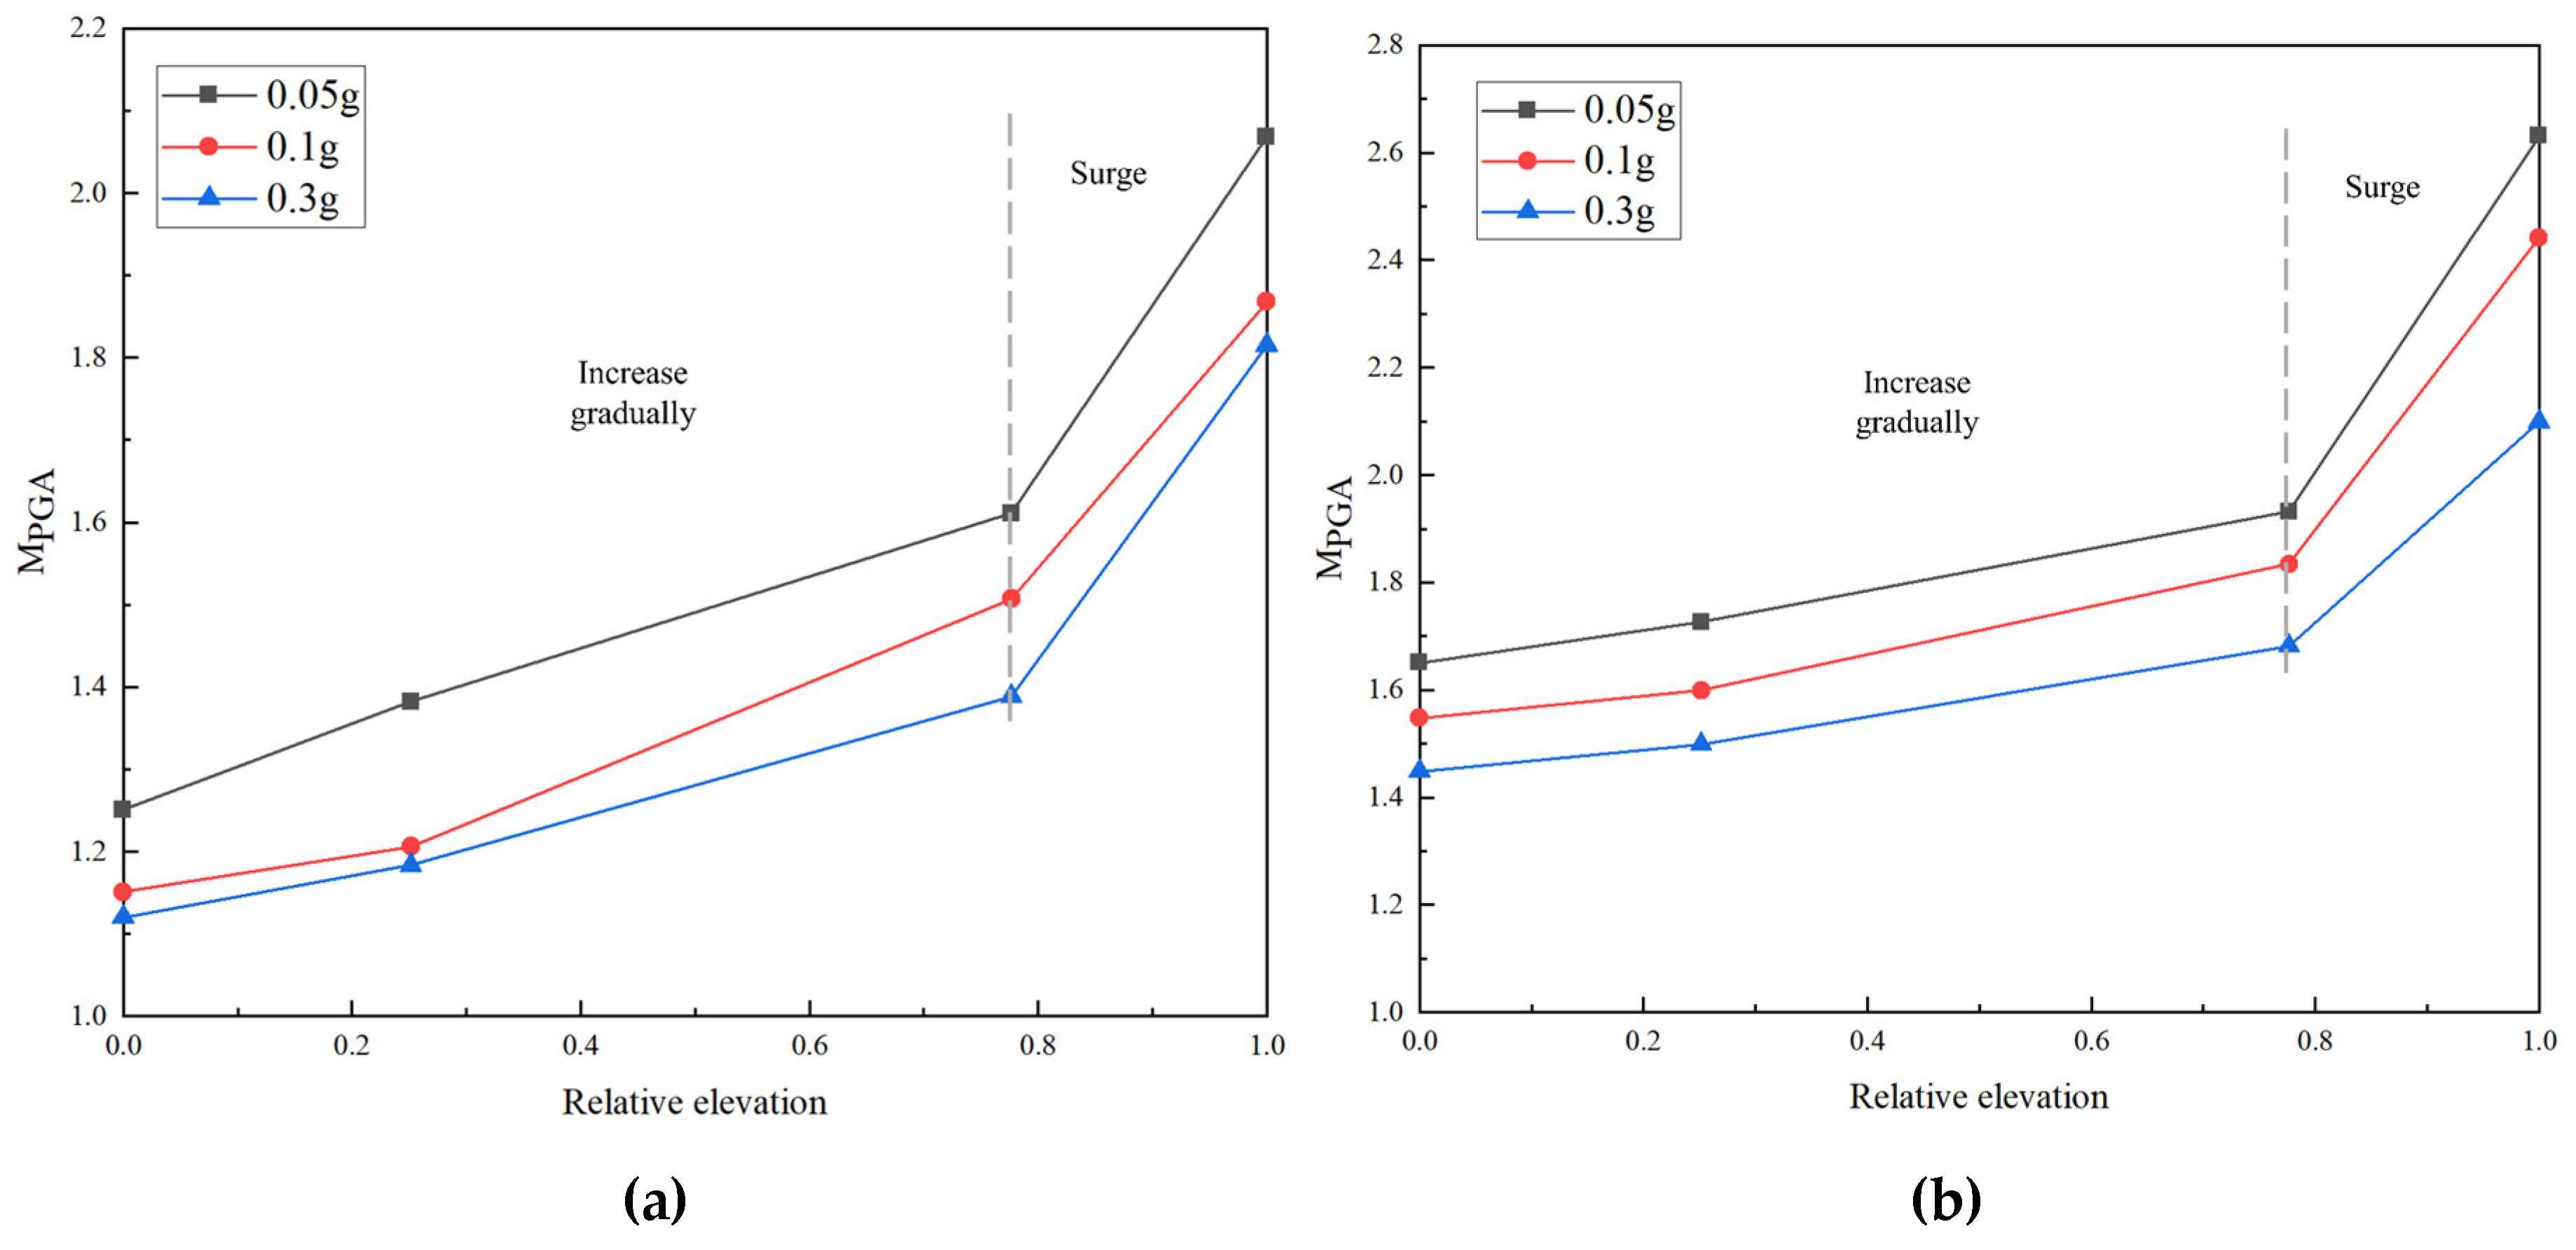
In order to study the influence of amplitudes on the dynamic response of slope, the results of different amplitudes of the Wenchuan wave are compared (
Figure 20 and
Figure 21).
The M
PGA decreases with the increase of amplitudes. This rule is consistent with the findings of many scholars [
45,
46,
47]. The occurrence of this phenomenon may be closely related to the nonlinear properties of the slope rocks, the damping properties, and the frequency of seismic waves. As the intensity of the seismic wave increases, the nonlinear characteristics of rocks become more obvious and its filtering effect is enhanced. At the same time, the strain increases, resulting in a decrease in the shear strength and shear modulus of rocks, an increase in the damping ratio, a decrease in the self-oscillation frequency of the structure and a decrease in the ability to resist deformation. These changes weaken the dynamic response of the slope and reduce the M
PGA.
From
Figure 20, at different amplitudes, the change rule of the M
PGA on the slope surface is basically the same. This indicates that the amplitude has little effect on the acceleration response of the slope surface.
From
Figure 21, the M
PGA increases continuously with elevation in the horizontal and vertical directions. The closer to the slope surface, the stronger the acceleration amplification effect. When the elevation is less than 4/5, the growth rate is slow; when the elevation is more than 4/5, the growth rate increases rapidly.
5. Conclusions
In this paper, the finite difference software FLAC3D is used to simulate the process of earthquake action at different amplitudes during 100 years creep. The long-term creep response characteristics of the high rock slope under the cumulative effect of earthquakes are revealed. The main conclusions are as follows:
- (1)
The combined actions of creep and earthquake increase the risk of slope instability. The increase in amplitudes leads to a looser and more broken rock structure and the overall stress value shows a decreasing trend. Especially, the maximum principal stress is reduced by 12.6% relative to the natural working condition. The shear strength is reduced and the risk of slope instability exists. Tensile and compressive stress are observed at the monitoring points on the slope surface, and all monitoring points in the slope are under compressive stress, making the slope surface more unstable compared to the interior of the slope. The cataclastic rock areas located on the slope face show a combination of compressive and tensile conditions, with large tensile stress in the middle of the slope surface and at the slope shoulder, which could potentially cause destructive deformation if further impacts are caused by unfavorable external factors.
- (2)
With the continuous actions of earthquake and creep, when the amplitude increases, the overall displacement tends to increase, and the change curve is rhythmic, reaching the maximum at the top of the slope. It shows the elevation effect and surface-trend effect. Displacement is distributed in a stepwise manner, mainly in the slope shoulder, the shallow surface part of the slope, and at the top of the slope. Earthquakes and creep effects have the greatest impact on the upper and middle parts of the slope which are often places where cumulative damage and crack development begin. Earthquakes promote the development of creep. As the amplitude increases, the 100-year creep displacement tends to increase, and earthquakes have the greatest effect on the area of the middle of the slope surface. Multiple earthquakes coupled with the effects of creep have resulted in the accumulation of damage on the slope surface and in the slope, which could result in widespread landslides and damage in the future if further adverse external influences occur.
- (3)
In the process of seismic wave propagation upward, the slope presents a delay effect due to inertia. The bigger the slope height is, the more obvious the delay effect is.
- (4)
The nonlinear height amplification and wave characteristics are obvious in both horizontal and vertical directions. The acceleration response of seismic waves on the slope surface shows a trend of increasing, decreasing and then increasing with elevations, reaching a peak at the top of the slope. The upper part and the middle part of the slope surface have a larger increment and the seismic response is stronger. The ground motion response on the slope surface is obviously stronger than that in the slope. Therefore, it’s necessary to reinforce the middle and top of the slope surface to reduce the risk of instability. Vertical earthquake has a great effect on the dynamic response of the slope. Because of the resonance phenomenon of the slope, the MPGA of the vertical direction is obviously larger than that of the horizontal direction. The MPGA decreases with the increase of amplitudes. The occurrence of this phenomenon may be closely related to the nonlinear and damping characteristics of the rock slope and the frequency of seismic waves.
In this study, it can provide some references for the prevention and control of geologic hazards of similar slopes under the combined effects of both creep and earthquakes in the Nujiang River Basin. However, there are some limitations, the slope is only in the stage of elastic deformation and plastic deformation and does not show the sliding instability state. The destabilizing damage mode of the slope needs to be further explored.
Author Contributions
Conceptualization, M.Y. (Meilin Yu) and H.D (Hongyan Deng); methodology, M.Y. (Meilin Yu) and H.D (Hongyan Deng); software, M.Y. (Meilin Yu); formal analysis, M.Y. (Meilin Yu); investigation, M.Y. (Meilin Yu); resources, M.Y. (Meilin Yu) and H.D (Hongyan Deng); data curation, M.Y. (Meilin Yu); writing—original draft preparation, M.Y. (Meilin Yu); writing—review and editing, M.Y. (Meilin Yu) and H.D (Hongyan Deng); visualization, M.Y. (Meilin Yu); supervision, M.Y. (Meilin Yu) and H.D (Hongyan Deng); funding acquisition, H.D (Hongyan Deng); All authors have read and agreed to the published version of the manuscript.
Funding
This research was supported by the Second Tibetan Plateau Scientific Expedition and Research Program (STEP), Grant No.2019QZKK0906-02.
Data Availability Statement
The table data used to support the findings of this study are included within the article. The image data used to support the findings of this study are available from the corresponding author upon request.
Conflicts of Interest
The authors declare no conflicts of interest.
References
- Zhang, H.; Zhao, H.; Zhang, X.; Wang, T.; Li, H.; Wang, Y. Creep characteristics and model of key unit rock in slope potential slip surface. Int J Geomech. 2019, 19, 04019094. [CrossRef]
- Dong, J.; Li, L.; Mao, Q.; Zhao, J.; Wu, Q.; Xie, F. Prediction of long-term creep features of a supported expressway slope (Publication with Expression of Concern). Arabian Journal of Geosciences. 2020, 13, 1-11. [CrossRef]
- Li, A.; Deng, H.; Zhang, H.; Jiang, M.; Liu, H.; Xiao, Y.; Wen, J. Developing a two-step improved damage creep constitutive model based on soft rock saturation-loss cycle triaxial creep test. Natural Hazards. 2021, 108, 2265-2281. [CrossRef]
- Zhou, X.P.; Cheng, H. The long-term stability analysis of 3D creeping slopes using the displacement-based rigorous limit equilibrium method. Engineering Geology. 2015, 195, 292-300. [CrossRef]
- Sun, C.; Jin, C.; Wang, L.; Cai, J.; Li, J. Creep damage characteristics and slip law of weak-layer mudstone in an open mining slope. Bulletin of Engineering Geology and the Environment. 2023, 82, 399. [CrossRef]
- Zhen, Z.-X. Modified time-varying damage model with caputo fractional derivative on the creep destruction prediction of rock slope. Mathematical Problems in Engineering. 2021, 2021. [CrossRef]
- Bao, M.; Chen, Z.; Nian, G.; Zhang, L.; Zhu, T. Study on creep properties of weak layer rock of slope under damage coupling. Bulletin of Engineering Geology and the Environment. 2024, 83. [CrossRef]
- Li, R.; Ji, F.; Feng, W.; Wang, D.; Zhang, J. Shear creep characteristics and constitutive model of hidden non-persistent joints. Chinese Journal of Geotechnical Engineering. 2019, 41, 2253-2261. [CrossRef]
- Jiang, S.; Wen, B.; Jiang, X.; Li, R.; Zhao, C. A non-linear damage rheological constitutive model and its application to a giant slow-moving landslide. Hydrogeology & Engineering Geology. 2019, 46, 56-63. [CrossRef]
- Lei, Q.; Sornette, D. A stochastic dynamical model of slope creep and failure. Geophysical Research Letters. 2023, 50, e2022GL102587. [CrossRef]
- Bao, C.; Zhan, L.; Xia, Y.; Huang, Y.; Zhao, Z. Development trend and stability analysis of creep landslide with obvious slip zone under rainfall-taking Xinchang Xiashan basalt slope as an Example. Frontiers in Earth Science. 2022, 9, 1-11. [CrossRef]
- Jeng, C.J.; Chen, S.S.; Tseng, C.H. A case study on the slope displacement criterion at the critical accelerated stage triggered by rainfall and long-term creep behavior. Natural Hazards. 2022, 112, 2277-2312. [CrossRef]
- Vallet, A.; Charlier, J.B.; Fabbri, O.; Bertrand, C.; Carry, N.; Mudry, J. Functioning and precipitation-displacement modelling of rainfall-induced deep-seated landslides subject to creep deformation. Landslides. 2016, 13, 653-670. [CrossRef]
- Paul, K.; Bhattacharya, P.; Misra, S. Frictional control on accelerating creep during the slow-to-fast transition of rainfall-induced catastrophic landslides. Journal of Geophysical Research-Earth Surface. 2024, 129, e2023JF007213. [CrossRef]
- Delchiaro, M.; Della Seta, M.; Martino, S.; Nozaem, R.; Moumeni, M. Tectonic deformation and landscape evolution inducing mass rock creep driven landslides: the Loumar case-study (Zagros Fold and Thrust Belt, Iran). Tectonophysics. 2023, 846, 229655. [CrossRef]
- Luo, Y.; Li, J.; Hu, B. Flowing deformation of softrock & deformation and wreck of slope. In Proceedings of the 8th National Conference on Engineering Geology, Shanghai, China, 31 October 2008; pp. 226-229.
- Li, M.; Qiao, L.; Tian, Y.; Du, H. Analysis of deformation mechanism of soft rock composite slope in open-pit mine. Coal Science and Technology. 2021, 49, 108-113. [CrossRef]
- Dong, J.; Zhao, Y.; Liu, H.; Zhao, J.; Zhang, Z.; Chi, Q.; Yang, J. Creep characteristics of a strongly weathered argillaceous sandstone sliding zone and the disaster evolution mechanism of the Huaipa landslide, China. Applied Sciences-Basel. 2023, 13, 8579. [CrossRef]
- Sun, H.; Wu, H.; Ma, Z.; Yuan, Z.; Feng, K. Analysis of seismic damage modes of landslides containing tunnels under horizontal earthquake action. Geofluids. 2022, 2022, 6026316. [CrossRef]
- Yan, Z.; Zhang, S.; Zhang, X.; Zhang, L. Study of dynamic response of bedding rock slope under earthquake and influence of ground motion parameters. Chinese Journal of Rock Mechanics and Engineering. 2011, 30, 3522-3528.
- Chen, X.; Gong, W.; Zhong, X.; Qiu, J.; Li, Y. Dynamic reliability analysis of bedding rock slopes under horizontal and vertical earthquake actions. China Civil Engineering Journal. 2017, 50, 91-98,128. [CrossRef]
- Tang, H.; Wu, Z.; Che, A.; Yuan, C.; Deng, Q. Failure mechanism of rock slopes under different seismic excitation. Advances in Materials Science and Engineering. 2021, 2021, 8866119. [CrossRef]
- Song, D.; Che, A.; Zhu, R.; Ge, X. Dynamic response characteristics of a rock slope with discontinuous joints under the combined action of earthquakes and rapid water drawdown. Landslides. 2018, 15, 1109-1125. [CrossRef]
- Che, A.; Yang, H.; Wang, B.; Ge, X. Wave propagations through jointed rock masses and their effects on the stability of slopes. Engineering Geology. 2016, 201, 45-56. [CrossRef]
- Fan, C.; Wang, C.; Liu, H. Influences of the combined horizontal and vertical excitations on the seismic responses of tiered geosynthetic reinforced slope. Journal of Disaster Prevention and Mitigation Engineering. 2020, 40, 606-613. [CrossRef]
- Huang, C.; Wang, A.; Ren, W. Influence of time combination pattern of horizontal and vertical ground motions on slope seismic safety factor. Rock and Soil Mechanics. 2010, 31, 3404-3410. [CrossRef]
- Song, G.; Du, J.; Ke, J.; Deng, Q.; Liang, Y. Stability limit analysis of bedding rock slopes based on pseudo-dynamic method. China Earthquake Engineering Journal. 2019, 41, 931-938.
- Chen, X.; Gao, R.; Gong, W.; Li, Y.; Peng, Y. Time history analysis method for seismic reliability of bedding rock slopes based newmark-β method. China Journal of Highway and Transport. 2017, 30, 33-40. [CrossRef]
- Xu, N.; Li, T.; Dai, F.; Li, B.; Fan, Y.; Xu, J. Stability analysis on the left bank slope of Baihetan hydropower station based on discrete element simulation and microseismic monitoring. Rock and Soil Mechanics. 2017, 38, 2358-2367. [CrossRef]
- Dong, J.; Yang, J.; Wu, F.; Yang, G.; Huang, Z. Large-scale shaking table test research on acceleration response rules of bedding layered rock slope and its blocking mechanism of river. Chinese Journal of Rock Mechanics and Engineering. 2013, 32, 3861-3867.
- Bowa, V.M.; Xia, Y.; Yan, M.; Kabwe, E. Toppling of the jointed rock slope with counter-tilted weak planes influenced by the response to local earthquakes. International Journal of Mining and Mineral Engineering. 2018, 9, 302-320. [CrossRef]
- Yan, Z.; Li, Y.; Long, Z.; Zhai, J. Shearing action of anchorage interface of rock slope with soft layer under bidirectional coupled earthquake. Journal of Vibration and Shock. 2020, 39, 158-164. [CrossRef]
- Antwi Buah, P.; Zhang, Y.; He, J.; Yu, P.; Xiang, C.; Fu, H.; He, Y.; Liu, J. Evaluating the dynamic response and failure process of a rock slope under pulse-like ground motions. Geomatics Natural Hazards & Risk. 2023, 14, 2167613. [CrossRef]
- Xiong, S.; Li, D.-Q.; Liu, Y.; Du, W. Effect of weak intercalated layers on the seismic response of rock slopes based on numerical analysis. Journal of Earthquake Engineering. 2023, 27, 4595-4612. [CrossRef]
- Peng, Y. Research on stability of bedding rock slope under bidirectional earthquake. Master Thesis, Huazhong University of Science & Technology, Hubei, China, 2017.
- Liu, X.; He, C.; Liu, S.; Liu, Y.; Lu, Y.; Liu, Z. Dynamic response and failure mode of slopes with horizontal soft and hard interbeddings under frequent microseisms. Arabian Journal for Science and Engineering. 2018, 43, 5397-5411. [CrossRef]
- Li, X. The analysis of the stability of bedding slope under the effect of frequent seismic. Master Thesis, Chongqing University, Chongqing, China, 2015.
- Yang, Z.; Liu, S.; Liu, Y.; He, C.; Yang, W. Dynamic stability analysis of bedding and toppling rock slopes under repeated micro-seismic action. Chinese Journal of Geotechnical Engineering. 2018, 40, 1277-1286.
- Lysmer, J.; Kuhlemeyer, R.L. Finite dynamic model for infinite media. Journal of the engineering mechanics division. 1969, 95, 859-877. [CrossRef]
- Yuan, H.; Cao, P.; Wan, W.; Xu, W. Study on creep rules of soft and intricate ore-rock under step load and unload. Chinese Journal of Rock Mechanics and Engineering. 2006, 25, 1575-1581.
- Guo, X.; Wang, B.; Wang, Z.; Yu, J. Methods and practices for deformation prediction in high-stress soft rock tunnels considering creep characteristics. Chinese Journal of Geotechnical Engineering. 2023, 45, 652-660.
- Chu, Z.; Sun, Z.; Zhang, Y.; Weng, L. Viscoelastic-plastic analysis for a deep-buried soft rock tunnel considering longitudinal construction. 2023, 67, 55-61. [CrossRef]
- Davis, L.L.; West, L.R. Observed effects of topography on ground motion. Bulletin of the Seismological Society of America. 1973, 63, 283-298. [CrossRef]
- Cui, F.; Xu, Q.; Tan, R.; Yin, Y. Numerical simulation of collapsing and sliding response of slope triggered by seismic dynamic action. Journal of Tongji University(Natural Science). 2011, 39, 445-450.
- Xu, G.; Yao, L.; Gao, Z.; Li, Z. Large-scale shaking table model test study on dynamic characteristics and dynamic responses of slope. Chinese Journal of Rock Mechanics and Engineering. 2008, 27, 624-632.
- Yang, B.; Yang, X.; Yang, T.; Wang, R.; Zhou, D. Shaking table model test on dynamic response and failure process of shatter-burst sliding slope under earthquake load 2018, 37, 3279-3290. [CrossRef]
- Xu, M.; Yu, X.-y.; Zhao, Y.-p.; Hu, J.-j.; Zhang, X.-t. Analysis of seismic dynamic response and failure mode of bedding rock slope with laminated fractured structure. Rock and Soil Mechanics. 2023, 44, 362-372. [CrossRef]
Figure 1.
Slope location.
Figure 1.
Slope location.
Figure 2.
Cross-sectional diagrams for modeling.
Figure 2.
Cross-sectional diagrams for modeling.
Figure 3.
Dimensions of the numerical model of the slope.
Figure 3.
Dimensions of the numerical model of the slope.
Figure 4.
Conventional triaxial compression test model of rocks.
Figure 4.
Conventional triaxial compression test model of rocks.
Figure 5.
Comparison of displacement: (a) Burgers-Mohr; (b) Mohr-Coulomb.
Figure 5.
Comparison of displacement: (a) Burgers-Mohr; (b) Mohr-Coulomb.
Figure 6.
Boundary conditions and the layout of monitoring points of the slope model.
Figure 6.
Boundary conditions and the layout of monitoring points of the slope model.
Figure 7.
Acceleration time-range curves of input horizontal and vertical seismic wave: (a) Amplitude 0.05g; (b) Amplitude 0.1g; (c) Amplitude 0.3g.
Figure 7.
Acceleration time-range curves of input horizontal and vertical seismic wave: (a) Amplitude 0.05g; (b) Amplitude 0.1g; (c) Amplitude 0.3g.
Figure 8.
Comparison between the velocity time range of the point P15 and the input seismic wave: (a) Horizontal ground motion; (b) Vertical ground motion.
Figure 8.
Comparison between the velocity time range of the point P15 and the input seismic wave: (a) Horizontal ground motion; (b) Vertical ground motion.
Figure 9.
The contour of total displacement and maximum principal stress after 100-year creep of the slope without earthquake action: (a) Maximum principal stress (unit: Pa); (b) Total displacement (unit: m).
Figure 9.
The contour of total displacement and maximum principal stress after 100-year creep of the slope without earthquake action: (a) Maximum principal stress (unit: Pa); (b) Total displacement (unit: m).
Figure 10.
The contour of maximum principal stress after the end of seismic and creep action at different amplitudes: (a) 0.05g; (b) 0.1g; (c) 0.3g (unit: Pa).
Figure 10.
The contour of maximum principal stress after the end of seismic and creep action at different amplitudes: (a) 0.05g; (b) 0.1g; (c) 0.3g (unit: Pa).
Figure 11.
Maximum principal stress at each monitoring point in the vertical and horizontal directions: (a) Monitoring points on the slope surface; (b) Vertical monitoring points in the slope; (c) Horizontal monitoring points in the slope.
Figure 11.
Maximum principal stress at each monitoring point in the vertical and horizontal directions: (a) Monitoring points on the slope surface; (b) Vertical monitoring points in the slope; (c) Horizontal monitoring points in the slope.
Figure 12.
The contour of total displacement after the end of seismic and creep action at different amplitudes: (a) 0.05g; (b) 0.1g; (c) 0.3g (unit: Pa).
Figure 12.
The contour of total displacement after the end of seismic and creep action at different amplitudes: (a) 0.05g; (b) 0.1g; (c) 0.3g (unit: Pa).
Figure 13.
Displacement of vertical and horizontal directions at amplitude 0.05g for each monitoring point: (a) Monitoring points on the slope surface; (b) Vertical monitoring points in the slope; (c) Horizontal monitoring points in the slope.
Figure 13.
Displacement of vertical and horizontal directions at amplitude 0.05g for each monitoring point: (a) Monitoring points on the slope surface; (b) Vertical monitoring points in the slope; (c) Horizontal monitoring points in the slope.
Figure 14.
Displacement of vertical and horizontal directions at amplitude 0.1g for each monitoring point: (a) Monitoring points on the slope surface; (b) Vertical monitoring points in the slope; (c) Horizontal monitoring points in the slope.
Figure 14.
Displacement of vertical and horizontal directions at amplitude 0.1g for each monitoring point: (a) Monitoring points on the slope surface; (b) Vertical monitoring points in the slope; (c) Horizontal monitoring points in the slope.
Figure 15.
Displacement of vertical and horizontal directions at amplitude 0.3g for each monitoring point: (a) Monitoring points on the slope surface; (b) Vertical monitoring points in the slope; (c) Horizontal monitoring points in the slope.
Figure 15.
Displacement of vertical and horizontal directions at amplitude 0.3g for each monitoring point: (a) Monitoring points on the slope surface; (b) Vertical monitoring points in the slope; (c) Horizontal monitoring points in the slope.
Figure 16.
Displacement of each monitoring point on the slope surface after the end of seismic and creep action at different amplitudes.
Figure 16.
Displacement of each monitoring point on the slope surface after the end of seismic and creep action at different amplitudes.
Figure 17.
Displacement time course curves of three monitoring points on the slope surface during the first seismic stage at amplitude 0.1g.
Figure 17.
Displacement time course curves of three monitoring points on the slope surface during the first seismic stage at amplitude 0.1g.
Figure 18.
Comparison of 100-year creep displacement under the natural work conditions and earthquakes of different amplitudes.
Figure 18.
Comparison of 100-year creep displacement under the natural work conditions and earthquakes of different amplitudes.
Figure 19.
MPGA for monitoring points in the vertical and horizontal directions at amplitude 0.1g:(a) Vertical monitoring points on the surface and in the slope along X and Z directions; (b) Horizontal monitoring points in the slope along X and Z directions.
Figure 19.
MPGA for monitoring points in the vertical and horizontal directions at amplitude 0.1g:(a) Vertical monitoring points on the surface and in the slope along X and Z directions; (b) Horizontal monitoring points in the slope along X and Z directions.
Figure 20.
The acceleration response of monitoring points on the slope surface along X and Z directions at different amplitudes:(a) X direction; (b) Z direction.
Figure 20.
The acceleration response of monitoring points on the slope surface along X and Z directions at different amplitudes:(a) X direction; (b) Z direction.
Figure 21.
The acceleration response of vertical monitoring points in the slope along X and Z directions at different amplitudes:(a) X direction; (b) Z direction.
Figure 21.
The acceleration response of vertical monitoring points in the slope along X and Z directions at different amplitudes:(a) X direction; (b) Z direction.
Table 1.
Physical and mechanical parameters of the rocks.
Table 1.
Physical and mechanical parameters of the rocks.
| Category of rock |
Volume Weight
/(kN·m-3) |
Cohesion
c/(MPa) |
Frictional Angle
φ/(°) |
Elasticity modulus
E/(GPa) |
Poisson ratio
μ |
| Fragmented and strongly weathered quartz schist |
25 |
0.4 |
32 |
2 |
0.32 |
| Weakly weathered quartz schist |
27.1 |
1.2 |
48 |
35 |
0.21 |
| Weakly weathered granite |
26 |
1.6 |
50 |
30 |
0.22 |
| Weakly weathered crushed granite |
25.5 |
0.6 |
37 |
15 |
0.25 |
| Slightly weathered granite |
26.4 |
1.8 |
52 |
40 |
0.20 |
Table 2.
Mechanical parameters of creep.
Table 2.
Mechanical parameters of creep.
| Category of rock |
Maxwell
shear modulus
EM/GPa |
Kelvin
shear modulus
EK/GPa |
Maxwell
viscosity
ηM/(GPa·s) |
Kelvin
viscosity
ηK/(GPa·s) |
| Fragmented and strongly weathered quartz schist |
1.15 |
0.98 |
16400 |
4570 |
Table 3.
Earthquakes have a greater impact on the area where the slope is located in the last 100 years.
Table 3.
Earthquakes have a greater impact on the area where the slope is located in the last 100 years.
| Year |
Magnitude |
Epicenter area |
Calculated
intensity |
Seismic precautionary intensity |
| 1908 |
8.2 |
Abroad |
5.8 |
7 |
| 1950 |
8.6 |
Chayu and Medog in Tibet |
7.5 |
8 |
| 1951 |
6 |
Chamdo in Tibet |
5.2 |
6 |
| 1953 |
5.5 |
Basu in Tibet |
7.2 |
8 |
| 1984 |
5.1 |
The southwest region of Markham in Tibet |
5.9 |
7 |
| 1997 |
5.2 |
The southwest region of Zuo Gong in Tibet |
5.3 |
6 |
| 2008 |
8 |
Wenchuan in Sichuan |
4.9 |
6 |
| 2010 |
7.4 |
Yushu in Qinghai |
5.3 |
6 |
| 2017 |
6.9 |
Milin in Tibet |
5.5 |
7 |
Table 4.
Seismic and creep modes of action for different amplitudes.
Table 4.
Seismic and creep modes of action for different amplitudes.
|
Amplitude |
0.05g |
0.1g |
0.3g |
| Order of action |
|
| 1 |
34s earthquake action |
34s earthquake action |
34s earthquake action |
| 2 |
25-year creep effect |
30-year creep effect |
50-year creep effect |
| 3 |
34s earthquake action |
34s earthquake action |
34s earthquake action |
| 4 |
25-year creep effect |
30-year creep effect |
50-year creep effect |
| 5 |
34s earthquake action |
34s earthquake action |
|
| 6 |
25-year creep effect |
40-year creep effect |
|
| 7 |
34s earthquake action |
|
|
| 8 |
25-year creep effect |
|
|
|
Disclaimer/Publisher’s Note: The statements, opinions and data contained in all publications are solely those of the individual author(s) and contributor(s) and not of MDPI and/or the editor(s). MDPI and/or the editor(s) disclaim responsibility for any injury to people or property resulting from any ideas, methods, instructions or products referred to in the content. |
© 2024 by the authors. Licensee MDPI, Basel, Switzerland. This article is an open access article distributed under the terms and conditions of the Creative Commons Attribution (CC BY) license (http://creativecommons.org/licenses/by/4.0/).
