Submitted:
10 July 2024
Posted:
10 July 2024
You are already at the latest version
Abstract
Keywords:
1. Introduction
2. Results
2.1. Identification and Characterization of Novel lncRNAs
2.2. LncRNAs’ Roles in AD Formation and Development
2.2.1. Contributions to key AD Phenotypes Via Cell-Polarity Changes
2.2.2. Contribution to Stress Generation
2.2.3. Contribution to Stress-Response Via Metabolic Reprogramming
2.3. LncRNA’s Discerning Power in Distinguishing AD Samples from Controls
3. Concluding Remarks
4. Materials and Methods
4.1. Data
4.2. Methods
4.2.1. RNA-seq Processing and lncRNA Identification
4.2.2. The Prediction Process Consists of Two Steps
4.2.3. Differential Analysis of All Assembled Transcripts
4.2.4. Ordering Disease Samples by the Level of Deviation from Control Tissues
4.2.6. Co-Expression Analyses
4.2.7. Predicting Target Genes or Pathways of Cis and Trans Regulation by lncRNA
4.2.8. Construction of lncRNA-mRNA Interaction Network and Identification of Functional Modules
4.2.9. The Discerning Power of lncRNAs in Distinguishing Control from AD Samples
Supplementary Materials
Author Contributions
Funding
Institutional Review Board Statement
Informed Consent Statement
Data Availability Statement
Acknowledgments
Conflicts of Interest
References
- Schwartz, L.; Peres, S.; Jolicoeur, M.; da Veiga Moreira, J. Cancer and Alzheimer’s disease: intracellular pH scales the metabolic disorders. Biogerontology 2020, 21, 683–694. [Google Scholar] [CrossRef] [PubMed]
- Xiong, Z.-G.; Pignataro, G.; Li, M.; Chang, S.-Y.; Simon, R.P. Acid-sensing ion channels (ASICs) as pharmacological targets for neurodegenerative diseases. Curr. Opin. Pharmacol. 2007, 8, 25–32. [Google Scholar] [CrossRef] [PubMed]
- Guan, P.-P.; Cao, L.-L.; Yang, Y.; Wang, P. Calcium Ions Aggravate Alzheimer’s Disease Through the Aberrant Activation of Neuronal Networks, Leading to Synaptic and Cognitive Deficits. Front. Mol. Neurosci. 2021, 14. [Google Scholar] [CrossRef] [PubMed]
- Vitvitsky, V.M.; Garg, S.K.; Keep, R.F.; Albin, R.L.; Banerjee, R. Na+ and K+ ion imbalances in Alzheimer's disease. Biochim. et Biophys. Acta (BBA) - Mol. Basis Dis. 2012, 1822, 1671–1681. [Google Scholar] [CrossRef] [PubMed]
- Verdile, G.; Keane, K.N.; Cruzat, V.F.; Medic, S.; Sabale, M.; Rowles, J.; Wijesekara, N.; Martins, R.N.; Fraser, P.E.; Newsholme, P. Inflammation and Oxidative Stress: The Molecular Connectivity between Insulin Resistance, Obesity, and Alzheimer’s Disease. Mediat. Inflamm. 2015, 2015, 1–17. [Google Scholar] [CrossRef] [PubMed]
- Zuo, L.; Prather, E.R.; Stetskiv, M.; Garrison, D.E.; Meade, J.R.; Peace, T.I.; Zhou, T. Inflammaging and oxidative stress in human diseases: From molecular mechanisms to novel treatments. Int. J. Mol. Sci. 2019, 20, 4472. [Google Scholar] [CrossRef] [PubMed]
- Dickson, D.W. Apoptotic mechanisms in Alzheimer neurofibrillary degeneration: cause or effect? J. Clin. Investig. 2004, 114, 23–27. [Google Scholar] [CrossRef] [PubMed]
- Chi, H.; Chang, H.-Y.; Sang, T.-K. Neuronal Cell Death Mechanisms in Major Neurodegenerative Diseases. Int. J. Mol. Sci. 2018, 19, 3082. [Google Scholar] [CrossRef]
- Haass, C.; Selkoe, D. If amyloid drives Alzheimer disease, why have anti-amyloid therapies not yet slowed cognitive decline? PLOS Biol. 2022, 20, e3001694. [Google Scholar] [CrossRef]
- Niikura, T.; Tajima, H.; Kita, Y. Neuronal Cell Death in Alzheimers Disease and a Neuroprotective Factor, Humanin. Curr. Neuropharmacol. 2006, 4, 139–147. [Google Scholar] [CrossRef]
- Wang, X.; Wang, W.; Li, L.; Perry, G.; Lee, H.-G.; Zhu, X. Oxidative stress and mitochondrial dysfunction in Alzheimer’s disease. Biochim. Biophys. (BBA)—Mol. Basis Dis. 2014, 1842, 1240–1247. [Google Scholar] [CrossRef] [PubMed]
- T. Pohlkamp et al., ‘Endosomal Acidification by NHE6-depletion Corrects ApoE4-mediated Synaptic Impairments and Reduces Amyloid Plaque Load’. bioRxiv, Mar. 23, 2021. [CrossRef]
- E. Im et al., ‘Lysosomal dysfunction in Down Syndrome and Alzheimer mouse models is caused by selective v-ATPase inhibition by Tyr682 phosphorylated APP βCTF’. bioRxiv, Jan. 26, 2023. [CrossRef]
- Serrano-Pozo, A.; Frosch, M.P.; Masliah, E.; Hyman, B.T. Neuropathological Alterations in Alzheimer Disease. Cold Spring Harb. Perspect. Med. 2011, 1, a006189–a006189. [Google Scholar] [CrossRef] [PubMed]
- Drummond, E.; Wisniewski, T. Alzheimer’s disease: experimental models and reality. Acta Neuropathol. 2016, 133, 155–175. [Google Scholar] [CrossRef] [PubMed]
- Olufunmilayo, E.O.; Holsinger, R.M.D. Roles of Non-Coding RNA in Alzheimer’s Disease Pathophysiology. Int. J. Mol. Sci. 2023, 24, 12498. [Google Scholar] [CrossRef] [PubMed]
- Lan, Z.; Chen, Y.; Jin, J.; Xu, Y.; Zhu, X. Long Non-coding RNA: Insight Into Mechanisms of Alzheimer's Disease. Front. Mol. Neurosci. 2022, 14, 821002. [Google Scholar] [CrossRef] [PubMed]
- Shan, X.; Tashiro, H.; Lin, C.-L.G. The Identification and Characterization of Oxidized RNAs in Alzheimer's Disease. J. Neurosci. 2003, 23, 4913–4921. [Google Scholar] [CrossRef] [PubMed]
- Bennett, D.A.; Buchman, A.S.; Boyle, P.A.; Barnes, L.L.; Wilson, R.S.; Schneider, J.A. Religious Orders Study and Rush Memory and Aging Project. J. Alzheimer's Dis. 2018, 64, S161–S189. [Google Scholar] [CrossRef] [PubMed]
- Rijpma, A.; van der Graaf, M.; Meulenbroek, O.; Rikkert, M.G.O.; Heerschap, A. Altered brain high-energy phosphate metabolism in mild Alzheimer's disease: A 3-dimensional 31P MR spectroscopic imaging study. NeuroImage: Clin. 2018, 18, 254–261. [Google Scholar] [CrossRef] [PubMed]
- Lyros, E.; Ragoschke-Schumm, A.; Kostopoulos, P.; Sehr, A.; Backens, M.; Kalampokini, S.; Decker, Y.; Lesmeister, M.; Liu, Y.; Reith, W.; et al. Normal brain aging and Alzheimer's disease are associated with lower cerebral pH: an in vivo histidine 1H-MR spectroscopy study. Neurobiol. Aging 2020, 87, 60–69. [Google Scholar] [CrossRef]
- Decker, Y.; Németh, E.; Schomburg, R.; Chemla, A.; Fülöp, L.; Menger, M.D.; Liu, Y.; Fassbender, K. Decreased pH in the aging brain and Alzheimer's disease. Neurobiol. Aging 2021, 101, 40–49. [Google Scholar] [CrossRef]
- Gong, C.-X.; Grundke-Iqbal, I.; Iqbal, K. Dephosphorylation of Alzheimer's disease abnormally phosphorylated tau by protein phosphatase-2A. Neuroscience 1994, 61, 765–772. [Google Scholar] [CrossRef] [PubMed]
- Ciudad, S.; Puig, E.; Botzanowski, T.; Meigooni, M.; Arango, A.S.; Do, J.; Mayzel, M.; Bayoumi, M.; Chaignepain, S.; Maglia, G.; et al. Aβ(1-42) tetramer and octamer structures reveal edge conductivity pores as a mechanism for membrane damage. Nat. Commun. 2020, 11, 1–14. [Google Scholar] [CrossRef]
- A. Farooqui, ‘Contribution of Dietary Carbohydrates in Induction of Oxidative Stress’, in Inflammation and Oxidative Stress in Neurological Disorders: Effect of Lifestyle, Genes, and Age, A. A. Farooqui, Ed., Cham: Springer International Publishing, 2014, pp. 237–261. [CrossRef]
- Harrow, J.; Frankish, A.; Gonzalez, J.M.; Tapanari, E.; Diekhans, M.; Kokocinski, F.; Aken, B.L.; Barrell, D.; Zadissa, A.; Searle, S.; et al. GENCODE: The reference human genome annotation for The ENCODE Project. Genome Res. 2012, 22, 1760–1774. [Google Scholar] [CrossRef] [PubMed]
- Shumate, A.; Wong, B.; Pertea, G.; Pertea, M. Improved transcriptome assembly using a hybrid of long and short reads with StringTie. PLOS Comput. Biol. 2022, 18, e1009730. [Google Scholar] [CrossRef] [PubMed]
- Tsai, C.-H.; Lin, T.-C.; Chang, Y.-H.; Tsai, H.-K.; Huang, J.-H. Identification and comparative analysis of long non-coding RNAs in the brain of fire ant queens in two different reproductive states. BMC Genom. 2022, 22, 1–14. [Google Scholar] [CrossRef] [PubMed]
- Liu, Y.; Tang, H.; Li, C.; Huang, N.; Miao, J.; Chen, L.; Luo, K.; Li, F.; Liu, S.; Liao, S.; et al. Long non-coding RNA and circular RNA and coding RNA profiling of plasma exosomes of osteosarcoma by RNA seq. Sci. Data 2023, 10, 1–9. [Google Scholar] [CrossRef] [PubMed]
- Wilcoxon signed-rank test - Handbook of Biological Statistics’. Accessed: Mar. 13, 2024. [Online]. Available: https://www.biostathandbook.com/wilcoxonsignedrank.
- Ju, J.-Q.; Zhang, H.-L.; Wang, Y.; Hu, L.-L.; Sun, S.-C. Kinesin KIFC3 is essential for microtubule stability and cytokinesis in oocyte meiosis. Cell Commun. Signal. 2024, 22, 1–11. [Google Scholar] [CrossRef] [PubMed]
- Ozon, S.; Guichet, A.; Gavet, O.; Roth, S.; Sobel, A. DrosophilaStathmin: A Microtubule-destabilizing Factor Involved in Nervous System Formation. Mol. Biol. Cell 2002, 13, 698–710. [Google Scholar] [CrossRef] [PubMed]
- Eckert, T.; Le, D.T.-V.; Link, S.; Friedmann, L.; Woehlke, G. Spastin's Microtubule-Binding Properties and Comparison to Katanin. PLOS ONE 2012, 7, e50161. [Google Scholar] [CrossRef]
- Cowan, C.M.; Mudher, A. Are Tau Aggregates Toxic or Protective in Tauopathies? Front. Neurol. 2013, 4, 114. [Google Scholar] [CrossRef]
- Introduction to Condensed Matter Chemistry - 1st Edition | Elsevier Shop’. Accessed: Apr. 16, 2024. [Online]. Available: https://shop.elsevier. 1614.
- Rival, T.; Page, R.M.; Chandraratna, D.S.; Sendall, T.J.; Ryder, E.; Liu, B.; Lewis, H.; Rosahl, T.; Hider, R.; Camargo, L.M.; et al. Fenton chemistry and oxidative stress mediate the toxicity of the β-amyloid peptide in a Drosophila model of Alzheimer’s disease. Eur. J. Neurosci. 2009, 29, 1335–1347. [Google Scholar] [CrossRef]
- Bauer, R.; Brüne, B.; Schmid, T. Cholesterol metabolism in the regulation of inflammatory responses. Front. Pharmacol. 2023, 14, 1121819. [Google Scholar] [CrossRef]
- Trupp, M.; Altman, T.; A Fulcher, C.; Caspi, R.; Krummenacker, M.; Paley, S.; Karp, P.D. Beyond the genome (BTG) is a (PGDB) pathway genome database: HumanCyc. Genome Biol. 2010, 11, O12–O12. [Google Scholar] [CrossRef]
- Gencel-Augusto, J.; Wu, W.; Bivona, T.G. Long Non-Coding RNAs as Emerging Targets in Lung Cancer. Cancers 2023, 15, 3135. [Google Scholar] [CrossRef]
- Li, R.; Zhu, H.; Luo, Y. Understanding the Functions of Long Non-Coding RNAs through Their Higher-Order Structures. Int. J. Mol. Sci. 2016, 17, 702. [Google Scholar] [CrossRef]
- Luo, J.; Qu, L.; Gao, F.; Lin, J.; Liu, J.; Lin, A. LncRNAs: Architectural Scaffolds or More Potential Roles in Phase Separation. Front. Genet. 2021, 12. [Google Scholar] [CrossRef]
- Salonikidis, P.S.; Kirichenko, S.N.; Tatjanenko, L.V.; Schwarz, W.; Vasilets, L.A. Extracellular pH modulates kinetics of the Na+,K+-ATPase. Biochim. et Biophys. Acta (BBA) - Biomembr. 2000, 1509, 496–504. [Google Scholar] [CrossRef]
- Janelidze, S.; Stomrud, E.; Palmqvist, S.; Zetterberg, H.; van Westen, D.; Jeromin, A.; Song, L.; Hanlon, D.; Hehir, C.A.T.; Baker, D.; et al. Plasma β-amyloid in Alzheimer’s disease and vascular disease. Sci. Rep. 2016, 6, 26801. [Google Scholar] [CrossRef]
- Karikari, T.K.; Benedet, A.L.; Ashton, N.J.; Rodriguez, J.L.; Snellman, A.; Suárez-Calvet, M.; Saha-Chaudhuri, P.; Lussier, F.; Kvartsberg, H.; Rial, A.M.; et al. Diagnostic performance and prediction of clinical progression of plasma phospho-tau181 in the Alzheimer’s Disease Neuroimaging Initiative. Mol. Psychiatry 2020, 26, 429–442. [Google Scholar] [CrossRef]
- Bennett, D.A.; Schneider, J.A.; Arvanitakis, Z.; Wilson, R.S. Overview and Findings from the Religious Orders Study. Curr. Alzheimer Res. 2012, 9, 628–645. [Google Scholar] [CrossRef]
- Caspi, R.; Altman, T.; Dreher, K.; Fulcher, C.A.; Subhraveti, P.; Keseler, I.M.; Kothari, A.; Krummenacker, M.; Latendresse, M.; Mueller, L.A.; et al. The MetaCyc database of metabolic pathways and enzymes and the BioCyc collection of pathway/genome databases. Nucleic Acids Res. 2011, 40, D742–D753. [Google Scholar] [CrossRef]
- Chen, Y.; Chen, Y.; Shi, C.; Huang, Z.; Zhang, Y.; Li, S.; Li, Y.; Ye, J.; Yu, C.; Li, Z.; et al. SOAPnuke: a MapReduce acceleration-supported software for integrated quality control and preprocessing of high-throughput sequencing data. GigaScience 2017, 7, 1–6. [Google Scholar] [CrossRef]
- Zhang, Y.; Park, C.; Bennett, C.; Thornton, M.; Kim, D. Rapid and accurate alignment of nucleotide conversion sequencing reads with HISAT-3N. Genome Res. 2021, 31, 1290–1295. [Google Scholar] [CrossRef]
- Kang, Y.-J.; Yang, D.-C.; Kong, L.; Hou, M.; Meng, Y.-Q.; Wei, L.; Gao, G. CPC2: a fast and accurate coding potential calculator based on sequence intrinsic features. Nucleic Acids Res. 2017, 45, W12–W16. [Google Scholar] [CrossRef]
- Han, S.; Liang, Y.; Li, Y.; Du, W. Long Noncoding RNA Identification: Comparing Machine Learning Based Tools for Long Noncoding Transcripts Discrimination. BioMed Res. Int. 2016, 2016, 1–14. [Google Scholar] [CrossRef]
- Wang, L.; Park, H.J.; Dasari, S.; Wang, S.; Kocher, J.-P.; Li, W. CPAT: Coding-Potential Assessment Tool using an alignment-free logistic regression model. Nucleic Acids Res. 2013, 41, e74–e74. [Google Scholar] [CrossRef]
- Li, A.; Zhang, J.; Zhou, Z. PLEK: a tool for predicting long non-coding RNAs and messenger RNAs based on an improved k-mer scheme. BMC Bioinform. 2014, 15, 1–10. [Google Scholar] [CrossRef]
- Tong, X.; Liu, S. CPPred: coding potential prediction based on the global description of RNA sequence. Nucleic Acids Res. 2019, 47, e43–e43. [Google Scholar] [CrossRef]
- Love, M.I.; Huber, W.; Anders, S. Moderated estimation of fold change and dispersion for RNA-seq data with DESeq2. Genome Biol. 2014, 15, 550. [Google Scholar] [CrossRef]
- Frazee, A.C.; Pertea, G.; Jaffe, A.E.; Langmead, B.; Salzberg, S.L.; Leek, J.T. Ballgown bridges the gap between transcriptome assembly and expression analysis. Nat. Biotechnol. 2015, 33, 243–246. [Google Scholar] [CrossRef]
- Subramanian, A.; Tamayo, P.; Mootha, V.K.; Mukherjee, S.; Ebert, B.L.; Gillette, M.A.; Paulovich, A.; Pomeroy, S.L.; Golub, T.R.; Lander, E.S.; et al. Gene set enrichment analysis: A knowledge-based approach for interpreting genome-wide expression profiles. Proc. Natl. Acad. Sci. USA 2005, 102, 15545–15550. [Google Scholar] [CrossRef]
- Ponting, C.P.; Oliver, P.L.; Reik, W. Evolution and Functions of Long Noncoding RNAs. Cell 2009, 136, 629–641. [Google Scholar] [CrossRef]
- E Kornienko, A.; Guenzl, P.M.; Barlow, D.P.; Pauler, F.M. Gene regulation by the act of long non-coding RNA transcription. BMC Biol. 2013, 11, 1–59. [Google Scholar] [CrossRef]
- Liu, S.; Wu, J.; Zhang, W.; Jiang, H.; Zhou, Y.; Liu, J.; Mao, H.; Liu, S.; Chen, B. Whole-Transcriptome RNA Sequencing Uncovers the Global Expression Changes and RNA Regulatory Networks in Duck Embryonic Myogenesis. Int. J. Mol. Sci. 2023, 24, 16387. [Google Scholar] [CrossRef]
- Li, X.; Shahid, M.Q.; Wen, M.; Chen, S.; Yu, H.; Jiao, Y.; Lu, Z.; Li, Y.; Liu, X. Global identification and analysis revealed differentially expressed lncRNAs associated with meiosis and low fertility in autotetraploid rice. BMC Plant Biol. 2020, 20, 1–19. [Google Scholar] [CrossRef]
- Wenzel, A.; Akbaşli, E.; Gorodkin, J. RIsearch: fast RNA–RNA interaction search using a simplified nearest-neighbor energy model. Bioinformatics 2012, 28, 2738–2746. [Google Scholar] [CrossRef]
- Sun, H.; Cao, X.; Sumayya; Ma, Y. ; Li, H.; Han, W.; Qu, L. Genome-wide transcriptional profiling and functional analysis of long noncoding RNAs and mRNAs in chicken macrophages associated with the infection of avian pathogenic E. coli. BMC Veter- Res. 2024, 20, 1–17. [Google Scholar] [CrossRef]
- Altmann, A.; Toloşi, L.; Sander, O.; Lengauer, T. Permutation importance: a corrected feature importance measure. Bioinformatics 2010, 26, 1340–1347. [Google Scholar] [CrossRef]
- Guo, X.; Gao, L.; Liao, Q.; Xiao, H.; Ma, X.; Yang, X.; Luo, H.; Zhao, G.; Bu, D.; Jiao, F.; et al. Long non-coding RNAs function annotation: a global prediction method based on bi-colored networks. Nucleic Acids Res. 2012, 41, e35–e35. [Google Scholar] [CrossRef]
- J. Enright, S. J. Enright, S. Van Dongen, and C. A. Ouzounis, ‘An efficient algorithm for large-scale detection of protein families’, Nucleic Acids Res., vol. 30, no. 7, pp. 1575–1584, Apr. 2002.
- Kanehisa, M.; Goto, S. KEGG: Kyoto Encyclopedia of Genes and Genomes. Nucleic Acids Res. 2000, 28, 27–30. [Google Scholar] [CrossRef]
- Reactome’. Accessed: Dec. 29, 2019. [Online]. Available: http://bmdb.cbi.pku.edu.cn/Reactome.php.
- Wu, T.; Hu, E.; Xu, S.; Chen, M.; Guo, P.; Dai, Z.; Feng, T.; Zhou, L.; Tang, W.; Zhan, L.; et al. clusterProfiler 4.0: A universal enrichment tool for interpreting omics data. Innovation 2021, 2, 100141. [Google Scholar] [CrossRef] [PubMed]
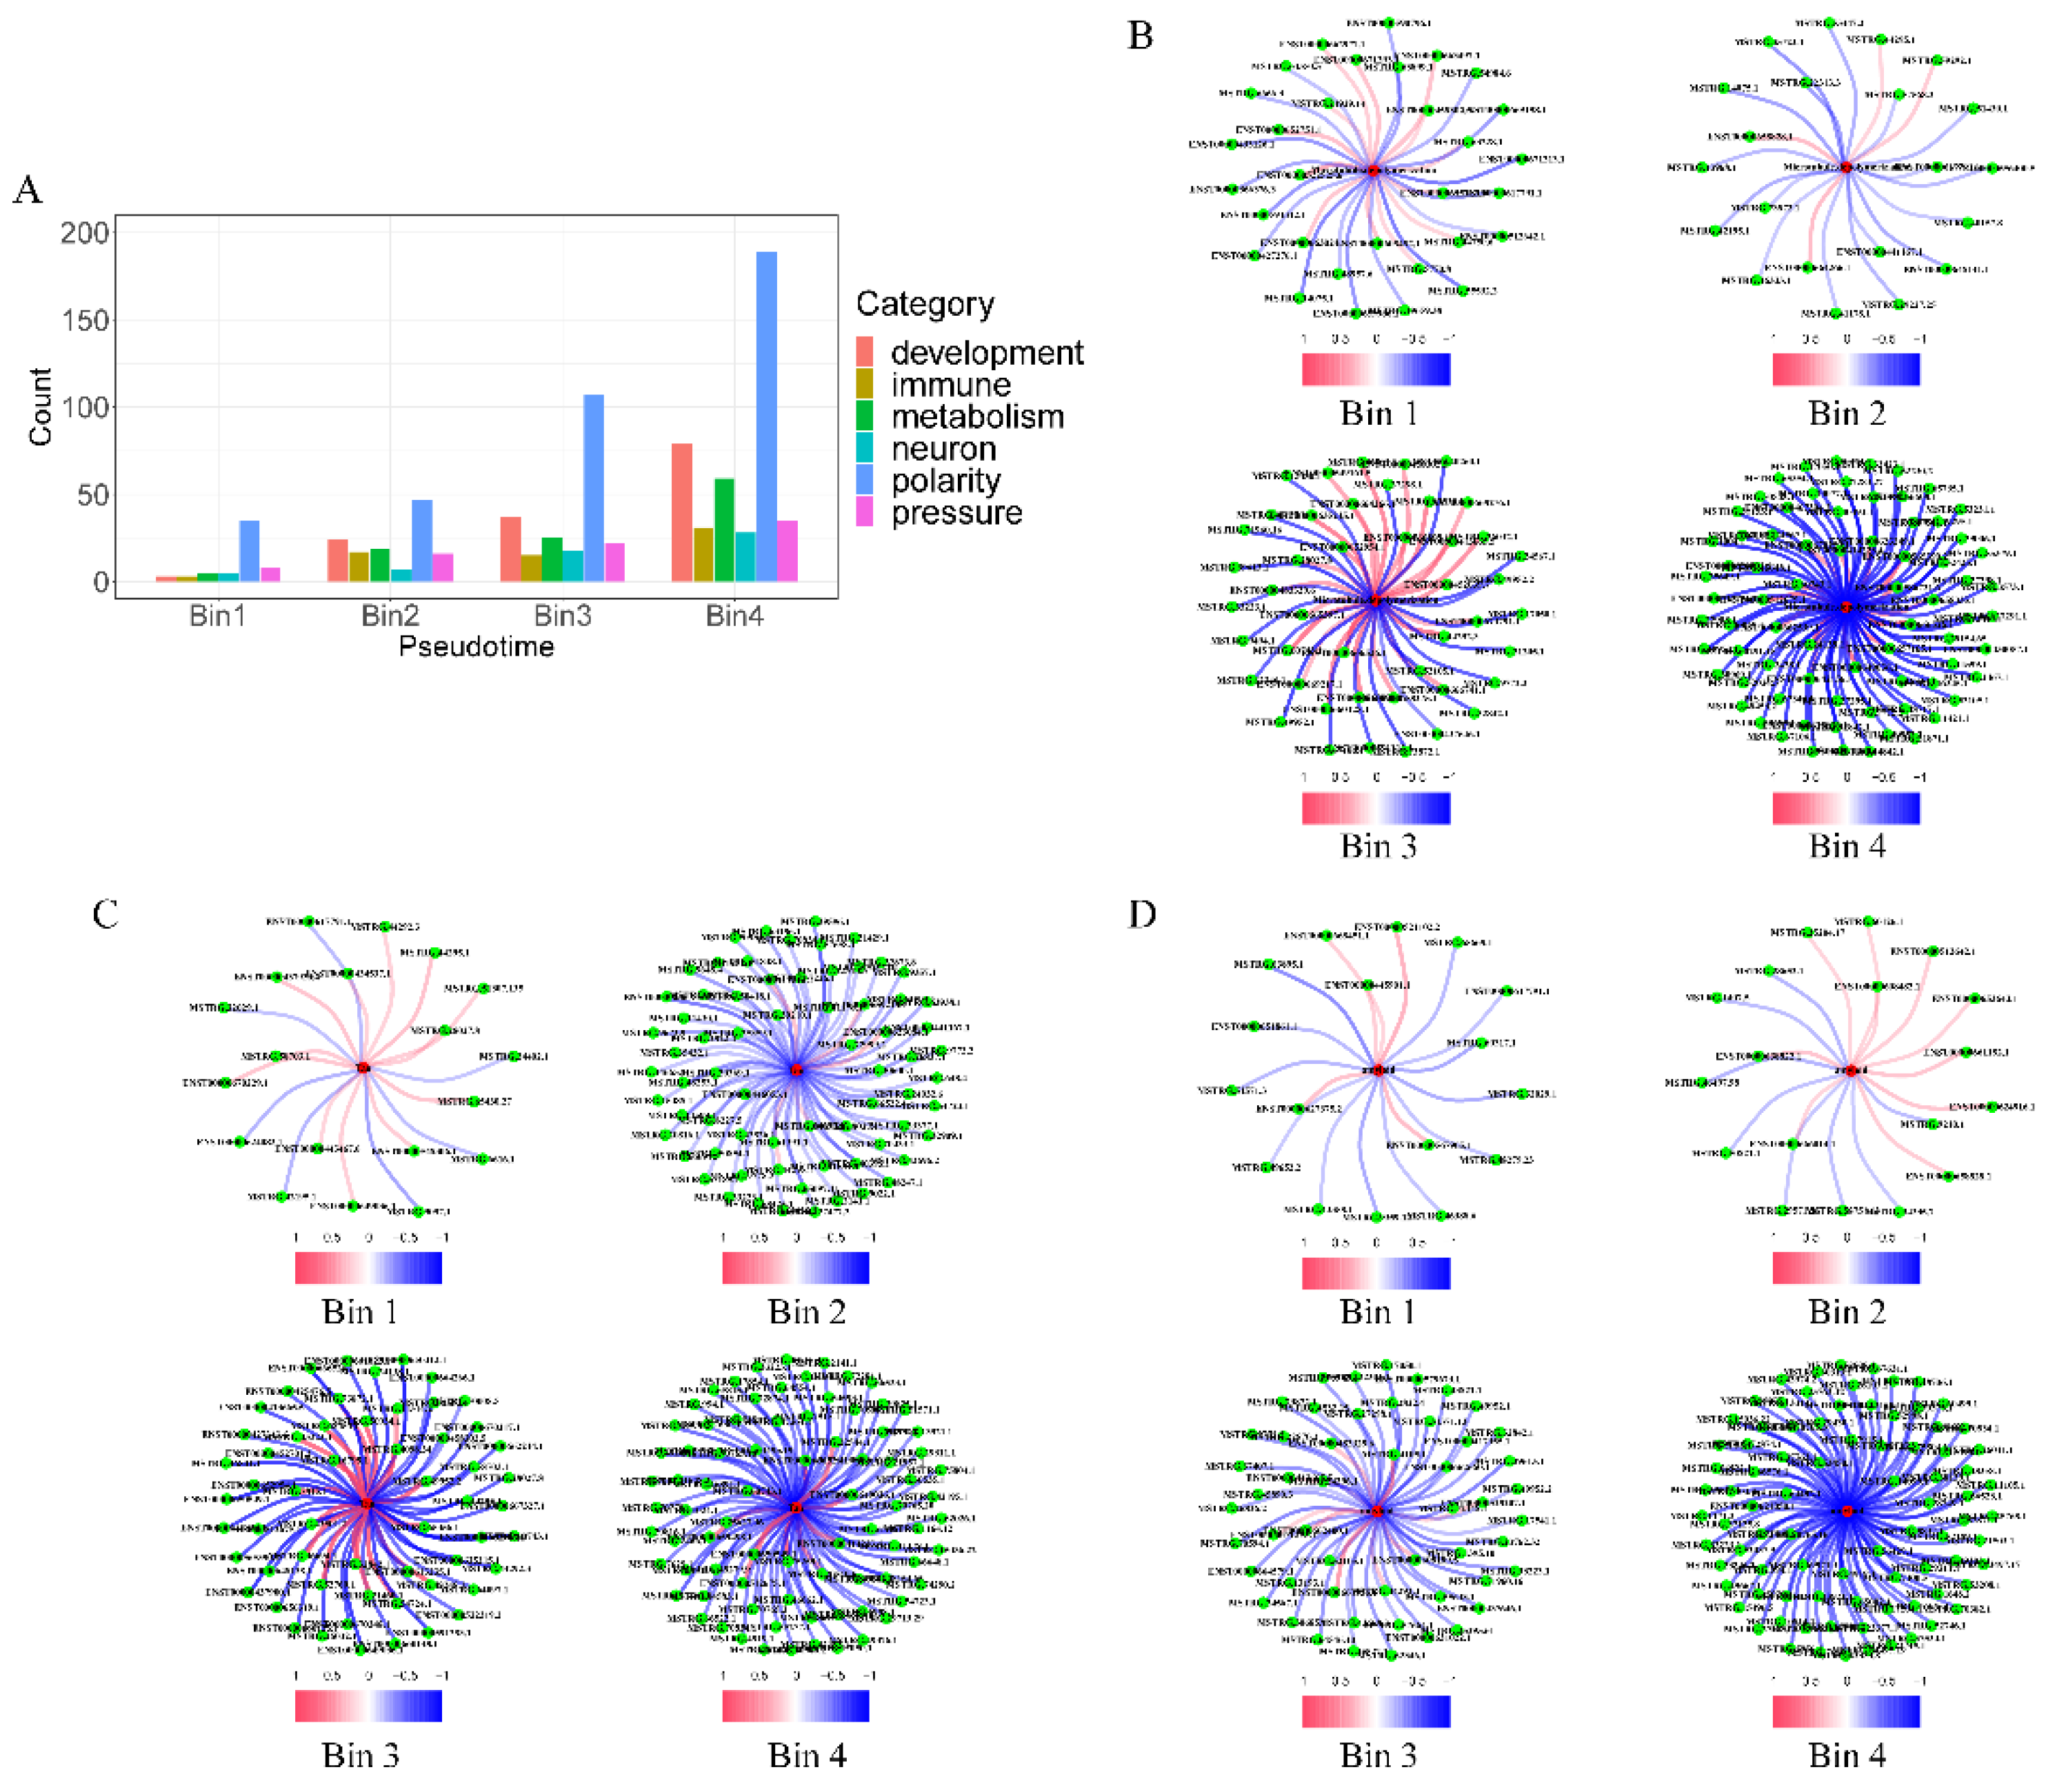
| Pesudotime | Immune activity | Metabolic reprogramming | Cell polarity | Stress response |
|---|---|---|---|---|
| Bin1 | 160 | 339 | 876 | 827 |
| Bin2 | 1069 | 729 | 1569 | 1291 |
| Bin3 | 863 | 1362 | 1522 | 1421 |
| Bin4 | 1916 | 5156 | 5230 | 5204 |
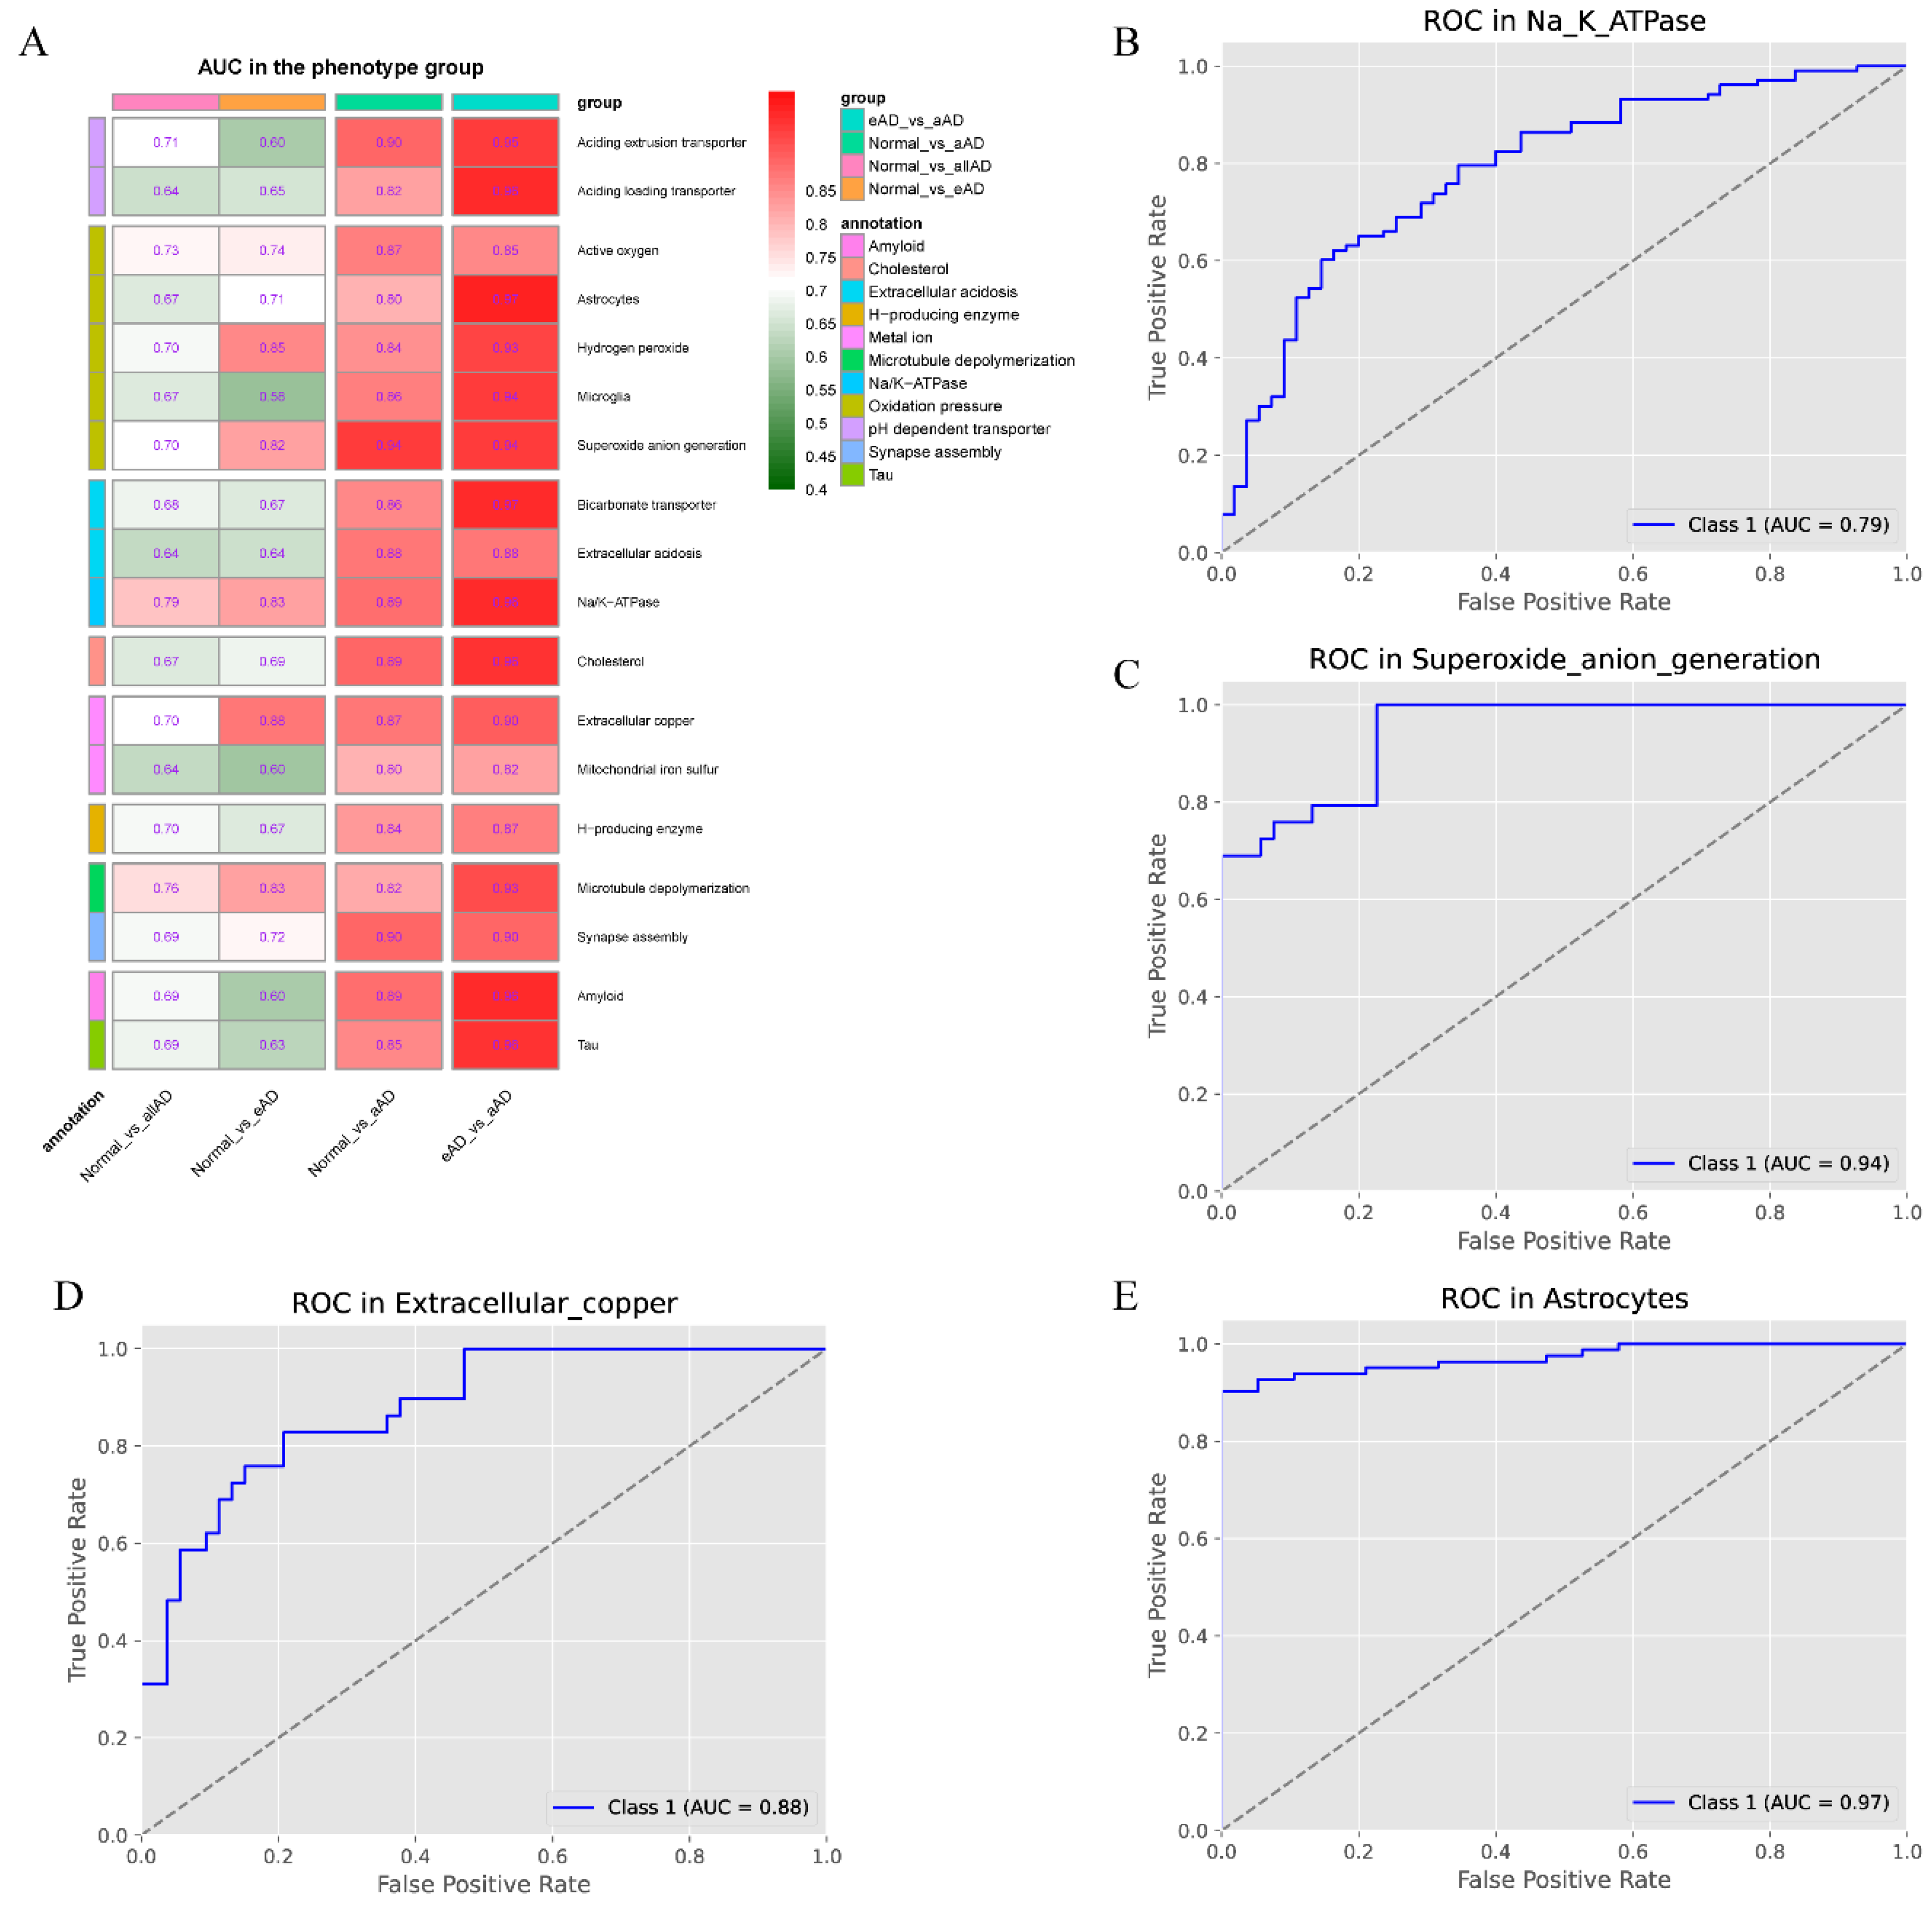
| Phenotype | Normal_vs_allAD | Normal_vs_eAD | Normal_vs_aAD | eAD_vs_aAD |
|---|---|---|---|---|
| Aciding extrusion transporter | 0.7124 | 0.6018 | 0.8998 | 0.9499 |
| Aciding loading transporter | 0.6448 | 0.6539 | 0.825 | 0.9602 |
| Active oxygen | 0.7297 | 0.7365 | 0.8673 | 0.8543 |
| Astrocytes | 0.6653 | 0.7124 | 0.8029 | 0.9718 |
| Hydrogen peroxide | 0.6981 | 0.851 | 0.8412 | 0.9339 |
| Microglia | 0.6669 | 0.581 | 0.8614 | 0.9429 |
| Superoxide anion generation | 0.7015 | 0.823 | 0.944 | 0.9416 |
| Bicarbonate transporter | 0.6819 | 0.6675 | 0.8595 | 0.9685 |
| Extracellular acidosis | 0.6373 | 0.6425 | 0.8783 | 0.878 |
| Na+/K+-ATPase | 0.7866 | 0.8256 | 0.8881 | 0.9615 |
| Cholesterol | 0.6694 | 0.6871 | 0.8939 | 0.9557 |
| Extracellular copper | 0.701 | 0.8783 | 0.8718 | 0.9018 |
| Mitochondrial iron sulfur | 0.6378 | 0.5979 | 0.8022 | 0.8228 |
| H-producing enzyme | 0.6971 | 0.6662 | 0.8399 | 0.8652 |
| Microtubule depolymerization | 0.7562 | 0.8256 | 0.8198 | 0.9268 |
| Synapse assembly | 0.6909 | 0.7235 | 0.8979 | 0.8967 |
| Amyloid | 0.6914 | 0.6012 | 0.8855 | 0.9634 |
| Tau | 0.6858 | 0.6291 | 0.8549 | 0.957 |
Disclaimer/Publisher’s Note: The statements, opinions and data contained in all publications are solely those of the individual author(s) and contributor(s) and not of MDPI and/or the editor(s). MDPI and/or the editor(s) disclaim responsibility for any injury to people or property resulting from any ideas, methods, instructions or products referred to in the content. |
© 2024 by the authors. Licensee MDPI, Basel, Switzerland. This article is an open access article distributed under the terms and conditions of the Creative Commons Attribution (CC BY) license (http://creativecommons.org/licenses/by/4.0/).


