Preprint
Article

Synthesis of Carbon Dots Extracted from Black Mulberry Fruits for Photocatalytic Degradation

This version is not peer-reviewed.

Submitted:

17 August 2024

Posted:

20 August 2024

You are already at the latest version

Abstract
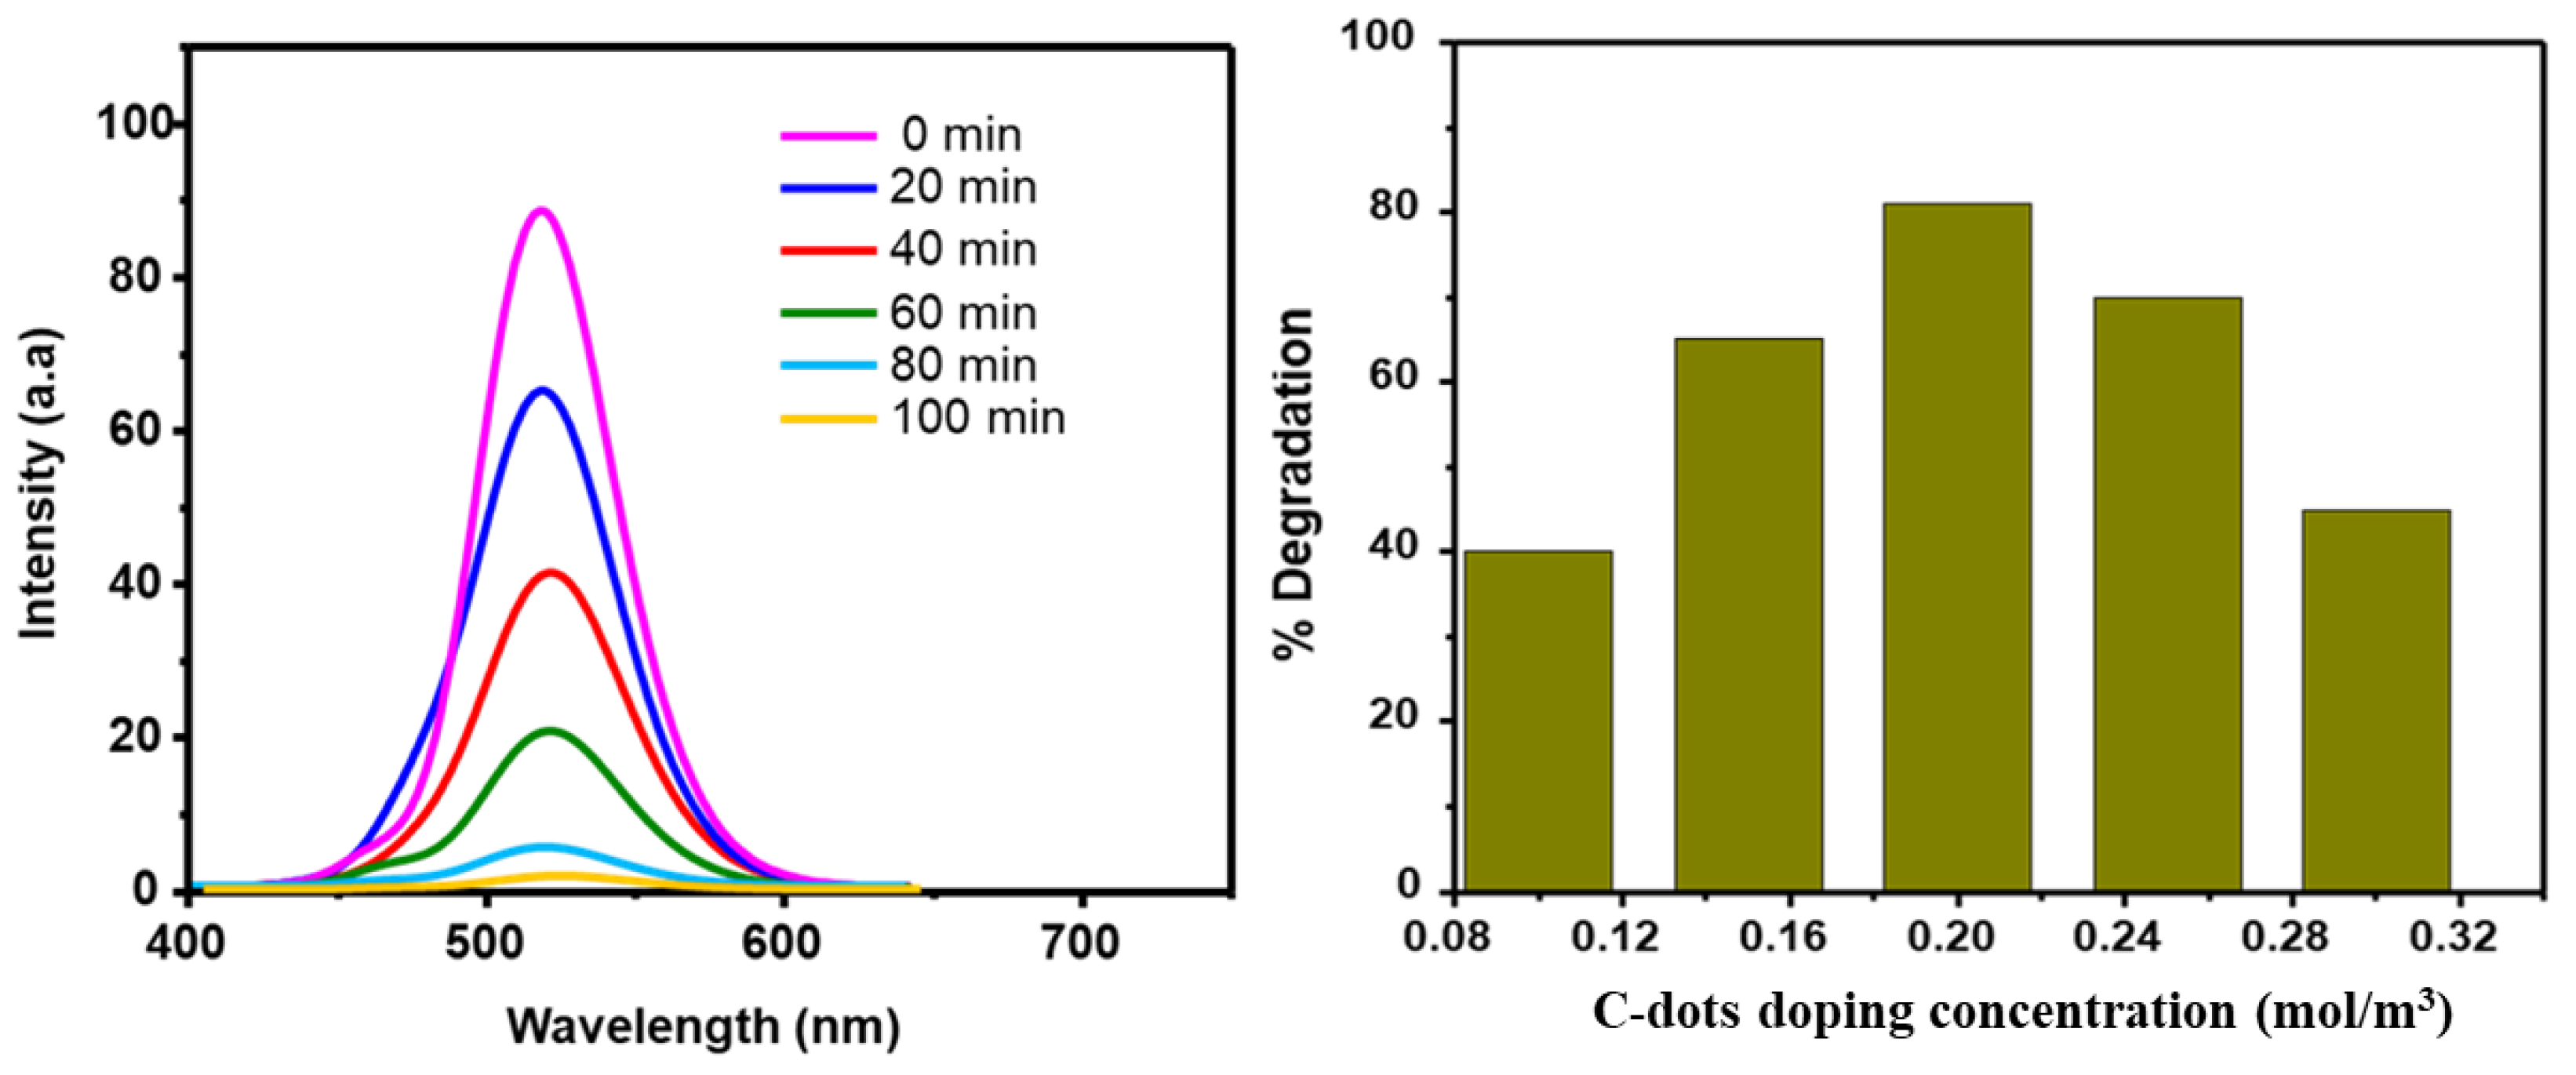
The utilization of black mulberry fruit as a precursor for C-dot synthesis represents a novel ap-proach to biosynthesizing C-dots. Through the implementation of a hydrothermal autoclave, we successfully produced C-dots using the fruit extract. This environmentally conscious and sustain-able method of synthesis presents a promising avenue for C-dot production. Our findings demon-strate the remarkable photocatalytic activity of the C-dots, as evidenced by their effective degra-dation of pollutants under visible light irradiation. This discovery holds significant implications for addressing water contamination issues and promoting environmental remediation efforts. Fur-thermore, we conducted a thorough investigation to determine the optimal doping concentration of C-dots, ultimately identifying 0.2 M as the ideal concentration. At this specific concentration, the photo catalytic degradation of pollutants reached an impressive rate of 95.8%. The enhanced photocatalytic activity can be attributed to the increased electron trapping resulting from the presence of additional surface sites and the absorption of different wavelengths of light. In sum-mary, this research contributes to the sustainable synthesis of carbon dots using black mulberry fruits as a precursor, while also providing a comprehensive analysis of their optical and photo-catalytic properties.
Keywords: 
Subject: 
Chemistry and Materials Science  -   Materials Science and Technology

1. Introduction

Photo-catalytic degradation of carbon dots (C-dots) refers to the process of breaking down nanoscale carbon-based materials with unique optical properties [1,2]. These dots possess the ability to absorb light energy and emit it at a different wavelength, a phenomenon known as photocatalysis [3]. The emission of light from carbon dots finds applications in various fields such as sensing, imaging, and optoelectronics [4,5]. Black mulberry fruits (Morus nigra), belonging to the Moraceae family [6,7], were the chosen source for deriving carbon dots in this study, indicating that the researchers extracted and synthesized these dots from the components of the fruit [6,7]. Photocatalytic degradation involves the use of a photocatalyst to break down or decompose organic pollutants in the presence of light Photocatalytic degradation involves the use of a photocatalyst to decompose or break down organic pollutants in the presence of light [8]. The carbon dots derived from black mulberry fruits were examined for their potential as photocatalysts to facilitate the degradation of organic contaminants [9]. The discharge of waste effluents from pollutant industries, as well as the application of pollutants and fertilizers in agriculture, has led to elevated levels of organic pollutants in natural water bodies [10,11]. The influx of these pollutants poses a potential risk, as it can result in the formation of carcinogenic intermediates that have the potential to cause cancerous effects [12]. Nanostructures made of carbon with sizes less than 5 nm were commonly referred to as "carbon dots." Since their discovery, carbon dots have garnered significant interest in materials science as a potential alternative to semiconductor quantum dots, particularly in biological applications due to their low toxicity. Photocatalysis, solar power, bioimaging, and medication delivery are among the various applications of carbon dots [13,14,15].
Due to concerns regarding their toxicity to humans and their persistence in ecosystems, the use of certain pollutants is currently prohibited in several countries [16]. The utilization of C-dots in photocatalytic degradation is of utmost importance for water purification and photon degradation, owing to their exceptional biocompatibility, optical properties, non-toxic precursors, high solubility in water, and ease of surface passivation [17,18]. The duration of the pollutant removal and mineralization process in water varies depending on the active ingredient [19]. In order to achieve success in the fields of theoretical chemistry and applied physics for nanomaterial applications, as well as for the treatment of wastewater through photocatalytic degradation, it is crucial to employ innovative techniques for the synthesis of carbon dots with desired size, shape, and functionalities. Moreover, the use of C-dots prepared from bulk mulberry fruits is advantageous due to their affordability, simplicity, and availability. Carbon quantum dots, which are ultrafine carbon nanomaterials measuring less than 5 nm, have garnered attention for their remarkable mechanical, chemical, and fluorescent properties, as well as their photostability and biocompatibility [20,21,22]. With their straightforward and cost-effective preparation methods, C-dots are ideal for various functions and exhibit excellent photostability, biological compatibility, biosensing capabilities, and low cytotoxicity [23]. The implementation of a reliable, affordable, and rapid synthesis method for carbon dots is essential for this study, and it involves distinguishing between top-down and bottom-up approaches based on the original carbon source [24]. Numerous fluorescent C-dots derived from food waste have a wide range of applications, including sensing, drug delivery, gene transfer, biological imaging, and food safety. Examples of food waste used for C-dots synthesis include banana peels, mango peels, sugarcane bagasse, Trapa bispinosa peels, bread, and wet olive pomace [25,26]. The development of nanoscale photocatalysts with higher efficiency is currently of interest due to their sustainability and positive impact on the environment. C-dots have been employed for the treatment of pollutants, while photocatalytic carbon dot hydrogels derived from brewing waste have been utilized for wastewater treatment [19,27,28]. This study contributes significantly to the field of carbon dots synthesis, characterization, and their application in photocatalysis, particularly in the context of pollutant degradation. The adoption of black mulberry fruits as a sustainable precursor for C-dot synthesis represents a novel and environmentally friendly approach. By employing a green synthesis method, we have demonstrated the potential for the sustainable production of C-dots. This information is crucial for optimizing the performance of C-dots in various applications.

2. Experimental Methods and Chemicals

2.1. Extraction of Black Mulberry Fruits

Black mulberry fruits will be collected freshly from Umthatha. South Africa. It is first wash in water and the juice like blue color of the black mulberry will be collected and then filtered using 0.2 μm cellulose acetate membranes (filter paper).

2.2. Green Synthesis of C-Dots

A mixture of 40 ml of freshly filtered black mulberry fruit liquid and 4 ml of ethylenediamine (EDA) will be placed in a 60 ml hydrothermal autoclave and heated to 200 °C for three hours. The freshly made black paste will be allowed to cool to room temperature before being centrifuged with DI water at 3000 rpm for 15 minutes to separate the insoluble components. To eliminate unreacted organic molecules, dichloromethane will then be added to the brown solution of C-dots and centrifuged once more for 20 minutes at 3000 rpm. To eliminate larger sized particles, the upper aqueous layer will then be separated and centrifuged at 6,000 rpm for 20 min. The result will be a brownish-yellow supernatant. To characterize and utilize the prepared C-dots, they will be stored at 4 °C [29,30], as shown in Figure 1 below.
Firstly, 2 ml of deionized water and contaminated water will be measured separately using UV-Visible spectroscopy to compare their absorption bands. Similarly, 2 ml of prepared material (C-dots) will be dissolved in 2 ml of deionized water and contaminated water in parallel. By observing the different absorption spectra of the deionized water and contaminated water, we can determine whether the material is degrading the pollutant or not. Lastly, the contaminated water will be treated by subjecting it to different durations of irradiation (20 min, 40 min, 60 min, 80 min, and 100 min) using light, to degrade the pollutant.

2.3. Photocatalytic Degradation of Methylene Blue

Modifications were implemented in the previous approach to assess the photocatalytic activity of the C-dots in the degradation of the MB dye under solar radiation [31,32]. Several experimental parameters, such as dye concentration, irradiation period, reaction mixture pH, and catalyst dosage, were adjusted for optim each experiment, 20 mg of C-dots catalyst were dispersed in a 100 mL solution containing 10 mg/L of MB dye, with the pH adjusted to 8. The solution was vigorously shaken for 30 minutes at around 600 rpm in the dark to achieve an equilibrium between the photocatalysts and the MB dye in terms of adsorption and desorption. To establish an adsorption/desorption equilibrium, the suspension was stirred in the dark at approximately 600 rpm for 30 minutes prior to solar exposure. Subsequently, the suspension was exposed to direct sunlight for 120 minutes at the same stirring speed. At regular intervals of 20 minutes, 5 mL of the suspension was withdrawn and subjected to centrifugation at 6000 rpm for 15 minutes to eliminate the catalyst. The degree of solution degradation was determined using a UV-vis absorption spectrophotometer. Equation 1 was utilized to quantify the level of photocatalytic dye degradation.
P e r c e n t   o f   r e m o v a l = C O C t C O × 100
where, Co (mg/L) is the initial MB dye concentration, Ct (mg/L) is the MB concentration at time t

3. Results and Discussion

3.1. Characterization

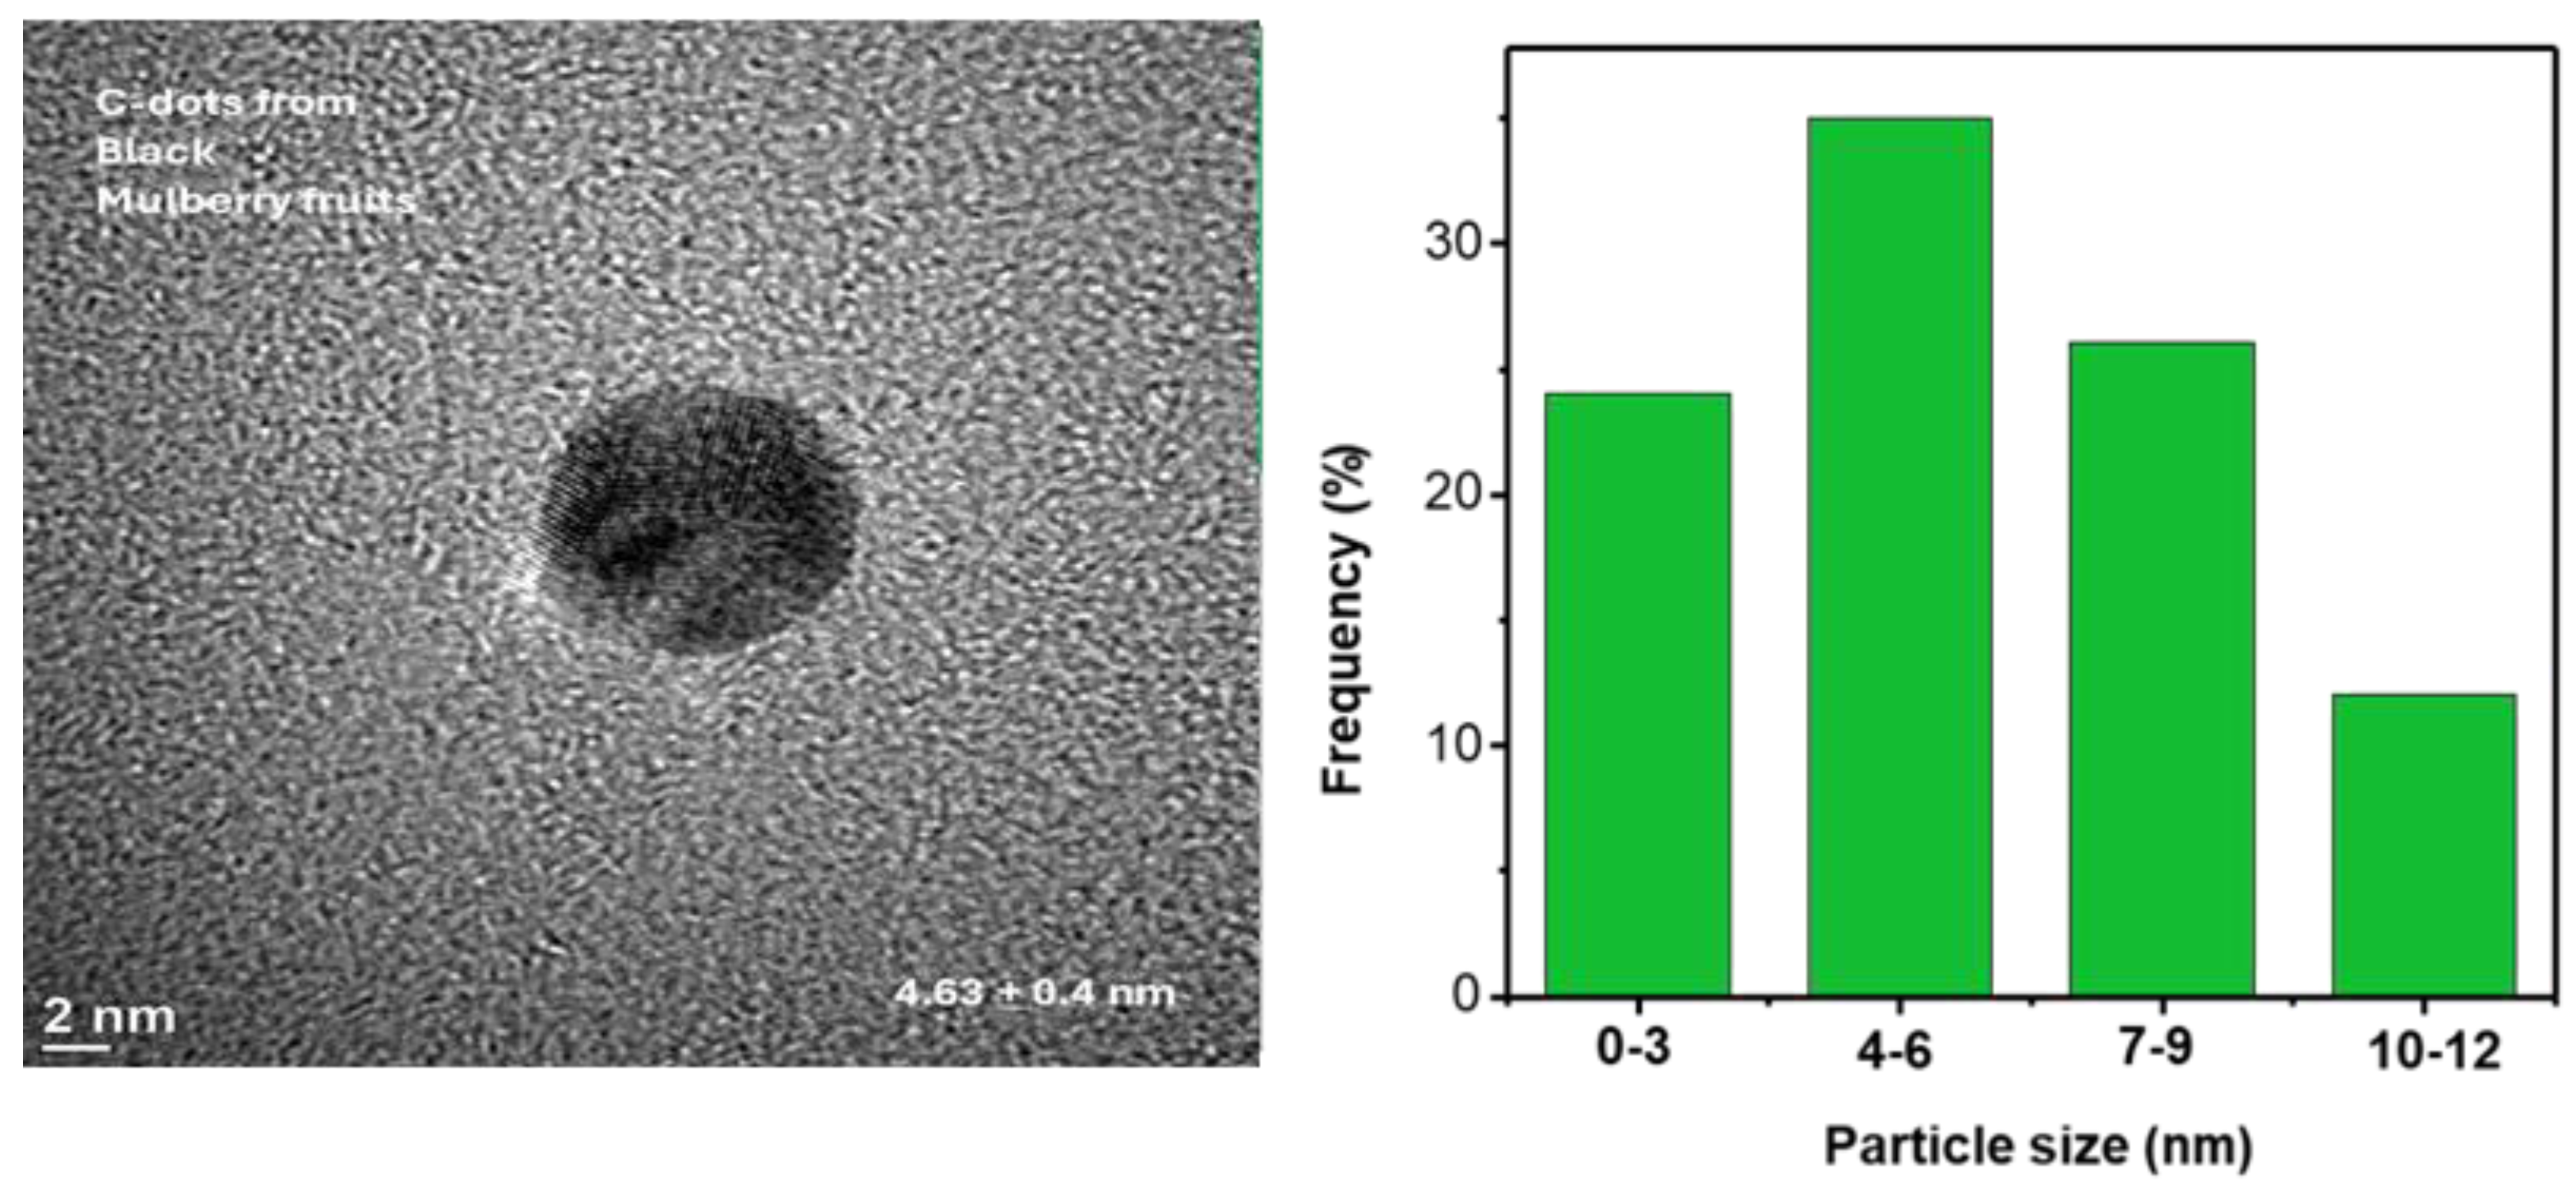
Researchers have utilized transmission electron microscopy (TEM) to investigate the size and morphology of carbon dots (C-dots). Analysis of the TEM images revealed that the average size of the C-dots was determined to be 4.63 ± 0.4 nm. This indicates that most of the observed C-dots fell within the size range of 4 nm to 6 nm, with some degree of variability around this mean value. The size distribution is typically represented by a histogram, as depicted in Figure 2, which portrays the frequency of C-dots at different size intervals. Additionally, the morphology of the C-dots was predominantly observed to be spherical, as illustrated in Figure 2. This signifies that the C-dots exhibited a rounded shape resembling that of a sphere. Furthermore, the interplanar spacing of the C-dots was determined to be 0.284 nm based on the TEM images. Interplanar spacing refers to the distance between adjacent crystal lattice planes within the C-dots. This value is consistent with what has been documented in previous literature [30,33], suggesting that the internal structure of the C-dots aligns with the expected properties. Therefore, the findings obtained from the TEM analysis of C-dots contribute to a more comprehensive comprehension of their properties and potential applications in various fields, such as nanotechnology, materials science, and bioimaging [30].
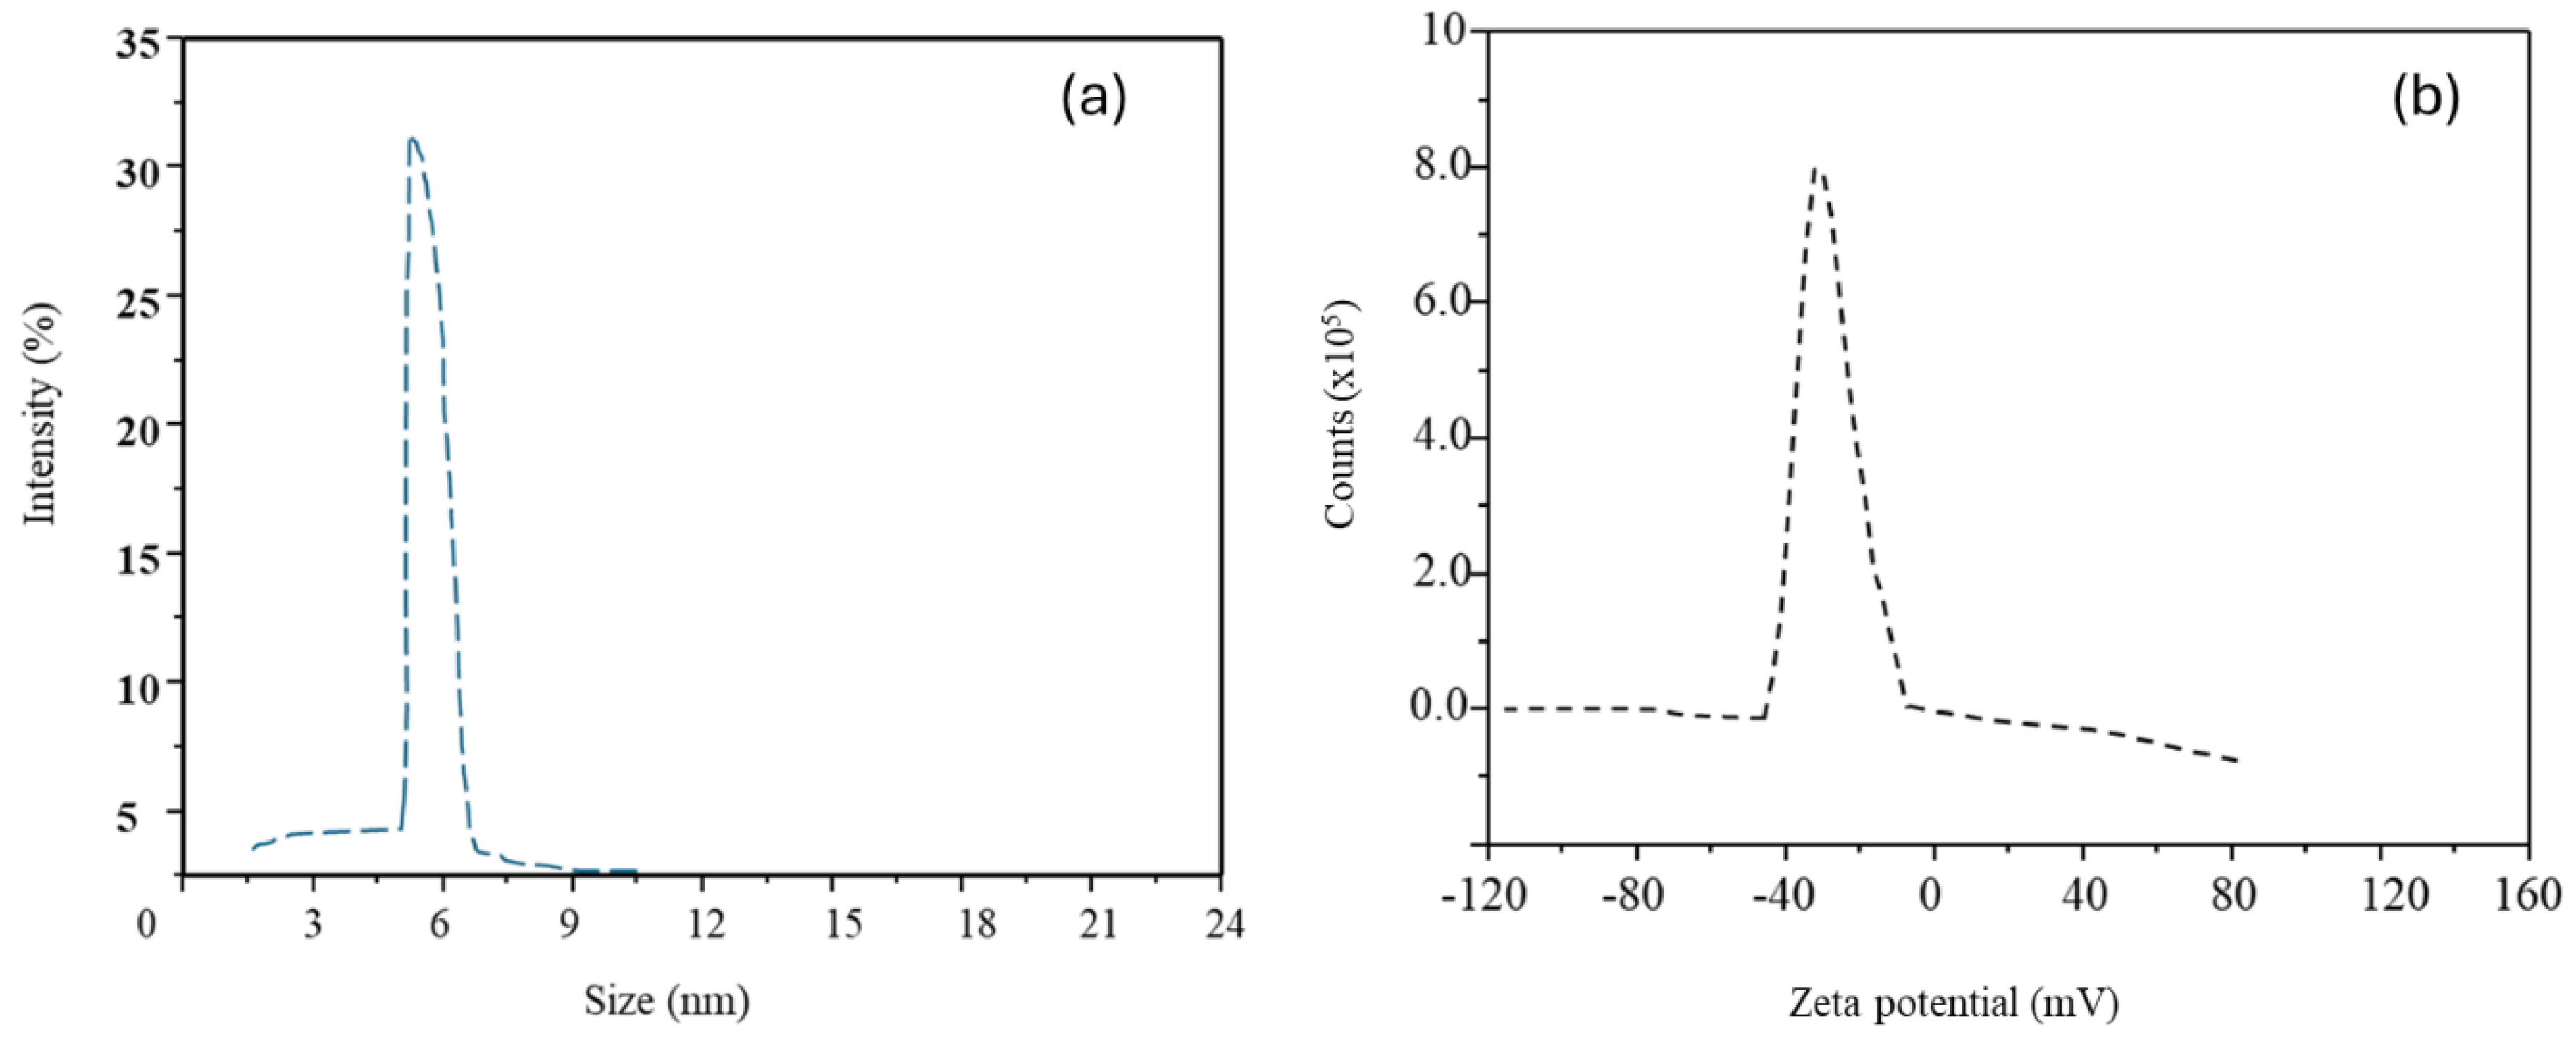
Zeta-seizer was employed to verify the size distribution of the synthesized C-dots, as depicted in Figure 3(a). The average size of the C-dots was determined to be 5.3 nm, slightly larger than the 4.6 nm value measured by TEM. It is important to consider that a particle's hydrodynamic diameter in a solvent is typically greater than its C-dot size determined in a vacuum. C-dots lacking any functional group on their surface tend to readily precipitate in aqueous-based solvents due to their hydrophobic nature. Therefore, functionalization of C-dots is crucial in achieving long-term colloidal stability, as the presence of various functional groups throughout the C-dots' surface enhances their dispersion in water-based solvents. Figure 3(b) illustrates the zeta-potential of the C-dots, characterized by a single peak at -25 mV, indicating a negative charge. To achieve successful dispersion of C-dots in a water-based solvent, it is necessary for the dots to possess negatively charged moieties on their surface, as suggested by the negative potential. However, zeta potential alone cannot determine the chemical structure of these moieties, although it does confirm the presence of negatively charged moieties on the surface of C-dots.
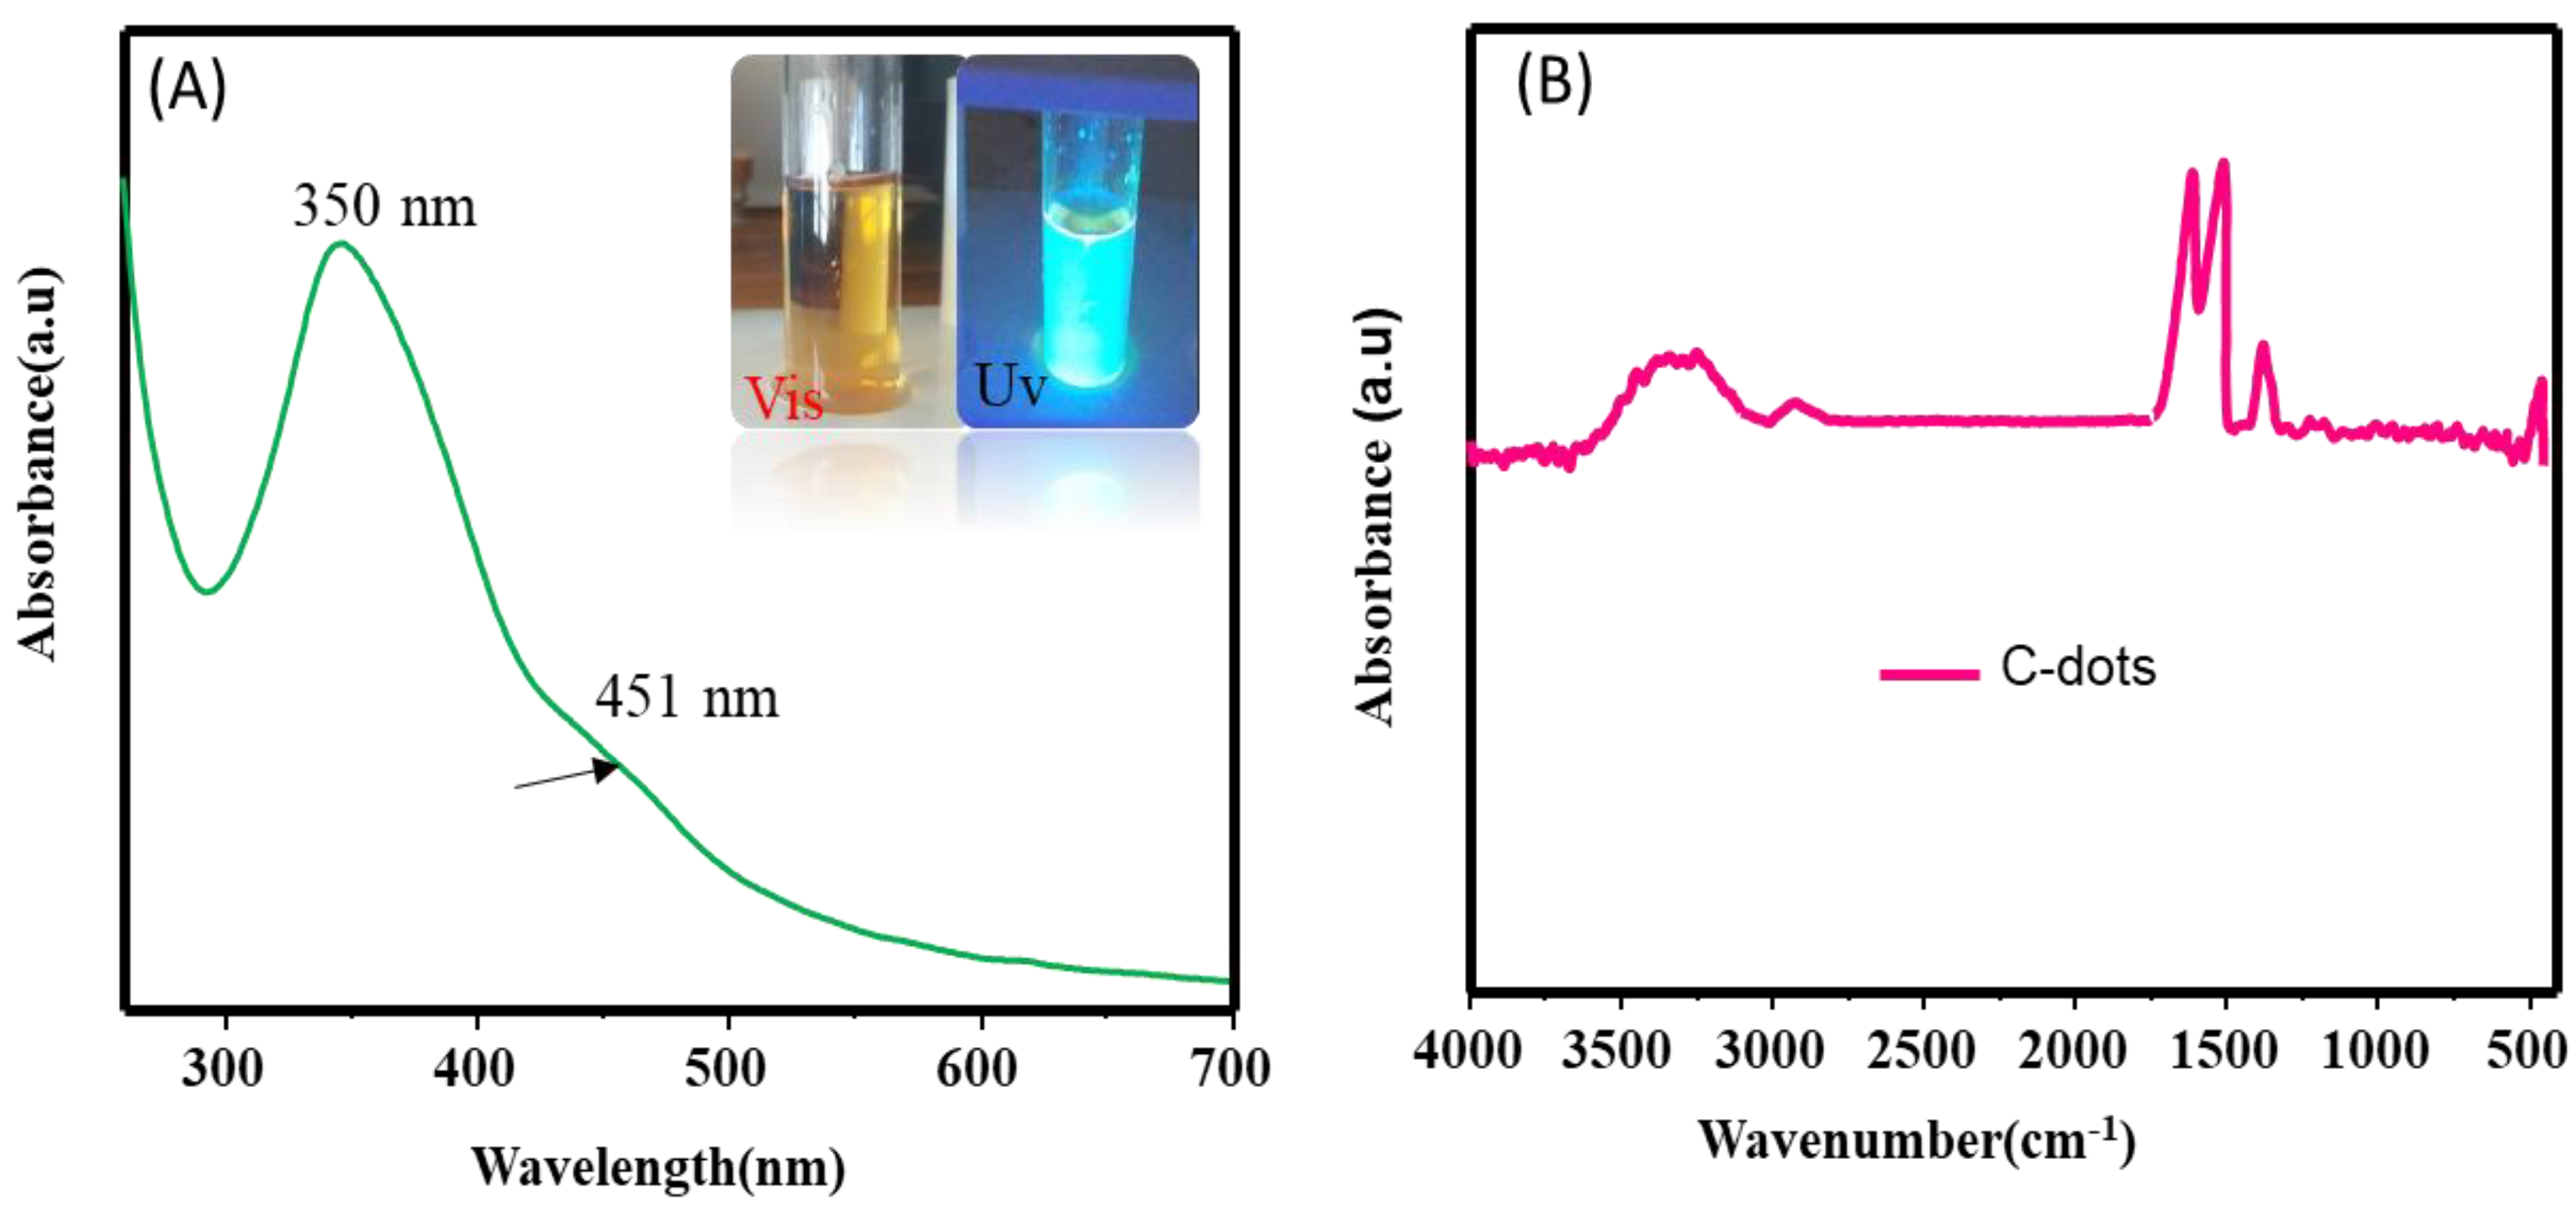
UV-Vis spectroscopy experiments were conducted to analyze the optical properties of the C-dots (Figure 4(A)). The observed absorption spectra exhibited distinctive peaks indicative of specific electronic transitions. Notably, a prominent peak at 350 nm was observed, which can be attributed to the n-π* electron transition of the carbonyl group. This transition arises due to the absorption of light in the ultraviolet region. Additionally, a smaller peak at 451 nm, as depicted in Figure 4(A), was observed and assigned to the n-π* electron transition. This transition can be associated with the absorption of light in the vicinity of the C=O and C=N bonds. These bonds contribute to electronic transitions within the C-dots structure, resulting in the observed absorption at this wavelength range. The n-π* electron transition plays a significant role in the optical properties of carbon dots. It involves the excitation of an electron from the non-bonding (n) orbital to the anti-bonding (π*) orbital of the carbonyl group within the carbon dot structure. This transition provides insights into the chemical structure, conjugation, and functional groups present in the carbon dot system.
FT-IR is a method utilized for the analysis of the molecular composition of a sample by assessing the absorption of infrared light. In the case of the C-dots obtained from Black Mulberry fruits (Figure 3(B)), five significant bands can be observed in the FTIR spectrum. Each of these bands corresponds to a specific vibration mode of distinct functional groups that were present in the C-dots derived from Black Mulberry fruits. Moreover, the aforementioned bands manifest themselves at particular wavenumbers represented in cm-1. Specifically, the band at 3390 cm-1 be attributed to the O-H vibration mode of carboxylic acid functional groups. It is important to note that carboxylic acids contain a carboxyl group (-COOH), and consequently, the absorption of infrared light arises from the O-H bond within this group. Additionally, the band at 2931 cm-1 can be assigned to the C-H (carbon-hydrogen) vibration mode of alkyl functional groups. Alkyl groups consist of carbon and hydrogen atoms that were bonded together. Therefore, it is the C-H bonds within these groups that contribute to the absorption of infrared light. As for the band at 1662 cm-1, it is associated with the C=O vibration mode of carboxylic acid functional groups. This absorption originates from the presence of a C=O bond within the carboxylic acid structure. Furthermore, the band at 1557 cm-1corresponds to the N−H/C=C vibration mode, which represents the combined vibrations of the N−H bond in amine functional groups and the C=C bond in the graphitic functional groups. Lastly, the band at 1390 cm-1 is indicative of the C=C vibration mode exhibited by the graphitic functional groups.

3.2. Photocatalytic Degradation Performance

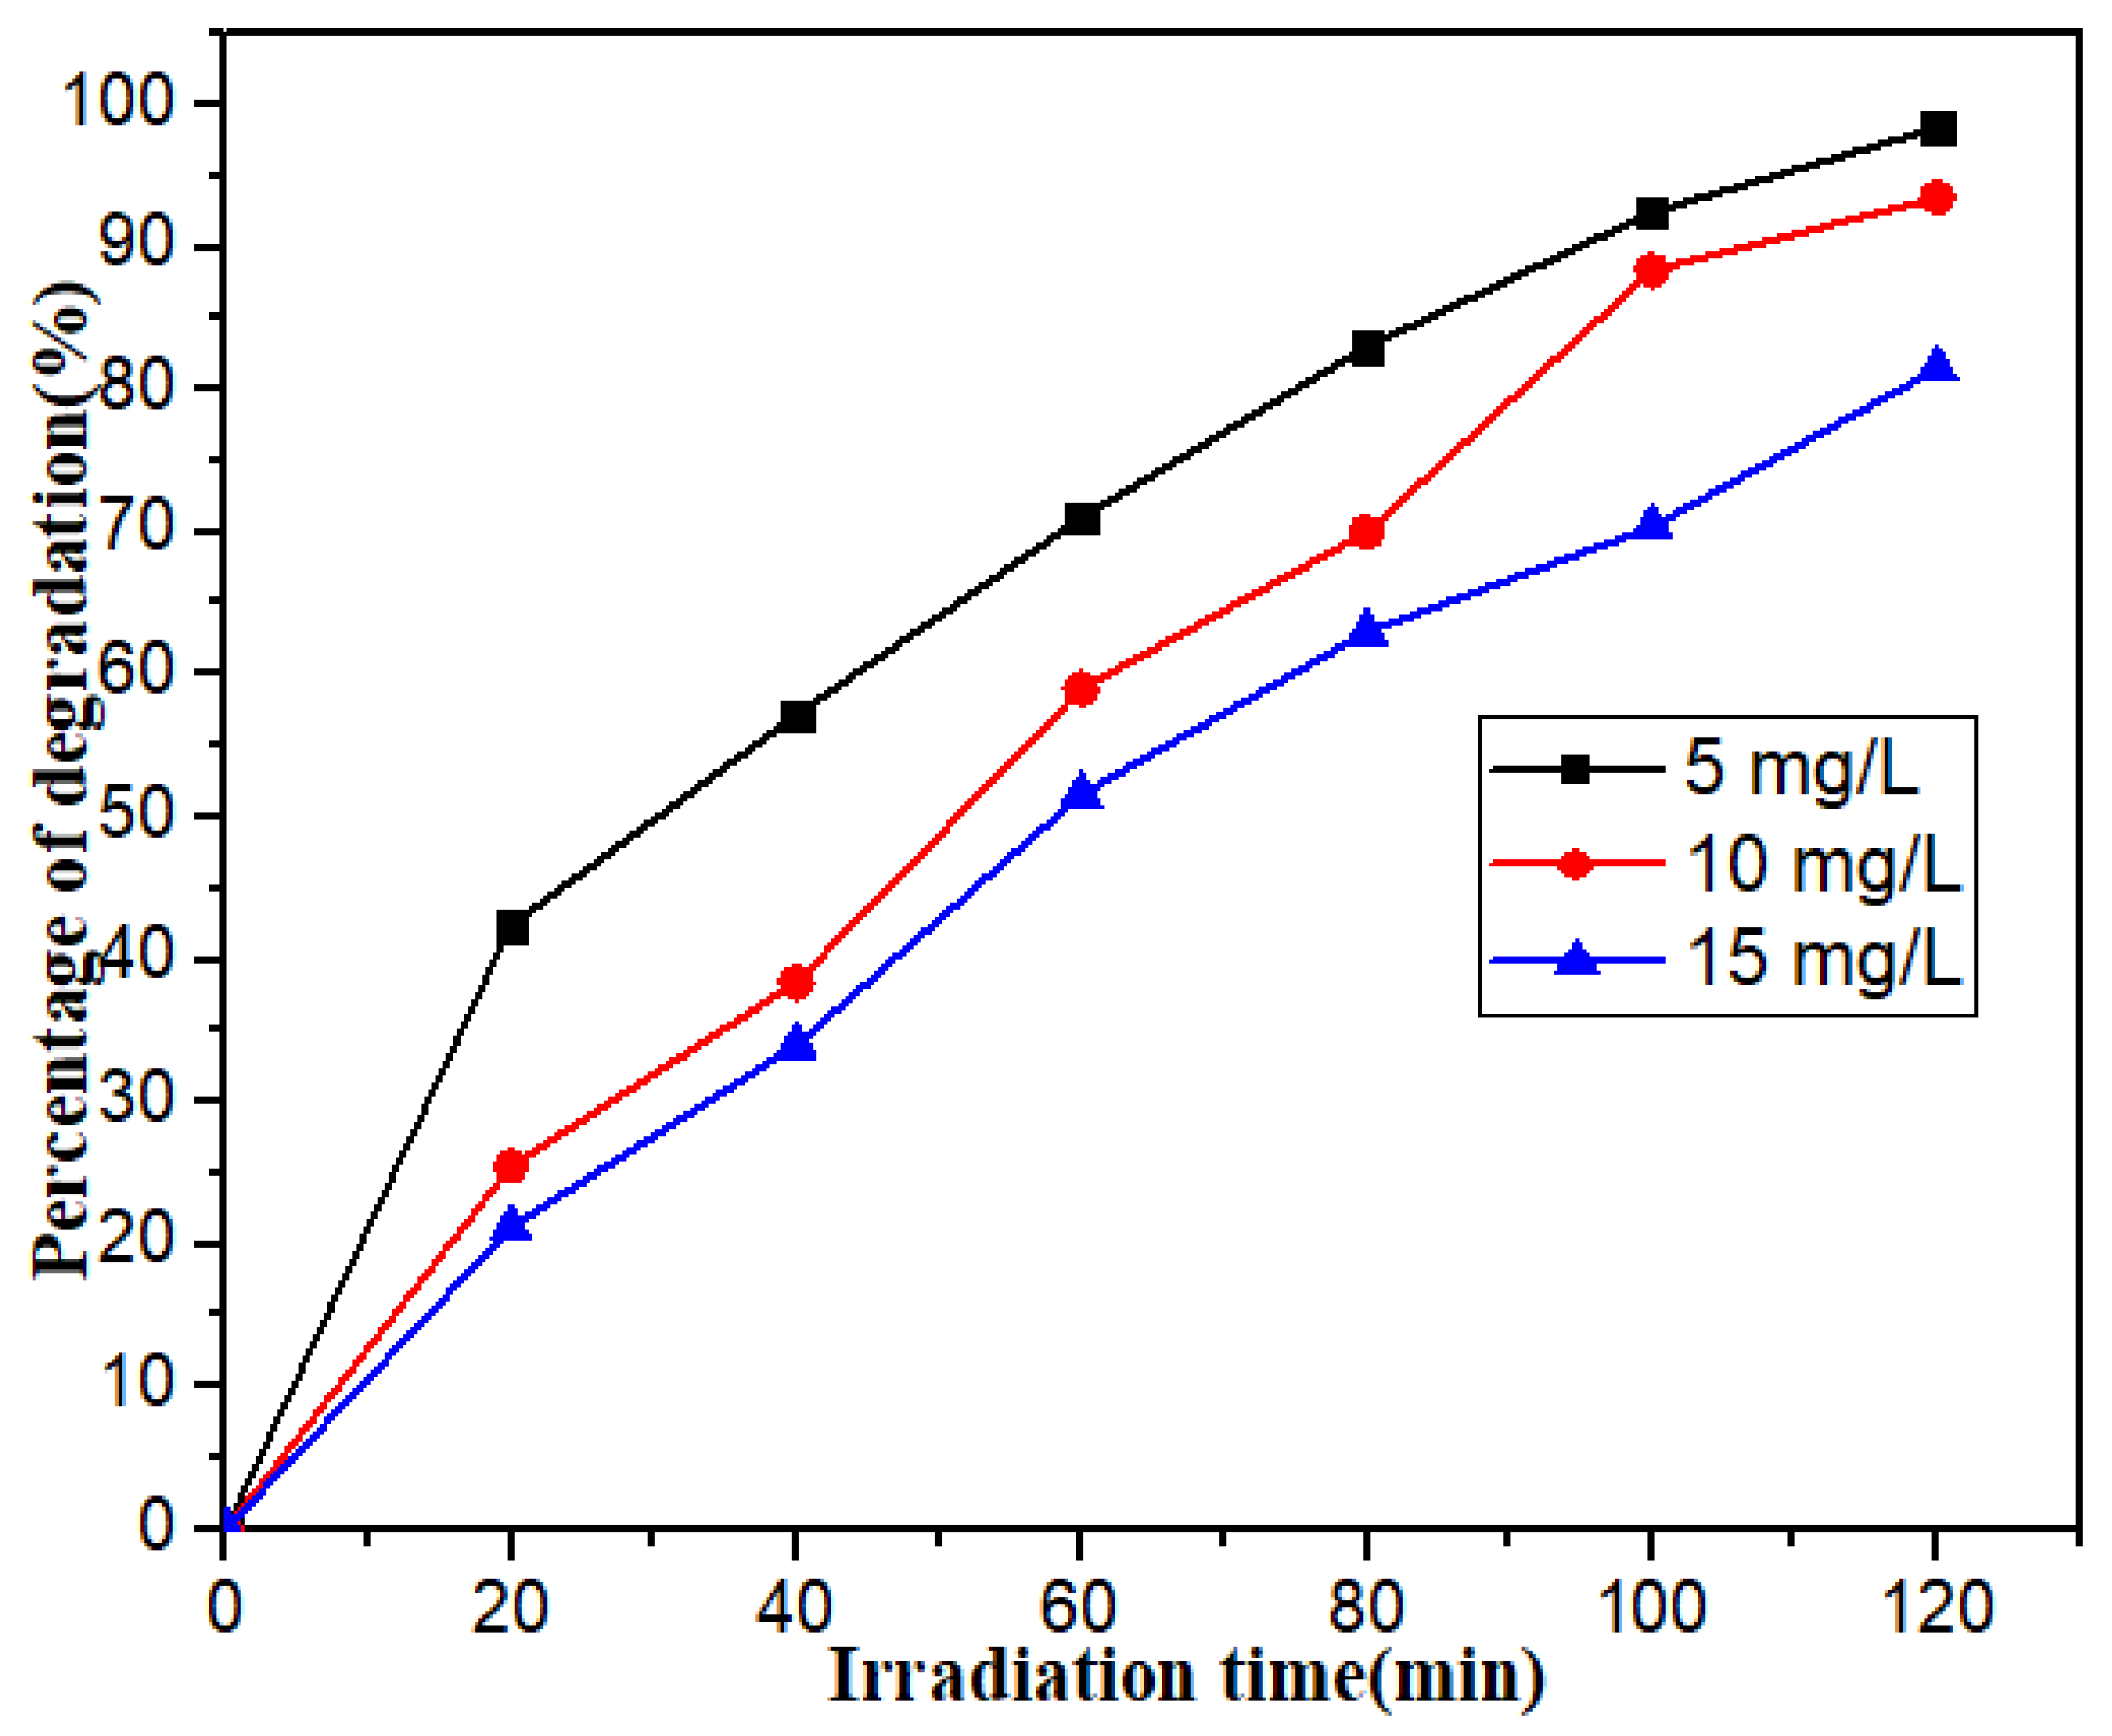
Using C-dots catalysts under solar irradiation, the effects of initial dye concentration on the percentage of photocatalytic degradation were investigated, as depicted in Figure 4. The catalyst dose remained constant at 300 mg/L throughout the experiment, while the dye (Methylene Blue, or MB) was initially introduced at concentrations of 5, 10, and 15 mg/L. After a reaction time of 120 minutes, the % clearance rates of the dyes were determined (as shown in Figure 5). The results revealed that as the concentration of MB dye increased, the degradation rate of C-dots catalysts decreased. This can be attributed to the fact that the adsorption of dye molecules onto the active sites of the catalyst approaches equilibrium as the dye concentration rises. Dye molecules possess the ability to absorb substantial amounts of sunlight when they occupy these positions, thereby reducing the incident light reaching the catalyst. Consequently, there is reduced light penetration, leading to diminished production of OH radicals—an essential component in the photocatalytic degradation process. The percentage of dye degradation is presented in Figure 4 of the study. Upon 120 minutes of irradiation, the initial concentration of MB dye increased from 5 to 15 mg/L, resulting in a loss of 95.8% of C-dots. In conclusion, the concentration of the dye significantly influences the photocatalytic degradation process. Higher dye concentrations lead to a decline in the percentage of degradation due to increased adsorption of the dye on the active sites of the catalyst, resulting in reduced light penetration and OH radical formation. Hence, higher dye concentrations lead to a decrease in the percentage of degradation due to increased adsorption of the dye on the catalyst's active sites, leading to reduced light penetration and diminished production of OH radicals.

3.3. Photoluminsince Results

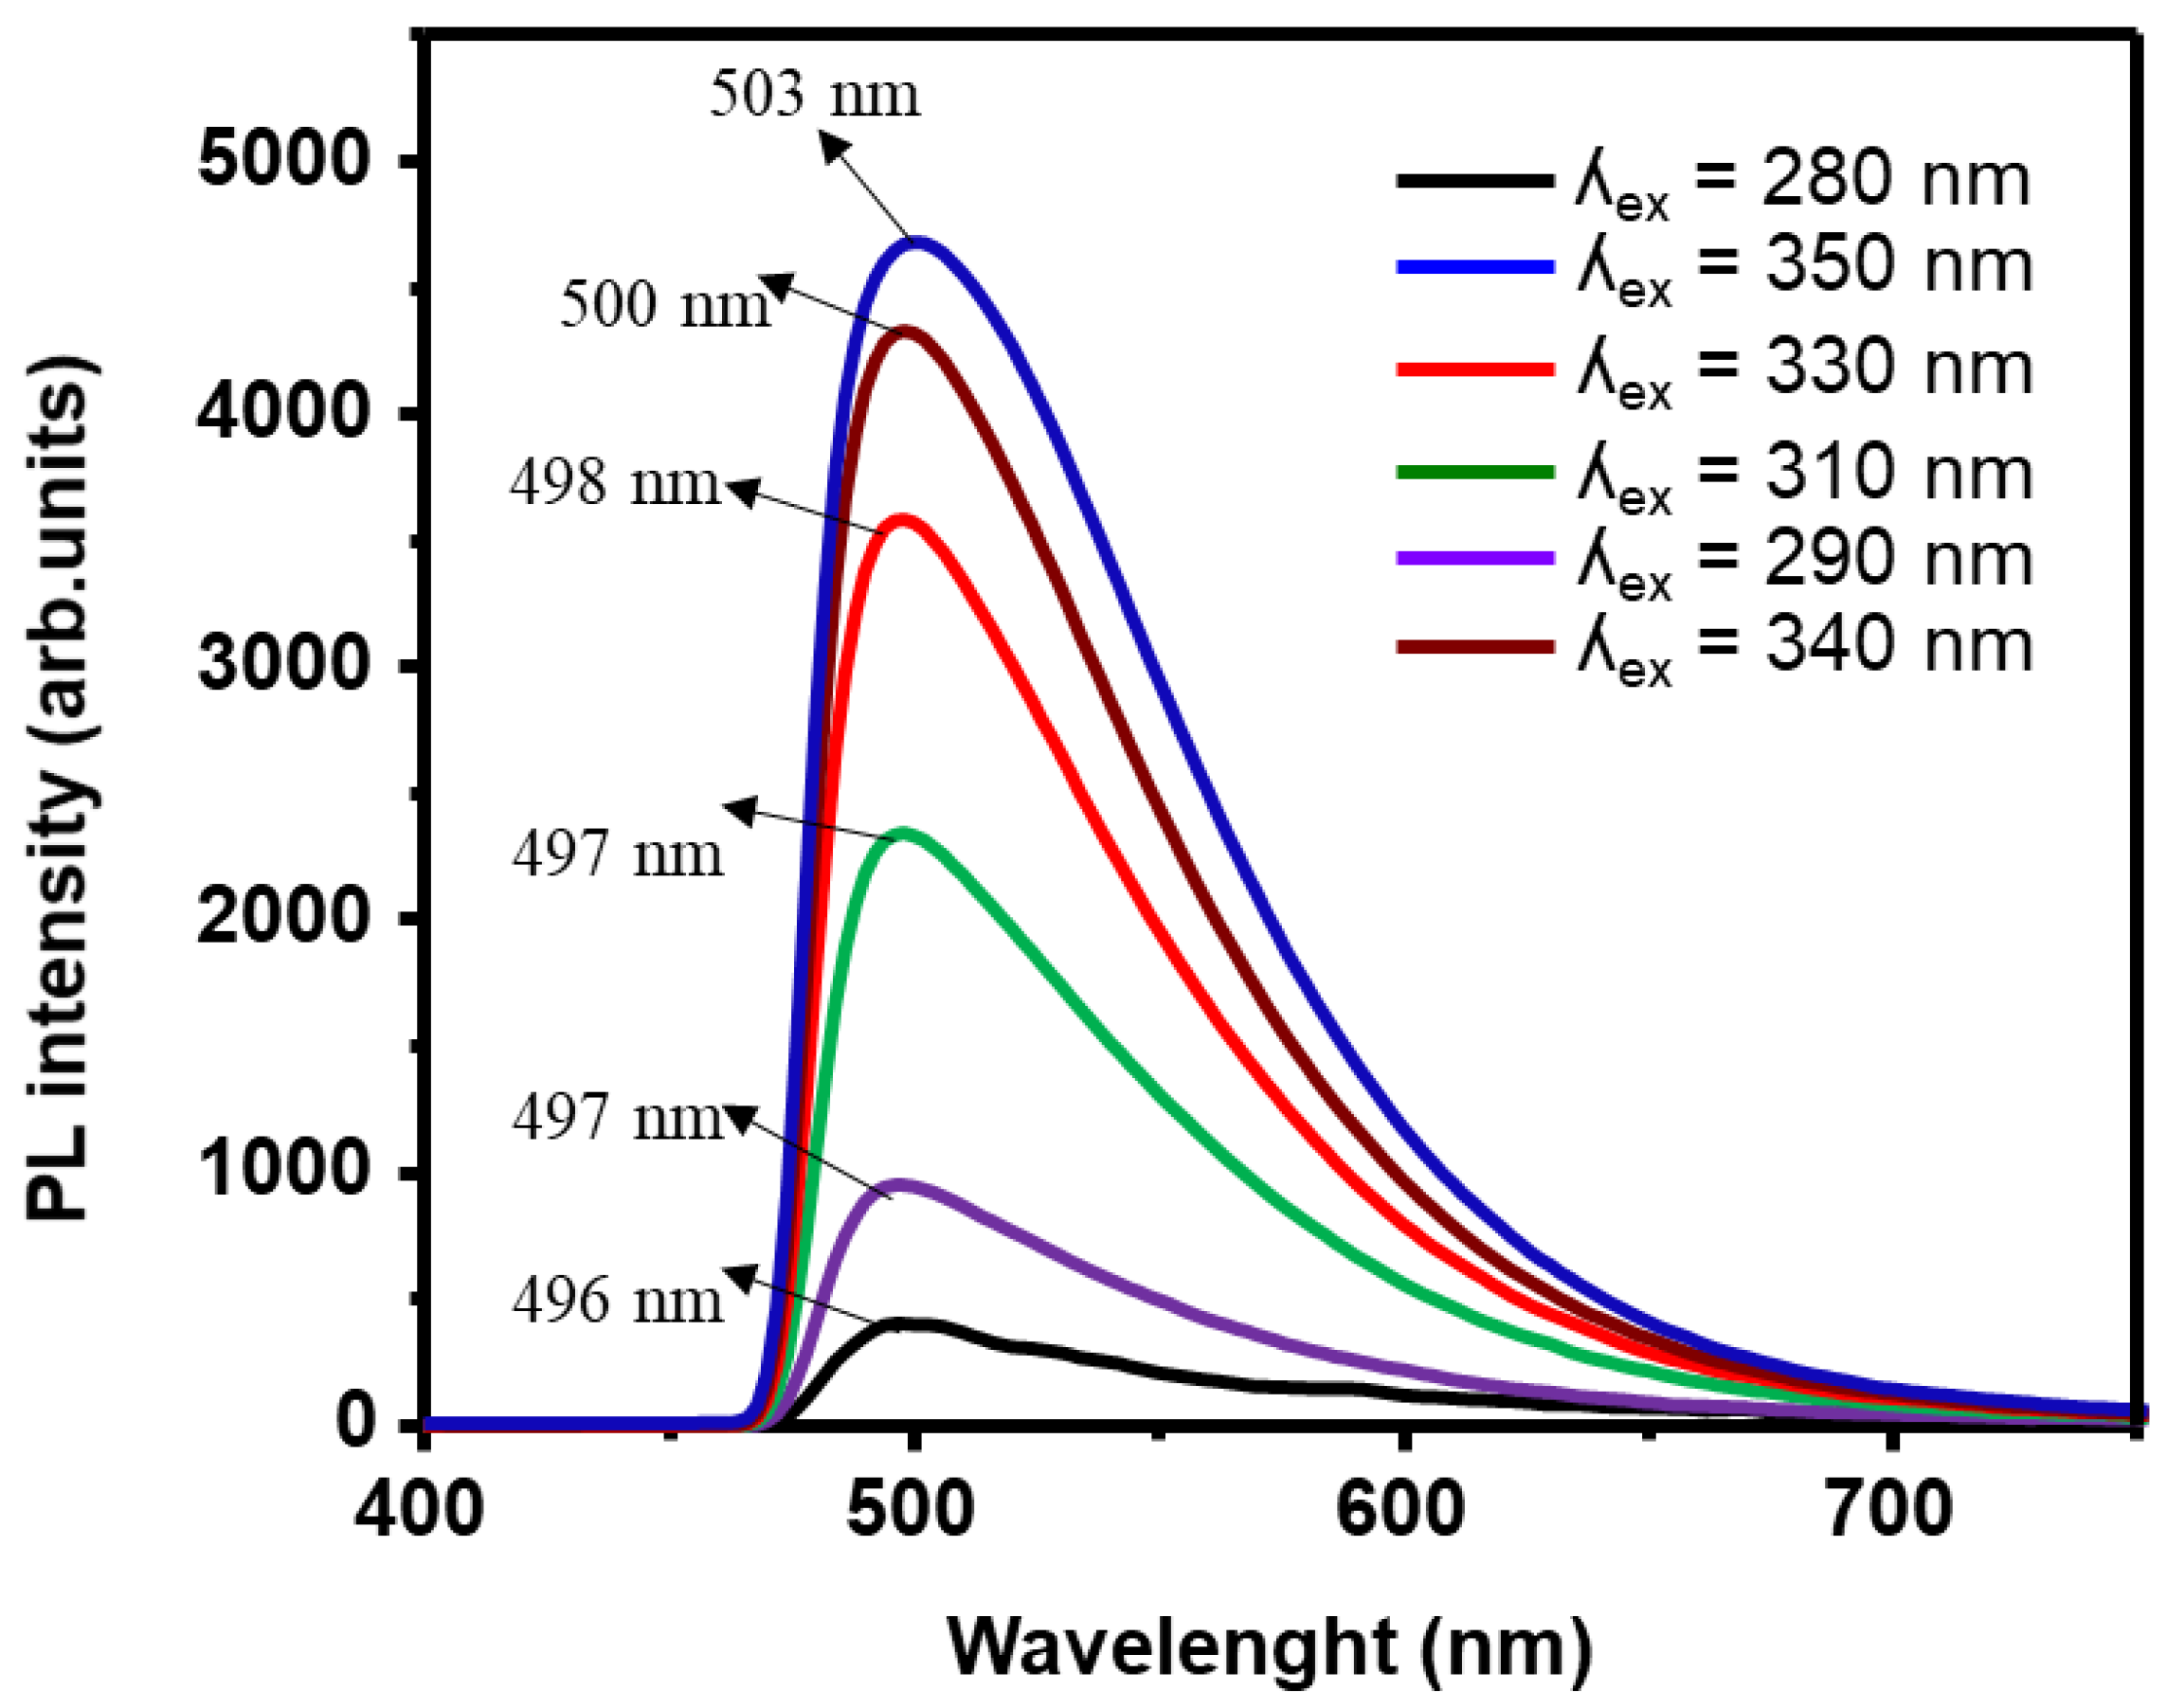
The fluorescence emission of C-dots (seen in Figure 6) is closely associated with their surface state, which encompasses factors such as surface functional groups and the extent of surface oxidation. Various functional groups present on the C-Dots play a pivotal role in determining the wavelengths at which emissions occur. A higher concentration of C=O and carboxyl groups in the C-dots leads to enhanced emission efficiency. The comprehensive color emission of C-dots is primarily influenced by functional groups rather than the extent of surface oxidation, given that C-dots with comparable oxygen content manifest different colors. The precise underlying structure of C-dots fluorescence remains incompletely understood and necessitates further elucidation due to the structural intricacy of C-dots. In summary, the excitation wavelengths and emission behavior in C-dots, the significance of surface state and functional groups in emissions, and the necessity for additional research to comprehend the fluorescence mechanism of C-dots.
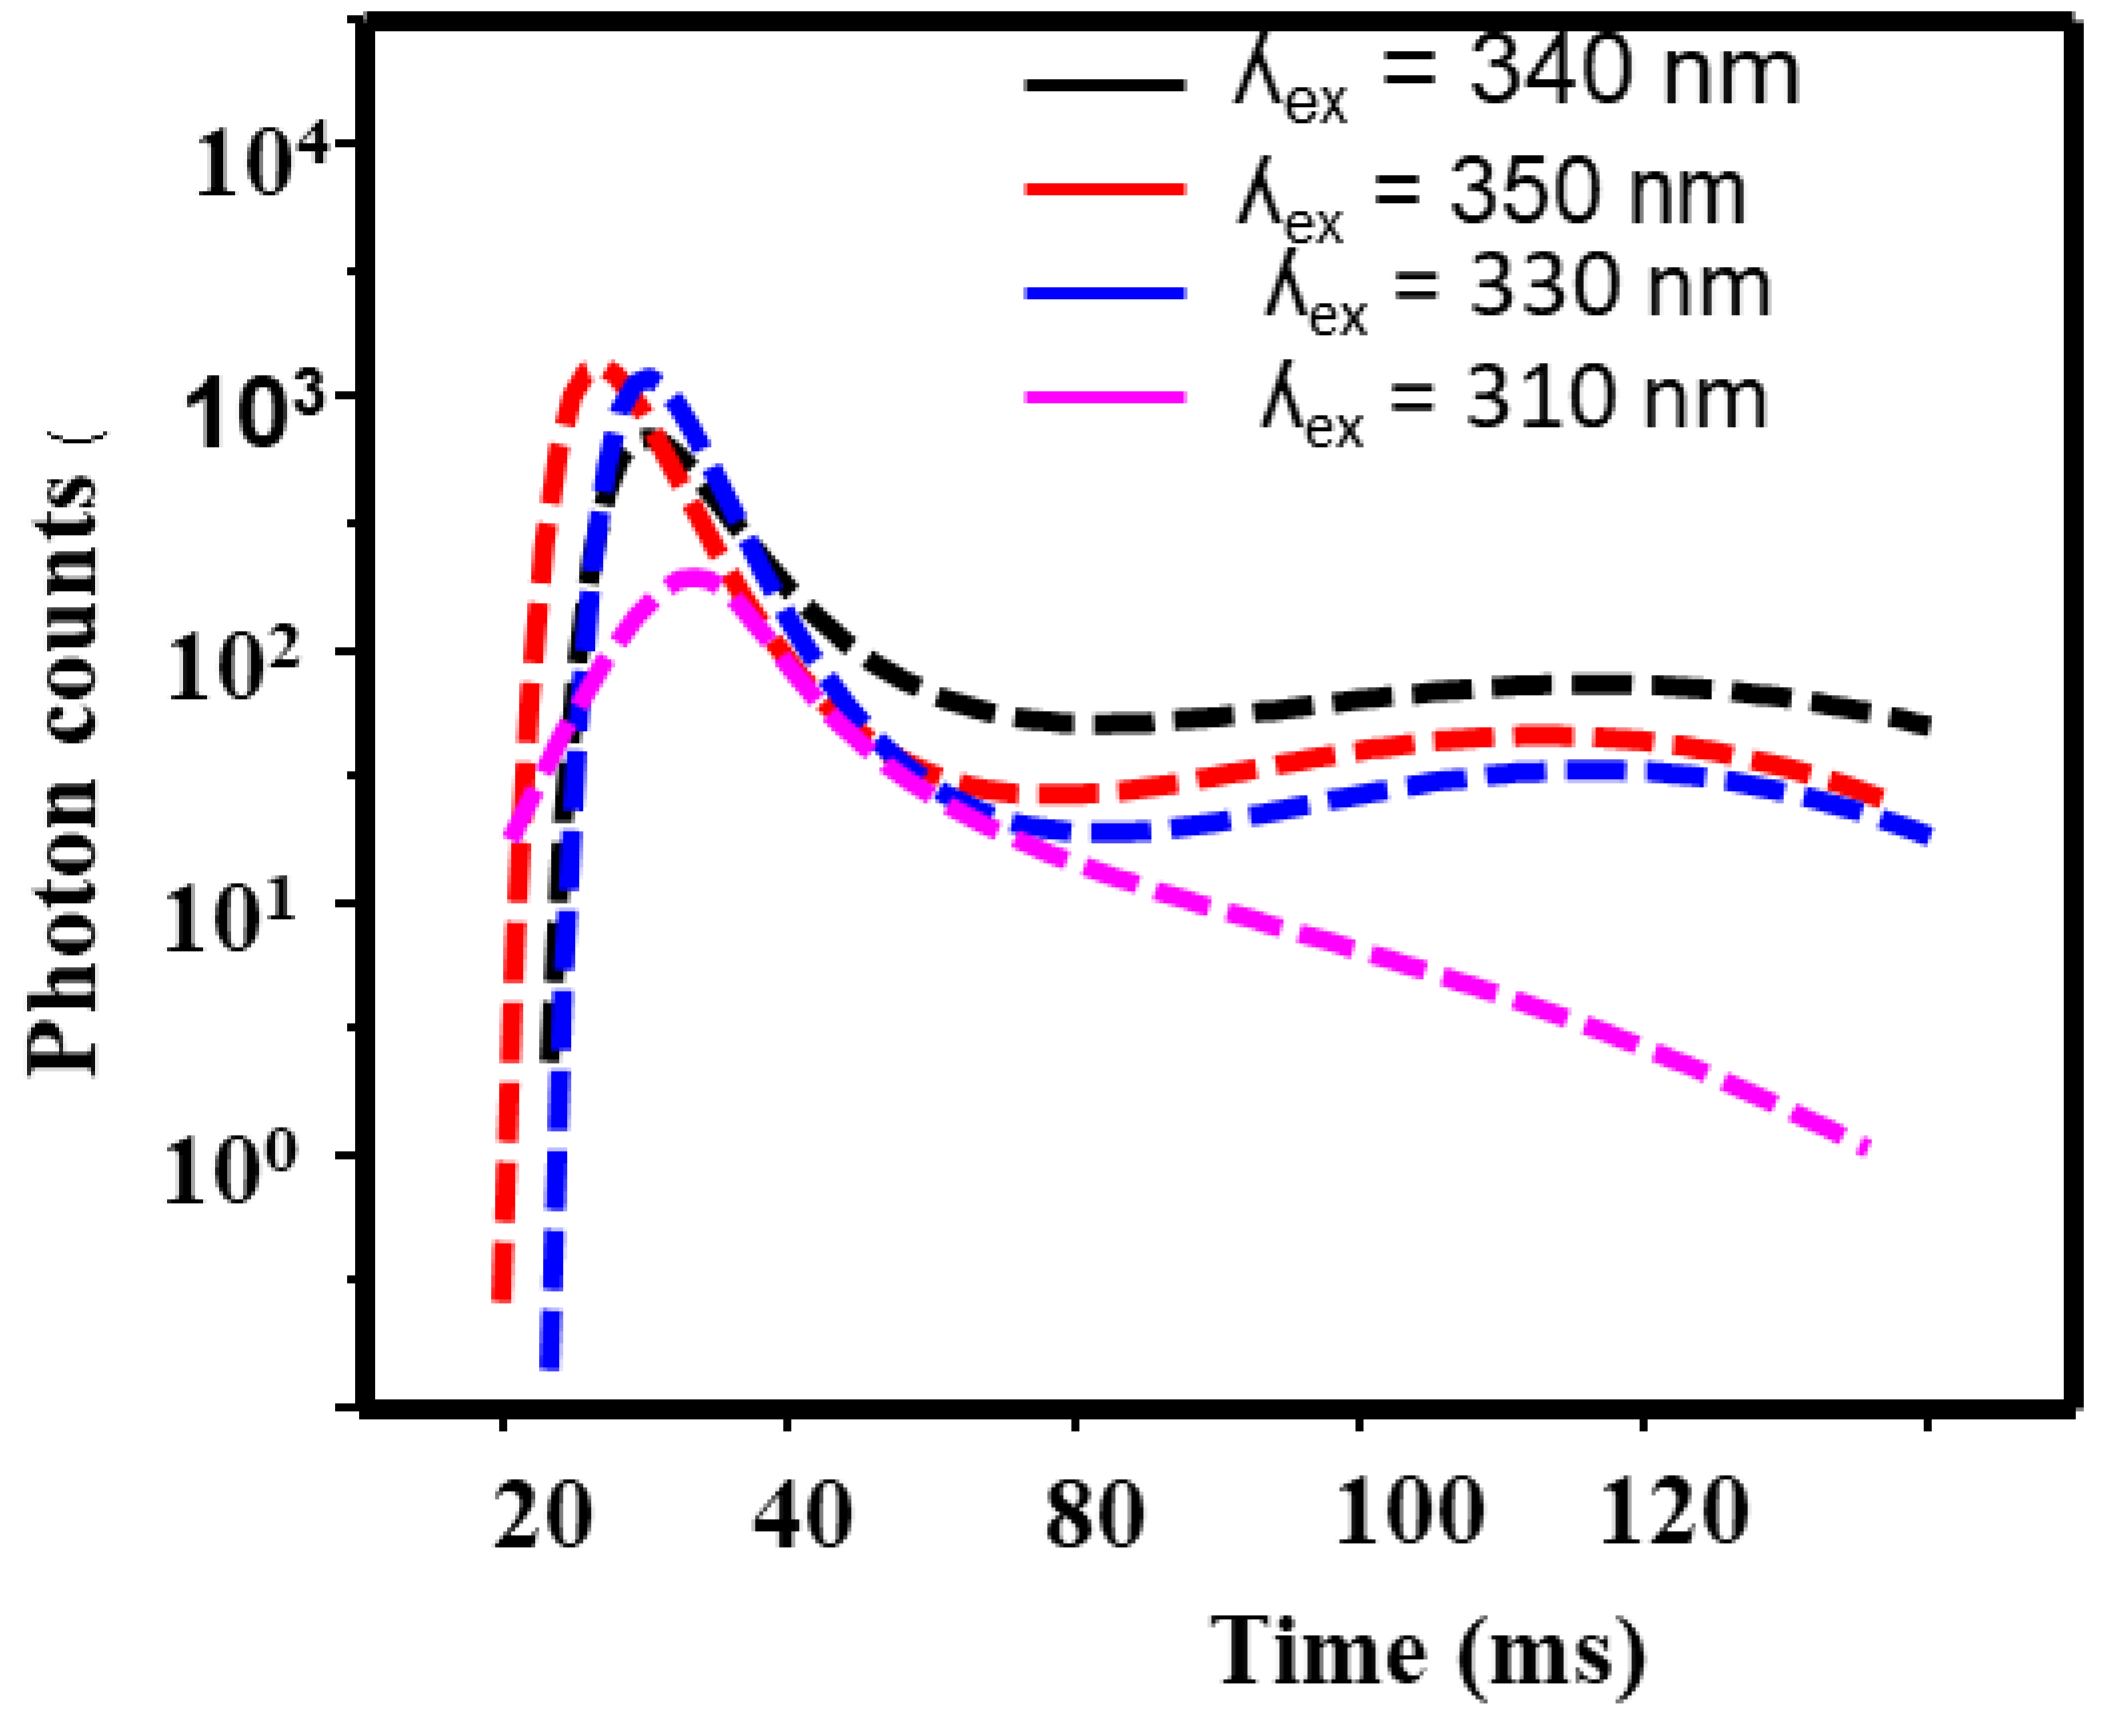
Based on the information provided in Figure 7, the decay curves of C-dots (carbon dots) were obtained at various excitation wavelengths, namely 340 nm, 350 nm, 330 nm, and 310 nm. The decay curve represents the rate at which the fluorescence intensity of the C-dots decreases over time following excitation. Among the excitation wavelengths, the decay curve at 350 nm demonstrated the most favourable performance, with a decay time of 6.73 ms. The decay time signifies the characteristic duration it takes for the fluorescence intensity to diminish to 1/e (approximately 36.8%) of its initial value. Generally, a shorter decay time indicates a quicker decay rate and a less efficient fluorescence emission process. In this instance, the C-dots excited at 350 nm exhibited a superior lifetime, indicating a higher emission efficiency in comparison to the other tested excitation wavelengths (340 nm, 330 nm, and 310 nm).
In the experiment, a concentration of 0.2 M of C-dots was introduced into the water with the aim of reducing the pollutant content. The findings of this investigation were presented in Figure 8, which appears to depict the decline in pollutant concentration over time when subjected to visible light irradiation at a wavelength of 503 nm. According to the results displayed in Figure 7, the pollutant concentration experienced a significant decrease throughout the duration of visible light irradiation. Following 100 minutes of irradiation, the pollutant had nearly completely decomposed or been eradicated at the 0.2 M concentration of C-dots. This suggests that the C-dots exhibited substantial photocatalytic activity, thus facilitating the efficient degradation of the pollutant under visible light irradiation. The specific concentration of 0.2 M utilized in the experiment, combined with the optimized number of C-dots, played a crucial role in the successful degradation of the pollutant. Overall, this study highlights the potential of employing C-dots as effective photocatalysts for pollutant degradation in water, presenting a promising approach for environmental remediation and the elimination of harmful substances.

4. Conclusions

In conclusion, the green synthesis of carbon dots (C-dots) from black mulberry fruits was conducted using a hydrothermal autoclave method, utilizing black mulberry fruit liquid and ethylenediamine. The resulting C-dots were analyzed using transmission electron microscopy (TEM), revealing an average size of 4.6 ± 1.5 nm and a predominantly spherical morphology. UV-Vis spectroscopy indicated distinctive absorption peaks at 350 nm and 451 nm, which can be attributed to specific electronic transitions within the C-dots. Fourier-transform infrared (FT-IR) analysis identified functional groups such as carboxylic acids, alkyl groups, and graphitic functional groups in the C-dots. The photoluminescence properties of the C-dots exhibited emission wavelengths that were influenced by surface functional groups. Decay curve analysis demonstrated that C-dots excited at 350 nm exhibited the best performance, with a decay time of 6.73 ms. Furthermore, the C-dots displayed robust photocatalytic activity in the degradation of pollutants under visible light irradiation, as evidenced by the significant decrease in pollutant concentration over time. This research emphasizes the potential of C-dots as effective photocatalysts for environmental remediation and pollutant elimination.

Author Contributions

Conceptualization, H.F.E. and A.A.T methodology, F.B.D.; validation, H.F.E., A.A.Tand F.B.D formal analysis, H.F.T.; investigation, F.B.D.; resources, H.F.E, writ-ing—original draft preparation, A.A.T.; writing—review and editing, F.B.D; visualization, F.B.D.; supervision, F.B.D; project administration, F.B.D; funding acquisition. All authors have read and agreed to the published version of the manuscript.”.

Funding

This research did not receive any specific grant from public funding agencies. This work is supported by the WSU (with ESKOM project).

Data Availability Statement

The data used is confidently included in this manuscript.

Acknowledgments

The authors were grateful to Walter Sisulu University (WSU) for its support.

Conflicts of Interest

The authors declare no conflicts of interest.

References

  1. Zhou, Z.; Shen, Y.; Li, Y.; Liu, A.; Liu, S.; Zhang, Y. Chemical Cleavage of Layered Carbon Nitride with Enhanced Photoluminescent Performances and Photoconduction. ACS Nano 2015, 9, 12480–12487. [CrossRef]
  2. Xiao, L.; Wang, Y.; Huang, Y.; Wong, T.; Sun, H. Self-trapped exciton emission from carbon dots investigated by polarization anisotropy of photoluminescence and photoexcitation. Nanoscale 2017, 9, 12637–12646. [CrossRef]
  3. Li, Y.; Miao, P.; Zhou, W.; Gong, X.; Zhao, X. N-doped carbon-dots for luminescent solar concentrators. J. Mater. Chem. A 2017, 5, 21452–21459. [CrossRef]
  4. Hola, K., et al., Carbon dots—Emerging light emitters for bioimaging, cancer therapy and optoelectronics. Nano Today, 2014. 9(5): p. 590-603.
  5. Stepanidenko, E.A.; Ushakova, E.V.; Fedorov, A.V.; Rogach, A.L. Applications of Carbon Dots in Optoelectronics. Nanomaterials 2021, 11, 364. [CrossRef]
  6. Luo, W.-K.; Zhang, L.-L.; Yang, Z.-Y.; Guo, X.-H.; Wu, Y.; Zhang, W.; Luo, J.-K.; Tang, T.; Wang, Y. Herbal medicine derived carbon dots: synthesis and applications in therapeutics, bioimaging and sensing. J. Nanobiotechnology 2021, 19, 1–30. [CrossRef]
  7. Kanwal, A., et al., Recent advances in green carbon dots (2015–2022): synthesis, metal ion sensing, and biological applications. Beilstein Journal of Nanotechnology, 2022. 13(1): p. 1068-1107.
  8. Umar, M. and H.A. Aziz, Photocatalytic degradation of organic pollutants in water. Organic pollutants-monitoring, risk and treatment, 2013. 8: p. 196-197.
  9. Ajith, M.; Aswathi, M.; Priyadarshini, E.; Rajamani, P. Recent innovations of nanotechnology in water treatment: A comprehensive review. Bioresour. Technol. 2021, 342, 126000. [CrossRef]
  10. Anju, A., P. Ravi S, and S. Bechan, Water pollution with special reference to pesticide contamination in India. Journal of Water Resource and Protection, 2010. 2010.
  11. Akhtar, N.; Ishak, M.I.S.; Bhawani, S.A.; Umar, K. Various Natural and Anthropogenic Factors Responsible for Water Quality Degradation: A Review. Water 2021, 13, 2660. [CrossRef]
  12. Bhosale, T.T.; Kuldeep, A.R.; Pawar, S.J.; Shirke, B.S.; Garadkar, K.M. Photocatalytic degradation of methyl orange by Eu doped SnO2 nanoparticles. J. Mater. Sci. Mater. Electron. 2019, 30, 18927–18935. [CrossRef]
  13. Georgakilas, V.; Perman, J.A.; Tucek, J.; Zboril, R. Broad Family of Carbon Nanoallotropes: Classification, Chemistry, and Applications of Fullerenes, Carbon Dots, Nanotubes, Graphene, Nanodiamonds, and Combined Superstructures. Chem. Rev. 2015, 115, 4744–4822. [CrossRef]
  14. Barman, M.K.; Patra, A. Current status and prospects on chemical structure driven photoluminescence behaviour of carbon dots. J. Photochem. Photobiol. C: Photochem. Rev. 2018, 37, 1–22. [CrossRef]
  15. Sharma, A.; Das, J. Small molecules derived carbon dots: synthesis and applications in sensing, catalysis, imaging, and biomedicine. J. Nanobiotechnol. 2019, 17, 92. [CrossRef]
  16. zkara, A., D. Akyıl, and M. Konuk, Pesticides, environmental pollution, and health, in Environmental health risk-hazardous factors to living species. 2016, IntechOpen.
  17. Chauhan, D.S.; Quraishi, M.A.; Verma, C. Carbon nanodots: recent advances in synthesis and applications. Carbon Lett. 2022, 32, 1603–1629. [CrossRef]
  18. Mansuriya, B.D.; Altintas, Z. Carbon Dots: Classification, Properties, Synthesis, Characterization, and Applications in Health Care—An Updated Review (2018–2021). Nanomaterials 2021, 11, 2525. [CrossRef]
  19. Cailotto, S.; Massari, D.; Gigli, M.; Campalani, C.; Bonini, M.; You, S.; Vomiero, A.; Selva, M.; Perosa, A.; Crestini, C. N-Doped Carbon Dot Hydrogels from Brewing Waste for Photocatalytic Wastewater Treatment. ACS Omega 2022, 7, 4052–4061. [CrossRef]
  20. Patial, S.; Sonu; Sudhaik, A.; Chandel, N.; Ahamad, T.; Raizada, P.; Singh, P.; Chaukura, N.; Selvasembian, R. A Review on Carbon Quantum Dots Modified g-C3N4-Based Photocatalysts and Potential Application in Wastewater Treatment. Appl. Sci. 2022, 12, 11286. [CrossRef]
  21. Gautam, S.; Agrawal, H.; Thakur, M.; Akbari, A.; Sharda, H.; Kaur, R.; Amini, M. Metal oxides and metal organic frameworks for the photocatalytic degradation: A review. J. Environ. Chem. Eng. 2020, 8, 103726. [CrossRef]
  22. Zhang, X.; Kamali, M.; Zhang, S.; Yu, X.; Appels, L.; Cabooter, D.; Dewil, R. Photo-assisted (waste)water treatment technologies — A scientometric-based critical review. Desalination 2022, 538. [CrossRef]
  23. Gudimella, K.K.; Appidi, T.; Wu, H.-F.; Battula, V.; Jogdand, A.; Rengan, A.K.; Gedda, G. Sand bath assisted green synthesis of carbon dots from citrus fruit peels for free radical scavenging and cell imaging. Colloids Surfaces B: Biointerfaces 2021, 197, 111362. [CrossRef]
  24. Gutiérrez-Cruz, A.; Ruiz-Hernández, A.R.; Vega-Clemente, J.F.; Luna-Gazcón, D.G.; Campos-Delgado, J. A review of top-down and bottom-up synthesis methods for the production of graphene, graphene oxide and reduced graphene oxide. J. Mater. Sci. 2022, 57, 14543–14578. [CrossRef]
  25. El-Shafey, A.M., Carbon dots: Discovery, structure, fluorescent properties, and applications. Green Processing and Synthesis, 2021. 10(1): p. 134-156.
  26. Nemera, D.J.; Etefa, H.F.; Kumar, V.; Dejene, F.B. Hybridization of nickel oxide nanoparticles with carbon dots and its application for antibacterial activities. Luminescence 2022, 37, 965–970. [CrossRef]
  27. Manzoor, S.; Dar, A.H.; Dash, K.K.; Pandey, V.K.; Srivastava, S.; Bashir, I.; Khan, S.A. Carbon dots applications for development of sustainable technologies for food safety: A comprehensive review. Appl. Food Res. 2023, 3, 100263. [CrossRef]
  28. Shanker, U.; Hussain, C.M.; Rani, M. Green Functionalized Nanomaterials for Environmental Applications; Elsevier: Amsterdam, NX, Netherlands, 2021; ISBN: .
  29. Etefa, H.F.; Nemera, D.J.; Dejene, F.B. Green Synthesis of Nickel Oxide NPs Incorporating Carbon Dots for Antimicrobial Activities. ACS Omega 2023, 8, 38418–38425. [CrossRef]
  30. Etefa, H.F.; Kumar, V.; Dejene, F.B.; Efa, M.T.; Jule, L.T. Modification of Flexible Electrodes for P-Type (Nickel Oxide) Dye-Sensitized Solar Cell Performance Based on the Cellulose Nanofiber Film. ACS Omega 2023, 8, 15249–15258. [CrossRef]
  31. Alzahrani, E.A.; Nabi, A.; Kamli, M.R.; Albukhari, S.M.; Althabaiti, S.A.; Al-Harbi, S.A.; Khan, I.; Malik, M.A. Facile Green Synthesis of ZnO NPs and Plasmonic Ag-Supported ZnO Nanocomposite for Photocatalytic Degradation of Methylene Blue. Water 2023, 15, 384. [CrossRef]
  32. Peng, G.; Chou, N.-N.; Lin, Y.-S.; Yang, C.-F.; Meen, T.-H. Comparison of the Degradation Effect of Methylene Blue for ZnO Nanorods Synthesized on Silicon and Indium Tin Oxide Substrates. Materials 2023, 16, 4275. [CrossRef]
  33. Etefa, H.F.; Imae, T.; Yanagida, M. Enhanced Photosensitization by Carbon Dots Co-adsorbing with Dye on p-Type Semiconductor (Nickel Oxide) Solar Cells. ACS Appl. Mater. Interfaces 2020, 12, 18596–18608. [CrossRef]
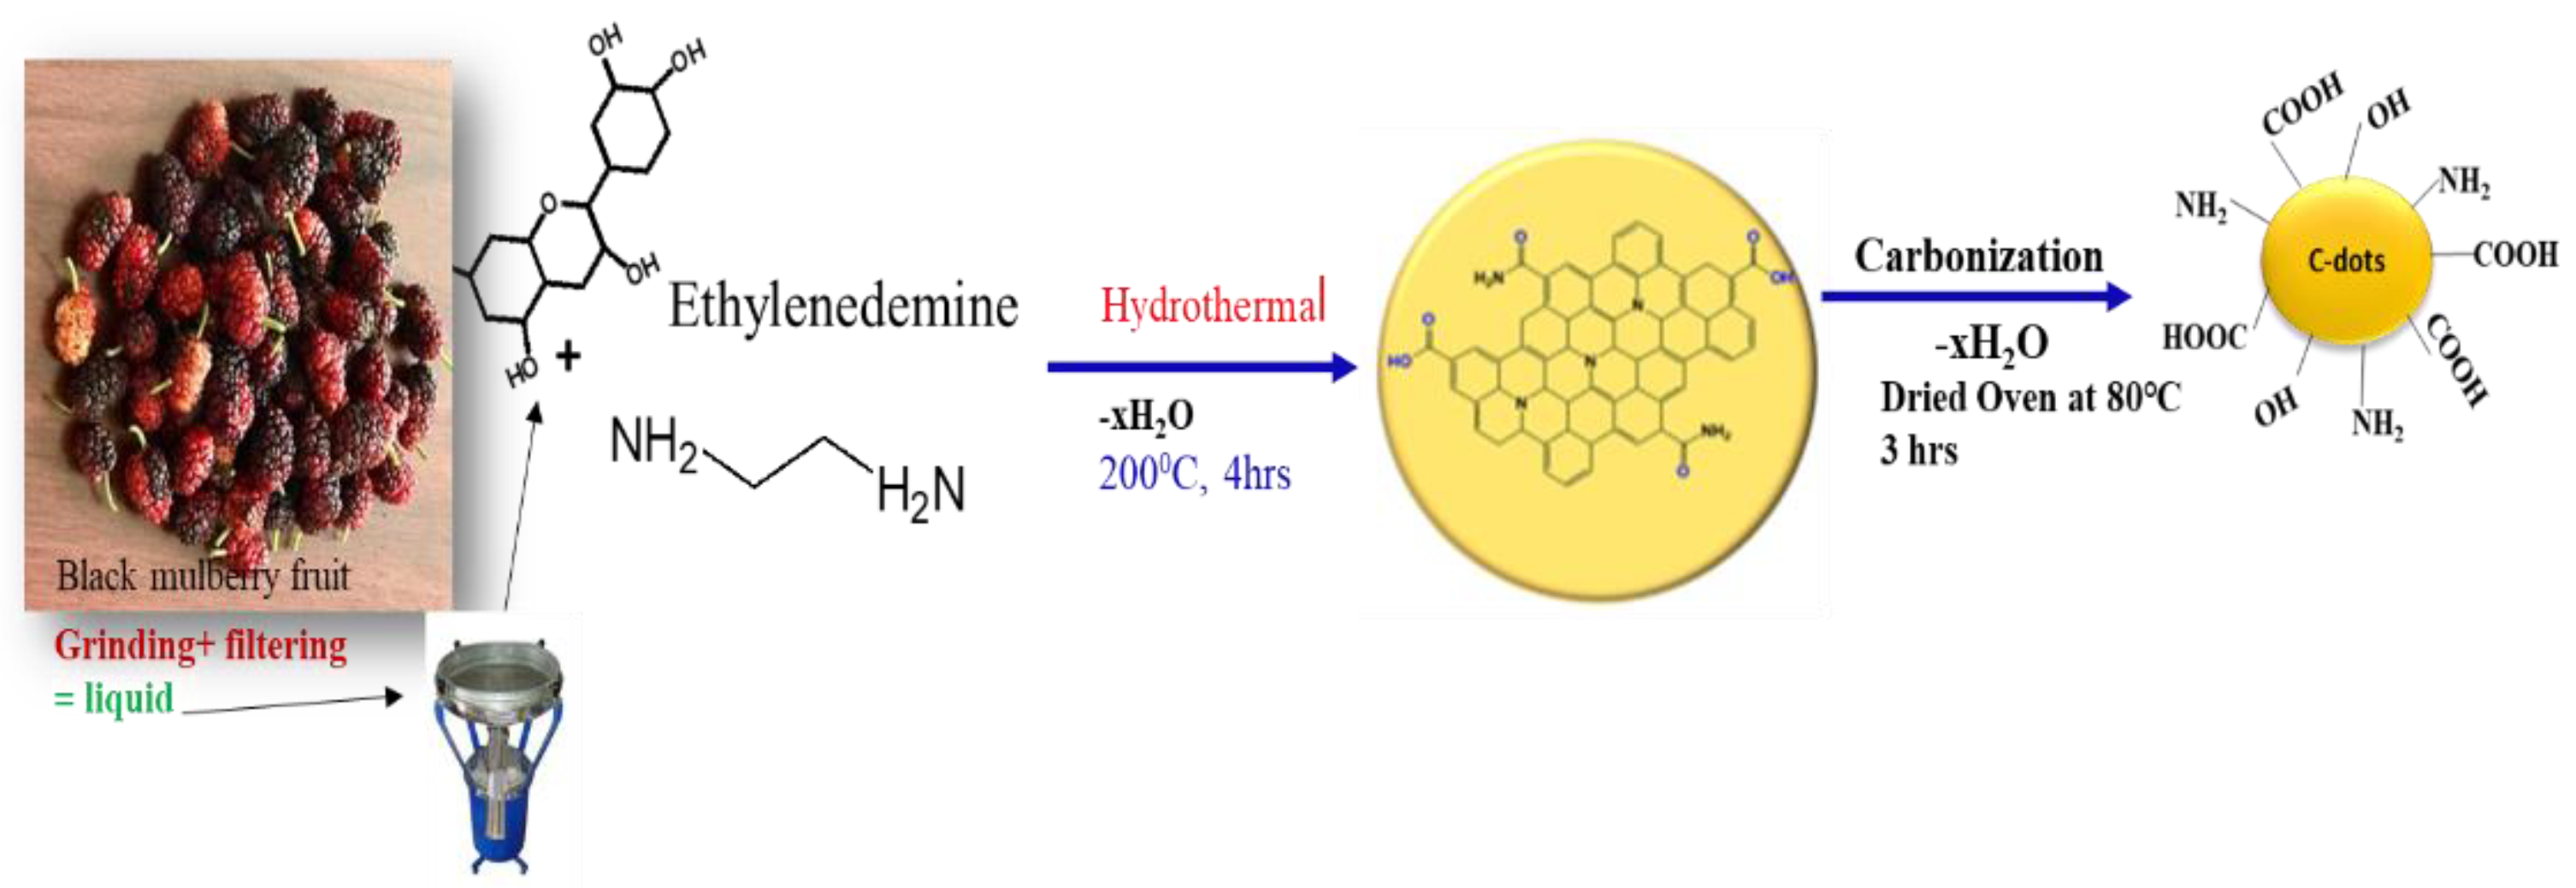
Figure 1. Green synthesis of Carbon dots extracted from black mulberry fruits.
Preprints 115520 g001
Figure 2. TEM image of C-dots fruit-derived Black mulberry and Particle size distribution.
Preprints 115520 g002
Figure 3. (a) Particle size distribution (b) Zeta potential of C-dots.
Preprints 115520 g003
Figure 4. (A) Carbon dots's ultraviolet-visible light absorption spectrum from Black Mulberry fruits (B) Carbon dots's FTIR spectrum from Black Mulberry fruits.
Preprints 115520 g004
Figure 5. Effect of concentration of MB on photocatalytic degradations.
Preprints 115520 g005
Figure 6. Carbon dot fluorescence emission spectrum at various excitation wavelengths.
Preprints 115520 g006
Figure 7. C-dot decay curves obtained at an excitation wavelength of each individual maximum intensity.
Preprints 115520 g007
Figure 8. Photocatalytic degradation of pollutant using 0.2 M of C-dots.
Preprints 115520 g008
Disclaimer/Publisher’s Note: The statements, opinions and data contained in all publications are solely those of the individual author(s) and contributor(s) and not of MDPI and/or the editor(s). MDPI and/or the editor(s) disclaim responsibility for any injury to people or property resulting from any ideas, methods, instructions or products referred to in the content.
Copyright: This open access article is published under a Creative Commons CC BY 4.0 license, which permit the free download, distribution, and reuse, provided that the author and preprint are cited in any reuse.
Alerts
Prerpints.org logo

Preprints.org is a free preprint server supported by MDPI in Basel, Switzerland.

Subscribe

© 2025 MDPI (Basel, Switzerland) unless otherwise stated