1. Introduction
Gas-water relative permeability curves are foundation for gas reservoir research and are widely used in gas well productivity evaluation, dynamic analysis and numerical simulation [
1,
2]. At present, the relative permeability curve measurement methods include logging data estimation method, capillary pressure curve method, fractal method, displacement experiment method, and empirical formula method [
3,
4,
5,
6,
7,
8,
9,
10]. The logging data estimation method and the empirical formula method are established on the basis of a large number of core sample relative permeability test curves. These samples are mostly medium and high permeability. The relative permeability curve predicted by the model is different from the measured relative permeability curve of low permeability and tight rock samples. The capillary pressure curve method determines the distribution law of wet phase and non-wet phase in the throat according to the capillary pressure curve, and calculates the relative permeability of wet phase and non-wet phase based on the capillary model [
4,
5,
6,
7,
8]. This method assumes that all throats participate in the flow, and does not consider the difference between two-phase flow and single-phase flow in porous media. The sum of relative permeability of wet phase and non-wet phase at a water saturation is always equal to 1, which is inconsistent with the actual gas-water two-phase seepage characteristics. Fractal method is similar to mercury injection method [
9,
10]. The steady-state displacement method is difficult to accurately match the injection velocity of gas, water in the test process, so it is difficult to achieve the continuous change of saturation in the core, and the relevant experimental research is few [
11]. The unsteady displacement method calculates the gas-water relative permeability of rock core according to the displacement pressure, flow rate of gas and water, and unsteady relative permeability calculation formula (JBN), which is the most widely method [
10,
11,
12,
13,
14,
15,
16,
17,
18,
19] now. While the low permeability and tight rock core have small pore volume, complex seepage mechanism, discontinuous gas and water flow during the displacement process, moreover, the calculation formula contains a derivative term, which requires data continuity, while the flow continuity of low permeability and tight rock core test is poor, which leads to poor smoothness of the gas-water relative permeability curves obtained by the unsteady state method, which limits the application of the relative permeability curves. In the later stage, it is usually necessary to manually smoothness treatment based on experience [
20]. A new test method of "nuclear magnetic resonance + high-speed centrifugal" for gas-water relative permeability curve of low permeability tight sandstone is established by using NMR technology, which improves the test method of gas-water relative permeability curve and solves the problem of gas-water relative permeability curve test of low permeability and tight gas reservoir.
2. Characterization of Micro Pore Structure by NMR
The capillary model shows that the throat distribution law of the core determines the core seepage ability and the two-phase seepage law. Based on this, Purcell (1949) established the calculation method of oil-water relative permeability curve by the capillary pressure curve [
6], and Budrdine (1953) proposed the concept of tortuosity and improved the calculation model [
7]. Therefore, the establishment of a more rapid and efficient test method of throat distribution curve is profit to promotion of the gas-water relative permeability curve test method.
Mercury injection and NMR testing are important means to characterize the micro pore structure of reservoirs. Mercury injection curve mainly reflects the throat size and its controlled saturation [
21,
22,
23,
24,
25]. NMR curve is mainly used to quantitatively reflect the distribution law of micro pore size and fluid mobility of the reservoir. It has become the main test method of core pore structure [
21,
22,
23] because of its small requirements on test core shape, fast test speed and pollution-free. Establishing the conversion relationship between Mercury injection and NMR testing is helpful to quickly obtain the throat distribution curve of the core. In order to establish the conversion relationship between mercury injection curve and NMR curve of the core, taking low permeability and tight sandstone in Sulige gas reservoir as the research object, typical rock samples were selected for mercury injection and NMR test experiments. The core permeability was 0.01-1mD, average 0.28mD, porosity 4% ~ 16%, average 10%, the maximum mercury injection saturation 80% ~ 99%, and average 94%. According to the permeability, the core was divided into two types: tight: 0.01-0.1md and low permeability: 0.1-1md.
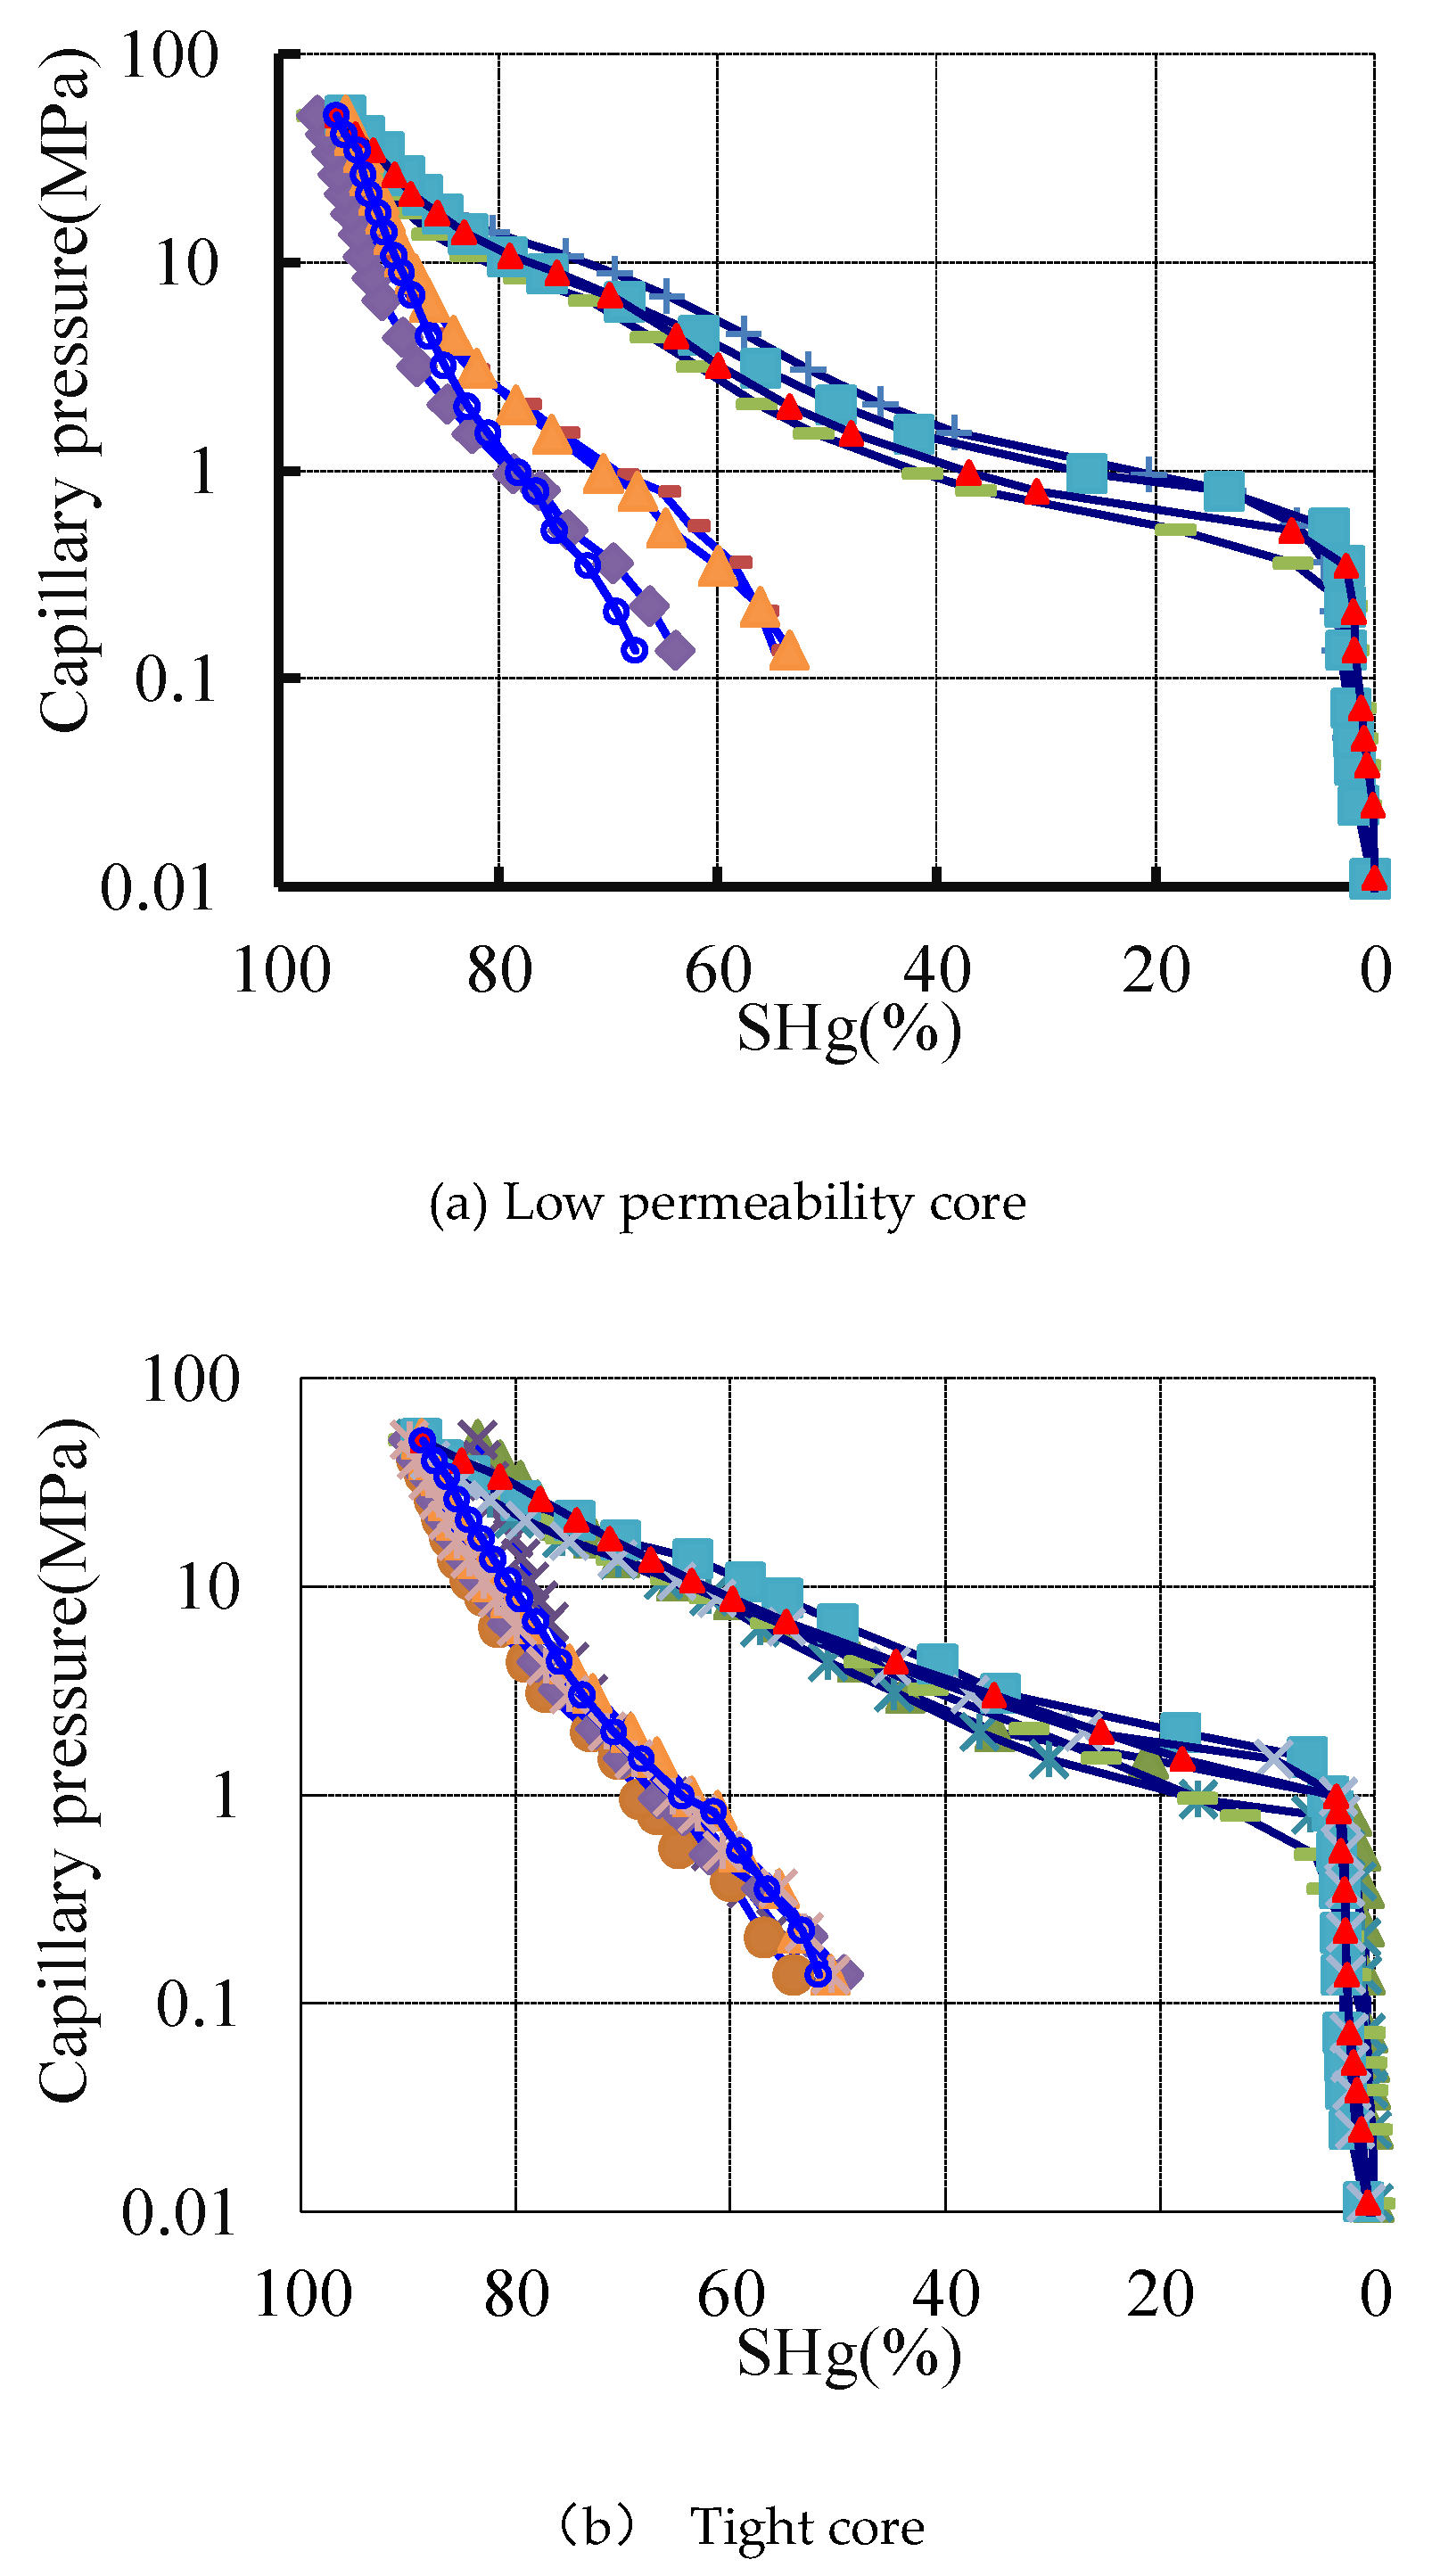
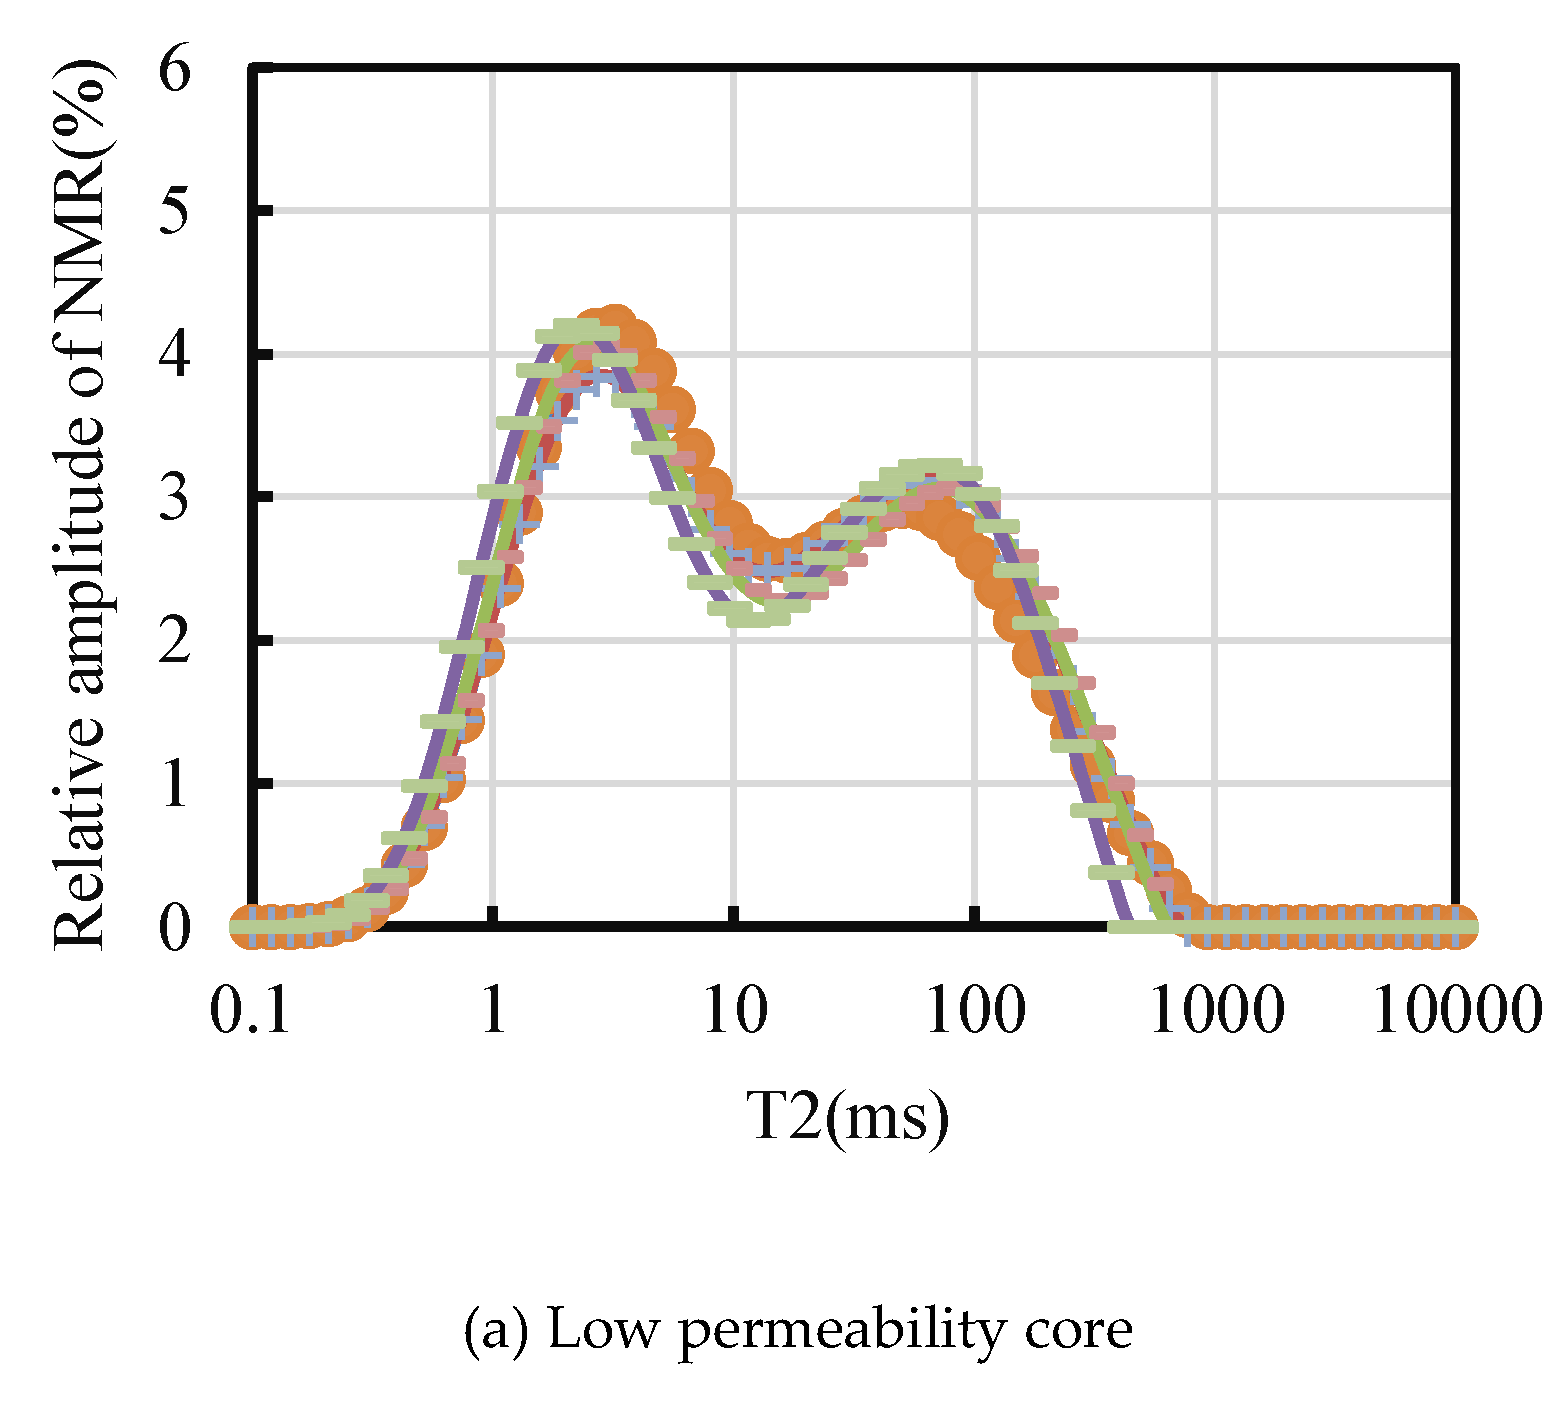
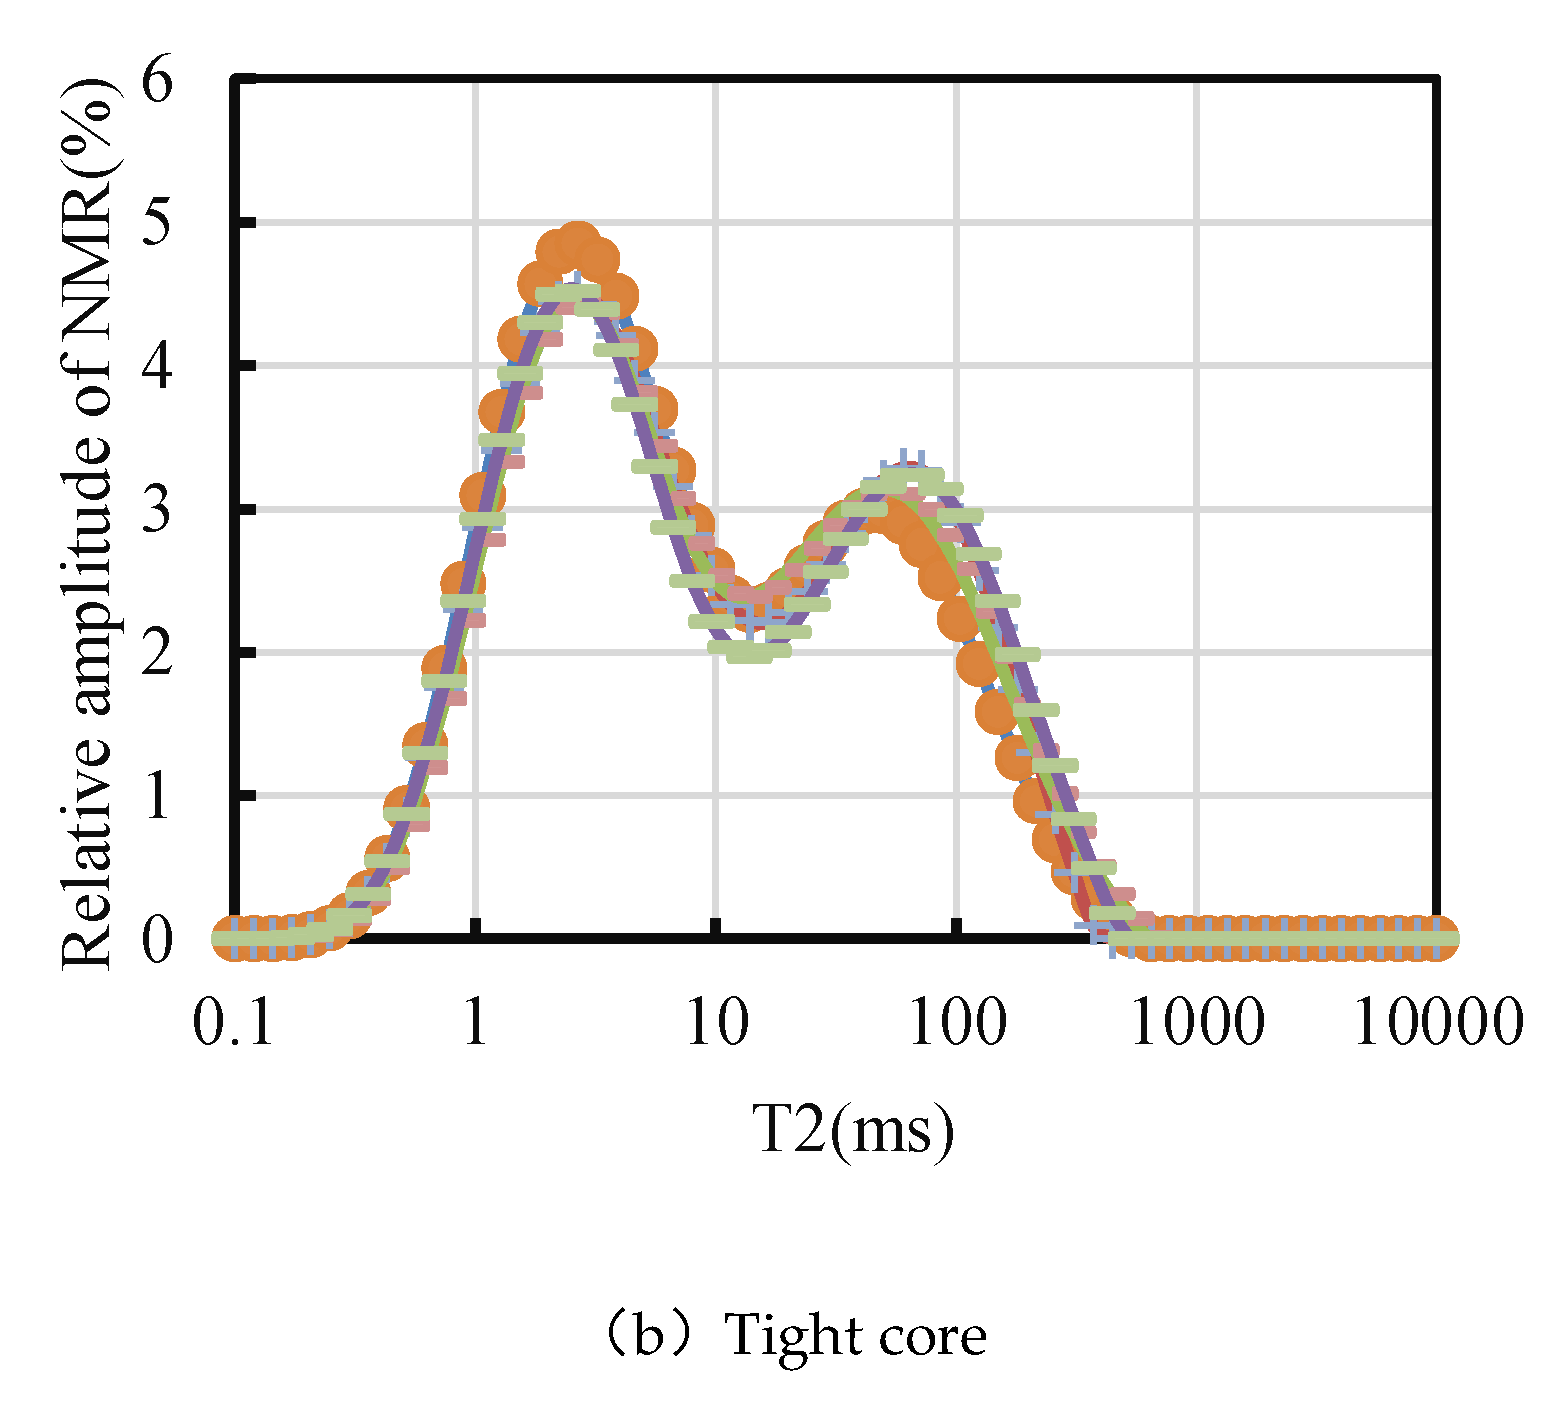
Figure 1 and
Figure 2 are typical mercury injection curves and NMR curves of low permeability core and tight core respectively. In order to eliminate the difference of nuclear magnetic signal amplitude caused by core pore volume, the relative amplitude of nuclear magnetic signal is taken as the vertical coordinate in
Figure 2. The relative amplitude of nuclear magnetic signal is defined as follows:
Where : N- number of nodes of NMR curve,here N=64;δ- NMR signal amplitude;β- Relative amplitude of nuclear magnetic signal,%, i , j-nodes. As can be seen from the expression: β reflects the percentage of pores corresponding to each relaxation time in the total pores of the core, and can well describe the relative number of various pores.
It can be seen from
Figure 1 and
Figure 2 that the mercury injection curves of sandstone at the same permeability level coincide with each other, with only slight differences, which can be characterized by the normalized mercury injection curves of cores at the same permeability level. The mercury injection curves of cores with different permeability are significantly different. The mercury injection threshold pressure of low permeability cores with permeability of 0.1-1md is less than 1MPa, and that of tight cores with permeability of less than 0.1md is generally greater than 1MPa. The NMR curve also shows similar characteristics. The NMR curve of the core with the same permeability level coincides. It can be characterized by the normalized NMR curve of the core with the same permeability level, and the small pores of the tight core account for more. This feature may be related to the good homogeneity of sandstone and strongly self-similarity of pores [
26,
27]. Therefore, theoretically, a normalized mercury injection curve and NMR curve can be used to represent the distribution law of pore and throat in low permeability and tight sandstone reservoirs.
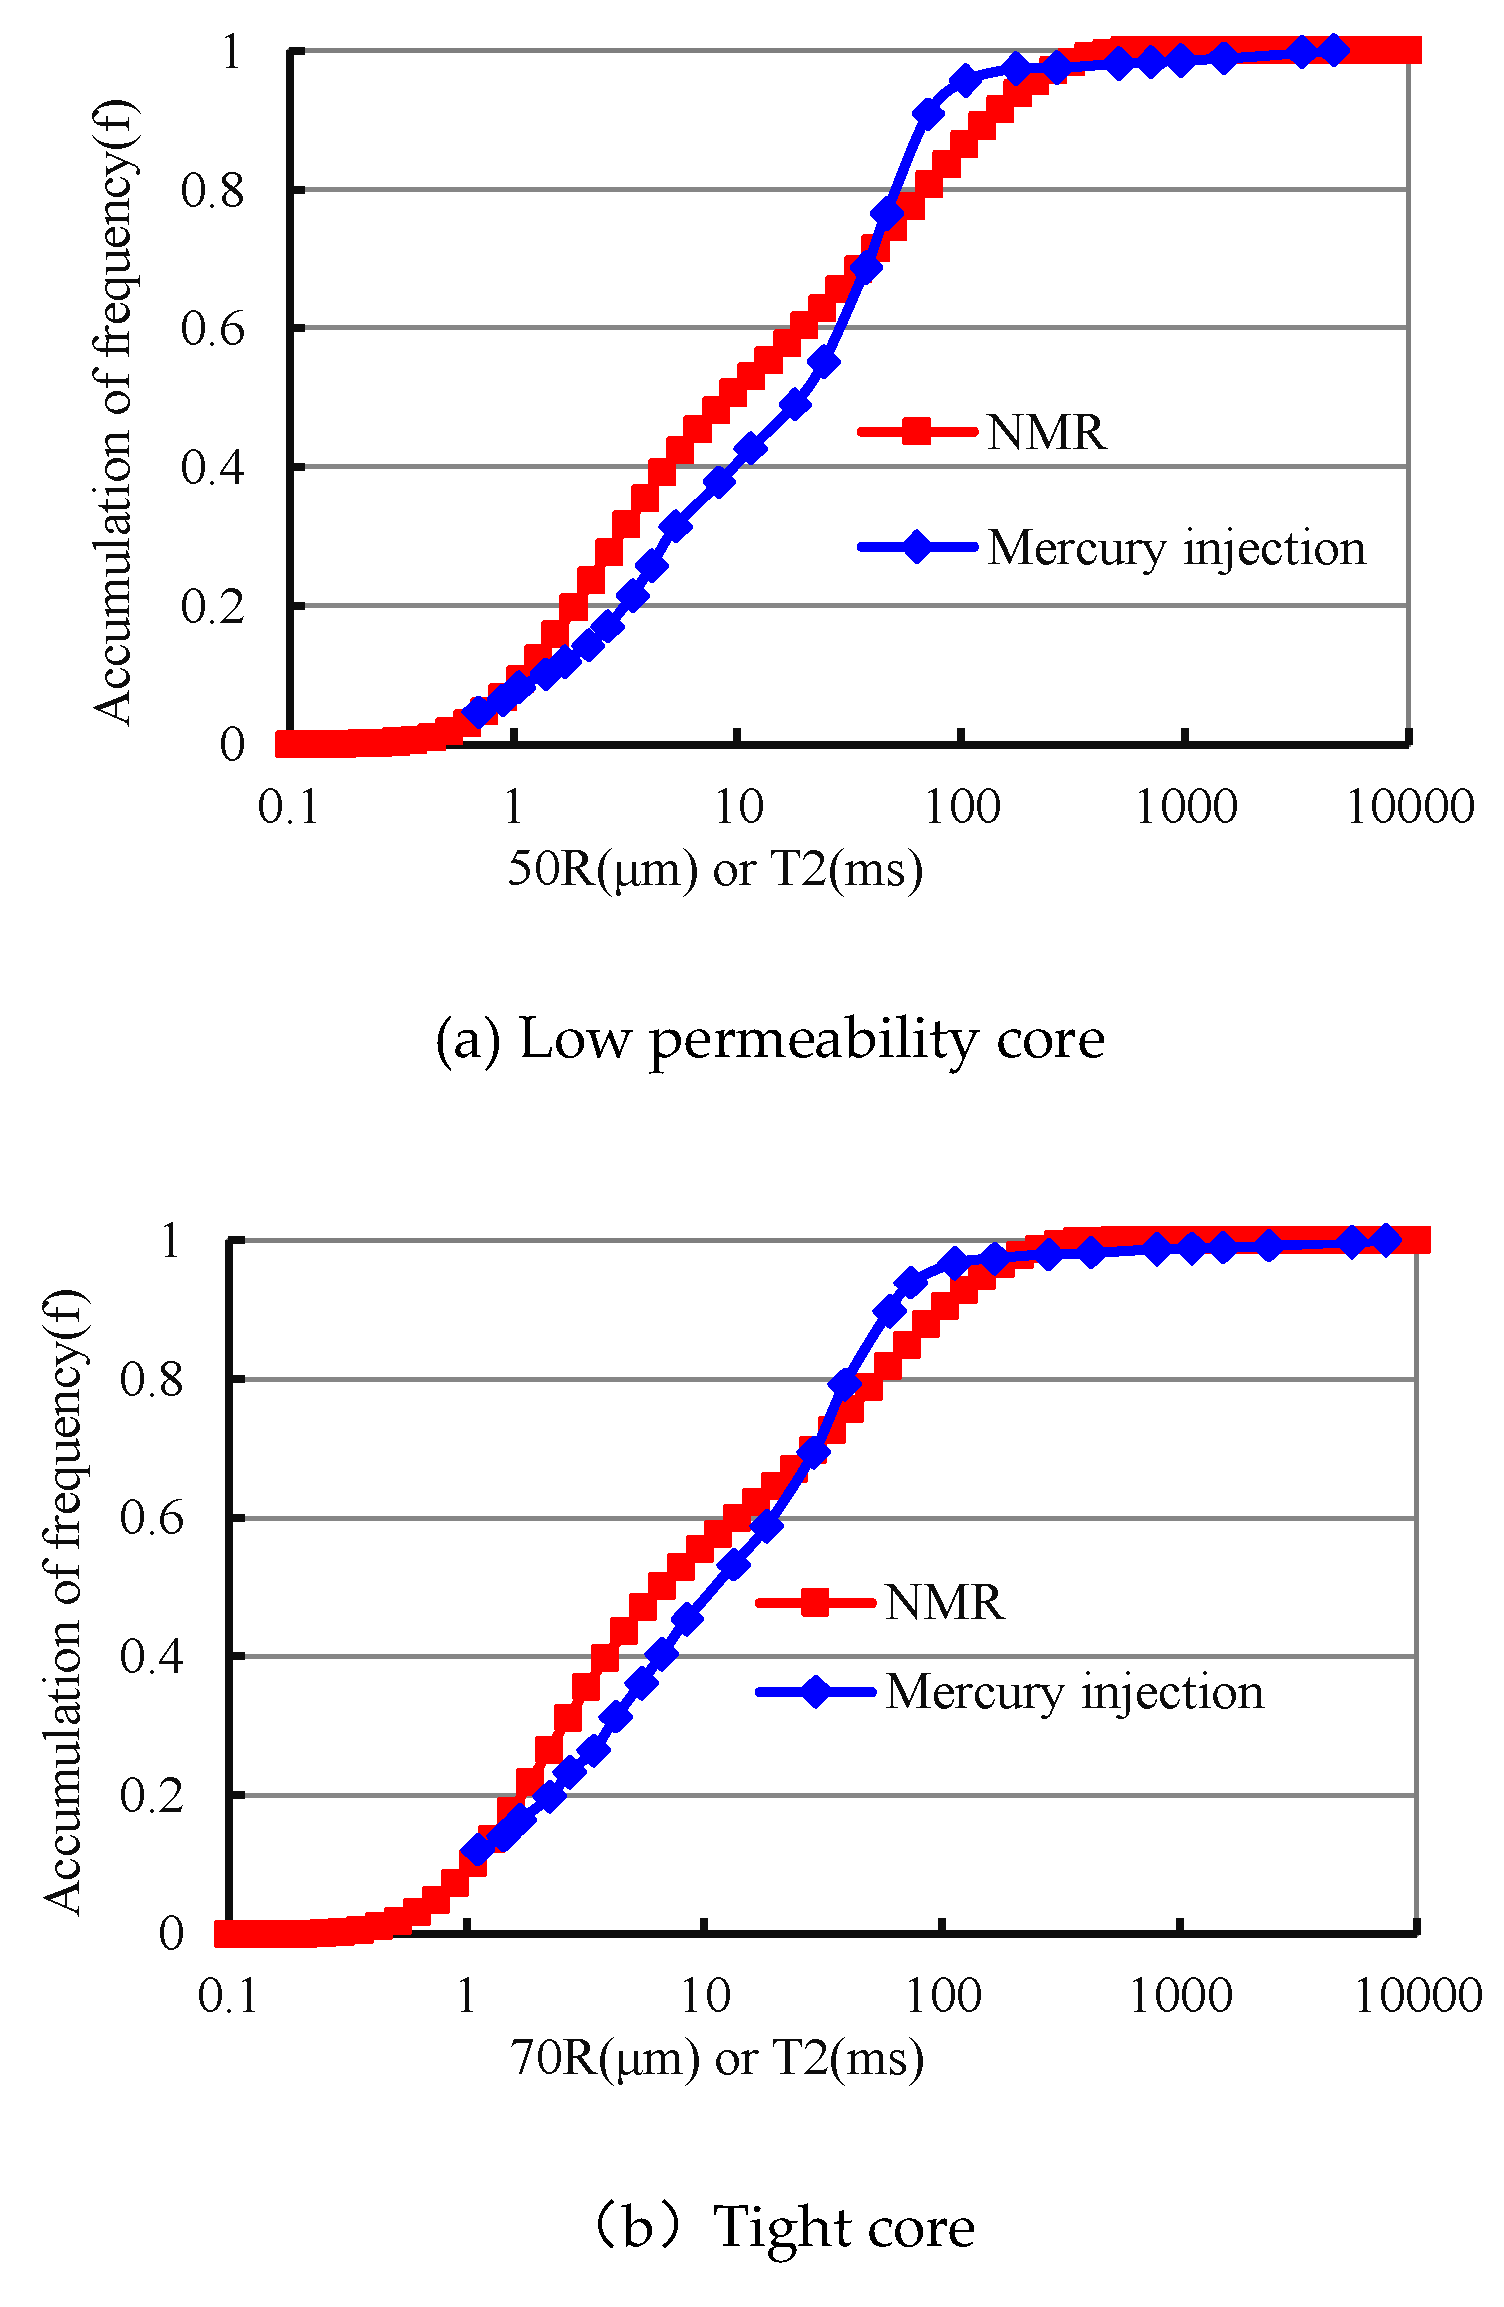
Figure 3 is the normalized throat radius accumulation curve of mercury injection and T2 relaxation time accumulation curve of NMR of the test core, wherein the throat radius from mercury injection is calculated and determined according to the mercury injection pressure, interface tension and capillary pressure formula. It can be seen that the normalized mercury injection throat radius accumulation curve is basically consistent with the normalized NMR T2 relaxation time accumulation curve, which proves that there is a good positive correlation between the T2 relaxation time and the mercury injection throat radius of low permeability tight sandstone, and the relationship is as follows:
Where: R - throat radius, μm, λ- ratio: according to the comparison of T2 relaxation time accumulation curve and throat radius accumulation curve from mercury injection of low permeability core and tight core, the ratio of low permeability core is 50 and that of tight core is 70. At this situation, the normalized throat radius accumulation curve from mercury injection and the normalized T2 relaxation time accumulation curve of NMR coincide, and the correlation coefficient of fitting relation R
2 is 0.93 and 0.95 respectively. Therefore, according to formula (2) and T2 relaxation time curve, the cumulative distribution frequency curve of throat radius of low permeability and tight sandstone core can be inversed, and the throat radius distribution law can be obtained by NMR.
In order to further verify that there is a good correlation between the T2 relaxation time from NMR and the throat radius from mercury injection test of low-permeability and tight sandstone, the distribution curve of the throat radius can also be inversed according to the T2 relaxation time from NMR to a certain extent. Similar samples are used to conduct NMR and mercury injection test simultaneously. The porosity and permeability of similar samples are 0.152mD, 12.3% and 0.151mD, 12.5% respectively, and the maximum mercury injection saturation of the core is 94%. It should be noted that the sample size of NMR test is not consistent with that of mercury injection test, and the core after mercury injection test cannot be reused. Therefore, one core cannot be used to carry out NMR and mercury injection test at the same time, and only similar samples can be used to carry out comparative experiment verification.
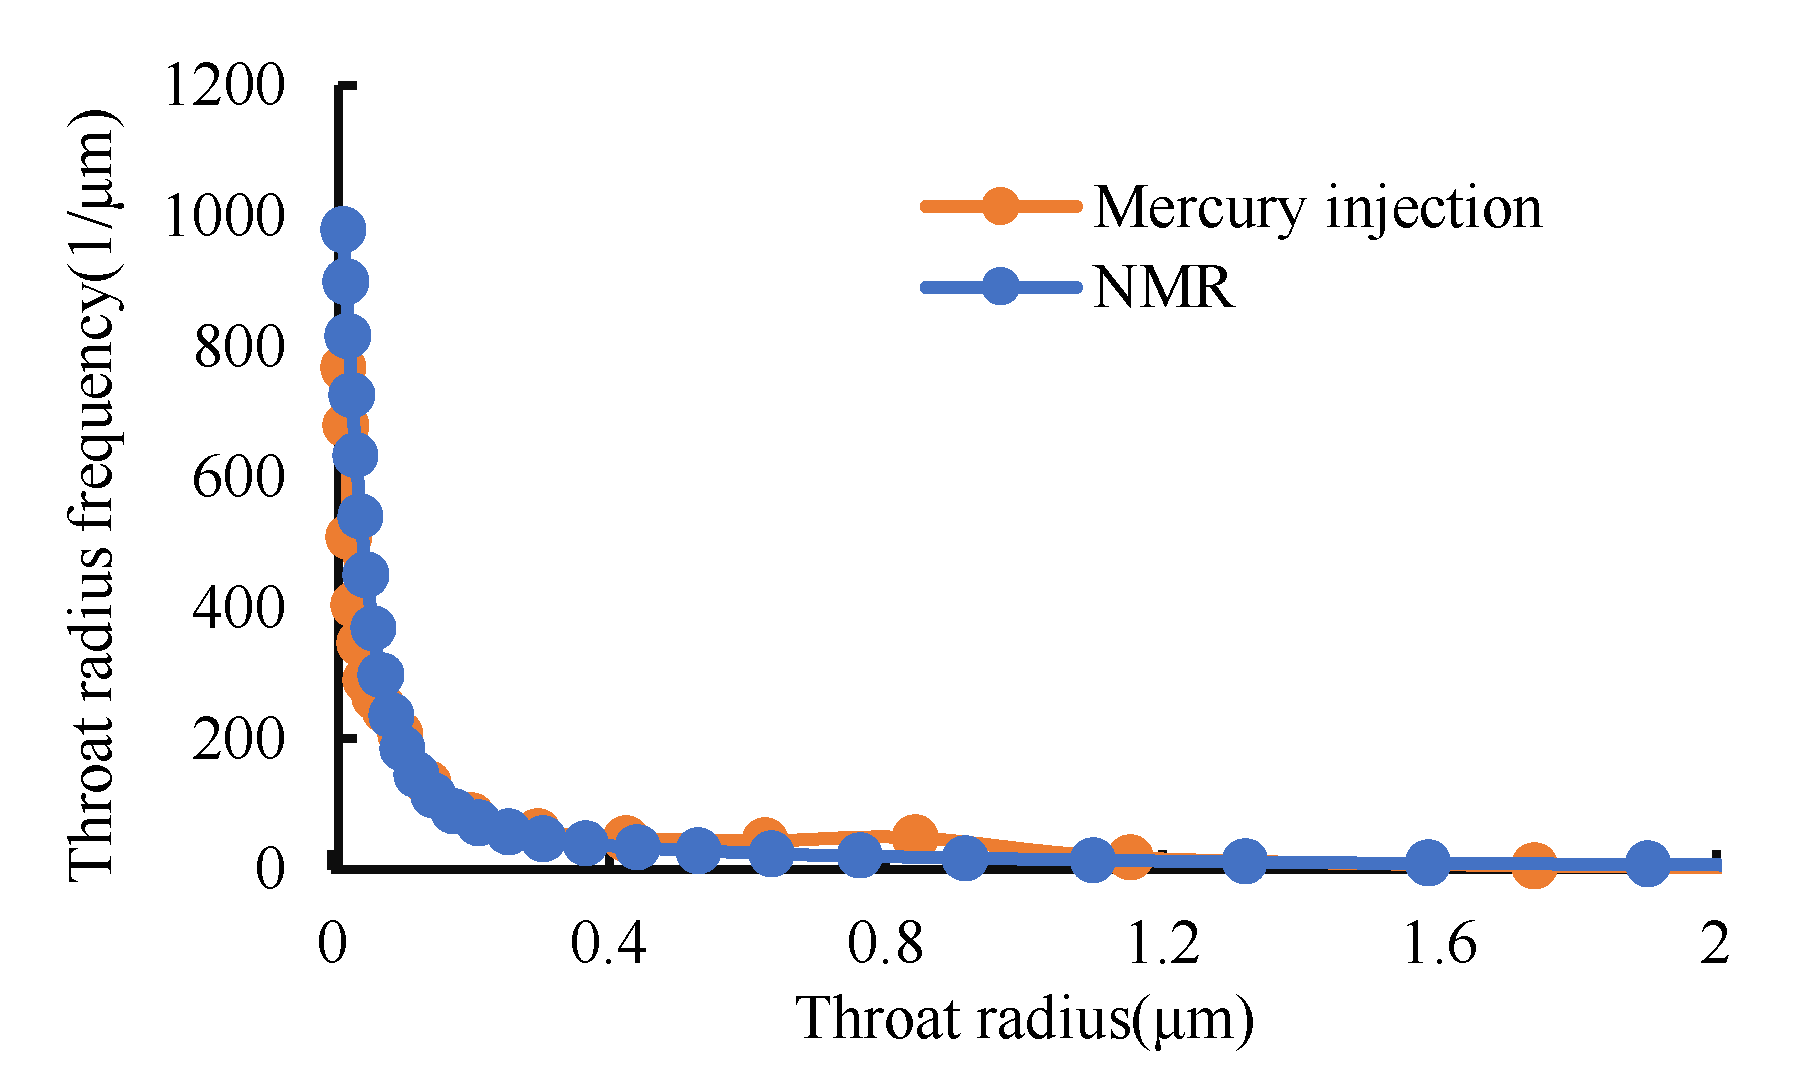
The cumulative distribution curve of throat radius can be directly obtained by mercury injection test. The cumulative distribution curve of throat radius from NMR can also be calculated according to formula (2). The vertical coordinate of the cumulative distribution curve is derived from the throat radius to obtain the throat radius distribution frequency curve. The throat radius distribution frequency curve from mercury injection and NMR are shown in
Figure 4. The results show that the throat radius distribution frequency curves obtained by the two methods of similar sample are about the same. With the increase of throat radius size, the throat radius frequency becomes smaller and smaller, the frequency of throat radius which is greater than 2μm is close to 0. The throat radius frequency of the core obtained by two methods only has some slight differences locally. Therefore, the throat radius distribution frequency curve of the low permeability and tight core obtained by NMR inversion can well represent the distribution law of the core throat radius.
3. The Test Method and Principle of "Nuclear Magnetic Resonance + High-Speed Centrifugation" for Gas-Water Relative Permeability Curve
3.1. The Test Method
The core with 100% saturated formation water is placed in a high-speed centrifuge. The centrifuge with a maximum centrifugal speed of 12000r/min. The high-speed rotation generates centrifugal force, the water in the rock core is thrown out and air enters the core to achieve the continuous change of core water saturation. Generally, the greater the centrifugal force, the more water will be separated, and the lower the residual water saturation will be. [
19] Then, the water saturation of the core and the pore throats radius participating in the gas-water two-phase flow are determined through the NMR test. Therefore, the gas-water relative permeability curve of low-permeability and tight sandstone can be tested through NMR + high-speed centrifugation. The test process is as follows:
Step 1: select the plunger sample with a diameter of 2.5cm and a length of 3cm. According to the National standard core analysis method of GB/T29172-2012[
27], the low permeability and large flow resistance characteristics of low permeability and tight sandstone [
28,
29,
30,
31], vacuum the plunger sample and pressurize 10MPa to saturate formation water for 48 hours to ensure that the sample water saturation reaches 100%, take it out and weigh it with a balance to obtain the sample pore volume and porosity;
Step 2: Test T
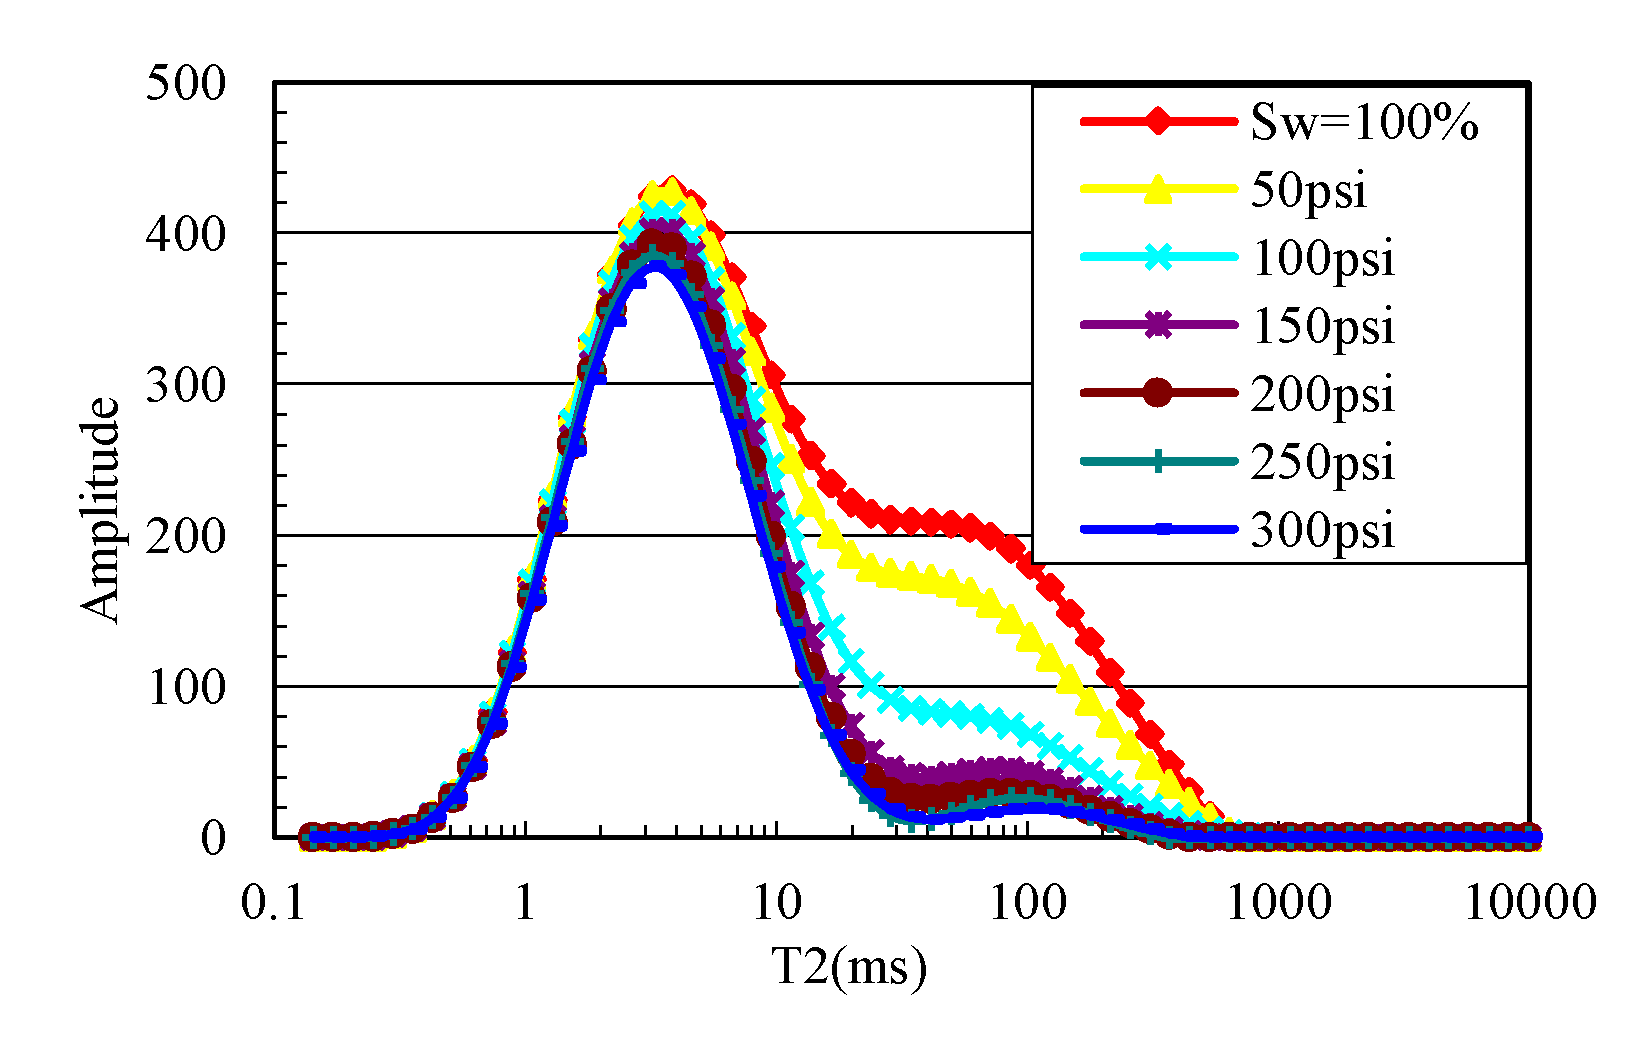
2 spectrum of core with 100% water saturation by NMR (red line in
Figure 4);
Step 3: Put the core in a centrifuge, centrifuge it for 30min with a centrifugal force of 50psi, take out the core, weigh it with a balance, and test T2 spectrum curve by NMR;
Step 4: Increase the centrifugal force, repeat step 3, and complete the core balance weighing and nuclear magnetic T2 spectrum test after centrifugation and the centrifugal force is 100psi, 150psi, 200psi, 250psi and 300psi in turn, obtain the nuclear magnetic T
2 spectrum curve of core under different centrifugal force [
27] (
Figure 5), and complete the core centrifugation NMR gas-water relative permeability curve test. The centrifuge can simultaneously centrifuge 2, 3, 4 or 6 cores with the same weight and specifications (ensure that the center of gravity of the core holding turntable is at the center of the turntable), which can greatly improve the speed of the core centrifuge experiment.
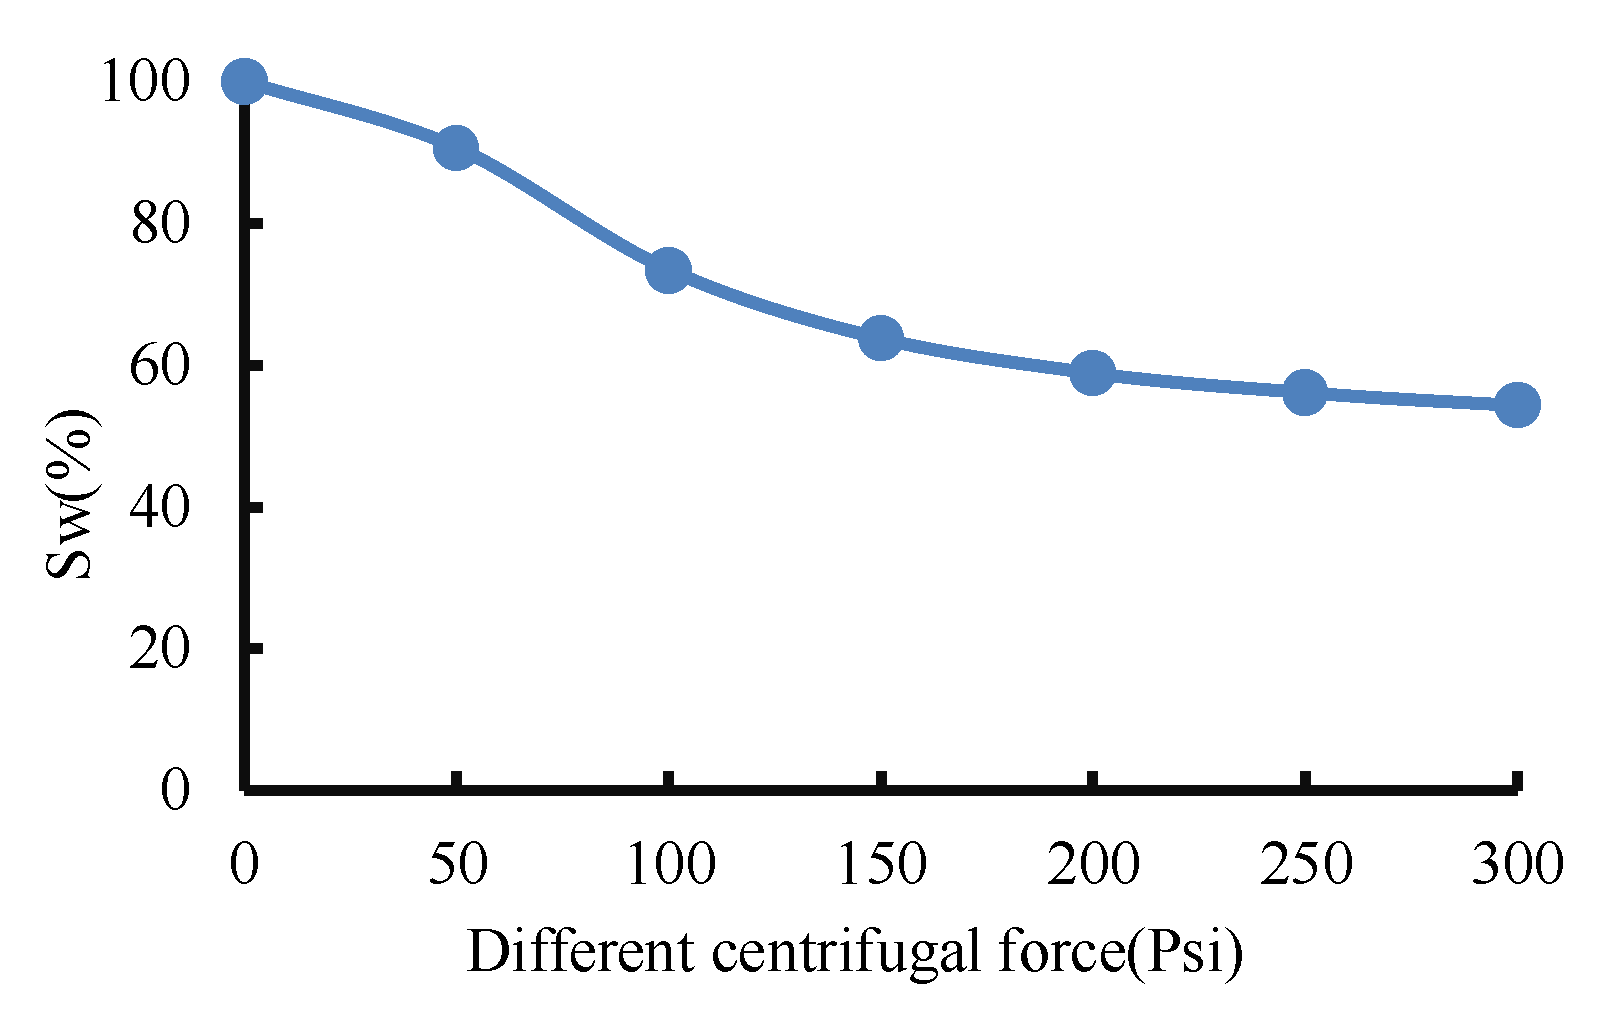
With the increase of centrifugal force, the water saturation gradually decreases, and the change of water saturation in each centrifugation becomes smaller and smaller(
Figure 6). Until the centrifugal force reaches 300psi, the water saturation tends to be constant. If the centrifugal force increase, the water saturation basically does not change and reaches irreducible water state. Consistent with the existing literature, the water saturation after centrifugation at 300psi can be regarded as the irreducible water saturation [
28]. Moreover, the centrifugal test process of 100% saturated water rock sample is consistent with the process of testing the gas-water relative permeability curve in rock core by standard displacement method, in this process the gas drive water and water saturation gradually decrease [
20]. Therefore, the core centrifugal test can be used to simulate the gas drive water experiment to test the gas-water relative permeability curve.
3.2. Calculation Model of Gas-Water Relative Permeability Curve
According to the T
2 spectrum curve from NMR, the water saturation of the core under different centrifugal conditions can be accurately calculated. A large number of core experiments show that the core saturation obtained by NMR method is consistent with the core saturation obtained by weighing method [
20]. The calculation formula of water saturation of the core from NMR is as follows:
Where:
- The signal amplitude corresponding to core relaxation time T
j when core is 100% saturated with formation water;
- The signal amplitude corresponding to the relaxation time Tj after the k times of centrifugation of; S
w,k- Water saturation after the k times of centrifugation,%;k- order number(k=0,1…,m),where m is the cumulative number of centrifugation of the core.
The denominator of formula (3) is the cumulative amplitude of core nuclear magnetic signal when the core is 100% saturated with formation water. According to formula (3) and
Figure 4, T
2 spectrum curve of the core under different centrifugal forces can calculate the corresponding water saturation change curve of the core under six different centrifugal forces (
Figure 5).
Similarly, according to formula (2) and formula (3), the T
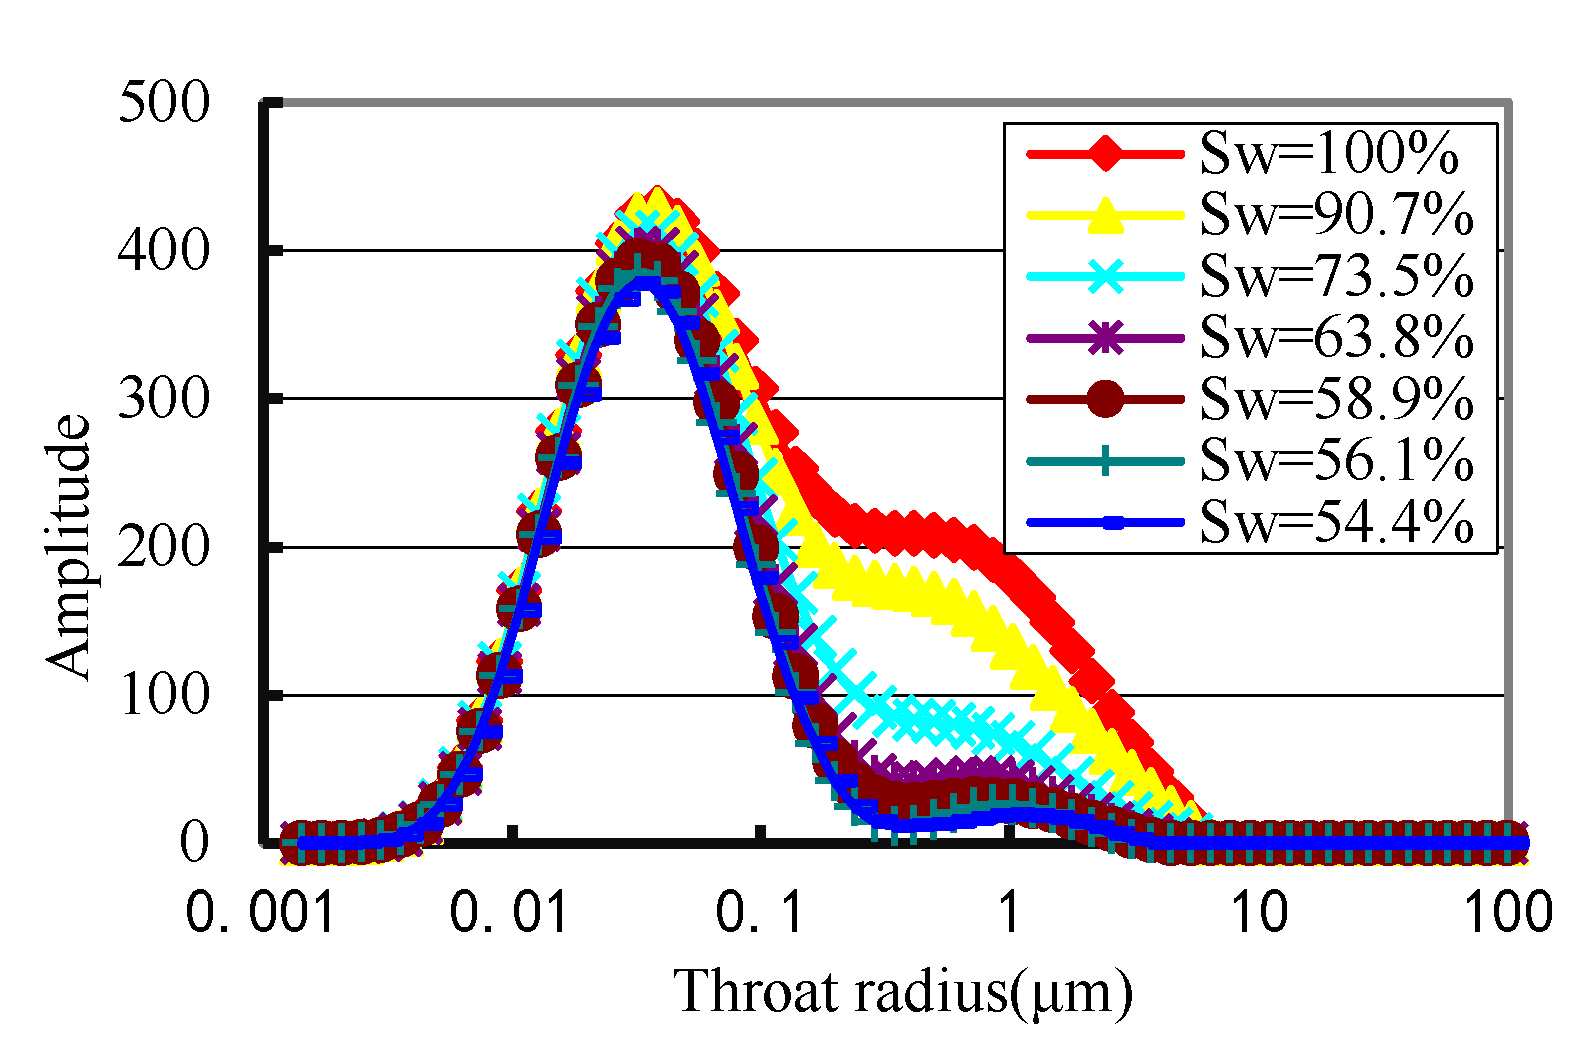
2 relaxation time is converted into throat radius from the NMR, unit: μm. The centrifugal force changes to the corresponding water saturation, thus obtaining a new type of nuclear magnetic T
2 spectrum curve of the core with the water saturation as the legend, taking the throat radius from the nuclear magnetic as the abscissa and the T2 amplitude value as the ordinate, representing the relative content of water in the throat of different radii (
Figure 7). It lays a foundation for testing the gas-water relative permeability curve of low permeability and tight rock core by "nuclear magnetic resonance + high-speed centrifugation".
According to the meaning of the new type of T
2 spectrum curve of the core from NMR, through the comparison of the T
2 spectrum curve of the core from NMR with different water saturation and the irreducible water state in
Figure 7, the relative number of the throat of radius R
j participating in the flow can be determined when the water saturation is S
w,k and the expression is as follows:
It is assumed that the core seepage channel is composed of throats with different radii. The fluid in a single throat is single-phase gas or water. The number of throats occupied by gas is proportional to gas saturation(1-S
w,k), and the number of throats occupied by water is proportional to water saturation (S
w,k). Therefore, according to the capillary bundle permeability model [
4], when the water saturation is S
w,k, the water phase permeability is:
Where: β
m,j—nuclear magnetic signal amplitude corresponding to relaxation time T
j of irreducible water; K
w,k -water phase permeability of core after k times of centrifugation, μm
2, when k=0, K
w,k is the core permeability measured by water; C-constant, a core has same C value which only affects the calculation value of core absolute permeability and has no effect on relative permeability.
Similarly, when the water saturation is S
w,k, the gas phase permeability is:
Where: K
g,k- the gas phase permeability after k times of centrifugation, μm
2.
Formula (5) and formula (6) are divided by the water phase permeability when the core water saturation is 100%, and the water phase relative permeability and gas phase relative permeability of the core are obtained:
Formula (7) and formula (8) give the calculation formula of gas-water relative permeability of low-permeability and tight sandstone. Combined with formula (3), the calculation model of gas-water relative permeability curve of low-permeability and tight sandstone core is obtained. Since the calculation model of the gas-water relative permeability curve is based on the core high-speed centrifugation and NMR experiments, it is called the core "nuclear magnetic resonance + high-speed centrifugation" gas-water relative permeability curve test method. In addition, a large number of experiments show that the core T
2 spectrum curve from NMR is smooth, and formula (3), formula (7) and formula (8) are integral formulas without derivative terms. Therefore, the smoothness and continuity of the core gas-water relative permeability curves obtained by the new method are better than those obtained by the displacement experiment method, and can be directly used for gas reservoir engineering analysis and numerical simulation [
21].
4. Verification of the new test method
In order to verify the reliability of the "nuclear magnetic resonance + high-speed centrifugal" gas-water relative permeability curve test method for low-permeability and tight sandstone, four low-permeability and tight sandstones from Sulige were selected for gas-water relative permeability curve test.
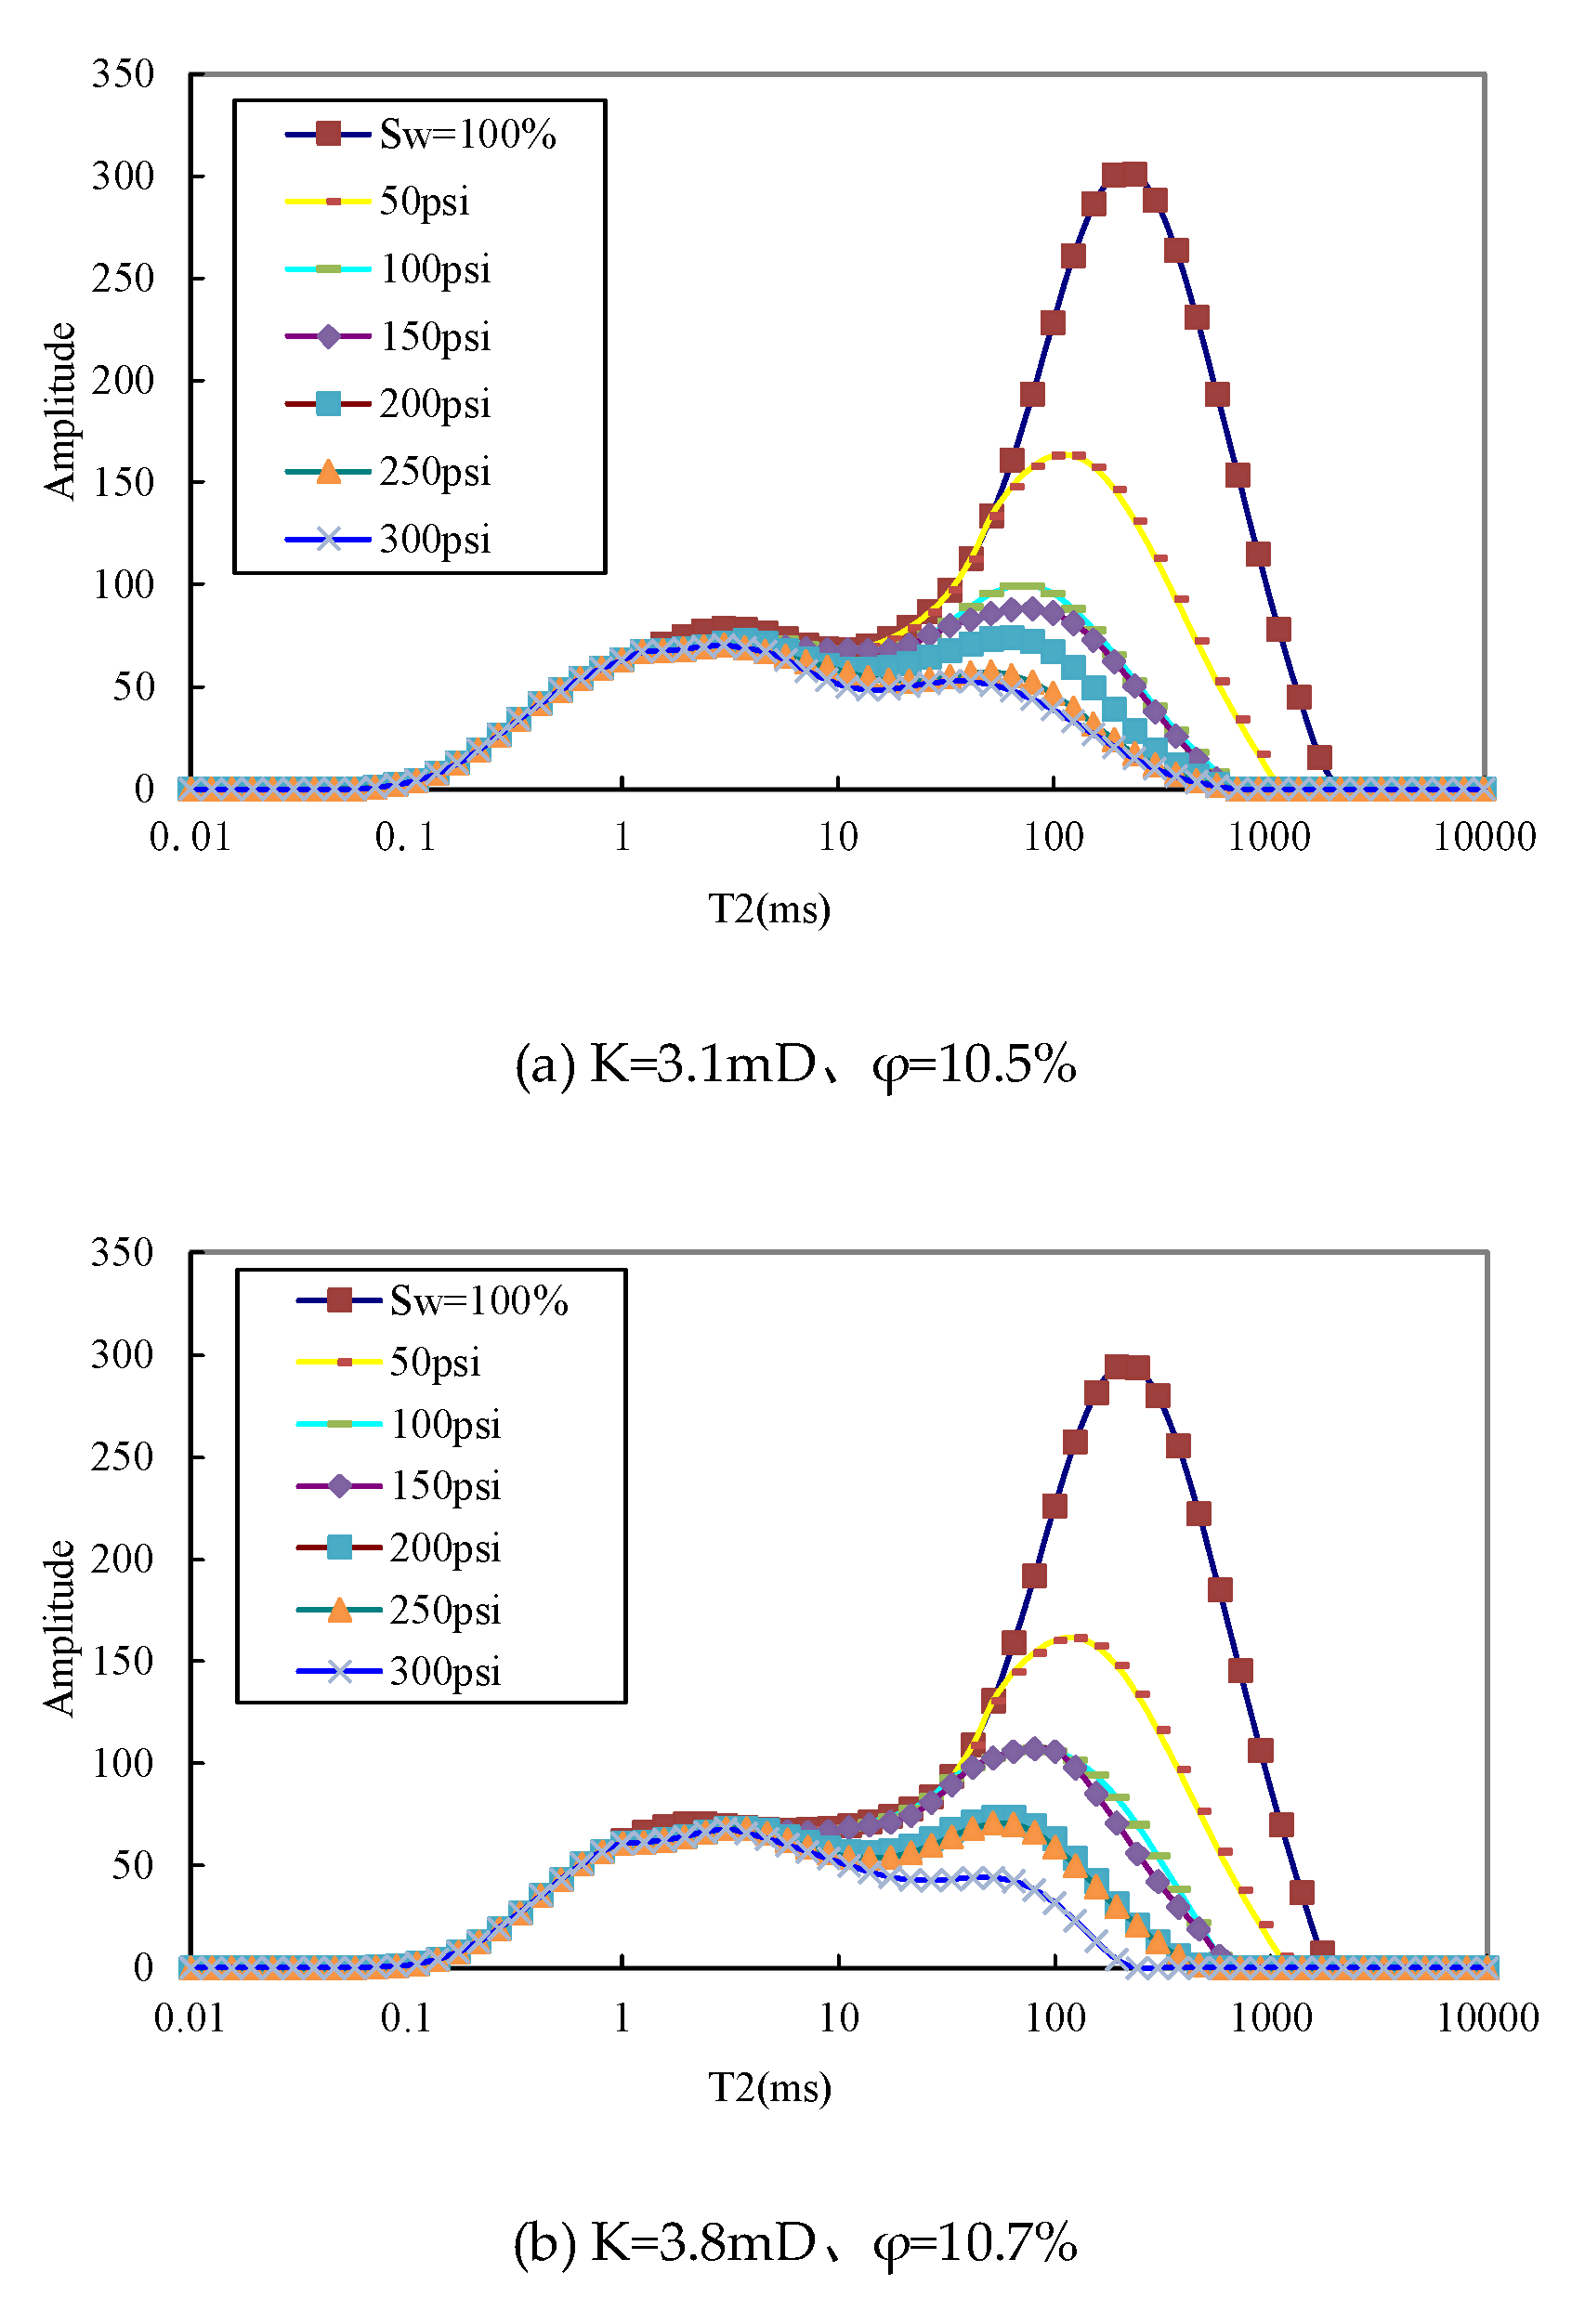
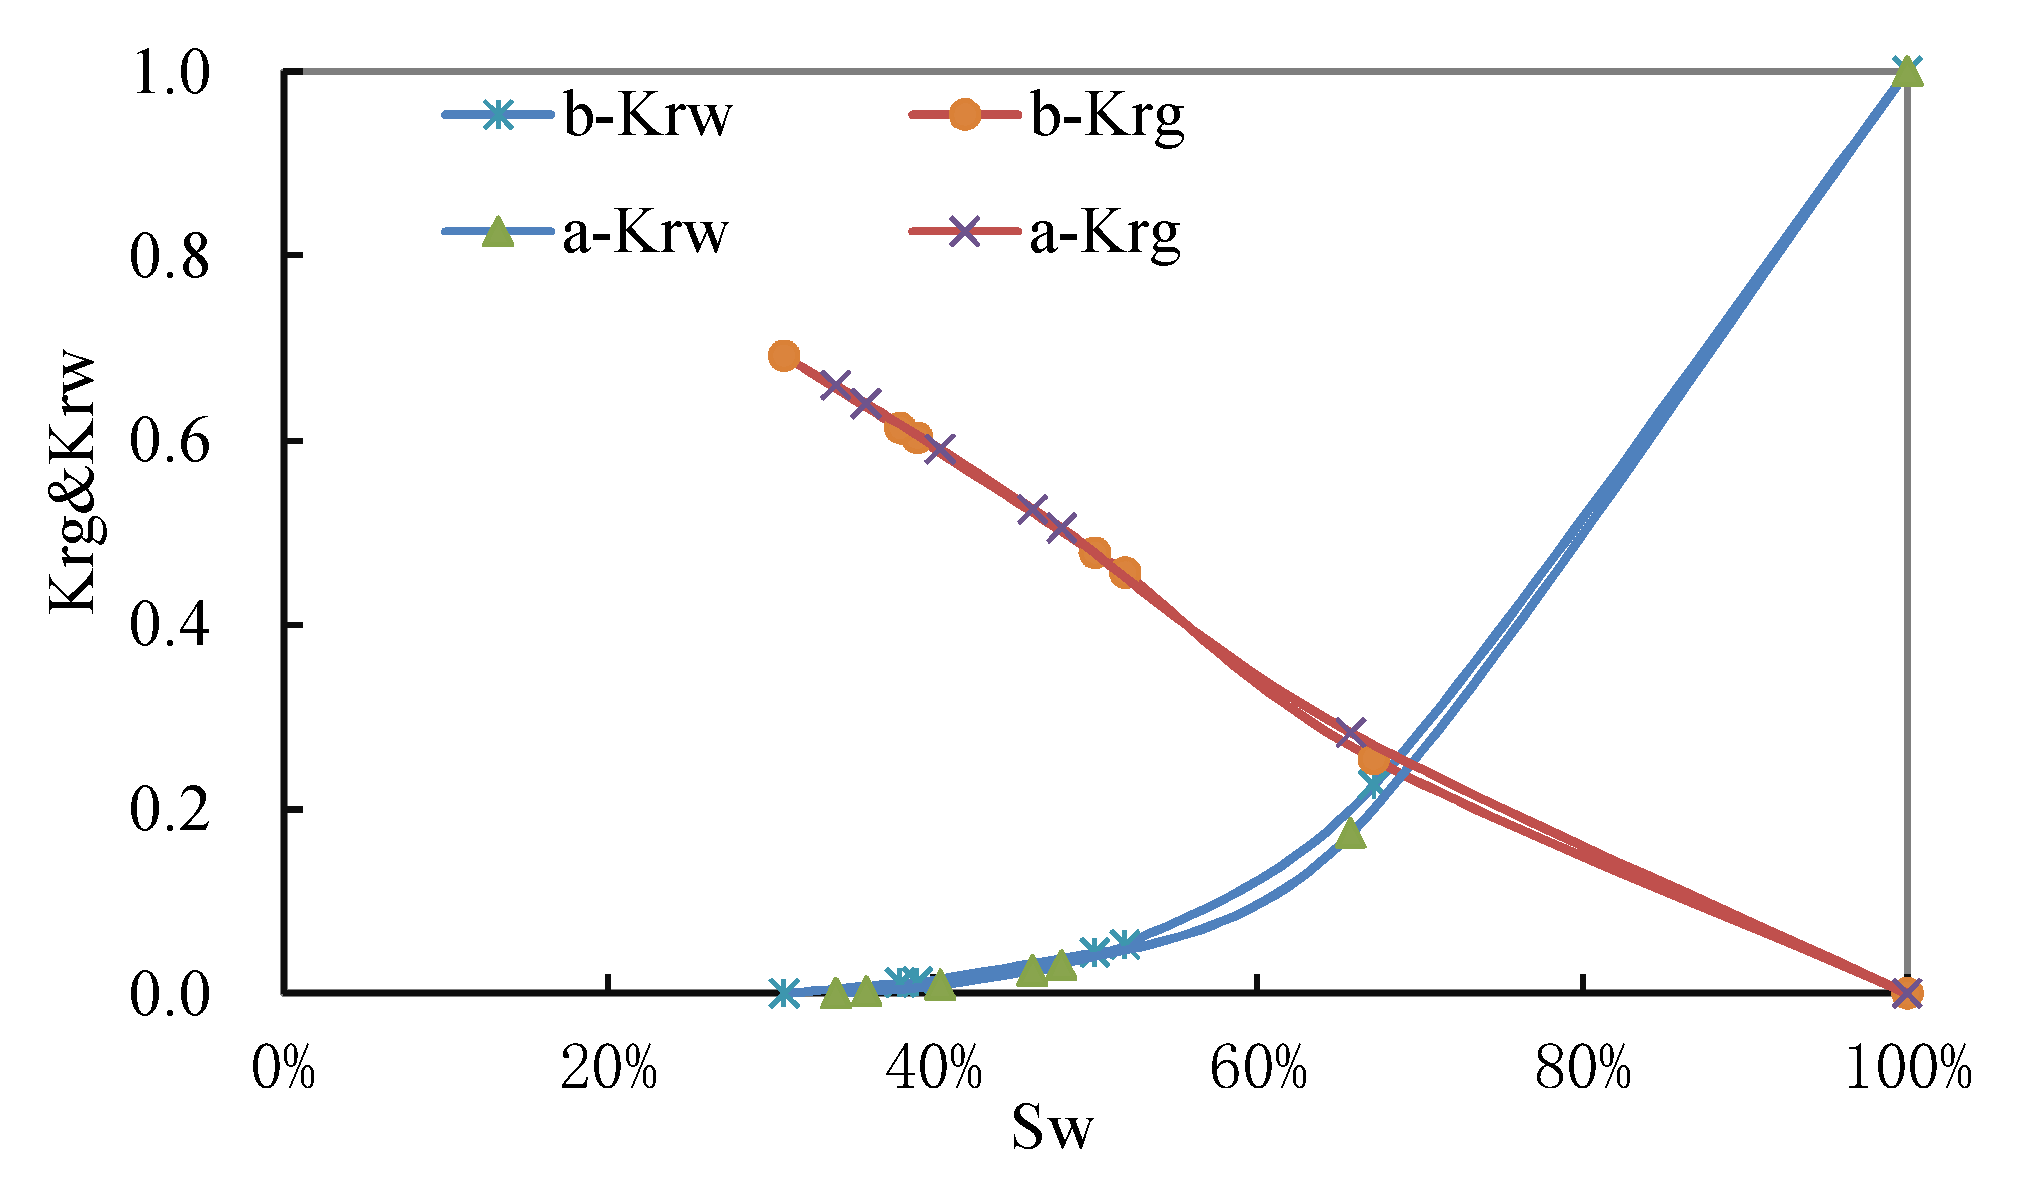
Figure 8 and
Figure 9 respectively show T
2 spectrum curves from NMR of two similar samples (permeability of 3.1 ~ 3.8mD, porosity of 10.5% ~ 10.7%) under different centrifugal forces and the relative permeability curves of gas-water in the rock core obtained by the "nuclear magnetic resonance + high-speed centrifugation" method. The shape of T
2 spectrum curve obtained by two similar samples under different centrifugal forces is consistent with that of gas-water relative permeability curve, which indicates that the new method has good stability and repeatability, and meets the requirements of scientific experiments and test methods.
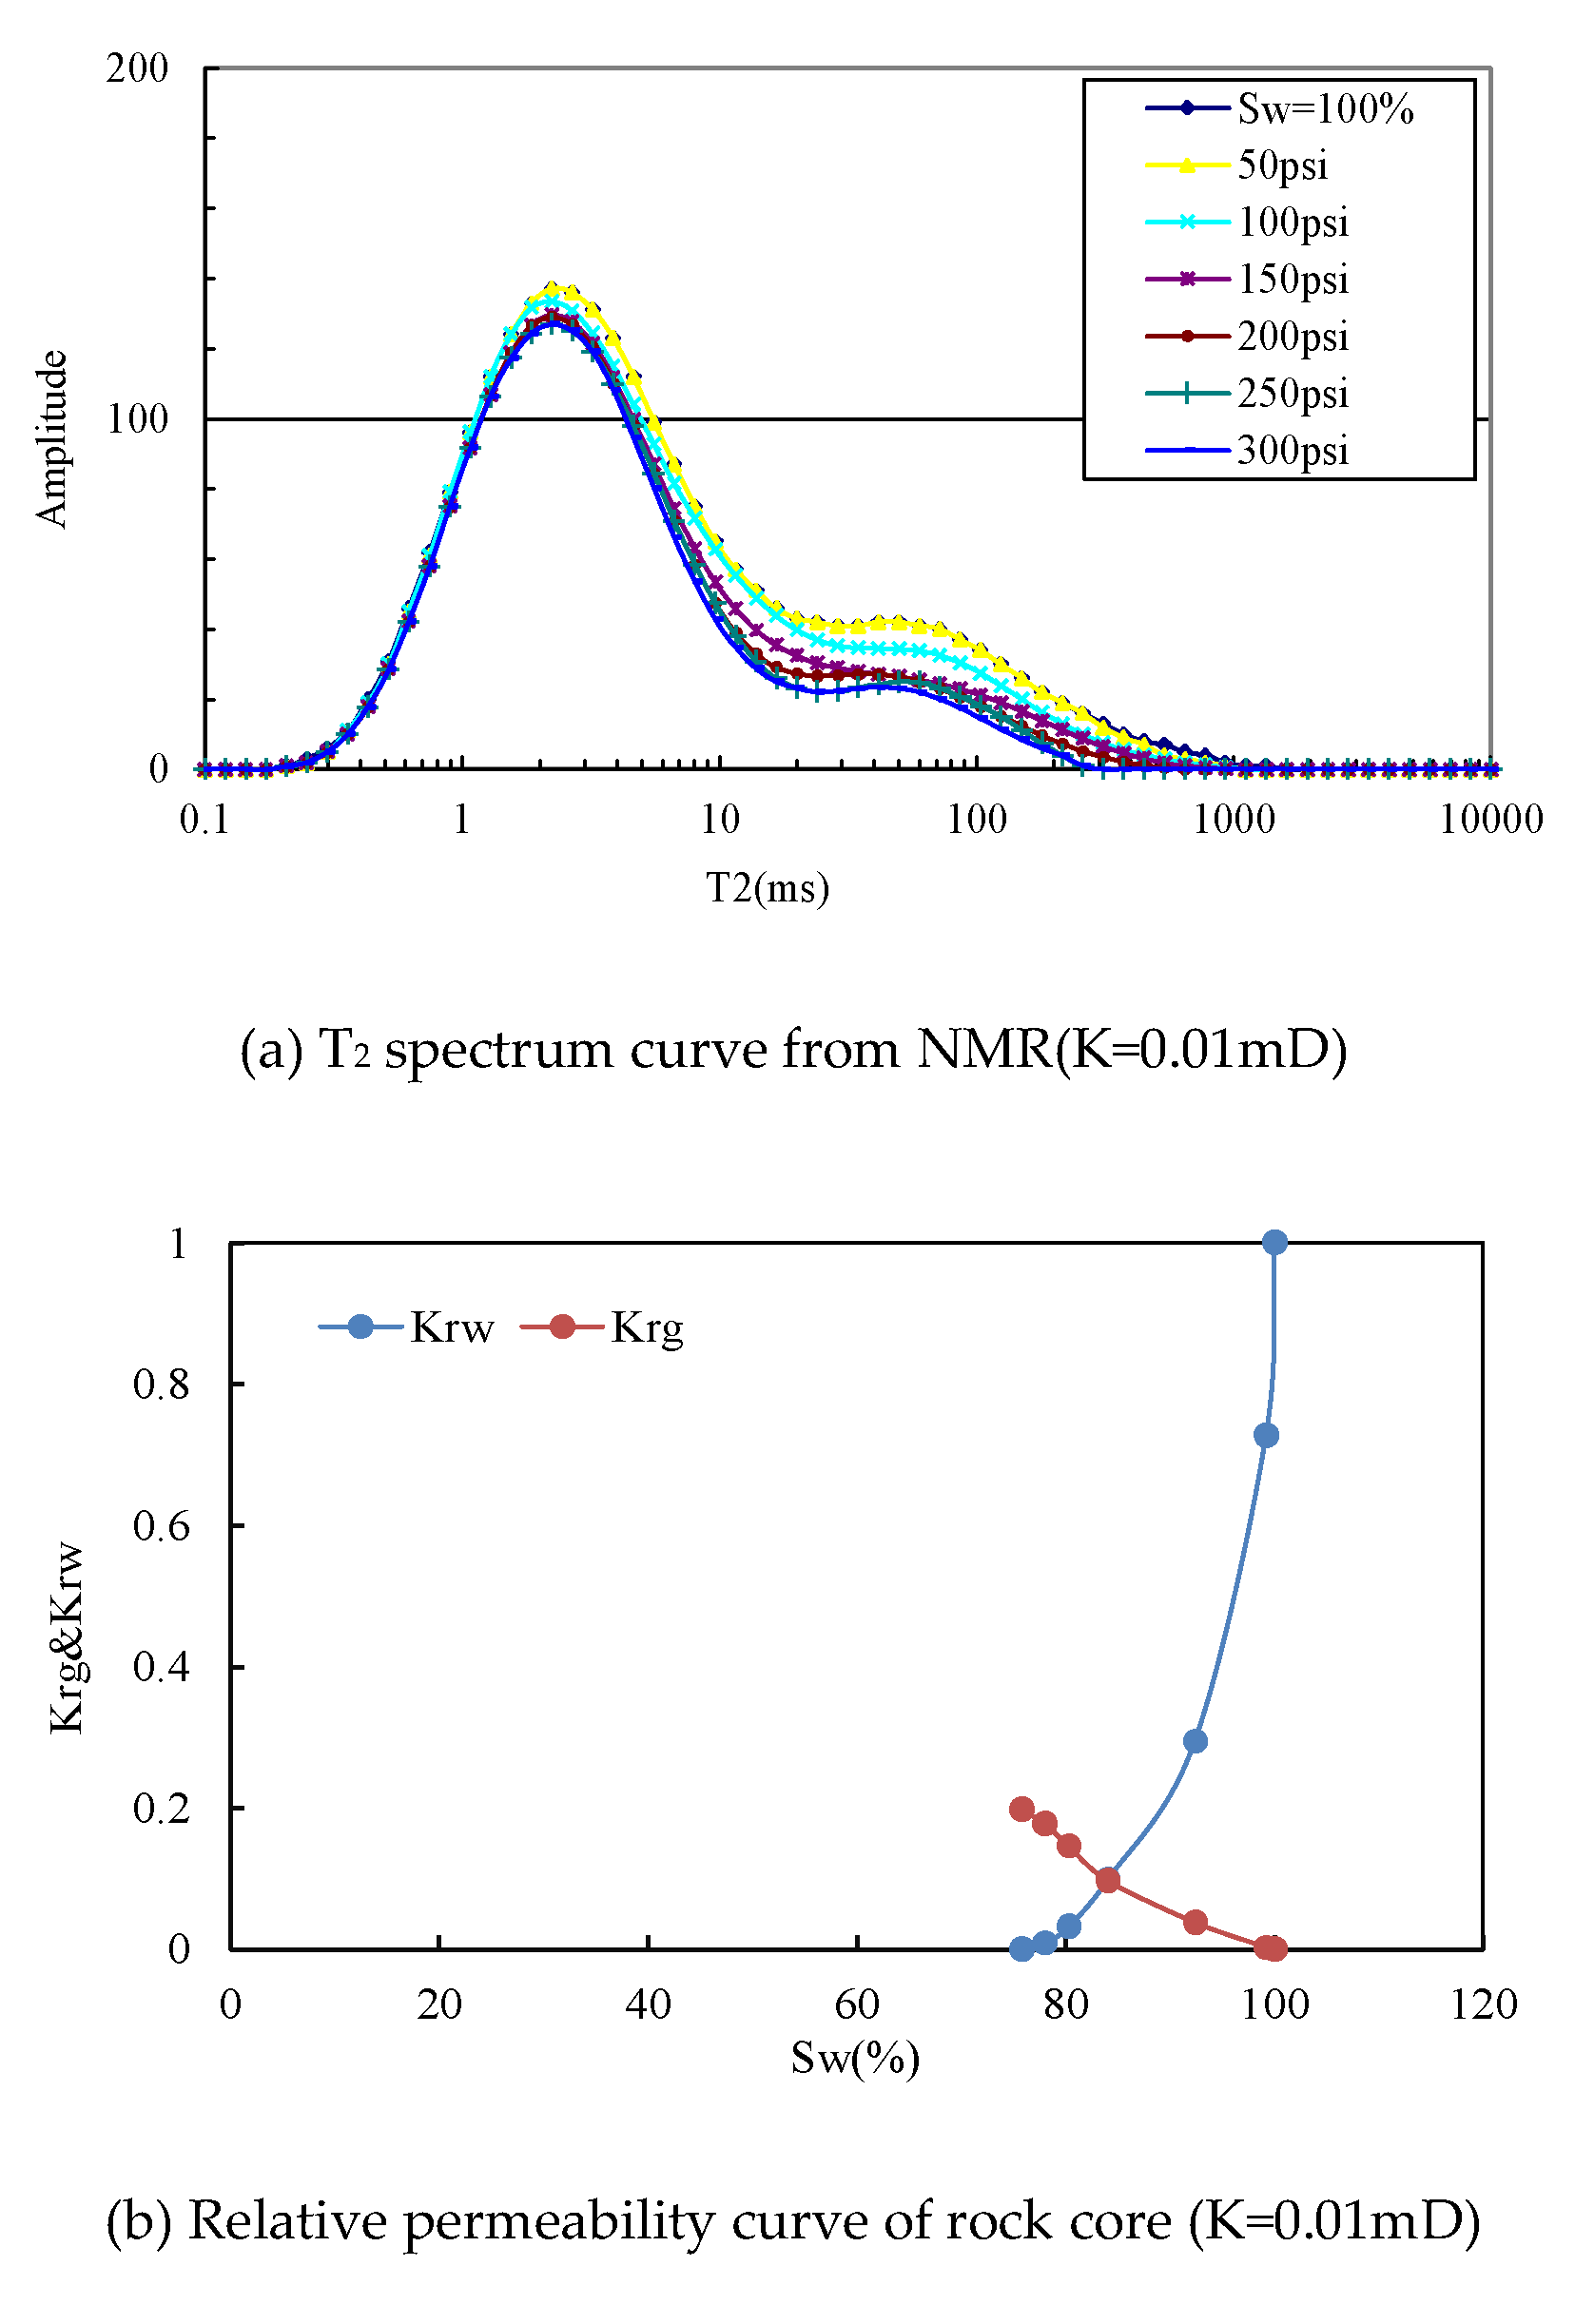
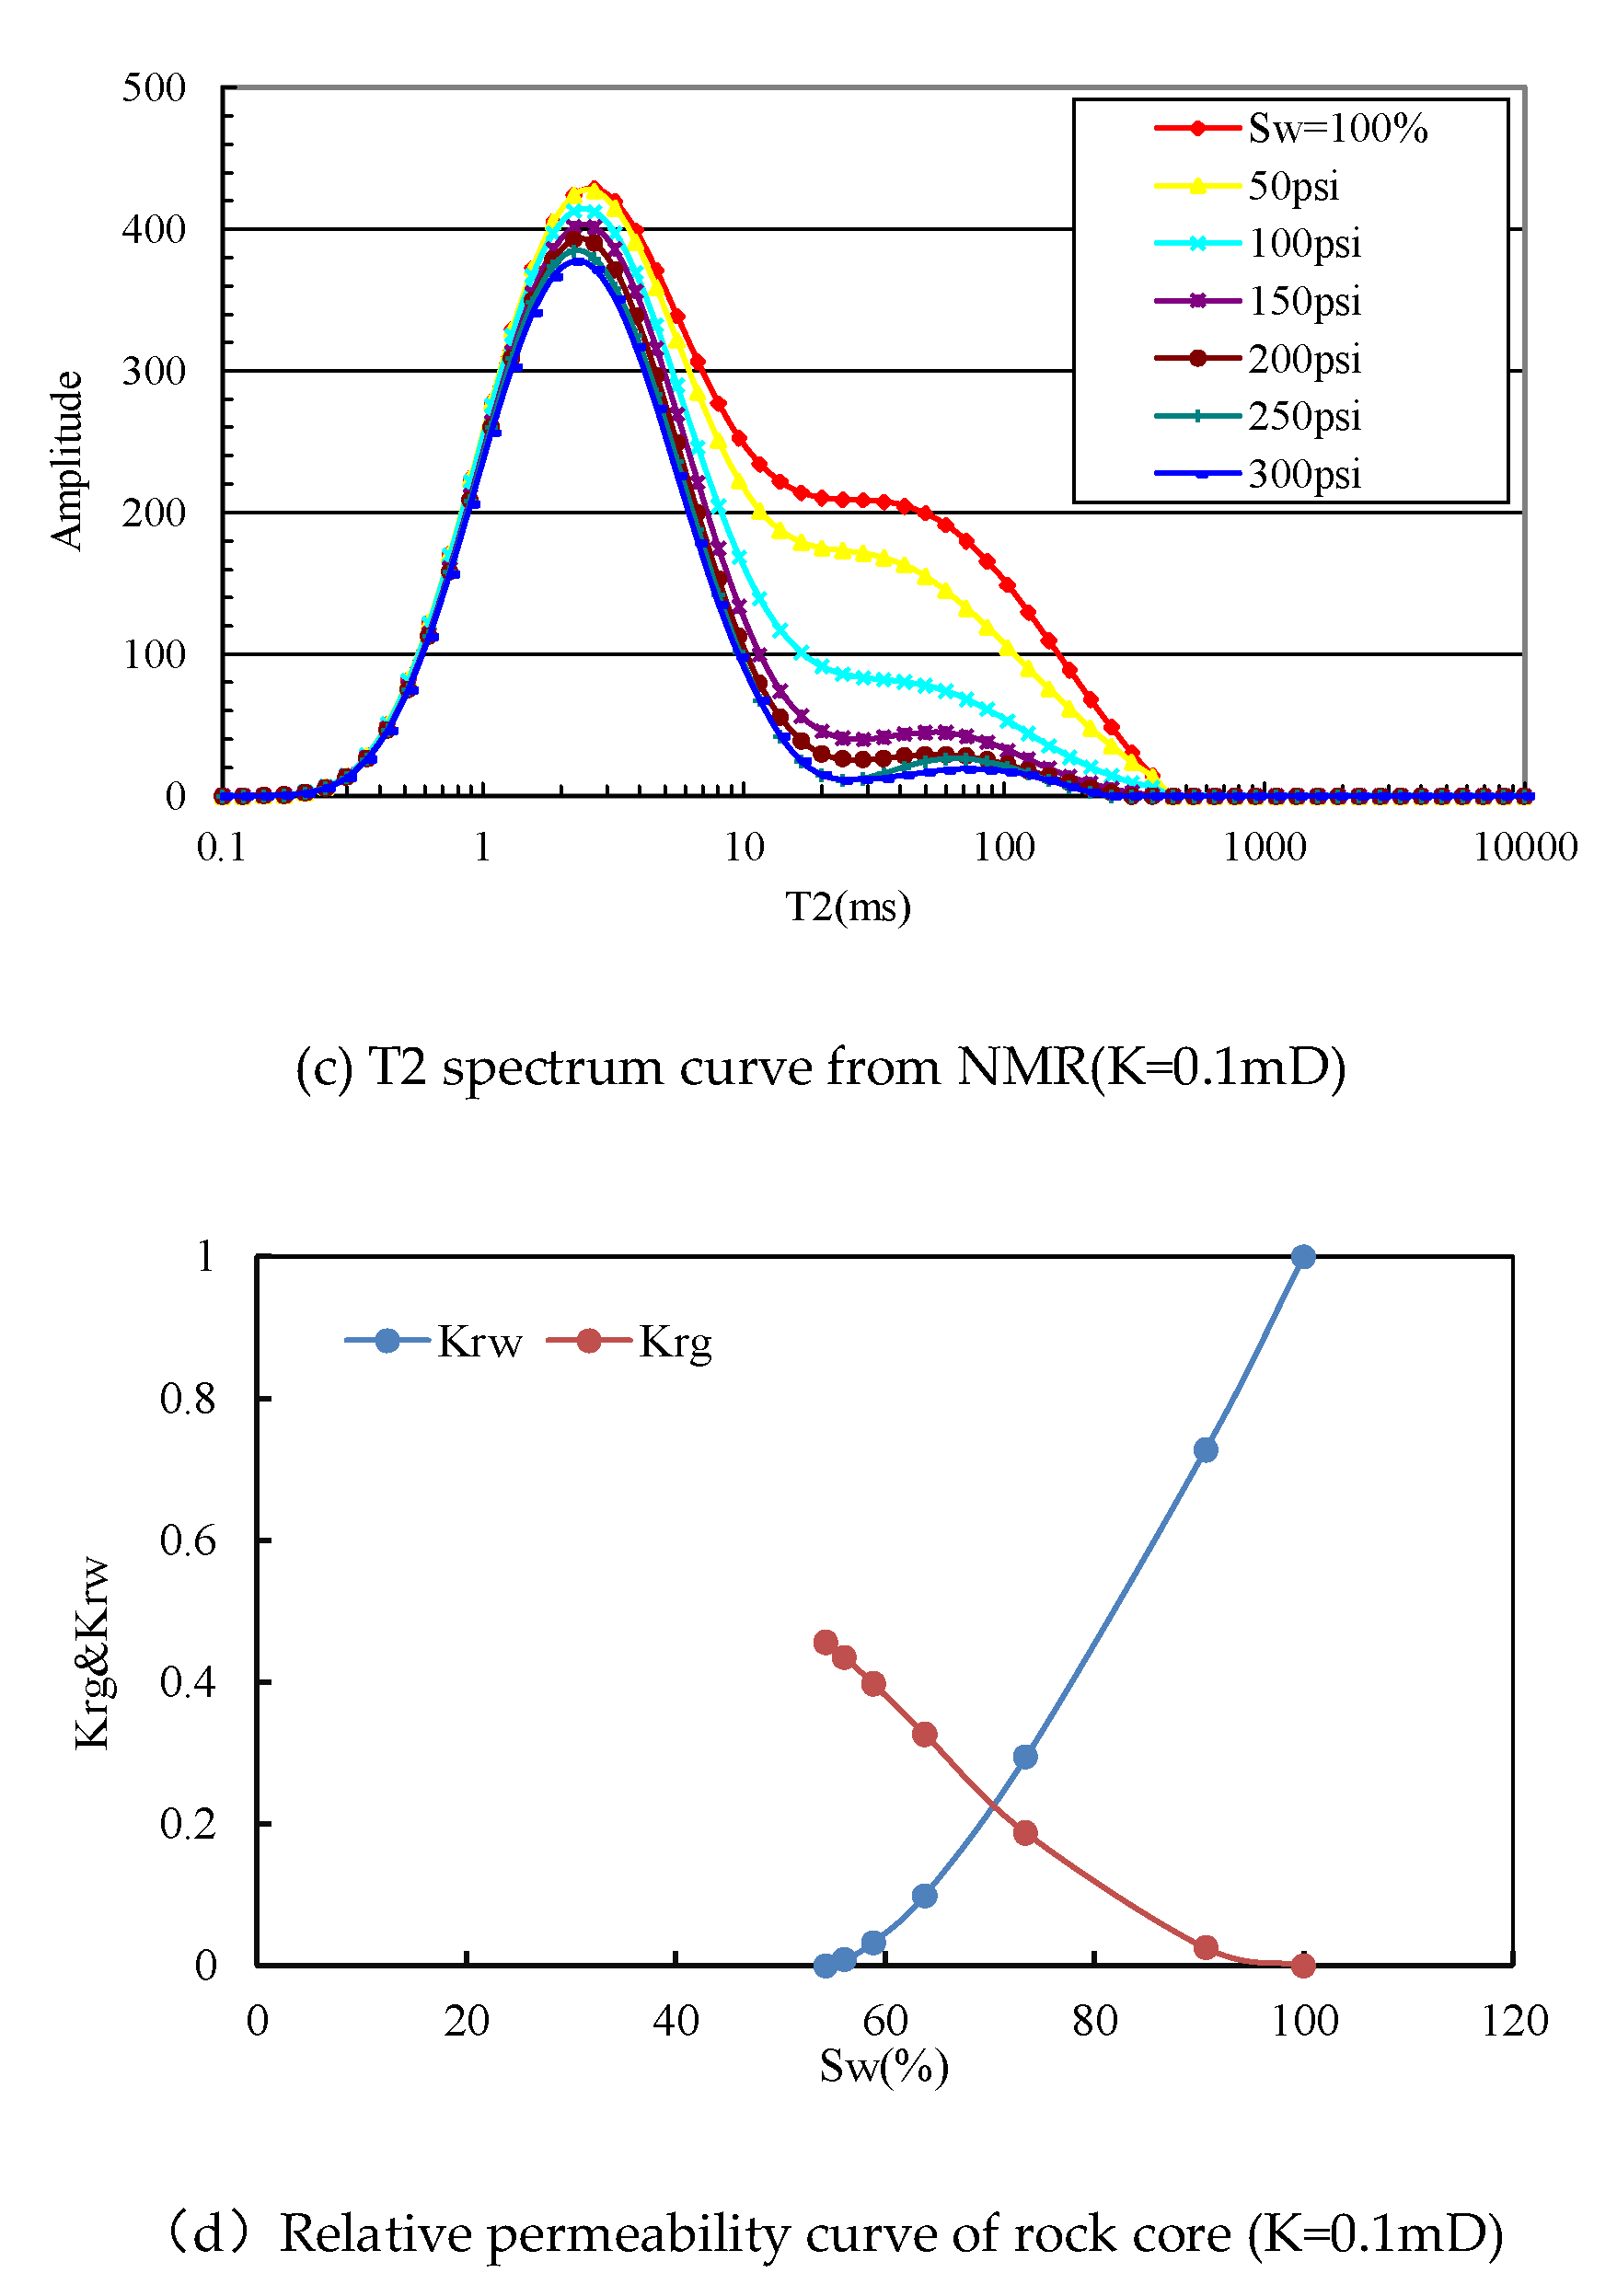
Figure 10 shows the T
2 spectrum curve from NMR and the relative permeability curve of gas-water of tight sandstone cores with different permeability levels. Comparing the experimental results of low permeability rock samples (
Figure 7 and
Figure 8), it is found that the core with lower permeability has smaller micro pores, less pore water available by centrifugation, higher core residual water saturation, and lower final gas-phase seepage capacity, which is completely consistent with the understanding of gas-water two-phase seepage law of low permeability and tight sandstone [
26,
27,
28], further proving the reliability of the new method.
It is feasible to test the gas-water relative permeability curve of low-permeability and tight sandstone core by "nuclear magnetic resonance + high-speed centrifugation". Compared with conventional displacement method, the new method has the following advantages: the core diameter is 2.5cm, the length is 3cm, the centrifugal force was 50, 100, 150, 200, 250 and 300psi in turn, and centrifuged for 30min each time. The echo interval during NMR test is 0.2ms. The size of the test sample and the test process are unified and meet the requirements of the standardized experiment; The new method can test up to 6 cores at a time, which can greatly improve the test speed. In addition, the unsteady state displacement method in the national standard GB/T28912-2012 determination method of relative permeability of two-phase fluid in rock calculates the gas-water relative permeability curve in the rock core through derivation. Due to the complex two-phase flow mechanism of low permeability and tight sandstone and the discontinuity of gas and water flow in the unsteady displacement process, the continuity of the gas-water relative permeability curves obtained by the existing standards is poor, and usually requires post-processing before they can be used for gas reservoir engineering calculation, The new method calculates the gas-water relative permeability in the rock core through integration. The calculated gas-water relative permeability curves have better continuity and smoothness, which provides a more effective and practical means for understanding the gas-water relative permeability in low permeability and tight sandstone reservoirs and gas reservoir engineering calculation.
Compared with mercury injection method, the new method of gas-water relative permeability curve test takes into account the difference between two-phase flow and single-phase flow. The new method does not assume that all throats participate in the flow, but subdivides the throats into throats participating in the flow and not participating according to the comparison of T2 spectrum curves from NMR with different water saturation, Then the gas-water relative permeability curve in rock core are calculated according to the capillary bundle model of core permeability.
The same is true for gas and water two-phase seepage in actual rock core. Unlike single-phase gas or single-phase water seepage, all throats participate in the flow. Due to the capillary effect, only part of throats participates in the two-phase flow of core. Especially for low permeability and tight core, the capillary effect is significant in two-phase flow and there are relatively few throats participating in the flow in two-phase flow. So the irreducible water saturation is high, and the two-phase seepage resistance is significantly greater than the single-phase seepage. Therefore, the gas-water relative permeability curves obtained by "nuclear magnetic resonance + high-speed centrifugation" method can better reflect the characteristics of gas and water two-phase seepage in low permeability and tight cores than those obtained by mercury injection method.
5. Conclusions
- (1)
The NMR and mercury injection curves of a large number of cores show that the cumulative distribution curve of T2 spectrum from NMR of low permeability and tight sandstone is consistent with the cumulative distribution curve of throat from mercury injection test. The T2 spectrum curve from NMR can characterize the distribution law of pore size and throat size.
- (2)
The gas-water relative permeability curve in rock core obtained based on NMR, high-speed centrifugal experiment and classical Poiseuille equation can effectively represent the production performance of gas and water in the process of gas reservoir depletion development, and truly reflect the gas-water relative permeability of in tight sandstone reservoir, providing a direct and reliable experimental curve for gas reservoir engineering and numerical simulation research.
- (3)
The "nuclear magnetic resonance + high-speed centrifugation" test method for gas-water relative permeability curve of low permeability and tight sandstone reservoir has obvious advantages: the test sample size and test process are unified, high test efficiency, high test accuracy. The gas-water relative permeability curve obtained by numerical integration have good continuity and good application prospects. It is recommended to popularize them.
References
- Li Xizhe, Wan Yujin, Liu Xiaohua, Zhang manlang, Gao shusheng,Su Yunhe. Longwangmiao gas reservoir development project design in Anyue Gasfield [R]. Langfang: Research Institute of Petroleum Exploration & Development-Langfang, 2013.
- Li Xizhe, Wan Yujin, Lu Jialiang, et al. Complex gas reservoir development technology [M], Beijing: Petroleum industry press, 2010.
- Shen Pingping. Petrophysics experiment techonolgy [M].Beijing: Petroleum Industry Press, 1995.
- He Gengsheng. Reservoir physics [M]. Beijing: Petroleum Industry Press,1994:239-242.
- Yang Yang, Tang Ling. A New Method to Determine the Relative Permeability Curve Parameters by Capillary Pressure Data[J]. Journal of Chongqing University of Science and Technology(Natural Sciences Edition),2014,16(03):40-43.
- Purcell W. Capillary pressures-their measurement using mercury the calculation of permeability therefrom. Trans.AIME, 1949, 186:39-48. [CrossRef]
- Burdine N. Relative permeability calculations from pore size distribution data. Trans .AIME, 1953, 198:71-78. [CrossRef]
- Li K,Horne R N.Comparison of Methods to Calculate Relative Permeability from Capillary Pressure in Consolidated Water-wet Porous Media[J]. Water Resources Research,2006,14( 6) : 42-54.
- Lei Gang, Dong Pingchuan , Cai Zhenzhong , Zhang Zhenghong,Dongruitao,Yang Shu,Wu Zisen,Cao Nai. Gas-water relative permeability of tight sandstone gas reservoirs[J]. Journal of Central South University (Science and Technology),2016,47(08):2701-2705.
- Li Jun ,Liu Ronghe ,Peng Xiaodong ,Zeng Yan. The Fractal Study of Using Capillary Pressure Curve to Calculate the Relative Permeability Curve of Shale Gas Reservoir[J]. Science Technology and Engineering,2013,13(08):2193-2197.
- Gao Shusheng,Xiong Wei,Liu Xiangui,Xue Hui. Experimental research status and several novel understandings on gas percolation mechanism in low-permeability sandstone gas reservoirs [J]. Natural Gas Industry, 2010,30(1):52-54.
- Huang Xiangfeng, Zhang Guangming, Han Junlei,Wang He,Qin ZHaohui. New measurement methods for relative permeability curve and its application[J] Petroleum geology and engineering,2013,27(01):53-55+139.
- Shen Pingping.A review of the dynamic methods to determine relative permeability of reservoir rocks[J]. Petroleum Exploration and Development ,1982(03):73-80.
- Lian Peiqing,Cheng Linsong,Liu Lifang.The relative permeability curve of fractured carbonate reservoirs[J]. Acta Petrolei Sinica[J],2011,32(06):1026-1030.
- Lv Weifeng, Qin Jishun, Wu Kangyun, Liu Qingjie, Yan Shouguo. An overview of testing methods of poroperm and relative permeability for low permeability rocks[J]. Special Oil & Gas Reservoirs ,2011,18(03):1-6+135.
- Zhong Xiao, Du Jianfen. Gas-water permeability characteristics and high temperature and high pressure experimental study [J]. Journal of Chongqing University of Science and Technology (Natural Sciences Edition), 2013, 15(3): 70-73.
- Li Chenghui, Li Xizhe, Gao Shusheng, et al. Experiment on gas-water two-phase seepage and inflow performance curves of gas wells in carbonate reservoirs: A case study of Longwangmiao Formation and Dengying Formation in Gaoshiti-Moxi block, Sichuan Basin, SW China [J]. Petroleum Exploration and Development, 2017, 44(6): 930-938.
- Test method for two phase relative permeability in rock[S]. SY/T 5345-2007.
- Gao Shusheng, et al. Study on seepage law and development mechanism of low permeability sandstone gas reservoir of Xujiahe formation in central Sichuan Province [M]. Beijing:Petroleum Industry Press, 2011.
- Jiao Chunyan, Liu Huaxun. The correction Method of permeability and water Saturation Curve on Low Permeability Sandstone Core [J]. Science Technology and Engineering, 2014,25(14):195-198.
- Hu Zhiming, Ba Zhibo, Xiong Wei, Gao Shusheng, Luo Rong. Analysis of micro pore structure in low permeability reservoirs [J].Journal of Daqing Petroleum Institute, 2006,30(3):51-53.
- Gao Shusheng, Hu Zhiming, Liu Huaxun, et al. Microscopic pore characteristics of different lithological reservoirs [J]. Acta Petrolei Sinica, 2016, 37(2):248-256.
- Liu Wei, Xing Li, et.al. Nuclear magnetic resonance logging[M].Beijing: Petroleum Industry Press,2011:10-70.
- Wang Wei,Song Yuanjuan,Huang Jing,Li Yahui,Chen Zhaobing,Zhu Yushuang.Fractal characteristics of pore-throat structure in tight sandstones using high-pressure mercury intrusion porosimetry[J].Bulletin of Geological Science and Technology,2021,40(04):22-30.
- He Wei, Zhong Fuxun, He Chengzu, Feng Wenguang. Fractal texture research on the pores in reservoir rocks and its application [J]. Natural Gas Industry, 2000, 20(02):67-70.
- Ye Liyou,Gao Shusheng,Yang Hongzhi,Xiong Wei,Hu Zhiming,Liu Huaxun,Du Shan. Water Production mechanism and development strategy of tight sandstone gas reservoirs [J]. Natural Gas Industry, 2015,35(2):41-46.
- Practices for core analysis[S].GB/T 29172-2012.
- Gao Shusheng,Hou Jirui,Yang Hongzhi,Xiong Wei,Hu Zhiming. Water production mechanism of Xujiahe low-permeability sandstone gas reservoirs in middle Sichuan Basin [J]. Natural Gas Industry, 2012,32(11):40-42.
- Kong Xiangyan.Advanced mechanics of fluids in porous media [M]. Press of University of Science and Technology of China, 2010.
- Gao Shusheng,Xiong Wei,Liu Xiangui,Xue Hui. Experimental research status and several novel understandings on gas percolation mechanism in low-permeability sandstone gas reservoirs [J]. Natural Gas Industry, 2010,30(1):52-54.
- Yang Jian, Kang Yili, Li Qiangui, et al. Characters of micro-structure and percolation in tight sandstone gas reservoirs [J]. Advances in Mechanics, 2008, 38(2): 229-234.
|
Disclaimer/Publisher’s Note: The statements, opinions and data contained in all publications are solely those of the individual author(s) and contributor(s) and not of MDPI and/or the editor(s). MDPI and/or the editor(s) disclaim responsibility for any injury to people or property resulting from any ideas, methods, instructions or products referred to in the content. |
© 2024 by the authors. Licensee MDPI, Basel, Switzerland. This article is an open access article distributed under the terms and conditions of the Creative Commons Attribution (CC BY) license (http://creativecommons.org/licenses/by/4.0/).
