1. Introduction
The application of advanced smelting technology significantly reduces impurities such as sulfur (S) and phosphorus (P) in steel, resulting in higher purity and cleanliness of the liquid steel [
1,
2,
3,
4]. Low-carbon high strength bainitic steel, developed using pure smelting technology, exemplifies this advancement [
5,
6]. This steel’s strength is enhanced through fine-grain strengthening, sub-structural strengthening, micro-alloying, and precipitation strengthening, which result in excellent mechanical properties and performance. Consequently, bainitic steels are widely used in high-performance applications such as bridges, oil platforms, and ships due to their exceptional strength and toughness [
7,
8].
Research on the effect of carbon content on bainitic steels began in the 1960s [
9]. To improve the hardenability of low-carbon bainitic steels, researchers added manganese (Mn) along with suitable amounts of boron (B) and titanium (Ti) to the steel, achieving strengths up to 1000 MPa [
10]. Subsequent studies examined the impact of Mn content on bainitic steels and established a Mn-B system for air-cooled bainitic steel [
11,
12,
13]. Caballero et al. investigated the effect of carbon content on bainitic steels and found that increasing the carbon content to 0.4% resulted in a strength exceeding 1375 MPa. However, this increase in strength led to reduced toughness, necessitating tempering treatments [
14,
15,
16,
17,
18].
To ensure the mechanical properties of steel, heat treatments such as quenching, normalizing, and tempering are often required [
19,
20]. Tempering, as the final heat treatment process, is particularly crucial. The success of tempering depends on selecting the appropriate temperature and time parameters; incorrect selections can alter the mechanical properties of steel, including temper brittleness, hardness, and impact toughness. Therefore, establishing relevant tempering prediction models is essential for optimizing tempering parameters and predicting mechanical properties. Holloman and Jaffe proposed a numerical relationship to predict the mechanical properties of steels after tempering, expressed in various forms by different authors [
21,
22,
23,
24]. Their model combines tempering temperature and time into a single P parameter, representing the combined effect of these variables. Inoue also developed a similar parameter, designated as the λ parameter, to quantify the degree of tempering during heating and soaking processes [
25,
26]. Once the λ parameter is determined for specific temperature and time conditions, the mechanical properties of steels during tempering can be predicted.
The objective of this study is to investigate the tempering behavior of low-carbon bainitic steel, with a particular focus on the key parameters of tempering temperature and time. Mechanical prediction models based on the P and λ parameters are developed to optimize tempering parameters and predict mechanical properties during the tempering process.
2. Experimental Procedure
The material used in this study is a low-carbon bainitic steel, with its main chemical composition shown in
Table 1. Specimens measuring 15 mm × 15 mm × 20 mm were prepared after controlled rolling and cooling. The initial rolling temperature was 1050°C, and the final rolling temperature was 800°C. The samples were then tempered at temperatures ranging from 200°C to 700°C for durations of 0.5, 1.0, 1.5, and 2.0 hours. After grinding and polishing, the samples were etched with 4% nitric alcohol solution. The microstructure was examined using scanning electron microscopy (SEM). Hardness was measured using an HVS-1000 microhardness tester. Based on the hardness values obtained, a tempering prediction model and a tempering kinetic curve for the steels were developed.
3. Results and Discussion
3.1. Effect of Tempering Parameters on Hardness
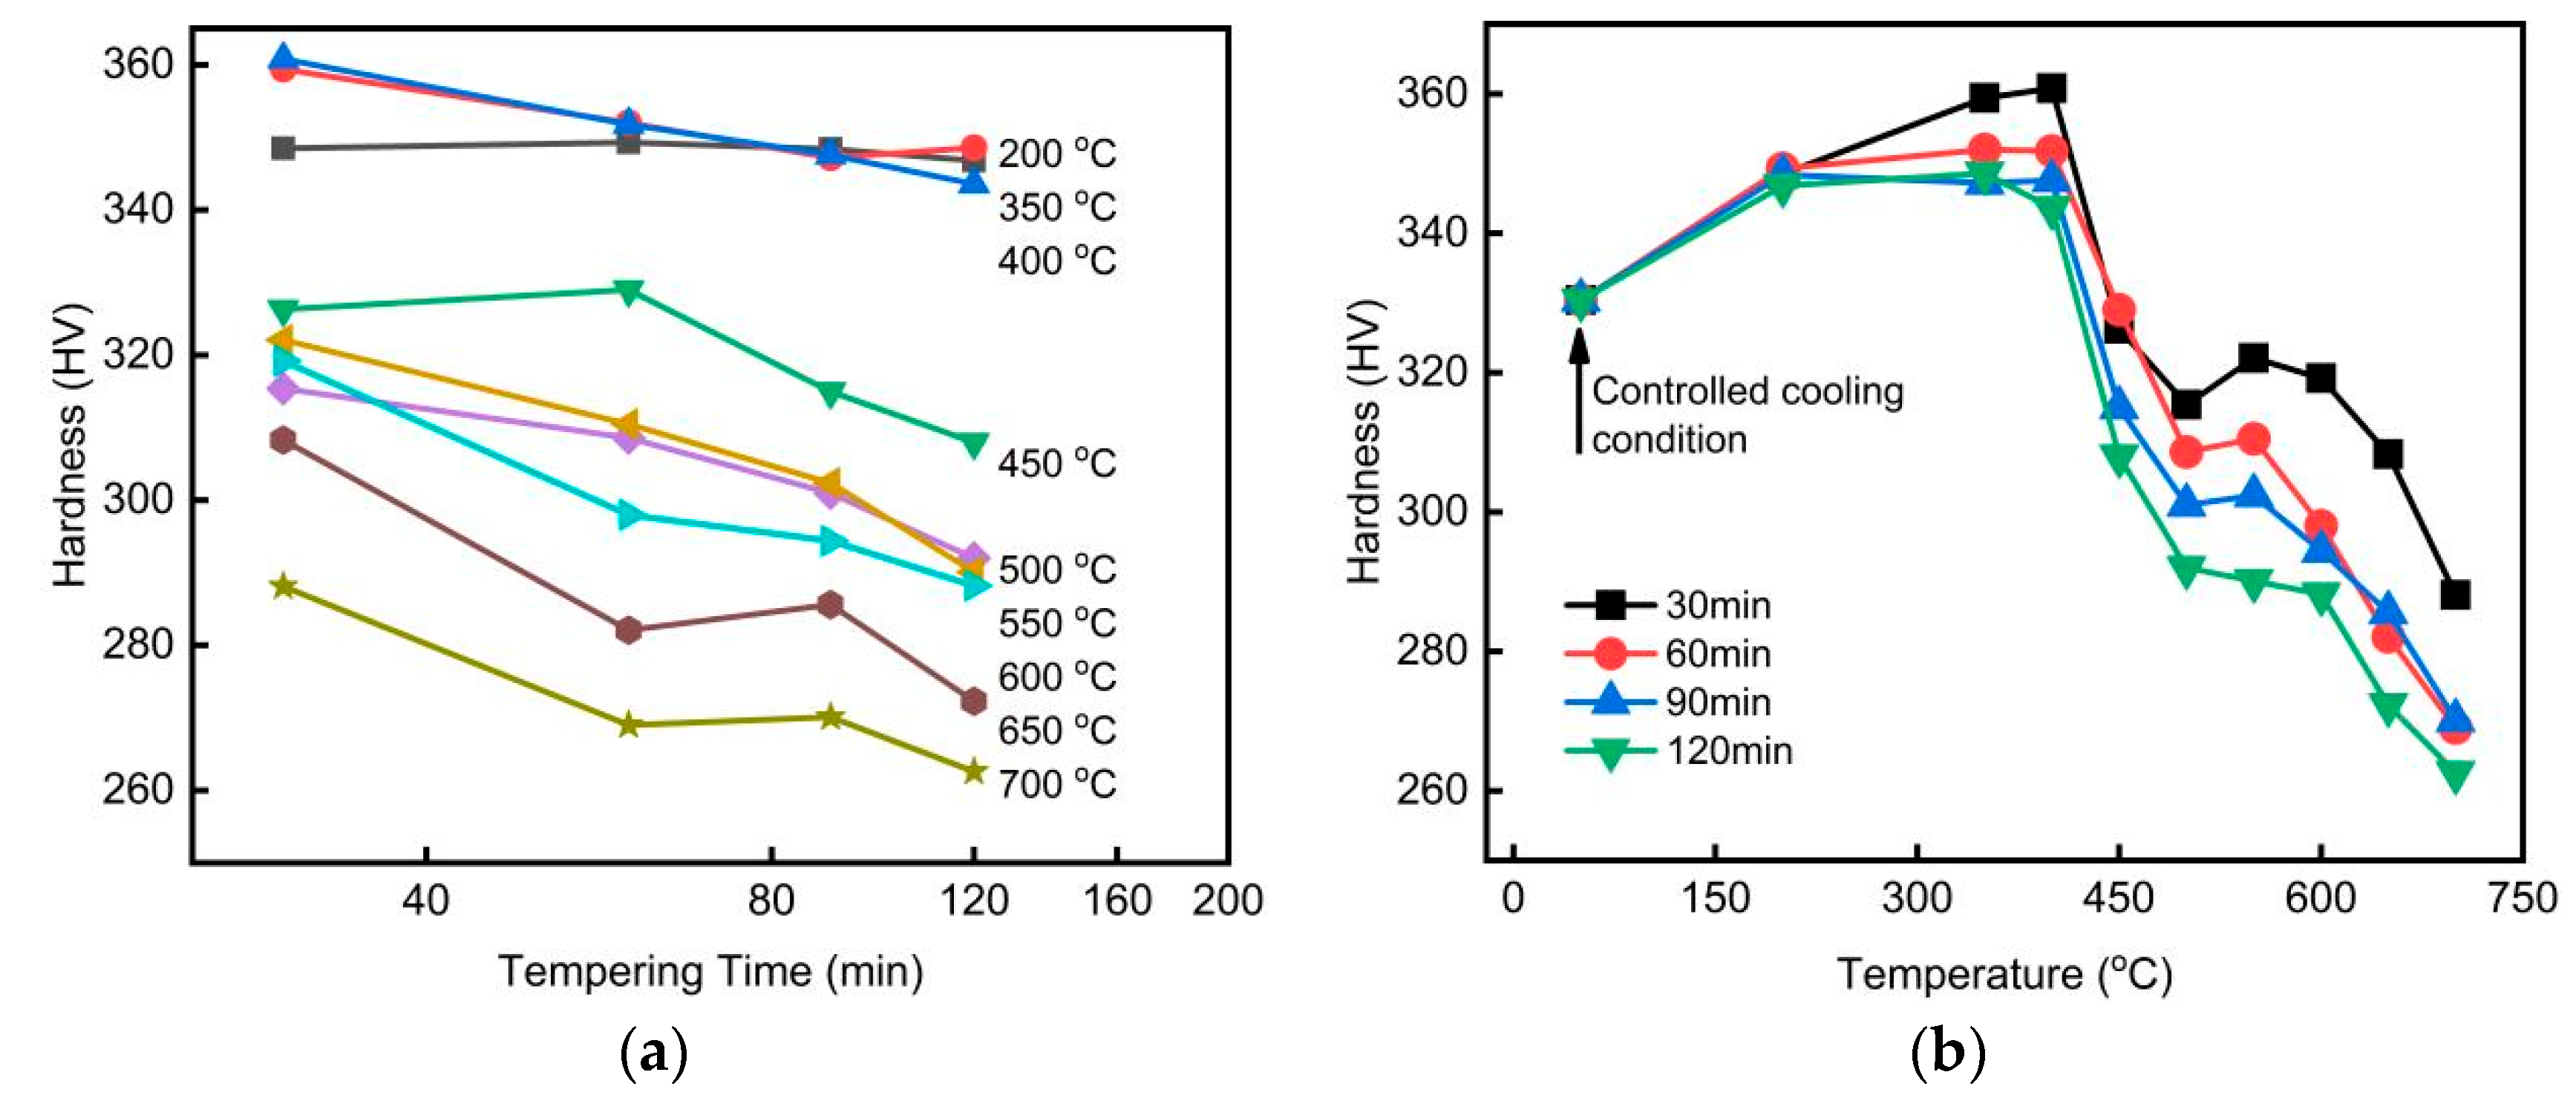
Hardness measurements were taken at no fewer than ten positions for each specimen after tempering at various temperatures and durations. The final hardness of each sample was determined by averaging the measurements, excluding any outliers. The effect of tempering temperature and time on the hardness of the steel is shown in
Figure 1.
Figure 1 shows an overall decreasing trend in the hardness of low-carbon bainitic steels with increasing tempering time, where hardness exhibits a roughly linear relationship with the logarithm of tempering time. Relatively more complex is the effect of tempering temperature on steel hardness. At lower tempering temperatures, hardness tends to increase slowly, reaching a maximum at 400°C. As tempering temperature rises further, hardness decreases. Slight secondary hardening occurs when the tempering temperature approaches 550°C. Beyond 550°C, hardness decreases rapidly. The complex hardness variations during tempering at different temperatures are closely related to changes in microstructure, as shown in
Figure 2.
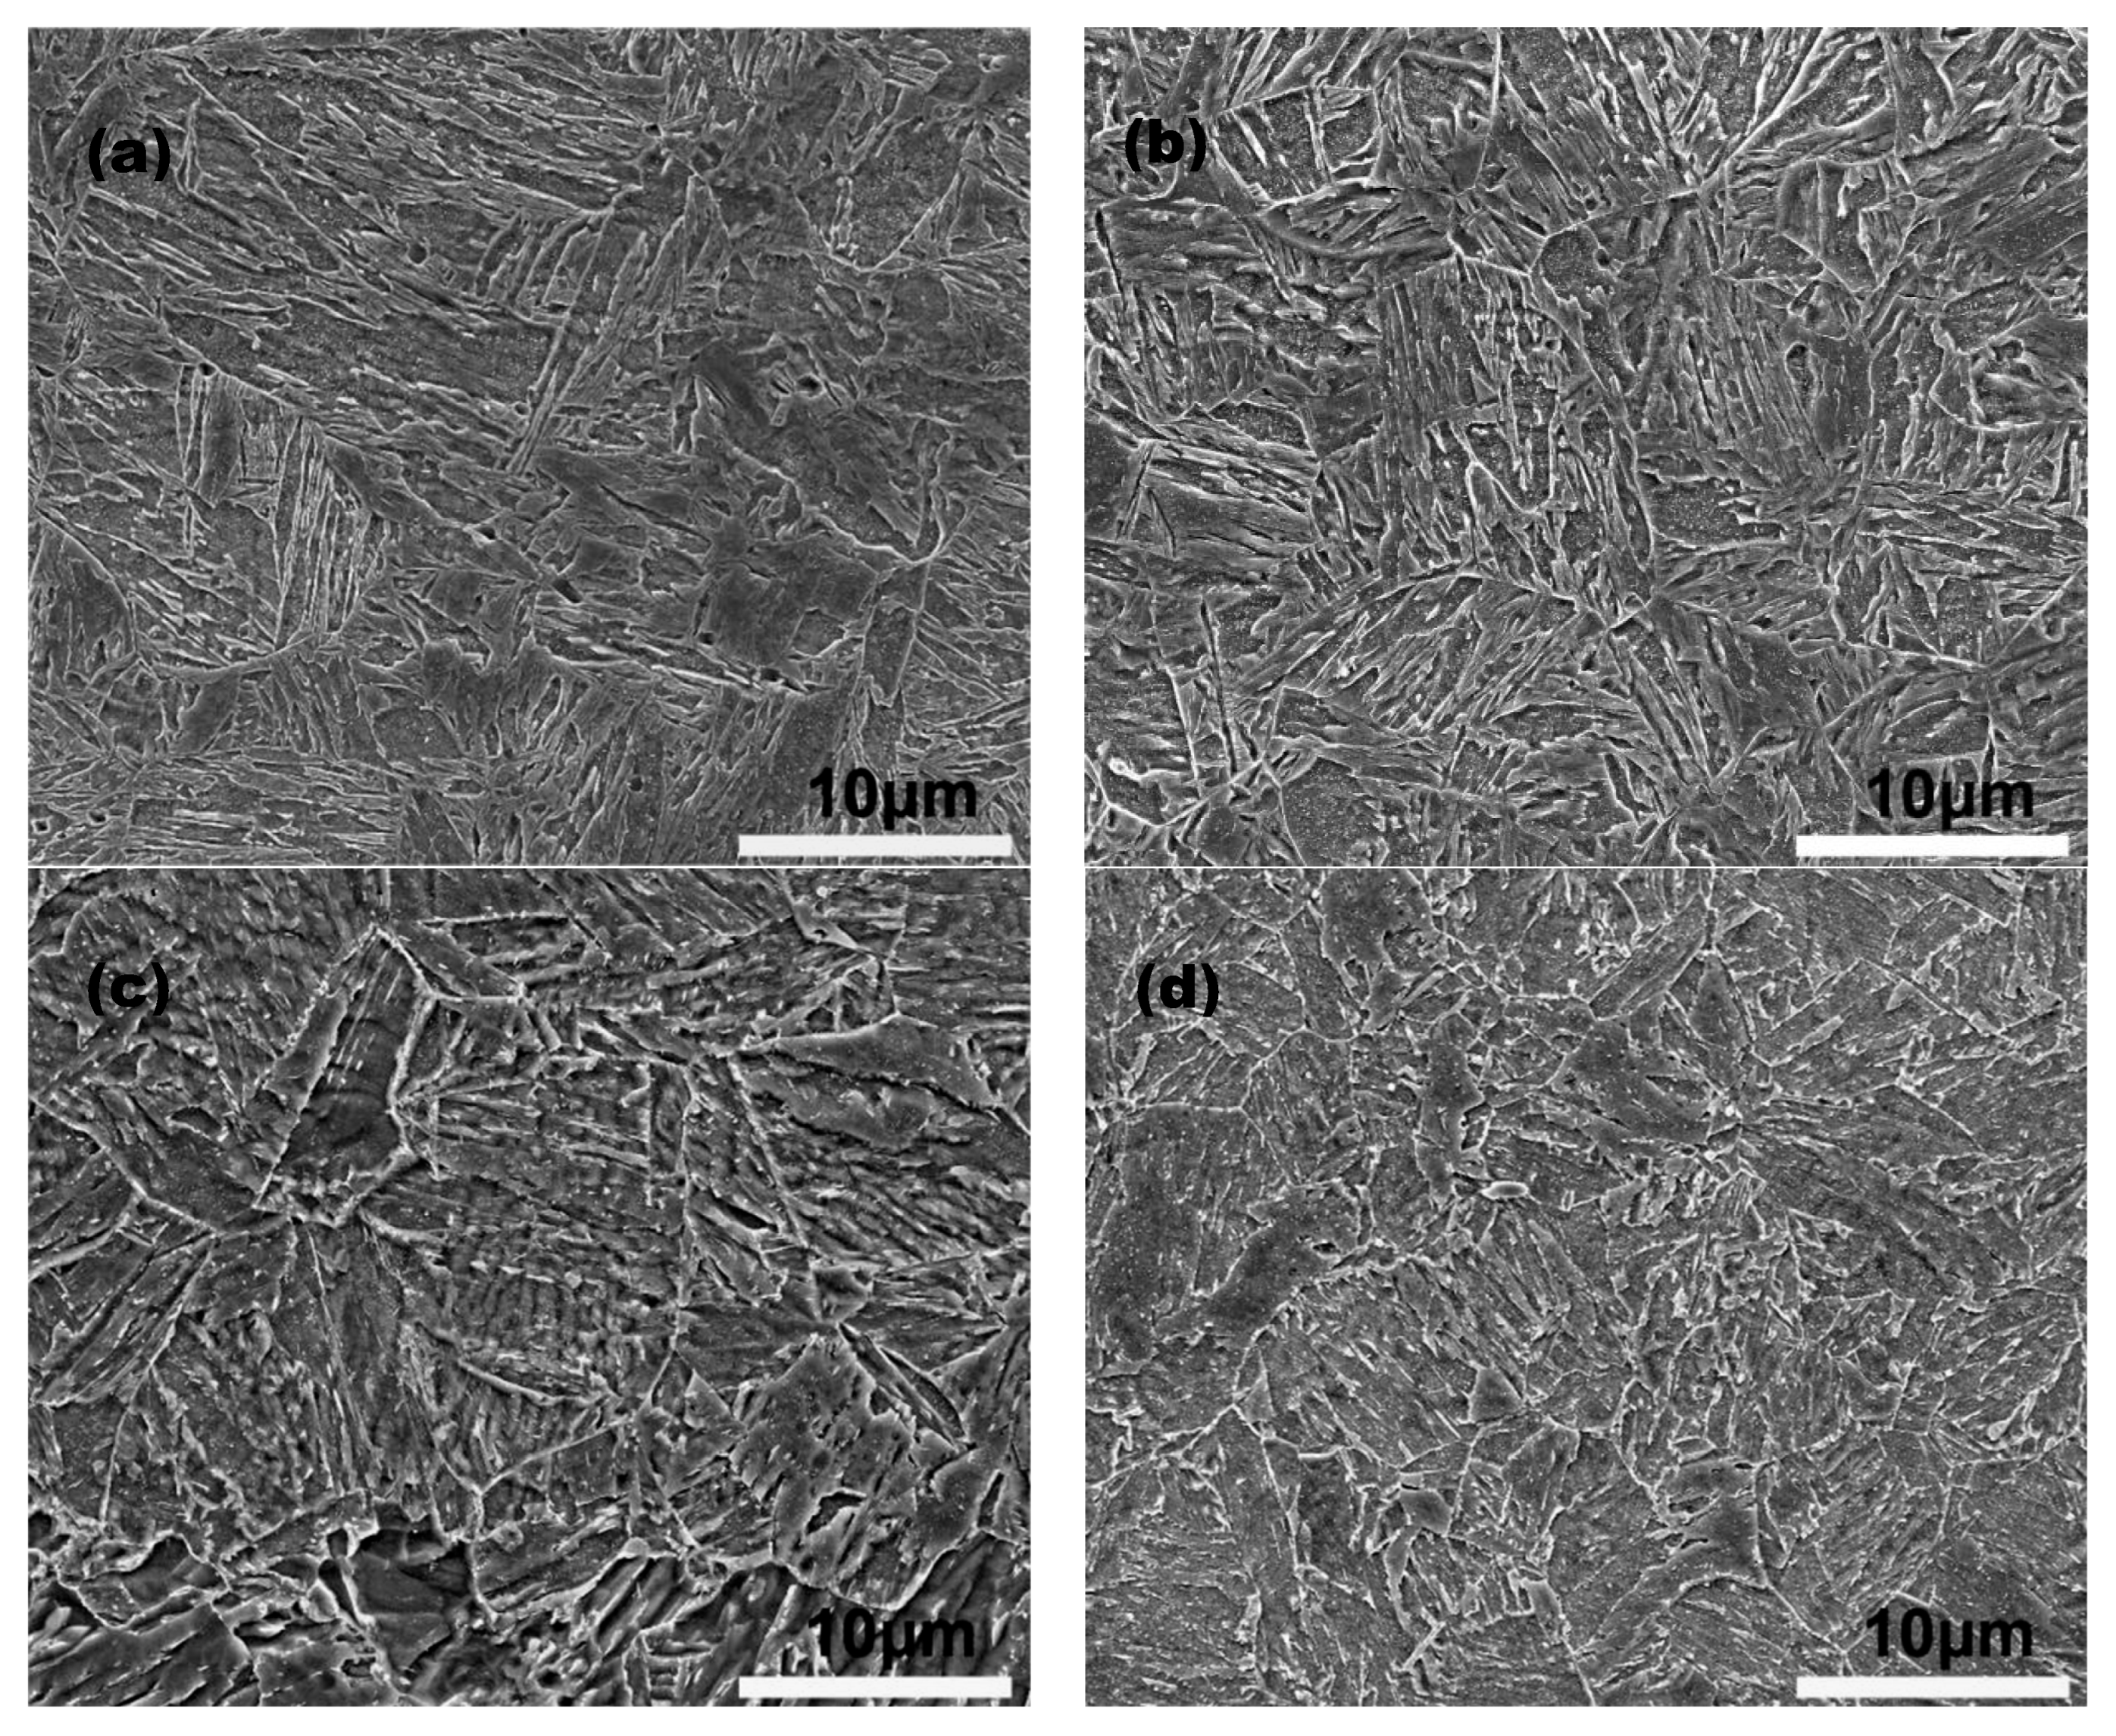
As depicted in
Figure 2a and b, there are no significant differences between the microstructures after low-temperature tempering and those under initial water-cooling conditions. However, during low-temperature tempering, the transformation and decomposition of residual austenite cause an initial increase in hardness [
27,
28]. As the temperature increases, hardness continues to increase due to further decomposition of residual austenite, alongside a concurrent decrease due to martensitic decomposition. The precipitation of NbC particles during the tempering process may explain the slight secondary hardening observed at 550°C [
29,
30]. When the temperature exceeds 550°C, a sharp decrease in hardness occurs due to the complete decomposition of martensite and the coarsening of carbides. The emergence of massive ferrite, indicated by the arrow in
Figure 2d, further contributes to the reduction in hardness.
3.2. Establishment of Tempering Model Based on λ and P Parameters
Tempering steel is a solid-state reaction process that involves the diffusive movement of atoms activated by heat. Inoue proposed a λ parameter to describe the degree of tempering progress [
25]. This parameter indicates the extent to which the tempering process has been influenced by time and temperature. It is derived as follows::
where:
A = pre-exponential factor
t = tempering time (h)
Q = activation energy during tempering process
R = ideal gas constant (1.99 cal/mol)
T = tempering temperature (K).
To represent lgC and utilise these assumptions, we derive a typical expression:
It is evident that the parameter λ has a direct impact on the properties after tempering. The mechanical properties, such as hardness, are dependent on the λ parameter, where:
To simplify calculations, it is assumed that:
Compare Equations (6) and (3):
The values for a, b, and c are determined using the least squares method by substituting various temperatures, times, and hardness values into Equation (5). The activation energy and tempering model for the steel in this study have been calculated as follows:
Holloman and Jaffe proposed a prediction model for steel after the tempering process [
21]. The equation commonly referred to as the Holloman-Jaffe equation is as follows:
where:
P = the tempering P parameter
t = tempering time (h)
T = tempering temperature (K)
K = a material dependent constant.
The constant K is solely related to the carbon content of the steel, that is:
For the low-carbon bainitic steel studied here, with a carbon content of 0.04%, K is calculated to be 21.2. The model for predicting hardness in the current tempering process was obtained through linear fitting based on the P parameter:
The model’s correlation coefficient is 0.85, indicating high accuracy.
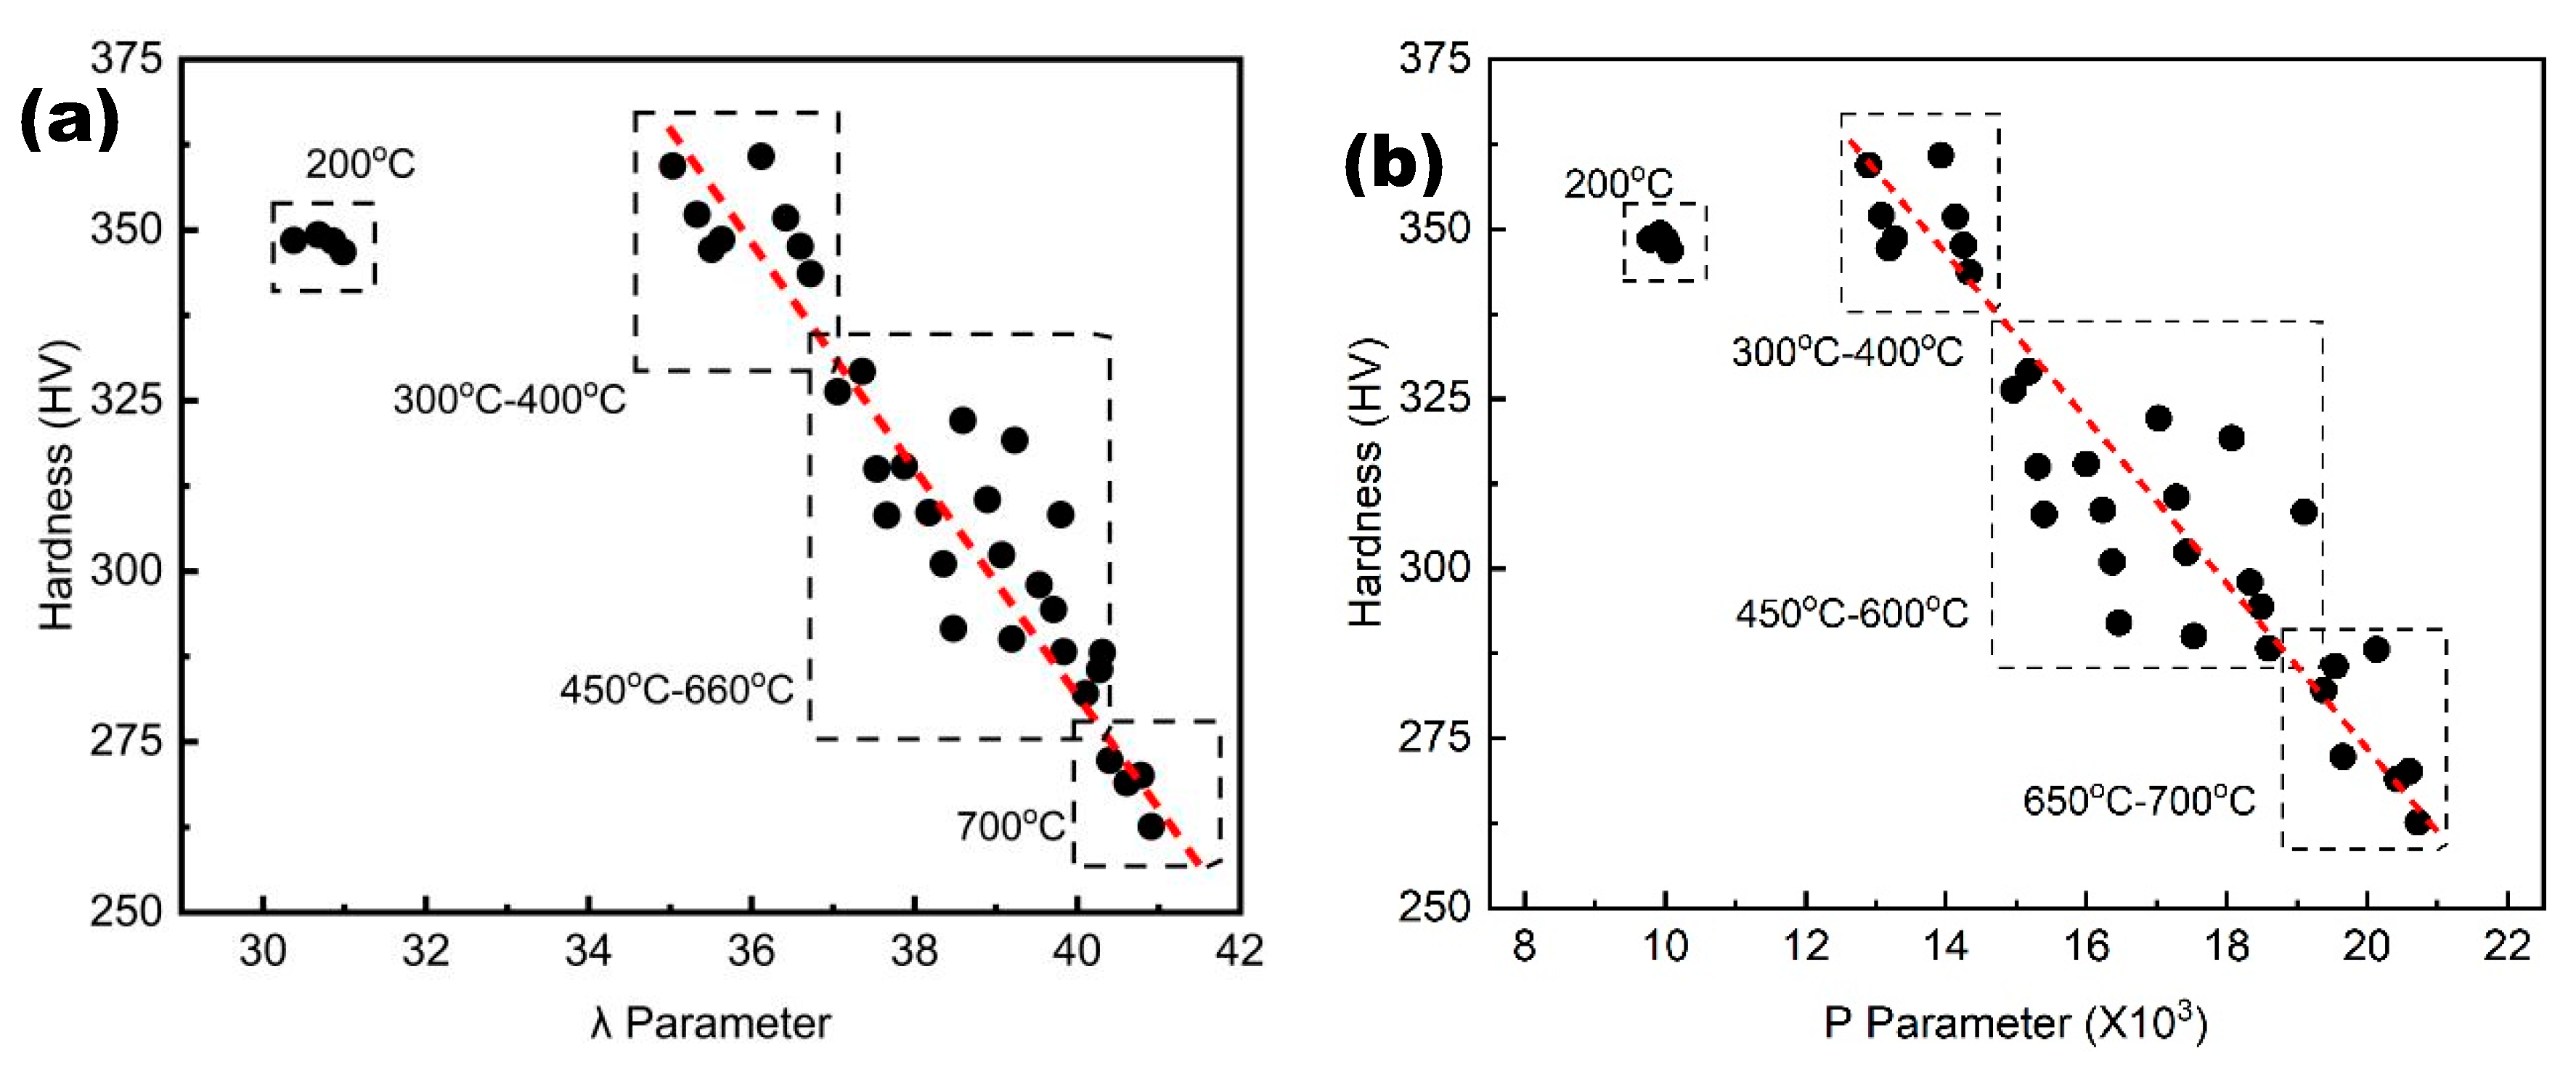
Figure 3 displays the relationship between hardness and tempering parameters. It is evident from
Figure 3 that the hardness after tempering is essentially linearly related to the tempering λ and P parameters, except in the low temperature range.
3.3. Error Analysis and Mechanical Prediction
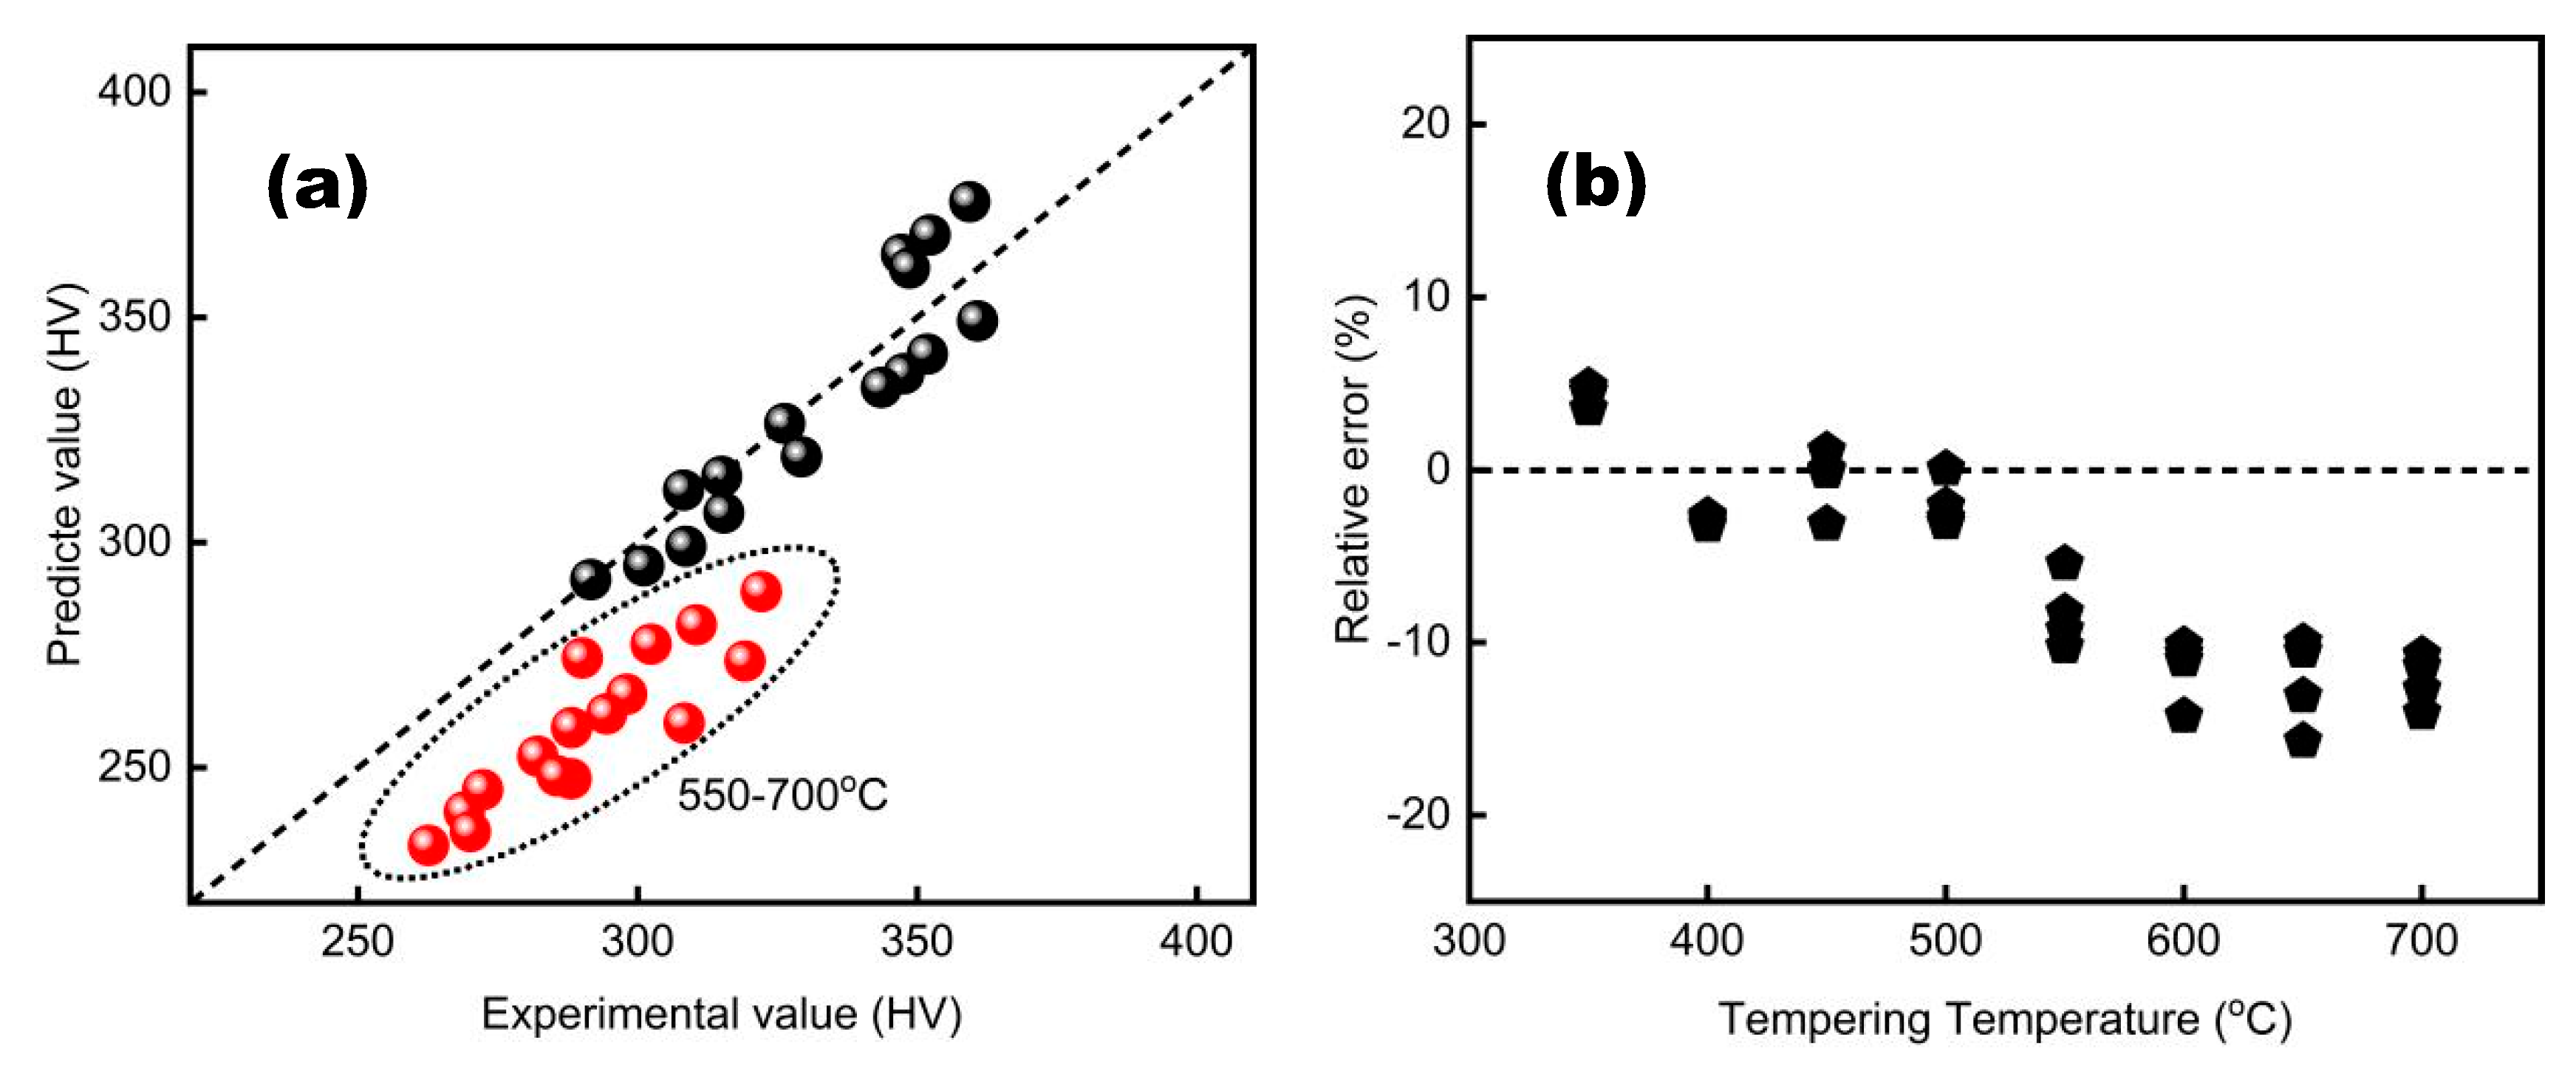
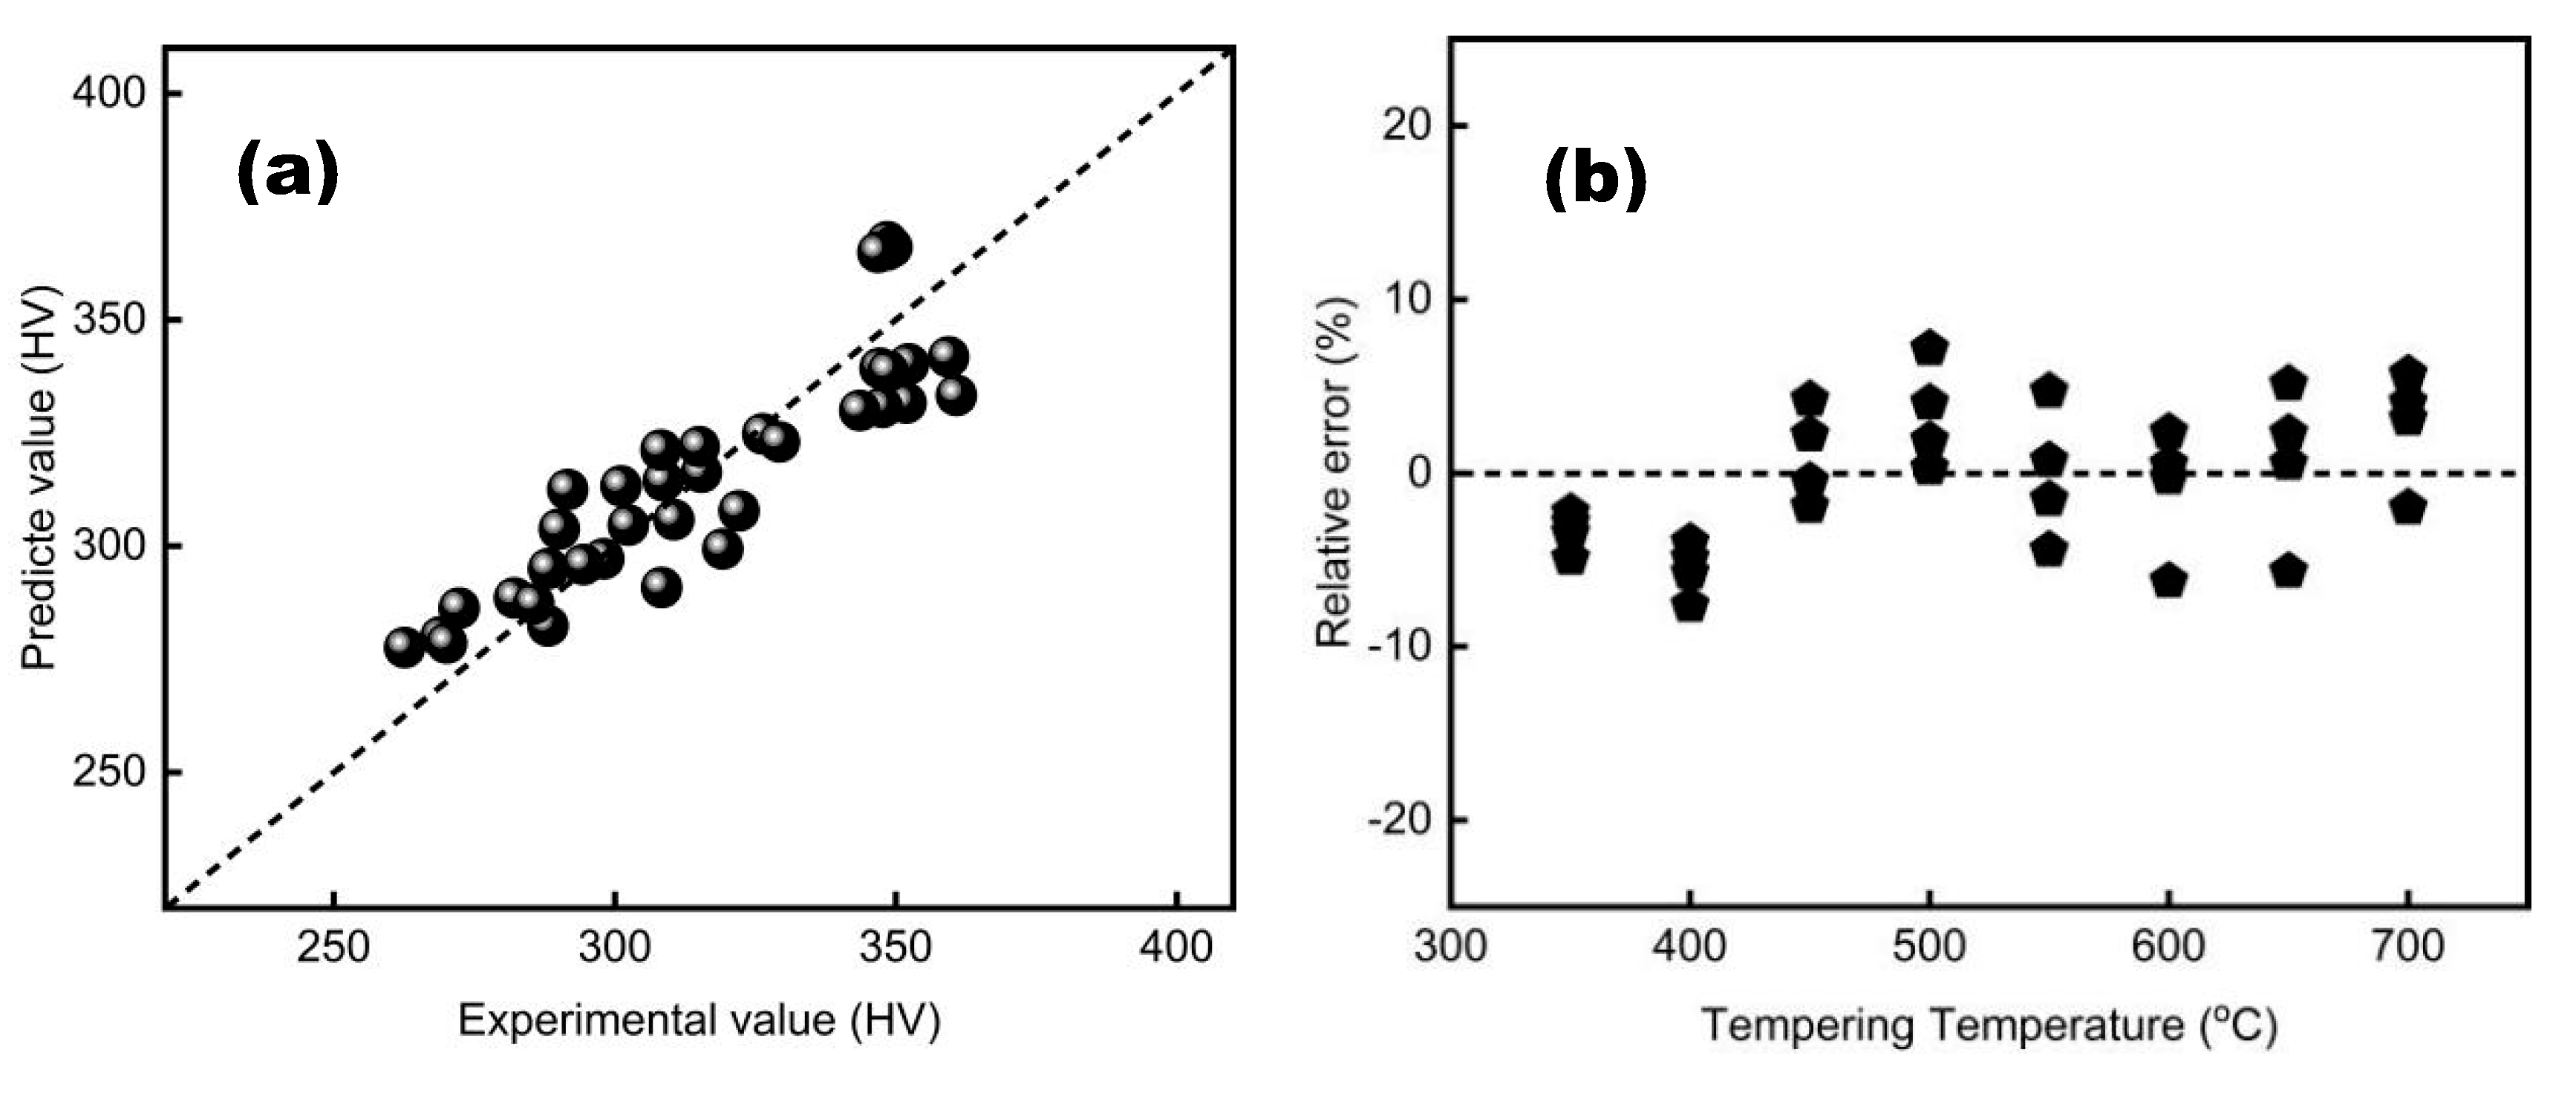
A comparison of the measured and calculated hardness values for different tempering processes is shown in
Figure 4 and
Figure 5.
As observed, the predicted hardness values and the measured values are essentially linearly distributed, both based on the P and λ parameters. For the λ parameter, the predicted value is generally smaller than the actual measured value when the temperature exceeds 550°C, as indicated by the circular markers in
Figure 4a. The error is less than 10% for the P parameter model and 15% for the λ parameter model. From the accuracy analysis, it is evident that both the developed prediction models can reliably predict the mechanical properties of tempering, such as hardness..
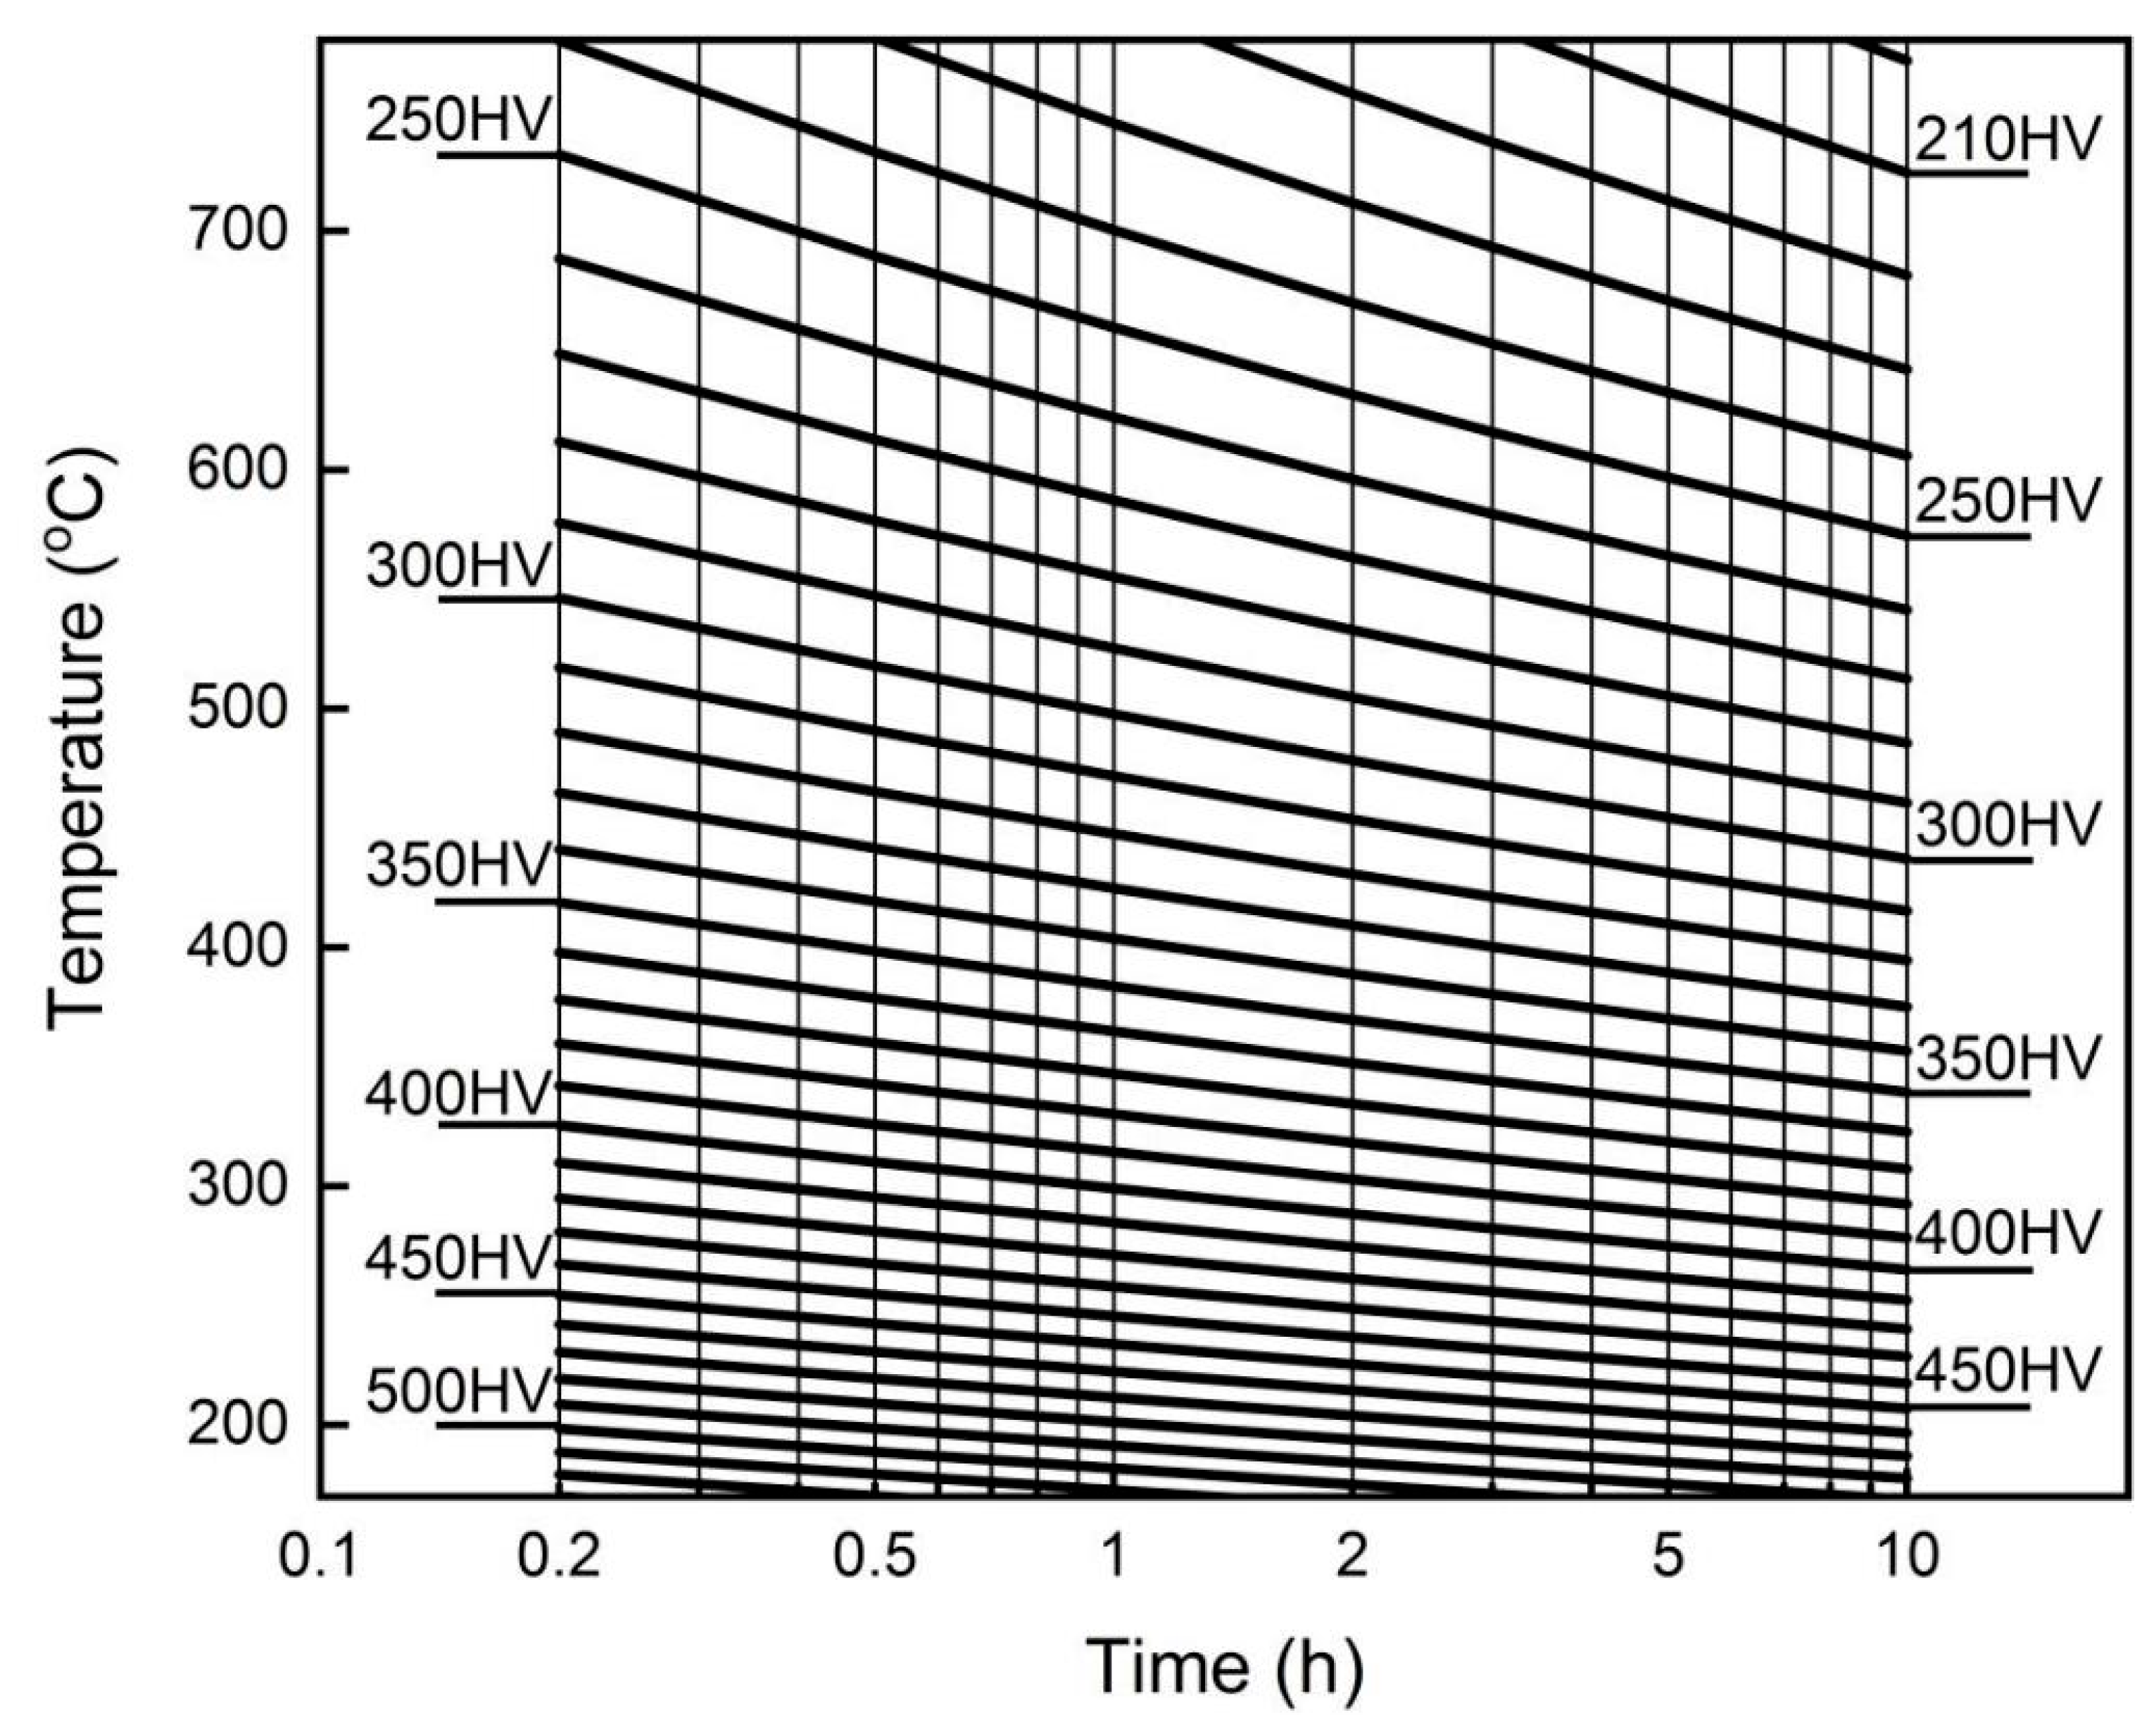
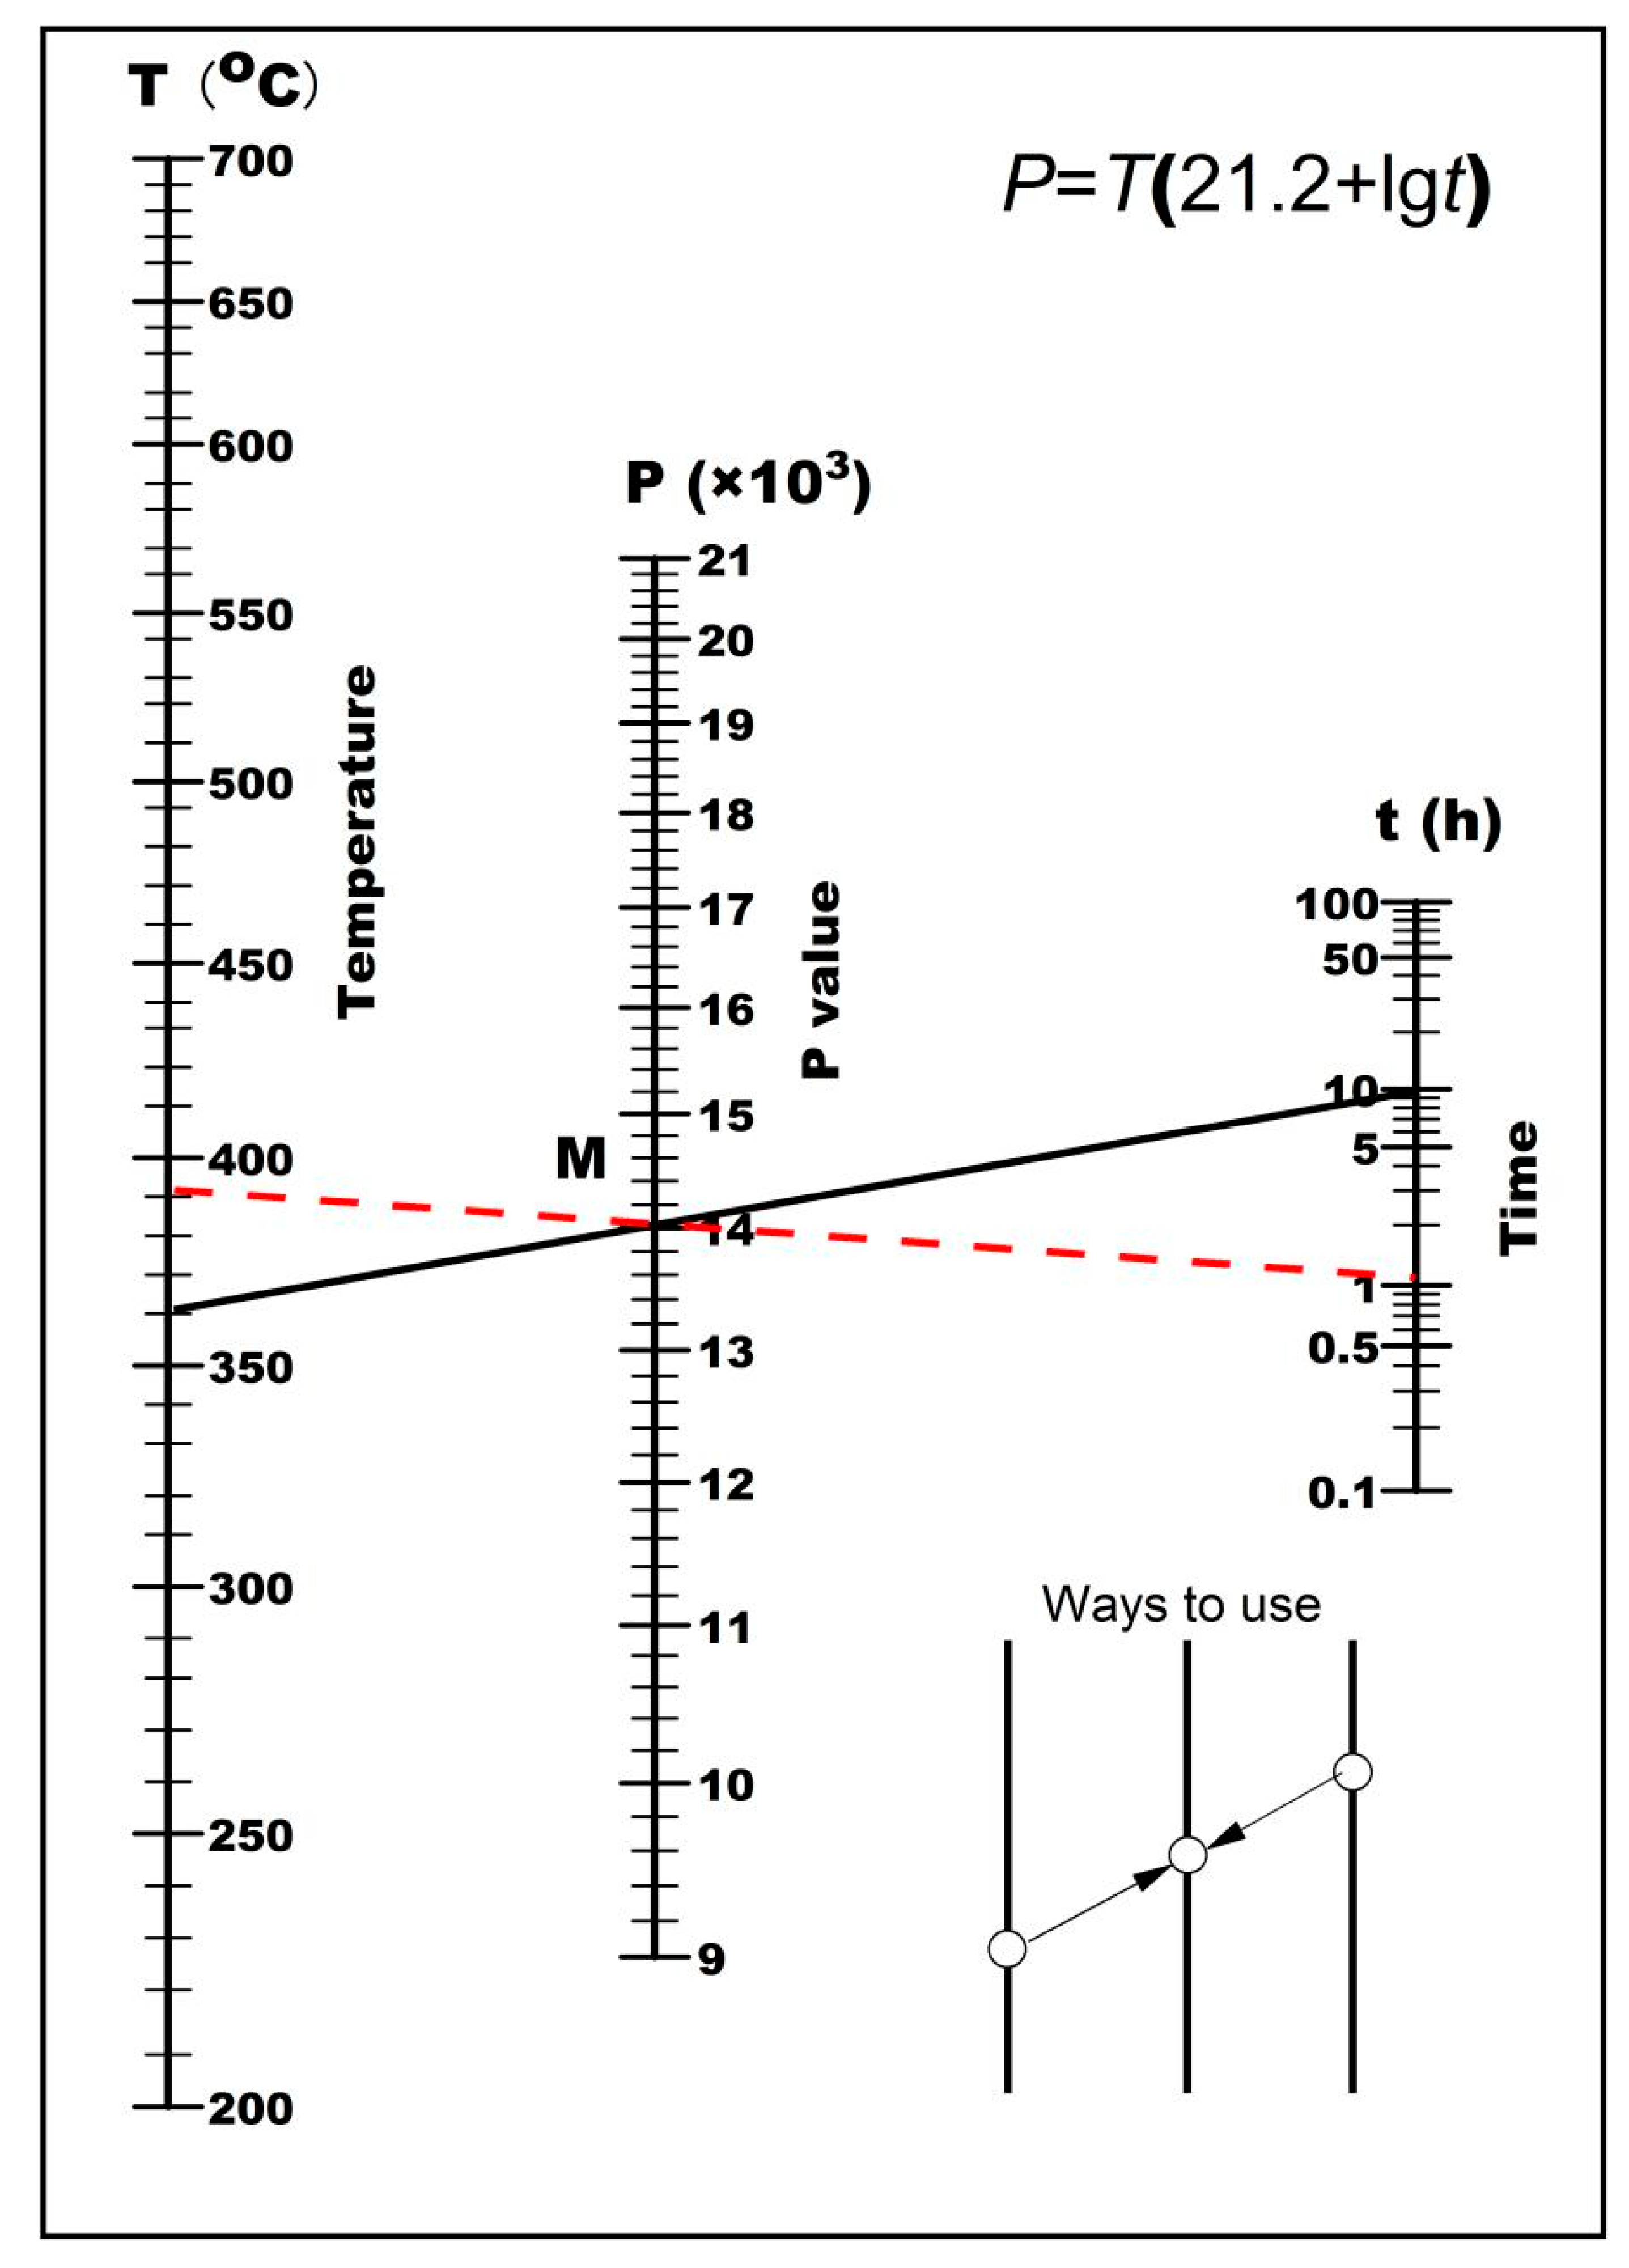
Based on the tempering model, equivalent tempering kinetic curves and nomographs were plotted as shown in
Figure 6 and
Figure 7. The hardness corresponding to different tempering temperatures and times can be directly read from
Figure 6.
To optimize the tempering process during heat treatment, consider the nomogram. For instance, if the tempering process is set at 360°C for 10 hours, as shown by the solid line in
Figure 7, the tempering process line intersects the P parameters at point M. To optimize the tempering process, a dashed line is drawn through point M. The intersection of this dashed line with time t and temperature T yields the optimized tempering parameters, which in this case would be tempering at 390°C for 1 hour. The same mechanical properties can be achieved using the optimized parameters because of the consistent P value. This model provides a convenient method for optimizing and adjusting the parameters of the tempering process.
4. Conclusions
This study investigated the effects of the tempering process on the mechanical properties of low-carbon bainitic steel, leading to the following conclusions:
(1) The tempering activation energy for low-carbon bainitic steels was calculated to be 41.63 cal/mol.
(2) Tempering prediction models for low-carbon bainitic steels were developed based on the P and λ parameters.
(3) The hardness equivalent kinetic curves and the nomograph of tempering process parameters were plotted, providing a convenient method for optimizing and adjusting the tempering process parameters.
Declaration of competing interest: The authors declare that they have no known competing financial interests or personal relationships that could have appeared to influence the work reported in this paper.
Acknowledgments
The authors acknowledge financial support from Kunlun Talent Project of Qinghai Province.
References
- Emi T .Steelmaking Technology for the Last 100 Years: Toward Highly Efficient Mass-Production Systems for High-Quality Steels[J]. Tetsu To Hagane-journal of The Iron and Steel Institute of Japan, 2014, 100:31-58.
- Tzevelekou T V ,Geck, Hans Günter,van Hüllen, Peter,et al. Direct smelting of metallurgical dusts and ore fines in a 125t DC-HEP furnace[J].Steel Research International, 2004, 75(6):382-391.
- Liu H Y , Li J , Ma C .Smelting Period Shortening Practices in Process of Electric Arc Furnace Steelmaking[J]. Advanced Materials Research, 2012, 572:243-248.
- KUHL T,SUN S,TRINH M.Equipment and Practice Enhancements at Dofasco’s Vacuum Degas Tank for ULC Steel [J]. Iron and Steel Technology,2004,1(4):21-27.
- Shi, X. X. , Zhang, Z. X., Li, Y., & Zhang, L. L. (2023). Bainitic high-phosphorus steel with an excellent combination of strength, toughness and corrosion resistance. Materials Letters, 339, Article 134088.
- De-Castro, D. , Granados, J. E., & Ramirez, A. (2022). Morphological and crystallographic features of granular and lath-like bainite in a low carbon microalloyed steel. Materials Characterization, 184, Article 111703.
- S.H. He, B.B. He, K.Y. Zhu, M.X. Huang. On the correlation among dislocation density, lath thickness and yield stress of bainite. Acta Materialia, Volume 135,2017,Pages 382-389. [CrossRef]
- F.G. Caballero, H. Roelofs, S. Hasler, et al. Influence of bainite morphology on impact toughness of continuously cooled cementite free bainitic steels[J]. Mater. Sci. Technol. 2012(28): 95-102.
- Xiangyun Zhang, Shiyun Liu, Kun Wang, Ling Yan, Jialong Wang, Qihang Xia, Hao Yu. Effect of vanadium microalloying on phase transformation and strengthening mechanism of 1000 MPa low carbon bainitic steel.Materials Science and Engineering: A,Volume 884,2023,145578. [CrossRef]
- Pancholi V, Krishnan M, Samajdar I S, et al. Self-accommodation in the bainitic microstructure of ultra-high-strength steel[J].Acta Materialia, 2008, 56(9):2037-2050.
- Im Y R, Oh Y J, Lee B J,et al. Effects of carbide precipitation on the strength and Charpy impact properties of low carbon Mn-Ni-Mo bainitic steels[J]. Journal of Nuclear Materials, 2001, 297(2):138-148.
- E. Tkachev, S. Borisov, Yu. Borisova, T. Kniaziuk, A. Belyakov, R. Kaibyshev. Austenite stabilization and precipitation of carbides during quenching and partitioning (Q&P) of low-alloyed Si–Mn steels with different carbon content. Materials Science and Engineering: A,Volume 895, 2024,146212. [CrossRef]
- Shin S Y, Han S Y, Hwang B,et al. Effects of Cu and B addition on microstructure and mechanical properties of high-strength bainitic steels[J]. Materials Science & Engineering A, 2009, 517(1-2):212-218.
- Canale Lauralice, Yao Xin, Gu Jianfeng,,et al. A historical overview of steel tempering parameters[J]. Int. J. Microstructure and Materials Properties, 2008(4–5): 474–525.
- Pashangeh S, Somani M, Banadkouki S S G.Structure-Property Correlations of a Medium C Steel Following Quenching and Isothermal Holding above and below the M-s Temperature[J]. ISIJ International, 2021, 61(1): 442-451.
- Rancel L, Gomez M, Medina S F,et al. Measurement of bainite packet size and its influence on cleavage fracture in a medium carbon bainitic steel[J]. Materials Science & Engineering A, 2011, 530:21-27.
- Adamczyk J, Grajcar A.Heat treatment of TRIP-aided bainitic steel[J]. International Journal of Microstructure & Materials Properties, 2007, 2(2):112-123.
- Yuang Dong, Xinqiang Lan, Siqi Yang, Jingxiang Lu, Siyu Yan, Kaiwen Wei, Zemin Wang. Effect of quenching and tempering treatments on microstructure and mechanical properties of 300M ultra-high strength steel fabricated by laser powder bed fusion. Materials Characterization,Volume 212,2024,113935. [CrossRef]
- , Zhang, C., Zhang, J., Liu, H., & Huang, Y. (2023). Achieving high strength-ductility synergy in nickel aluminum bronze alloy via a quenching-aging-tempering heat treatment. Materials Letters, 333, Article 2.
- Zhang J, Dai Z, Zeng L,et al. Revealing carbide precipitation effects and their mechanisms during quenching-partitioning-tempering of a high carbon steel: Experiments and Modeling[J]. Acta Materialia, 2021, 217.
- Yerbolat Koyanbayev. Applying the Hollomon-Jaffe parameter to predict changes in mechanical properties of irradiated austenitic chromium-nickel steels during isothermal exposure[J]. AIMS Materials Science, 2024, 11(2): 216-230.
- Virtanen E, Tyne C J V, Levy B S,et al. The tempering parameter for evaluating softening of hot and warm forging die steels[J].Journal of Materials Processing Technology, 2013, 213(8):1364–1369.
- Kang S, Lee S J.Prediction of Tempered Martensite Hardness Incorporating the Composition-Dependent Tempering Parameter in Low Alloy Steels[J]. Materials Transactions, 2014, 55(7):1069-1072.
- Revilla C, Lopez B, Rodriguez-Ibabe J M.Carbide size refinement by controlling the heating rate during induction tempering in a low alloy steel[J]. Materials and Design, 2014, 62(oct.):296–304.
- Gomes C , Kaiser A L , Bas J P ,et al. Predicting the mechanical properties of a quenched and tempered steel thanks to a “tempering parameter”[J]. Metallurgical Research & Technology, 2010, 107: 293-302.
- Gomes C, Kaiser A L, Bas J P,et al. Predicting the mechanical properties of a quenched and tempered steel thanks to a “tempering parameter”[J]. Metallurgical Research & Technology, 2010.
- Goulas C, Kumar A, Mecozzi M G,et al. Atomic-scale investigations of isothermally formed bainite microstructures in 51CrV4 spring steel[J]. Materials Characterization, 2019, 152:67-75.
- Jun H J, Park S H, Choi S D,et al. Decomposition of retained austenite during coiling process of hot rolled TRIP-aided steels[J]. Materials Science and Engineering A, 2004, 379(1-2):204-209.
- H. Dong, Y. Zhang, G. Miyamoto, et al. Unraveling the effects of Nb interface segregation on ferrite transformation kinetics in low carbon steels[J]. Acta Mater. 215 (2021), 117081.
- J. Takahashi, K. Kawakami, J.I. Hamada, et al. Direct observation of niobium segregation to dislocations in steel[J]. Acta Mater. 107 (2016) 415–422.
|
Disclaimer/Publisher’s Note: The statements, opinions and data contained in all publications are solely those of the individual author(s) and contributor(s) and not of MDPI and/or the editor(s). MDPI and/or the editor(s) disclaim responsibility for any injury to people or property resulting from any ideas, methods, instructions or products referred to in the content. |
© 2024 by the authors. Licensee MDPI, Basel, Switzerland. This article is an open access article distributed under the terms and conditions of the Creative Commons Attribution (CC BY) license (http://creativecommons.org/licenses/by/4.0/).
