1. Introduction
The emission of greenhouse gases attributed directly or indirectly to human activity is causing global climate change. These greenhouse gases are mainly composed of four gases: carbon dioxide (CO2), nitrous oxide (N2O), methane (CH4), and ozone (O3) [
1]. One of the emissions that contributes most to climate change is (CO2) according to [
2] energy-related (CO2) emissions (mainly produced by hydropower and natural gas) will rise by about 20% by 2035. This emission generates spatiotemporal variations of state variables such as humidity, pressure, and temperature, changes that directly affect the energy balance of the atmosphere, which defines the occurrence of rainfall or clear skies, which as expressed by [
3] is expected to increase the greenhouse effect as the concentration of (CO2) in the atmosphere increases.
In Colombia, the IDEAM (Institute of Hydrology, Meteorology and Environmental Studies) knows climate change, indicating that throughout the 21st century, precipitation will increase towards the center and north of the Pacific region and decrease between 15% and 36% in the Caribbean and Andean regions. This prolonged increase in precipitation is reflected this year with permanent precipitation events and, according to [
4], will persist until late 2022 and early 2023. This would mark the first "triple episode" La Niña of this century, spanning three consecutive northern hemisphere winters, corresponding to summer in the southern hemisphere. This project aims to implement a methodology to develop predictive models of total monthly precipitation using new cutting-edge technologies such as deep learning for water supply consumption in the department of Boyacá.
With the rise of artificial intelligence, the importance of massive data for science, and in particular geography, stands out. Remote sensing plays an important role, allowing the acquisition of images of the earth's surface from aerial or space sensors [
5,
6], which complements the acquisition of information from different sensors or meteorological devices necessary to know the spatiotemporal behavior of precipitation, such as surface weather stations, altitude stations, hundreds of weather radars in addition to some 200 research satellites among others [
7], from the above, one can gain an idea of the magnitude of the global network of meteorological and hydrological observations. This abundance of information facilitates analysis, modelling, and prediction of this phenomenon by utilizing various emerging technologies focused on artificial intelligence, such as machine learning (ML) and deep learning (DL).
The effects of climate change have led to an increase in global precipitation, a phenomenon known as La Niña. This is particularly evident in Colombia, affecting the Andean, Pacific, and Caribbean regions.
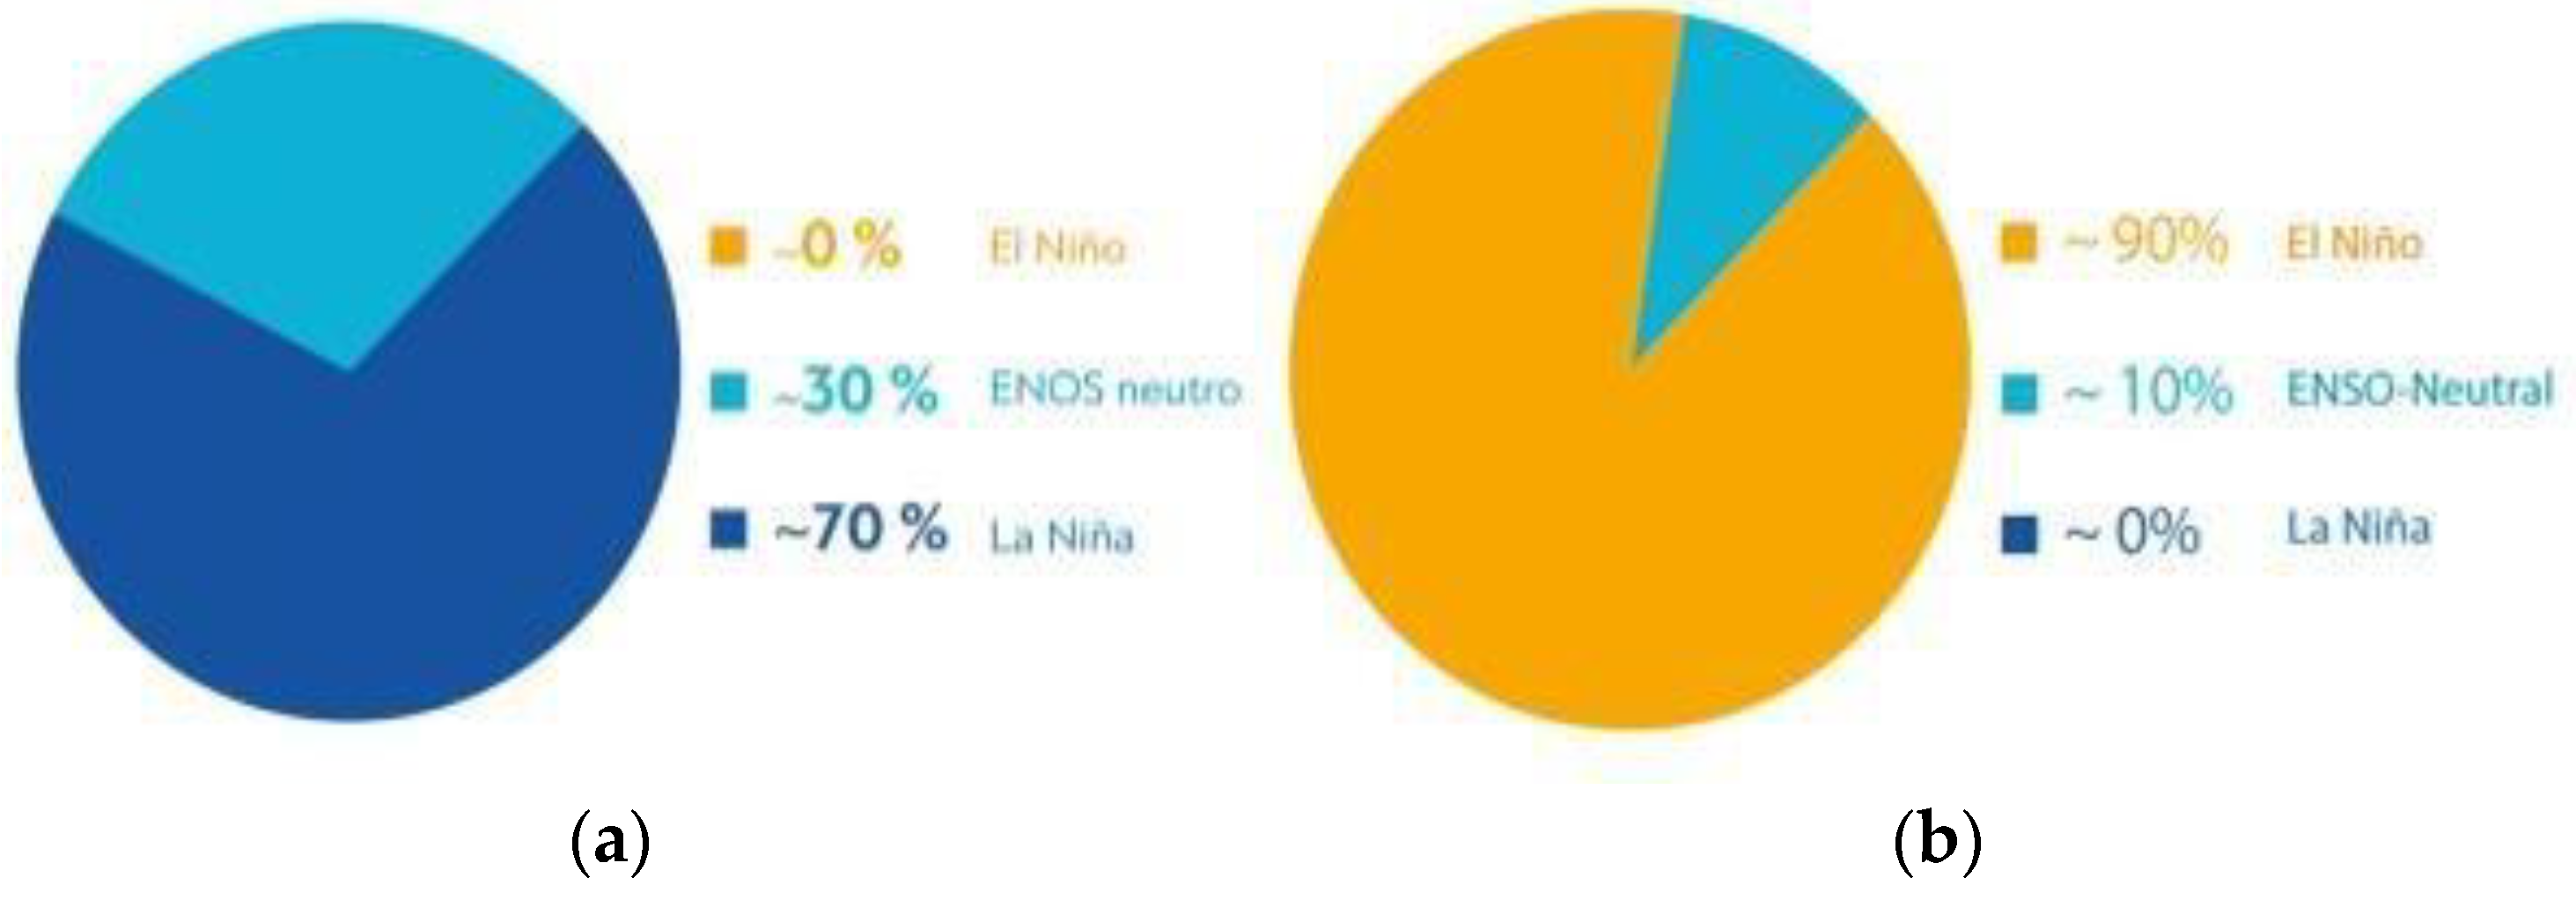
Figure 1(a) illustrates the recent occurrence of the third triple episode of La Niña (ENSO), which had a 70% probability of persisting until the end of March 2023. Forecasts indicated a 60% probability of an El Niño event from May through July 2023, with a 90% probability of continuing through October 2023, as shown in
Figure 1(b). This leaves a 10% probability of an ENSO Neutral period and virtually no chance of another La Niña event by the end of October 2023.
Statistical and numerical applications are often not as effective in predicting precipitation accurately and timely, and although weather stations offer short-term predictions, forecasting long-term precipitation remains challenging [
9,
10]. Therefore, advancements are being made by integrating them with emerging technologies like artificial intelligence. For instance, [
11] implemented machine learning and observed that the forecast was able to achieve a better precipitation prediction compared to a deviation between 46% and 91% experienced in June 2019 in India. This progress involves leveraging historical data and employing time series models to implement various machine learning (ML) and deep learning (DL) models, such as the OP-ELM algorithm, which demonstrated successful monthly rainfall predictions in China [
12].
There are several versions of ML, as demonstrated by [
13] in their study predicting the normalized precipitation index using monthly data from 1949 to 2013 at four meteorological stations. Techniques include M5tree, extreme learning machine (ELM), and online sequential ELM (OSELM). The ELM model made the best predictions for (months 3, 6, and 12) with the lowest root mean square error (RMSE) value, except for the predicted values for month 1, where the M5tree model obtained the best result.
DL is an emerging technique for dealing with complex systems such as the prediction of meteorological variables. Therefore, [
14] proposes a hybrid DL approach, using a combination of one-dimensional convolutional neural network (Conv1D) and multilayer perceptron (MLP) (hereafter Conv1D-MLP) to predict precipitation applied to twelve different locations. This result is better and was compared with a support vector regression (SVM) machine learning approach. However, models with immediate rainfall prediction over large areas cannot yet be generated, so [
15] proposes a dual-input, dual-encoder recurrent neural network (RNN) to predict rainfall threat within the next two hours in China, obtaining an accuracy of 52.3% within 30 min, 50.3% within 1 hour and 50% for 2 hours. Similarly, using 92 meteorological stations in China, [
16] combines the surface altitude of the stations with the precipitation prediction, grouping by the k-means method as implemented by [
17]; the stations surrounding the target, and employing a convolutional neural network (CNN) thus obtaining better results in existing threat index and mean squared error (MSE).
In Simtokha region, Bhutan [
18] using rainfall data studied the predictive ability of a model based on bidirectional long-term memory with controlled recurrent unit (BLSTM-GRU). This model was compared with other existing models such as the linear regression method, MLP, CNN, long-term memory (LSTM), and controlled recurrent unit (GRU). The proposed model was the best among the other 5 models, outperforming the LSTM model by 41.1% with a score of 0.0128 mean squared error (MSE) value. Similarly, including georeferencing of weather stations, [
19] uses sequences of weather radar measurements of hourly precipitation levels with RNN and LSTM models. This ensures that the training set is more or less independent in reducing the value of MSE and RMSE in the predictions.
When working with time series data, ensembles are trained to respect the ascending order of the data in time to generate the training and validation data partition. However, proposing a STConvS2S (Spatiotemporal Convolutional Sequence to Sequence Network) model DL architecture, [
20] for training the model, does not respect the temporal order of the historical data and leaving the data sequence identical to the output sequence results in 23% better prediction to future sequences and 5 times faster training than the RNN-based model used as an evaluation benchmark. However, it is complicated to find the best method of modelling the precipitation variable and the different parameters surrounding it. For this reason, [
9] evaluated a model in Australia based on ML optimized with DL to predict daily rainfall, and used GridSearchCV to find the best parameters for the different models over a daily span of 10 years from 2007 to 2017 from 26 geographically diverse rain gauge locations.
With the rise of ML and DL systems, remote sensing plays an important role since, according to [
21], it allows the acquisition of terrestrial information from sensors installed on space platforms and the use of satellite images to perform multi-temporal analyses, understood as spatiotemporal changes [
22,
23]. In 2020, using a CNN model with different architectures such as (GoogLeNet, AlexNet, and LeNet, among others) [
24] on 2D images as input precipitation data with three different heights: 100, 3000, and 5500 meters above sea level. The output variable is an image that indicates to which class it belongs, converting the model to a binary class defined by a rainfall probability threshold between 0 and 100%. The main result is that CNNs can predict precipitation with lower computational capacity than traditional methods [
25]. Two data sources are used for training and testing the CNN model. The first was from CEH, and the second was GEAR (Centre for Ecology and Hydrology Gridded Estimate of Areal Rainfall), providing monthly rainfall across Britain between 1890 and 2017. The results obtained from video-based rainfall prediction using different CNN architectures can provide valuable post-processing to traditional numerical weather prediction models.
The main concern for researchers studying precipitation in different geographical areas and climates worldwide has been the selection of suitable ML or DL methods. Hence, [26 - 29] also presents various approaches to predict precipitation.
Table 1 evaluates techniques such as the Lagrangian convolutional neural network (L-CNN), ELM model, LSTM model, Multilayer perceptron model (MLP), CNN model, and others.
Formulation of the research question
What computational elements are necessary to implement a predictive model supported by deep learning that facilitates the spatiotemporal analysis of the monthly total precipitation in the Department of Boyacá?
3. Results
In surveying and geography, spatial analysis is a widely used technique for collecting information from specific sampling points. Climate Hazards Group InfraRed Precipitation with Station data (CHIRPS), which integrates infrared precipitation data with station data, was used for this project. This dataset was developed by the Climate Hazards Group at the University of California, Santa Barbara [
38].
The CHIRPS dataset provides more than 35 years of comprehensive and accurate precipitation information worldwide. For this study, infrared precipitation data were extracted from January 1981 to August 2023 for Boyacá Department. The data were acquired at a resolution of 0.05°, with each degree corresponding to 111.1 km, resulting in a data acquisition resolution of approximately 5.5 km.
Using tools such as Python [
39], Google Collaboratory [
40], TensorFlow [
41], Keras [
42], Matplotlib [
43], among others, the project was developed as follows:
3.1. Data Set Acquisition
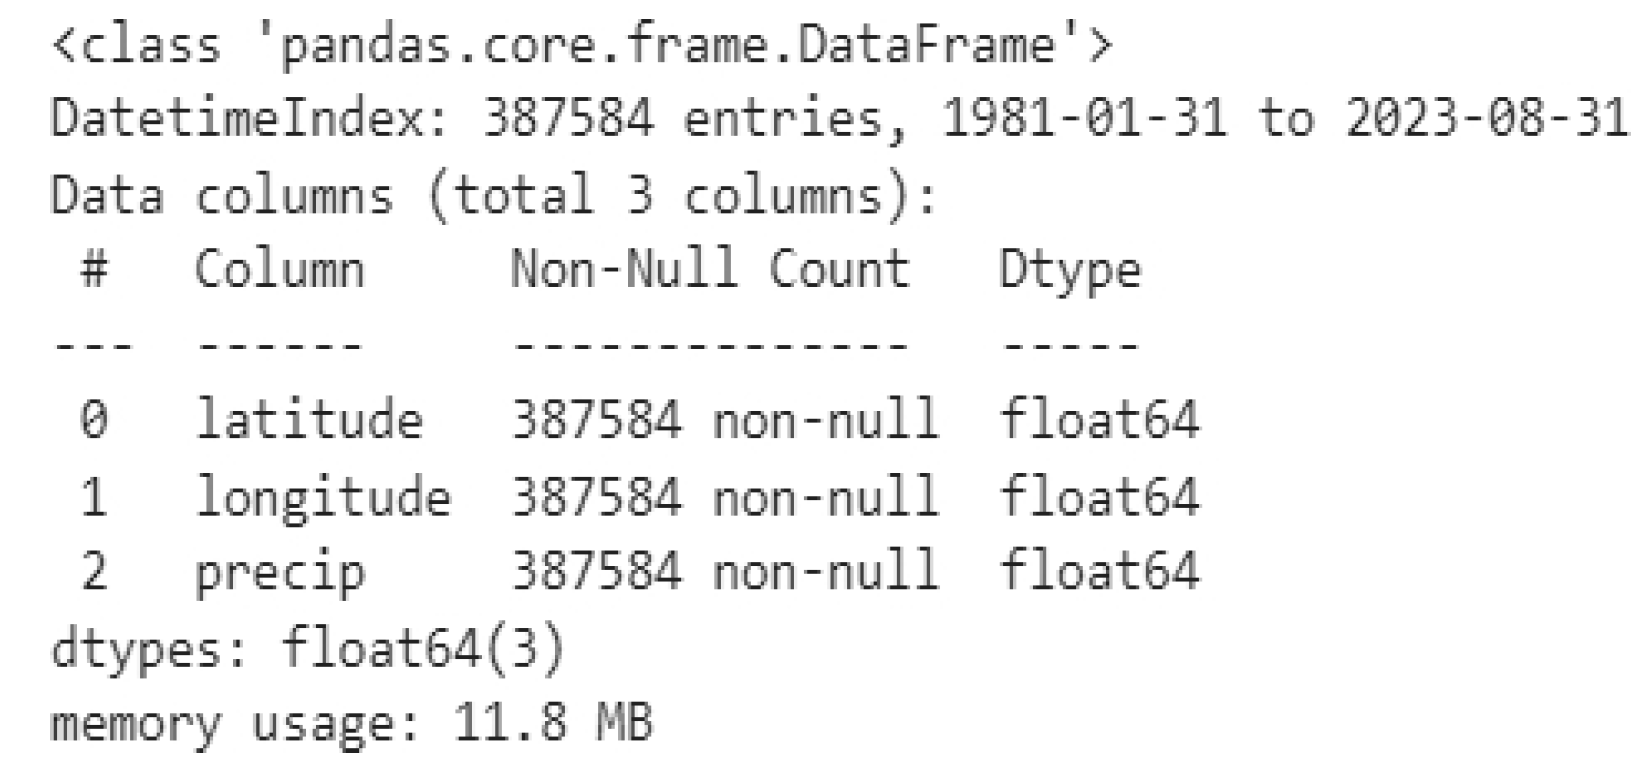
The downloaded dataset was processed in the netcdf (.nc) format, containing monthly precipitation records worldwide, spanning 43 years and 8 months, with 3 variables: longitude, latitude, and precipitation in (mm), along with a time variable indicating the date of measurement in datetime [ns] format. This format enables manipulation of the dates and times at which the data was collected, as illustrated in
Figure 6. It provides the dataset with the spatiotemporal focus required for predicting precipitation, comprising a total of 387,584 observations.
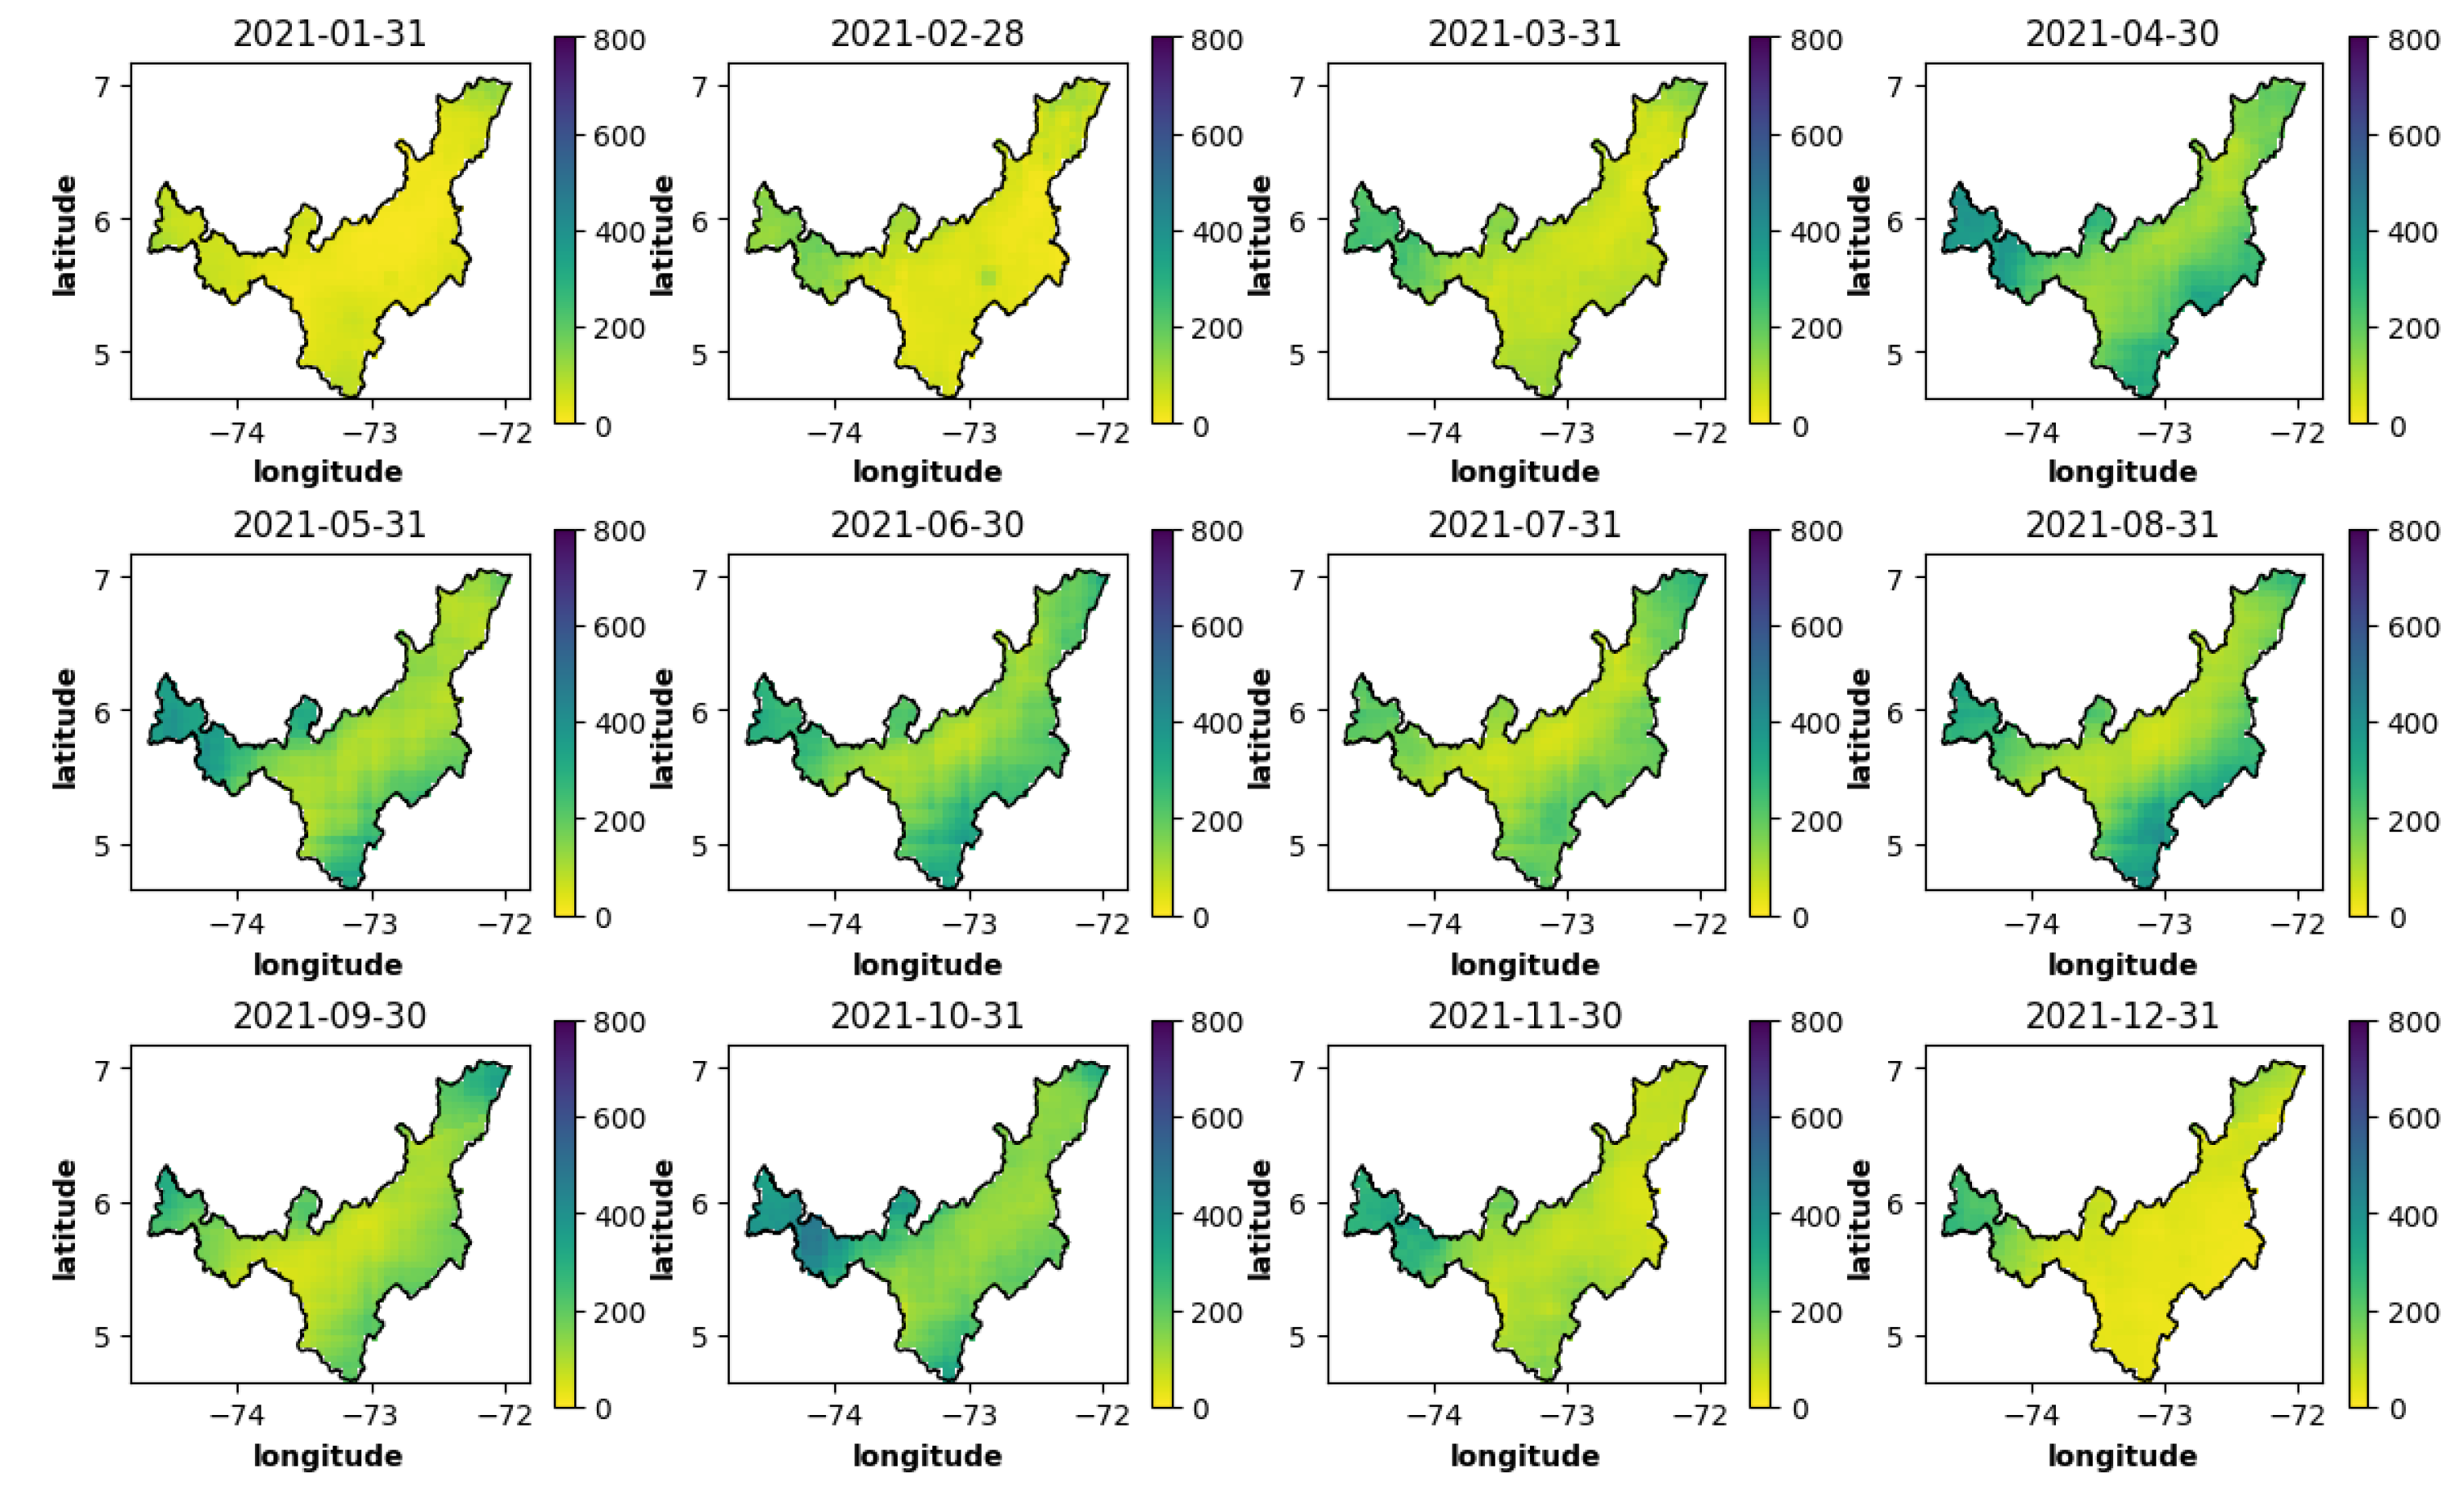
The coordinates were utilized to filter the CHIRPS precipitation data for Boyacá, Colombia, using the department's polygon. Subsequently, the dataset was organized to visualize the spatiotemporal dimension for climate analysis through time, as depicted in
Figure 7, illustrating the spatiotemporal precipitation of Boyacá in the year 2022.
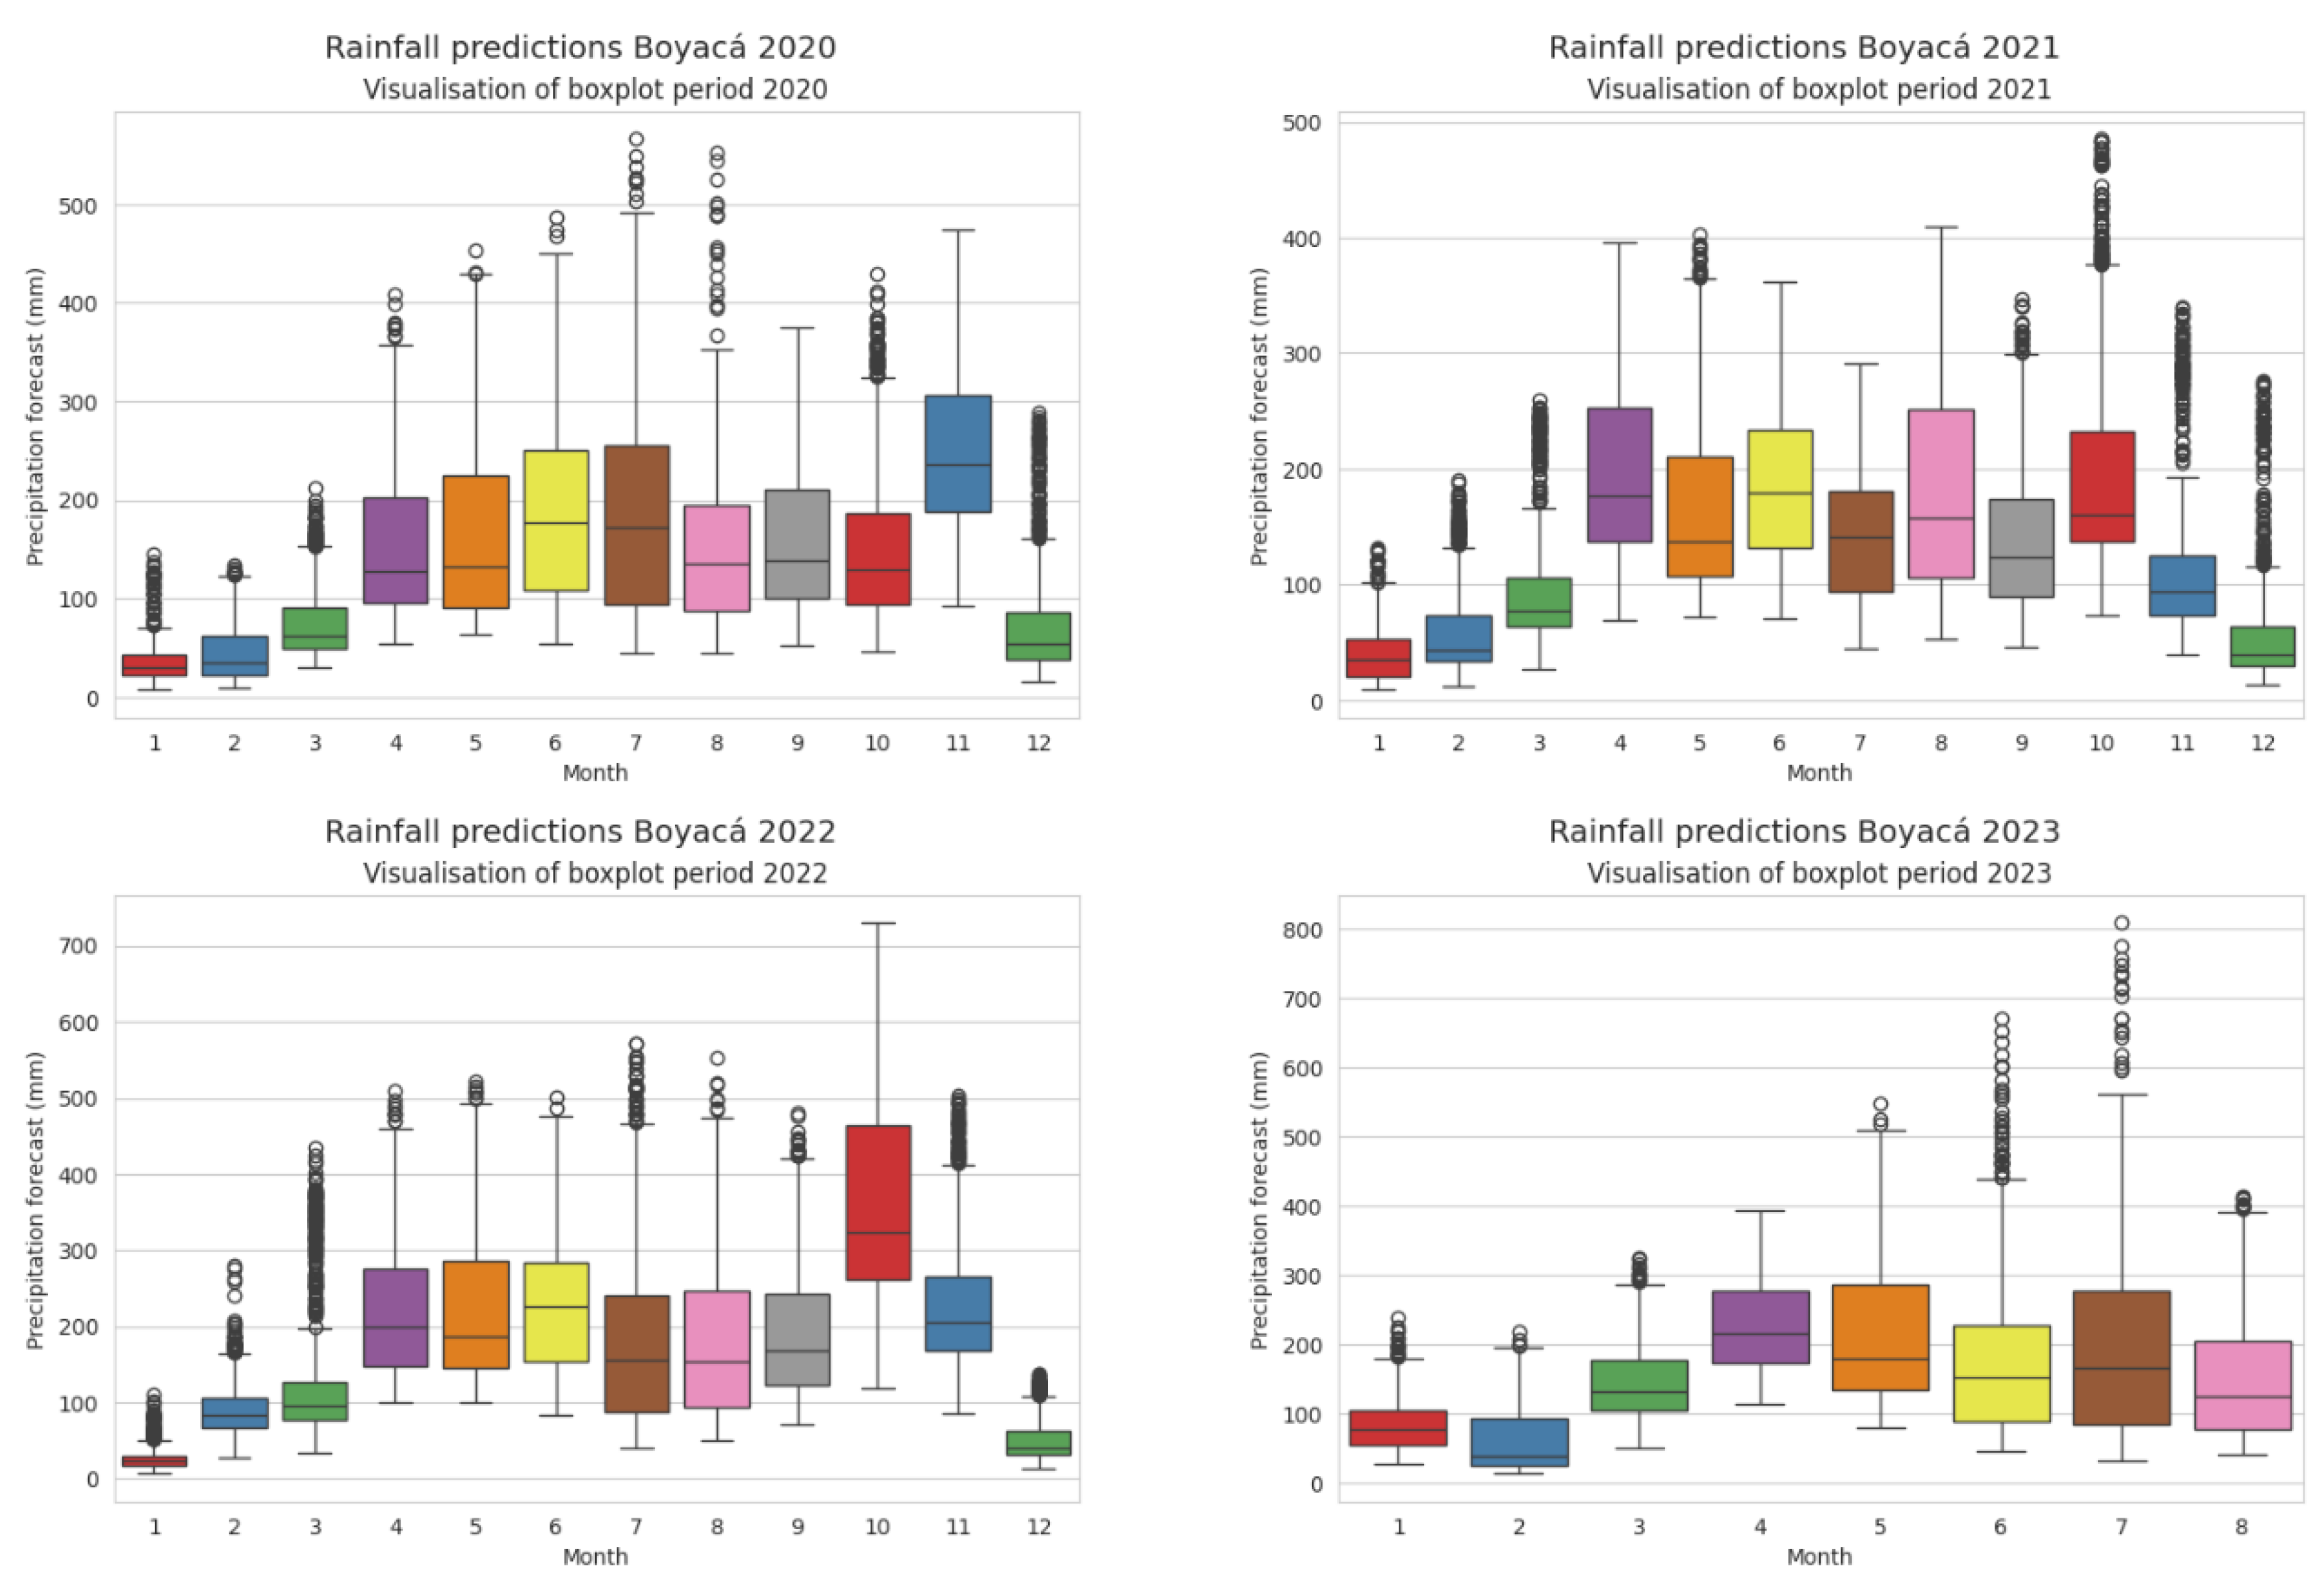
An analysis of historical precipitation values from 2020 to 2023 was conducted using box plots, presenting quantitative distribution through quartiles, as shown in
Figure 8. Based on the acquired and organized stationary precipitation data, along with statistical analysis, patterns, trends, and relationships between the dataset's characteristics can be identified. According to [
44], the box plot facilitates the establishment of relationships between samples and the identification of outliers.
Examining the distribution of precipitation in Boyacá, it is noted that in the year 2020, the maximum precipitation occurred in October, reaching approximately 500 mm. This value may suggest a geographic point with significant monthly rainfall, such as a moor or an outlier within the dataset for that year. Upon investigating outliers, it is found that the coordinates corresponding to latitude: 7.024998, longitude: -72.125008, located in the municipality of Cubará, Boyacá, northeast of the region, experience high rainfall, indicating it is not an outlier but rather a location with a high probability of precipitation.
In 2021, the dry season months (January to March) did not exceed an average of 100 mm of monthly rainfall, although March saw rainfall exceeding 200 mm. The rainy season, averaging between 150 and 200 mm, persisted from April to October, with October being the wettest month, recording rainfall over 400 mm.
In 2022, the effects of climate change were evident, with precipitation values from May to November surpassing 500 mm per month at evaluated points in Boyacá. In November, data exceeded 700 mm per month, representing an increase compared to previous years when precipitation values did not exceed 400 mm.
For 2023, rainfall ranged between 150 mm and a maximum of 300 mm until March. From April to October, the El Niño phenomenon was expected, resulting in decreased departmental precipitation, averaging 200 mm per month. This analysis indicates that the dry season occurs between January and March, with December having moderate rainfall. Months with average rainfall are between April and August, while the highest rainfall occurs from September to November, with October experiencing the highest rainfall in the last two years, 2021 and 2022.
3.2. Development of Predictive Models
The results of the ARIMA, RFR and LSTM models are presented below.
3.2.1. Design Model Arima
A Dickey-Fuller (DF) test was conducted on the time series to determine whether the data adhere to a unit root autoregressive process [
30], indicating the stationarity of the model. Once the time series rejects the null hypothesis and the data are stationary, the dataset is divided, with 70% allocated for training and the remaining 30% for testing. Precipitation is selected as the target variable. The best model for the training set is identified as the autoregressive and differenced ARIMA model (4,1,0) (2,1,0) (12), lacking moving average characteristics (i.e., a stationary model), with 4 lag observations in the autoregressive model and 1 degree of differencing.
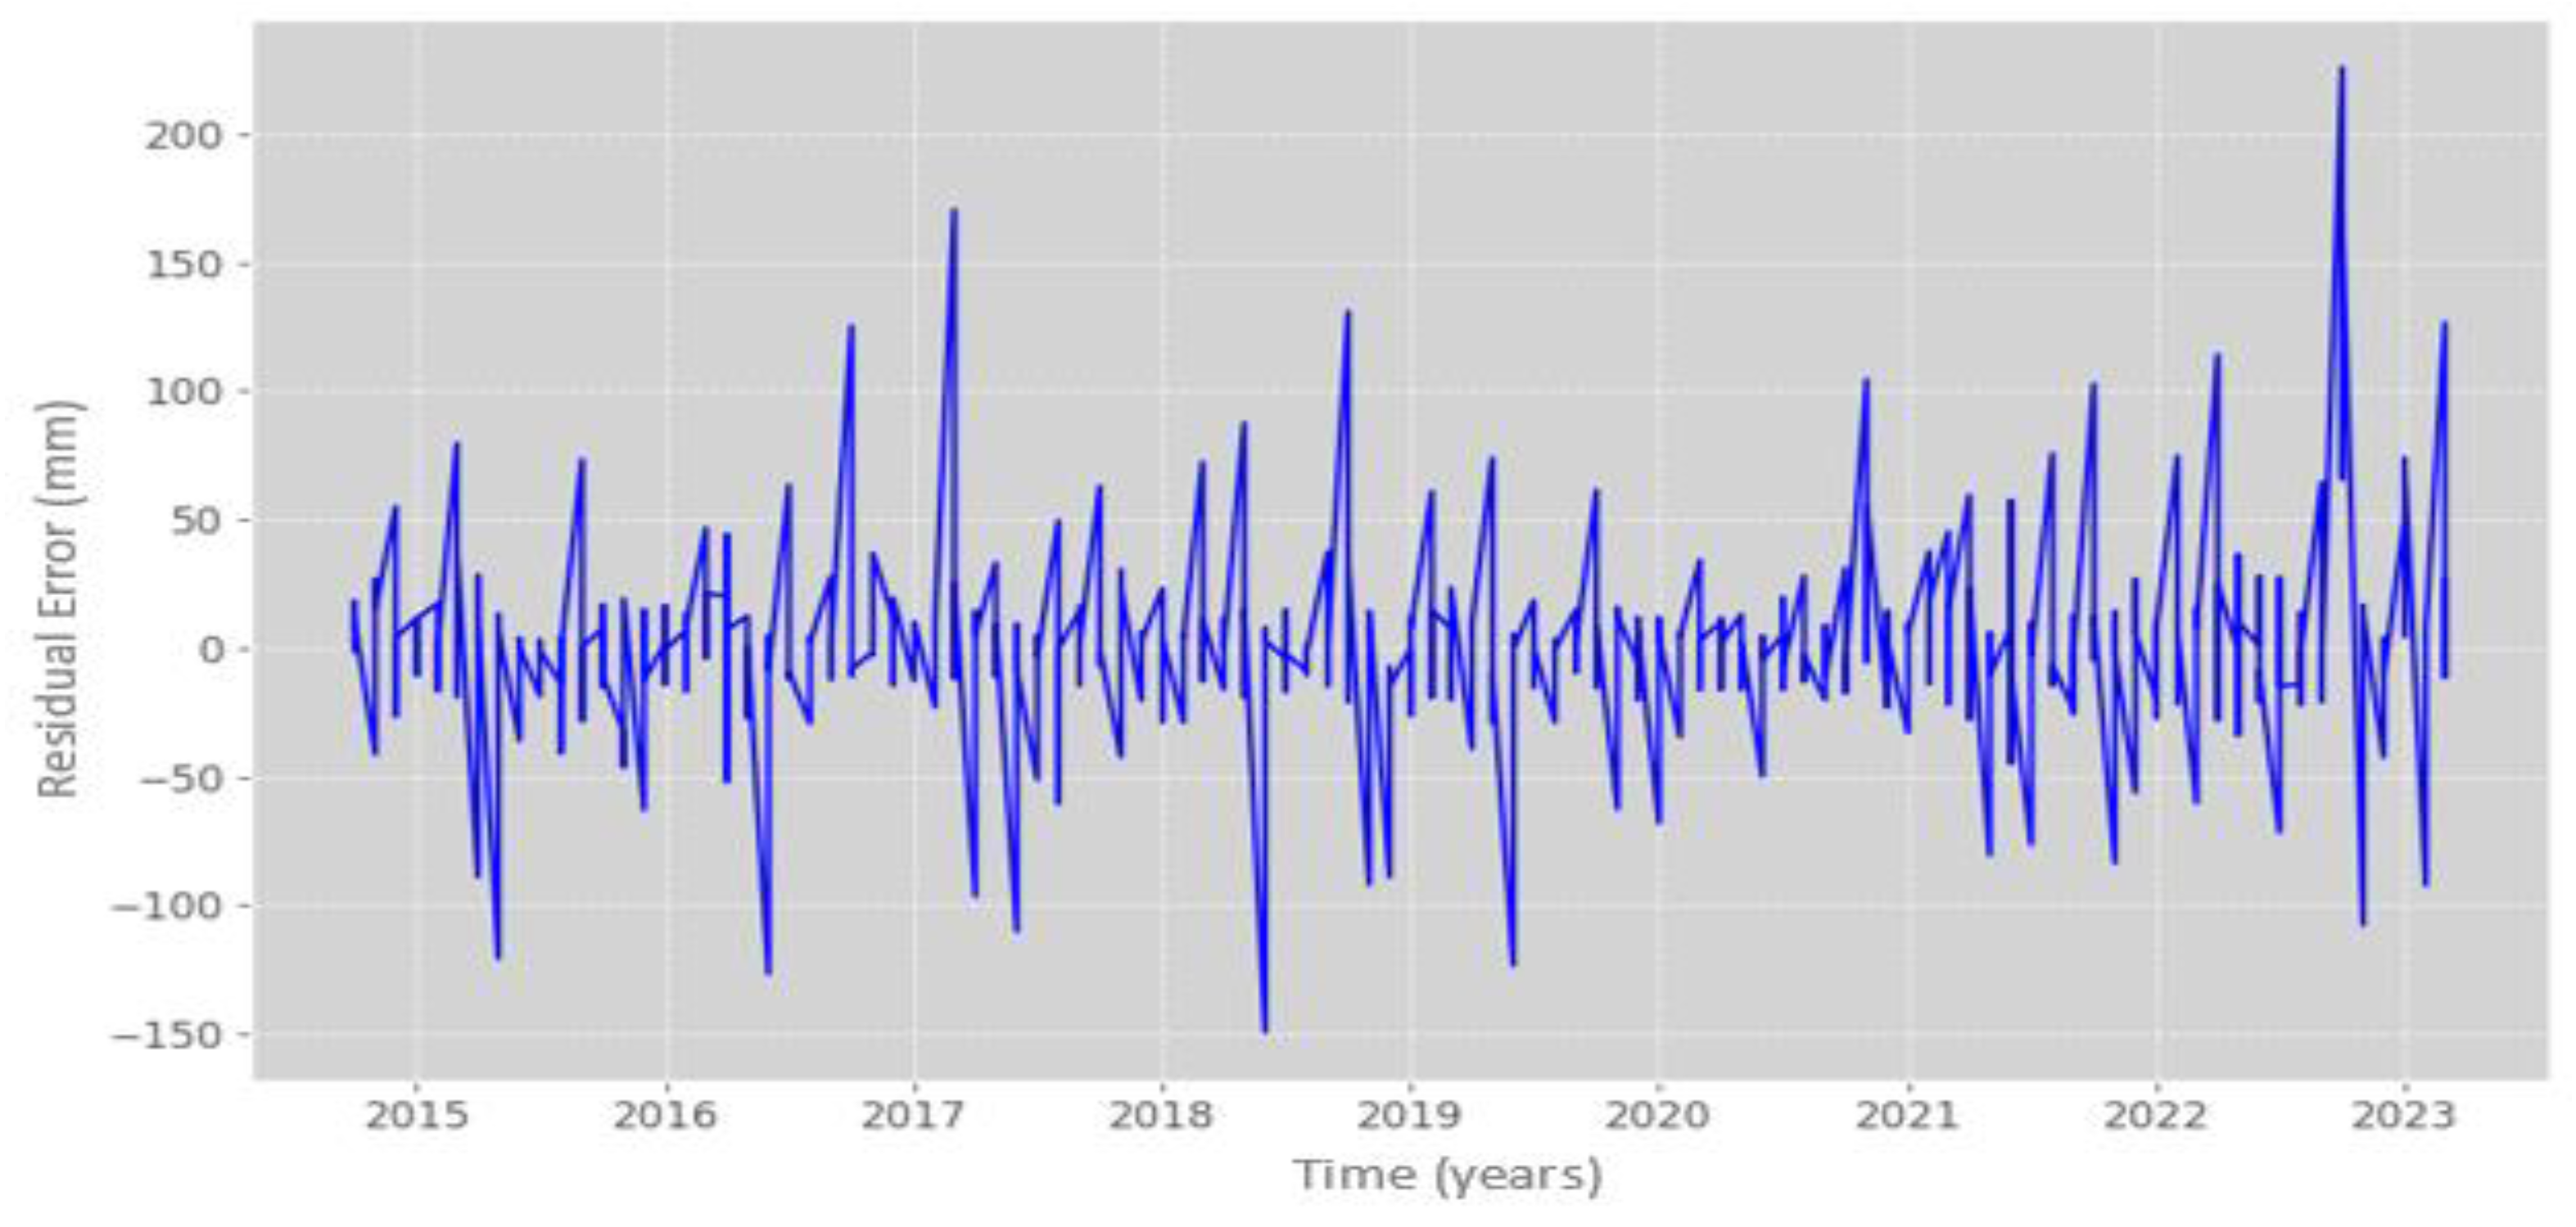
Finally, the model's predictions were evaluated, achieving an 81% similarity to the observed precipitation in both the training and test datasets, with residual errors averaging 27.98 mm compared to the actual measurements. The error trend across most data points exhibited a mean of zero and a uniform variance, although there were instances where the residual error exceeded 200 mm, as illustrated in
Figure 9.
3.2.2. Random Forest Regression Design
In this model, seasonal variables of year and month are included in each observation of the input dataset. Additionally, one year's worth of data has been included for each observation. Consequently, a dataset with 17 variables (latitude, longitude, precipitation, year, month, L1, ..., L12) was obtained, where precipitation serves as the target variable and the other variables act as labels for prediction.
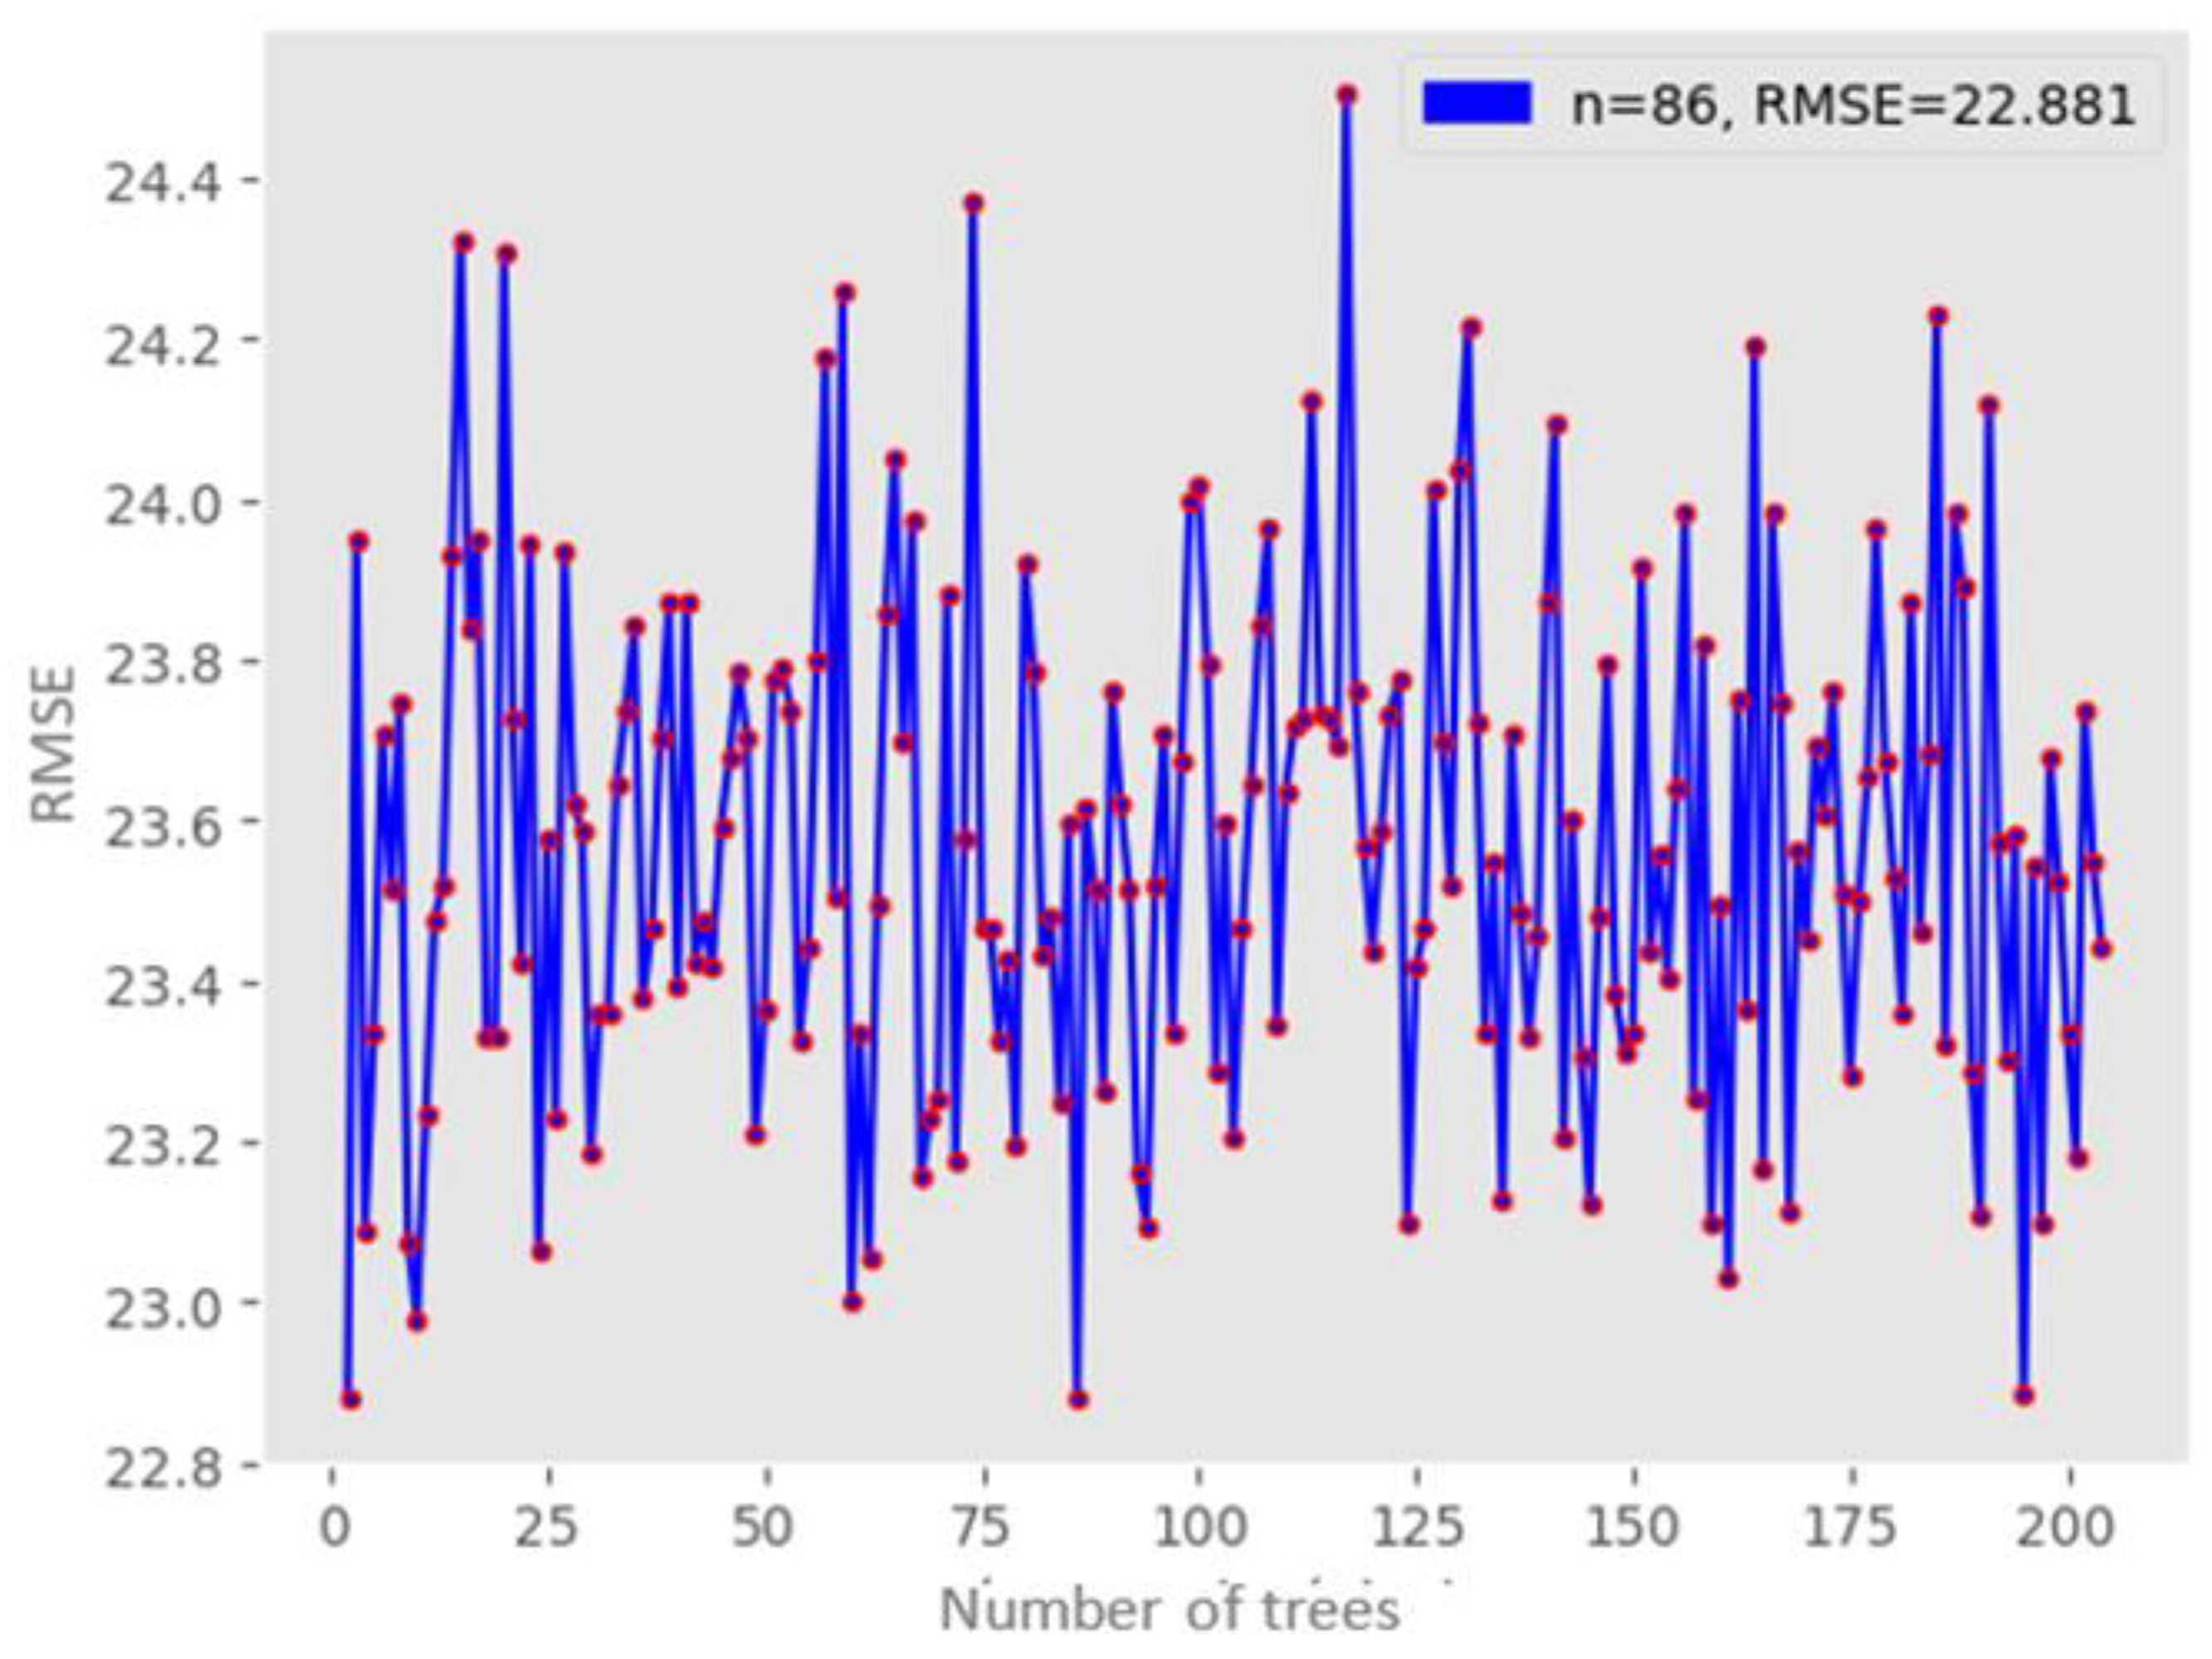
Seventy percent of the data was allocated for training, with the remaining 30 percent reserved for model evaluation. A Random Forest regression model with 83 decision trees was created. This specific number of trees was chosen as it produced the lowest RMSE value among the 0 to 205 trees evaluated, as shown in
Figure 10.
The study achieved an 87% similarity between the model's precipitation predictions and the observations from the training and test datasets. When plotting the model's response against the test dataset, it was observed that the predictions closely matched the actual behavior in most instances. However, there were a few outliers where the predictions deviated by approximately 12 mm from the actual values, resulting in an overall error of 23.21 mm, as illustrated in
Figure 11.
3.2.3. LSTM-NN Model Design
Several training runs were conducted for the LSTM model, exploring different hyperparameter values. The best model achieved included a sequential class instance with 128 memory units in the hidden layers, utilizing a linear activation function and a mean squared error (MSE) loss function, with a learning rate set to RMSprop. Seventy percent of the data was allocated for training, with the remaining 30 percent reserved for model evaluation.
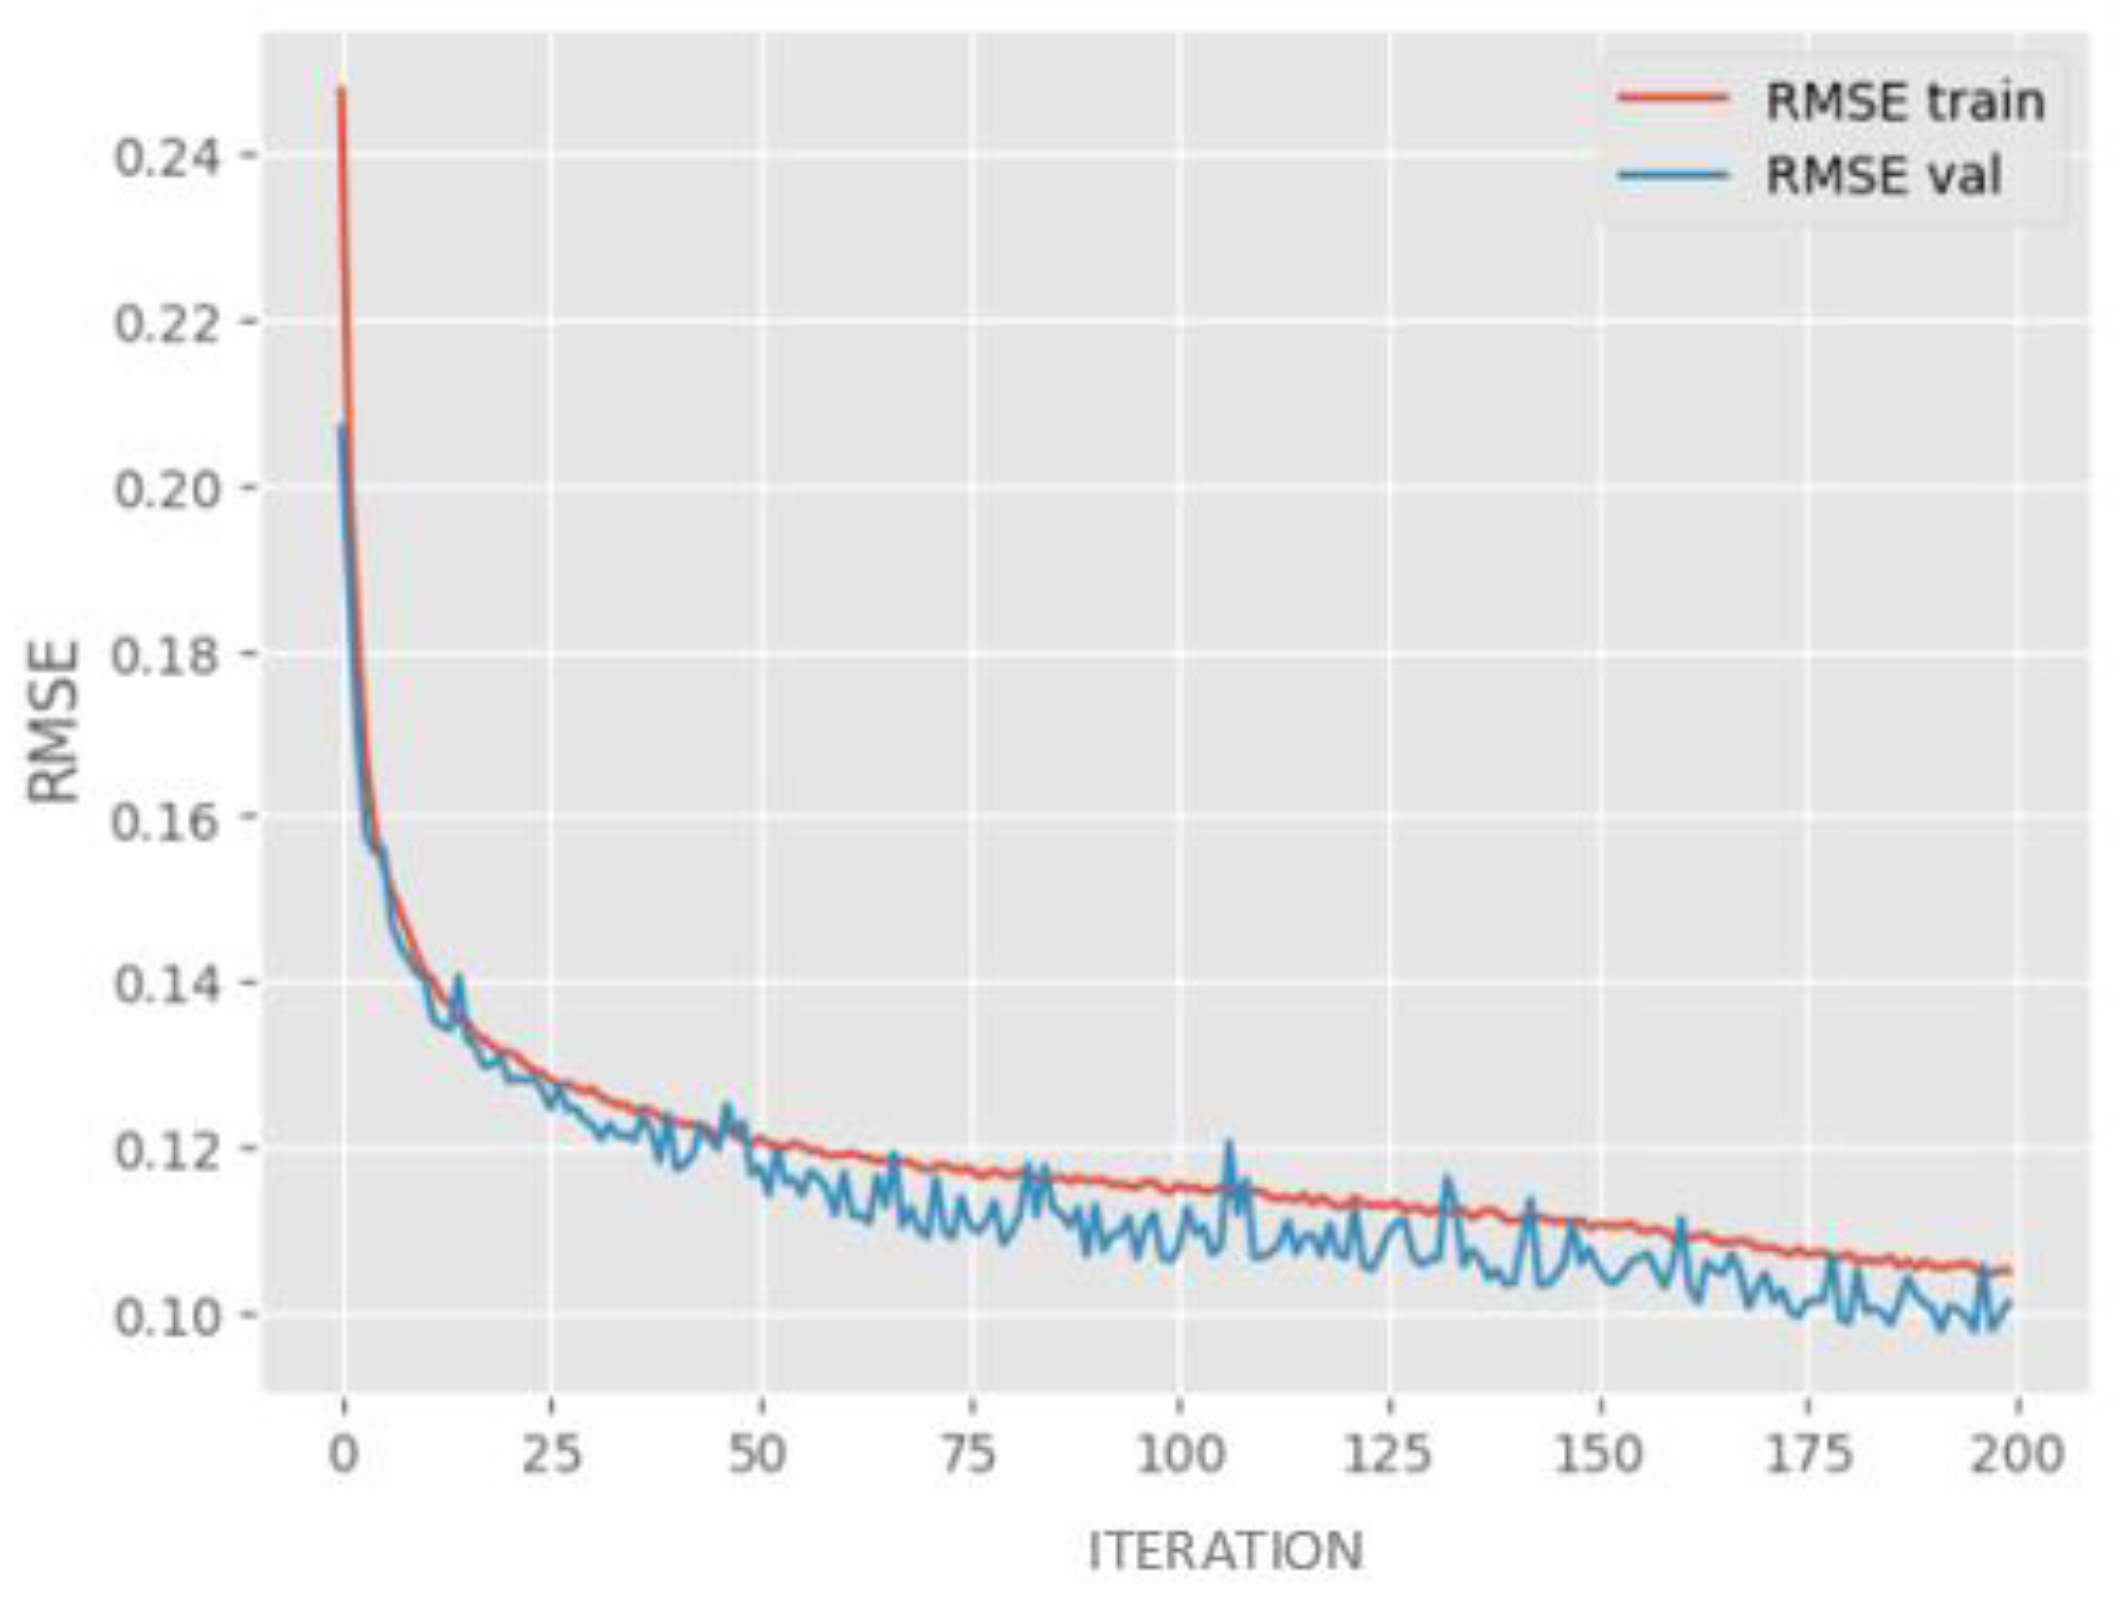
Furthermore, validation for overfitting was performed on the training and test datasets, as illustrated in
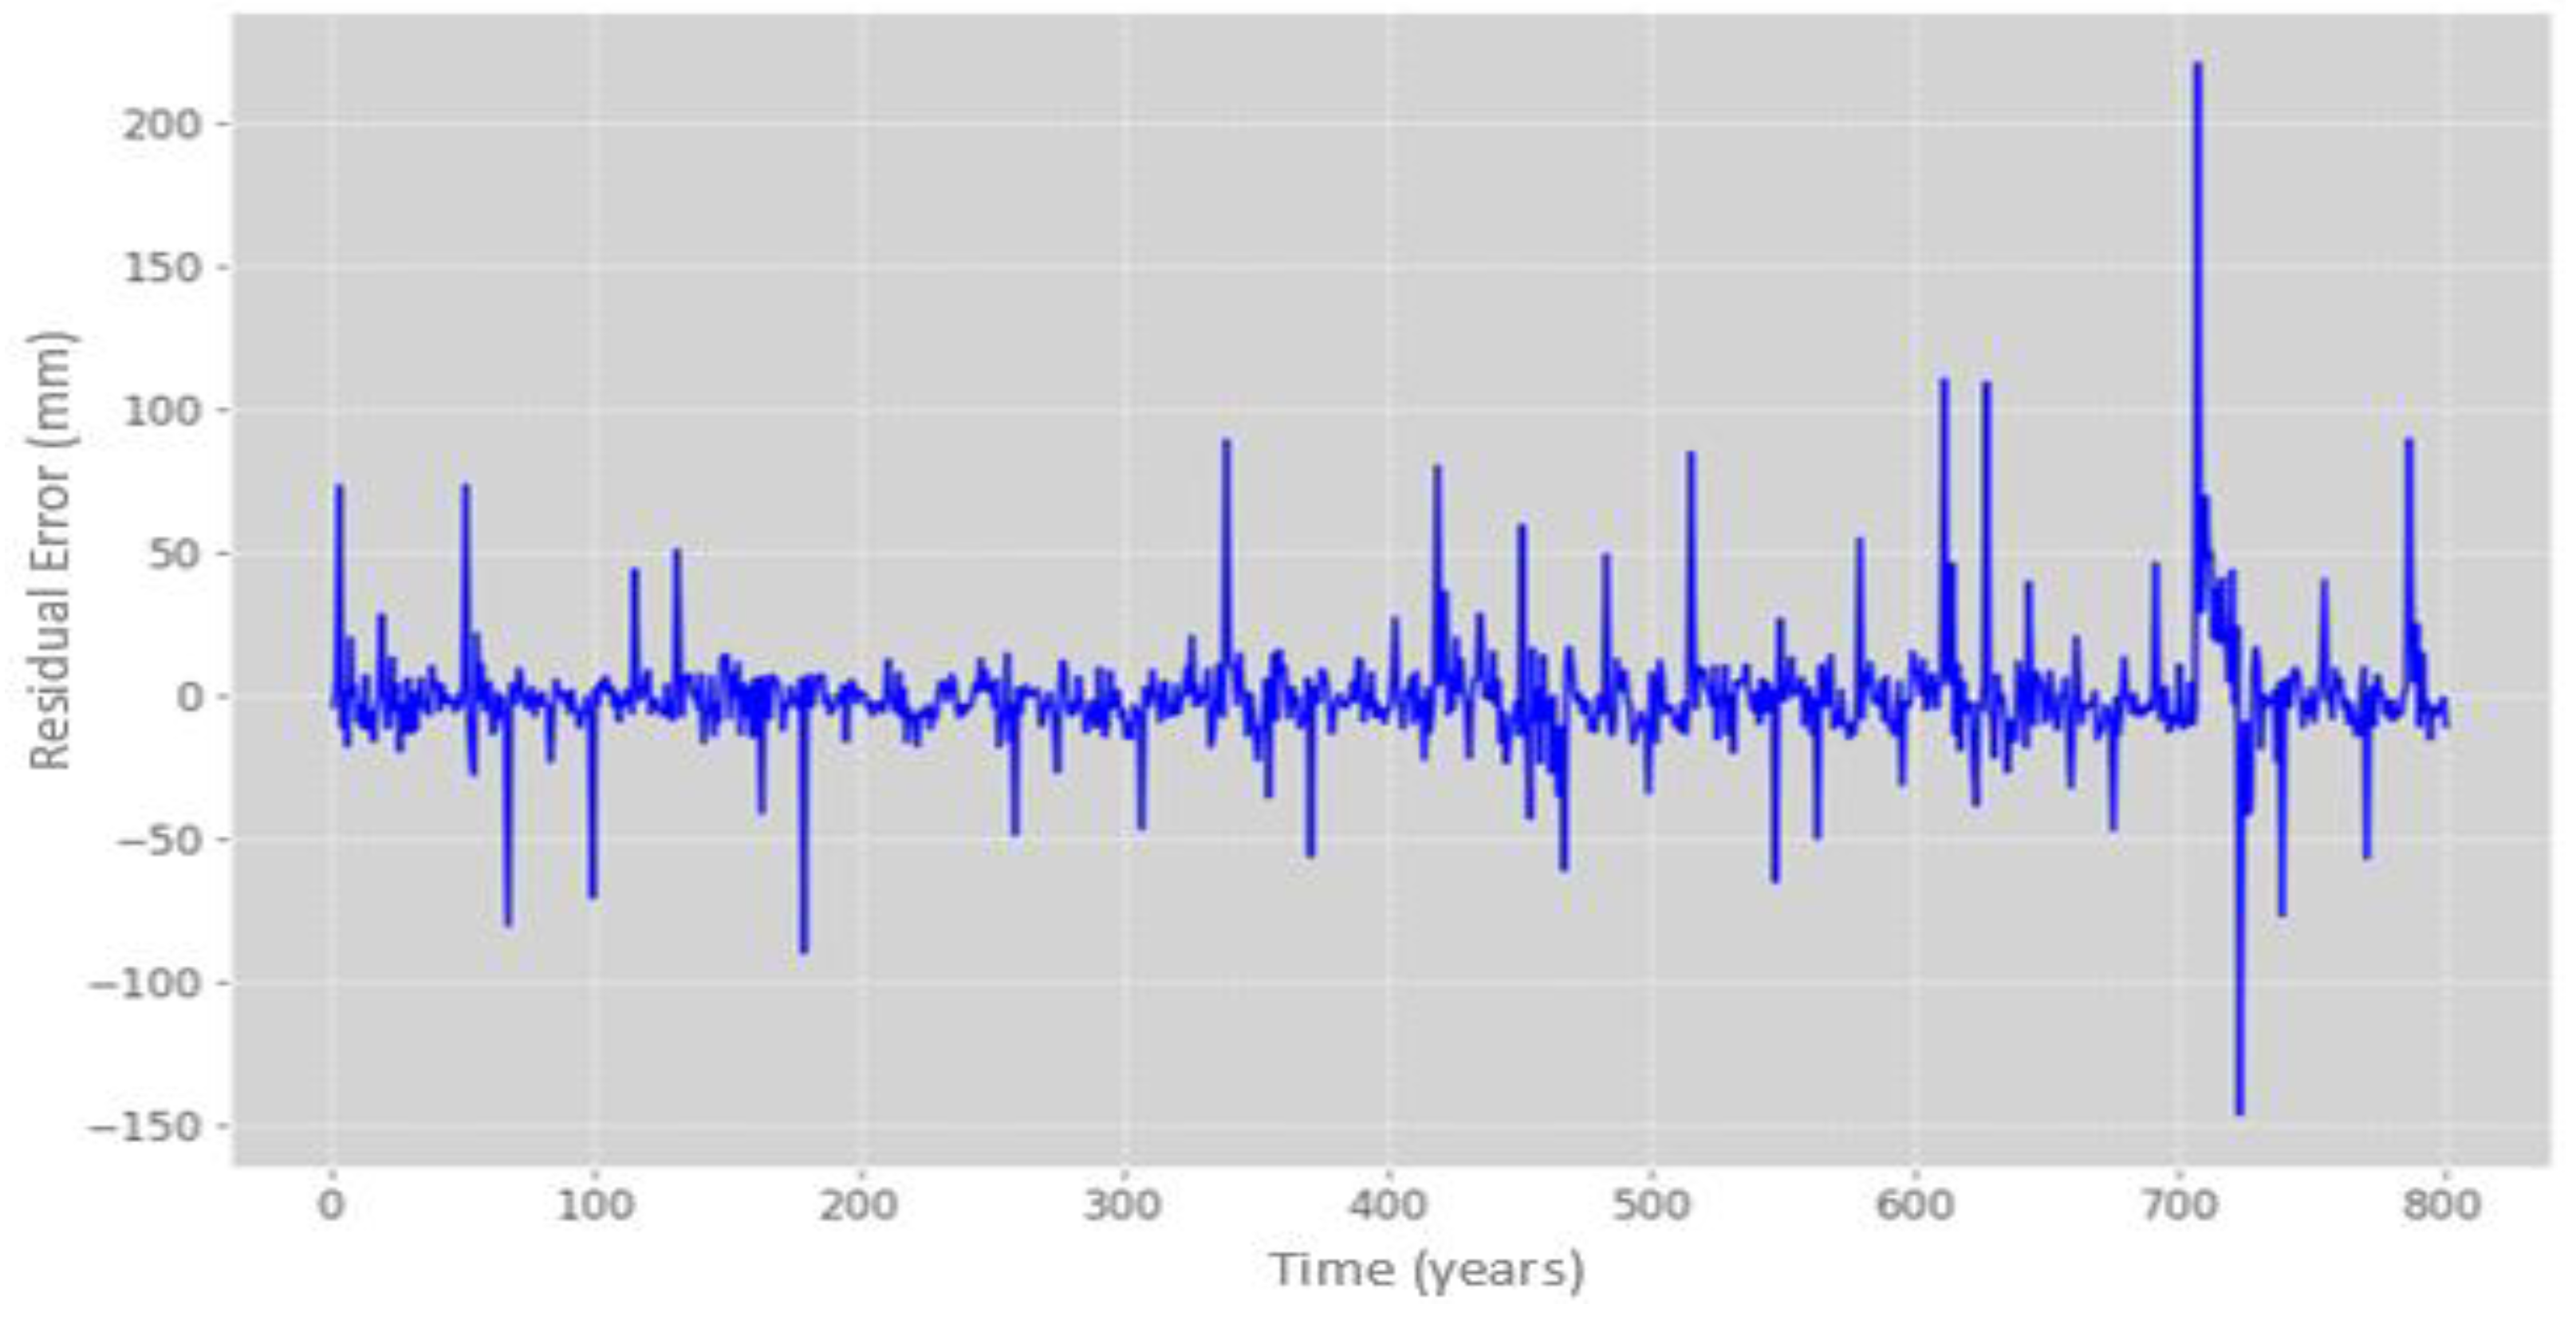
Figure 12. Upon converting the predictions to full scale, the LSTM model demonstrated 92% effectiveness in reproducing the precipitation values of the dataset. This resulted in a 16-percentage point reduction in residual error compared to the Random Forest Regression (RF-R) model. Additionally, the LSTM model showed a decrease in the number of significant errors, with only a few iterations exhibiting values above 100 mm and one instance with approximately 200 mm, as shown in
Figure 13.
In the evaluation metrics, three models were compared: the ARIMA model, the LSTM-NN model, and the Random Forest Regressor. The ARIMA model demonstrated efficiency but exhibited 10% lower reliability in predictions compared to the LSTM-NN model, as detailed in
Table 2. Additionally, the root mean square error (RMSE) of the ARIMA model was more than 10% higher than that of the other two evaluated models. Consequently, the LSTM-NN emerged as the best model for reproducing observations from the dataset, with an error rate of 0.8% and a superior RMSE metric compared to the second-best model, the Random Forest Regressor. The monthly precipitation errors, whether above or below the actual measurements, were approximately 10 mm.
Based on the evaluated results, the LSTM-NN model emerges as the most effective in reproducing precipitation observations from both the training and test datasets. Consequently, this model was implemented to predict the next 48 months, starting from the last month, which is August 2023.
3.3. LSTM-NN Model Implementation
The implementation was based on the LSTM-NN model capturing spatiotemporal patterns of monthly precipitation data for the Boyacá Department with the following architecture:
The decision to use an LSTM layer with 128 units was based on its ability to yield the best results, leading to an improvement in the RMSE value. It's worth noting that increasing the number of hidden layers in the model tends to result in more accurate predictions. However, it's important to exercise caution, as the number of layers determines the amount of information the layer can learn. Therefore, there is a risk of overfitting the training and test data if this number is increased excessively.
This function was used so that training would be fast, so that there would be no saturation, as occurs with functions such as sigmoidal and hyperbolic tangent, and it is computationally simpler to implement.
The objective of the prediction is to perform a regression, therefore a dense layer with a unit is used, being the prediction on the precipitation variable.
It is a method to accelerate the training of neural networks and achieve a near-linear acceleration rate with the increase of computational nodes [
45]. It was selected to speed up the LSTM model, as it can adapt to learning each parameter individually and can lead to lower prediction error compared to other algorithms.
The MSE loss function gives more importance to large errors or outliers by providing a quadratic loss function as it squares and subsequently averages the values. This method is used in many identifications, prediction and optimal filtering applications [
46].
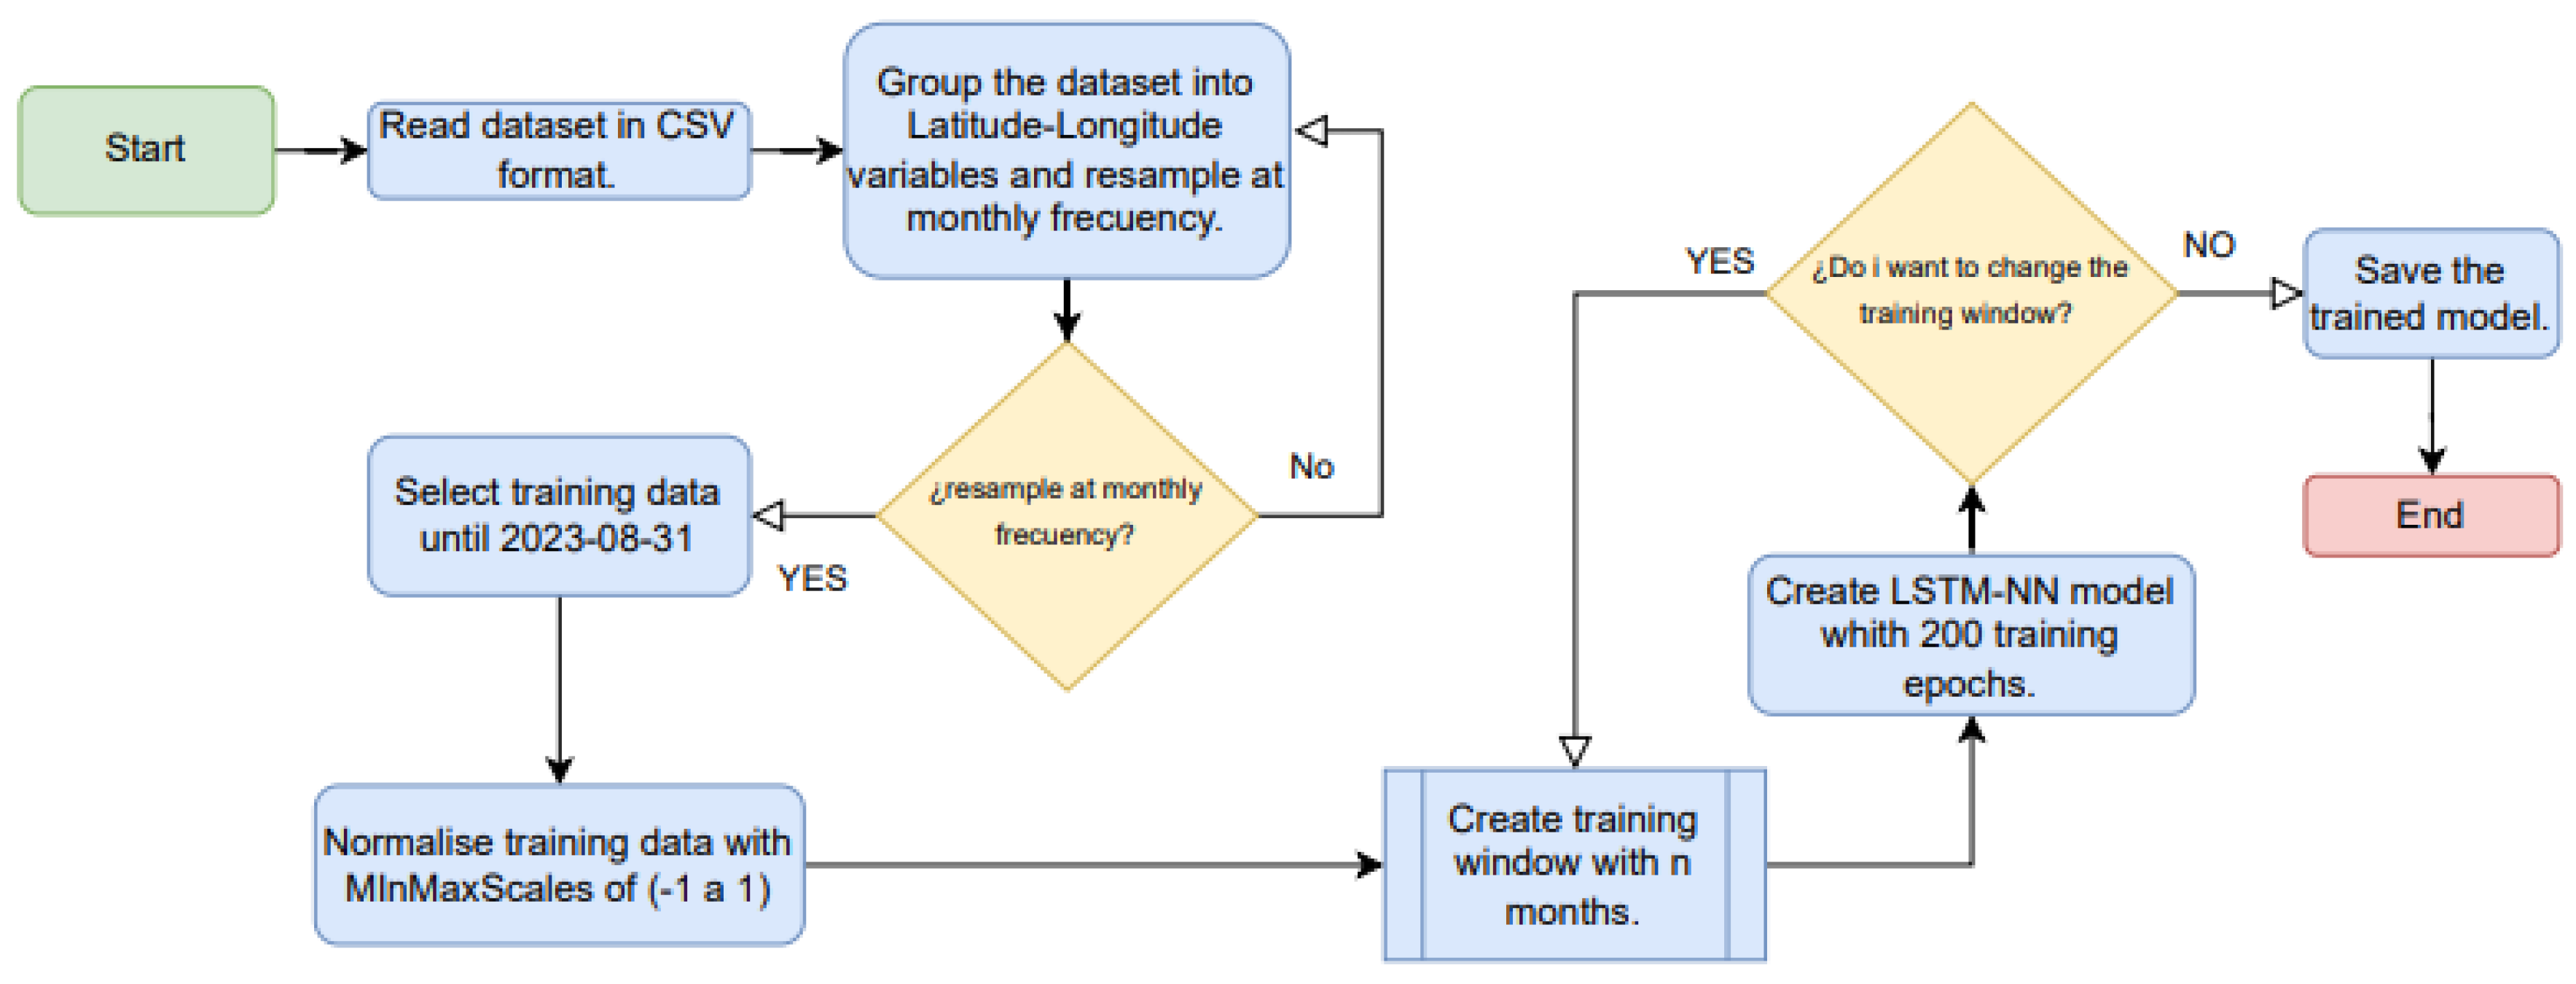
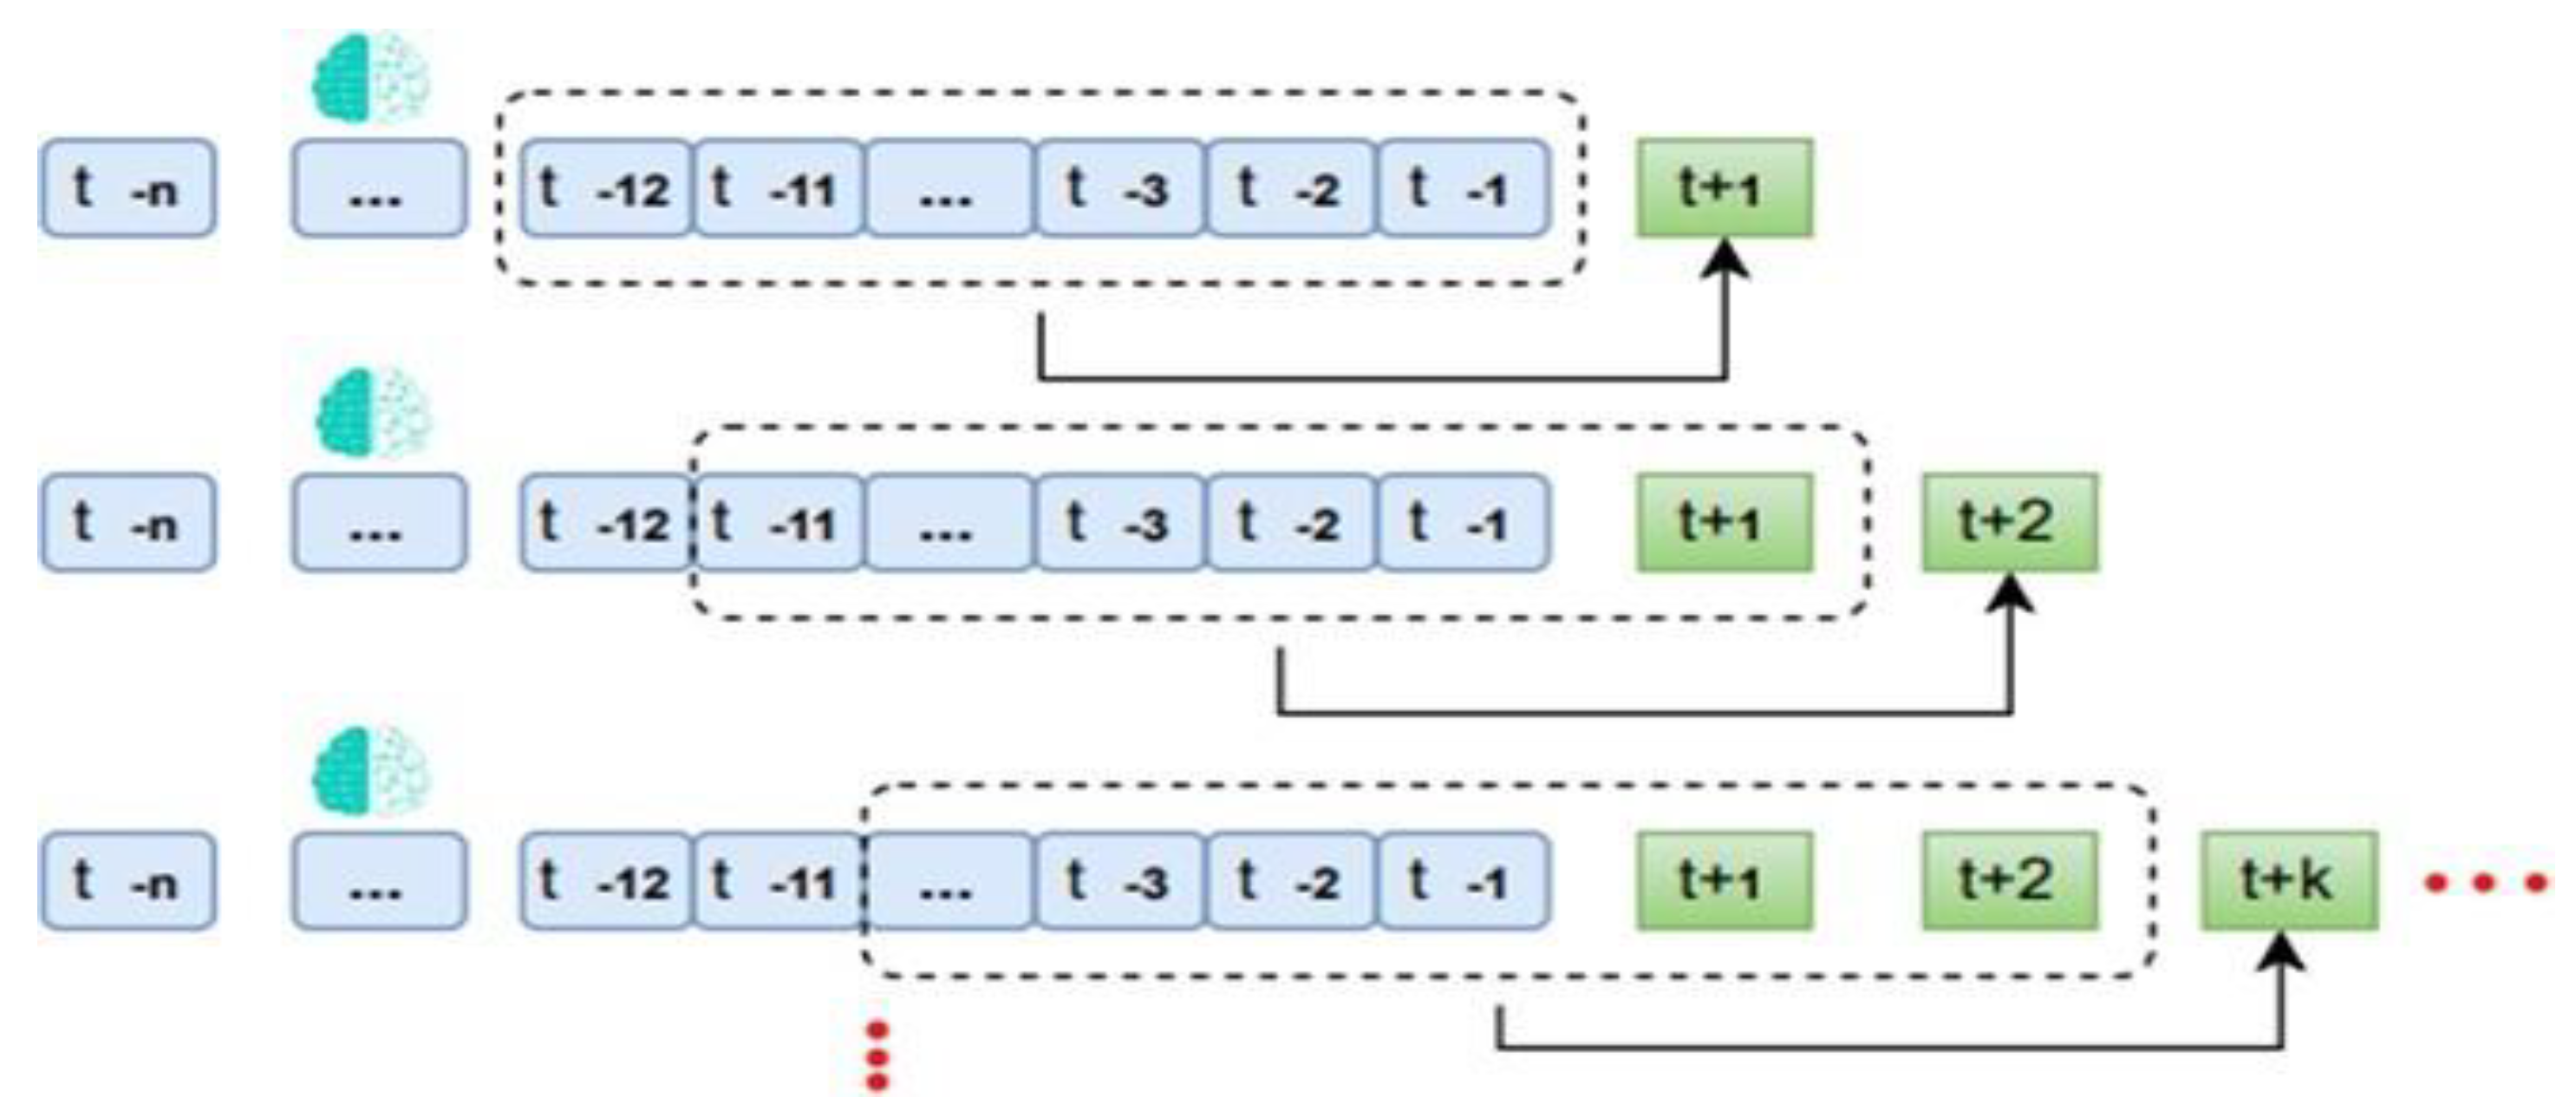
A sliding window approach was employed, wherein several previous months (t+n) were used to make predictions. This concept, known as sliding windows, is utilized to repair the input data for the training model. Subsequently, an algorithm was developed to construct a dataset comprising n number of previous months, with the output obtained for k following months using the architecture of the LSTM model mentioned above (refer to
Figure 14).
The Sliding Windows model significantly enhances the accuracy of short-term monthly precipitation prediction when utilizing deep long-term memory (LSTM) recurrent neural networks, which segment the input data [
47]. In this project, the 48-month window size was reconsidered to account for the El Niño and La Niña phenomena present in the region. Therefore, a 48-month window was established to predict at (t+16), commencing the first prediction in September 2023 for each dataset and concluding in December 2024. The process, detailing the handling of training data windows, is illustrated in
Figure 15.
The dataset contains a total of 757 geographical points of latitude and longitude of the Boyacá department. Once validated, the model was trained and run-on Google Collaboratory, which has the advantage of running Python 3 code in a runtime environment that uses T4 GPU hardware acceleration and high RAM capacity. A CSV-type dataset was generated with columns: latitude, longitude, time and precipitation prediction in millimeters (mm), which allows the generation of heat maps and box plots for each month.
3.3.1. LSTM-NN Forecast with 48-Month Window
The training of this model was conducted in Google Collaboratory, following the specified configurations and utilizing 100 epochs, lasting approximately 2 hours.
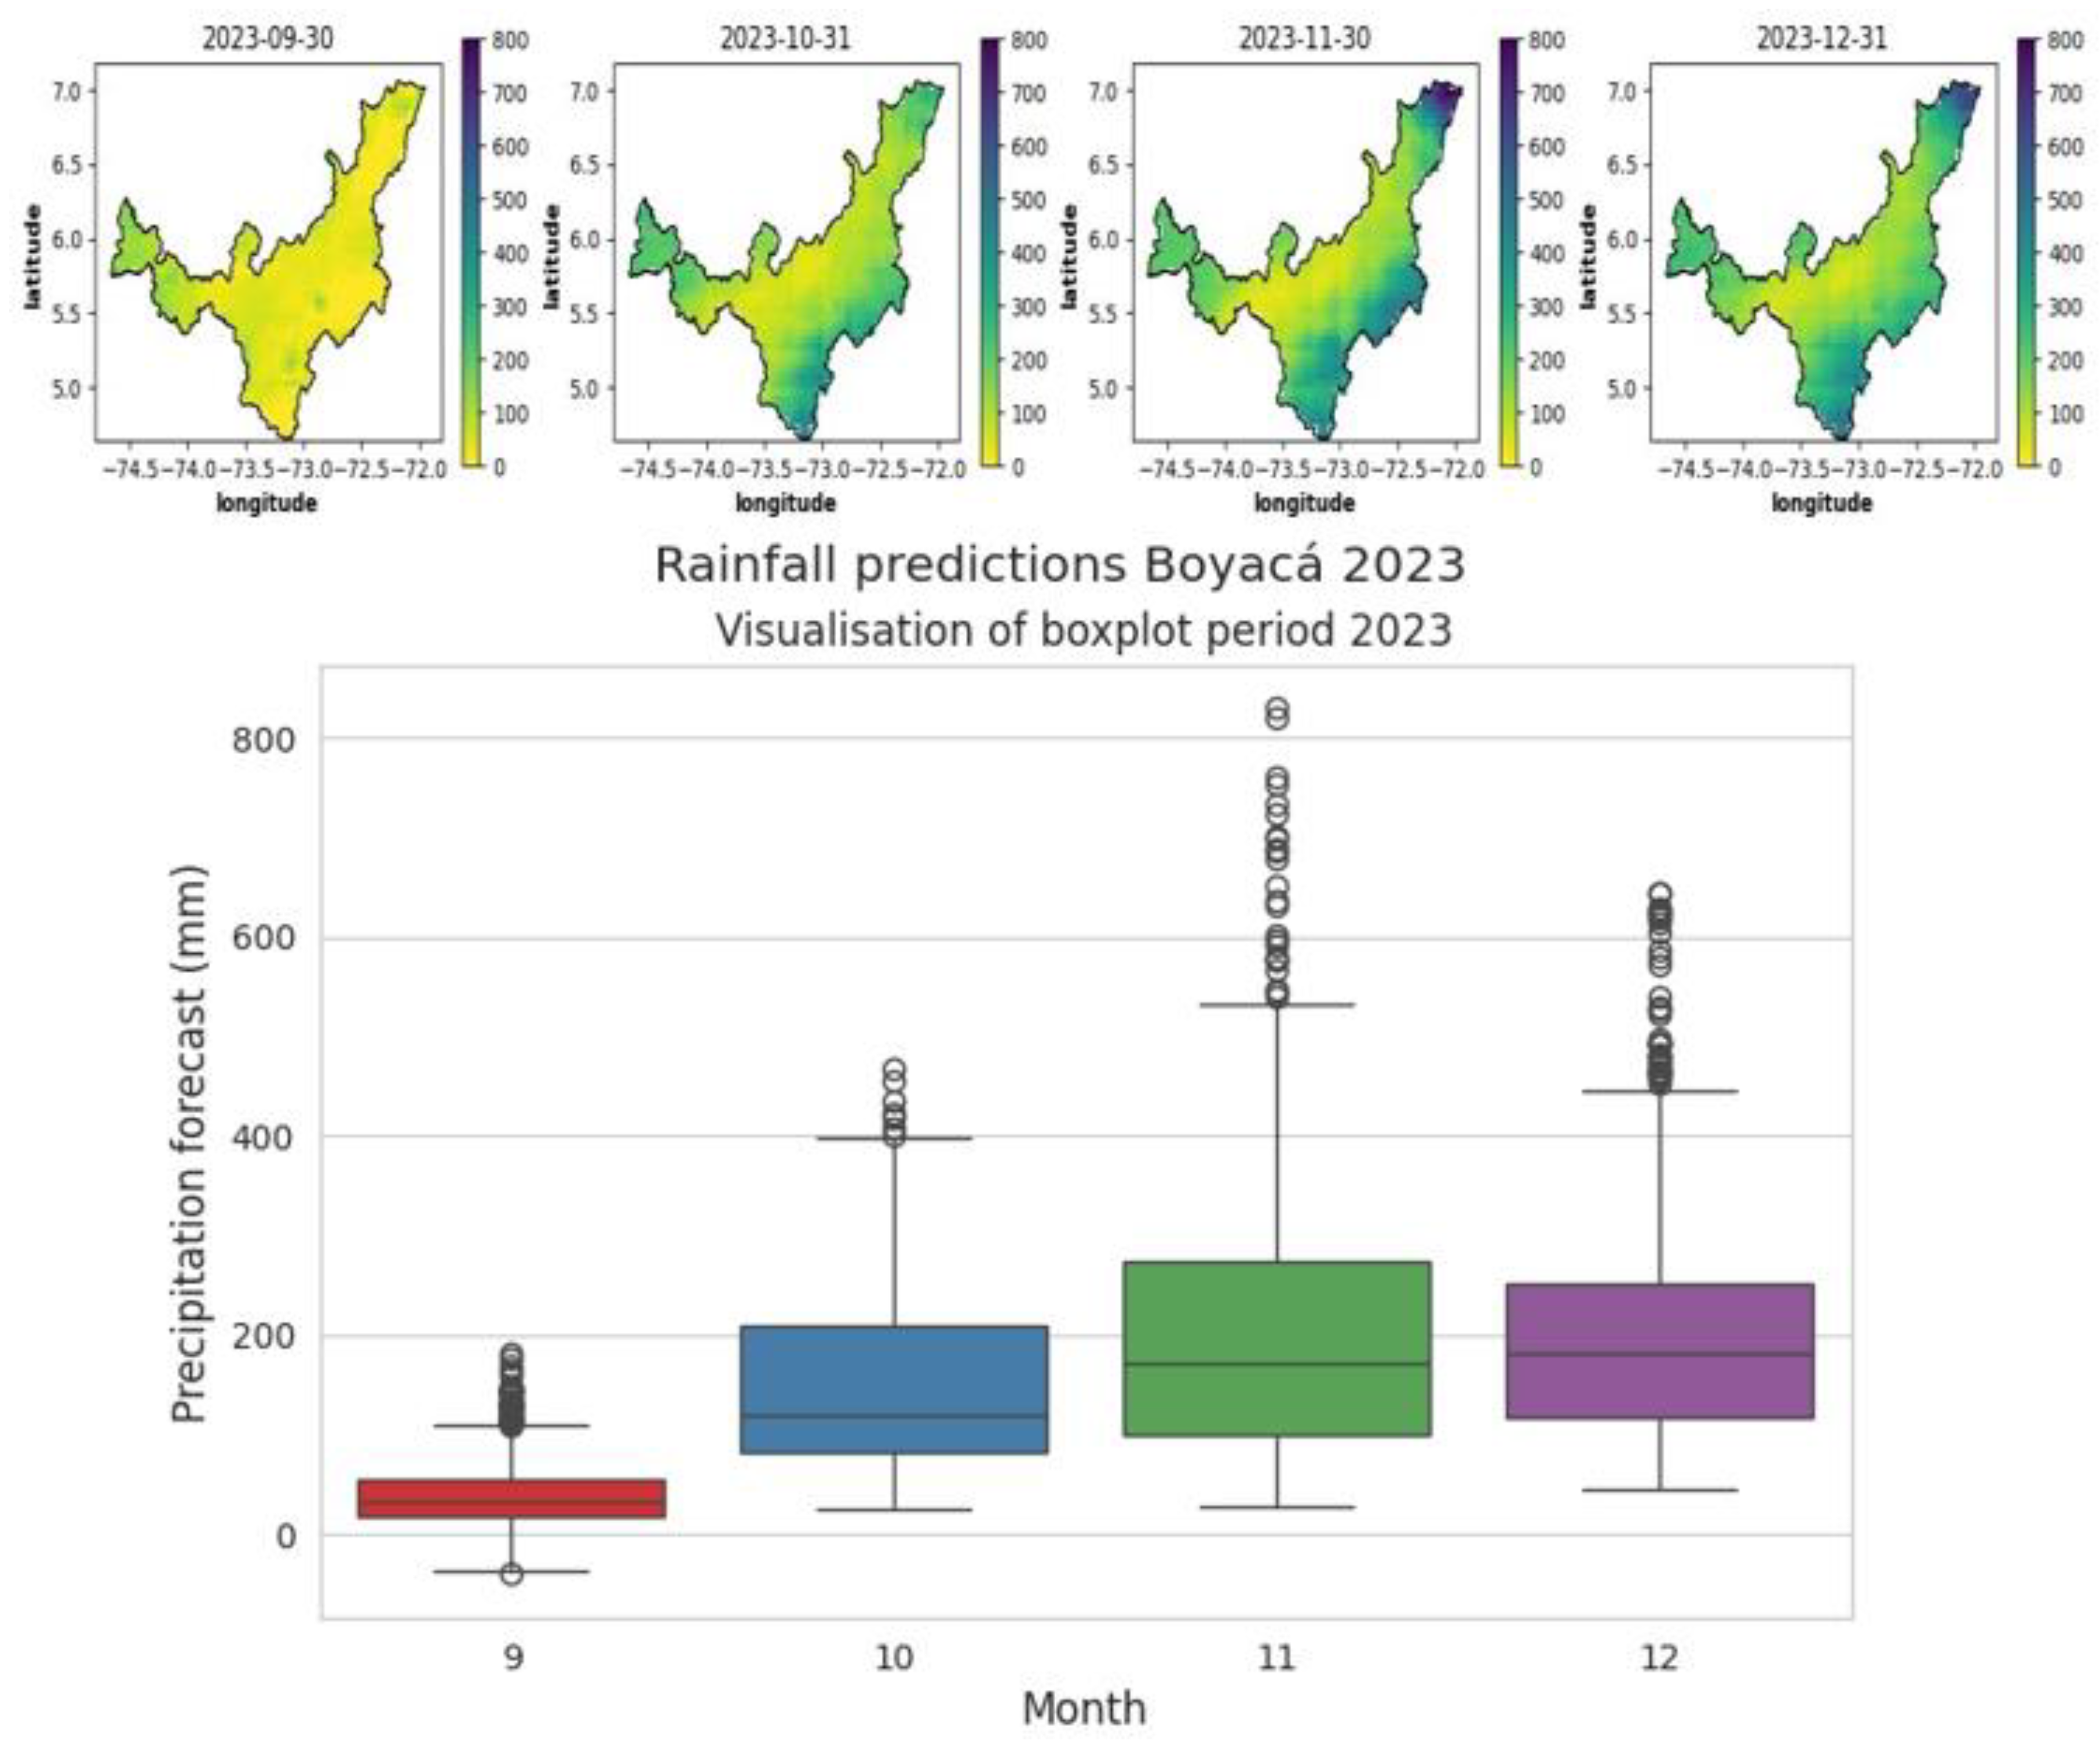
Figure 16 illustrates the spatiotemporal precipitation data and values represented in box plots obtained for the 4 remaining months of the year 2023, starting in September. The data indicates that precipitation for September does not exceed 150 mm per month for the entire department of Boyacá, a value very close to the average precipitation for this month. The box plots provide a clearer visualization of the precipitation values, showing that the distribution of precipitation in September 2023 will range between 10 and 80 mm per month, with a maximum of 100 mm.
Furthermore, the months of October to December exhibit an average precipitation of 180 to 200 mm in most parts of the department. However, precipitation values reach up to 500 mm in November in the northeast and southeast parts of the department, coinciding with the second winter period of the year in Boyacá.
For October to December 2023, it is observed that municipalities in the central region and those near the border with the Santander Department tend to experience relatively dry conditions, with monthly precipitation not exceeding 180 mm. However, municipalities located at the extremes and borders with departments the Antioquia, Caldas, Cundinamarca, and Norte Santander are expected to experience a gradual increase in precipitation from September to December, with anticipated values ranging from 300 mm to 600 mm, respectively
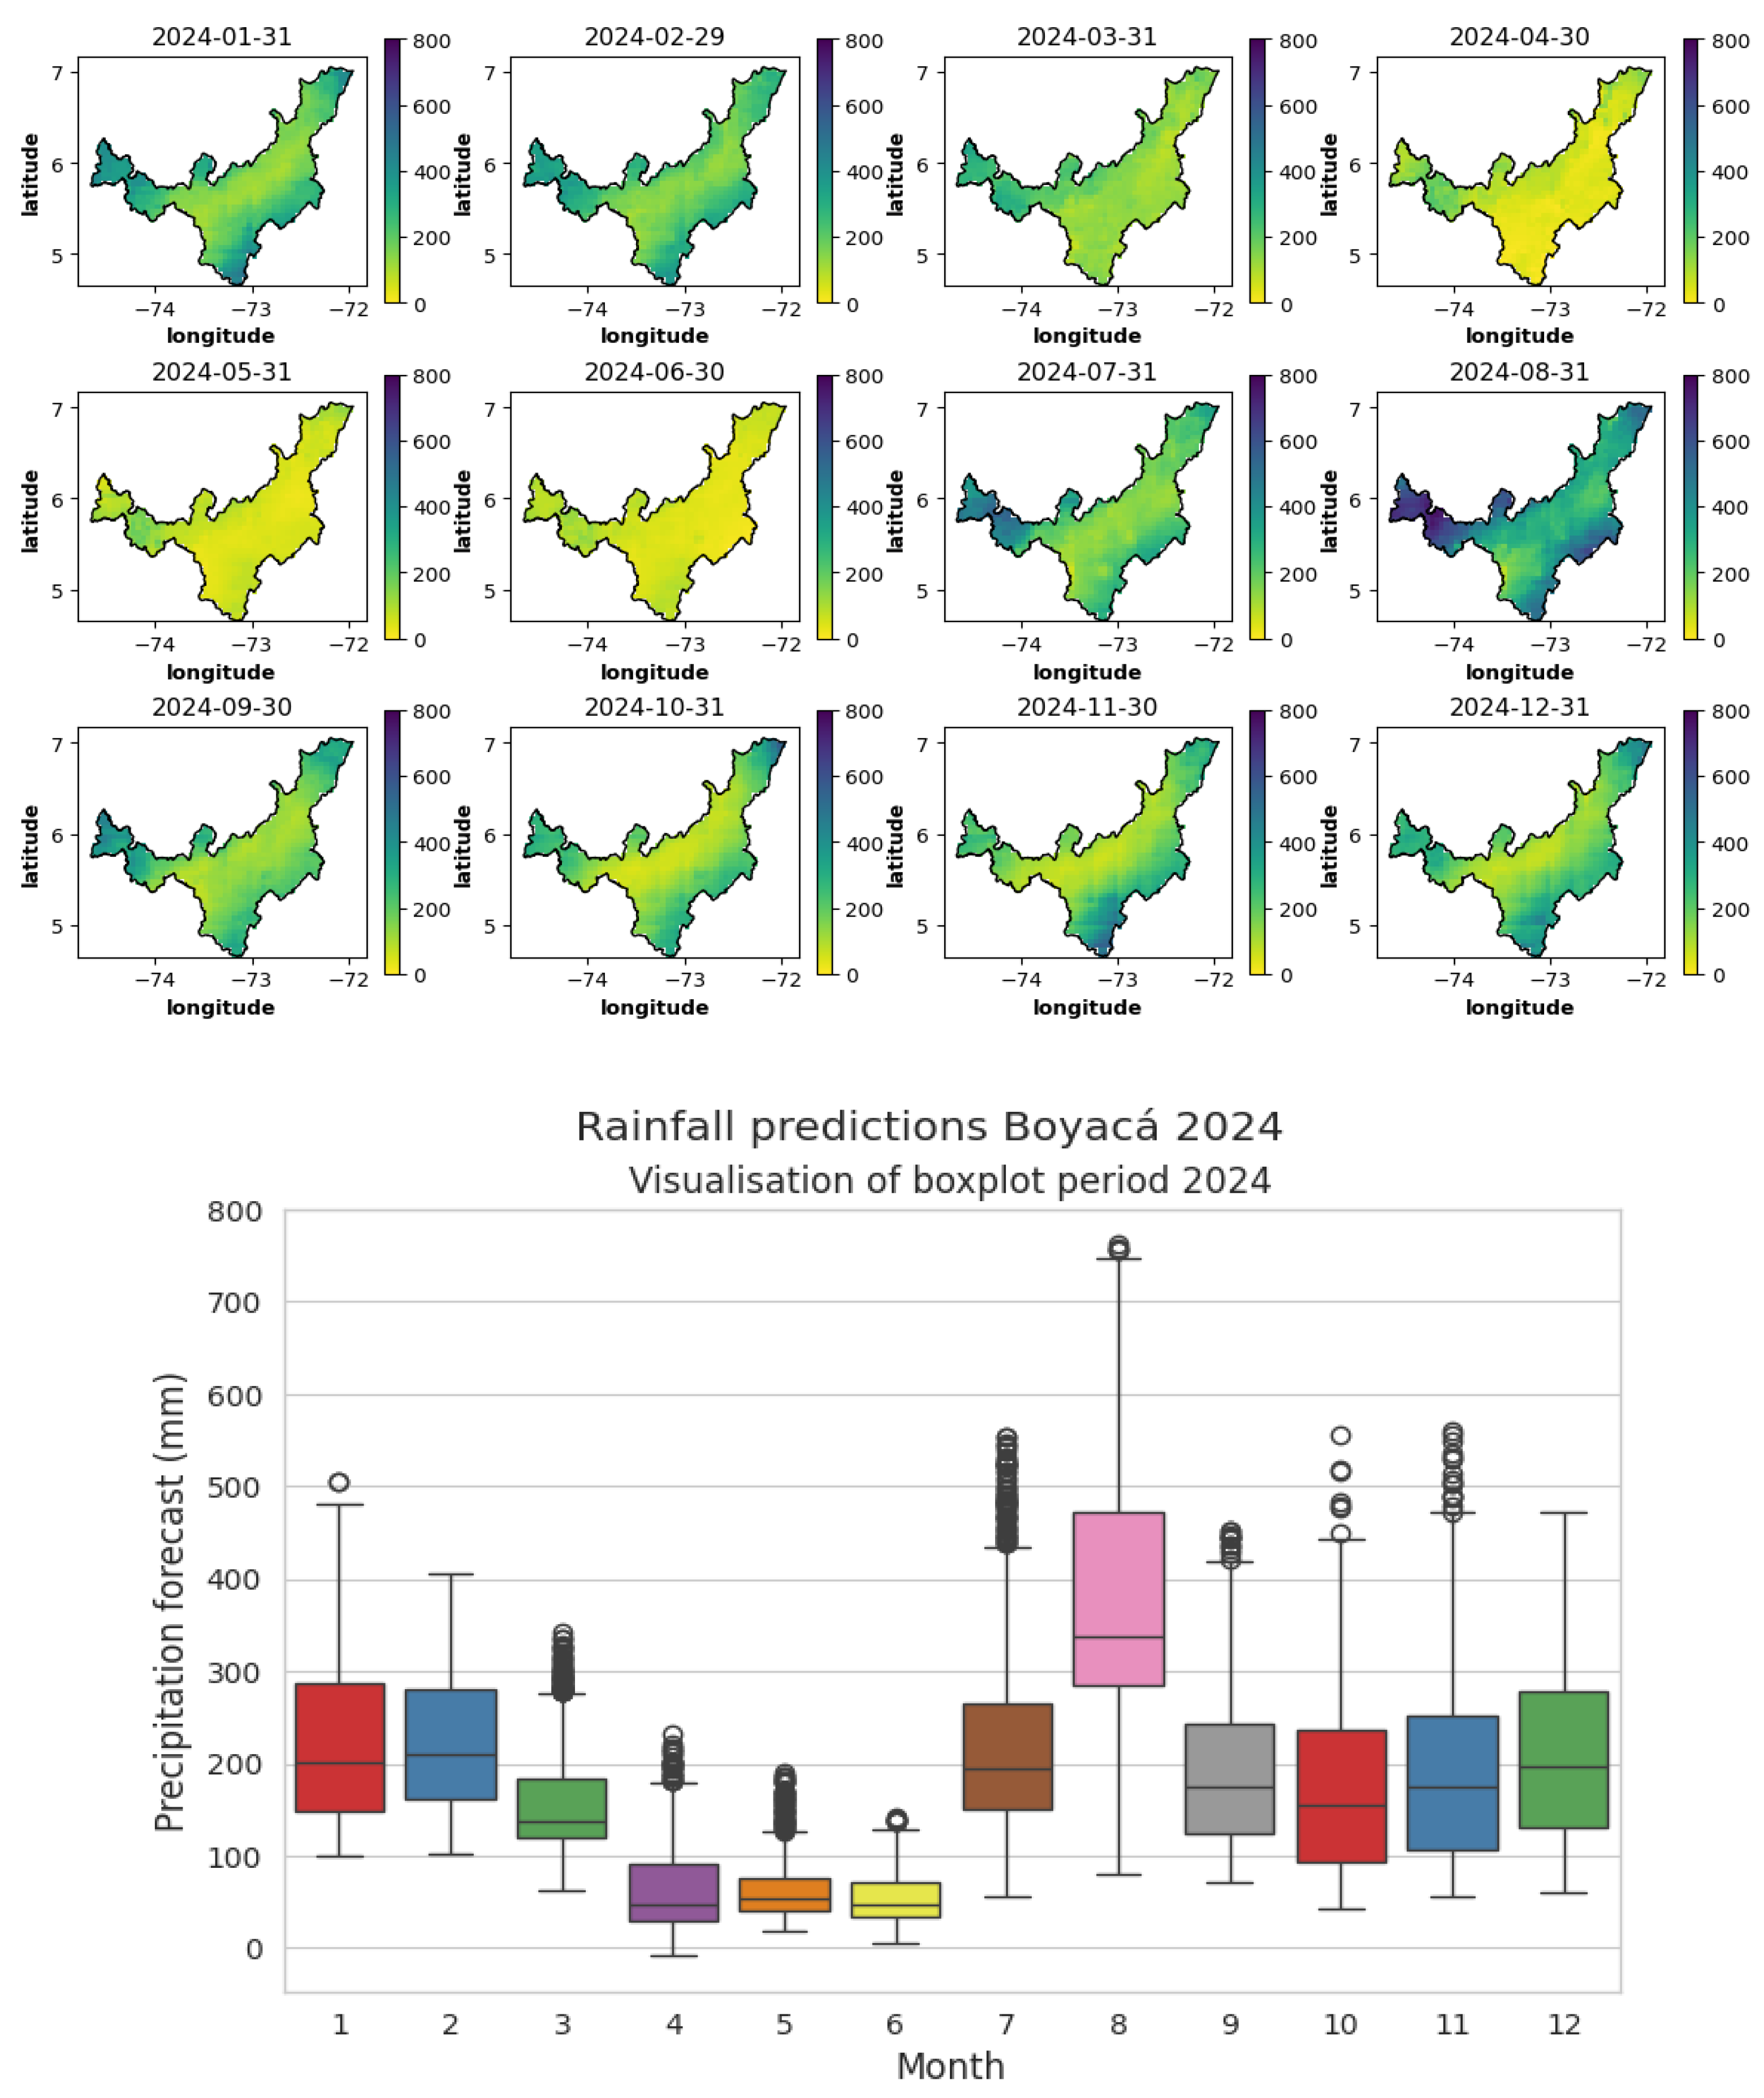
Similarly, the spatiotemporal prediction of precipitation for the year 2024 was conducted, revealing, as depicted in
Figure 17, an expectation of low to moderate rainfall between 100 and 300 mm for January and February, with some outlier data exceeding 450 mm. In March, rainfall is anticipated to decrease to between 100 and 190 mm, with a maximum of 290 mm, and some outlier data not exceeding 350 mm.
April, May, and June are forecast to be the driest months, despite April and May being winter months, with expected rainfall between 50 and 100 mm per month, reaching maximums of 200 mm across all three months. In July, rainfall is anticipated to return to low to moderate levels, similar to the beginning of the year, ranging between 180 and 290 mm, with outliers exceeding 450 mm. August is expected to be the month with the highest rainfall, with intense rainfall predicted between 300 and 500 mm, and some municipalities in the department may experience maximums of up to 700 mm. Rainfall is forecasted to decrease during the last four months of the year, with expected low rainfall ranging between 100 and 250 mm per month. In the north-eastern and south-eastern parts of the department, rainfall may range between 350 and 400 mm per month.
4. Discussion
The ARIMA, Random Forest regression, and LSTM models yielded favorable results when evaluating the RMSE, MAE, and R2 metrics, as summarized in
Table 2. Of these, the neural network with long-term memory (LSTM) emerged as the best model for predicting time series with precipitation and location data. It achieved predictions closely aligned with real data and improved prediction accuracy for different outliers, resulting in high residual error values. The visualization of prediction results is crucial for decision-making and preventive measures across various fields. Heat maps depicting monthly rainfall patterns at different points within the department of Boyacá enable the identification of months with the most intense precipitation (La Niña phenomenon), as well as moderate and dry months (El Niño phenomenon) in the 123 municipalities of Boyacá.
According to the spatiotemporal precipitation prediction maps obtained by the LSTM model, in September 2023, there will be minimal rainfall, with maximum data reaching 100 mm. From October to December, there will be low to moderate rainfall in the municipalities closest to the department's borders, not exceeding 200 mm. This trend is expected to continue until March 2024, with values ranging between 200 and 300 mm maximum. These levels will decrease from March until May, with the three months predicted to have the least rainfall for 2024, with precipitation values of 100 mm and maximums of 200 mm. In July, moderate rainfall is forecasted between 180 and 280 mm monthly, similar to the beginning of the year, and it will increase in August, which is expected to be the wettest month, ranging from 300 to 450 mm, with maximums reaching 700 mm at the department’s borders. Finally, rainfall will decrease with an average value of 170 mm per month from September to December, similar to the beginning of the year.
The impact of Boyacá's topography influences rainfall prediction, as 24% of Colombia's paramo areas are located in the department of Boyacá. Therefore, to identify mountainous areas, valleys, or plains, it is suggested to include a topography control as a variable or label for model training to improve prediction accuracy and decrease errors.
It was possible to design and implement the prediction with the windows method for the training dataset with the deep learning model LSTM-NN, which allowed making predictions of precipitation for the department of Boyacá for 16 months, corresponding to September 2023 to December 2024. These predictions are visualized in heat maps that allow the identification of monthly precipitation patterns in the region and also in box plots that, with a statistical format, fulfill the purpose of showing the minimum, maximum, and average precipitation values for each month to be analyzed. This visualization is appropriate as it can facilitate decision-making in different areas such as planning water management in the municipalities, planning the sowing of the different crops produced in the department, or mitigating drought catastrophes for the coming months.
For future work, it may be beneficial to consider combining models to reduce residual errors and increase accuracy. Additionally, including the variable altitude could be explored further, as Colombia's geography contains both mountainous and flat areas, which can significantly influence intense or low rainfall in the model. Furthermore, the results of this project enable the adaptation of this model to generate predictions for any geographical area of the country, simply by identifying the geographical area to be analyzed.5.
5. Conclusions
The evaluation of the ARIMA, Random Forest regression, and LSTM models was conducted to determine the most effective approach for precipitation forecasting. The LSTM-NN model emerged as the most accurate for predicting precipitation in Boyacá over the next 4 to 12 months, covering the period from September 2023 to August 2024. Consequently, the design and implementation of precipitation predictions using the sliding window method on the training dataset were successfully achieved with the LSTM-NN deep learning model.
The dataset used for this project was derived from the Climate Hazards Group InfraRed Precipitation with Station data (CHIRPS), which integrates infrared precipitation data with station data. This dataset, developed by the Climate Hazards Group at the University of California, Santa Barbara, was crucial for ensuring the accuracy and completeness of the predictions.
The predictions are presented through heat maps and box plots, facilitating the identification of monthly precipitation patterns in the region. These visualizations provide essential statistical information, such as minimum, maximum, and mean precipitation values for each month. This innovative data visualization and interpretation approach has enabled an effective analysis of the predictions, offering crucial insights for decision-making across various domains. These include water management planning in municipalities, scheduling crop planting cycles, and mitigating potential drought or flood catastrophes in the coming months.is section is not mandatory but can be added to the manuscript if the discussion is unusually long or complex.
Figure 1.
Probability of La Niña and El Niño (ENSO) Occurrence from 2022 to 2023 (
a) The probability of occurrence of La Niña phenomenon "ENSO” 2022 to March 2023; (
b) the probability of occurrence of El Niño "ENSO" April 2023 to October 2023. Taken from: [
8].
Figure 1.
Probability of La Niña and El Niño (ENSO) Occurrence from 2022 to 2023 (
a) The probability of occurrence of La Niña phenomenon "ENSO” 2022 to March 2023; (
b) the probability of occurrence of El Niño "ENSO" April 2023 to October 2023. Taken from: [
8].
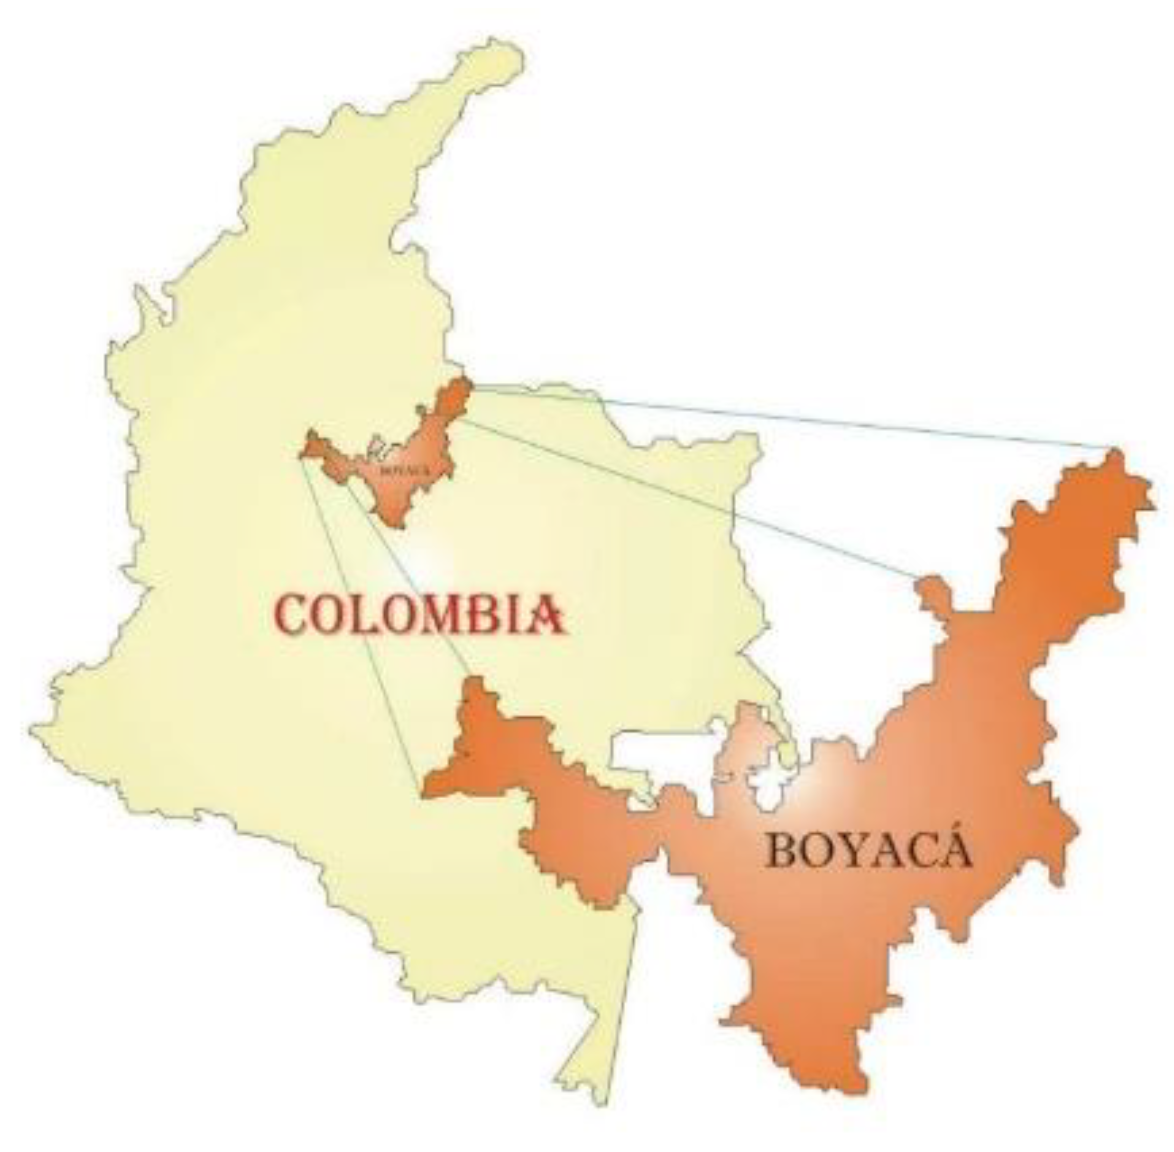
Figure 2.
Geographic location of the Boyacá department. Source: Author (2023).
Figure 2.
Geographic location of the Boyacá department. Source: Author (2023).
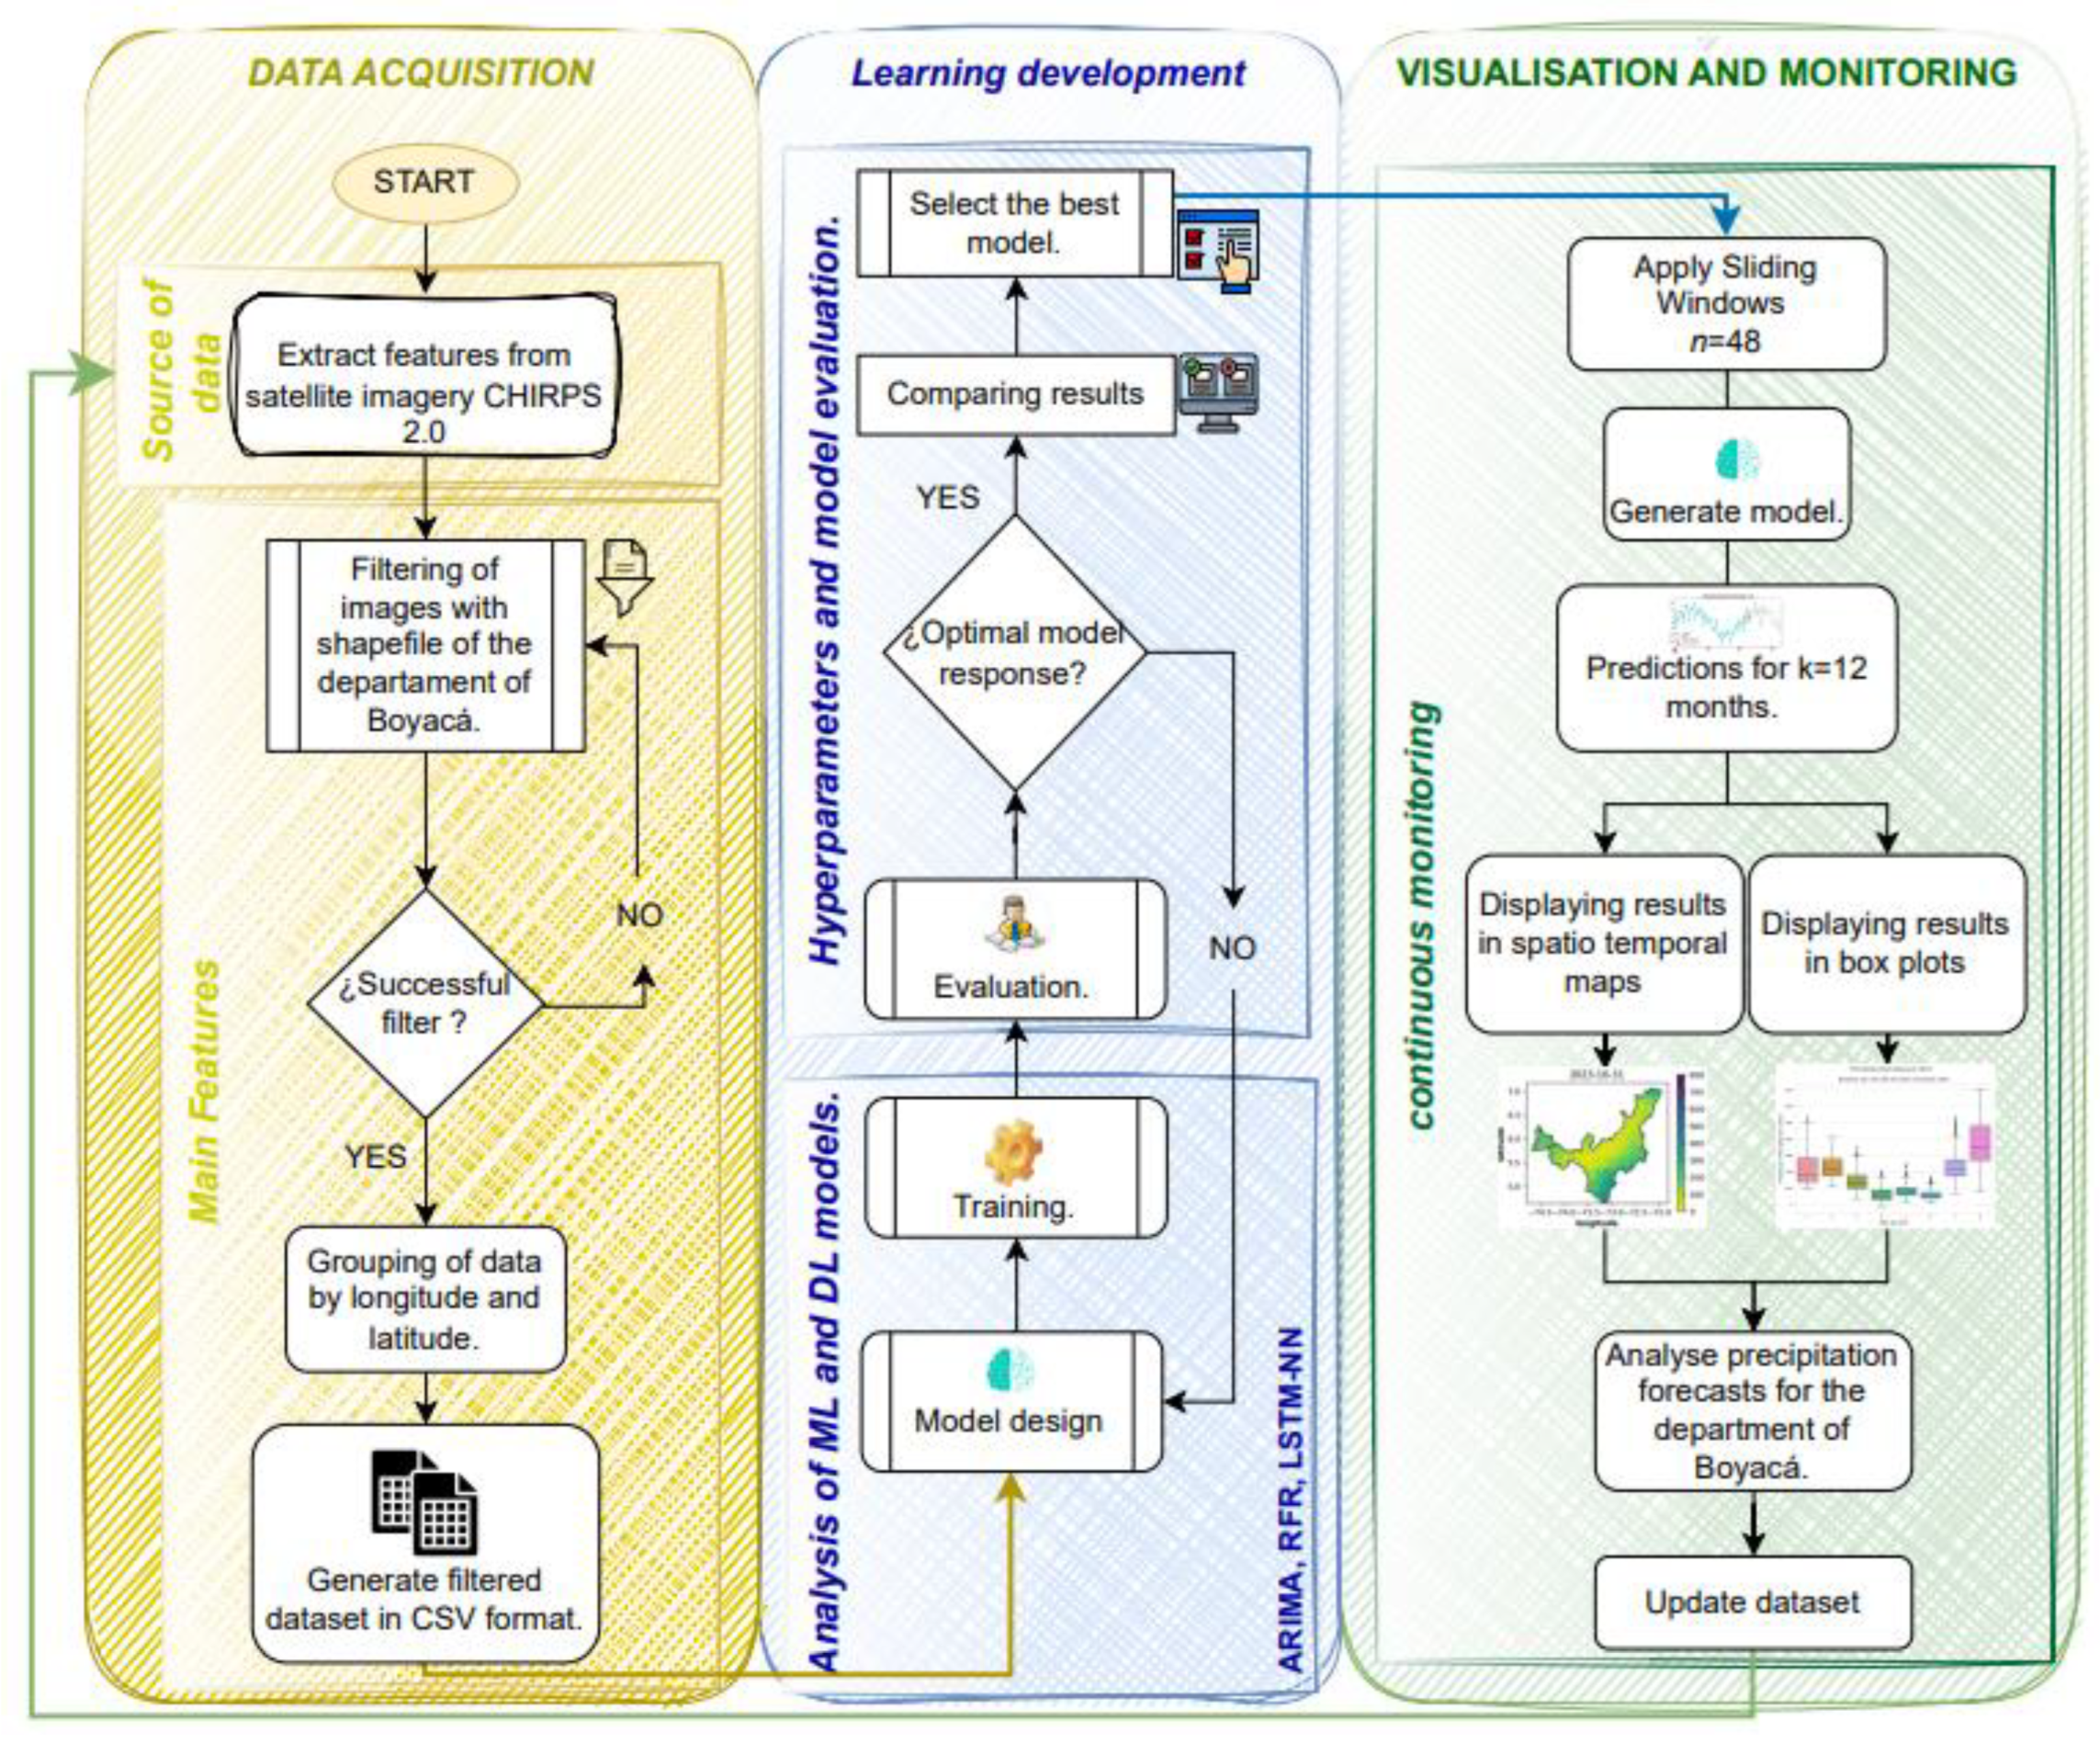
Figure 3.
Illustration of project methodology based on the ML-OPS model. Source: Author (2023).
Figure 3.
Illustration of project methodology based on the ML-OPS model. Source: Author (2023).
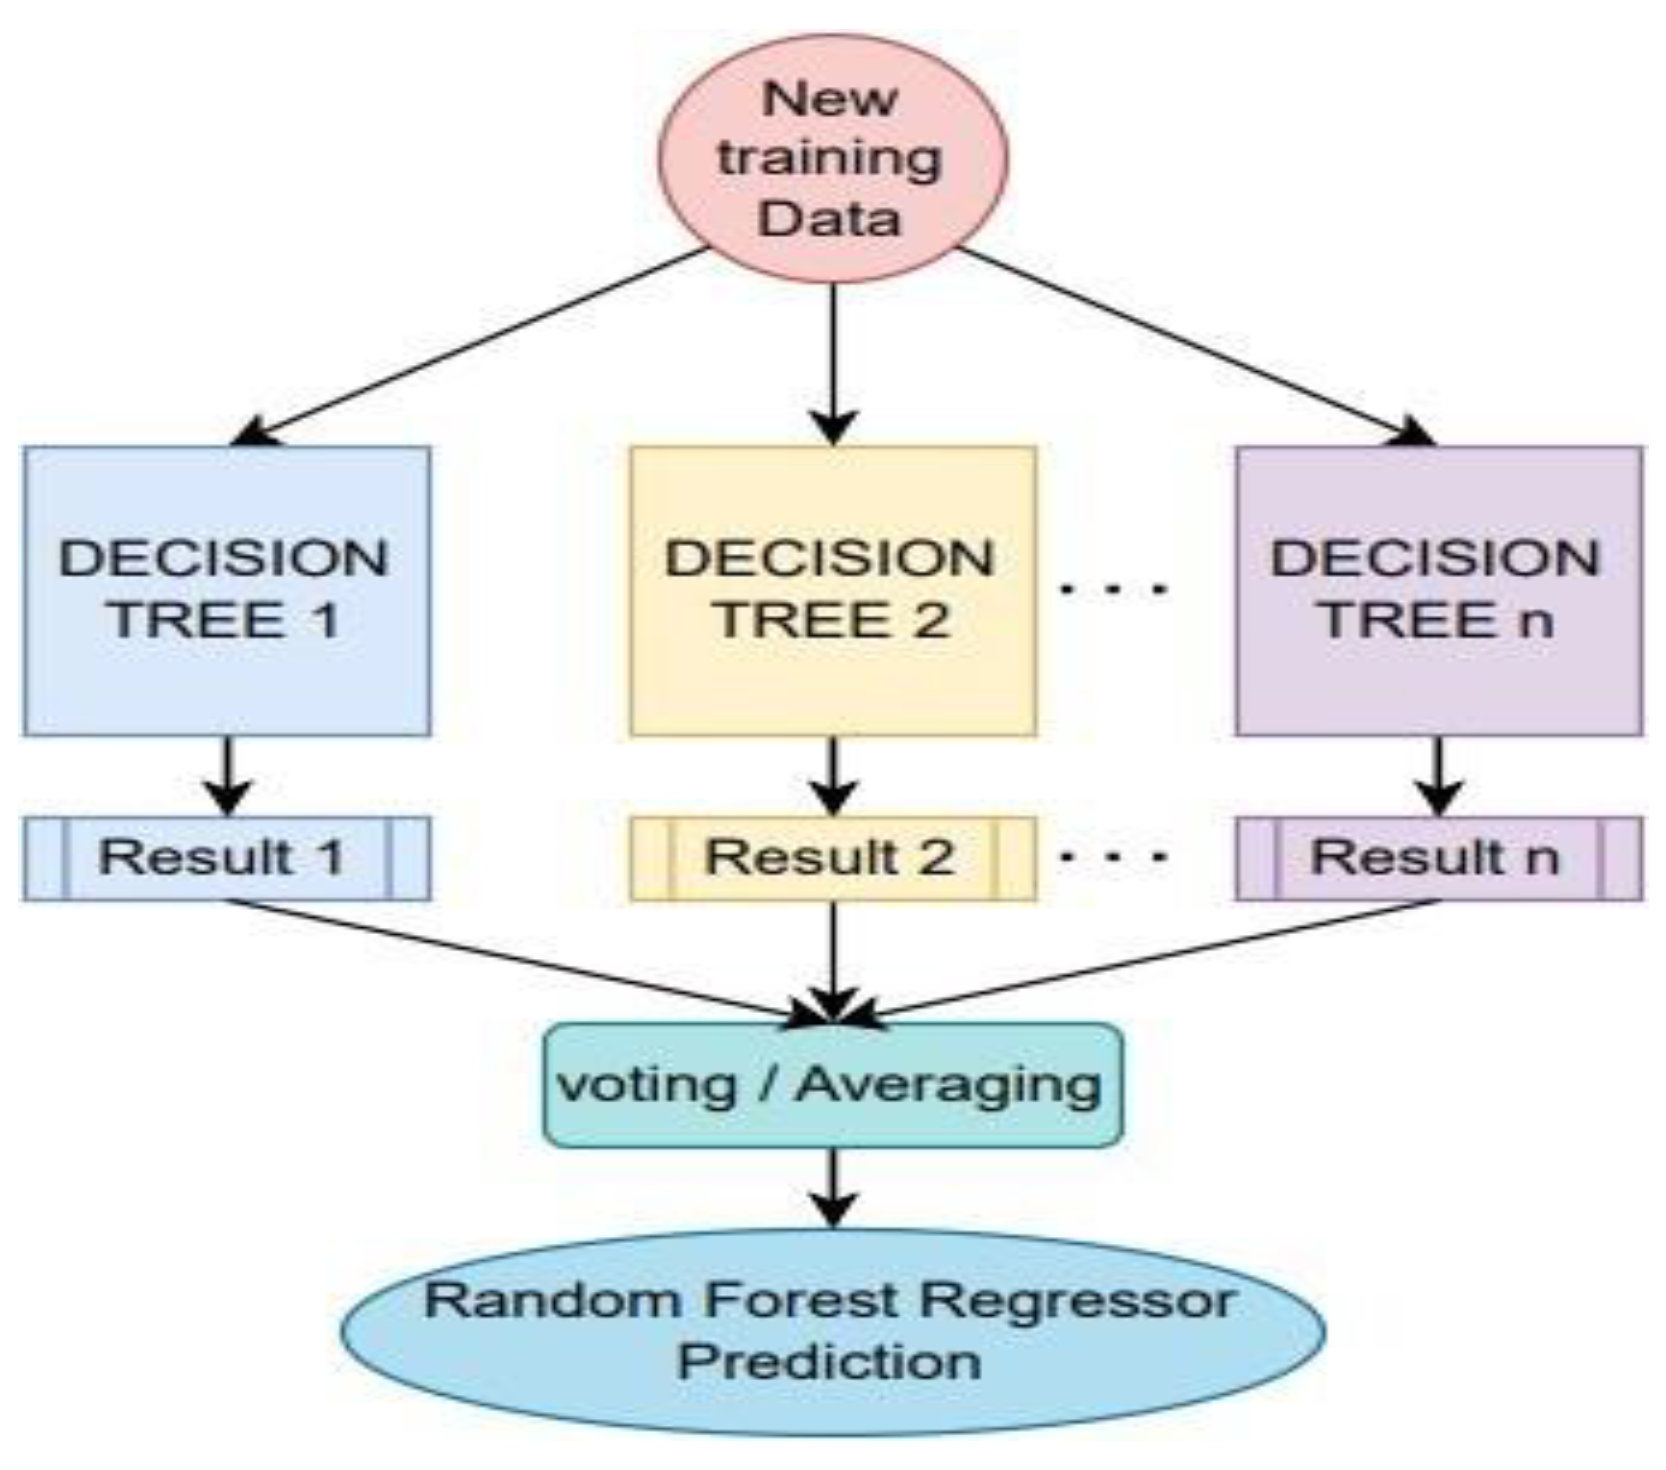
Figure 4.
Random Forest flowchart. Source: Author (2023).
Figure 4.
Random Forest flowchart. Source: Author (2023).
Figure 5.
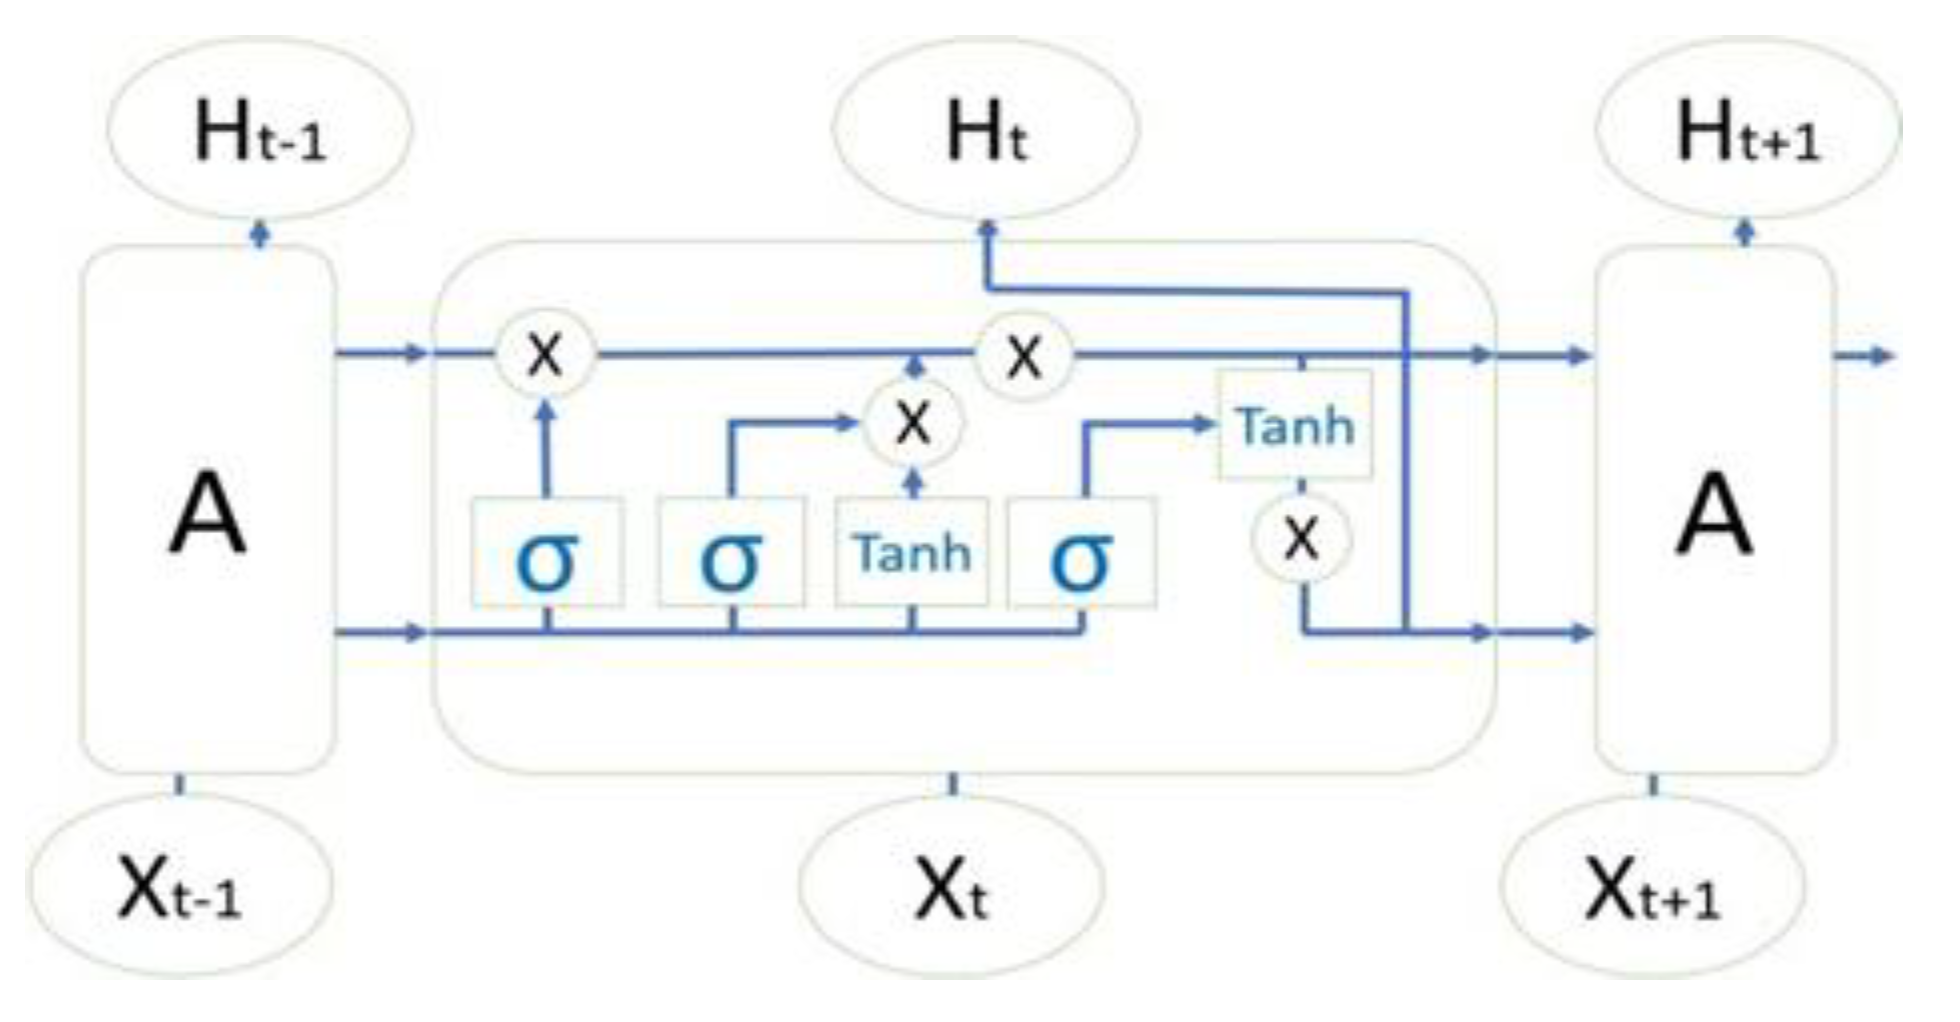
LSTM model structure [
36].
Figure 5.
LSTM model structure [
36].
Figure 6.
Monthly total precipitation dataset for Boyacá. Source: Author (2023).
Figure 6.
Monthly total precipitation dataset for Boyacá. Source: Author (2023).
Figure 7.
Spatiotemporal graphs of precipitation for the year 2022 in Boyacá. Source: Author (2023).
Figure 7.
Spatiotemporal graphs of precipitation for the year 2022 in Boyacá. Source: Author (2023).
Figure 8.
Monthly precipitation box plots for Boyacá from 2020 to 2023. Source: uthor (2023).
Figure 8.
Monthly precipitation box plots for Boyacá from 2020 to 2023. Source: uthor (2023).
Figure 9.
Simple error calculation of original vs. predicted precipitation with ARIMA model. Source: Author (2023).
Figure 9.
Simple error calculation of original vs. predicted precipitation with ARIMA model. Source: Author (2023).
Figure 10.
RMSE values between 0 and 200 trees for the RFR model. Source: Author (2023).
Figure 10.
RMSE values between 0 and 200 trees for the RFR model. Source: Author (2023).
Figure 11.
Simple error calculation of original vs. predicted precipitation with RFR model. Source: Author (2023).
Figure 11.
Simple error calculation of original vs. predicted precipitation with RFR model. Source: Author (2023).
Figure 12.
RMSE for training and testing the LSTM model. Source: Author (2023).
Figure 12.
RMSE for training and testing the LSTM model. Source: Author (2023).
Figure 13.
Calculation of simple errors of original precipitation vs. predicted precipitation with the LSTM model. Source: Author (2023).
Figure 13.
Calculation of simple errors of original precipitation vs. predicted precipitation with the LSTM model. Source: Author (2023).
Figure 14.
LSTM model training flow - n months window. Source: Author (2023).
Figure 14.
LSTM model training flow - n months window. Source: Author (2023).
Figure 15.
Process diagram of LSTM model for predicting (t+k) using n windows. Source: Author (2023).
Figure 15.
Process diagram of LSTM model for predicting (t+k) using n windows. Source: Author (2023).
Figure 16.
Visualization of 2023 forecasts in maps and box plots with a 48-month window. Source: Author (2023).
Figure 16.
Visualization of 2023 forecasts in maps and box plots with a 48-month window. Source: Author (2023).
Figure 17.
Visualization of predictions in maps and box plots for the year 2024 with a 48-month window. Source: Author (2023).
Figure 17.
Visualization of predictions in maps and box plots for the year 2024 with a 48-month window. Source: Author (2023).
Table 1.
Comparison of different training dataset methodologies, techniques, and evaluation metrics from 2021 to the present for predicting precipitation.
Table 1.
Comparison of different training dataset methodologies, techniques, and evaluation metrics from 2021 to the present for predicting precipitation.
| AUTHOR |
TECHNIQUE |
MEASURE PRECISION |
DATASET |
PLACE-TIME |
[26] |
L-CNN. |
POD, FAR, ETS, MAE, ME. |
11 polarimetric
Doppler radars that operate in C-band. |
Daily Precipitation from 2019 to 2021 in Finland. |
[27] |
ELM |
RMSE, MAE, R2, RPD. |
SPI CHIRPS 2.0
climatology project. |
12,15,18 and 24 months
rainfall from 1981 to 2019 in Eastern Tunisia
(Mediterranean). |
[28] |
MLP
and AUTO-
ENCODERS |
RMSE, MSE |
- |
Weather stations
in India. |
[29] |
LSTM and ConvNet |
RMSE |
Rainfall
Climatology
Project
Global (GPCP) |
Monthly precipitation from 1979 to 2018
globally. |
Table 2.
Evaluation metrics of the models evaluated on the test dataset.
Table 2.
Evaluation metrics of the models evaluated on the test dataset.
| MODEL |
RMSE |
MAE |
MAPE |
R2 |
| ARIMA (4,1,0) *(2,1,0,12) |
27.98 |
15.96 |
17.30 |
0.81 |
| RANDOM FOREST (regression) |
23.21 |
12.07 |
11.25 |
0.87 |
|
LSTM-NN
|
19.43 |
10.39 |
9.68 |
0.92 |
| Source: Author (2023). |
|
|
|
|
