Preprint
Article

Quantum Chemical (QC) Calculations and Linear Solvation Energy Relationships (LSER)-Hydrogen-Bonding Calculations with New QC-LSER Molecular Descriptors

Altmetrics

Downloads

89

Views

31

Comments

0

A peer-reviewed article of this preprint also exists.

This version is not peer-reviewed

Submitted:

11 July 2024

Posted:

15 July 2024

You are already at the latest version

Alerts
Abstract
A new method, based on quantum chemical calculations, is proposed for the thermodynamically consistent reformulation of QSPR-type Linear Free-Energy Relationship (LFER) models. This reformulation permits the extraction of valuable information on intermolecular interactions and its transfer in other LFER-type models, in acidity / basicity scales or even in equation-of-state models. New molecular descriptors of electrostatic interactions are derived from the distribution of molecular surface charges obtained from COSMO-type quantum chemical calculations. The widely used and very successful Abraham’s Linear Solvation Energy Relationship (LSER) model is selected as the reference LSER model for the calculations in solute – solvent systems as well as in solute self-solvation. Hydrogen-bonding free energies, enthalpies and entropies are now derived for a variety of common solutes. The capacity of the method to address the role of conformational changes in solvation quantities is discussed. The perspectives of the LSER model with the implementation of the new descriptors are also discussed.
Keywords: 
Subject: Chemistry and Materials Science  -   Physical Chemistry

1. Introduction

The new technological advances and their ever changing landscape brings up new challenging problems and opens new research horizons for efficient and insightful solutions in new material or new process designs. Current developments of modern Molecular Thermodynamics exploit the widely available high computational speed, even at the laptop level, and derive valuable information from quantum chemical calculations and molecular simulations. Quantum chemical suites at various levels are now widely and freely available. Atomistically-detailed force fields developed with information from quantum chemical calculations are extensively used allowing the computer-based reliable prediction of thermodynamic / thermophysical properties, phase equilibria or solvation quantities [1,2,3,4,5,6].
On the other hand, in numerous sectors, including the pharmaceutical and biomedical sector, the need often arises for an efficient fast solvent screening or reactant selection with specific properties. Quantitative structure – property or structure – activity relationships (QSPR / QSAR) are the preferred approach in most practical applications. One of the most successful QSPR-type approaches is Abraham’s LSER (Linear Solvation Energy Relationship) model [7,8,9,10,11] and has led, ultimately, to the valuable and freely available comprehensive and rich in thermodynamic information LSER Database [12]. Abraham’s legacy is continued by his collaborators and other developers worldwide. Bill Acree, having been one of Abraham’s closest collaborators, is conti nu ing the development and expansion of the LSER model with particular focus on solvation enthalpies [10,13,14]. The LSER model is currently one of the simplest, robust and widely used tools for thermodynamic calculations in a remarkably broad range of applications and often more successful than other more involved models [15].
The LSER model uses simple linearity equations that quantify solute transfer between two phases. These important linear relationships, in Abraham’s LSER approach, take the form of equations 1 and 2 for the equilibrium constant, KG, of solute partitioning between gas and liquid phases and for the corresponding solvation energy (enthalpy) constant, KE, respectively:
L o g K G = Δ G 12 2 , 303 R T = c g 2 + e g 2 E 1 + s g 2 S 1 + a g 2 A 1 + b g 2 B 1 + l g 2 L 1   (LSER)
and
L o g K E = Δ H 12 2 , 303 R T = c e 2 + e e 2 E 1 + s e 2 S 1 + a e 2 A 1 + b e 2 B 1 + l e 2 L 1   (LSER)
Analogous equations apply for the solute transfer / partitioning between two condensed phases. The upper-case letters in these equations indicate solute molecular LSER descriptors while the lower-case letters indicate the corresponding complementary but solvent-phase-specific LFER coefficients. The solute molecular LSER descriptors Vx, L, E, S, A, and B, are corresponding to the McGowan’s characteristic volume, the equilibrium constant for the gas–liquid partition in n-hexadecane at 298 K, the excess molar refraction, the dipolarity / polarizability, the hydro gen bonding (HB) acidity A, and hydrogen-bonding basicity B, respectively [7,8,9,10,11].
Besides the traditional solute-partitioning / transfer studies and the limited Henry’s law, the solvation free-energy, ΔG12, and its components enthalpy, ΔH12 and entropy, ΔS12, are directly connected with phase equilibrium studies involving activity or fugacity coefficients through the following most useful classical working equation:
Δ G 12 R T = Δ H 12 T Δ S 12 R T = ln φ 1 0 P 1 0 V m 2 γ 1 / 2 R T
Vm2 in Equation (3) is the molar volume of the solvent (component 2) and γ 1 / 2 is the activity coefficient of solute 1 at infinite dilution in solvent 2. P 1 0 is the vapor pressure of pure solute at temperature, T, and φ 1 0 its fugacity coefficient (typically, set equal to 1 at ambient conditions). As seen, by knowing ΔG12 and ΔH12 from the LSER equations 1 and 2, one has a direct information on γ 1 / 2 over a range of external conditions, which is crucial, among others, for phase equilibrium calculations [16,17,18]. This explains the interest of thermodynamicists, especially chemical engineers, in LSER-type models and their solvation equations.
There are, however, two main drawbacks of this otherwise very useful LSER model [7,8,9,10,11,12]. The LSER descriptors and the corresponding LFER coefficients are, typically, determined by multi linear regression of experimental data. The model expansion is, thus, restricted by the availability of experimental data. The second drawback is the thermodynamic inconsistency of the way the linear equations 1 – 2 are currently used. Although there is a sound thermodynamic basis of the LSER equations, their current use leads to peculiar results when applied to self-solvation of hydrogen-bonded solutes and very far from the expected equality of the comple mentary hydro gen-bonding interaction energies, since solute and solvent become identical on self-solvation. This problem was extensively discussed in the recent literature along with the significant advantages an eventual consistent reformulation would have [16,17,18].
New reliable experimental data on solvation or hydrogen-bonding (HB) quantities are becoming more and more scarce following the related scarcity of research groups on experimental thermodynamics worldwide. There is, in fact, an enormous amount of experimental information and calculations on these quantities already available [4,12,19,20,21,22,23,24,25,26,27,28,29,30,31,32,33,34] but, unfortunately, the scatter of data often reach very high levels, of several thermal energy (RT) units, even for well-studied systems such as water or alkanols and their mixtures. It seems also that little care for thermodynamic consistency was applied to the proposed equations and scale correlations, which seriously restricts or rather forbids the reliable exchange of information between the various compilations and scales [16,17,18]. In this respect, the decisions for use of data exclusively from ab initio or high level DFT quantum chemical calculations for the development of predictive tools of solvation quantities [6] or the correlation of exclusively their own experimental solvation data for testing new descriptors [35] appear well plausible.
Strong specific interactions, such as hydrogen-bonding or Lewis acid / base interactions are ubiquitous and very often of primordial importance in chemical and biochemical processes and systems of practical or industrial interest [20,21,22,23,24,25,36,37]. Developments of modern Molecular Thermodynamics do focus on these specific interactions of directional character. As an example, the core of one of the most advanced equation-of-state models today, the family of SAFT (statistical associating fluid thermodynamics) models [38,39,40], consists of Wertheim’s perturbation approximation of these association interactions [41]. However, the above mentioned uncertainty regarding hydrogen bonding quantities pervades also SAFT models with often very large discrepancies in reported hydrogen bonding strengths [42]. An alternative equation-of-state model [43,44,45], which handles hydrogen-bonding with the more versatile Veytsman statistics [46], was also developed and applied to numerous hydrogen-bonded systems exhibiting intermolecular, intramolecular or cooperative association, forming oligomeric associates up to three – dimensional network structures [47]. However, this NRHB (non-randomness with hydrogen-bonding) model, the SAFT models and, essentially, all similar models of current Molecular Thermodynamics require external information on hydrogen bonding interactions as well as information on conformational changes upon solvation or mixing, typically, obtained from quantum chemical calculations.
Nearly thirty years ago, Klamt has published his pioneering work on Conductor-like Screening Model for Real Solvents (COSMO-RS) [48], which became one of the central directions in the development of modern Molecular Thermodynamics. Sandler, Lin and collaborators [49,50] have further contributed in familiarizing thermodynamicists, especially chemical engineers, with quantum – chemical / COSMO – calculations. A key feature of COSMO-RS is the adoption of the simple nearest-neighbor pairwise additive interaction approach for the calculation of potential and solvation energies [48,49,50,51,52,53,54]. The combination of this approach with detailed quantum-chemical information on the distribution of molecular charge densities has turned COSMO-RS into a powerful a-priori predictive and popular tool in Molecular Thermodynamics, especially, in solute solvation / partitioning calculations [55,56]. Due to the structure of the model, calculation of the separate hydrogen-bonding contribution to the solvation free energy cannot be made but the corresponding contribution to the solvation enthalpy can be made. Thus, COSMO-RS may be used as a predictive tool for this contribution and compared with the corresponding LSER contribution. Above all, however, COSMO-RS may be used for a well based development and expansion of a consistent LSER-type model, not only for solvent screening applications but also as a reliable source of information on intermolecular interactions and conformational changes needed in activity-coefficient or equation-of-state models [18].
Thus, the main task of the present work is to explore the potential of using COSMO-RS for the development of simple enough but thermodynamically consistent linear solvation energy relationships. These simple equations will be used to correlate experimental solvation data from recent compilations and extract their hydrogen bonding information. For this purpose, new molecular descriptors will be derived in the next section based on the molecular charge-density distributions or sigma-profiles of the COSMO-RS model [48,49,50,51,52,53,54]. The new linear relationships will be tested against experimental solvation data, including self-solvation data, and compared with LSER calculations [12,13,14] and, of course, COSMO-RS estimations [57]. The significance and perspectives of these calculations will be critically discussed.

2. The New Quantum-Chemistry Based LSER (QC-LSER) Molecular Descriptors

In Abraham’s LSER approach only the molecular descriptors V1 and E1 are well defined by the molecular structure and the refractivity of the solute [7,8,9,10,11,12]. The descriptors S1, A1, B1, although attributed a more or less clear physical meaning, are determined, in essence, via global optimization of data correlations or error minimization in the prediction of various solute / solvent properties in a variety of solvents. Thus, our first task in this work is to derive new molecular descriptors obtained solely from the molecular structure of the solute and the COSMO-based molecular surface charge distributions or sigma-profiles [48,49,50,51,52,53,54,57], which could replace the LSER descriptors S, A, B. This is not a novel idea. Abraham, Klamt et al. [58] have already used the moments of the σ-profiles (cosmoments) in order to derive expressions for the LSER descriptors. These cosmoments are used extensively in the literature for the calculation of numerous quantities in a variety of applications [51]. More recently, Dohnal [35] has also used the σ-profiles and derived new molecular descriptors. However, in none of these applications the concern was the consi stent reformulation of the linear relationships that would permit the extraction of reliable information on intermolecular interactions. This is what will be attempted in this and the next sections.
From its very definition, a sigma-profile (σ-profile) is the distribution of probabilities Pi = Ai /A to find a surface charge density σi on the (COSMO solvation / screening) cavity of the studied molecule [51]. The sum of the partial surface areas Ai (not to be confused with the LSER descriptor Ai) gives the total surface area, A, of the molecular cavity, while the sum of the partial charges σiAi gives the total charge of the molecule or ion. Figure 1 is an example of a sigma-profile.
Klamt has derived from the σ-profile AX(σ) of a solute X, a number of molecular descriptors or cosmoments MiX of type i, defined by the integral A X σ f i σ d σ , for various functional forms fi(σ) [51]. Dohnal’s hydrogen-bonding descriptors are derived by setting fi(σ) = σi integrating in the hydrogen-bonding ranges of the charge density, σ .and using the “centroid” concept [35].
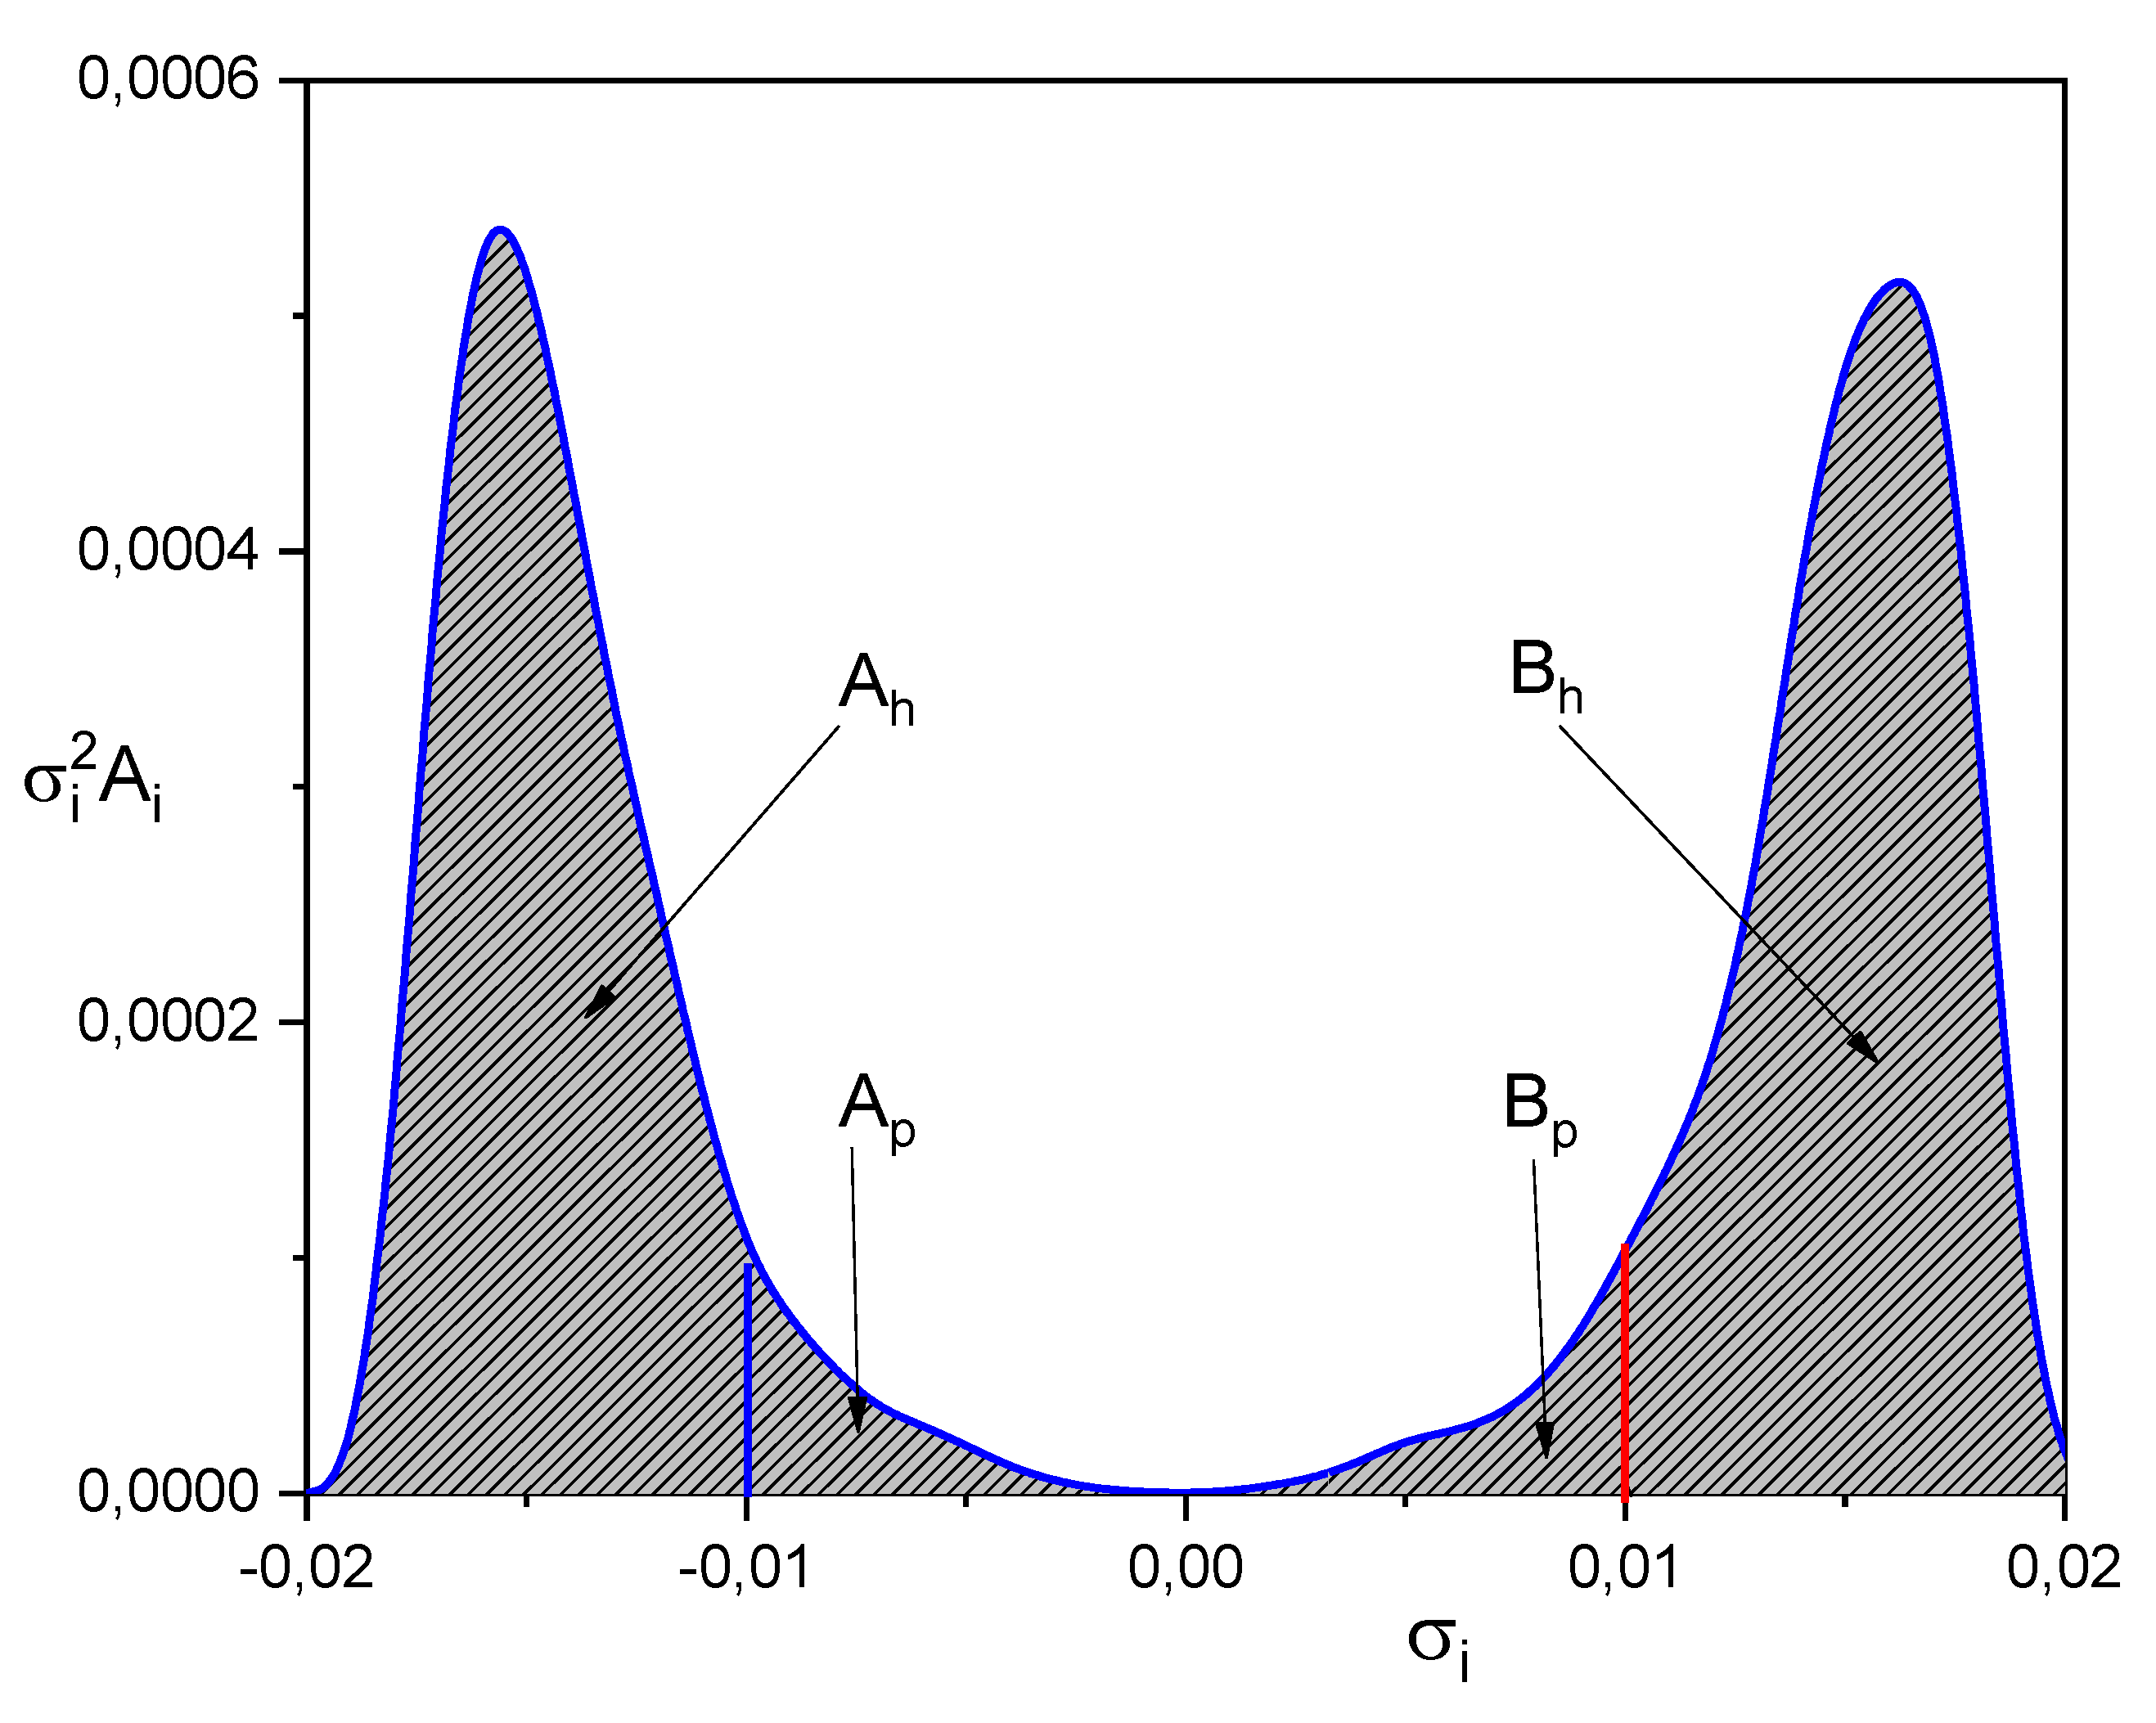
Of interest to us is the derivation of descriptors reflecting the strength of intermolecular forces or interactions. A proper handling of the σ-profiles could give us information on these forces of electrostatic character. In this respect, the product of the surface charge density σi by the charge σiAi or the product σi2Ai (being charge by charge over unit area, with units C2m-2) appears more appropriate for reflecting an electrostatic force. Such a distribution function turns Figure 1 into Figure 2. A key difference of the two distributions is in the central dome above zero charge density, which becomes a valley in Figure 2 touching the ground zero of electrostatic interactions.
According to Klamt’s suggestion [51], charge densities to the left of the blue line in Figure 2 correspond to acidic or donor sites able to participate in strong specific or hydrogen-bonding interactions (HBD sites). Similarly, charge densities to the right of the red line in Figure 2 correspond to basic or acceptor (HBA) sites. The molecular sites with charge densities between the two lines interact with much weaker forces, primarily, dispersion / induction forces. Of course, they may also interact with sites beyond the two cutoff lines when the latter are not involved in hydrogen bonding interactions. Thus, interactions due to polarizability do not exclusively involve sites from the two central sub-sections of Figure 2. Representative distributions for other molecules are reported in Figures S1 and S2 in the Supplementary Information (SI) file.
The two cutoff lines and the zero charge density divide the total area under the distribution curve of Figure 2 in four sub-areas, two to the left towards the acidic sites and two to the right towards the basic sites. The areas pertaining to hydrogen bonding sites are marked by the subscript h (Ah the HBD sites and Bh the HBA sites). The two central “polarizability” sub-areas are marked by the subscript p (Ap the sites to the left with screening charge sign negative (as acidic ones) and Bp the sites towards the basic sites of positive screening charge sign). The four new QC-LSER descriptors are just the areas of these four sub-sections in Figure 2 and they may be obtained from simple integration as follows (the factor 106 accounts for the units of σ and A in σ-profiles):
A h = 10 6 1 A i σ i 2 d σ i
A p = 10 6 1 0 A i σ i 2 d σ i
B p = 10 6 0 1 A i σ i 2 d σ i
B h = 10 6 1 A i σ i 2 d σ i
σ- Profiles are available, free of charge, for thousands of molecules in the open literature, as an example in ref. [50]. They may, of course, be obtained also by using appropriate quantum-chemical calculation suites, such as the TURBOMOLE, DMol3 of BIOVIA’s MATERIALS STUDIO suite, or the SCM suite [59,60,61]. In this work, the σ-profiles from COSMObase [57] at the DFT / TZPVD-Fine level of quantum chemical calculations are used and the corresponding QC- LSER descriptors for common solutes are reported in Table 1.
The descriptors Ah and Bh are considered reflecting the HBD and the HBA capacity, respectively, of the molecule. They are the analogues of the A and B descriptors of the Abraham LSER model [7,8,9,10,11,12]. The descriptors Ap and Bp do not have direct analogues in the Abraham’s LSER model. Abraham’s polarity / polarizability descriptor, S, is much different from descriptors Ap and Bp. Dipole or quadrupole moments and dipolar interactions cannot be extracted from σ-profiles since there is no information in them on the spatial (3D) charge distribution. Conformer distribution provides with valuable information but not direct polarity information. Yet, σ-profiles may provide with valu able information for the electrostatic interactions between sites of the Ah or Bh subareas with the Bp or Ap subareas of Figure 2. In fact, COSMO-RS model has very successfully used this information via the “misfit” energy contribution to the potential energy [48,49,50,51,52,53,54]. Following this idea, the sum AhBp + BhAp could be considered a substitute to the LSER S descriptor. This sum is considered to reflect the intermediate between hydrogen-bonding and dispersion-interaction contributions to solvation energy, that is, to play the role the polarity/ polarizability interactions are playing in the Abraham’s LSER model. It is in this sense that the descriptors Ap and Bp are used in this series of works not as measures of the actual polarizability of the molecule.
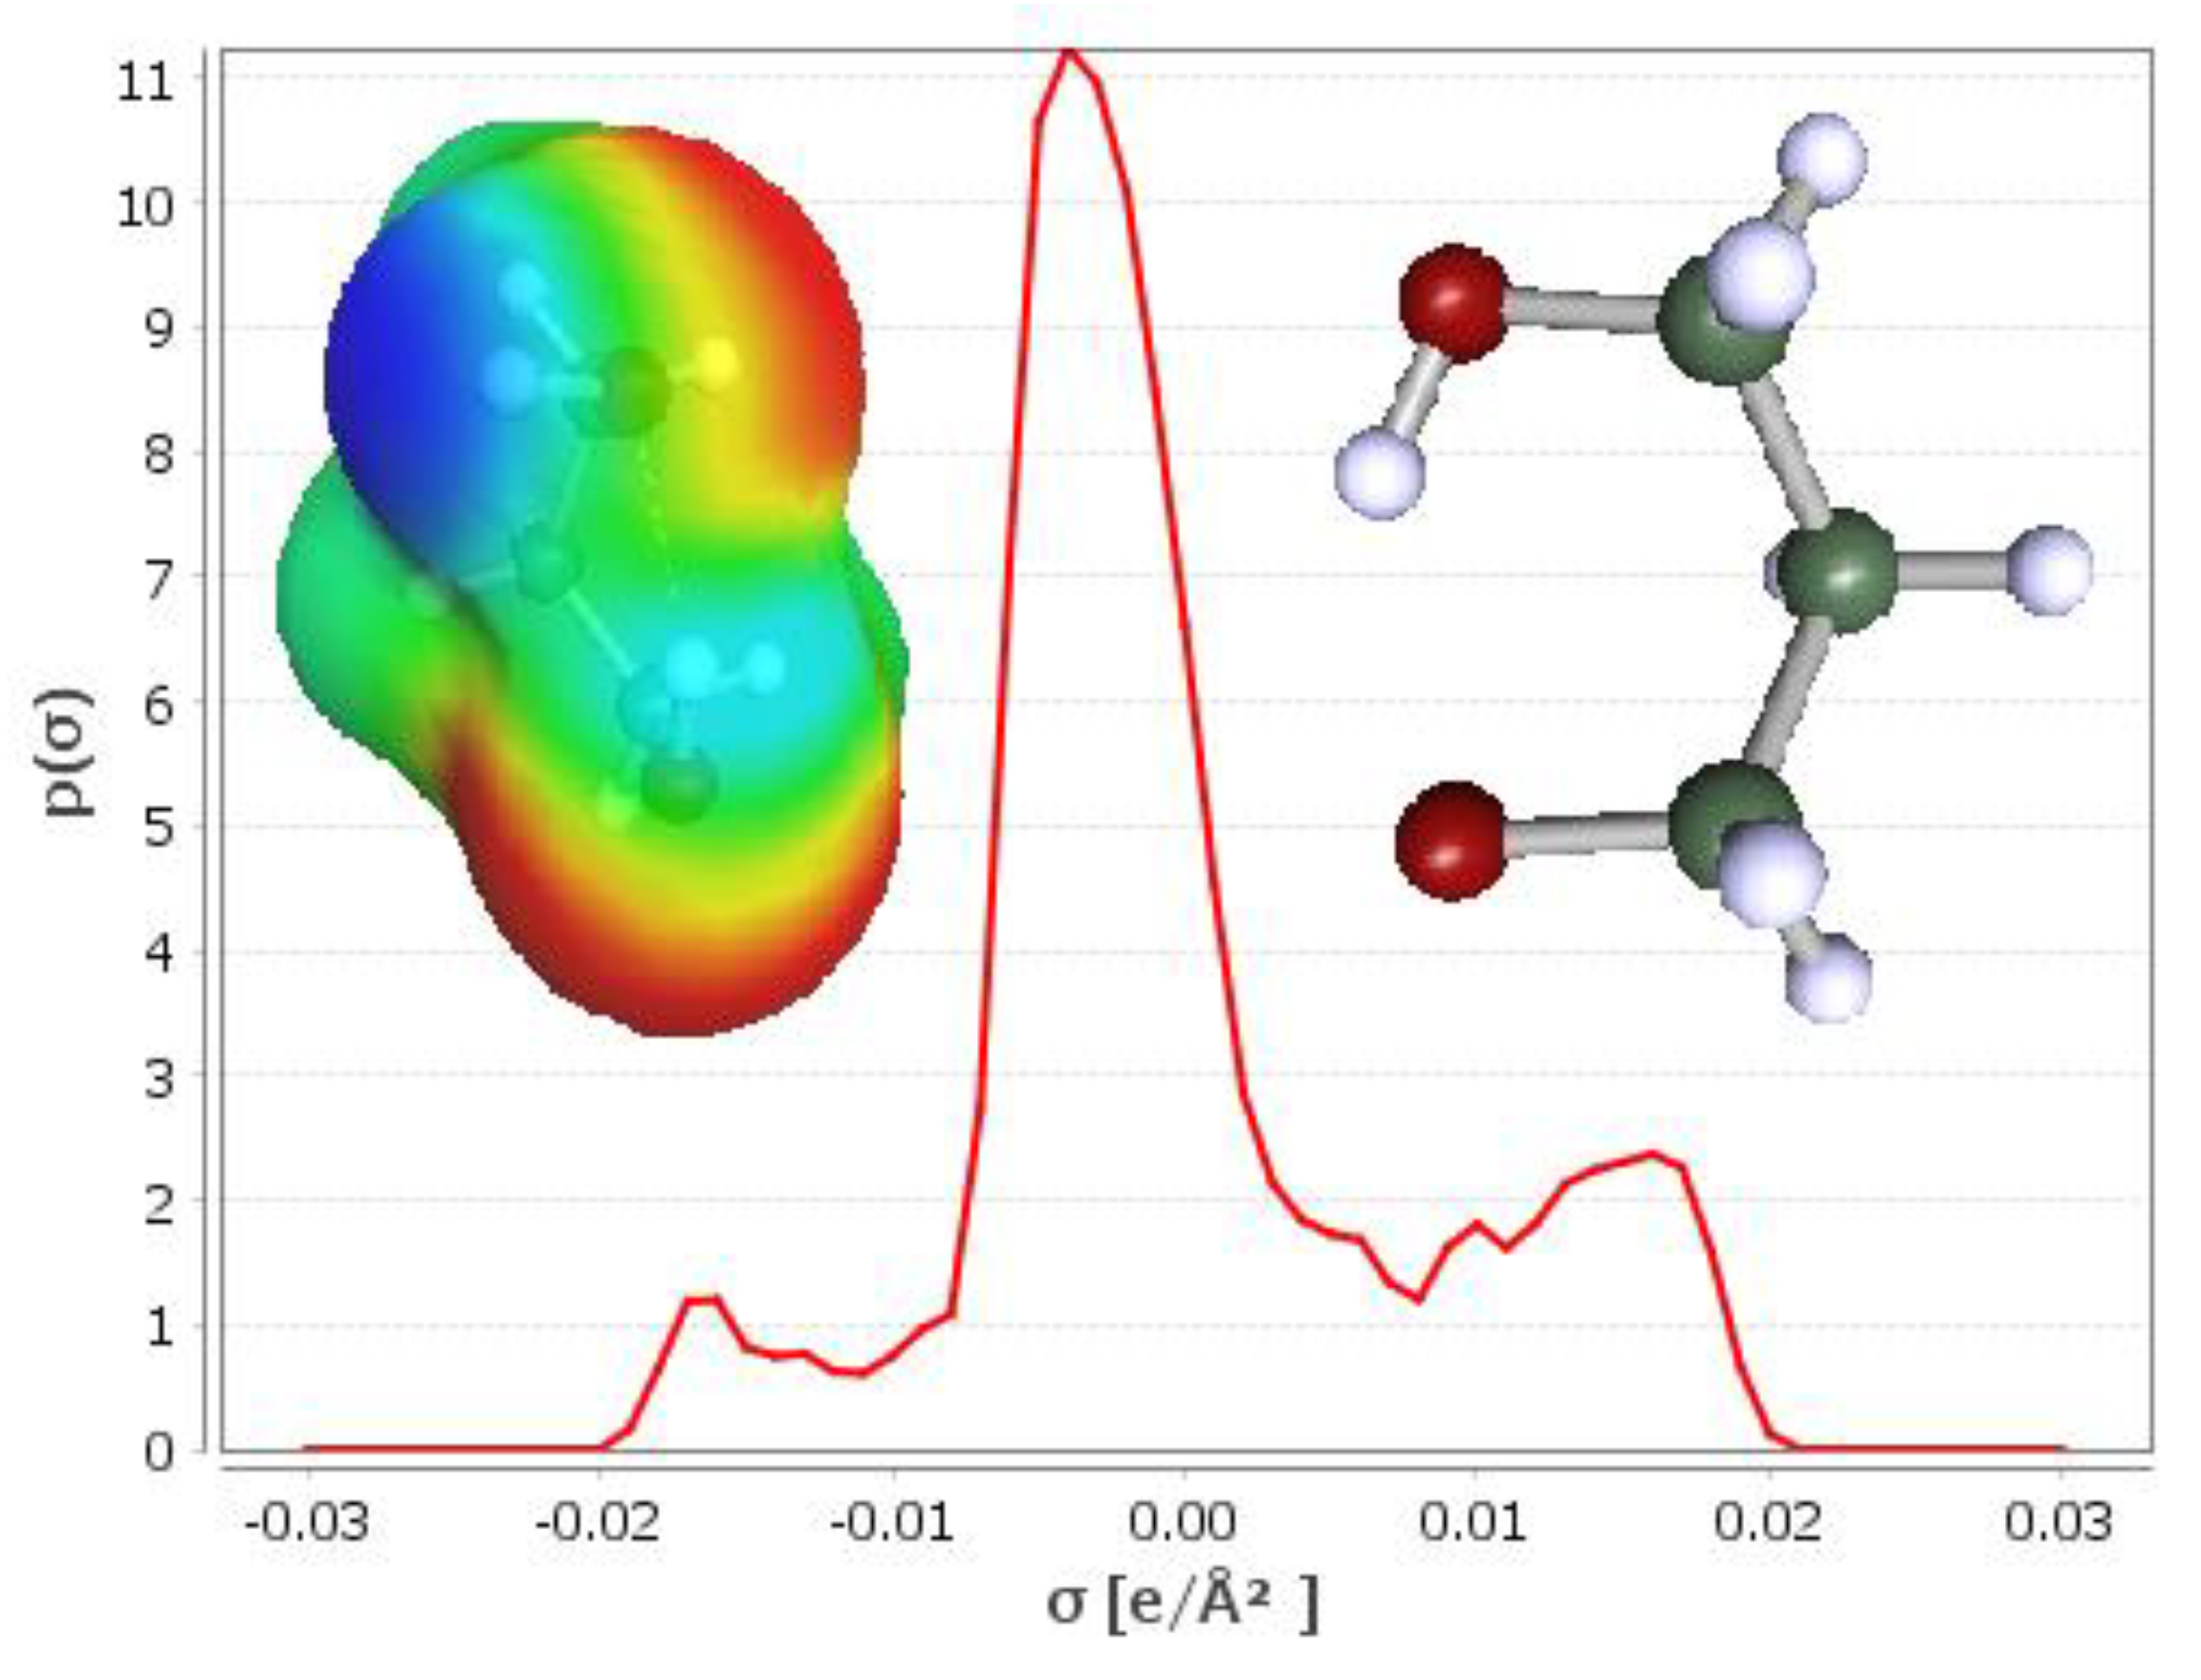
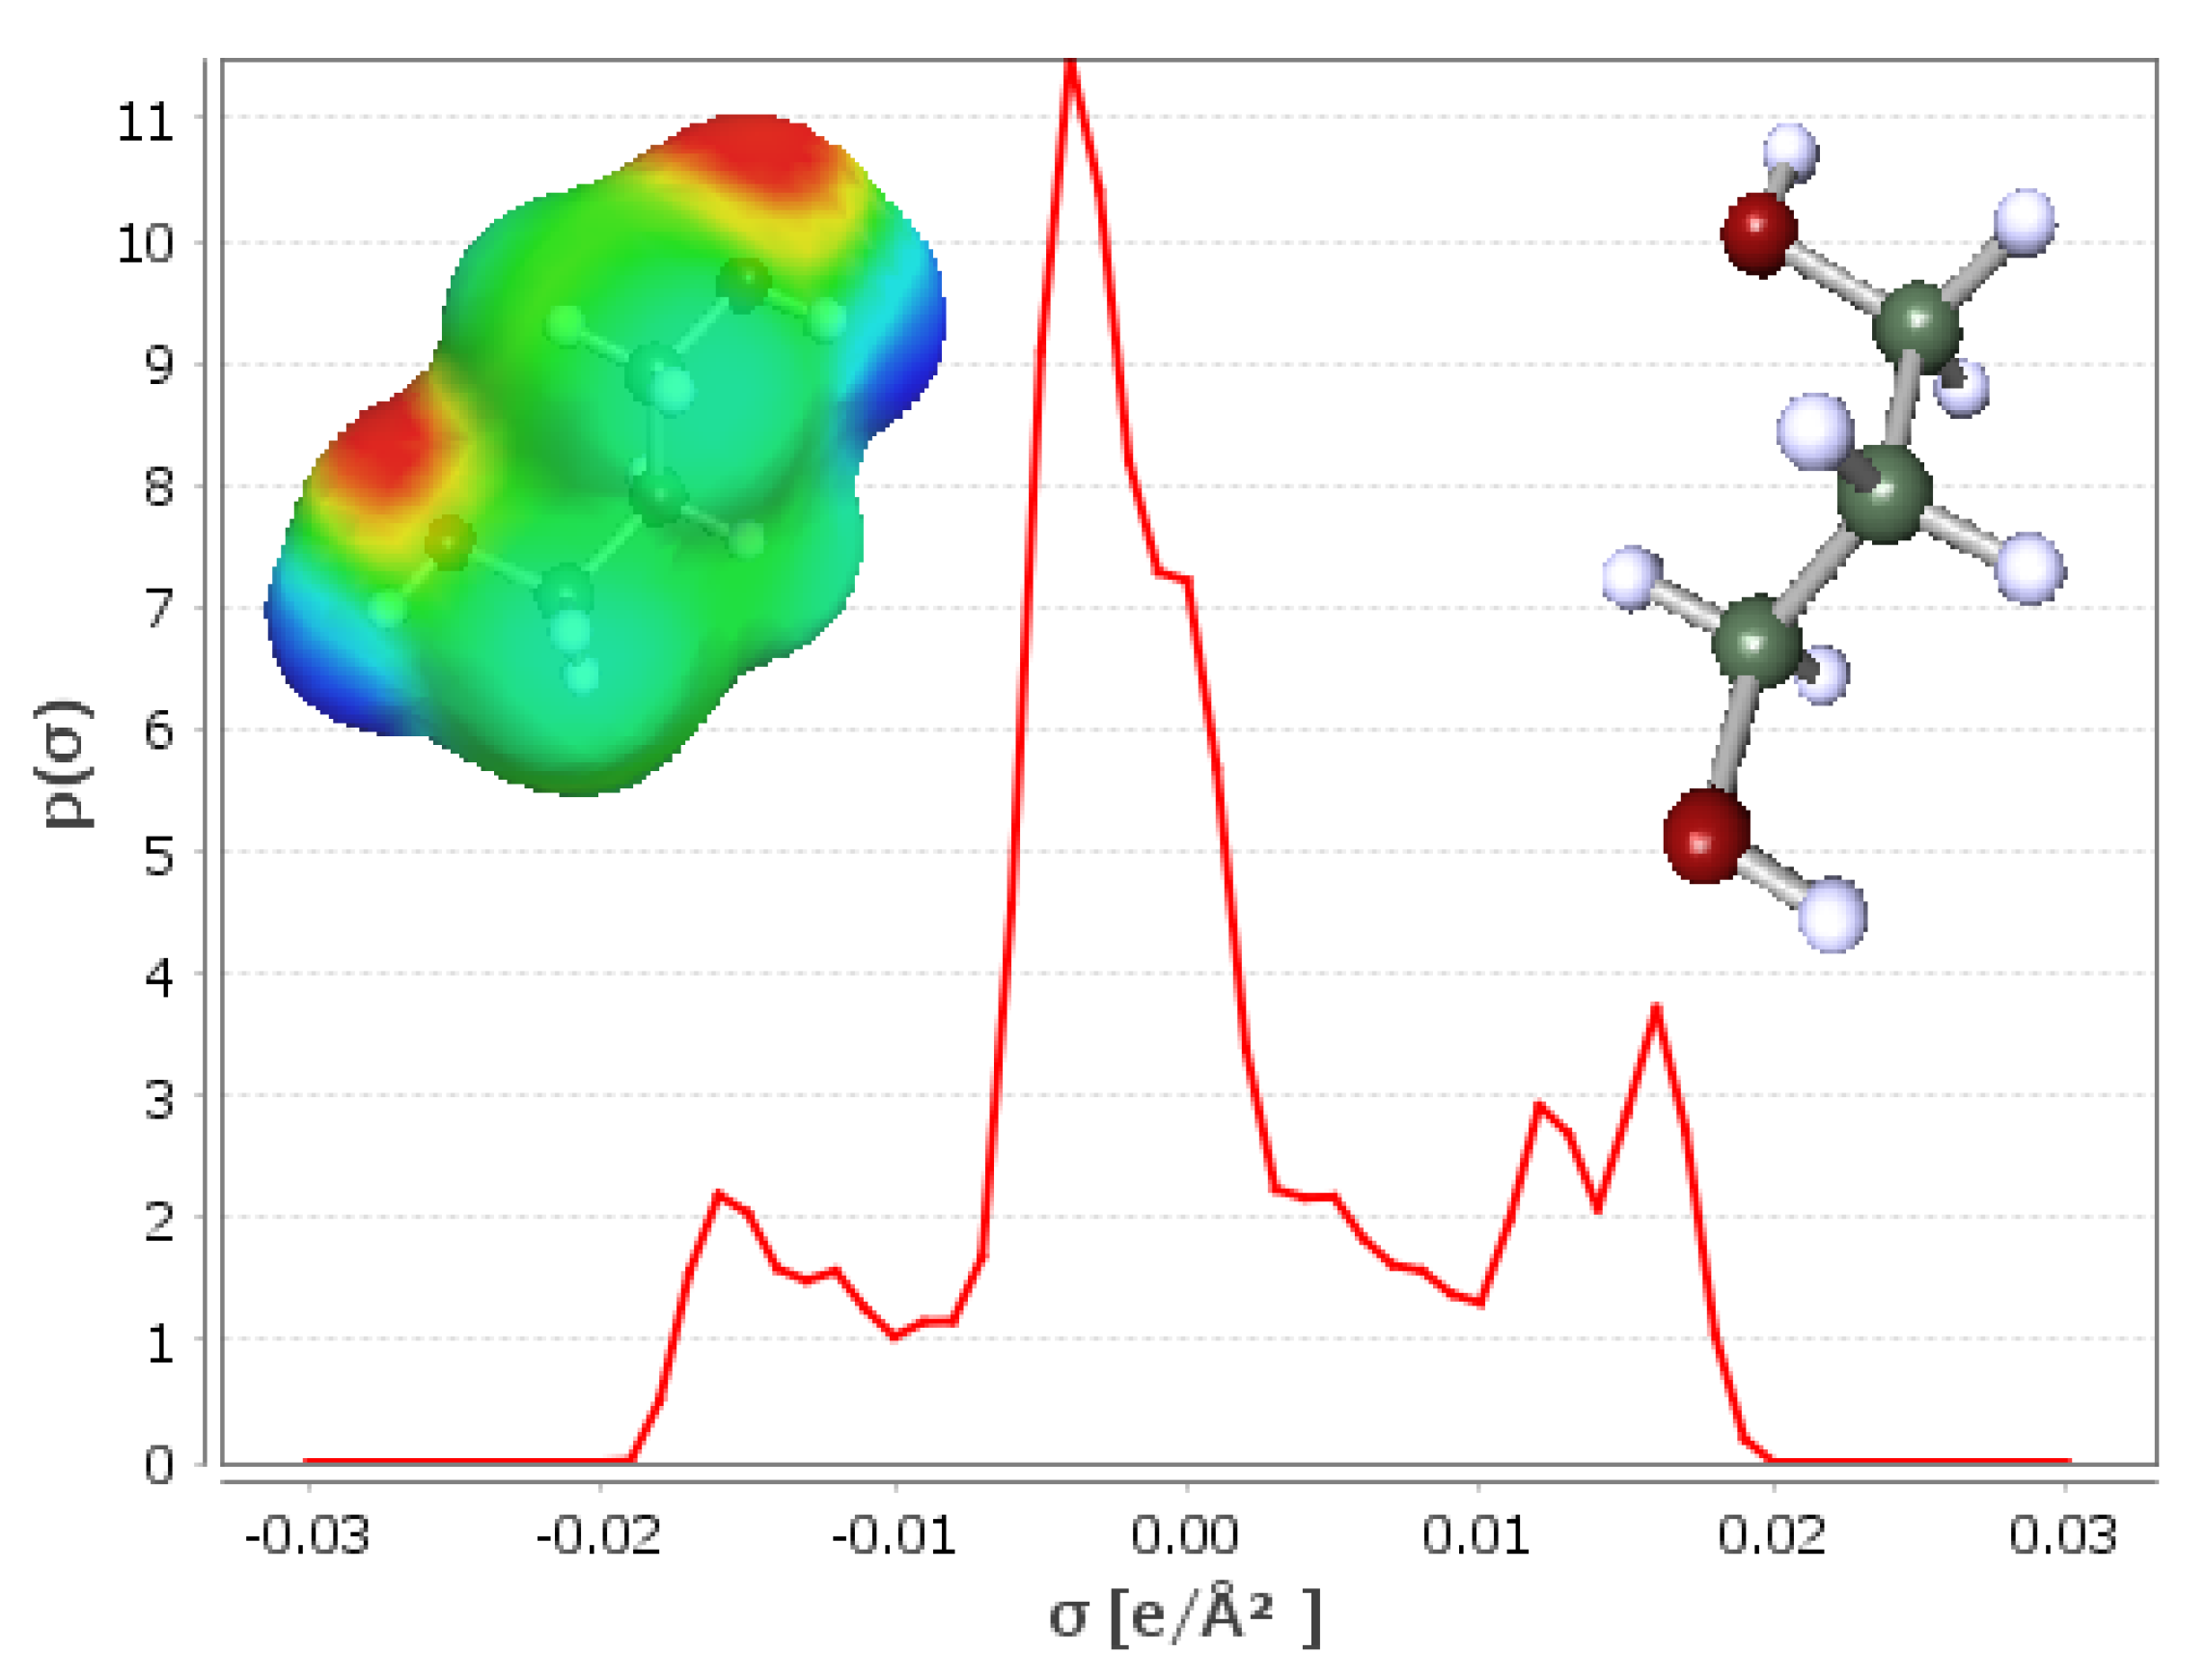
An important advantage of the new QC-LSER descriptors of Table 1 over the Abraham’s LSER descriptors is their capacity to account for conformational changes of the solute upon transfer to the solvent. As seen in Table 1, two conformers are reported for ethylene glycol, 2-methoxy etha nol and 1,3-propylene glycol and 3 conformers for 2-ethoxyethanol (many more conformers are reported in ref. [57]). The σ-profiles and sigma-surfaces of these conformers are shown in Figure 3 and in the Supplementary Information (SI) file. As shown in Figure 3, the conformer c0 of 1,3-propylene glycol has a significantly reduced HBD capacity compared to conformer c3 (acidity peaks on the left-hand side of σ-profiles). Conformer c0 is hydrogen-bonded intra-molecularly and, thus, the proton donor is not much available for intermolecular association.
In Table 1 are also reported the conformational energies of the less stable conformers, namely, their excess energy over the stable conformer c0. As shown also in the SI file, the c0 conformers favor intramolecular association while the less stable expose much more their hydrogen-bonding sites and favor intermolecular association. In the case of 2-ethoxyethanol, both conformers c1 and c9 favor intermolecular hydrogen-bonding. However, the conformational energy of conformer c9 is much higher than that of conformer c1 and this will diminish the gain from hydrogen-bonding. Most likely, then, conformer c1 will be a more favorable structure of 2-ethoxyethanol for intermolecular hydrogen-bonding We will come back to these conformers in a later section.
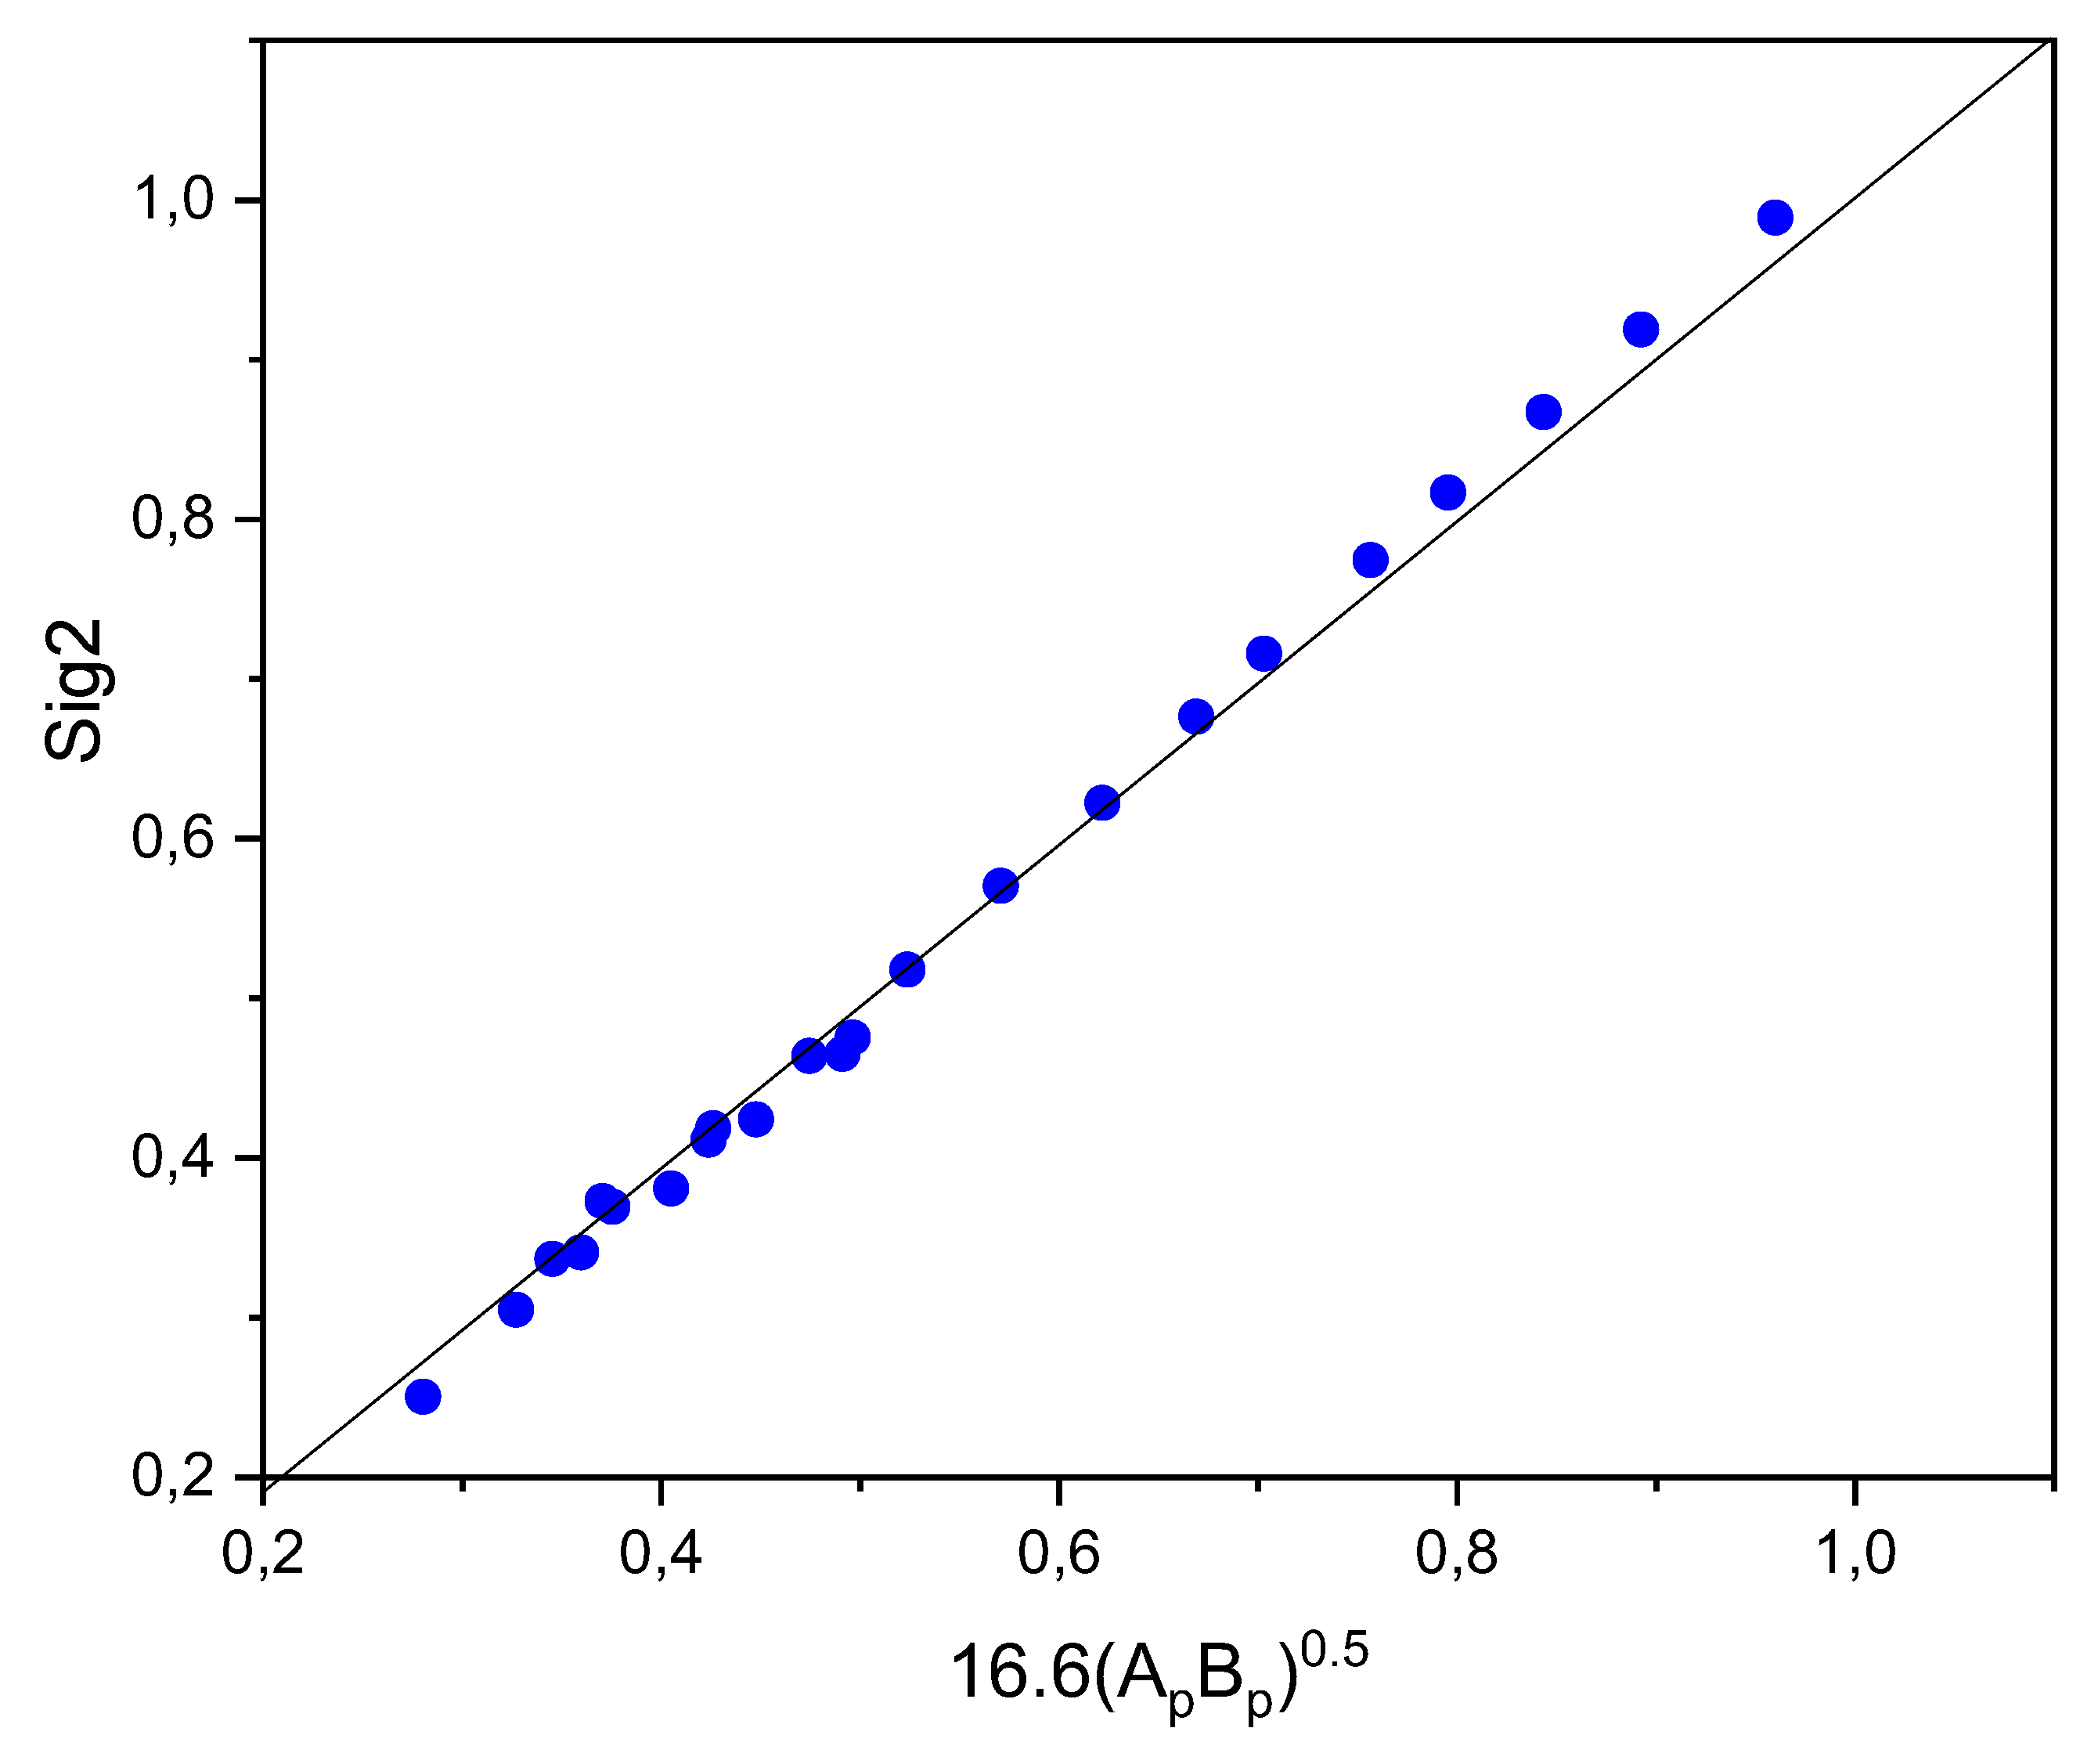
Before using these new QC-LSER descriptors for calculations in real systems, it is worth comparing them with corresponding descriptors in the literature. As mentioned already, Klamt has proposed various cosmoments of the σ-profiles as molecular descriptors [51]. In Figure 4 are compared the cosmoment sig2 [51,57] with the square root of the product of the two QC-LSER polarizability descriptors of alkanes. As shown, the ratio of the two is nearly constant as both seem to be nearly proportional to the molecular size.
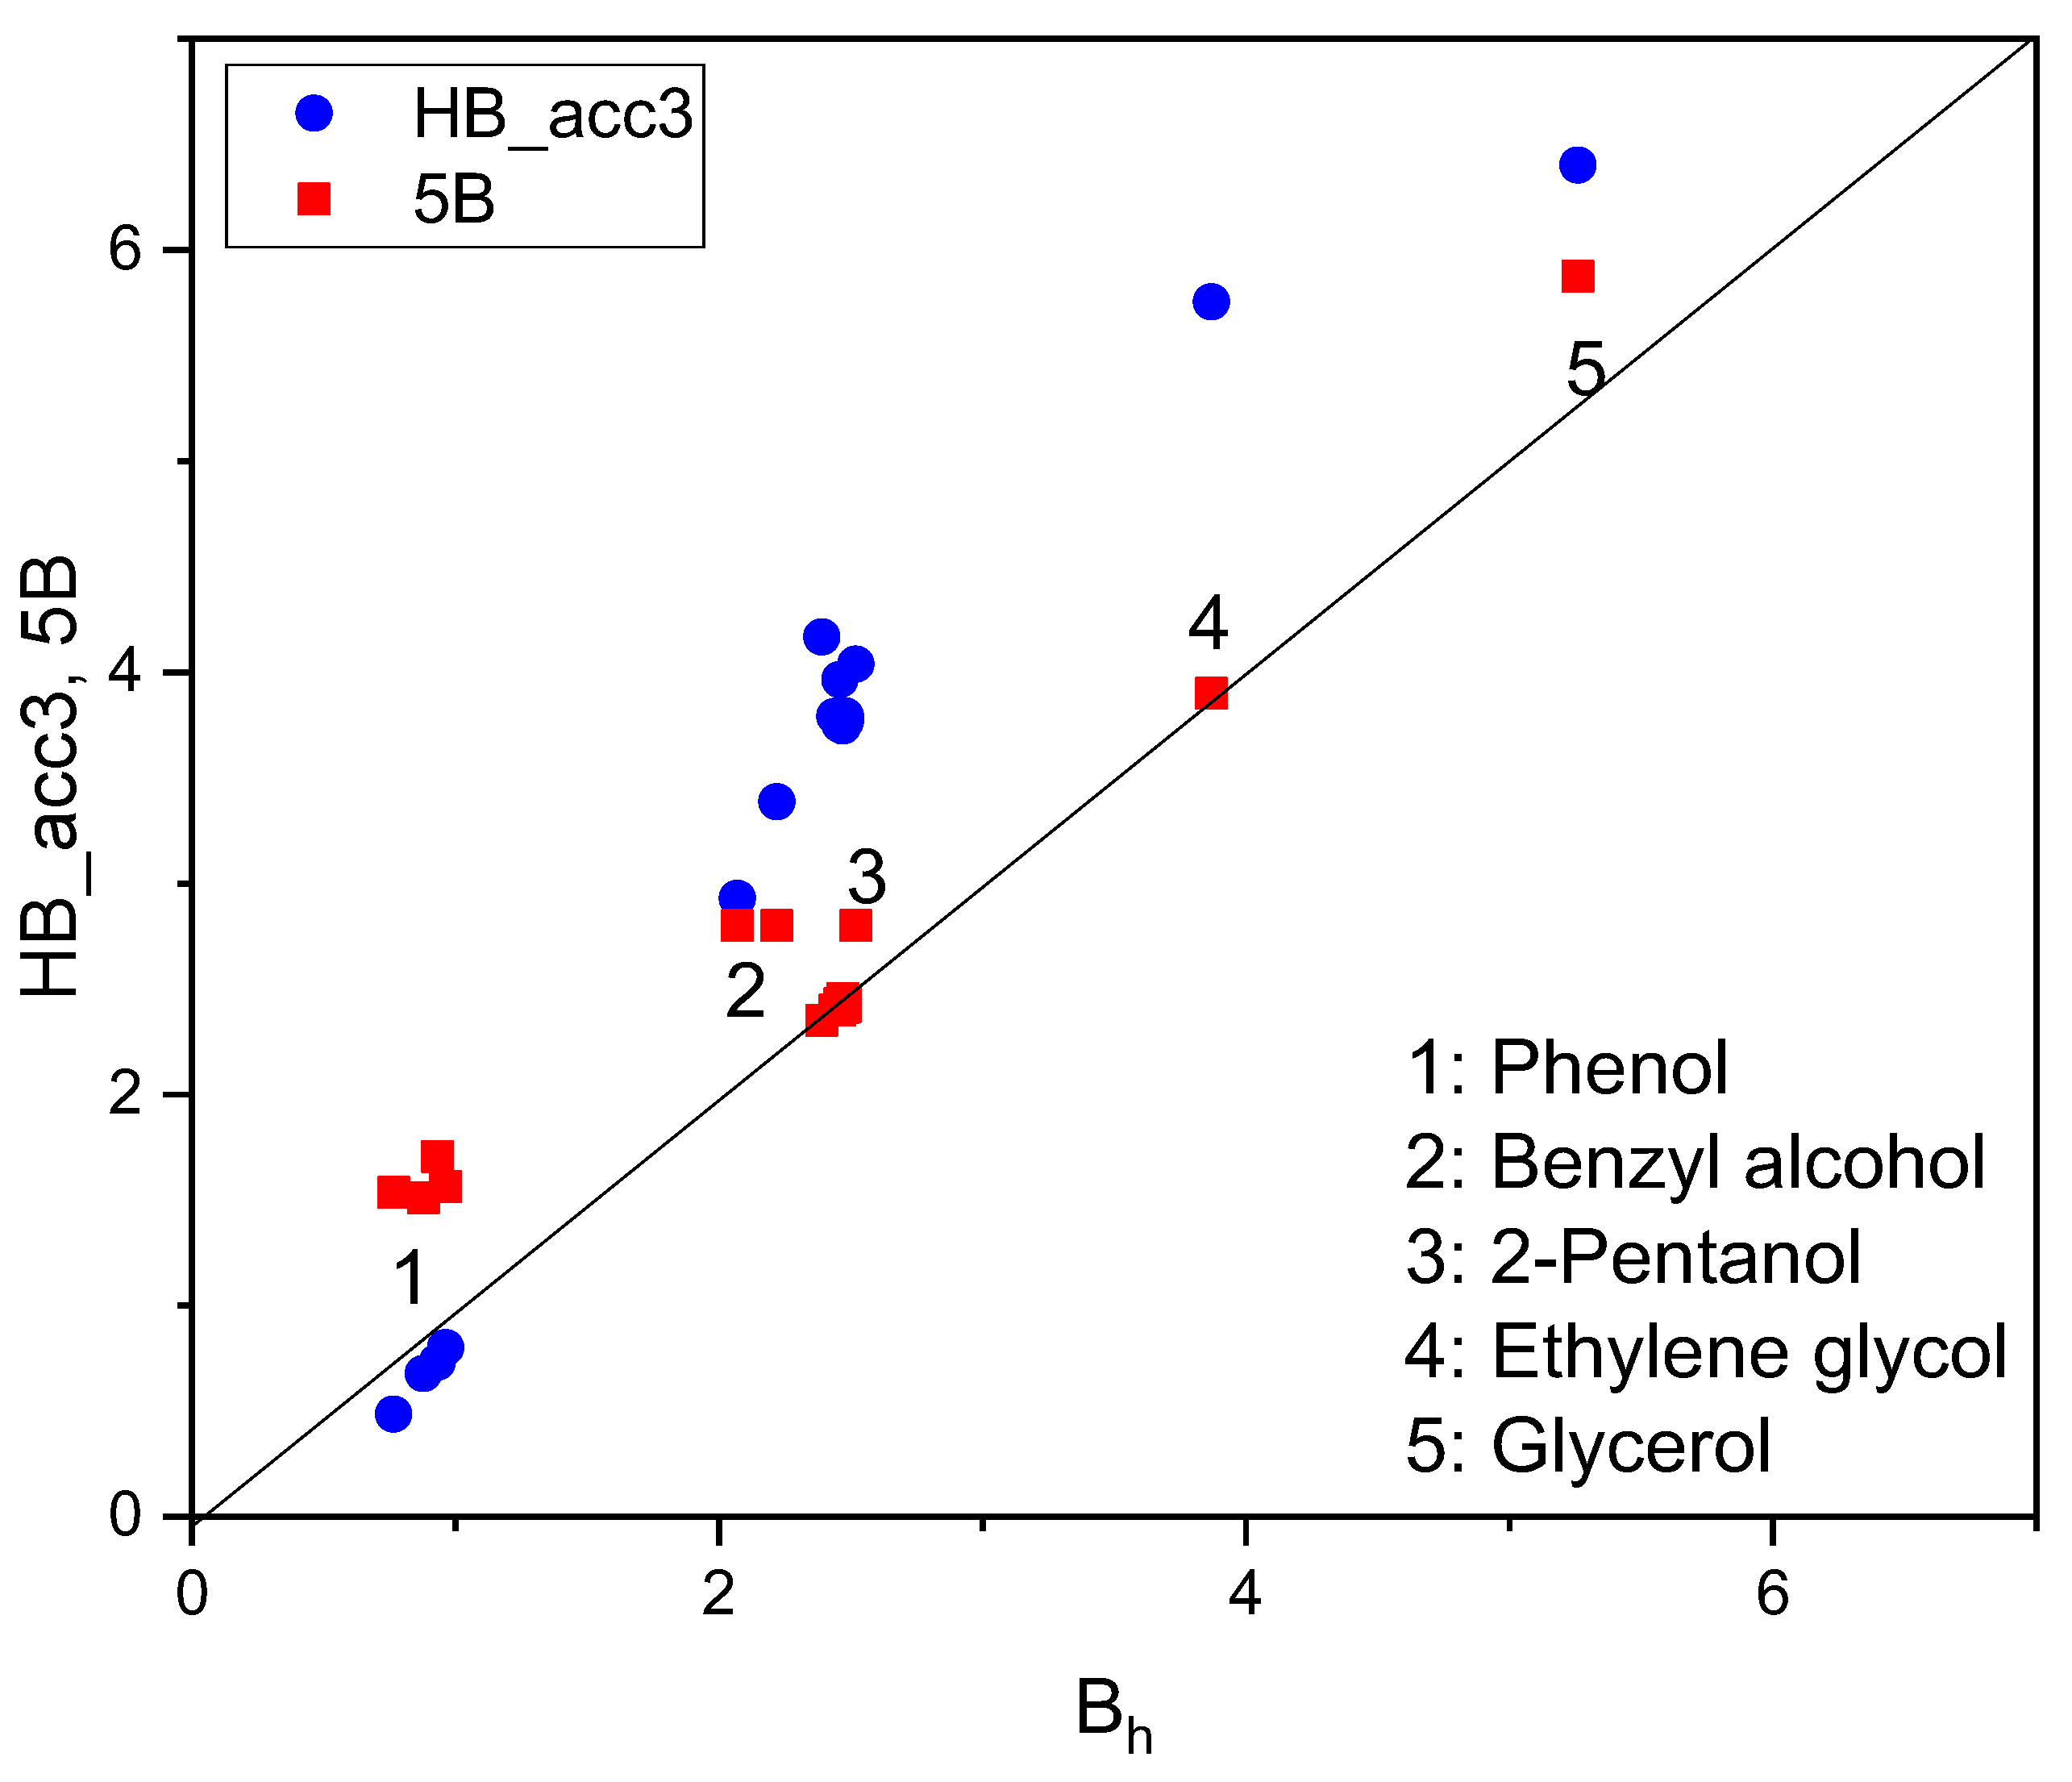
The third - order hydrogen-bonding cosmoments [51] are often considered in the literature as adequate hydrogen-bonding descriptors [14,15]. In Figure 5, the new hydrogen-bonding descrι ptors Bh are compared with the corresponding B LSER descriptor [12] and the cosmoment HB_acc3 [57] for a number of common hydrogen-bonded hydroxyl (OH-) containing solutes. As shown, although the descriptors are not equal, their trends are rather similar. A corresponding graph with the HBD descriptors shows even more scatter and, thus, each set of descriptors reflects the hydrogen-bonding interaction capacity of the molecules in its own way. More information on the new QC-LSER descriptors is reported in the SI file.

3. Linear Solvation Energy Relationships with the New QC-LSER Descriptors

Hydrogen bonding and strong polar interactions belong to the so called “complementary” interactions in the sense that a donor site interacts with an acceptor site (not with a “similar” donor site), a positively charged site with a negatively charged one or a basic with an acidic one. When two different molecules 1 and 2 having, both, donor and acceptor sites interact, two types of intermo lecular hydrogen bonds form, namely, one HBD1 X HBA2 and one HBA1 X HBD2. The strength of these two bonds are considered here to be proportional to the complementary products Ah1Bh2 and Bh1Ah2, respectively. This is in conformity with the thermodynamic basis of linearity of all these LSER – type models [16,17,18]. The form, then, of thermodynamically consistent linear relationships for the enthalpy of solvation of solute 1 by solvent 2 cannot be arbitrary and, in the limit of self-solvation, the sum of the above two products should be equal to 2Ah1Bh1 = 2Ah2Bh2 since solute and solvent become identical on self-solvation (subscript 2 becomes subscript 1). This is guaranteed by the following simple expression for the hydrogen-bonding term of the linearity equation:
H B t e r m = c h 12 A h 1 B h 2 + B h 1 A h 2
where, ch12 is a characteristic constant of the 1 – 2 pair.
In a similar manner, the contribution of the intermediate “polarity / polarizability” interactions is considered to be given by the expression:
P o l a r t e r m = c p 12 A h 1 B p 2 + B h 1 A p 2 + c p 12 A h 2 B p 1 + B h 2 A p 1
where, cp12 is a characteristic constant of the 1 – 2 pair. In conformity, however, with the main stream of relevant linear relationships in the literature, the polar contribution is not activated when the solute is non-polar. In this way, the solute must possess at least one hydrogen bonding site and only the first of the two terms on the right-hand side of equation (9) must be kept. We will further expand on these two alternative views in a forthcoming publication.
As mentioned above, one of the deficiencies of the sigma profiles is the fact that they do not quite reflect the shape or the three – dimensional character of the molecule. The contribution to solvation energy of the dispersion interactions are affected by this 3D character and, thus, in this series of works the polarizability descriptors are not used for the estimation of dispersion interactions except for a rather minor correction. Instead, the well-defined and easily obtained Abraham’s descriptors V and E for the McGowan volume and the excess refractivity, respectively, will be used for the dispersion - induction interactions with the following simple expression:
D i s p e r s i o n t e r m = c v V 1 α + c e E 1 + c 2
where, cv, ce and α are (expected to be) universal constants and c2 is a characteristic constant of solvent 2. The sum of the above three terms gives the solvation enthalpy, ΔH12, of the 1 – 2 pair of molecules. Thus, the logarithm of the solvation enthalpy (energy) constant, KE, is given by the following working equation:
L o g K E = c 2 + c v V 1 α + c e E 1 + c p 12 A h 1 B p 2 + B h 1 A p 2 + c h 12 A h 1 B h 2 + B h 1 A h 2
or a similar equation containing both terms on the right-hand-side of equation 9. It is this form of equation 9 which will facilitate the direct use of LSER descriptors V and E and, also, will facilitate the direct comparison of the new molecular descriptors with the corresponding Abraham’s LSER descriptors.
In addition to the above sum, the solvation free energy, ΔG12, will require a solvation – entropy contribution, ΔS12, so that at any temperature, T, the left-hand side of equation 3 will hold true. In order to facilitate comparison and handle solvation entropy data, the final working equation of the present linear solvation energy relationship is cast in direct analogy with Abraham’s LSER model in the following form:
L o g K G = Δ G 12 2.303 R T = Δ H 12 2.303 R T + Δ S 12 2.303 R = L o g K H L o g K S
LogKG may be cast also in a form similar to equation 11 but the coefficients cannot be arbitrary since always equation 12 should be valid. When adopting the LSER equations 1 – 2, thermodynamic consistency implies that the following equation should hold true:
L o g K S = c e 2 c g 2 + e e 2 e g 2 E 1 + s e 2 s g 2 S 1 + a e 2 a g 2 A 1 + b e 2 b g 2 B 1 + l e 2 l g 2 L 1   (LSER)

4. Applications

As mentioned already, one of the main tasks of this work is the extraction of information on hydrogen-bonding quantities from the corresponding solvation quantities. COSMO-RS [57] gives information on hydrogen-bonding enthalpy but no information on hydrogen-bonding free-energy or entropy. Thus, this section is divided in two parts. The focus in the first part is on self-solvation calculations in a variety of common solutes and the extraction of hydrogen-bonding quantities of self-associated solutes. The focus on the second part is on the extraction of consistent hydrogen-bonding energies in representative mixtures including aqueous systems. The calculations make extensive use of relevant experimental data on solvation quantities from the CompSol compilation [19] and COSMO-RS estimations [57].

4.1. Self-Solvation Calculations

The CompSol database [19] contains information on self-solvation free-energy, enthalpy and entropy for a number of common solutes and has systematically used the thermodynamic equation 3. This is a very useful information for model developments and verification of calculations. In order to directly apply the equations of the previous section, the experimental data are, first, transformed into their logarithmic equivalents (Log10) as is the practice of Abraham’s LSER [7,8,9,10,11,12] model (cf. eqs. 1–2]. In order to recover solvation free-energies and enthalpies in kJ/mol units, one has to multiply LogKG and LogKE by the transformation factor -2.303RT/1000 = -5.71 kJ/mol. Similarly, the solvation entropy in JK-1mol-1 is recovered by multiplying LogKS by the transformation factor -2.303R = -19.15 JK-1mol-1.
For the calculation of these self-solvation quantities, we must, first, determine the constants and coefficients in equations 10 and 11. On the basis of equation 12, if we will be able to calculate the logarithms for energy (enthalpy) and entropy, the logarithm of self-solvation free energy will be obtained by simple subtraction. On the other hand, since there are plenty of experimental data on heats of vaporization (the negative of self-solvation energy) it would be useful to focus also on one of the other two quantities (their logarithms) and, by subtraction, get also the third quantity.
In order to simplify things, we will start with the solvation quantities of normal alkanes. For alkanes only the dispersion – induction term will contribute to the solvation energy since there are no polarity or hydrogen-bonding interactions present. As mentioned above, the general dispersion – induction term is considered here to be given by equation 10. Since, by definition, the excess refractivity E is equal to zero for alkanes, their working equation will be:
L o g K E = c v V 1 α + c 1   (n-alkanes)
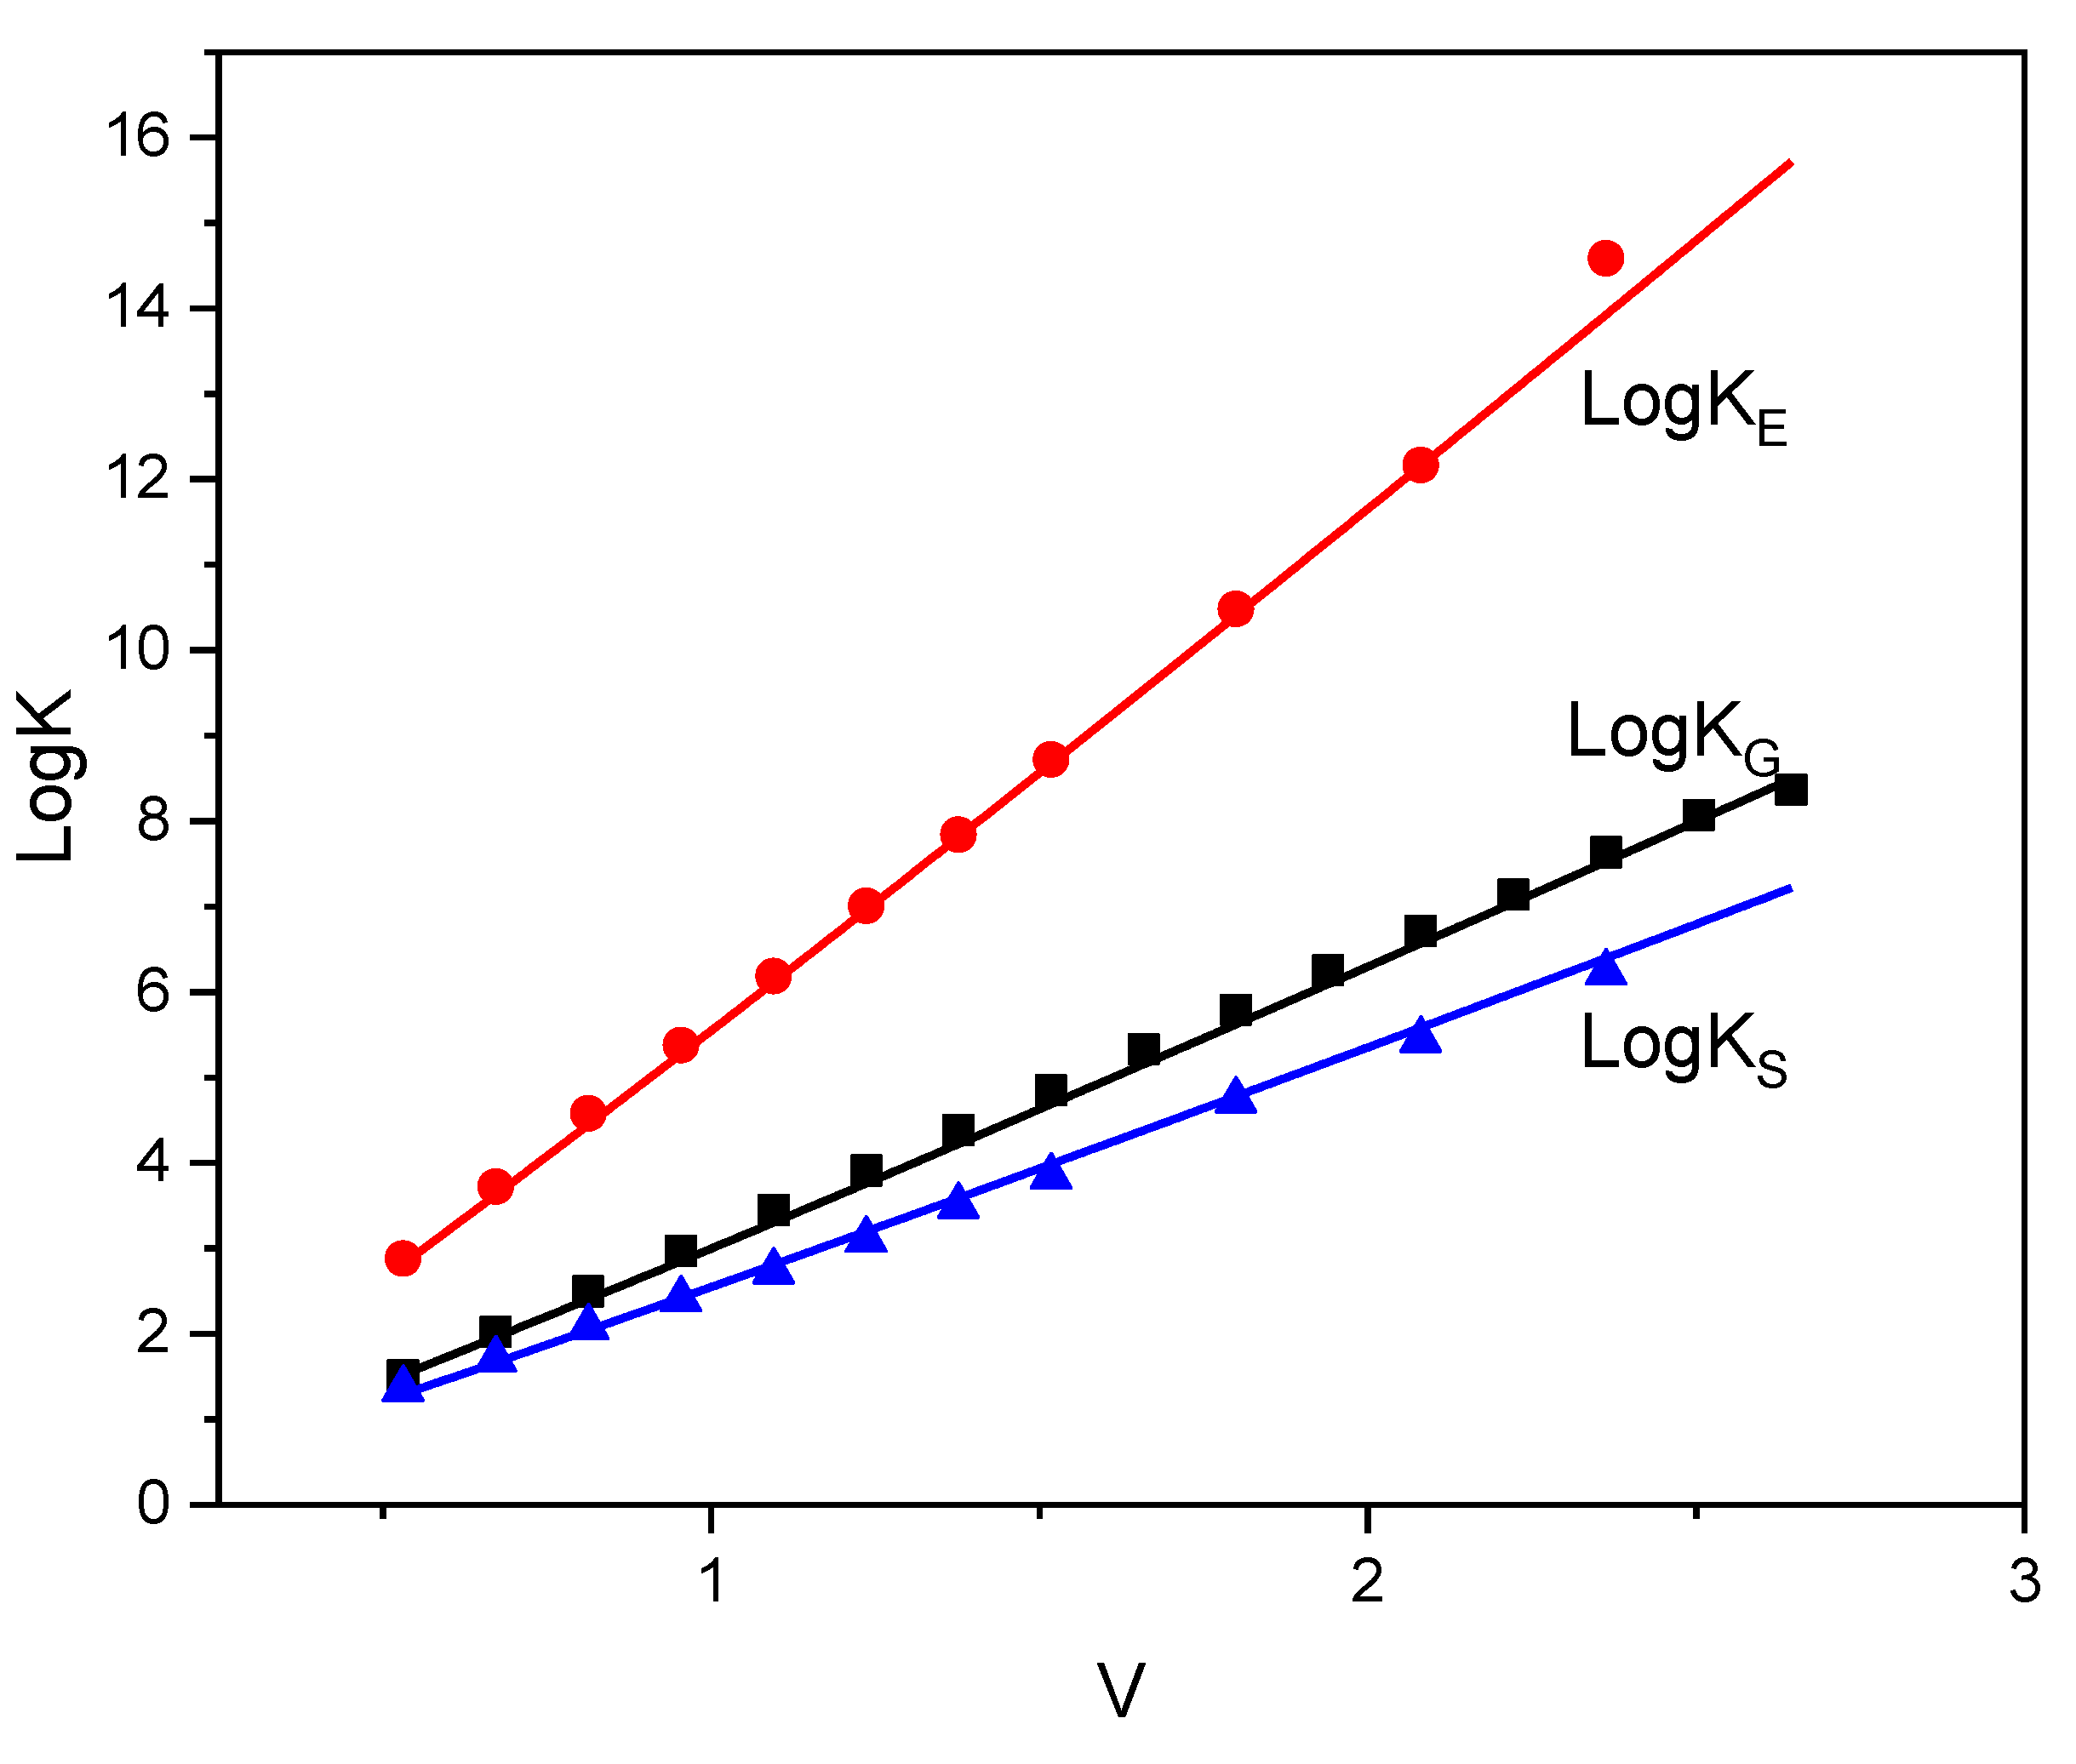
In fact, as shown in Figure 6, the experimental self-solvation enthalpies of n-alkanes are described well by the following simple equation:
L o g K E = 5.55 V 1 1.07   (n-alkanes)
In a similar manner, the self-solvation entropy of n-alkanes is described well by the following simple equation:
L o g K S = 2.5 V 1 1.07   (n-alkanes)
On the basis of the above equations 15-16, the self-solvation free-energy of n-alkanes is given by:
L o g K G = 3.05 V 1 1.07   (n-alkanes)
Calculations with equations 15, 16 and 17 are compared with experimental data in Figure 6.
In view of the simplicity of the equation for LogKS, it is interesting to examine the corresponding expression for non-hydrogen-bonded solutes. Obviously, some correction must be applied to equation 16, which would take into account at least the size difference from the corresponding “homomorph” alkane with carbon atoms equal to the number of non-hydrogen atoms of the solute. In Table 2 are reported the experimental LogKs and the calculated ones for some representative solutes. The calculations were made with the following simple equation:
L o g K S = 2.5 V 1 1.07 + 2 ln V hom V 1 o r L o g K S = 2.5 V 1 1.07 + 4.6 L o g V hom V 1
Vhom is the McGowan volume of the homomorph alkane of the solute with volume V1 [7,8,9,10,11,12].
This definition of the homomorph alkane is operational for solvents with more than two non-hydrogen atoms. Our focus here is on the self-solvation of liquid solvents and their homomorph counterparts should also be in a condensed / liquid state. Thus, instead of methane, the homomorph volume for water is taken equal to 1/4 of the McGowan volume of butane and, instead of ethane, the homomorph volume for methanol is taken equal to 2/4 of the volume of butane. It is worth mentioning that this choice of homomorph volume for water turns its size correction term in equation 18 negligible and, thus, the simple equation (16) applies also to water for the non-hydrogen-bonding contribution to LogKS. It is also worth mentioning that the general validity of equation 18 may be used to define the homomorph in the case of halogenated compounds. Thus, for carbon tetrachloride, equation 18 reproduces its known LogKs by setting its homomorph volume equal to 0.835 of the volume of n-heptane or Vhom = 0.835 Vn-C7.
Equation 18, though empirical, is an important result. The observed discrepancies in Figure 6 and Table 2 between experimental and calculated LogKS are rather tolerable, in view of the scatter of the experimental data [19]. In fact, a deviation of the order of 0.2 in LogKS implies a deviation of 0.2 X 19.15 = 3.8 JK-1mol-1 in solvation entropy and this, in turn, implies an error of 3.8 X 0.298 = 1.13 kJ/mol in solvation free energy or enthalpy, which is well within the experimental uncertainty of these quantities. Thus, equation 18 will be adopted, in the present work, for the estimation of the non-hydrogen-bonding contribution, LogKS,nhb , to the solvation entropy. If the overall solvation entropy is known, the corresponding hydrogen-bonding contribution is obtained by subtraction, or:
L o g K S , h b = L o g K S L o g K S , n h b
Equations 18 and 19 may, now, be coupled with information on hydrogen bonding enthalpy from COSMO-RS [57] in order to obtain the hydrogen-bonding free-energy of the studied solute through the classical equation:
Δ G H B = Δ H H B T Δ S H B
This comprehensive hydrogen – bonding information for a number of common self-associated solutes is reported in Table 3. The corresponding LSER estimations of ΔGHB are available for some of the solutes [62] and are reported in the last column of Table 3 for comparison .
The results reported in Table 3 are particularly interesting. The hydrogen-bonding enthalpies are, essentially, very close to the values more often used in current equation of state or activity coefficient models for the strength of hydrogen-bonding interactions [42,47]. Quite often in practice, these self-association strengths are used as a basis and the corresponding cross-association strengths are obtained by simple combining / mixing rules [42]. However, as we will see in the next sub-section, there is an alternative route for direct information on these cross-association strengths. On the other hand, the calculated hydrogen-bonding free-energies are also close to the estimations by Abraham’s LSER model [62], as shown by a comparison of the data in the last two columns of Table 3. The observed relative large discrepancy in the case of acetic acid is, most likely, due to the fact that lower carboxylic acids are dimerized in their pure state. It is not certain that all reported estimations have properly taken into account this dimerization for acetic acid. As shown in the table, the impact of this dimerization is significantly reduced after pentanoic acid and the entropy contribution assumes the expected larger absolute values of strongly hydrogen-bonded compounds. This is one example of the importance of accounting for self-solvation, especially for self-associated solutes, by the various linear relationships.

4.2. Hydrogen-Bonding Calculations in Solute (1) – Solvent (2) Systems

More often needed is the strength of cross-association interaction. If an alcohol is interacting with an ester or an ether, the required information for alcohol is its donor capacity. If it is interacting with chloroform, the required information is its acceptor capacity. And if it interacts with phenol or alkylamine, both, its donor capacity and its acceptor capacity must be known. In view of this, it is crucial to extract information on hydrogen-bonding interactions from solvation quantities in a consistent manner, caring for the separate donor and acceptor contributions.
Let us consider again a binary mixture of cross-associated solute (1) with solvent (2) and let their hydrogen-bonding donor and acceptor capacities be HBD1 and HBA1 for the solute and HBD2 and HBA2 for the solvent. The crucial information for Molecular Thermodynamic models is the strength of the two cross-association interactions HBD1 X HBA2 and HBA1 X HBD2 and of course the two self-association interactions HBD1 X HBA1 and HBD2 X HBA2. Obviously, when the solute becomes identical to the solvent the above cross-association strengths should become identical to the corresponding self – association strengths. This is precisely what is guaranteed with equation 8 or 11. Unfortunately, the existing LSER models and acidity / basicity scales in the literature have not paid much attention to this fact and their interaction strengths cannot be used for thermodynamic calculations. Luckily, the overall hydrogen-bonding enthalpies calculated by Abraham’s LSER model [7,8,9,10,11,12] are, very often, close to the corresponding COSMO-RS and equation-of-state calculations [18] and, thus, still are a useful information.
In Table 4 are reported the HB interaction strengths for representative solute – solvent systems. The LSER calculations [62,63] for the HBD1 X HBA2 and HBA1 X HBD2 interactions are reported in the second and third column, respectively. The fifth and sixth column of the Table reports the corresponding calculations from the COSMO-RS estimations [57]. COSMO-RS estimates the overall HB interaction HBD1 X HBA2 + HBA1 X HBD2. This overall strength is split in its separate contributions through equation 8. The equality of the two results specifies the binary coefficient ch12 which is reported in the fourth column of Table 4. A number of comments regarding these calculations are in order.
As observed in Table 4, the overall LSER estimations of the cross-association interactions are often not very different from COSMO-RS estimations. It is their splitting in the separate interactions which matters for thermodynamic calculations since these values, extracted from infinitely dilute solutions, are typically used throughout the full composition range of the mixture. As seen, in all self-solvation cases the LSER calculations give two significantly different estimations for the same quantity HBD1 X HBA1. When the solvents are ethanol or 1-octanol and the solute is an alkanol, the hydrogen-bonding interactions are of the OH---OH type and one would expect some symmetry in the HBD1 X HBA2 and HBA1 X HBD2 interaction values. As seen in Table 4, the two LSER estimations are significantly different and this is rather difficult to rationalize.
In contrast to LSER calculations, the splitting of the COSMO-RS estimations gives two identical values on self-solvation and symmetric values for the OH---OH interactions. In fact, the reported values in the last two columns of Table 4 are quite close to the typically adopted values in equation-of-state calculations [42,47]. This is important in practice and in model developments since there are no limitations in COSMO-RS calculations for both the hydrogen-bonding contribution to the solvation enthalpy as well as to the QC-LSER descriptors even for non-synthesized compounds. If not already available, the required quantum chemical calculations can be done with available software suites [59,60,61].
It is worth observing in Table 4 that the binary coefficient ch12 takes nearly a common value for each class of solute molecules or, rather, for each type of donor – acceptor pair. Thus, in the case of aqueous systems, this coefficient is nearly equal to 0.555 for all alkanols except for methanol. In the case of esters, it is nearly equal to 0.385 and in the case of alkanals it is equal to 0.35. This indicates that the new QC-LSER descriptors discriminate properly the type of interacting HB sites and the above coefficients may be used for the prediction of HB interaction strengths with other members of the homologous series. Of course, many more and diverse systems have to be studied in order to derive safe rules for these predictive calculations.
Of much interest is the availability of QC-LSER descriptors for conformers, when conformer-specific calculations are needed. Conformational changes may occur upon transfer of the solute from the gaseous to the liquid state. Of particular interest are conformers with intramolecular association. Missopolinou et al. [64,65] have studied the thermodynamics of alcoxyethanol mixtures with inert solvents and have shown that their skewed heat-of-mixing diagrams can be explained by accounting for the conformational changes of alcoxyethanols upon change of mixture composition. At infinite dilution of ethoxyethanol in solvent n-octane, the prevailing conformer is the c0 shown in Figure 7 and Figure S5 of SI file. Intramolecular hydrogen-bonding is possible with this conformation. The practically isolated ethoxyethanol molecules in the dilute concentration region prefer this conformation since the intramolecular association reduces the system potential energy and free energy. However, as the concentration increases, the probability for intermolecular association increases and it is the preferred association since it is stronger than the intramolecular one. The more open conformers c1 or c9 of Figure 7 favor intermolecular interaction much more than the conformer c0. There is of course a penalty of conformation energy in going from conformer c0 to these more extended conformers but this is offset by the gain from the stronger intermolecular interactions. These considerations explain the dispersive, intermolecular and intramolecular contributions to the experimental heat-of-mixing, especially the last one which is negative [64].
As mentioned already, information on hydrogen-bonding strengths and conformational changes are essential but extraneous to activity-coefficient or equation-of-state thermodynamic models. It is on account of this that the above COSMO-RS information, incorporated in the new QC-LSER descriptors, is particularly useful. As seen in Table 4, the solute – solvent HB interactions change significantly with conformation change and this must be accounted for by the molecular thermodynamic models, like the above mentioned SAFT or NRHB models.
COSMO-RS provides also with values for the total solvation energy [57]. In principle. then, one could combine it with the more easily available [19] total solvation free-energy and obtain the corresponding total solvation entropy. A scheme analogous to the one discussed above for self-solvation (cf. equations 16 and 18) could be devised for the mixtures. Again, the starting point could be n-alkane solvents. In this case, a correction should be made to equation 18 accounting at least for the size difference of solute and solvent. For all other solvents the additional correction should again account at least for the size difference of the solvent from its homomorph n-alkane. In this way, both, the hydrogen-bonding and the non-hydrogen-bonding contributions to the solvation entropy may be obtained. In a forthcoming publication we will see how this scheme may be applied, not only to systems of inert solvents like n-hexane or n-hexadecane but also to self-associated solvents such as ethanol or water and aqueous systems.

5. Discussion and Conclusions

As mentioned in the Introduction, hydrogen-bonding (HB) interactions are ubiquitous, playing a vital role in biological systems and processes but also in systems of practical or industrial interest. As such, they must be attributed a concrete value as any other properties and parameters in thermodynamic calculations. Unfortunately, in spite the enormous experimental and theoretical work done for nearly one century now, there is not even one single system whose strength of HB interaction is unanimously accepted as precisely known quantity. Various research schools define and measure differently in various environments the presumably very same interaction. The various acidity / basicity scales have their own essentially arbitrary scale – origin or zero interaction strength, which prevents the reliable exchange of information. Often, no due attention is paid to the thermodynamic consistency of the proposed correlations and predictive equations. One example is the inconsistency of the current linear relationships of solvation quantities when applied to self-solvation. This is really unfortunate because self-solvation is probably more appropriate for devising a rational widely acceptable scheme for the precise determination of HB quantities.
The present work is not solving this problem but it indicates a potential route towards this end. Quantum chemical calculations or quantum-mechanics based molecular simulations may be used to determine the strength of HB interaction in a pure self-associated fluid at well-defined external conditions and express it in understandable and replicable terms. Ethanol or propanol are examples of molecules that might be carefully studied. They are small enough with no extensive conformer populations and large enough to sterically hinder the simultaneous attack of both acceptor sites (lone pairs) of oxygen. Well-founded averaging schemes could be adopted for the determination of the OH--O interaction. Various attempts from various research schools would, sooner or later, coincide on the value of it within a tolerance less than the thermal energy (RT) unit. This is the information needed by statistical thermodynamic equation-of-state models empowered with well-founded hydrogen-bonding statistics.
The solvation quantities are clearly defined from the thermodynamics standpoint and are measurable precisely. Consistent self-solvation entropy values appear highly informative and the scheme leading to equations analogous to equations 16 and 18 deserve further exploration as a potential route for the sufficiently precise determination of the non-hydrogen-bonding contribution to the self-solvation entropy and, thus, to hydrogen-bonding contribution as well. A comprehensive table analogous to the above Table 3 could be produced by a well concerted international effort which could report unanimously accepted values for the hydrogen-bonding contributions to self-solvation entropy, ΔSHB, enthalpy, ΔHHB and free-energy, ΔGHB, of well-studied solutes. Such a table could act as a reference or standard measure of hydrogen-bonding interactions.
In a self-associated pure solvent at equilibrium, at given external conditions, hydrogen bonds are continuously formed and disrupted but, on average, there is one degree of association and, thus, one average number of hydrogen bonds which share the overall hydrogen bonding contribution to the solvation or potential energy of this well-defined pure system. It is this share of hydrogen-bonding energy which may be determined with good and eventually widely accepted precision. Statistical thermodynamic HB modeling might, then, be used to decouple multi-site interactions in solutes like water, glycols, alkoxyalkanols, etc. The fact that ethylene glycol has two hydroxyls does not mean that its overall averaged HB interaction strength should be twice the strength of each separate OH--O interaction. The latter strength, when intermolecular, would be close to the one determined in self-associated propanol or butanol but it would be different when it is an intramolecular interaction. Statistical thermodynamics may account for this with the proper information from quantum chemical calculations. This is a first key step for turning the vast available relevant information into a thermodynamically usable quantity with very important implications.
The second crucial step is the use of thermodynamically consistent solvation energy relationships, such as the above equation 11. There is a key prerequisite for this step: the existence of consistent and coherent molecular descriptors, especially the descriptors of the HBD and HBA scales or of the acidity and basicity scales. Quantum mechanics seems to be very useful in this respect. Schemes analogous to the above equations 4 to 7 could be implemented as scripts in the existing relevant databases and produce consistent descriptors for thousands of compounds. At the same time, quantum chemical calculations of the strength of hydrogen-bonding energies in solute–solvent systems could be split into their HBD1 X HBA2 and HBA1 X HBD2 interactions as shown in Table 4. This may become a very useful information for testing hydrogen-bonding theories and for the development of advanced molecular thermodynamic models of mixtures. The above two steps are essential for the systematic thermodynamic study of hydrogen-bonding. Besides the descriptors used in the present work, analogous descriptors like the above mentioned Klamt cosmoments [57] or Dohnal descriptors [35] or any other analogous descriptors may be explored for analogous consistent HB calculations.
The HB enthalpies from COSMO-RS [57] or from LSER model [62,63] are close to the widely used values by activity–coefficient and equation-of-state models [42,47]. In contrast, the corresponding HB entropies differ significantly. As an example, the HB entropies used in the NRHB equation-of-state model [47] for alkanols, are in the range from -25 to -30 JK-1mol-1, which differs by more than 50% from the reported ones in Table 3. Care must be exercised before judging this difference. Entropy changes are sensitive to density changes and depend on molecular sizes / shapes. Density changes with external conditions, as well as molecular sizes / shapes, are taken explicitly into account by equation-of-state models. The above type of linear relationships do not account explicitly for the impact of density changes on HB interactions, although their cavitation terms account indirectly for solvent densities. Thus, the transfer of HB entropies in an equation-of-state model must be adapted to the specifics of the system and its treatment of hydrogen-bonding. As discussed before [16,17,18], partial solvation parameters or partial solubility parameters are a useful bridge for this transfer as they do take explicitly into account the molar volumes or densities of solutes and solvents. However, a systematic and conclusive study on this HB entropy transfer has not been done so far.
The focus in the present work was on hydrogen-bonding interactions. If these interactions were sufficiently precisely determined, the determination of the intermediate electrostatic or polarity / polarizability interactions could be very much facilitated. A forthcoming article is focusing on this and on calculations with equations 9 and 11.
Summing up, this work has shown how quantum-mechanics based calculations may be combined with experimental information on solvation quantities in order to extract information on hydrogen-bonding interactions. A simple scheme was used for the derivation of two pairs of molecular descriptors, one for the hydrogen-bonding interactions and one for the electrostatic interactions of the intermediate strength of polarity / polarizability interactions from the σ-profiles of COSMO calculations [57]. These descriptors were used to split in a consistent manner the COSMO-RS estimations of the HB interaction energies into their HBD1 X HBA2 and HBA1 X HBD2 component interactions. These COSMO-RS calculations were combined with experimental solvation entropies which permitted the extraction of information on hydrogen-bonding free-energy, enthalpy and entropy for a number of common solutes. The potential for extension and thermodynamic use of these calculations is significant for practical applications and molecular model developments.

Supplementary Materials

The following supporting information can be downloaded at the website of this paper posted on Preprints.org. Additional information on the new QC-LSER descriptors are reported in terms of graphs and tables. Sigma-profiles and sigma – surfaces are reported for additional conformers.

References

  1. Moore, J.D., Mountain, R.D., Ross, R.B., Shen, V.K., Siderius, D.W., Smith, K.D., 2018. The 9th Industrial Fluid Properties Simulation Challenge. Fluid Phase Equilib., 476, 1–5.
  2. Tillotson, M.J., Diamantonis, N. I., Buda, C., Bolton, L.W., Mu¨ller, E.A., 2023, Molecular modelling of the thermophysical properties of fluids: expectations, limitations, gaps and opportunities. Phys. Chem. Chem. Phys., 25, 12607.
  3. Sapir, L., Harries, D., 2017. Revisiting Hydrogen Bond Thermodynamics in Molecular Simulations, J. Chem. Theory Comput. 13, 2851−2857 . [CrossRef]
  4. Duarte Ramos Matos, G., Kyu, D.Y., Loeffler, H.H., Chodera, J.D., Shirts, M.R., Mobley, D.L., 2017. Approaches for Calculating Solvation Free Energies and Enthalpies Demon strated with an Update of the FreeSolv Database. J. Chem. Eng. Data 62, 5, 1559–1569 . [CrossRef]
  5. Hirata, F. 2020. Exploring Life Phenomena with Statistical Mechanics of Molecular Liquids. Boca Raton, FL, CRC Press.
  6. L. Pereyaslavets, G. Kamath, O. Butin, A. Illarionov, M. Olevanov, I. Kurnikov,S. Sakipov, I. Leontyev, E. Voronina, T. Gannon, G. Nawrocki, M. Darkhovskiy, I. Ivahnenko, A. Kostikov, J. Scaranto, M. G. Kurnikova , S. Banik, H. Chan, M. G. Sternberg, S. K. R. S. Sankaranarayanan, B. Crawford, J. Potoff, M. Levitt, R. D. Kornberg, B Fain 2022. Accurate determination of solvation free energies of neutral organic compounds from first principles. Nature Communications . [CrossRef]
  7. Abraham, M. H., McGowan, J. C. 1987. The use of characteristic volumes to measure cavity terms in reversed phase liquid chromatography, Chromatographia, 23: 243-246 . [CrossRef]
  8. Abraham, M. H. 1993. Scales of solute hydrogen-bonding: their construction and application to physicochemical and biochemical processes, Chem. Soc. Rev., 22, 73-83. [CrossRef]
  9. Abraham, M. H., Ibrahim, A., Zissimos, A. M. 2004. Determination of sets of solute descriptors from chromatographic measurements, J. Chromatogr. A, 1037, 29-47. [CrossRef]
  10. Abraham, M. H., Smith, R. E., Luchtefeld, R., Boorem, A. J., Luo, R., Acree Jr., W. E.. 2010. Prediction of solubility of drugs and other compounds in organic solvents, J. Pharm. Sci., 99, 1500-1515.
  11. Goss, K.-U., 2005. Predicting the equilibrium partitioning of organic compounds using just one linear solvation energy relationship (LSER). Fluid Phase Equilibr., 233, 19–22. [CrossRef]
  12. Endo, S., Watanabe, N., Ulrich, N.., G. Bronner, K-U. Goss, UFZ-LSER database v 2.1 [Internet], Leipzig, Germany, Helmholtz Centre for Environmental Research-UFZ, 2015. [last accessed on 12.06.2024], available from https://www.ufz.de/index.php?en= 31698& contentonly=1&m=0&lserd_data[mvc]=Public/start.
  13. Sinha, S., Yang, Ch., Wu, E., Acree, W.E. 2022. Abraham Solvation Parameter Model: Examination of Possible Intramolecular Hydrogen-Bonding using calculated solute descriptors, Liquids, 2, 131 – 146 . [CrossRef]
  14. C. Mintz, T. Ladlie, K. Burton, M. Clark, W.E. Acree Jr, M.H. Abraham, 2008, Enthalpy of solvation correlations for gaseous solutes dissolved in alcohol solvents based on the Abraham model, QSAR Comb. Sci. 27, 627–635. [CrossRef]
  15. Egert, T., Langowski, H. Ch., Linear Solvation Energy Relationships (LSERs) for Accurate Prediction of Partition Coefficients between Low Density Polyethylene and Water - Part II: Model Evaluation and Benchmarking, Eur. J. Pharm. Sci., 2022, 172, 1-10.
  16. Panayiotou, C., Zuburtikudis, I., Abu Khalifeh, H. 2023. Linear Free-Energy Relationships (LFER) and Solvation Thermodynamics: The Thermodynamic Basis of LFER Linearity. Ind. Eng. Chem. Res. 62 (6), 2989-3000. [CrossRef]
  17. Panayiotou, C., Zuburtikudis, I., Abu Khalifeh, H. 2023. Linear Solvation Energy Relationships (LSER) and Equation-of-State Thermodynamics: On the Extraction of Thermodynamic Information from LSER Database. Liquids 3, 66-89. [CrossRef]
  18. Panayiotou, C., Acree Jr, W.E/, Zuburtikudis, I., 2023. COSMO-RS and LSER Models of Solution Thermodynamics: Towards a COSMOLSER Equation of State Model of Fluids. J. Molec. Liq.
  19. Moine, E., Privat, R., Sirjean, B., Jaubert, J.N., 2017. Estimation of Solvation Quantities from Experimental Thermodynamic Data: Development of the Comprehensive CompSol Databank for Pure and Mixed Solutes. J. Phys. Chem. Ref. Data, 46 (3), 033102. https://hal.univ-lorraine.fr/hal-01703358.
  20. Joesten, M.D., Schaad, L.1974, Hydrogen bonding, Marcel Dekker, New York.
  21. Raevsky, O.A., Grigor'ev, V.Y., Kireev, D.B., Zefirov, N.S. 1992, Complete Thermodynamic Description of H-Bonding in the Framework of Multiplicative Approach. Quantitative Structure-Activity Relationships 11, 49-63. [CrossRef]
  22. Gilli G, Gilli P. 2009. The Nature of the Hydrogen Bond. Oxford, Oxford University Press.
  23. Baev, A.K. 2014, Specific Intermolecular Interactions of Nitrogenated and Bioorganic Compounds, Springer-Verlag Berlin Heidelberg.
  24. Katritzky, D., Fara, E., Yang, H., Tamm, K., Tamm, T., Karelson, M. 2004. Quantitative Measures of Solvent Polarity, Chem. Rev. 104: 175-198 . [CrossRef]
  25. Laurence, C., J.-F. Gal, J.-F. 2010. Lewis Basicity and Affinity Scales: Data and Measurements, Wiley, New York.
  26. Epley, T.D., Drago, R.S. 1967, Calorimetric Studies on Some Hydrogen-Bonded Adducts. Journal of the American Chemical Society 89, 5770-5773. [CrossRef]
  27. Murthy A.S., Rao, C. 1968, Spectroscopic Studies of the Hydrogen Bond. Applied Spectroscopy Reviews 2, 69-191.
  28. Arnett, E.M., Joris, L., Mitchell, E., Murty, T., Gorrie, T., Schleyer, P.V.R. 1970. Hydrogen-bonded complex formation. III. Thermodynamics of complexing by infrared spectroscopy and calorimetry Journal of the American Chemical Society 92, 2365-2377.
  29. Cabani, S., Gianni, P., Mollica, V., Lepori, L. 1981, Group Contributions to the Thermodynamic Properties of Non-Ionic Organic Solutes in Dilute Aqueous Solutions. J. Solution Chem. 10, 563- 595. [CrossRef]
  30. Abbott, S., Yamamoto, H., Hansen, C.M. 2010. Hansen Solubility Parameters in Practice, Complete with software, data and examples, third ed.-version 3.1.20. Book and Software published by Hansen-Solubility.com.
  31. Dortmund Data Bank [Last accessed on 28.06.2024]: https://www.ddbst.com/ddb.html.
  32. Sedov, L.A., Solomonov,, B.N., 2012. Hydrogen bonding in neat aliphatic alcohols: The Gibbs free energy of self-association and molar fraction of monomer. J. Mol. Liq., 167, 47–51.
  33. Solomonov, B.N., Yagofarov, M.I. ,2022, Compensation relationship in Thermodynamics of solvation and vaporization: features and applications. I. Non-hydrogen-bonded systems, J. Mol. Liq. 368. [CrossRef]
  34. Solomonov, B.N., Yagofarov, M.I., 2023. Compensation relationship in Thermodynamics of solvation and vaporization: features and applications. ΙΙ. Hydrogen-bonded systems, J. Mol. Liq. 372, 121205. [CrossRef]
  35. Dohnal, V. 2024, New QSPR molecular descriptors based on low-cost quantum chemistry computations using DFT/COSMO approach, J. Mol. Liq. 125256. [CrossRef]
  36. Goodsell, D.S. 2003, Bionanotechnology: Lessons from Nature. Wiley & Sons, New York.
  37. Qiu, X., Li, H., Ver Steeg, G., Godzik, A. 2024. Advances in AI for Protein Structure Prediction: Implications for Cancer Drug Discovery and Development. Biomolecules 14(3), 339; [CrossRef]
  38. Chapman, W.G., Gubbins, K.E., Jackson, G. and Radosz, M. 1990. Ind. Eng.Chem. Res. 29: 1709 – 1721.
  39. Vega LF, Llovall, F. 2016. Review and new insights into the application of molecular-based equations of state to water and aqueous solutions. Fluid Phase Equil. 416:150–173. [CrossRef]
  40. Torshizi, M. F, and Muller, E. A., 2021. Coarse-grained molecular dynamics study of the self-assembly of polyphilic bolaamphiphiles using the SAFT-γ Mie force field. Mol. Syst. Des. Eng. 6: 594 – 608.
  41. Wertheim, M. 1986. Fluids with highly directional attractive forces. III. Multiple attraction sites, J. Statist. Phys., 42, 459–476. [CrossRef]
  42. Kontogeorgis, G.M, Folas, G.K. 2010. Thermodynamic Models for Industrial Applications. From Classical and Advanced Mixing Rules to Association Theories. Chichester, U.K., John Wiley and Sons, Ltd.
  43. Panayiotou, C. and Sanchez, I.C. 1991. Hydrogen Bonding in Fluids: An Equation of-State Approach. J. Phys. Chem. 95, 10090 – 10097. [CrossRef]
  44. Panayiotou, C.; Stefanis, E.; Tsivintzelis, I.; Pantoula, M.; Economou, I. 2004. Nonrandom Hydrogen-Bonding Model of Fluids and Their Mixtures 1. Pure Fluids. Ind. Eng. Chem. Res. 43, 6592-6606 . [CrossRef]
  45. Panayiotou, C., Tsivintzelis, I., Economou., I.G. 2007. Nonrandom Hydrogen-Bonding Model of Fluids and their Mixtures. 2. Multicomponent Mixtures Ind. Eng. Chem. Res. 46, 2628 - 2636. [CrossRef]
  46. Veytsman, B. A.: 1990. Are lattice models valid for fluids with hydrogen bonds? J. Phys. Chem. 94, 8499 – 8500.
  47. Mensitieri, G., Scherillo, G.. Panayiotou, C., Musto, P. 2020. Towards a predictive thermodynamic description of sorption processes in polymers: The synergy between theoretical EoS models and vibrational spectroscopy, Materials Sci. & Eng. R, 140, 100525 . [CrossRef]
  48. Klamt, A. 1995. Conductor-like Screening Model for Real Solvents: A New Approach to the Quantitative Calculation of Solvation Phenomena. J. Phys. Chem. 99 (7): 2224-2235. [CrossRef]
  49. Lin, S. T. and Sandler, S. I. 2002. A priori phase equilibrium prediction from a segment contribution solvation model. Ind. Eng. Chem. Res. 41: 899−913.
  50. Bell, I. A., Mickoleit, E., Hsieh, C-M., Lin, S-T., Vrabec, J., Breitkopf, C.,Jager, A., 2020. A Benchmark Open-Source Implementation of COSMO-SAC, J. Chem. Theory Comput. 16, 2635−2646 . [CrossRef]
  51. Klamt, A. 2005. COSMO-RS from Quantum Chemistry to Fluid Phase Thermodynamics and Drug Design; Amsterdam: Elsevier.
  52. Grensemann, H., Gmehling, J. 2005. Performance of a conductor-like screening model for real solvents model in comparison to classical group contribution methods. Ind. Eng. Chem. Res.44: 1610−1624. [CrossRef]
  53. Pye, C. C.; Ziegler, T.; van Lenthe, E., Louwen, J. N. 2009. An implementation of the conductor-like screening model of solvation within the Amsterdam density functional package, Part II. COSMO for real solvents. Can. J. Chem. 87, 790−797. [CrossRef]
  54. Klamt, A., Eckert, F., Arlt, W. 2010. COSMO-RS: An alternative to simulation for calculating thermodynamic properties of liquid mixtures, Annual Review of Chemical and Biomolecular Engineering, 1:101–122 . [CrossRef]
  55. Klamt, A., Eckert, F., Reinisch, J., Wichmann, K. 2016. Prediction of cyclohexane-water distribution coefficients with COSMO-RS on the SAMPL5 data set. J Comput Aided Mol Des. 30(11): 959–967. [CrossRef]
  56. Reinisch, J., Klamt, A. 2014. Prediction of free energies of hydration with COSMO-RS on the SAMPL4 data set. J Comput Aided Mol Des. 28(3): 169–173. [CrossRef]
  57. COSMObase, ver. 2019, COSMOlogic GmbH &CoKG (now, BIOVIA Dassault Systemes).
  58. M. Zissimos, M. H. Abraham, A. Klamt, F. Eckert, and J. Wood 2002. A Comparison between the Two General Sets of Linear Free Energy Descriptors of Abraham and Klamt. J. Chem. Inf. Comput. Sci., 42, 6, 1320–1331 . [CrossRef]
  59. https://www.turbomole.org.
  60. https://www.3ds.com/products/biovia/materials-studio.
  61. https://www.scm.com/product/cosmo-rs/.
  62. Sinha, S., Yang, Ch., Wu, E., Acree, W.E. 2022. Abraham Solvation Parameter Model: Examination of Possible Intramolecular Hydrogen-Bonding using calculated solute descriptors, Liquids, 2, 131 – 146 . [CrossRef]
  63. Mintz, C., Ladlie, T., Burton, K., Clark, M., Acree Jr, W.E., Abraham, M.H. 2008, Enthalpy of solvation correlations for gaseous solutes dissolved in alcohol solvents based on the Abraham model, QSAR Comb. Sci. 27, 627–635.
  64. Missopolinou, D., Ioannou, K., Prinos, I., and Panayiotou, C. 2002. Thermodynamics of alkoxyethanol + alkane mixtures. Z. Phys. Chem. 216 (7): 905 – 918. [CrossRef]
  65. Missopolinou, D., Tsivintzelis, I., and Panayiotou, C. 2006. Excess enthalpies of binary mixtures of 2-ethoxyethanol with four hydrocarbons at 298.15, 308.15, and 318.15K: An experimental and theoretical study. Fluid Phase Equil. 245 (2): 89–101. [CrossRef]
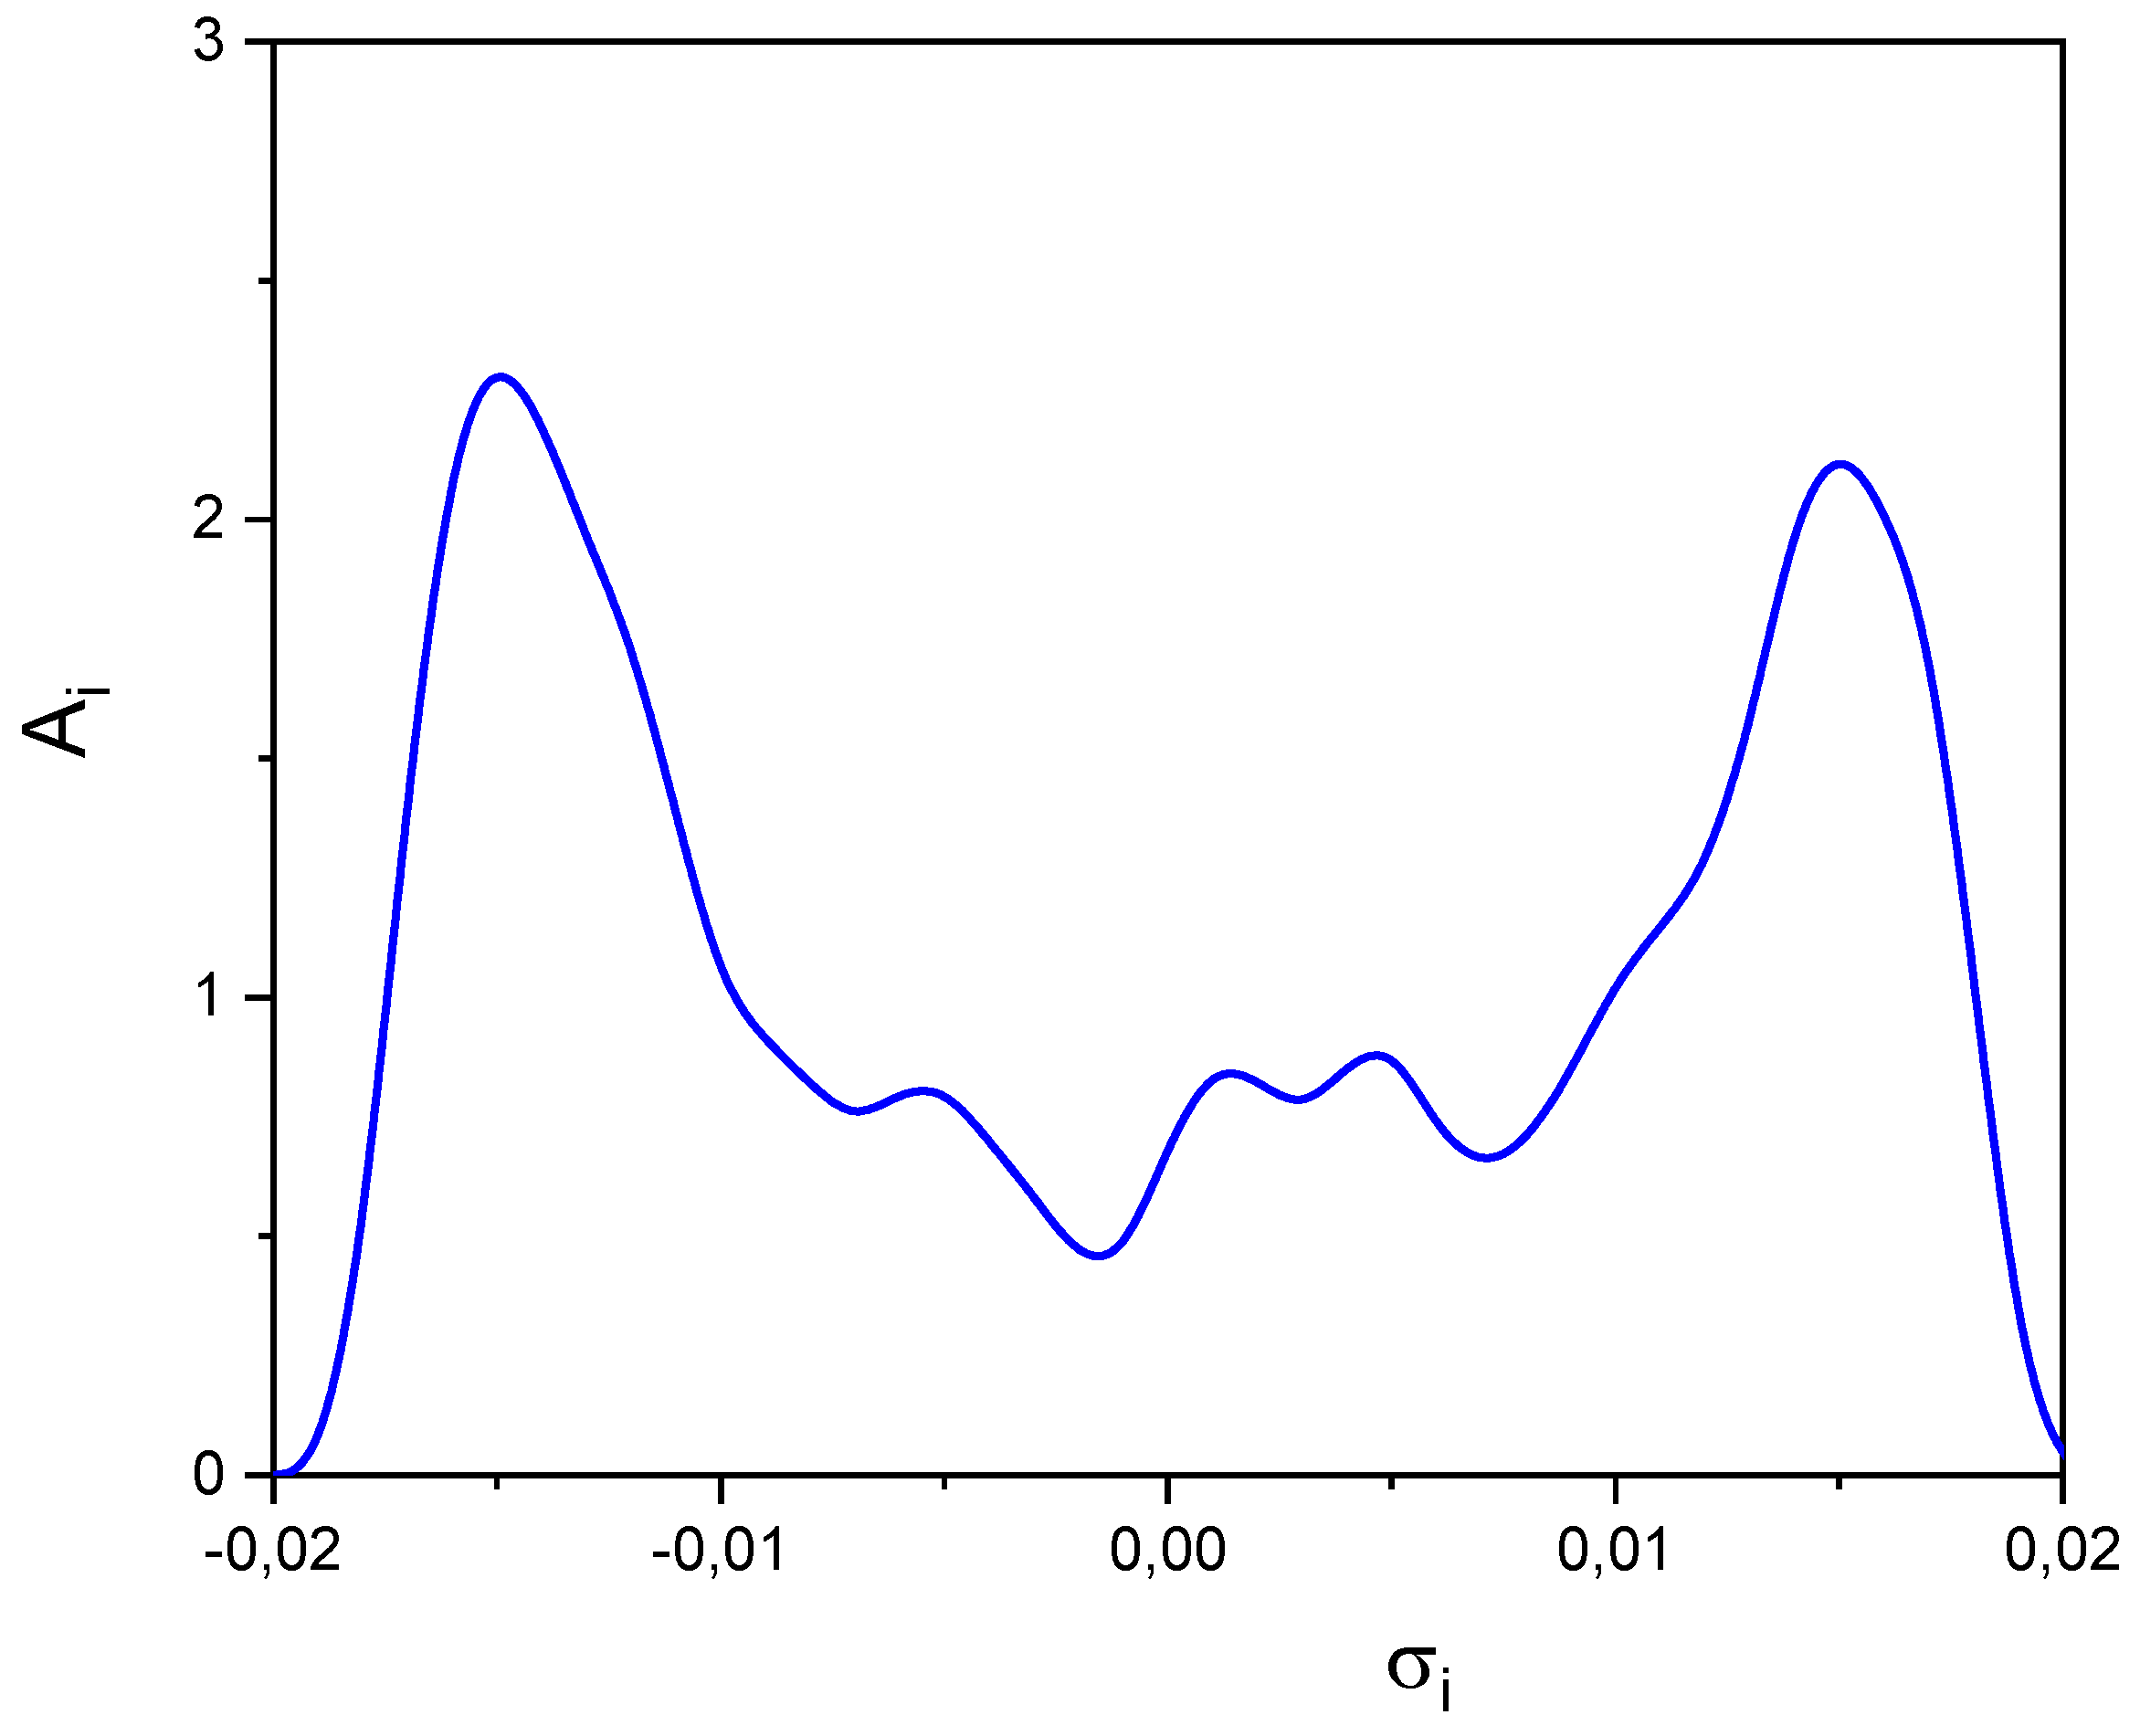
Figure 1. The σ-profile of water [data from [57]].
Preprints 111870 g001
Figure 2. The distribution function of the product σi2Ai of charge densities σi with the molecular charges σiAi of water and the definition areas of the QC-LSER molecular descriptors. The four surface areas under the distribution curve, multiplied by 106, give the four QC-LSER descriptors of the molecule, as indicated.
Preprints 111870 g002
Figure 3. The σ-profiles and σ-surfaces of conformer c0 (upper) and c3 (lower) of 1,3-propylene glycol. Data from [57].
Preprints 111870 g003aPreprints 111870 g003b
Figure 4. Comparison of Cosmoment sig2 [57] and the square root of the product of the descriptors Ap and Bp of saturated hydrocarbons. Symbols correspond to sig2 vs. 16.6 A p B p . The straight line is the diagonal.
Preprints 111870 g004
Figure 5. The cosmoment HB_acc3 [57] and the basicity LSER descriptor Bx5 [12] versus the corresponding QC-LSER basicity descriptor Bh of OH- containing compounds.
Preprints 111870 g005
Figure 6. Experimental (symbols) [19] and calculated (lines) logarithms of solvation equilibrium constants of n-alkanes as a function of the McGowan volume [12]. Calculations were done with equations 15–17.
Preprints 111870 g006
Figure 7. COSMO calculations of the surface profiles of three conformers of 2-ethoxyethanol [57]. Deep blue indicates donor sites and deep red acceptor sites.
Preprints 111870 g007
Table 1. The QC-LSER Molecular Descriptors of Common Solutes. Conformational energies are given in kJ/mol.
SOLUTE Ah Ap Bp Bh
ETHANE 0.00 0.28 0.23 0.00
PROPANE 0.00 0.32 0.29 0.00
n-BUTANE 0.00 0.37 0.37 0.00
n-PENTANE 0.00 0.42 0.40 0.00
n-HEXANE 0.00 0.47 0.46 0.00
n-HEPTANE 0.00 0.52 0.52 0.00
n-OCTANE 0.00 0.57 0.57 0.00
n-NONANE 0.00 0.62 0.63 0.00
n-DECANE 0.00 0.67 0.69 0.00
n-UNDECANE 0.00 0.71 0.73 0.00
n-DODECANE 0.00 0.77 0.78 0.00
n-TRIDECANE 0.00 0.80 0.84 0.00
n-TETRADECANE 0.00 0.85 0.89 0.00
n-PENTADECANE 0.00 0.90 0.94 0.00
n-HEXADECANE 0.00 0.96 1.02 0.00
n-OCTADECANE 0.00 1.05 1.11 0.00
ISOBUTANE 0.00 0.39 0.37 0.00
ISOPENTANE 0.00 0.44 0.41 0.00
2-METHYLPENTANE 0.00 0.49 0.46 0.00
3-METHYLPENTANE 0.00 0.49 0.45 0.00
3-METHYLHEXANE 0.00 0.54 0.51 0.00
2,2-DIMETHYLHEXANE 0.00 0.61 0.60 0.00
2,5-DIMETHYLHEXANE 0.00 0.59 0.58 0.00
CYCLOPENTANE 0.00 0.35 0.33 0.00
CYCLOHEXANE 0.00 0.35 0.33 0.00
CYCLOHEPTANE 0.00 0.38 0.37 0.00
CYCLOOCTANE 0.00 0.42 0.42 0.00
ETHYLENE 0.00 0.67 0.73 0.02
PROPYLENE 0.00 0.67 0.80 0.06
1-BUTENE 0.00 0.70 0.84 0.06
1-PENTENE 0.00 0.74 0.90 0.07
1-HEXENE 0.00 0.79 0.96 0.06
1-HEPTENE 0.00 0.83 1.02 0.06
1-OCTENE 0.00 0.86 1.07 0.05
BENZENE 0.00 1.24 1.14 0.00
TOLUENE 0.00 1.22 1.23 0.00
ETHYLBENZENE 0.00 1.25 1.29 0.00
n-PROPYLBENZENE 0.00 1.29 1.36 0.00
n-BUTYLBENZENE 0.00 1.34 1.42 0.00
o-XYLENE 0.00 1.25 1.34 0.00
m-XYLENE 0.00 1.22 1.31 0.00
p-XYLENE 0.00 1.21 1.29 0.00
1-PENTYNE 0.49 1.01 1.51 0.16
1-HEXYNE 0.48 1.05 1.57 0.17
3-HEXYNE 0.00 1.10 1.39 0.34
DICHLOROMETHANE 0.94 0.94 1.08 0.00
CHLOROFORM 1.14 0.59 0.71 0.00
CARBON TETRACHLORIDE 0.00 0.71 0.37 0.00
2,2-DICHLOROPROPANE 0.00 1.48 1.43 0.00
CARBON TETRAFLUORIDE 0.00 0.33 0.14 0.00
DIETHYL ETHER 0.00 0.79 0.38 1.81
DI-n-PROPYL ETHER 0.00 0.85 0.47 1.79
DI-n-BUTYL ETHER 0.00 0.94 0.60 1.79
FURAN 0.24 1.40 1.24 0.13
TETRAHYDROFURAN 0.00 0.79 0.31 2.15
1,3-DIOXANE 0.00 1.50 0.54 3.12
1,4-DIOXANE 0.00 1.50 0.54 3.12
TETRAHYDROPYRAN 0.00 0.77 0.34 1.97
METHYL FORMATE 0.19 1.59 0.74 2.21
ETHYL FORMATE 0.15 1.56 0,73 2.36
ETHYL ACETATE 0.00 1.61 0.68 2.81
n-PROPYL ACETATE 0.00 1.60 0.72 2.80
ISOPROPYL ACETATE 0.00 1.65 0.68 2.68
n-BUTYL ACETATE 0.00 1.64 0.76 2.81
ETHYL PROPIONATE 0.00 1.53 0.73 2.66
ETHYL n-BUTYRATE 0.00 1.56 0.78 2.65
n-PROPYL PROPIONATE 0.00 1.54 0.74 2.69
ACETONE 0.02 1.47 0.38 2.95
METHYL ETHYL KETONE 0.00 1.41 0.43 2.78
2-PENTANONE 0.00 1.43 0.47 2.81
3-PENTANONE 0.00 1.35 0.51 2.58
3-HEXANONE 0.00 1.37 0.53 2.62
FORMALDEHYDE 0.00 1.34 0.62 1.55
ACETALDEHYDE 0.00 1.39 0.47 2.36
PROPANAL 0.00 1.32 0.49 2.33
BUTANAL 0.00 1.34 0.54 2.32
PENTANAL 0.00 1.38 0.59 2.33
HEXANAL 0.00 1.43 0.66 2.32
OCTANAL 0.00 1.52 0.76 2.33
METHANOL 1.39 0.55 0.29 2.39
ETHANOL 1.23 0.66 0.35 2.46
1-PROPANOL 1.23 0.70 0.41 2.44
1-BUTANOL 1.22 0.74 0.44 2.47
1-PENTANOL 1.22 0.79 0.51 2.46
1-HEXANOL 1.22 0.83 0.55 2.48
1-HEPTANOL 1.21 0.90 0.61 2.48
1-OCTANOL 1.19 0.95 0.68 2.46
1-NONANOL 1.21 0.99 0.73 2.47
1-DECANOL 1.23 1.02 0.79 2.47
ISOPROPANOL 1.18 0.73 0.38 2.52
2-BUTANOL 0.91 0.81 0.39 2.46
2-PENTANOL 1.14 0.79 0.52 2.22
GLYCEROL 2.98 1.68 0.75 5.26
ETHYLENE GLYCOL, c0 2.13 1.10 0.57 3.87
ETHYLENE GLYCOL, c6
Econf = 8.98
2.97 0.86 0.86 4.11
1,3-PROPYLENE GLYCOL, c0 1.58 1.17 0.53 3.92
1,3-PROPYLENE GLYCOL, c3
Econf = 5.54
2.63 1.01 0.56 4.38
1,2-BUTANEDIOL 1.73 1.20 0.64 3.66
1,3-BUTANEDIOL 1.60 1.21 0.58 3.96
1,4-BUTANEDIOL 1.63 1.08 0.55 3.98
2-METHOXYETHANOL c0 0.77 1.22 0.60 3.13
2-METHOXYETHANOL c7
Econf = 10.97
1.39 1.08 0.62 3.19
2-ETHOXYETHANOL c0 0.63 1.24 0.60 3.13
2-ETHOXYETHANOL c1
Econf = 2.59
1.35 1.20 0.47 4.23
2-ETHOXYETHANOL c9
Econf = 10.5
1.39 1.11 0.64 3.28
PHENOL 2.03 1.26 1.45 0.88
o-CRESOL 1.99 1.21 1.57 0.77
m-CRESOL 1.98 1.25 1.52 0.93
p-CRESOL 1.96 1.26 1.46 0.96
BENZYL ALCOHOL 1.23 1.59 1.18 2.07
ACETIC ACID 2.04 1.11 0.76 2.70
PROPIONIC ACID 1.99 1.06 0.78 2.62
n-BUTYRIC ACID 1.98 1.07 0.83 2.62
n-PENTANOIC ACID 1.97 1.12 0.89 2.62
ETHYLAMINE 0.43 0.95 0.32 2.73
n-BUTYLAMINE 0.43 1.04 0.45 2.73
DIETHYLAMINE 0.20 0.84 0.40 2.02
DI-n-PROPYLAMINE 0.19 0.93 0.52 2.02
TRIMETHYLAMINE 0.00 0.65 0.35 1.49
ANILINE 1.62 1.41 1.82 0.78
PYRIDINE 0.00 1.60 0.56 2.11
FORMAMIDE 3.03 0.84 0.36 4.23
DIMETHYL SULFOXIDE 0.10 2.30 0.29 5.24
ACETONITRILE 0.31 1.67 0.91 2.00
ACRYLONITRILE 0.43 1.48 1.00 1.52
PROPIONITRILE 0.08 1.64 0.91 2.02
ACETAMIDE 2.61 1.03 0.34 4.74
N,N-DIMETHYLFORMAMIDE 0.00 1.66 0.25 4.17
N-METHYL FORMAMIDE 1.58 1.21 0.28 4.20
WATER 2.89 0.28 0.27 2.99
Table 2. Experimental [19] equilibrium constants of solvation entropy and calculated ones for non-hydrogen-bonded solutes at 298.15 K.
Solute LogKS
exp [19]
LogKS
Eq. 18
ISOBUTANE 1.57 1.63
ISOPENTANE 1.99 2.00
2-METHYLPENTANE 2.25 2.38
3-METHYLPENTANE 2.25 2.38
1-BUTENE 1.62 1.65
1-PENTENE 1.99 2.00
1-HEXENE 2.38 2.35
3-HEXYNE 2.40 2.40
CYCLOPENTANE 2.03 2.00
CYCLOHEXANE 2.25 2.33
CYCLOHEPTANE 2.64 2.67
CYCLOOCTANE 2.95 3.03
BENZENE 2.36 2.32
TOLUENE 2.58 2.61
ETHYLBENZENE 2.93 2.92
n-PROPYLBENZENE 3.19 3.25
n-BUTYLBENZENE 3.58 3.60
o-XYLENE 2.99 2.92
m-XYLENE 2.92 2.92
p-XYLENE 2.93 2.92
CARBON TETRACHLORIDE 2.23 2.23*
DIETHYL ETHER 2.21 2.00
DI-n-PROPYL ETHER 2.67 2.69
DI-n-BUTYL ETHER 3.39 3.42
ETHYL ACETATE 2.71 2.59
n-BUTYL ACETATE 3.41 3.16
ACETONE 2.27 2.10
METHYL ETHYL KETONE 2.49 2.33
2-PENTANONE 2.80 2.60
3-PENTANONE 2.60 2.60
ACETALDEHYDE 2.01 1.96
PROPANAL 2.21 2.10
BUTANAL 2.34 2.33
PENTANAL 2.51 2.60
HEXANAL 2.88 2.90
*Vhom = 0.835VnC7.
Table 3. The equilibrium constant of solvation entropy, LogKS, with its hydrogen-bonding, LogKS,hb and non-hydrogen-bonding, LogKS,nhb, components and the hydrogen-bonding contributions to self-solvation entropy, ΔSHB, enthalpy, ΔHHB and free-energy, ΔGHB, of common solutes at 298.15 K.
Solute LogKS
exp [19]
LogKS,nhb
Eq. 18
LogKS,hb -ΔSHB/
JK-1 mol-1
-ΔHHB [57]
kJmol-1
-ΔGHB/
kJmol-1
Eq. 20
-ΔGHB/
kJmol-1
LSER[62]
METHANOL 2.95 0.88 2.07 39.58 23.08 11.28 13.14
ETHANOL 3.47 1.40 2.08 39.78 24.93 13.07 11.49
1-PROPANOL 4.02 1.68 2.34 44.78 24.61 11.26 11.16
2-PROPANOL 4.06 1.68 2.38 45.62 23.74 10.14 10.43
1-BUTANOL 4.55 2.01 2.54 48.72 24.16 9.63 10.21
1-PENTANOL 4.79 2.34 2.45 46.85 24.01 10.04 10.59
2-PENTANOL 4.76 2.34 2.42 46.43 23.77 9.93 10.34
1-HEXANOL 5.44 2.69 2.75 52.67 24.24 8.54 10.06
1-HEPTANOL 6.01 3.05 2.96 56.64 23.64 6.75 9.77
1-OCTANOL 6.14 3.42 2.72 52.10 23.43 7.90 9.40
1-NONANOL 6.75 3.79 2.96 56.68 23.68 6.78
1-DECANOL 6.84 4.17 2.67 51.11 23.26 8.02 9.40
ETHYLENE GLYCOL,c0 4.68 1.77 2.91 54.51 43.29 26.70 25.24
1,3-PROPYLENE GLYCOL,c0 4.74 2.02 2.72 51.10 50.21 34.70
GLYCEROL 6.18 2.32 3.86 73.90 51.61 29.58
BENZYL ALCOHOL 4.87 2.88 2.00 38.25 22.47 11.06 10.32
PHENOL 4.26 2.59 1.67 31.91 17.58 8.07
o-CRESOL 4.55 2.88 1.67 31.98 13.22 3.69
m-CRESOL 4.63 2.88 1.76 33.65 17.98 7.95
p-CRESOL 4.96 2.88 2.09 39.92 18.59 6.69
2-METHOXY-ETHANOL c0 3.28 2.03 1.25 23.99 19.53 12.38 9.06
2-ETHOXY-ETHANOL c0 3.93 2.32 1.61 30.89 19.21 10.00 9.45
ACETIC ACID 2.69 1.84 0.85 16.27 25.31 20.46 14.95
PROPIONIC ACID 3.43 2.05 1.38 26.43 25.39 17.51
n-BUTYRIC ACID 4.09 2.32 1.77 33.84 25.37 15.28
n-PENTANOIC ACID 4.85 2.62 2.23 42.71 24.89 12.16
n-BUTYLAMINE 2.69 2.00 0.69 13.19 2.84 -1.10
DIETHYLAMINE 2.38 2.00 0.38 7.33 2.69 0.50
WATER 2.72 0.38 2.35 44.77 41.15 27.80 27.37
Table 4. The two components of the hydrogen-bonding solvation energies calculated by Abraham’s LSER model [62,63]] and the corresponding components calculated by the new descriptors of Table 1 from COSMO-RS estimations of the overall hydrogen-bonding contribution to solvation energy of common solutes [57] at 298.15 K.
SOLUTE LSER [62,63] This Work / COSMO-RS [57]
-A1a2/
kJ/mol
-B1b2/
kJ/mol
ch12 -ch12Ah1Bh2 /
kJ/mol
-ch12BBh1Ah2 /
kJ/mol
Solvent: WATER
WATER 24.41 15.79 0,42 20,56 20,56
TETRAHYDROFURAN 0.00 20.03 0.69 0.00 24.52
TETRAHYDROPYRAN 0.00 21.43 0.72 0.00 23.26
ETHYL ACETATE 0.00 18.82 0.38 0.00 17.59
n-PROPYL ACETATE 0.00 18.82 0.38 0.00 17.61
n-BUTYL ACETATE 0.00 18.79 0.39 0.00 18.03
ACETONE 1.28 20.62 0.40 0.14 19.52
METHYL ETHYL KETONE 0.00 21.31 0.41 0.00 18.64
2-PENTANONE 0.00 21.30 0.42 0.00 19.64
ACETALDEHYDE 0.00 18.82 0.35 0.00 13.60
PROPANAL 0.00 18.82 0.35 0.00 13.48
BUTANAL 0.00 18.82 0.35 0.00 13.51
DMSO 0.00 38.05 0.32 0.57 27.81
METHANOL 13.76 19.65 0.49 11.53 19.17
ETHANOL 11.84 20.07 0.55 11.63 22.48
1-PROPANOL 11.84 20.07 0.56 11.61 22.35
1-BUTANOL 11.80 20.16 0.55 11.51 22.52
1-PENTANOL 11.80 20.16 0.56 11.56 22.53
1-HEXANOL 11.76 20.29 0.55 11.48 22.55
1-HEPTANOL 11.78 20.19 0.55 11.40 22.59
1-OCTANOL 11.71 20.31 0.56 11.33 22.64
1-NONANOL 11.76 20.53 0.56 11.51 22.71
1-DECANOL 11.66 20.37 0.56 11.70 22.71
ISOPROPANOL 9.81 23.42 0.60 11.99 24.74
2-PENTANOL 10.44 23.42 0.64 12.38 23.31
PHENOL 19.50 12.63 0.50 17.17 7.18
ETHYLENE GLYCOL, c0 18.57 32.62 0.63 23.08 40.54
ETHYLENE GLYCOL, c6 18.57 32.62 0.54 27.23 36.39
2-ETHOXYETHANOL c0 9.72 34.10 0.89 9.56 45.97
2-ETHOXYETHANOL c1 9.72 34.10 0.60 13.74 41.79
2-ETHOXYETHANOL c9 9.72 34.10 0.71 16.90 38.63
1,2-BUTANEDIOL 18.57 35.13 0,65 19,28 39,46
1,3-BUTANEDIOL 20.65 35.13 0,71 19,52 46,63
ACETIC ACID 19.71 18.46 0,42 14,65 18,74
PROPIONIC ACID 19.42 18.54 0,44 15,12 19,23
n-BUTYLAMINE 5.12 25.51 0,41 2,98 18,35
DIETHYLAMINE 2.56 28.73 0,65 2,22 21,53
PYRIDINE 0.00 21.42 0,47 0,00 16,23
Solvent: ETHANOL
ETHANOL 18.08 5.53 0.73 12.58 12.58
1-PROPANOL 18.08 5.53 0.72 12.28 12.36
2-PROPANOL 14.97 6.45 0.77 12.56 13.55
1-OCTANOL 17.87 5.59 0.74 12.17 12.71
ETHYLENE GLYCOL, c0 28.34 8.98 0.70 20.75 19.05
ETHYLENE GLYCOL, c6 28.34 8.98 0.57 23.43 16.37
2-ETHOXYETHANOL c0 14.83 9.39 0.86 7.53 18.93
2-ETHOXYETHANOL c1 14.83 9.39 0.55 10.22 16.24
2-ETHOXYETHANOL c9 14.83 9.39 0.63 12.05 14.41
ACETIC ACID 30.08 5.08 0.47 13.39 8.96
n-BYTYL AMINE 7.82 7.02 0.82 4.87 15.69
DMSO 0.00 10.48 0.54 0.77 19.88
WATER 37.25 4.35 0.60 24.22 12.66
Solvent: 1-OCTANOL
1-OCTANOL 19.74 4.37 0.70 11.69 11.69
ETHANOL 19.98 4.32 0.69 11.91 11.52
1-PROPANOL 19.98 4.32 0.73 12.55 12.09
2-PROPANOL 16.54 5.03 0.74 12.19 12.59
ETHYLENE GLYCOL, c0 31.31 7.01 0.65 19.52 17.15
ETHYLENE GLYCOL, c6 31.31 7.01 0.53 21.97 14.70
2-ETHOXYETHANOL c0 16.39 7.33 0.77 6.80 16.37
2-ETHOXYETHANOL c1 16.39 7.33 0.49 9.19 13.98
2-ETHOXYETHANOL c9 16.39 7.33 0.56 10.81 12.36
ACETIC ACID 33.24 3.97 0.47 13.37 8.56
n-BYTYL AMINE 8.64 5.48 0.83 4.98 15.35
DMSO 0.00 8.18 0.54 0.77 19.06
WATER 41.17 3.39 0.59 23.80 11.91
Solvent: DMSO
DMSO (Dimethyl Sulfoxide) 0.00 5.33 0.004 0.01 0.01
ETHANOL 17.55 2.81 0.36 13.17 0.52
1-PROPANOL 17.55 2.81 0.36 13.08 0.51
1-OCTANOL 17.34 2.85 0.36 12.94 0.53
2-PROPANOL 14.53 3.28 0.36 12.54 0.53
ETHYLENE GLYCOL, c0 27.50 4.57 0.41 25.79 0.92
ETHYLENE GLYCOL, c6 27.50 4.57 0.29 26.00 0.71
2-ETHOXYETHANOL c0 14.39 4.78 0.62 11.62 1.14
2-ETHOXYETHANOL c1 14.39 4.78 0.30 12.02 0.74
2-ETHOXYETHANOL c9 14.39 4.78 0.29 12.19 0.57
ACETIC ACID 29.20 2.59 0.31 18.81 0.49
n-BYTYL AMINE 7.59 3.58 0.04 0.50 0.06
WATER 36.16 2.21 0.33 28.28 0.58
Disclaimer/Publisher’s Note: The statements, opinions and data contained in all publications are solely those of the individual author(s) and contributor(s) and not of MDPI and/or the editor(s). MDPI and/or the editor(s) disclaim responsibility for any injury to people or property resulting from any ideas, methods, instructions or products referred to in the content.
Copyright: This open access article is published under a Creative Commons CC BY 4.0 license, which permit the free download, distribution, and reuse, provided that the author and preprint are cited in any reuse.
Prerpints.org logo

Preprints.org is a free preprint server supported by MDPI in Basel, Switzerland.

Subscribe

© 2024 MDPI (Basel, Switzerland) unless otherwise stated