1. Introduction
The global popularity of Japanese cuisine has led to increased demand for Japanese Wagyu beef [
1]. The most distinctive feature of Wagyu beef is its intricate marbling, which enhances the meat's smooth texture, tenderness, and unique flavor by providing a melt-in-the-mouth experience.
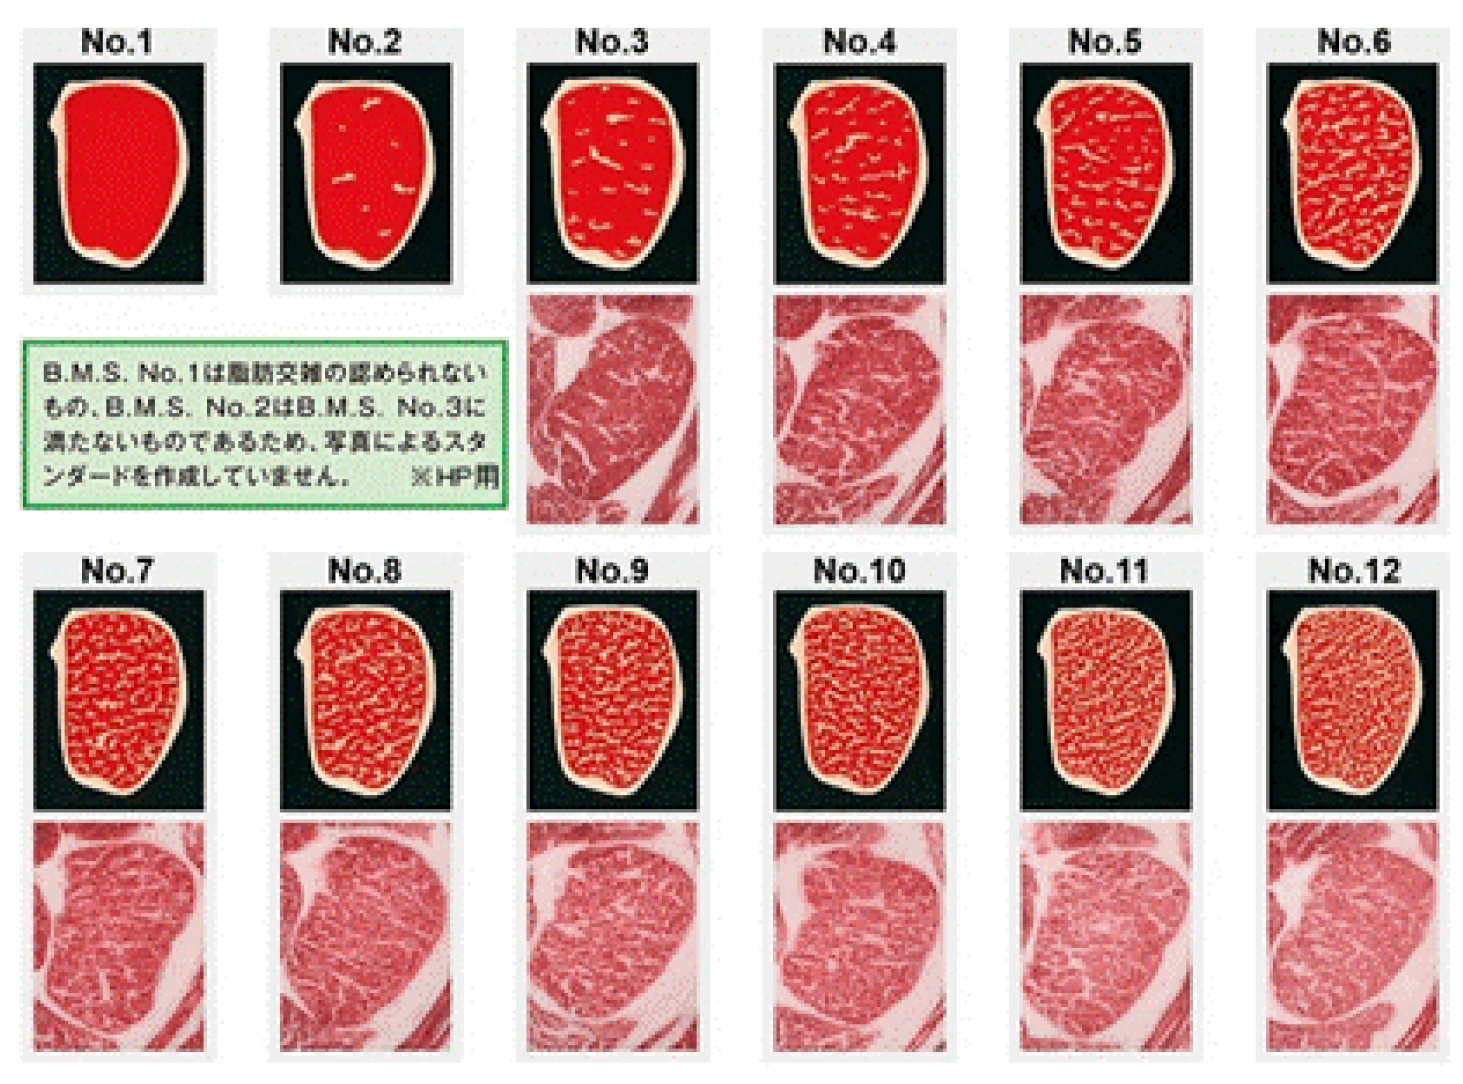
Currently, the evaluation of Wagyu marbling is performed visually by certified graders. This marbling evaluation is known as Beef Marbling Standard Number (BMSNo), which ranges from 1 to 12. The evaluation is based on the extent of marbling in the longissimus dorsi muscle, as well as the spinalis dorsi and semispinalis capitis muscles, between the sixth and seventh ribs. Higher marbling levels correspond to higher BMSNo values. The grading is conducted according to the standards set by the Japan Meat Grading Association (JMGA) [
2], as shown in
Figure 1.
Table 1 illustrates the relationship between the 12-level BMSNo and the five-level marbling evaluation.
However, visual evaluation by graders presents several challenges: differences in evaluation criteria among graders, reduced accuracy due to long working hours and external factors causing fatigue, and fluctuations in grading standards due to the grader's mood. These factors introduce variability in the evaluation.
Hashimoto et al. [
3] investigated a low-cost, objective method for estimating marbling using biopsy to measure moisture and crude fat content. However, this method is complex as it requires grinding the longissimus dorsi muscle after cutting it at the slaughterhouse, and it necessitates specialized knowledge and equipment.
Kuchida et al. [
4] proposed an image analysis method for estimating BMSNo from the fat area ratio using a dedicated imaging device. While this method can estimate BMSNo, it does not account for the complexity and fineness of marbling and requires specialized imaging equipment.
To address the complexity and fineness of marbling, Chen et al. applied fractal analysis to the marbling images of beef from China and the United States [
5]. Fractal theory, proposed by Mandelbrot, uses the fractal dimension as a key indicator of the complexity of fractal patterns. Chen et al. used this parameter for analysis and evaluation.
In the United States, beef quality grades are divided into eight levels, with the highest grade being "Prime." The marbling grade, unlike in Japan, is based on the cross-section of the longissimus dorsi muscle between the twelfth and thirteenth ribs, classified into ten levels. The top three levels are categorized as "Prime" [
6,
7].
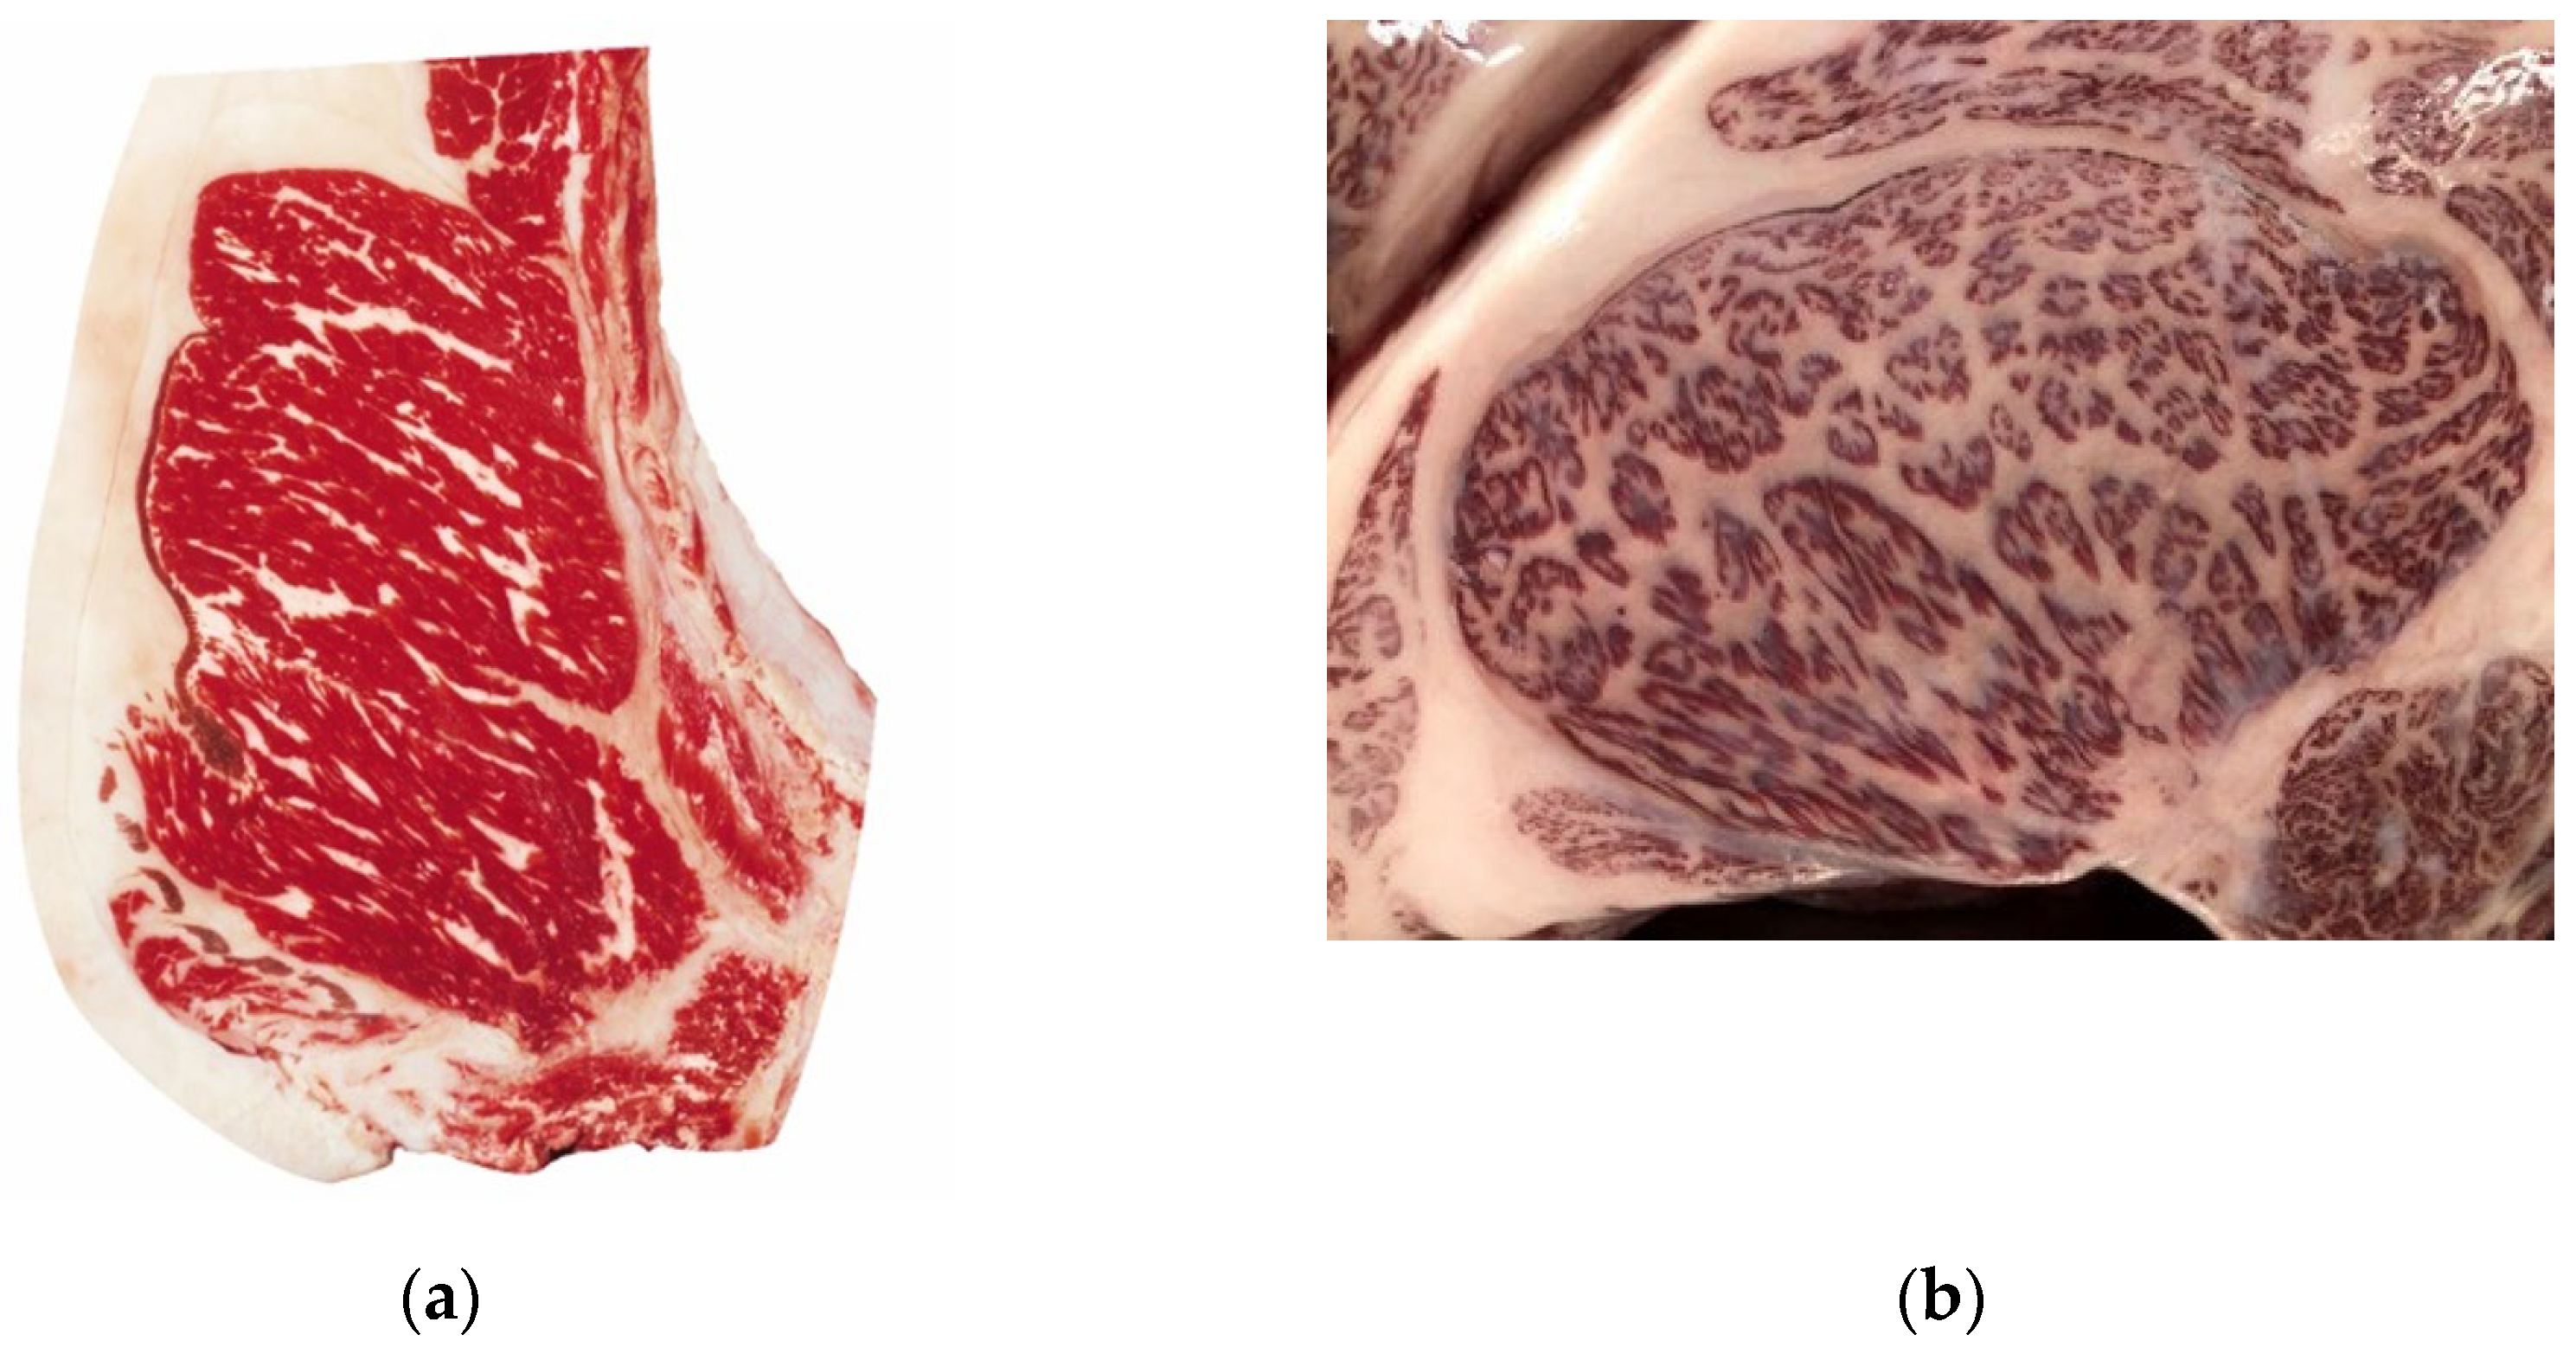
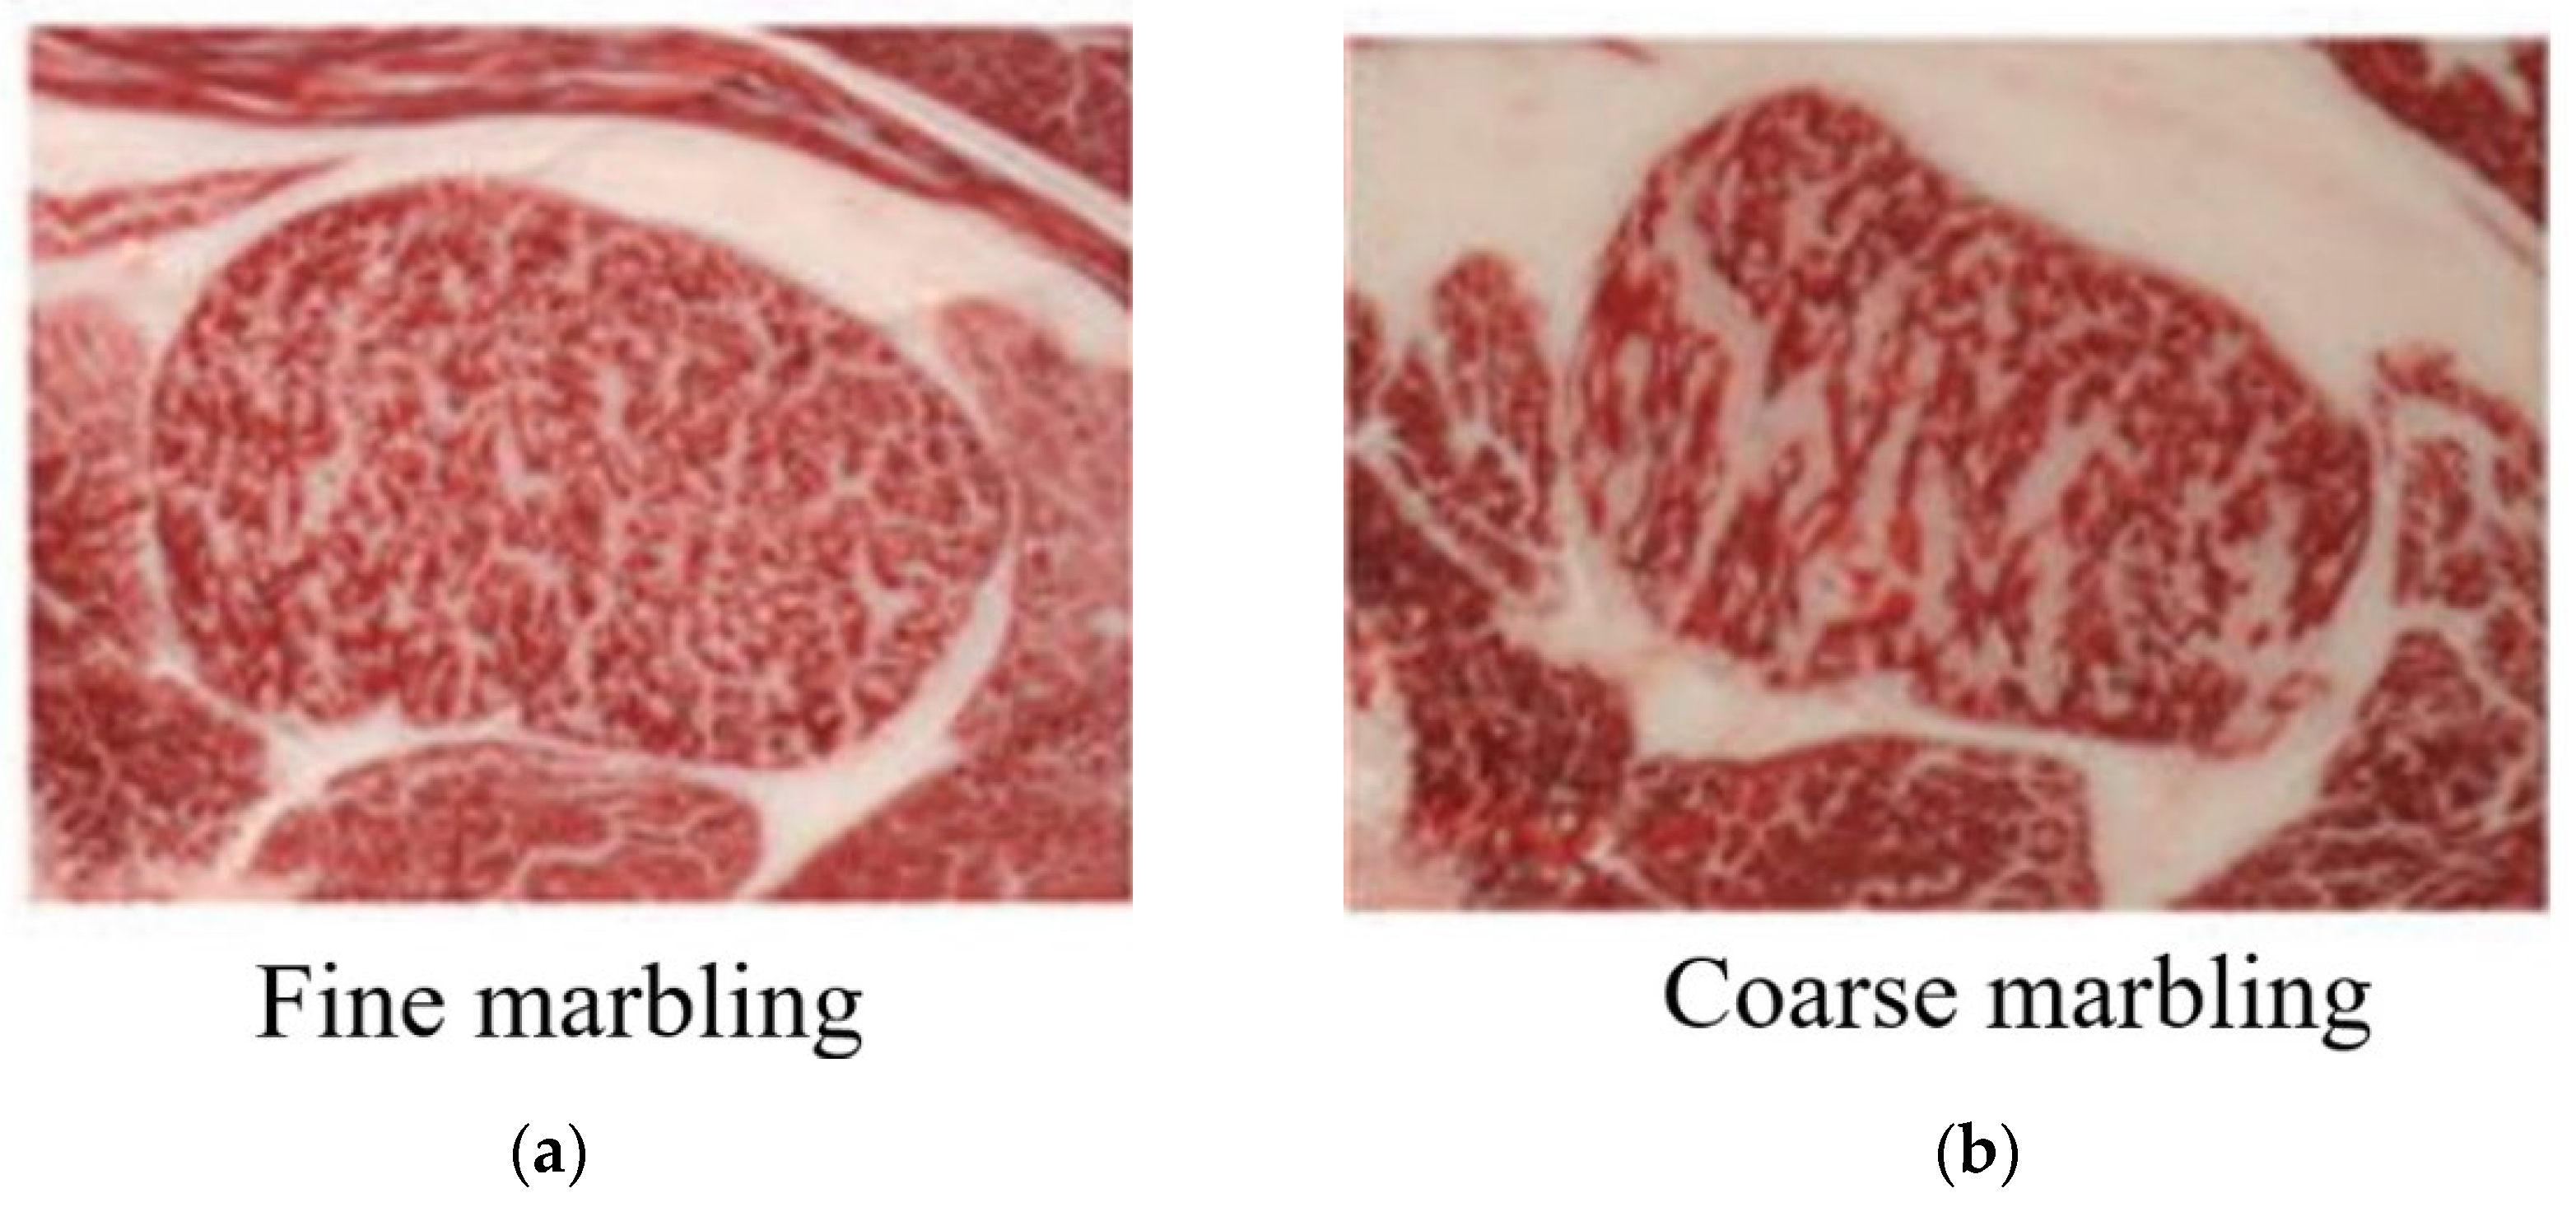
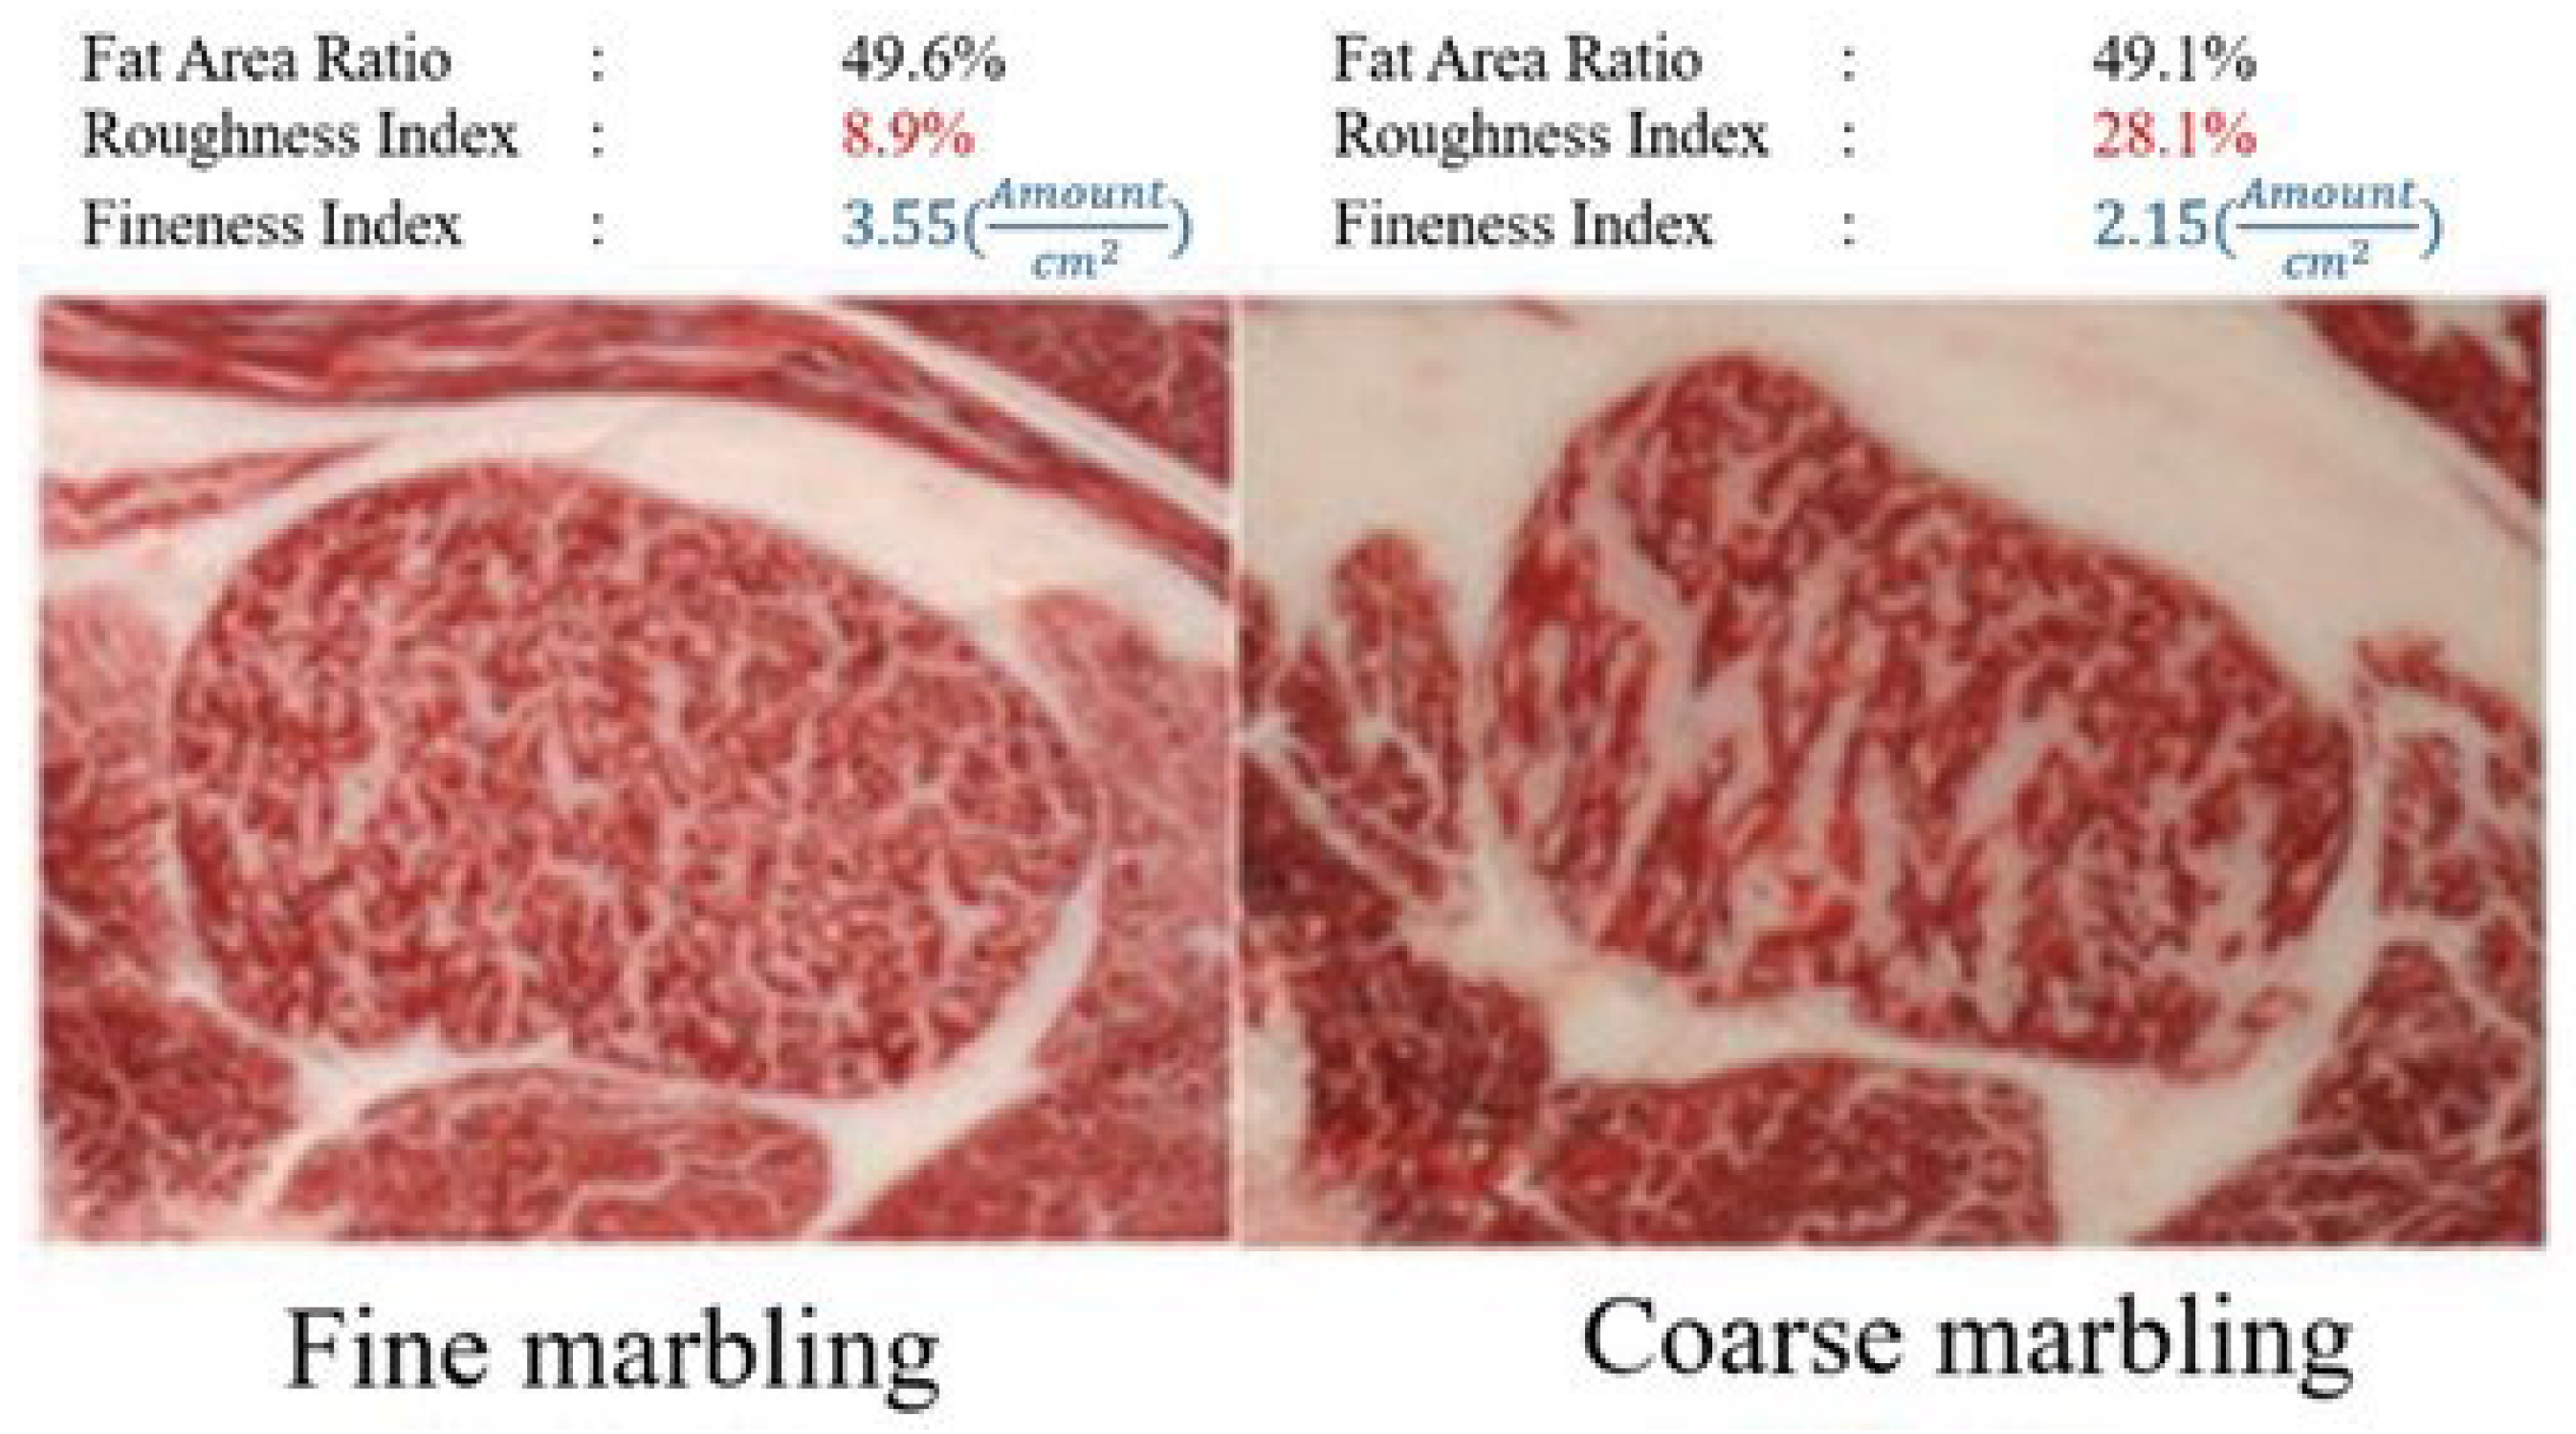
Figure 2 compares images of "Moderately Abundant," the second highest marbling grade in the U.S., with BMSNo.11, the second highest marbling grade in Japan. The complexity of Wagyu marbling is more pronounced than that of U.S. beef. Increased marbling complexity can result in "coarse marbling" or "fine marbling," as shown in
Figure 3. These characteristics are considered in Wagyu evaluation, necessitating a new method tailored to the detailed grading system used for Wagyu.
In contrast, Xiao et al. [
8] adjusted the marbling grades of Chinese beef from four to seven classes. However, even the highest grade with a marbling area of 14% is less complex compared to Wagyu. This paper proposes a fractal analysis method that considers the unique marbling characteristics of Japanese Wagyu, such as "coarse marbling" and "fine marbling," for accurate evaluation.
2. Materials and Methods
2.1. Beef Quality Grading Evaluation
The quality grading of Wagyu beef is currently conducted through qualitative visual assessment by certified graders based on the evaluation method established by the Japan Meat Grading Association (JMGA). This evaluation encompasses four criteria: "meat color and brightness," "firmness and texture of the meat," "marbling," and "fat color and quality." Each criterion is rated on a five-point scale, where higher numbers indicate better quality.
This study focuses specifically on the evaluation of "marbling," a characteristic feature of Wagyu beef. The "marbling" criterion is assessed using the Beef Marbling Standard Number (BMSNo), which ranges from 1 to 12. This standard, developed by the Livestock Industry Technology Station of the Ministry of Agriculture, Forestry and Fisheries, measures the fineness and distribution of marbling within the beef [
10].
2.2. Fractal Analysis
Fractal analysis is a technique that analyzes fractal patterns in images to calculate a parameter known as the fractal dimension, which is then used for various evaluations. While fractal analysis can include multifractal analysis—where additional concepts like the information dimension
() and correlation dimension
()are used—previous studies have shown that these dimensions have low correlation with the marbling in beef used in this study [
3]. Therefore, this paper focuses solely on the fractal dimension
().
There are several methods for performing fractal analysis to determine the fractal dimension. In this study, we use the box-counting method, the most commonly used technique in computer-based fractal analysis, to calculate the fractal dimension. The box-counting method involves covering the image with a grid of boxes of varying sizes and counting the number of boxes that contain part of the fractal pattern. The fractal dimension is then derived from the relationship between the size of the boxes and the number of boxes that contain part of the pattern.
2.3. Box-Counting Method
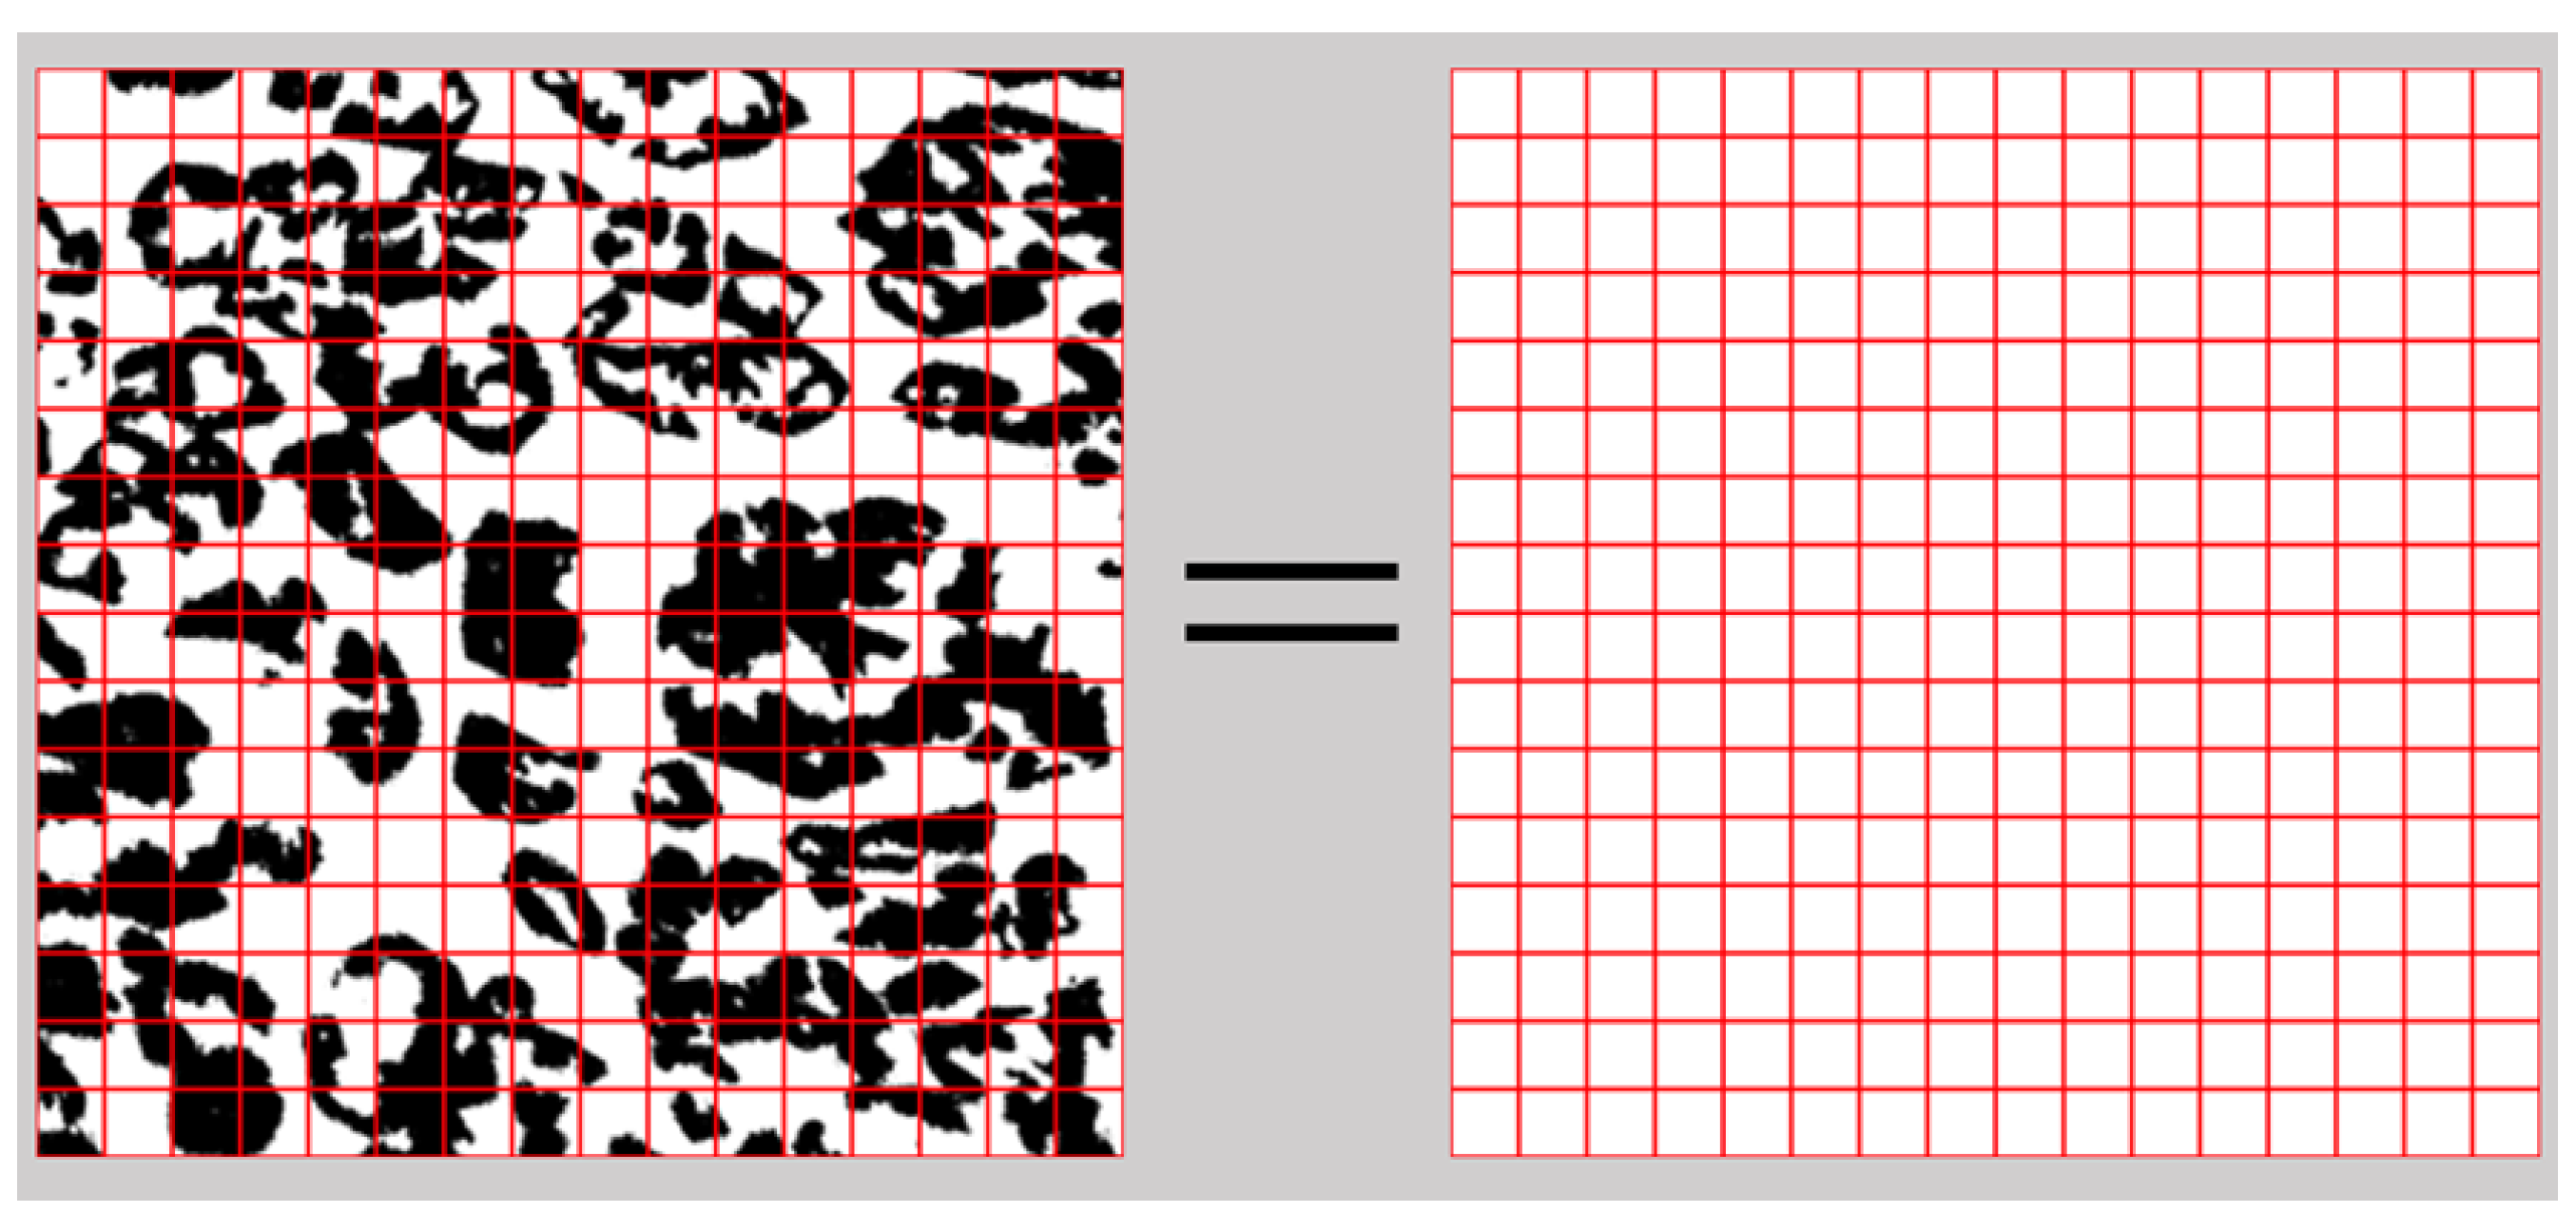
The box-counting method is one of the techniques used to calculate the fractal dimension. As shown in
Figure 4, the box-counting method involves determining the presence probability for each box at a given box size
ε, and then calculating the fractal dimension. The process involves repeatedly halving the box size
ε.
The fractal dimension
can be calculated using Equations (1) and (2).
In Equation (1),
represents the generalized dimension,
q is the moment order, and
ε is the box size. In Equation (2),
represents the probability of presence for each box. For the fractal dimension
, which we focus on, the moment order
q is set to 0. Thus, setting q=0 in Equation (1) leads to Equation (3).
Similarly, setting q=0 in Equation (2) implies that the presence probability, regardless of its value (except for 0, which would be handled as , returning 0 since no pattern exists in the box), results in a value of 1.
To summarize, in Equation (3) simply counts the number of boxes that cover the pattern. Since the smallest pixel size is 1, it is impossible to determine the limit precisely. Therefore, we plot on the x-axis and on the y-axis, and then approximate the result by taking the slope of the best-fit line through these points.
2.4. Images Used for the Box-Counting Method
When using the box-counting method, it is preferable for the images to be of sizes that are powers of 2 (e.g., ). This ensures that when the box size ε is repeatedly halved, the entire image can be referenced without any parts being excluded or falling outside the scan area. For this study, images were prepared to meet this criterion, ensuring they fit neatly within the boxes during the analysis process. An example of how the images were prepared for use in the box-counting method is provided below.
2.4.1. Photography
The BMSNo evaluation is based on the extent of marbling in the longissimus dorsi muscle, as well as the spinalis dorsi and semispinalis capitis muscles, between the sixth and seventh ribs. The more extensive the marbling, the higher the evaluation. In this study, we focused on the longissimus dorsi muscle, as it is the main component used in the JMGA's Beef Marbling Standard model shown in
Figure 1. Therefore, the subject of our photography was the cross-section of the longissimus dorsi muscle between the sixth and seventh ribs.
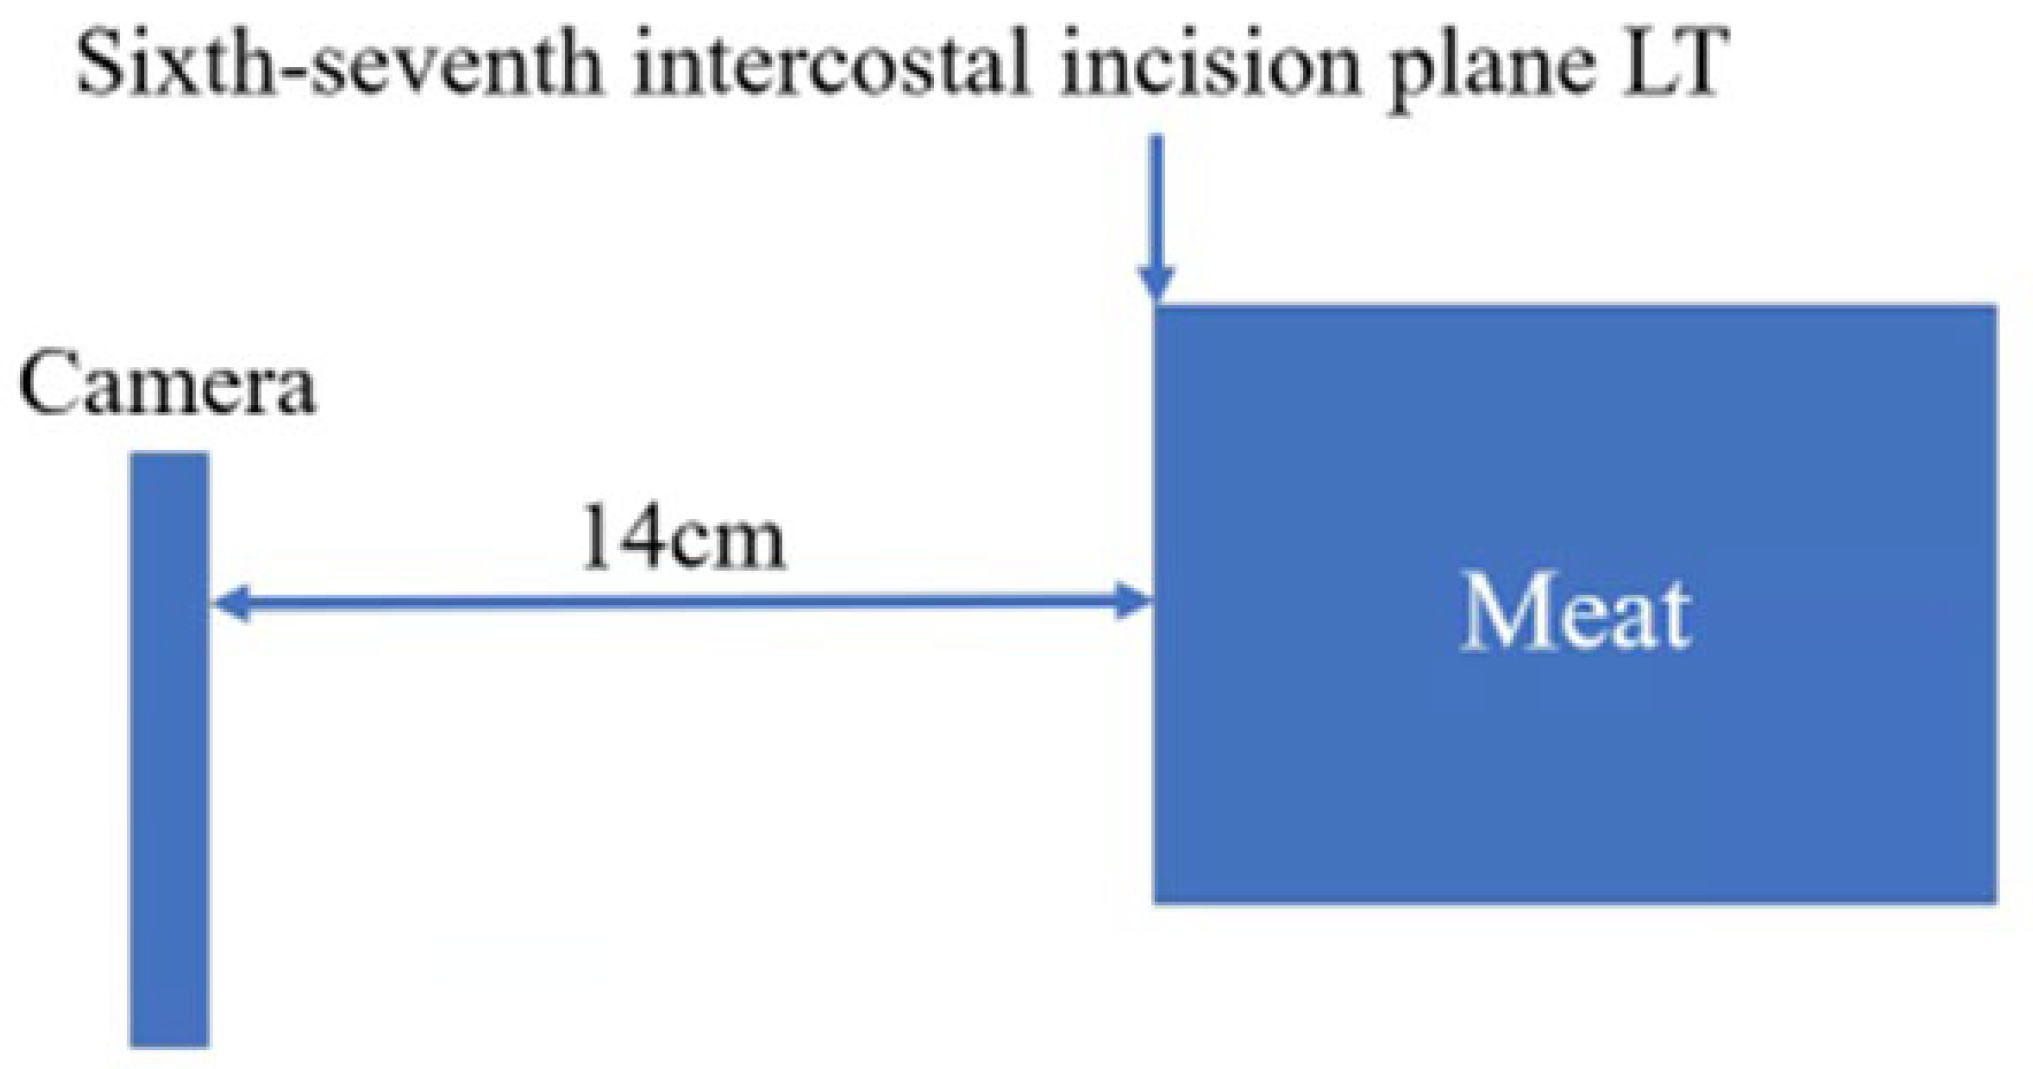
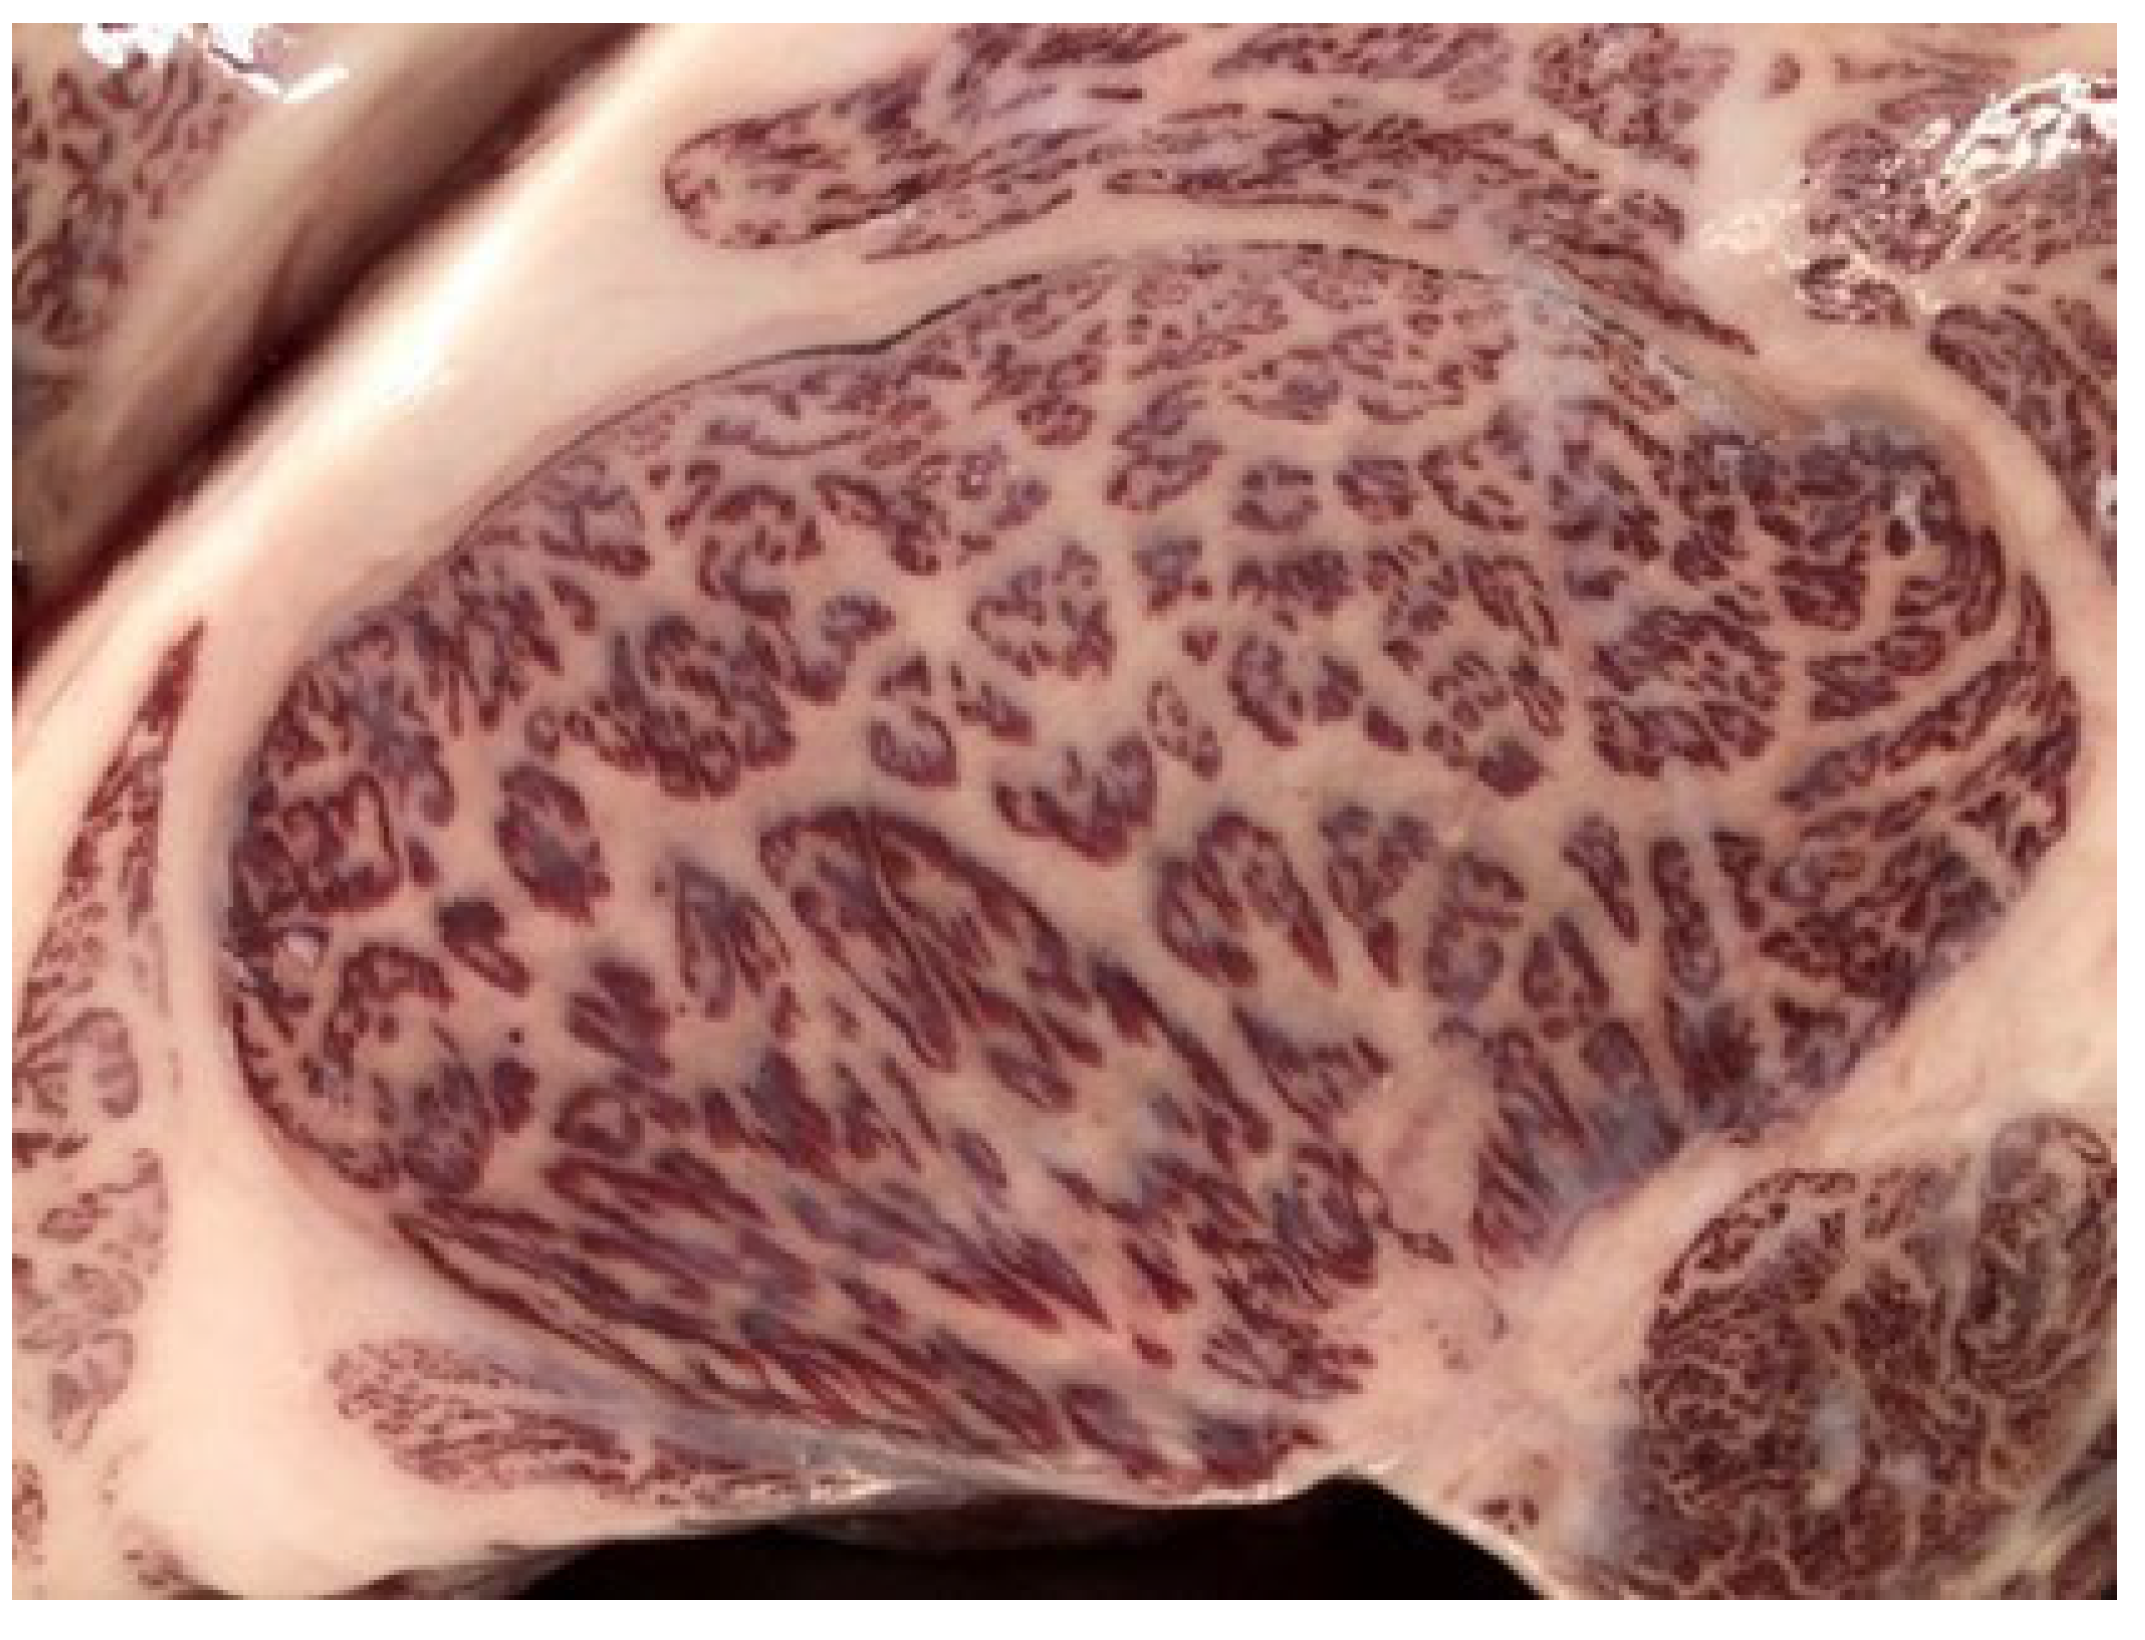
Figure 5 illustrates the photography setup, and
Figure 6 shows the actual photographs taken for analysis.
2.4.2. Trimming
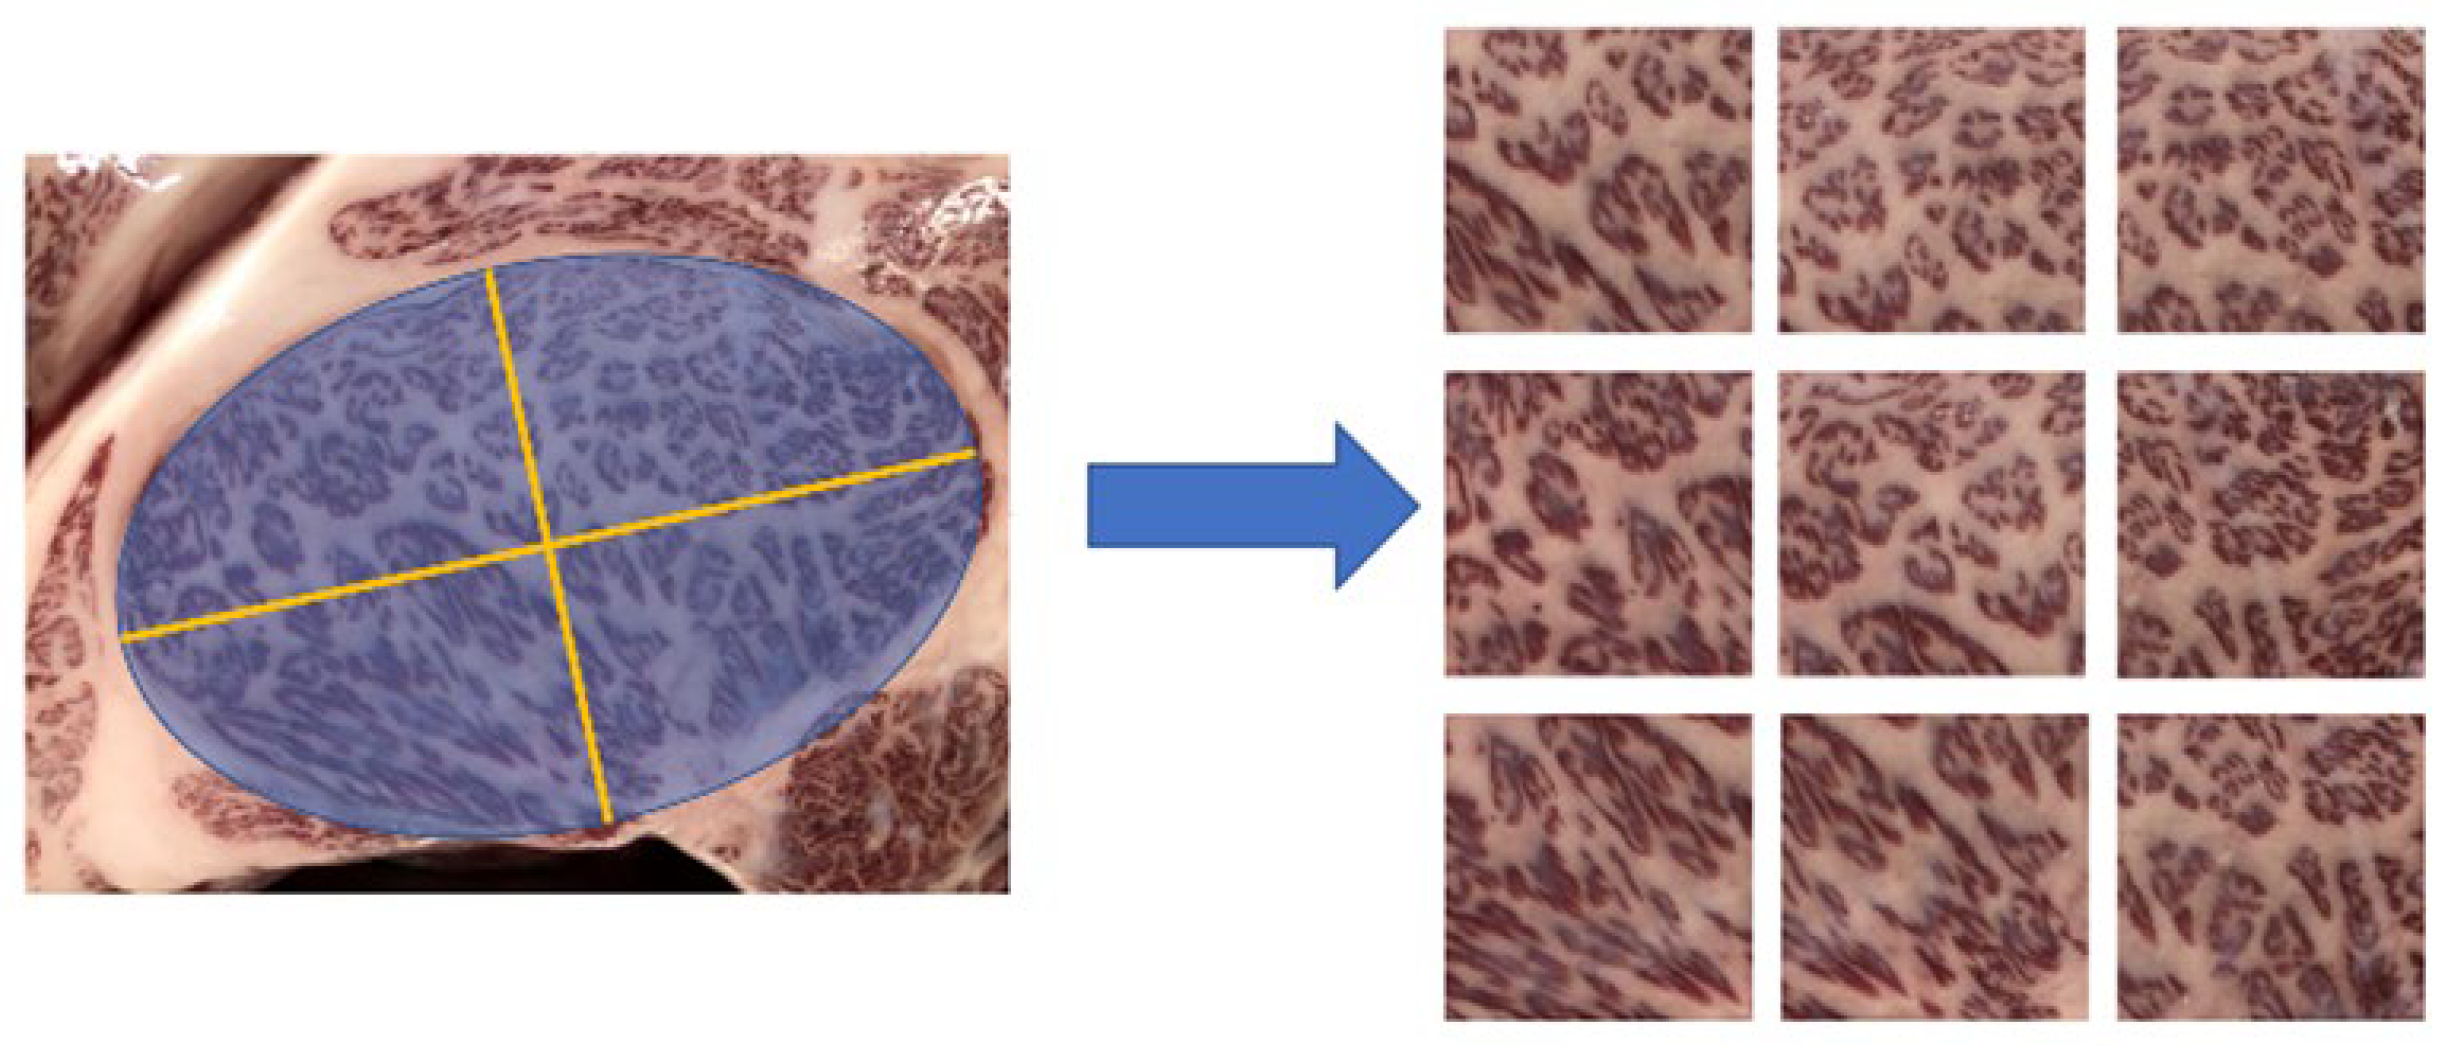
As mentioned in section 2.4, it is preferable for the images used to be of size 2^n×2^n pixels. Therefore, the images are trimmed to a size of 1024 × 1024 pixels. However, trimming to 1024 × 1024 pixels might limit the analyzable area of the longissimus dorsi muscle and may introduce errors if only one analysis per piece of beef is conducted. To address this, the longissimus dorsi muscle is approximated as an ellipse, and nine areas—one central and eight surrounding—are trimmed from a single photograph, ensuring the entire muscle is covered as much as possible. This trimming is performed manually. Each of the nine trimmed images remains 1024 × 1024 pixels in size. An example of this trimming process is shown in
Figure 7.
2.4.3. Grayscale Conversion and Binarization
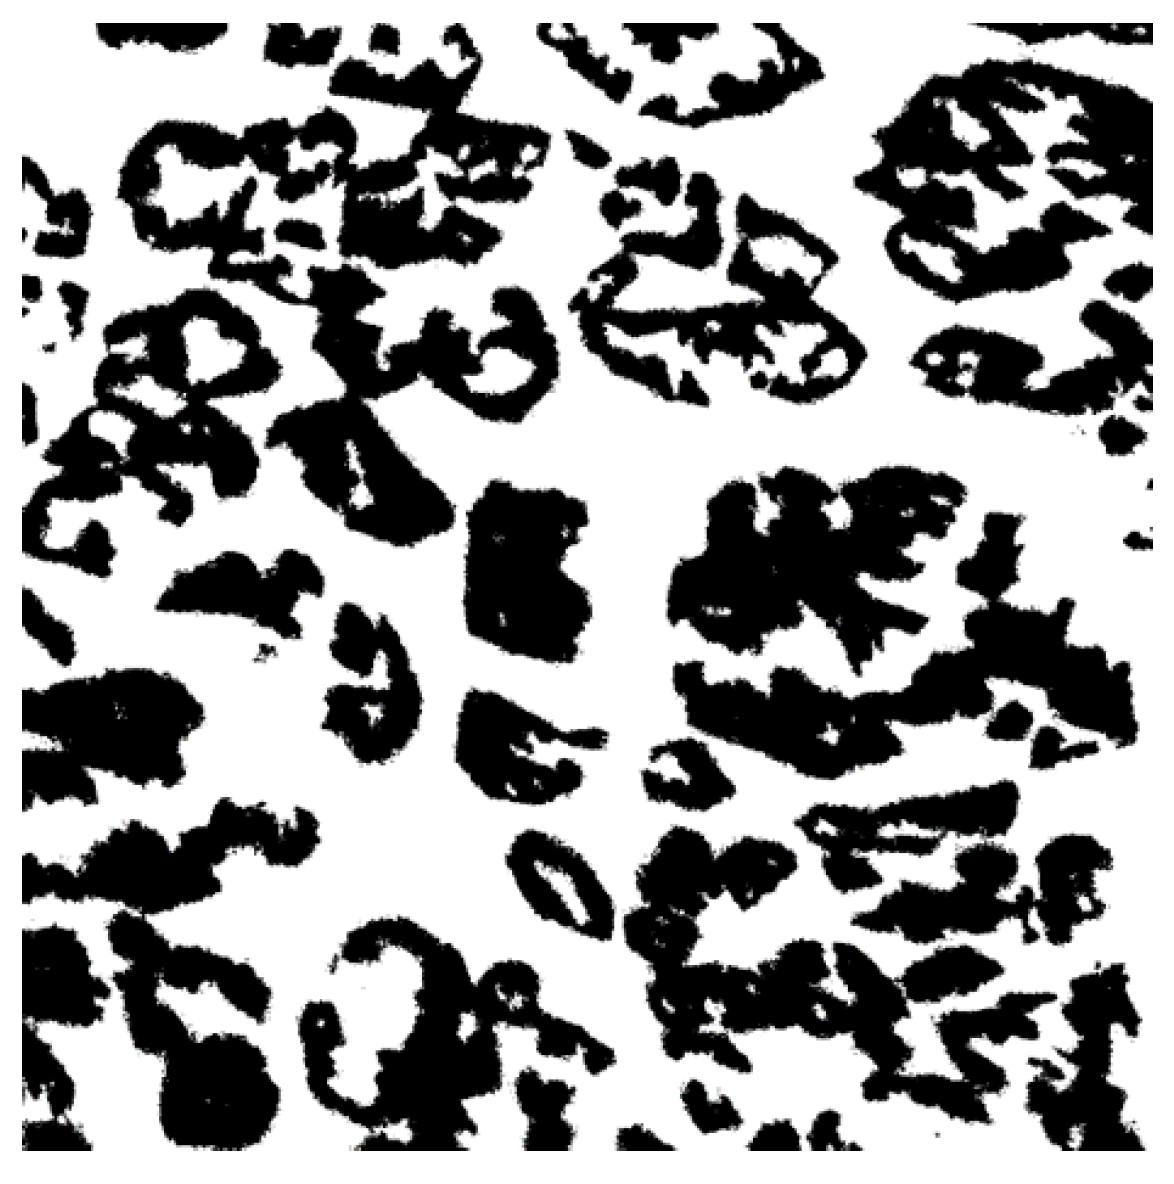
To analyze the marbling patterns using the box-counting method, the images are first converted to grayscale and then binarized. Since different beef samples require different threshold values for binarization, we use Otsu's method [
11] to automatically determine the optimal threshold for each image, rather than setting the threshold manually. An example of an image after these preprocessing steps is shown in
Figure 8.
2.4.4. Box Size
The box-counting method is then applied to the binarized images. For this study, the minimum box size is set to 2, and the maximum box size is set to 32. Therefore, the box sizes used are 2, 4, 8, 16, and 32 pixels. The reason for setting the minimum box size to 2 is that using a box size of 1 would be equivalent to counting the number of marbling pixels, thus merely calculating the area ratio and potentially reducing accuracy. The maximum box size is set to 32 because, at a box size of 64, the entire pattern is covered by the boxes, as shown in
Figure 9, indicating a reduction in analysis accuracy.
2.5. Characteristics of Beef Marbling
The grading of beef marbling in Wagyu tends to be higher for more complex marbling patterns, as finer and more intricate marbling indicates higher quality. Within these marbling patterns, "coarse marbling" refers to coarser marbling, and "fine marbling" refers to finer marbling. coarse marbling is generally considered inferior, resulting in lower grades and a greasier texture. In contrast, fine marbling is considered superior, leading to higher grades and a smoother texture. Obama et al. [
8,
12] established roughness and fineness indices to evaluate coarse marbling and fine marbling. These indices are calculated using Equations (4) and (5).
In Equation (4), R represents the roughness index,
is the area of fat after thin lines are removed, and
is the total fat area. In Equation (5), S is the fineness index, G is the number of fine marbling particles, and A is the area of the ribeye muscle. Examples of coarse marbling and fine marbling calculated using these indices are shown in
Figure 10.
3. Results and Discussion
To demonstrate the effectiveness of the proposed method, three experiments were conducted: verifying the fractality of beef marbling, examining the correlation between BMSNo and the fractal dimension of beef marbling, and considering the characteristics of beef marbling in the experiments.
3.1. Verification of Fractality in Beef Marbling
For fractal analysis to be applied to a target pattern, the target must exhibit fractal properties. Although Chen et al. [
3] utilized fractal analysis on beef marbling, they did not explicitly demonstrate its fractal nature. Therefore, an experiment was conducted to determine whether beef marbling exhibits fractality. Fractal patterns follow power laws, so if a log-log plot yields a coefficient of determination (
) close to 1, it indicates that the pattern has fractal properties [
13].
In this experiment, the photographs were taken as shown in
Figure 5. The author photographed the sixth-seventh rib cut surfaces in the freezer of a permitted wholesale company using an iPhoneX. The camera was held parallel to the beef at a distance of 14 cm, with no zoom, flash, or filters, and the focus was auto-adjusted. The image size was 4032 × 3024 pixels. Examples of the photographs are shown in
Figure 6.
After capturing the images, they were manually trimmed to 1024 × 1024 pixels, approximating the longissimus dorsi muscle as an ellipse, and nine regions (central and surrounding eight) were selected as shown in
Figure 7. These trimmed images were then converted to grayscale and binarized using Otsu’s method [
11] as illustrated in
Figure 8. The box-counting method was applied to these nine preprocessed images with box sizes of 2, 4, 8, 16, and 32 pixels.
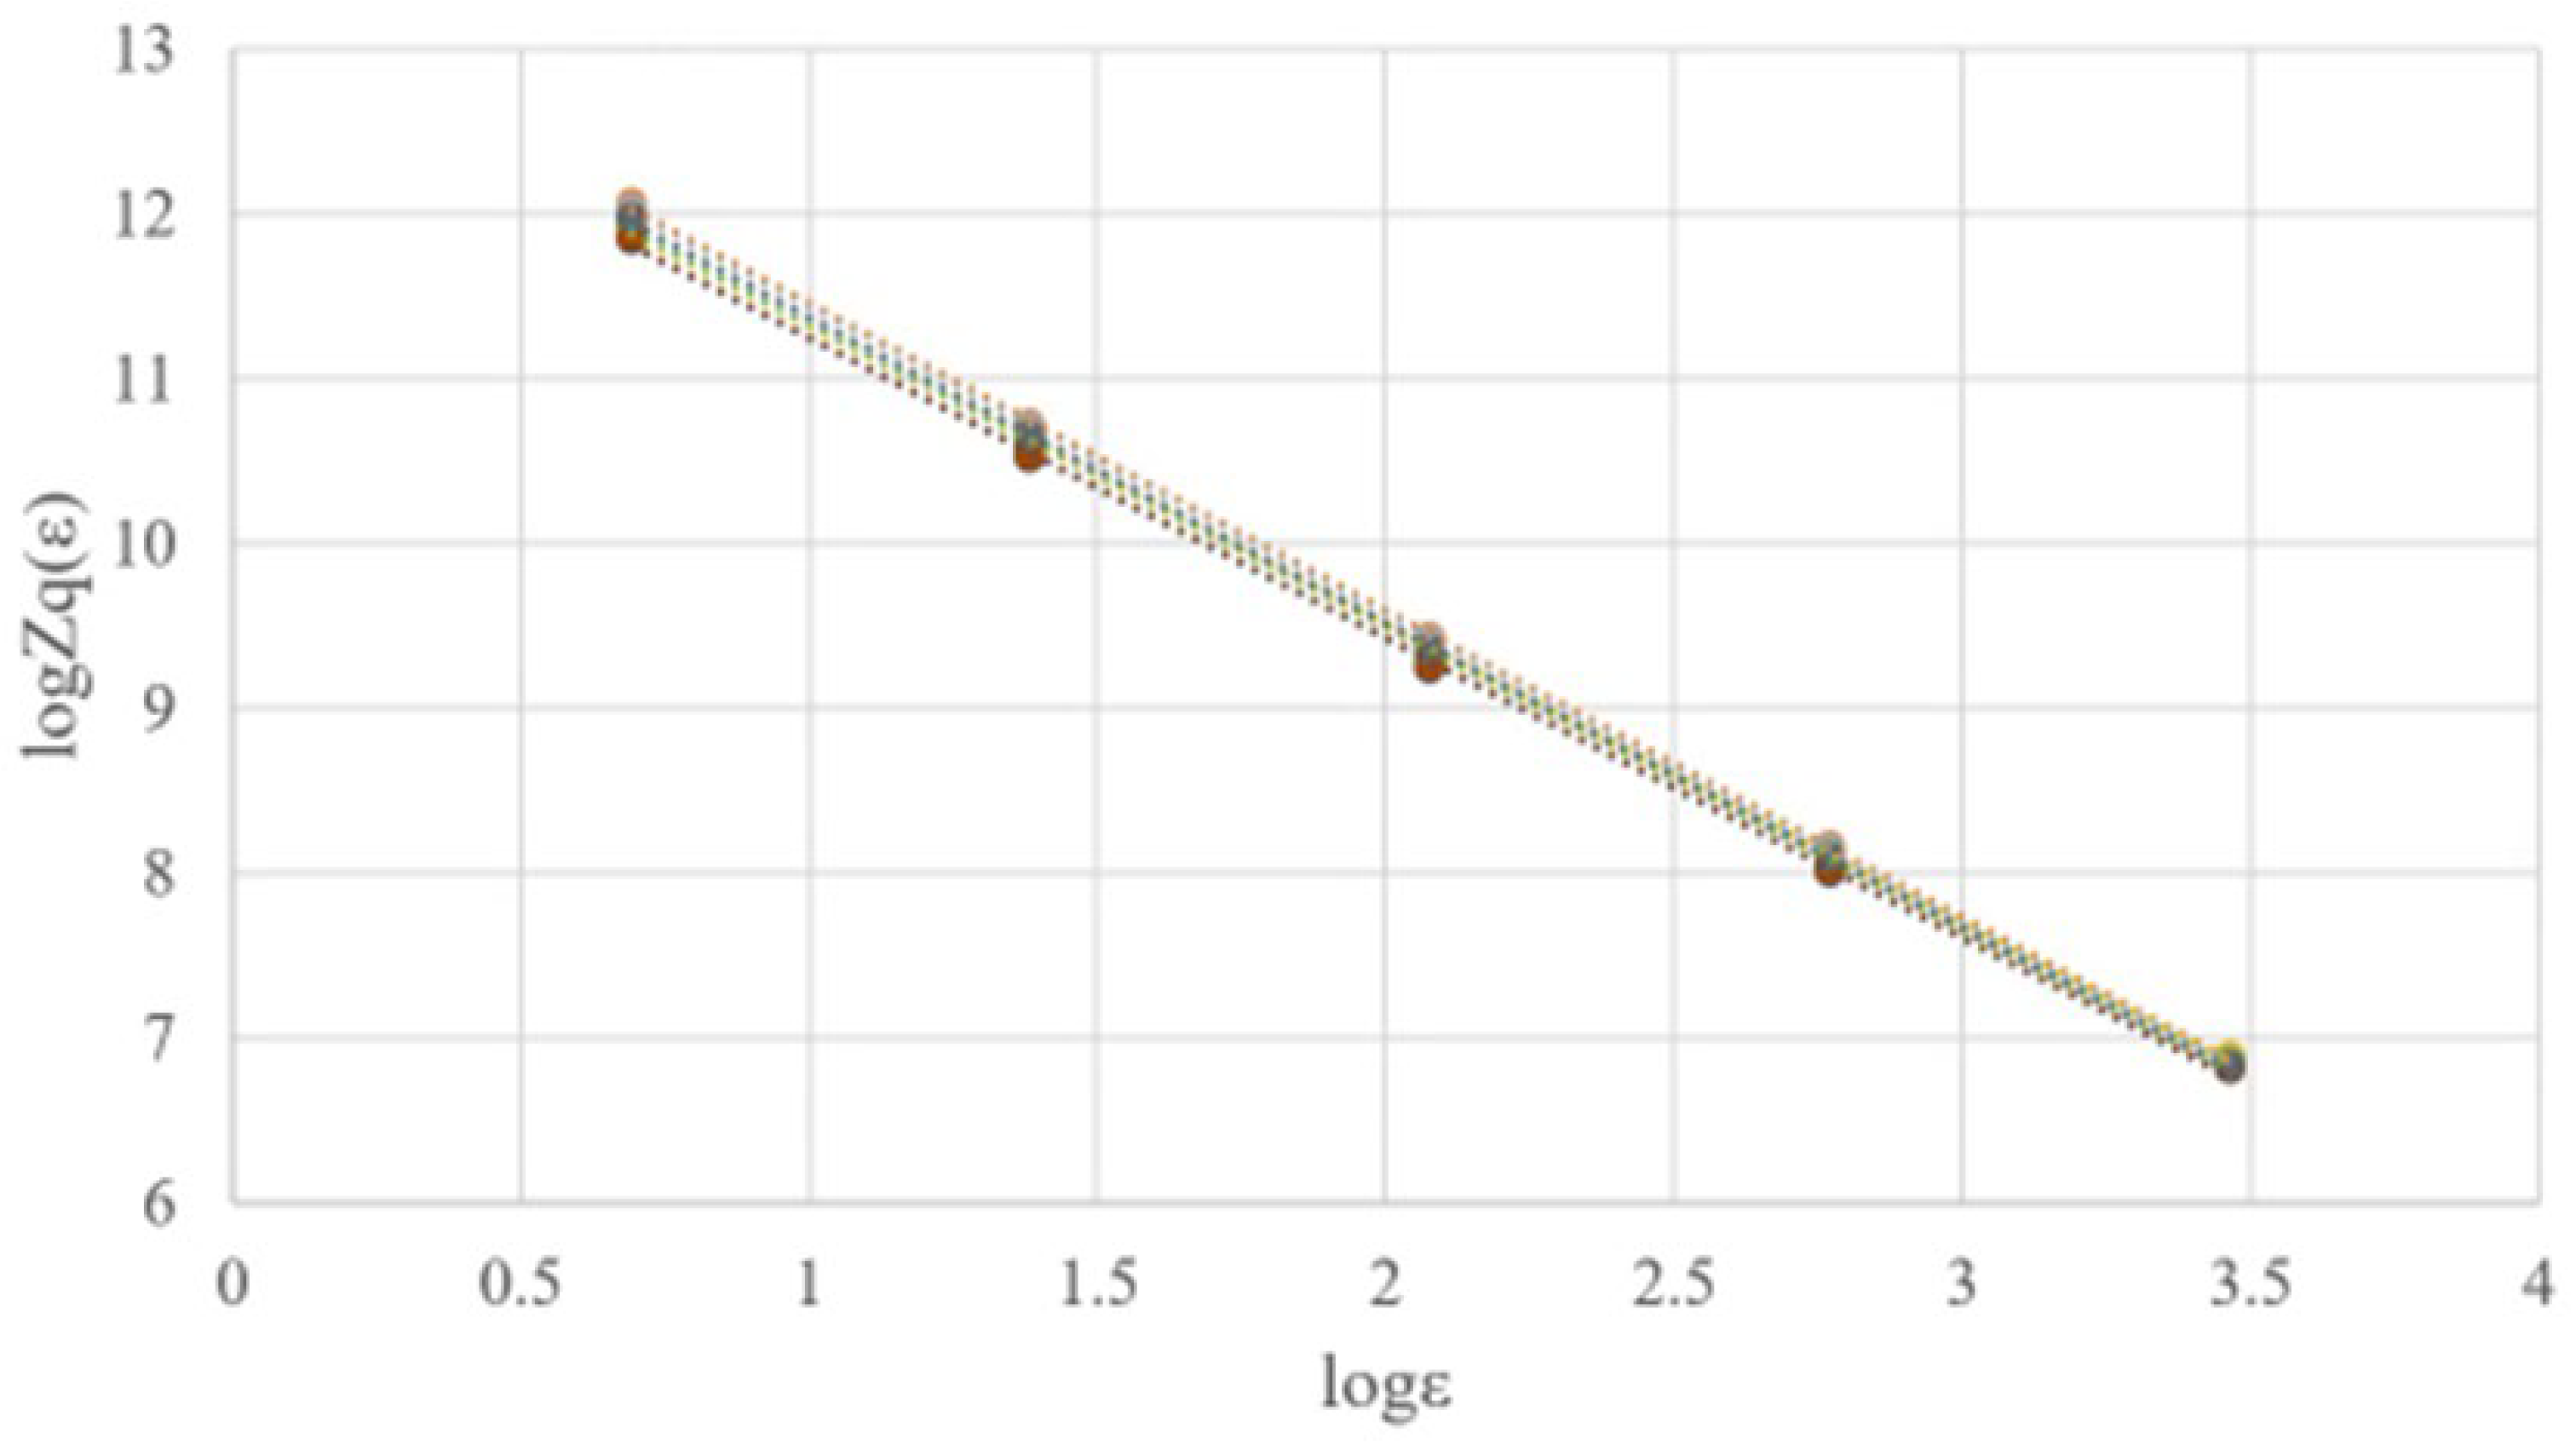
The results of applying the box-counting method to the nine images from a single piece of beef are summarized in a graph shown in
Figure 11. The
values for each of the nine images, indicating the degree of linearity, are shown in
Table 2. By calculating the trimmed mean, excluding the maximum and minimum values, the result was approximately 0.99977, indicating a high degree of linearity. This confirmed the presence of fractality in beef marbling. This process was repeated for all 33 beef samples used in the study. The number of beef samples used in the experiments is shown in the table. After calculating the trimmed mean
for each sample and the overall
for all samples, excluding the top and bottom 5%, the overall
was approximately 0.99973. This confirmed that all beef samples exhibited fractality in their marbling patterns.
3.2. Experiment on the Correlation between BMSNo and the Fractal Dimentsion of Beef Marbling
If a correlation exists between BMSNo and the fractal dimension of beef marbling, BMSNo can be estimated using the fractal dimension. The box-counting method was applied to all beef samples as described in section 3.1, and the fractal dimension was calculated using Equation (3) from section 2.3. Since the minimum pixel size is 1, the limit cannot be directly calculated, so the slope of the approximated linear plot was used to determine the fractal dimension.
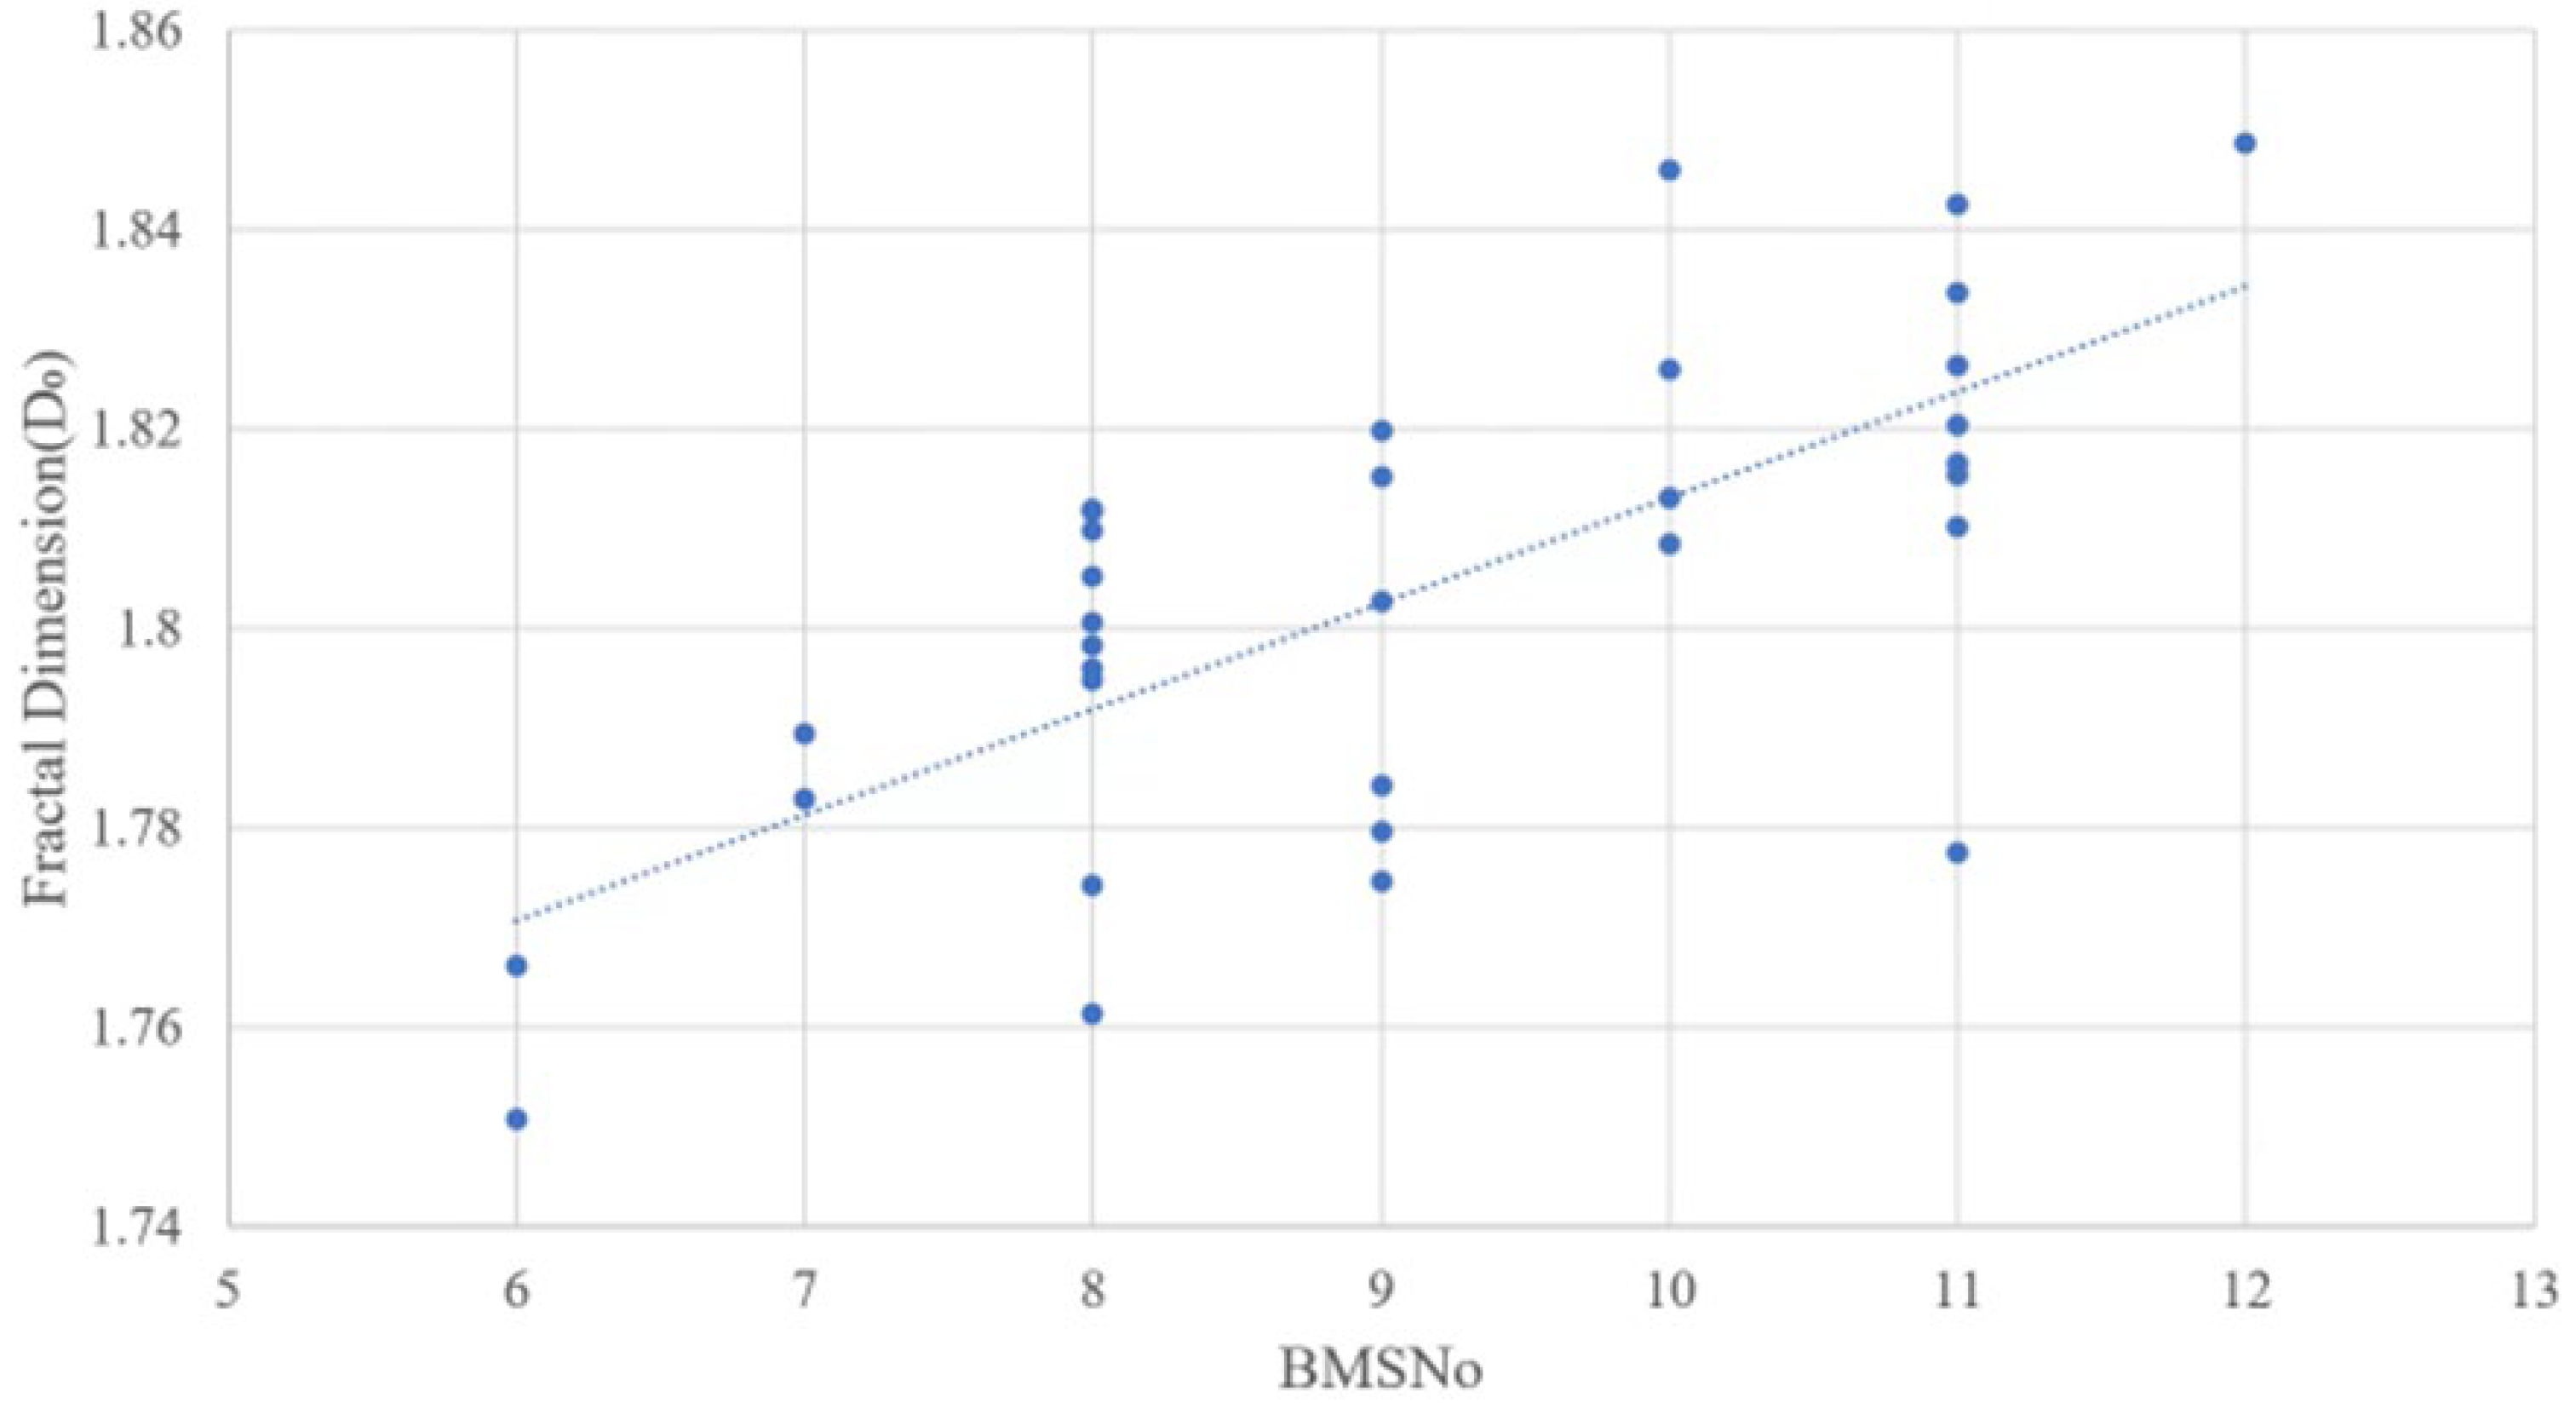
Table 3 shows the fractal dimensions calculated for each piece of beef, and
Figure 12 illustrates the correlation between the fractal dimension and BMSNo. The fractal dimensions in these tables and graphs were calculated as the trimmed mean of the nine images, excluding the maximum and minimum values. The correlation coefficient in
Figure 12 was approximately 0.69558, indicating a positive correlation. This suggests that the fractal dimension can be used to estimate BMSNo, a key indicator of Wagyu beef quality. However, some points were distant from the regression line, likely due to characteristics of marbling such as "coarse marbling" and "fine marbling".
3.3. Experiment Considering the Characteristics of Beef Marbling
In the experiment conducted in section 3.2, points distant from the regression line were observed due to the influence of marbling characteristics such as "coarse marbling" and "fine marbling". Therefore, it is necessary to consider these characteristics when performing fractal analysis. The roughness index and fineness index explained in section 2.5 were used to account for these characteristics. In this experiment, the roughness index was calculated using Equation (4) and the fineness index using Equation (5). The area and total fat area in Equation (4) were determined by counting the white pixels in the binarized images and calculating the area per pixel. The area per pixel was approximately 0.000018716 cm², based on the measured maximum width of the longissimus dorsi muscle.
For the number of fine marbling particles G in Equation (5), ten reduction and dilation operations were performed to isolate the fine marbling particles, and connected white pixel regions were labeled using an 8-neighbor connectivity algorithm. The number of labeled regions was treated as G. The area A of the ribeye muscle was fixed at 19.625 cm², calculated from the known size of the analysis region (1024 × 1024 pixels).
To verify if the results from section 3.2 could be improved, the same beef samples were analyzed using the roughness and fineness indices.
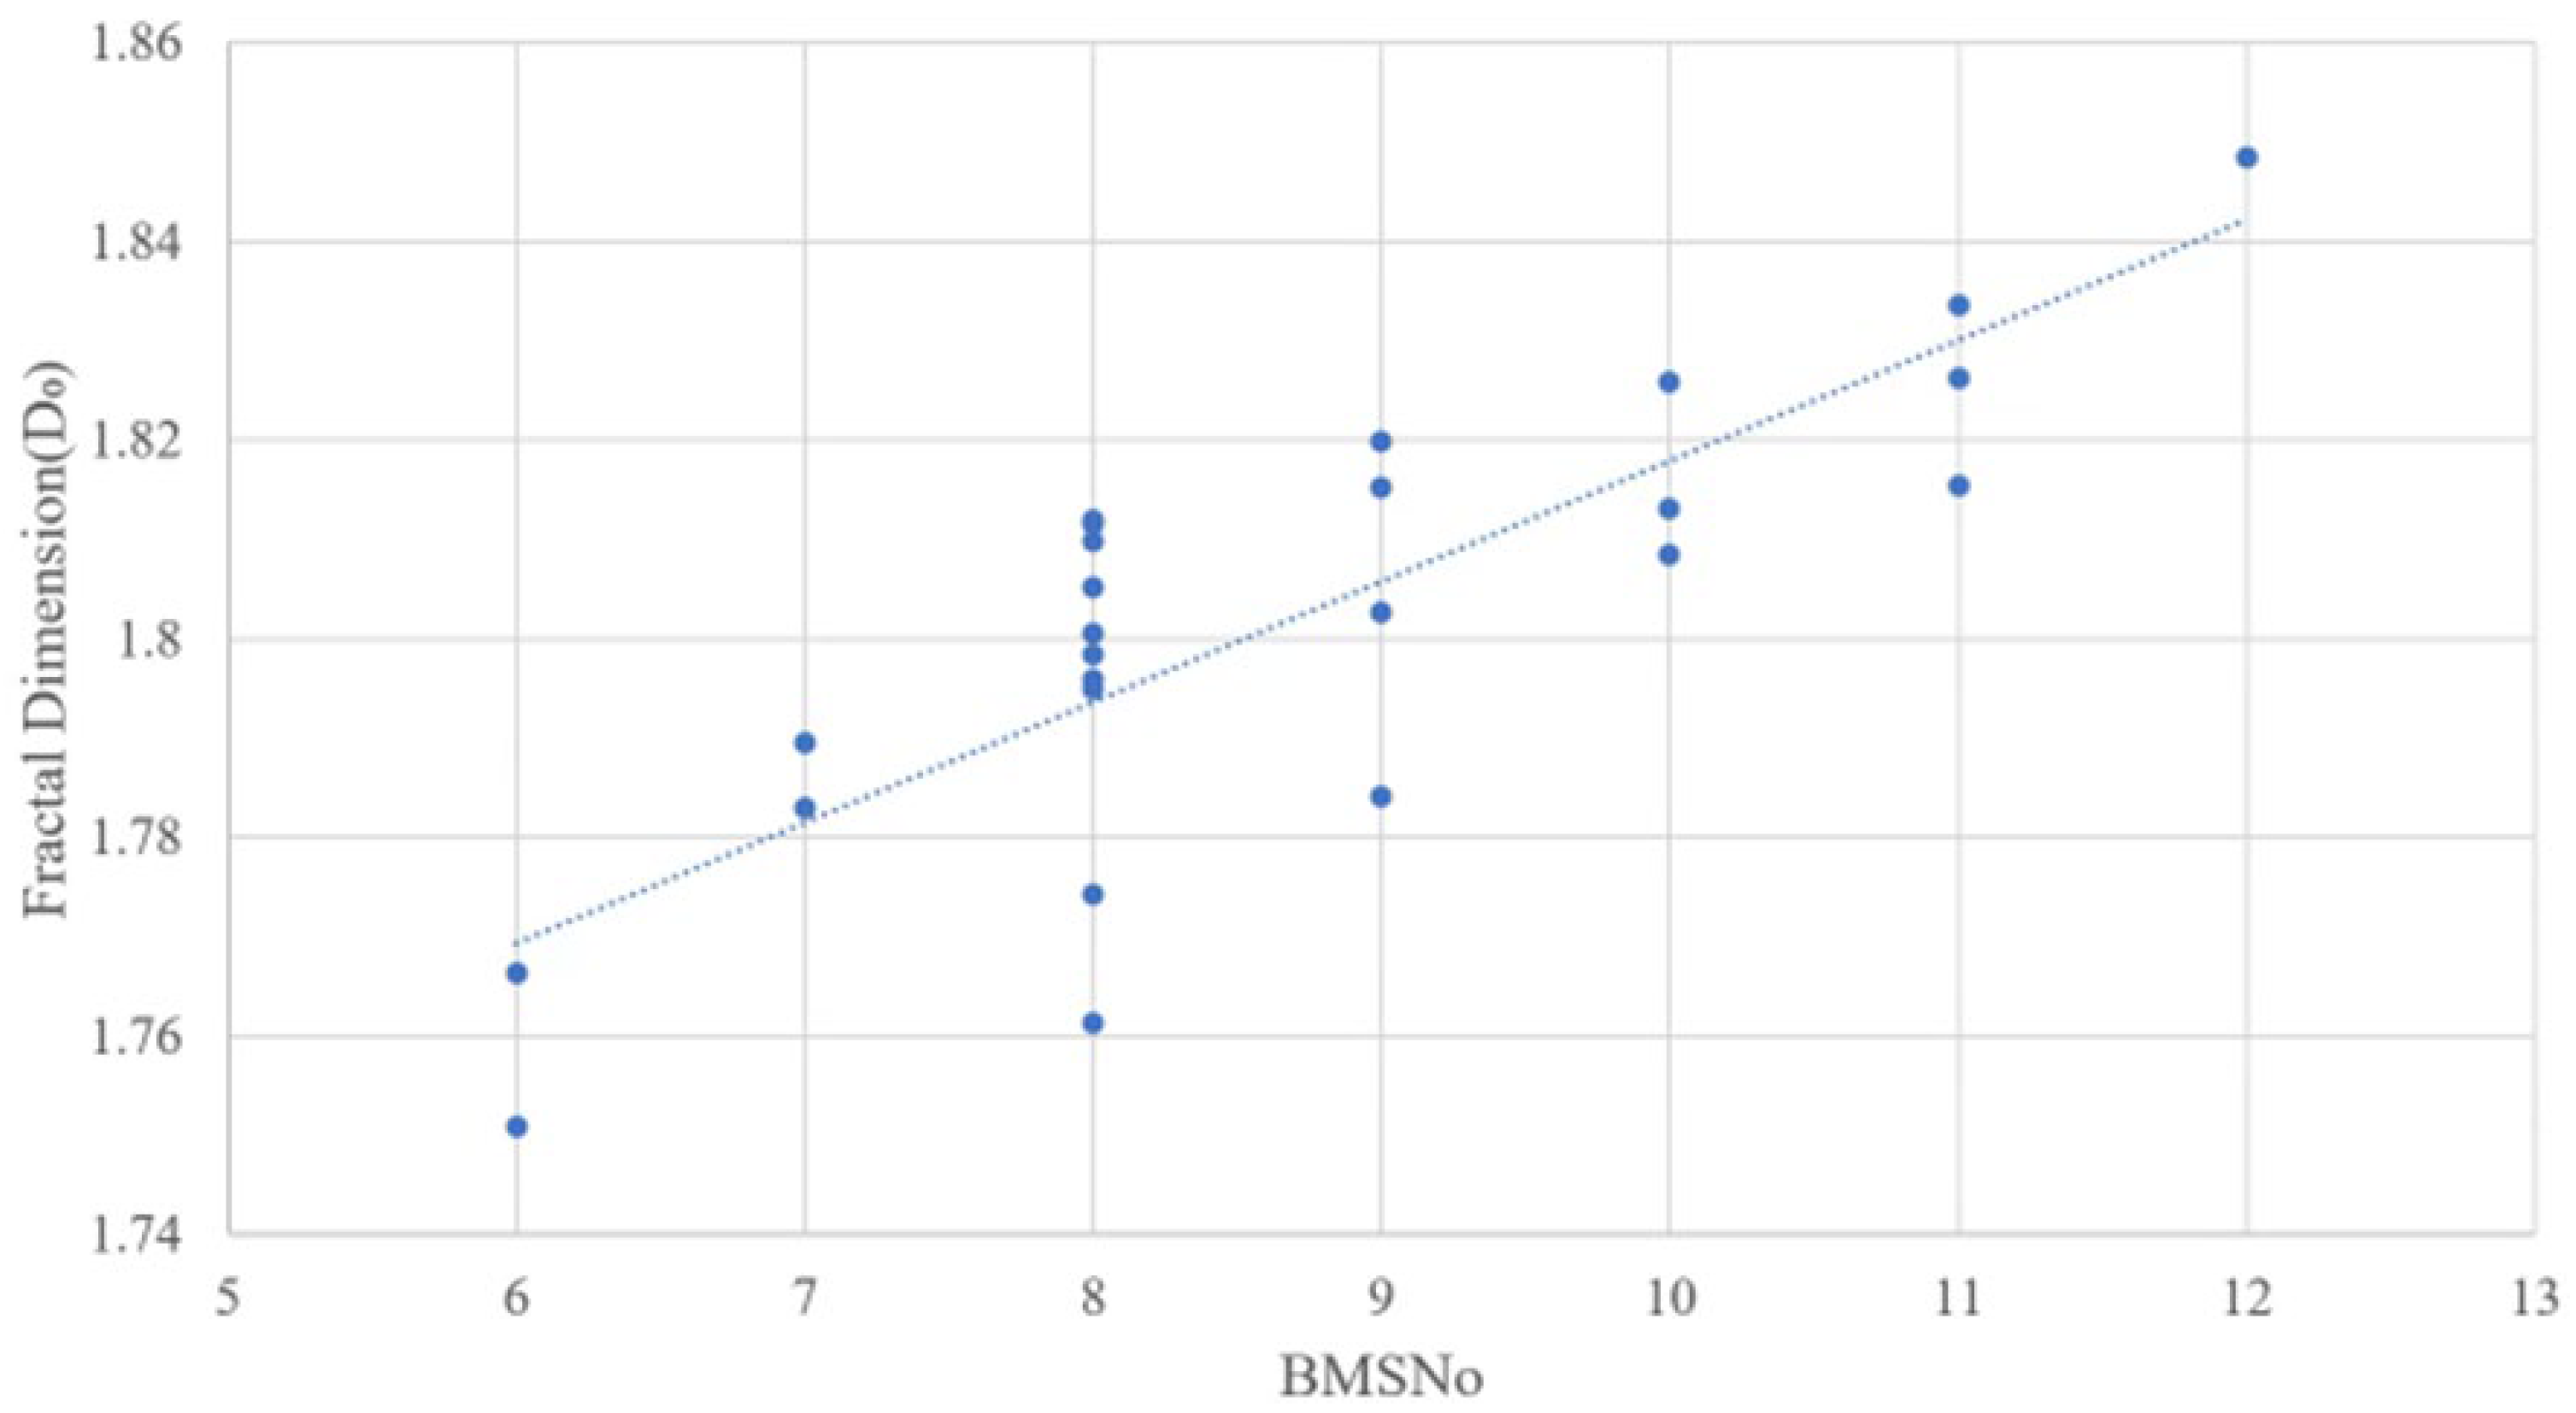
Table 4 shows the calculated roughness and fineness indices for each sample. The average roughness index was approximately 30.5, and the average fineness index was approximately 25.8. Beef samples with a roughness index of 34.3 or higher or a fineness index of 22 or lower were classified as coarse marbling, while those with a roughness index of 26.7 or lower or a fineness index of 29.6 or higher were classified as fine marbling. The remaining samples were plotted in
Figure 13.
The correlation coefficient in
Figure 13 was approximately 0.8183, higher than in section 3.2, indicating improved accuracy. This suggests that considering the characteristics of coarse marbling and fine marbling can enhance the accuracy of BMSNo estimation. However, since BMSNo is determined by human graders, there is inherent variability, which likely increased the scatter in the results. Nonetheless, the average BMSNo values for each group in
Figure 13 show correct grading, confirming that accounting for marbling characteristics such as coarse marbling and fine marbling improves BMSNo estimation accuracy.
4. Conclusions
In this study, we proposed quantifying the grading evaluation of Wagyu beef, which is traditionally performed visually, by using image processing. Three experiments were conducted to achieve this goal.
The first experiment aimed to verify the fractality of beef marbling. Through fractal analysis of beef marbling patterns, it was suggested that beef marbling indeed possesses fractal properties. This implies that fractal analysis is applicable to beef marbling.
The second experiment investigated the correlation between BMSNo and the fractal dimension of beef marbling. Fractal analysis was performed on all prepared beef samples, and it was suggested that there is a positive correlation between BMSNo and the fractal dimension of beef marbling. This indicates that BMSNo can be estimated using the fractal dimension. However, the results showed some outlier points, which were suggested to be influenced by specific characteristics of beef marbling.
The third experiment considered these characteristics by incorporating the concepts of the roughness index and fineness index into the analysis. By classifying and excluding beef samples estimated to have coarse or fine marbling, the correlation coefficient between BMSNo and the fractal dimension of beef marbling improved compared to the second experiment. This suggests that classification of marbling characteristics can enhance accuracy.
In the future, it will be necessary to establish thresholds for defining coarse and fine marbling characteristics, considering their impact on BMSNo. By adjusting the BMSNo value based on these characteristics, we can improve the precision of grading evaluations.
Author Contributions
Conceptualization, Y.S. and B.Y.; methodology, Y.S.; software, Y.S.; validation, Y.S. and B.Y.; formal analysis, Y.S.; investigation, Y.S.; resources, Y.S.; data curation, Y.S.; writing—original draft preparation, Y.S.; writing—review and editing, Y.S. and B.Y.; visualization, Y.S.; supervision, B.Y.; project administration, B.Y.; funding acquisition, B.Y. All authors have read and agreed to the published version of the manuscript.
Funding
This research received no external funding.
Institutional Review Board Statement
Not applicable.
Informed Consent Statement
Not applicable.
Data Availability Statement
The datasets used or analyzed during the current study are available from the corresponding author upon reasonable request.
Conflicts of Interest
We declare that there is no conflict of interest.
References
- Inagaki, S.; Amano, Y.; Kumazawa, K. Identification and Characterization of Volatile Components Causing the Characteristic Flavor of Wagyu Beef (Japanese Black Cattle). Agricultural and Food Chemistry 2017, 65, 8691–8695. [Google Scholar] [CrossRef] [PubMed]
- JAPAN MEAT GRADING ASOCIATION. Available online: http://www.jmga.or.jp/standard/beef/ (accessed on 29 June 2022).
- Hashimoto, D.; Iwamoto, T.; Hayata, G.; Nakanishi, Y. The Relationship Between Moisture or Crude Fat Content in Biopsy Muscle Samples and Carcass Fat Marbling in Fattening Cattle. Warm Regional Society of Animal Science 2014, 57, 141–145. [Google Scholar]
- Kuchita, K.; Osawa, T.; Hori, T.; Kotaka, H.; Maruyama, S. Evaluation and genetics of carcass cross section of beef carcass by computer image analysis. Animal Genetics 2006, 34, 45–52. [Google Scholar] [CrossRef] [PubMed]
- Chen, J.; Liu, M.; Zong, L. The Fractal Dimension Research of Chinese and American Beef Marbling Standards Images. CCTA 2012, IFIP AICT 2013, 392, 199–209. [Google Scholar]
- Agricultural marketing Service, U.S. DEPARTMENT OF AGRICULTURE. Available online: https://www.ams.usda.gov/ (accessed on 9 July 2024).
- U.S. Meat Export Federation. Available online: https://www.americanmeat.jp/trd/database/rank/r_001.html (accessed on 9 July 2024).
- Hyogo Prefectural Technology Center for Agriculture, Forestry and Fisheries. Available online: http://hyogo-nourinsuisangc.jp/archive/19-kenkyu/article/kenkyu_2709.html (accessed on 9 July 2024).
- Xiao, T.; Xing, X.U.; Yong, Q.; Yuan, J.; Min, W.; Guang, Z. Improvement of marbling grade in Chinese beef grading standard. Scientia Agricultura Sinica 2006, 39, 2101–2106. [Google Scholar]
- Ministry of Agriculture, Forestry and Fisheries. Available online: https://www.maff.go.jp/index.html (accessed on 9 July 2024).
- Otsu, N. A Threshold Selection Method from Gray-Level Histograms. IEEE Transactions on Systems, Man, and Cybernetics 1979, 9, 62–66. [Google Scholar]
- Obama, N. Establishment of a New Meat Quality Evaluation Method (Estimation of Genetic Parameters for 'Fine Marbling' and 'Fat Quality'). Livestock Technology Hyogo 2013, 112, 15–17. [Google Scholar]
- Chonabayashi, H.; Negoro, H.; Ouchi, H. Study on the Correlation Between Fractal Dimension and Environmental Cognition Using GIS and 3D Image Analysis: Considerations in Coastal Fishing Villages of the Izu and Boso Peninsulas. College of Industrial Engineering, Nihon University Abstracts of Academic Lectures 2004, 37. [Google Scholar]
|
Disclaimer/Publisher’s Note: The statements, opinions and data contained in all publications are solely those of the individual author(s) and contributor(s) and not of MDPI and/or the editor(s). MDPI and/or the editor(s) disclaim responsibility for any injury to people or property resulting from any ideas, methods, instructions or products referred to in the content. |
© 2024 by the authors. Licensee MDPI, Basel, Switzerland. This article is an open access article distributed under the terms and conditions of the Creative Commons Attribution (CC BY) license (http://creativecommons.org/licenses/by/4.0/).
