Submitted:
12 July 2024
Posted:
12 July 2024
You are already at the latest version
Abstract
Keywords:
1. Introduction
2. Experiments
2.1. Materials
2.2. Method
2.2.1. Experimental Device
2.2.2. Measurement Method
2.2.3. Experimental Scheme
3. Results and Discussion
3.1. Macroscopic Morphology Analysis
3.2. Influence of Impact Velocity on Erosion Rate
3.3. 3D Surface Profiles
3.4. Erosion Mechanism Analysis
4. Conclusion
Author Contributions
Institutional Review Board Statement
Informed Consent Statement
Data Availability Statement
Conflicts of Interest
References
- Wu, G.Y.; Zhao, W.W.; Wang, Y.R.; Tang, Y.F.; Xie, M. Analysis on corrosion, induced failure of shale gas gathering pipelines in the southern Sichuan Basin of China. Eng. Fail. Anal. 2021, 130, 105796. [Google Scholar] [CrossRef]
- Gregory, K.B.; Vidic, R.D.; Dzombak, D.A. Water management challenges associated with the production of shale gas by hydraulic fracturing. Elements 2011, 7, 181–186. [Google Scholar] [CrossRef]
- Zeng, D.; Zhang, S.; Li, J.; Wang, X.; Tian, G.; Zhang, X.; Yu, H.Y.; Li, X.G. An experimental study on casing perforation erosion during sand fracturing. Wear 2023, 528, 204980. [Google Scholar] [CrossRef]
- Chi, M.H.; Zeng, X.G.; Gao, Y.P.; Li, W.; Jiang, H.Y.; Sun, R.C. The erosion rate prediction for the elbow in shale gas gathering and transportation system: RSM and GA,BP,ANN modeling. Powder. Technol. 2024, 435, 119429. [Google Scholar] [CrossRef]
- Parsi, M.; Najmi, K.; Najafifard, F.; Hassani, S.; McLaury, B.S.; Shirazi, S.A. A comprehensive review of solid particle erosion modeling for oil and gas wells and pipelines applications. J Nat. Gas. Sci. Eng. 2014, 21, 850–873. [Google Scholar] [CrossRef]
- Hong, B.Y.; Li, Y.B.; Li, Y.; Gong, J.; Yu, Y.F.; Huang, A.D.; Li, X.P. Numerical simulation of solid particle erosion in the gas,liquid flow of key pipe fittings in shale gas fields. Case. Stud. Therm. Eng. 2023, 42, 102742. [Google Scholar] [CrossRef]
- Hong, B.; Li, X.; Li, Y.; Li, Y.; Yu, Y.; Wang, Y.; Gong, J.; Ai, D. Numerical simulation of elbow erosion in shale gas fields under gas,solid two,phase flow. Energies. 2021, 14, 3804. [Google Scholar] [CrossRef]
- Hong, B.; Li, Y.; Li, X.; Li, G.; Huang, A.; Ji, S.; Li, W.; Gong, J.; Guo, J. Experimental investigation of erosion rate for gas,solid two,phase flow in 304 stainless/L245 carbon steel. Petrol. Sci. 2022, 19, 1347–1360. [Google Scholar] [CrossRef]
- Vite-Torres, M.; Laguna-Camacho, J.R.; Baldenebro-Castillo, R.E.; Gallardo-Hernandez, E.A.; Vera-Cárdenas, E.E.; Vite-Torres, J. Study of solid particle erosion on AISI 420 stainless steel using angular silicon carbide and steel round grit particles. Wear. 2013, 301, 383–389. [Google Scholar] [CrossRef]
- Babu, P.S.; Basu, B.; Sundararajan, G. The influence of erodent hardness on the erosion behavior of detonation sprayed WC,12Co coatings. Wear. 2011, 270, 903–913. [Google Scholar] [CrossRef]
- Liu, E.B.; Huang, S.; Tian, D.C.; Shi, L.M.; Peng, S.B.; Zheng, H. Experimental and numerical simulation study on the erosion behavior of the elbow of gathering pipeline in shale gas field. Petrol. Sci. 2024, 21, 1257–1274. [Google Scholar] [CrossRef]
- Zaragoza-Granados, J.; Gallardo-Hernández, E.A.; Vite-Torres, M.; Sedano-de la Rosa, C. Erosion behaviour of AISI 310 stainless steel at 450 C under turbulent swirling impinging jets. Wear 2019, 426, 637–642. [Google Scholar] [CrossRef]
- Jia, W.L.; Zhang, Y.R.; Li, C.J.; Luo, P.; Song, X.Q.; Wang, Y.Z.; Hu, X.Y. Experimental and numerical simulation of erosion,corrosion of 90 steel elbow in shale gas pipeline. J Nat. Gas. Sci. Eng. 2021, 89, 103871. [Google Scholar] [CrossRef]
- Zhu, H.J.; Zhao, H.N.; Pan, Q.; Li, X. Coupling analysis of fluid,structure interaction and flow erosion of gas,solid flow in elbow pipe. Adv. Mech. Eng. 2014, 2014, 815945. [Google Scholar] [CrossRef]
- Peng, W.S.; Cao, X.W.; Li, M.; Wang, P.; Bian, J.; Lin, C.G. Sand erosion prediction models for two,phase flow pipe bends and their application in gas,liquid,solid multiphase flow erosion. Powder. Technol. 2023, 421, 118421. [Google Scholar] [CrossRef]
- Song, X.Q.; Luo, P.; Luo, S.Y.; Huang, S.W.; Wang, Z.L. Numerical simulation study on the influence of incident position on erosion characteristics of gas,particle two,phase flow in 90° elbow. Adv. Mech. Eng. 2017, 9, 1687814017733249. [Google Scholar] [CrossRef]
- Zhang, E.B.; Zeng, D.Z.; Zhu, H.J.; Li, S.G.; Chen, D.B.; Ding, Y.Y.; Tian, G. Numerical simulation for erosion effects of three,phase flow containing sulfur particles on elbows in high sour gas fields. Petroleum 2018, 4, 158–167. [Google Scholar] [CrossRef]
- Ashokkumar, M.; Thirumalaikumarasamy, D.; Thirumal, P.; Barathiraja, R. Influences of Mechanical, Corrosion, erosion and tribological performance of cold sprayed Coatings A review. Mater Today: Process 2021, 46, 7581–7587. [Google Scholar] [CrossRef]
- Sharma, R.K.; Das, R.K.; Kumar, S.R. Effect of chromium–titanium on corrosion and erosion of HVOF coating. Surf. Eng. 2022, 38, 366–374. [Google Scholar] [CrossRef]
- González, M.A.; Rodríguez, E.; Mojardín, E.; Jiménez, O.; Guillen, H.; Ibarra, J. Study of the erosive wear behaviour of cryogenically and tempered WC,CoCr coating deposited by HVOF. Wear. 2017, 376, 595–607. [Google Scholar] [CrossRef]
- Geng, Z.; Hou, S.; Shi, G.; Duan, D.; Li, S. Tribological behaviour at various temperatures of WC,Co coatings prepared using different thermal spraying techniques. Tribol Int. 2016, 104, 36–44. [Google Scholar] [CrossRef]
- Bolelli, G.; Berger, L.M.; Börner, T.; Koivuluoto, H.; Matikainen, V.; Lusvarghi, L.; Vuoristo, P. Sliding and abrasive wear behaviour of HVOF,and HVAF,sprayed Cr3C2–NiCr hardmetal coatings. Wear 2016, 358, 32–50. [Google Scholar] [CrossRef]
- Ćurković, L.; Landek, D.; Švagelj, Z.; Gabelica, I. The volume erosion rate of the slip cast monolithic and composite ceramics. Adv Appl Ceram. 2023, 122, 119–128. [Google Scholar] [CrossRef]
- Bhosale, D.G.; Prabhu, T.R.; Rathod, W.S.; Patil, M.A.; Rukhande, S.W. High temperature solid particle erosion behaviour of SS 316L and thermal sprayed WC,Cr3C2–Ni coatings. Wear 2020, 462, 203520. [Google Scholar] [CrossRef]
- de Portu, G.; Pinasco, P.; Melandri, C.; Capiani, C.; Guardamagna, C.; Lorenzoni, L.; Cernuschi, F. Solid particle erosion behavior of laminated ceramic structures. Wear 2020, 442, 203147. [Google Scholar] [CrossRef]
- Medvedovski, E. Advanced ceramics and coatings for erosion-related applications in mineral and oil and gas production: A technical review. Int J Appl Ceram Tec. 2023, 20, 612–659. [Google Scholar] [CrossRef]
- ASTM,G76 standard. Standard Test Method for Conducting Erosion Tests by Solid Particle Impingement Using Gas Jets.
- Verdi, D.; Cortés, R.; Chia, G.Y.; Tay, G. Erosion behaviour of laser cladded Inconel 625,Vanadium carbide metal matrix composites coatings manufactured with different reinforcement contents. Surf Coat Tech. 2024, 476, 130282. [Google Scholar] [CrossRef]
- Deng, K.; Zhou, N.; Lin, Y.; Cheng, J.; Bing, L.; Jing, Z. Experimental and numerical study on the high,speed gas,solid nozzle erosion of choke manifold material in high pressure and high production gas well. Powder Technol. 2024, 438, 119628. [Google Scholar] [CrossRef]
- Erdoğan, A.A.; Feyzullahoğlu, E.; Fidan, S.; Sinmazçelik, T. Investigation of erosive wear behaviors of AA6082,T6 aluminum alloy. P I Mech Eng L,J Mat. 2020, 234, 520–530. [Google Scholar] [CrossRef]
- Laguna-Camacho, J.R.; Marquina-Chávez, A.; Mendez-Mendez, J.V.; Vite-Torres, M.; Gallardo-Hernandez, E.A. Solid particle erosion of AISI 304, 316 and 420 stainless steels. Wear 2013, 301, 398–405. [Google Scholar] [CrossRef]
- Modi, O.P.; Prasad, B.K.; Jha, A.K. Influence of alumina dispersoid and test parameters on erosive wear behaviour of a cast zinc–aluminium alloy. Wear 2006, 260, 895–902. [Google Scholar] [CrossRef]
- Liu, B.; Liu, X.; Deng, K.H.; Lin, K.H.; Zhou, N.T.; Mei, Z.B.; Li, S.G. Erosion Mechanism of 30CrMo Steel Impacted by High Speed Solid Particles. Surf. Technol. 2023, 52, 135–145. [Google Scholar] [CrossRef]
- Ribu, D.C.; Rajesh, R.; Thirumalaikumarasamy, D.; Kaladgi, A.R.; Saleel, C.A.; Nisar, K.S.; Afzal, A. Experimental investigation of erosion corrosion performance and slurry erosion mechanism of HVOF sprayed WC,10Co coatings using design of experiment approach. J Mater Res Technol. 2022, 18, 293–314. [Google Scholar] [CrossRef]
- Zhao, Y.L.; Tang, C.Y.; Yao, J.; Zeng, Z.H.; Dong, S.G. Investigation of erosion behavior of 304 stainless steel under solid–liquid jet flow impinging at 30. Petrol Sci. 2020, 17, 1135–1150. [Google Scholar] [CrossRef]
- Liu, L.; Zhang, K.; Wang, Y. Baffle effect of exposed WC particles in the clearance on slurry erosion behavior of cemented carbide surface. Mater Today Commun. 2024, 39, 109071. [Google Scholar] [CrossRef]
- Vashishtha, N.; Khatirkar, R.K.; Sapate, S.G. Tribological behaviour of HVOF sprayed WC,12Co, WC,10Co,4Cr and Cr3C2−25NiCr coatings. Tribol Int. 2017, 105, 55–68. [Google Scholar] [CrossRef]
- Grilec, K.; Ćurković, L.; Kumić, I.; Baršić, G. Erosion mechanisms of aluminium nitride ceramics at different impact angles. Materialwiss Werkst. 2011, 42, 712–717. [Google Scholar] [CrossRef]
- Li, X.; Ding, H.; Huang, Z.; Fang, M.; Liu, B.; Wu, X.; Chen, S. Solid particle erosion,wear behavior of SiC–Si3N4 composite ceramic at elevated temperature. Ceram Int. 2014, 40, 16201–16207. [Google Scholar] [CrossRef]
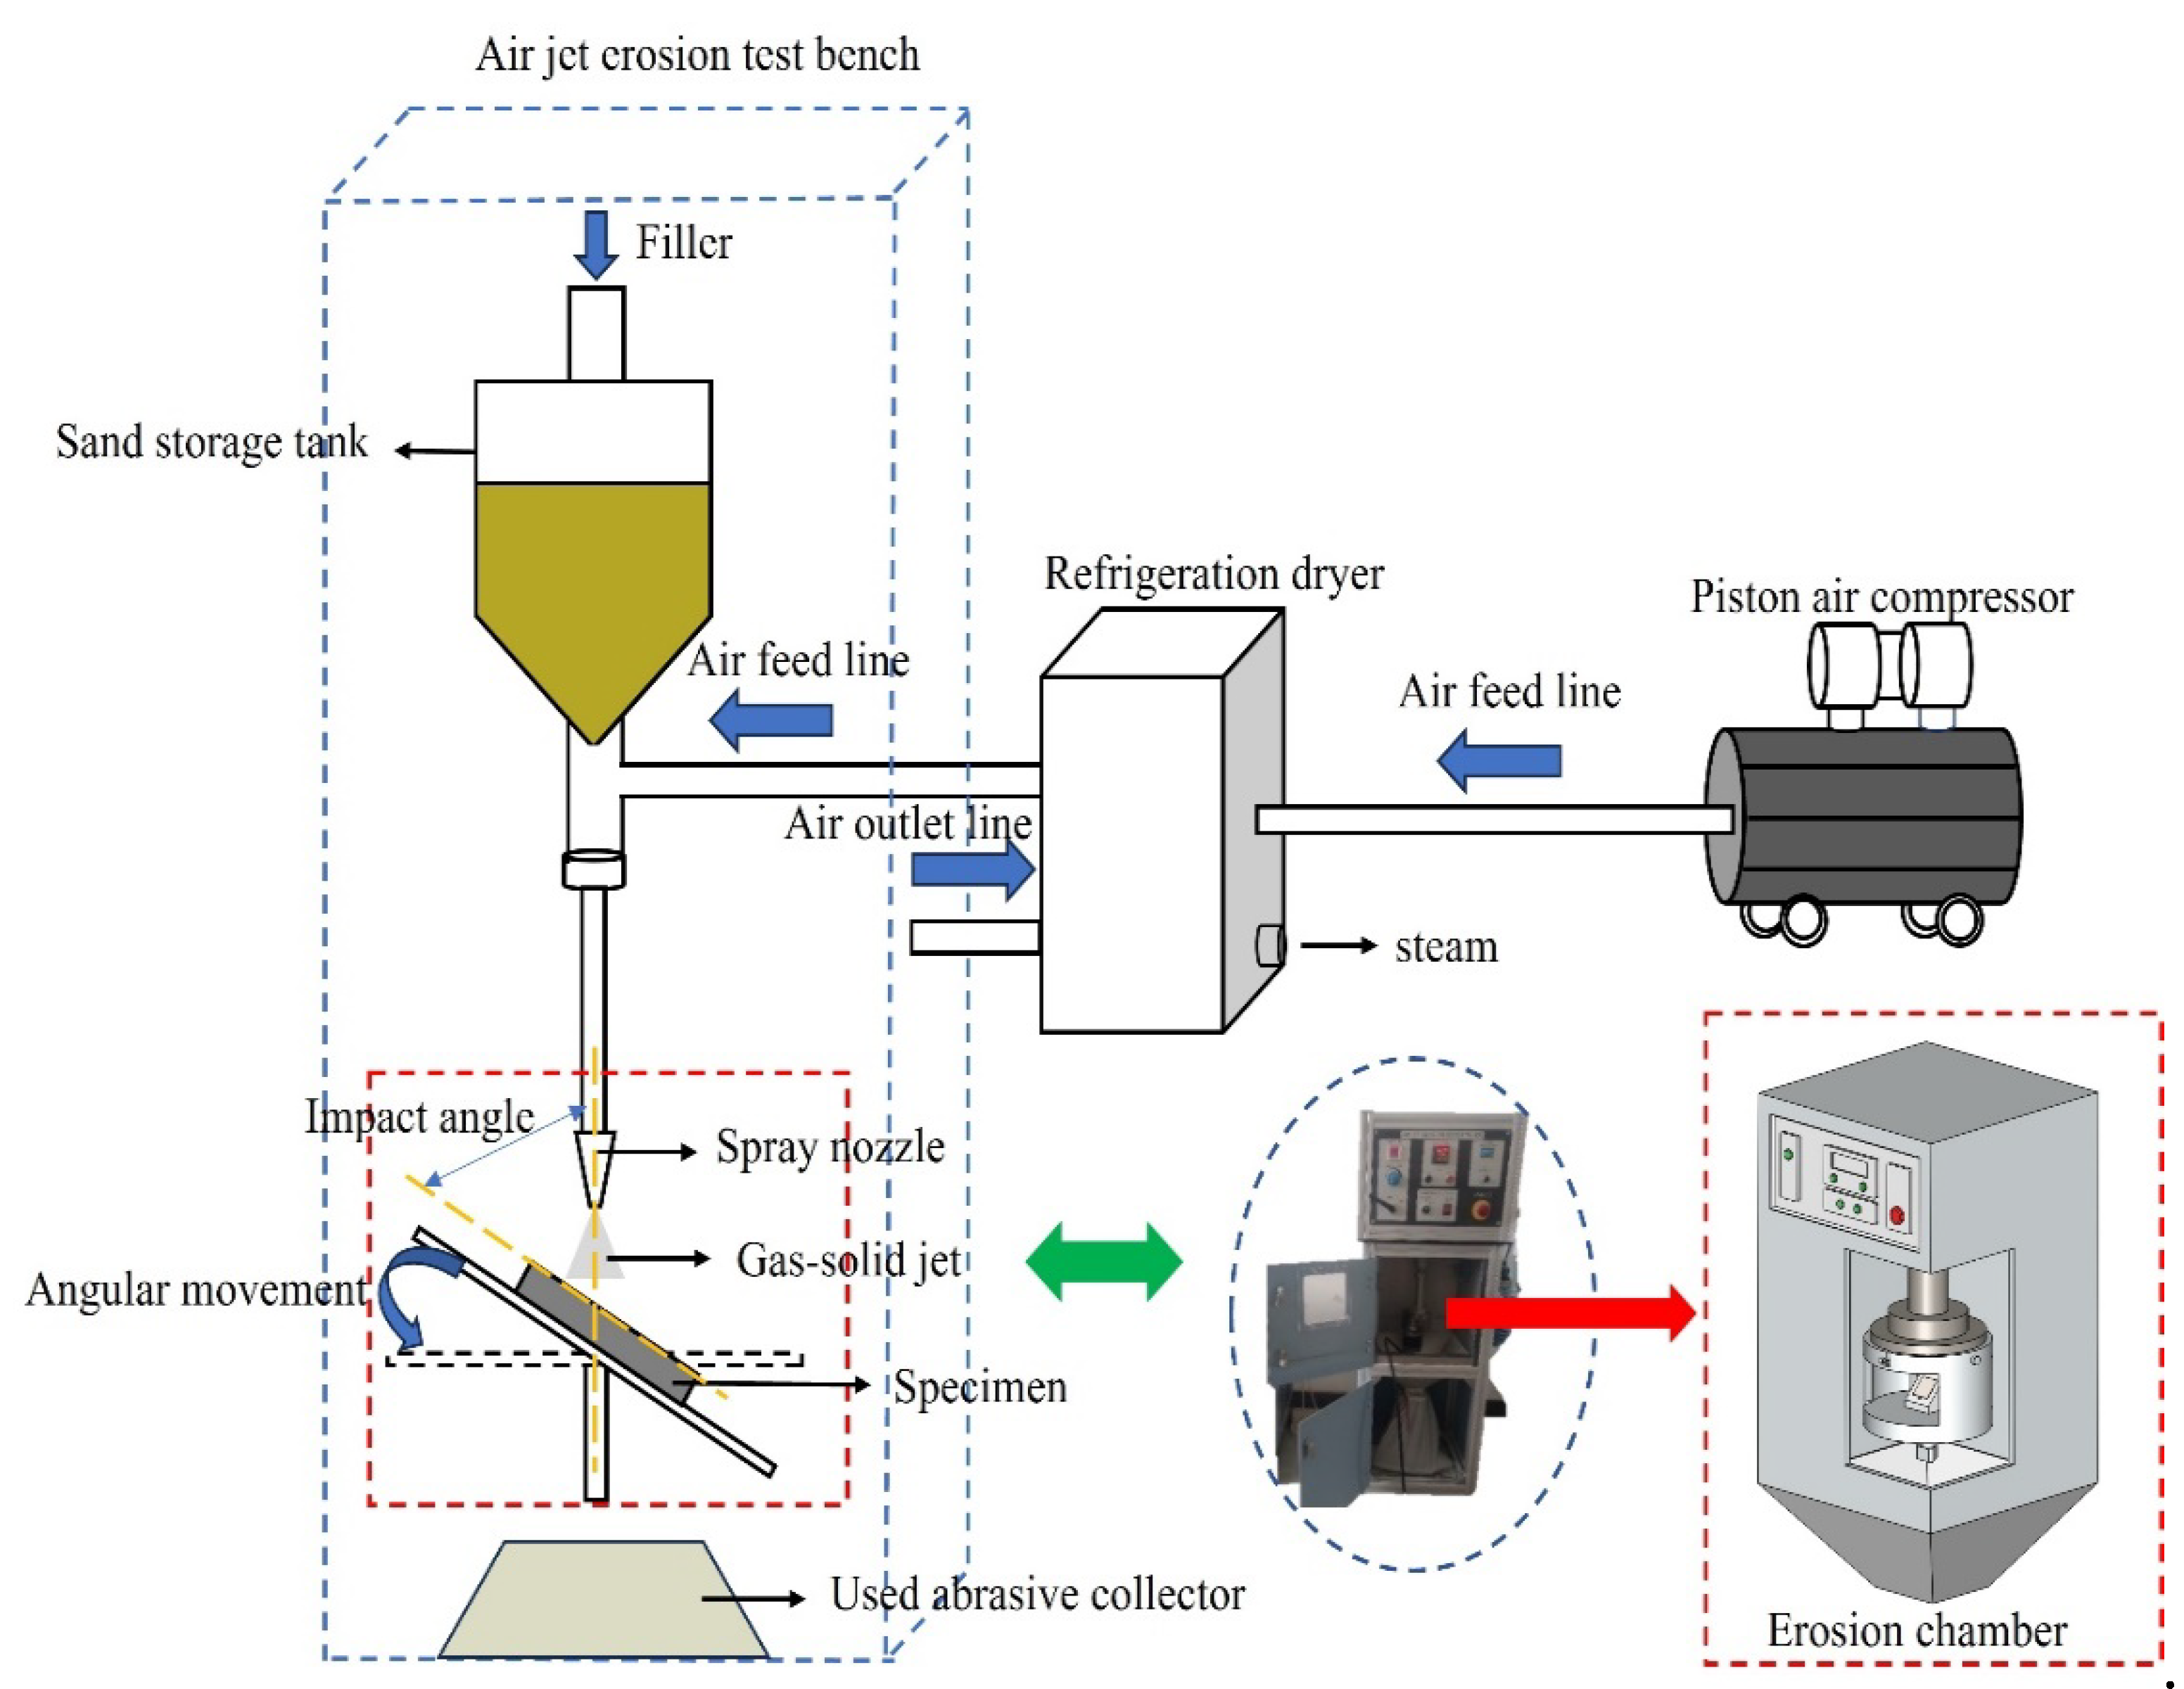
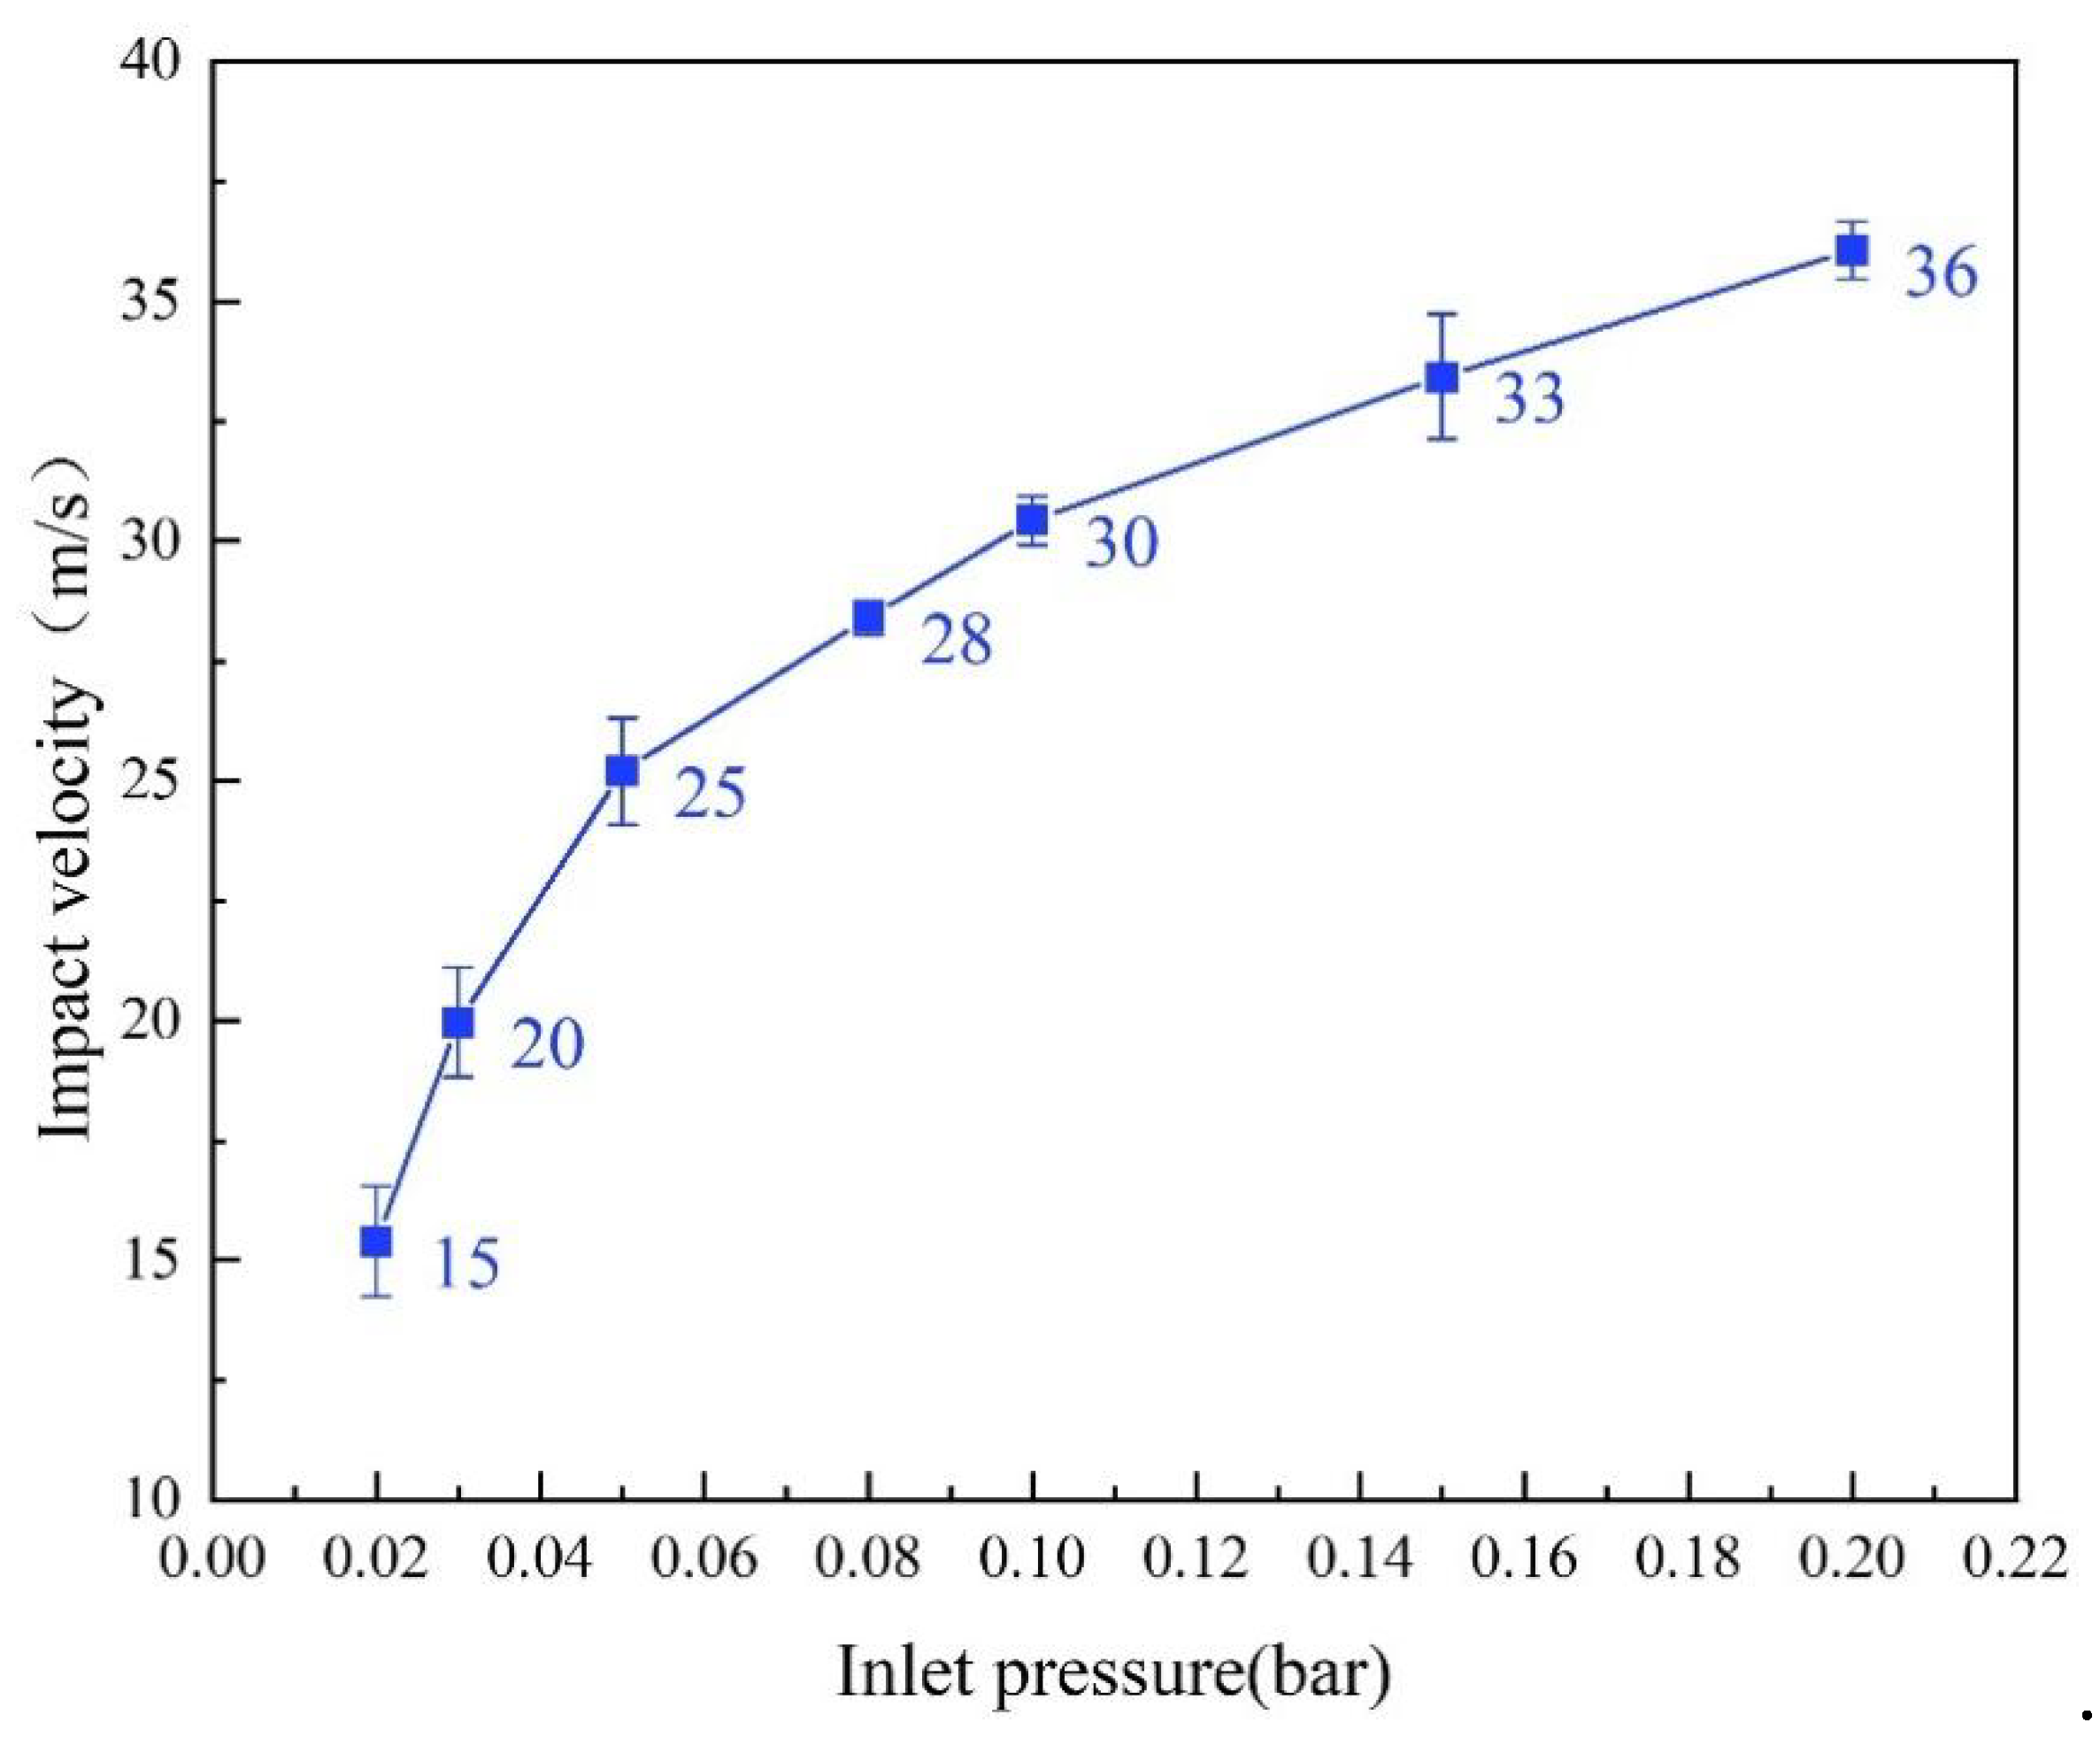
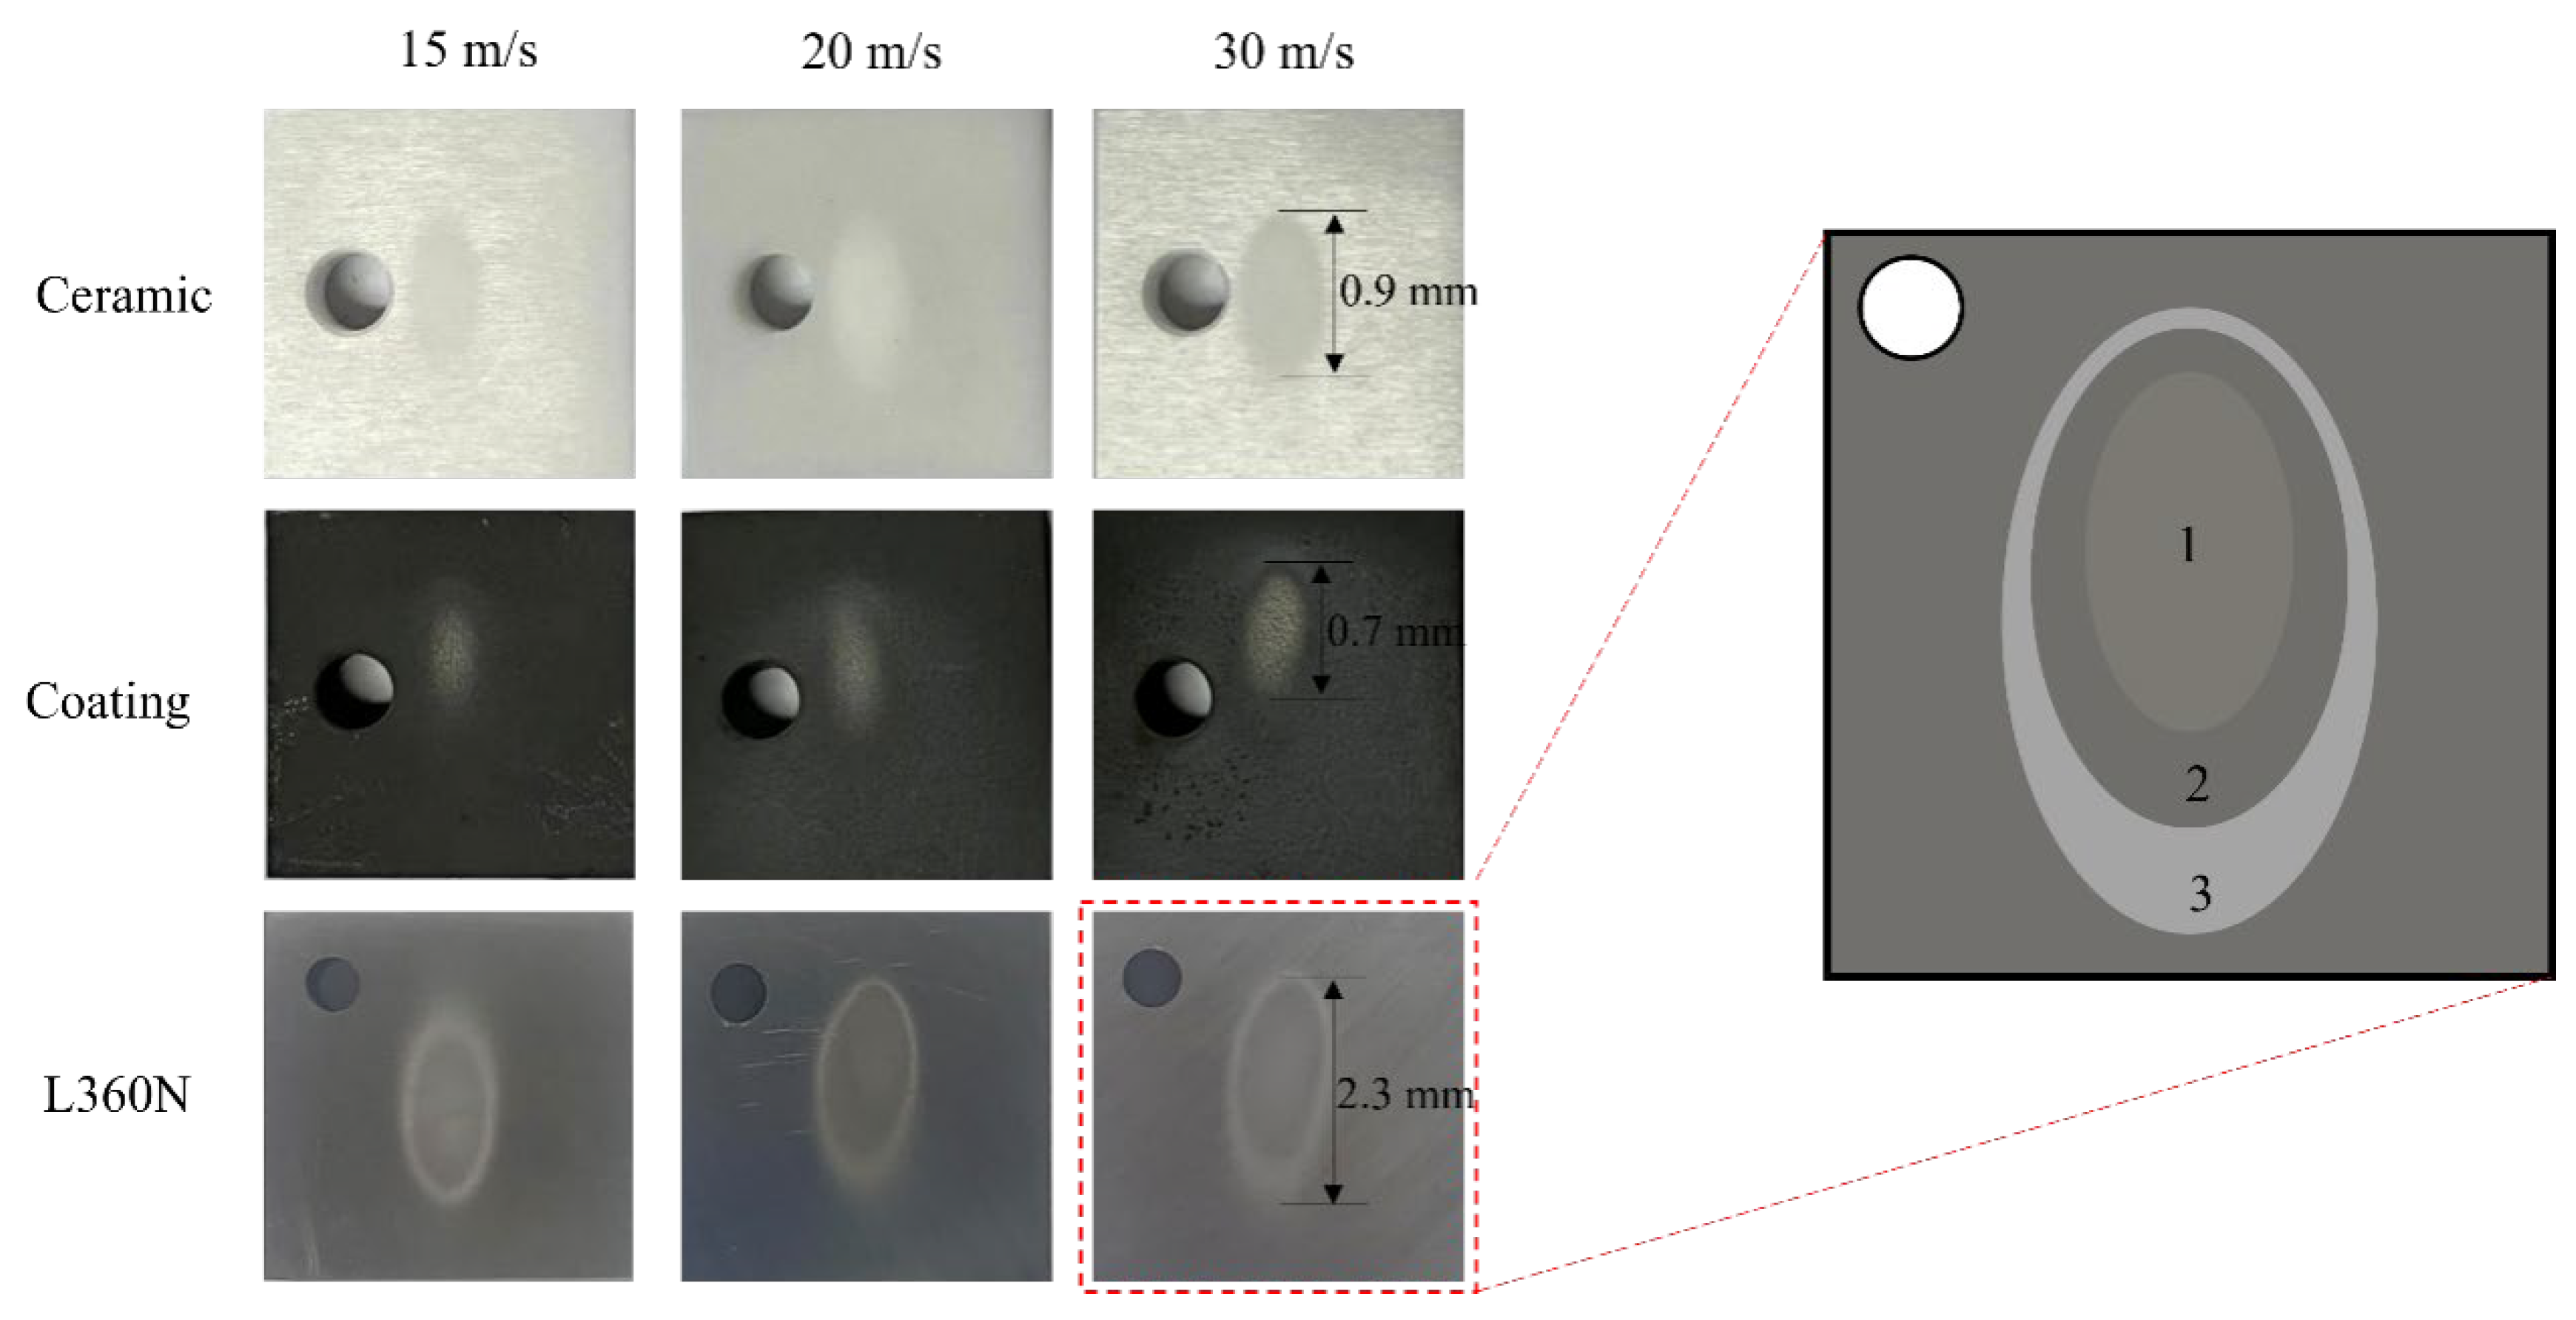
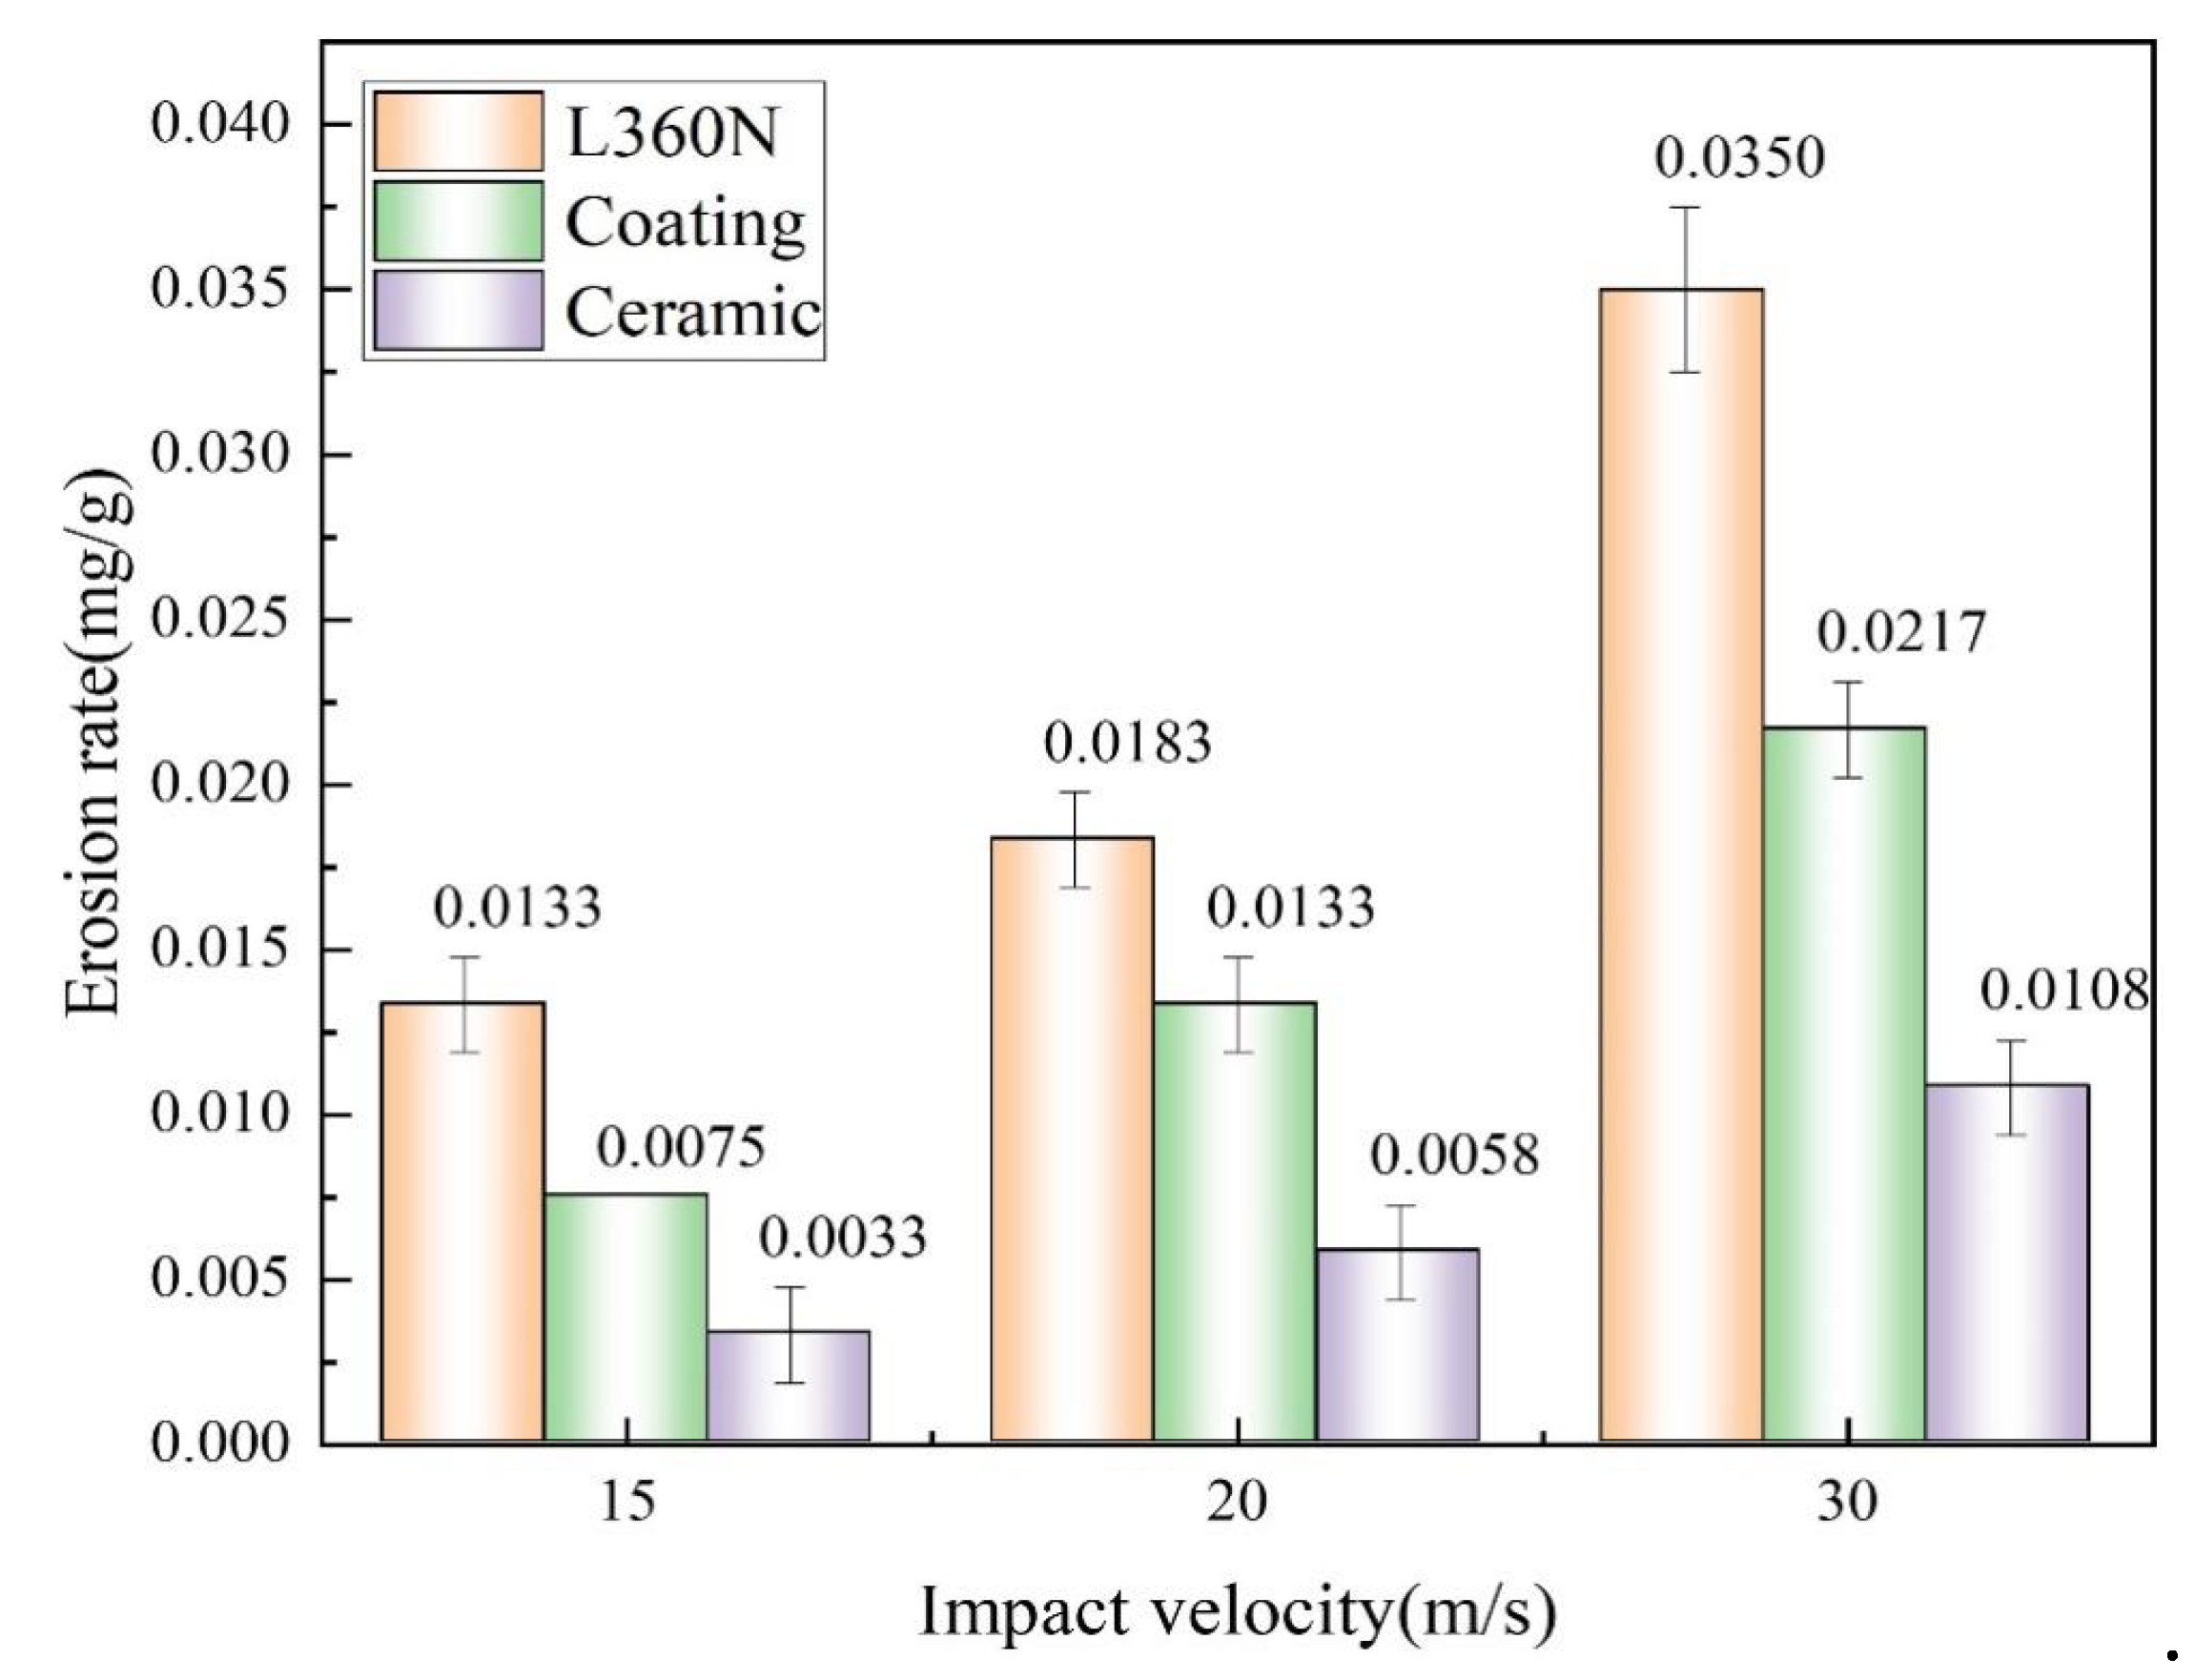

| Materials | Vickers hardness (HV) | |||||
| Test 1 | Test 2 | Test 3 | Test 4 | Test 5 | Means | |
| L360N | 220.72 | 225.97 | 202.39 | 267.57 | 239.79 | 231.29 |
| Ceramic | 1749.18 | 1702.85 | 1649.44 | 1468.97 | 1652.39 | 1644.57 |
| Coating | 1071.58 | 1065.48 | 1121.95 | 1062.54 | 1035.78 | 1071.46 |
| Experimental parameters | Setting |
| Erodent | Quartz sand |
| materials | L360N, Ceramic, Coating |
| Impact velocity (m/s) | 15, 20, and 30 |
| Experimental temperature (℃) | Room temperature |
| Impact Angle (°) | 30 |
| Particle mass flow (g/min) | 2 |
| Test duration (min) | 20 |
| Materials | L360N | Coating | Ceramic |
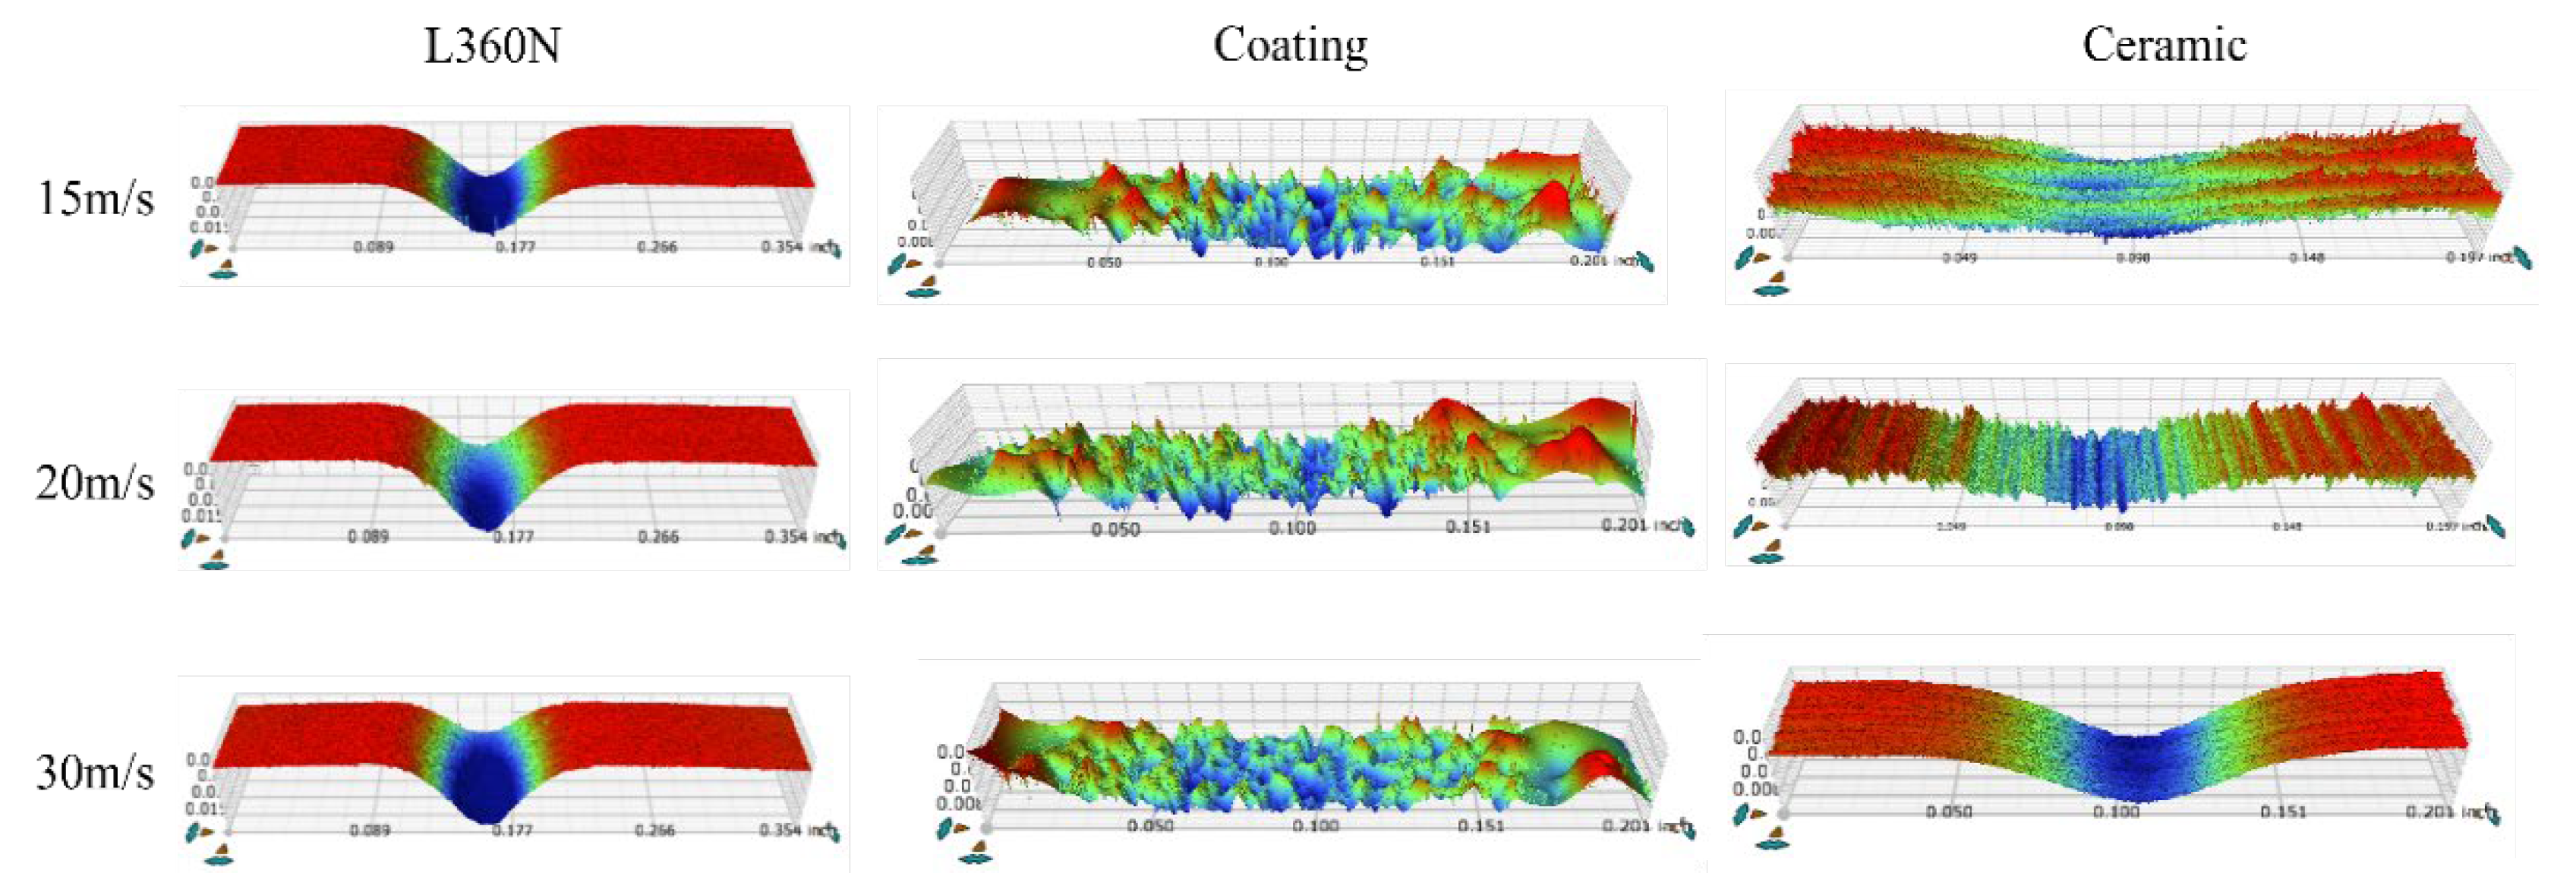
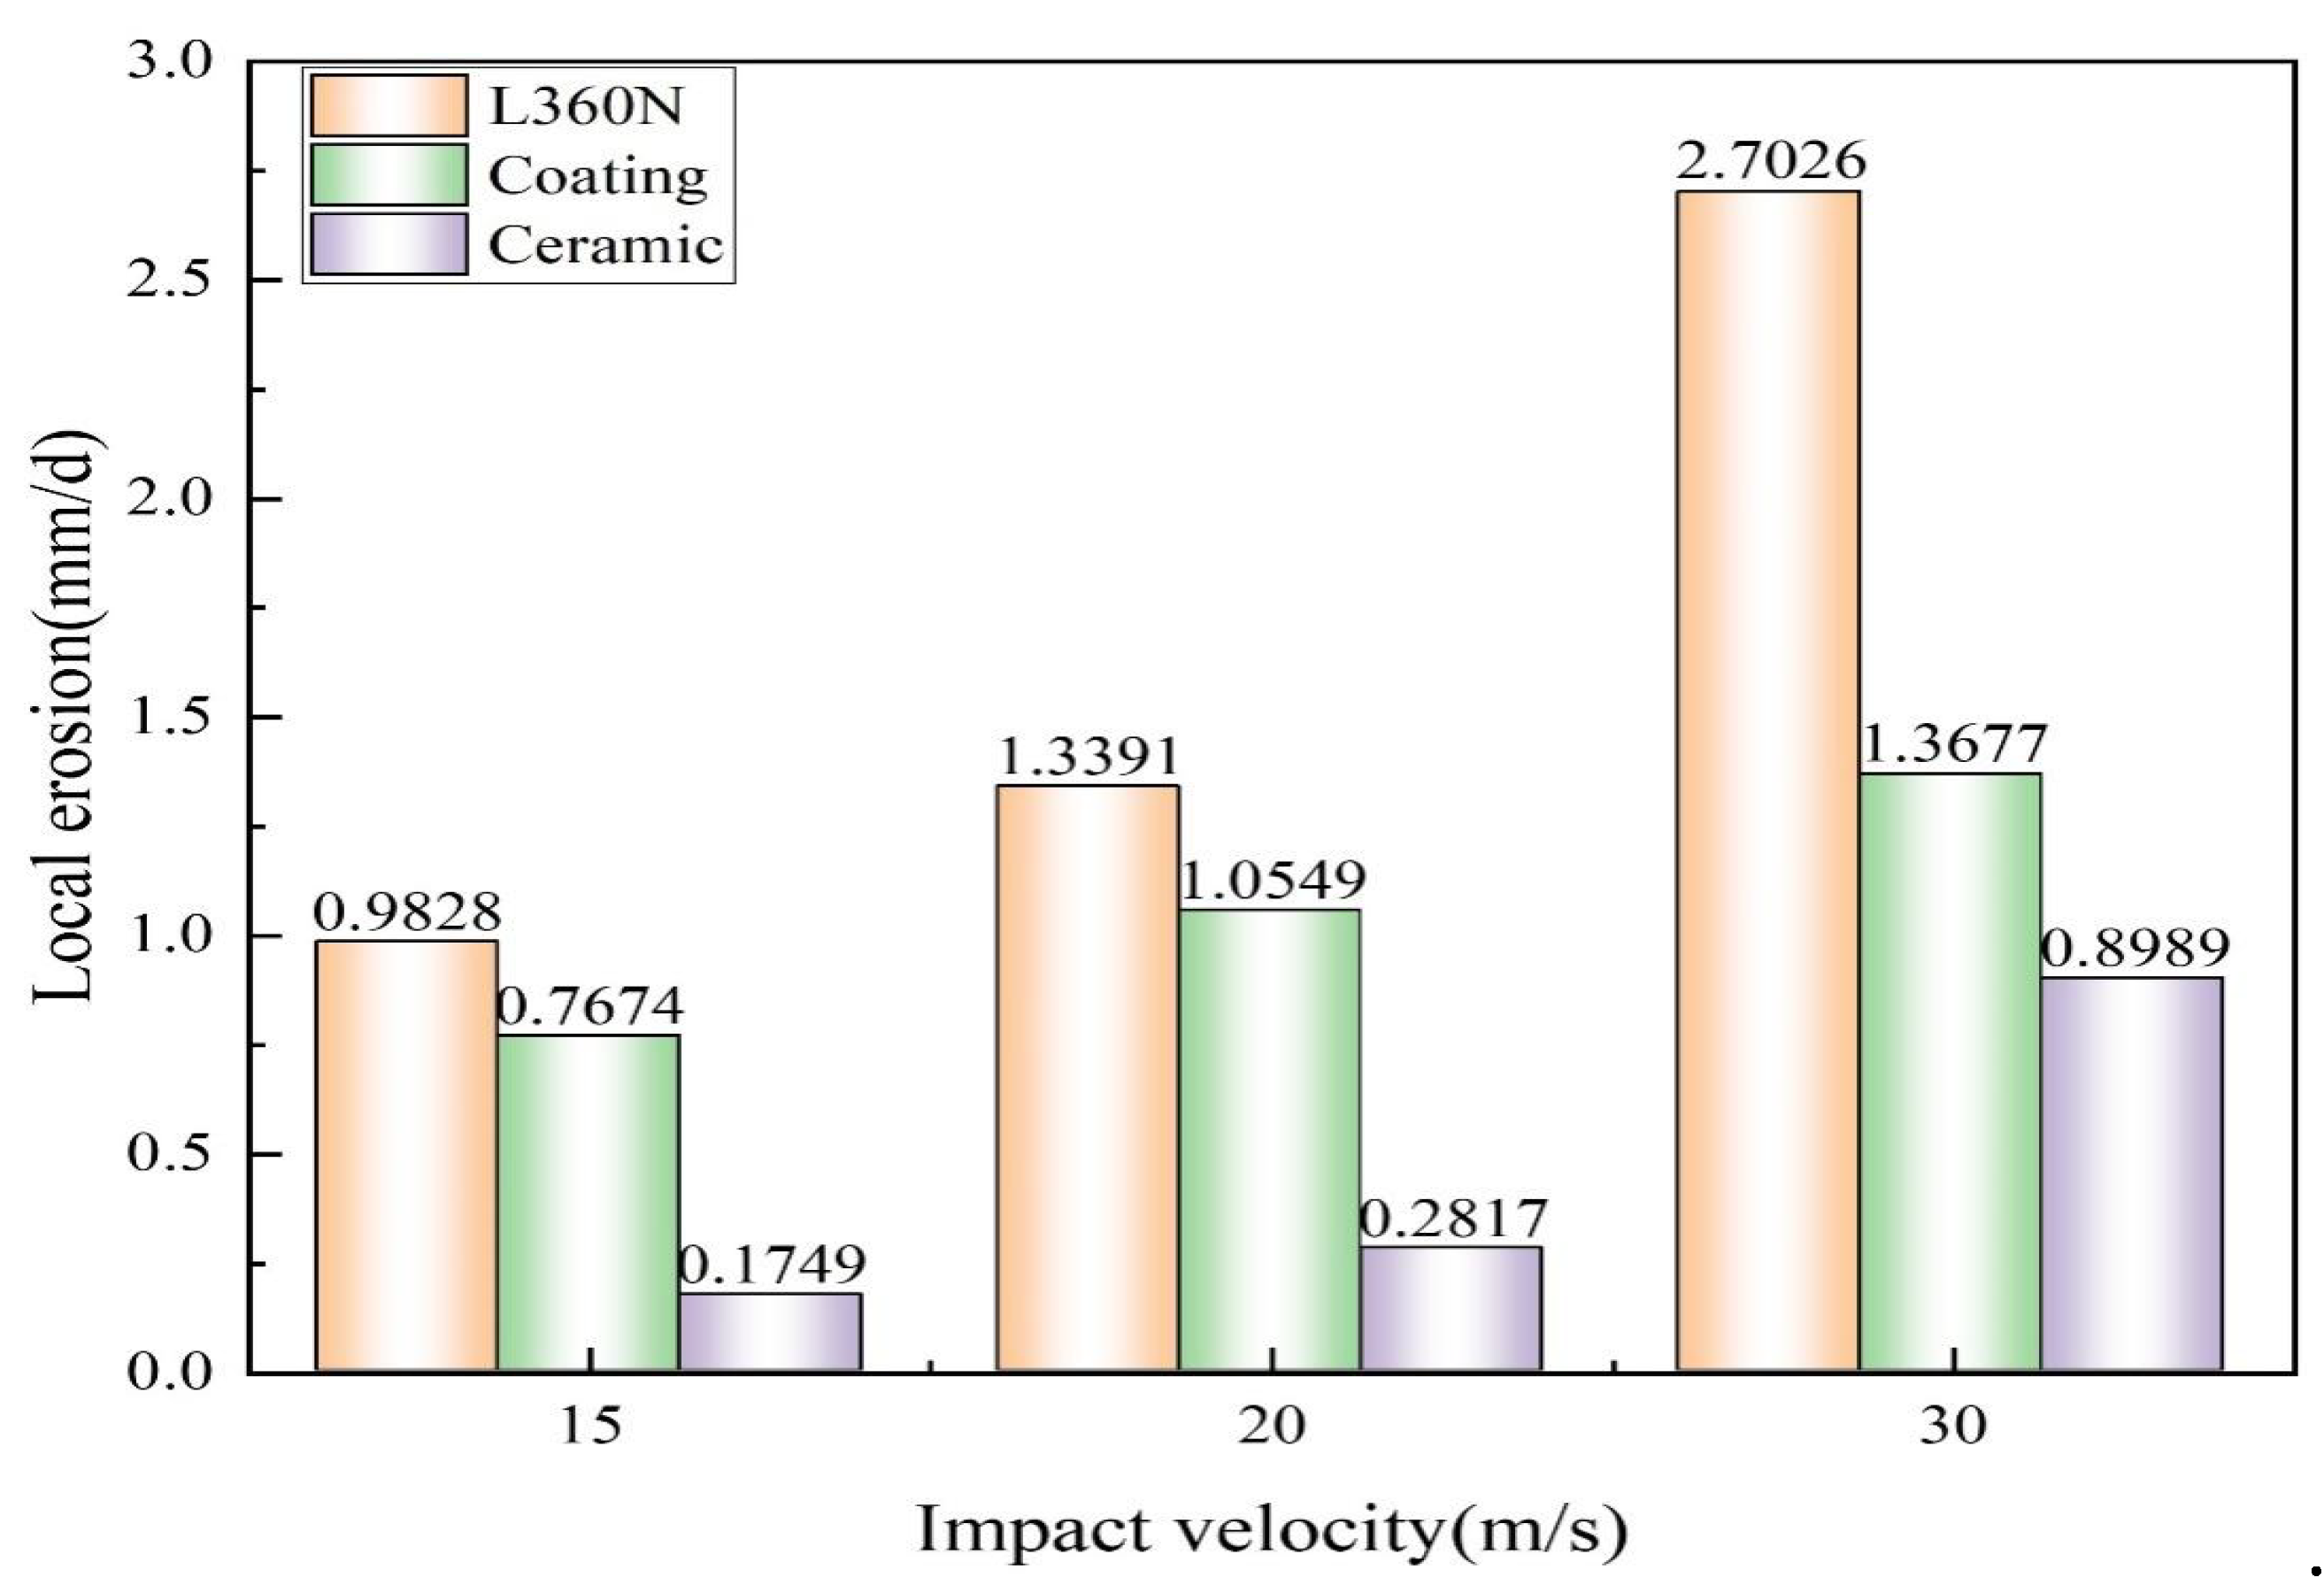
| Impact velocity (m/s) | Maximum erosion depths (µm) | ||
| 15 | 13.6494 | 10.6588 | 2.4304 |
| 20 | 18.5994 | 14.6526 | 3.9132 |
| 30 | 37.5365 | 18.9964 | 12.4856 |
Disclaimer/Publisher’s Note: The statements, opinions and data contained in all publications are solely those of the individual author(s) and contributor(s) and not of MDPI and/or the editor(s). MDPI and/or the editor(s) disclaim responsibility for any injury to people or property resulting from any ideas, methods, instructions or products referred to in the content. |
© 2024 by the authors. Licensee MDPI, Basel, Switzerland. This article is an open access article distributed under the terms and conditions of the Creative Commons Attribution (CC BY) license (http://creativecommons.org/licenses/by/4.0/).


