Submitted:
12 July 2024
Posted:
15 July 2024
You are already at the latest version
Abstract
Keywords:
1. Introduction
2. Materials and Methods
2.1. Materials
2.2. 11 S purification
2.3. SDS-PAGE electrophoresis
2.4. Molecular docking
2.5. Preparation of 11S and TOC or RSV mixed systems
2.6. Circular dichroism (CD)
2.7. Isothermal titration calorimetry (ITC)
2.8. Steady-state fluorescence measurements
2.9. Encapsulation efficiency
2.10. Particle Size and ζ-Potential Determinations
2.11. Atomic Force Microscopy (AFM)
2.12. Antioxidant Activity of 11S-RSV or 11S-TOC Complexes
2.12.1. ABTS Assay
2.12.2. Ferric reducing antioxidant power (FRAP) assay
2.13. Statistical analysis
3. Results
3.1. SDS-PAGE- FPLC
3.2. Molecular Docking
3.3. Circular Dichroism (CD)
3.4. Isothermal Titration Calorimetry (ITC)
3.5. Fluorescence Spectroscopy
3.6. EE determination
3.7. Analysis of 11S globulin aggregation induced by RSV or TOC
3.8. Atomic force microscopy (AFM)
3.9. Antioxidant capacity of 11S-RSV and 11S-TOC nanocomplexes
3.9.1. ABTS
3.9.2. FRAP
4. Discussion
5. Conclusions
Supplementary Materials
Author Contributions
Funding
Institutional Review Board Statement
Informed Consent Statement
Data Availability Statement
Conflicts of Interest
References
- He, X.; Wang, B.; Zhao, B.; Yang, F. Ultrasonic Assisted Extraction of Quinoa (Chenopodium Quinoa Willd.) Protein and Effect of Heat Treatment on Its In Vitro Digestion Characteristics. Foods 2022, 11. [Google Scholar] [CrossRef] [PubMed]
- Lingiardi, N.; Galante, M.; de Sanctis, M.; Spelzini, D. Are Quinoa Proteins a Promising Alternative to Be Applied in Plant-Based Emulsion Gel Formulation? Food Chem 2022, 394. [Google Scholar] [CrossRef] [PubMed]
- Kaspchak, E.; de Oliveira, M.A.S.; Simas, F.F.; Franco, C.R.C.; Silveira, J.L.M.; Mafra, M.R.; Igarashi-Mafra, L. Determination of Heat-Set Gelation Capacity of a Quinoa Protein Isolate (Chenopodium Quinoa) by Dynamic Oscillatory Rheological Analysis. Food Chem 2017, 232, 263–271. [Google Scholar] [CrossRef] [PubMed]
- Choi, I.; Li, N.; Zhong, Q. Enhancing Bioaccessibility of Resveratrol by Loading in Natural Porous Starch Microparticles. Int J Biol Macromol 2022, 194, 982–992. [Google Scholar] [CrossRef] [PubMed]
- Chimento, A.; De Amicis, F.; Sirianni, R.; Sinicropi, M.S.; Puoci, F.; Casaburi, I.; Saturnino, C.; Pezzi, V. Progress to Improve Oral Bioavailability and Beneficial Effects of Resveratrol. Int J Mol Sci 2019, 20. [Google Scholar] [CrossRef] [PubMed]
- Saini, R.K.; Keum, Y.S. Tocopherols and Tocotrienols in Plants and Their Products: A Review on Methods of Extraction, Chromatographic Separation, and Detection. Food Research International 2016, 82, 59–70. [Google Scholar] [CrossRef]
- Bustos, L.F.; Judis, M.A.; Vasile, F.E.; Pérez, O.E. Molecular Interactions Involved in the Complexation Process between Buffalo Whey Proteins Concentrate and Folic Acid. Food Chem 2022, 396. [Google Scholar] [CrossRef] [PubMed]
- Corfield, R.; Martínez, K.D.; Allievi, M.C.; Santagapita, P.; Mazzobre, F.; Schebor, C.; Pérez, O.E. Whey Proteins-Folic Acid Complexes: Formation, Isolation and Bioavailability in a Lactobacillus Casei Model. Food Structure 2020, 26. [Google Scholar] [CrossRef]
- Corfield, R.; Lalou, G.; Di Lella, S.; Martínez, K.D.; Schebor, C.; Allievi, M.C.; Pérez, O.E. Experimental and Modeling Approaches Applied to the Whey Proteins and Vitamin B9 Complexes Study. Food Hydrocoll 2023, 142. [Google Scholar] [CrossRef]
- Liu, K.; Zha, X.Q.; Li, Q.M.; Pan, L.H.; Luo, J.P. Hydrophobic Interaction and Hydrogen Bonding Driving the Self-Assembling of Quinoa Protein and Flavonoids. Food Hydrocoll 2021, 118. [Google Scholar] [CrossRef]
- Martínez, J.H.; Velázquez, F.; Burrieza, H.P.; Martínez, K.D.; Paula Domínguez Rubio, A.; dos Santos Ferreira, C.; del Pilar Buera, M.; Pérez, O.E. Betanin Loaded Nanocarriers Based on Quinoa Seed 11S Globulin. Impact on the Protein Structure and Antioxidant Activity. Food Hydrocoll 2019, 87, 880–890. [Google Scholar] [CrossRef]
- Ochnio, M.E.; Martínez, J.H.; Allievi, M.C.; Palavecino, M.; Martínez, K.D.; Pérez, O.E. Proteins as Nano-Carriers for Bioactive Compounds. The Case of 7S and 11S Soy Globulins and Folic Acid Complexation. Polymers (Basel) 2018, 10. [Google Scholar] [CrossRef] [PubMed]
- Kiss Nanotechnology in Food Systems: A Review. Acta Aliment 2020, 49, 460–474. [CrossRef]
- Pérez, O.E.; David-Birman, T.; Kesselman, E.; Levi-Tal, S.; Lesmes, U. Milk Protein-Vitamin Interactions: Formation of Beta-Lactoglobulin/Folic Acid Nano-Complexes and Their Impactoninvitro Gastro-Duodenal Proteolysis. Food Hydrocoll 2014, 38, 40–47. [Google Scholar] [CrossRef]
- Laemmli Cleavage of Structural Proteins during the Assembly of the Head of bacteriophage T4. 1970. [CrossRef]
- Neuhoff, V.; Arold, N.; Taube, D.; Ehrhardt, W. Improved Staining of Proteins in Polyacrylamide Gels Including Isoelectric Focusing Gels with Clear Background at Nanogram Sensitivity Using Coomassie Brilliant Blue G-250 and R-250. Electrophoresis 1988, 9, 255–262. [Google Scholar] [CrossRef] [PubMed]
- Trott, O.; Olson, A.J. AutoDock Vina: Improving the Speed and Accuracy of Docking with a New Scoring Function, Efficient Optimization, and Multithreading. J Comput Chem 2010, 31, 455–461. [Google Scholar] [CrossRef] [PubMed]
- William Humphrey; Andrew Dalke; Klaus Schulten VMD: Visual Molecular Dynamics. [CrossRef]
- Liang, L.; Subirade, M. β-Lactoglobulin/Folic Acid Complexes: Formation, Characterization, and Biological Implication. Journal of Physical Chemistry B 2010, 114, 6707–6712. [Google Scholar] [CrossRef] [PubMed]
- Lakowicz, J.R.; Weber, G. Quenching of Fluorescence by Oxygen. a Probe for Structural Fluctuations in Macromolecules. Biochemistry 1973, 12, 4161–4170. [Google Scholar] [CrossRef] [PubMed]
- Bian, Q.; Liu, J.; Tian, J.; Hu, Z. Binding of Genistein to Human Serum Albumin Demonstrated Using Tryptophan Fluorescence Quenching. Int J Biol Macromol 2004, 34, 275–279. [Google Scholar] [CrossRef]
- Wei, X.L.; Xiao, J.B.; Wang, Y.; Bai, Y. Which Model Based on Fluorescence Quenching Is Suitable to Study the Interaction between Trans-Resveratrol and BSA? Spectrochim Acta A Mol Biomol Spectrosc 2010, 75, 299–304. [Google Scholar] [CrossRef]
- Demirkaya, F.; Kadioglu, Y. Simple GC-FID Method Development and Validation for Determination of α-Tocopherol (Vitamin E) in Human Plasma. J Biochem Biophys Methods 2007, 70, 363–368. [Google Scholar] [CrossRef]
- Carpineti, L.; Martinez, M.J.; Pilosof, A.M.R.; Pérez, O.E. β-Lactoglobulin-Carboxymethylcellulose Core-Shell Microparticles: Construction, Characterization and Isolation. J Food Eng 2014, 131, 65–74. [Google Scholar] [CrossRef]
- Montserrat-de la Paz, S.; Rodriguez-Martin, N.M.; Villanueva, A.; Pedroche, J.; Cruz-Chamorro, I.; Millan, F.; Millan-Linares, M.C. Evaluation of Anti-Inflammatory and Atheroprotective Properties of Wheat Gluten Protein Hydrolysates in Primary Human Monocytes. Foods 2020, 9. [Google Scholar] [CrossRef]
- Rocha, G.F.; Kise, F.; Rosso, A.M.; Parisi, M.G. Potential Antioxidant Peptides Produced from Whey Hydrolysis with an Immobilized Aspartic Protease from Salpichroa Origanifolia Fruits. Food Chem 2017, 237, 350–355. [Google Scholar] [CrossRef]
- Ruiz, G.A.; Xiao, W.; Van Boekel, M.; Minor, M.; Stieger, M. Effect of Extraction PH on Heat-Induced Aggregation, Gelation and Microstructure of Protein Isolate from Quinoa (Chenopodium Quinoa Willd). Food Chem 2016, 209, 203–210. [Google Scholar] [CrossRef] [PubMed]
- Brinegar, C.; Goundan, S. Isolation and Characterization of Chenopodin, the 11S Seed Storage Protein of Quinoa (Chenopodium Quinoa). J. Agrlc. FoodChem 1993, 1883, 182–185. [Google Scholar] [CrossRef]
- Abugoch, L.E.; Martínez, N.E.; Añón, M.C. Influence of PH on Structure and Function of Amaranth (Amaranthus Hypochondriacus) Protein Isolates. Cereal Chem 2010, 87, 448–453. [Google Scholar] [CrossRef]
- Shahraki, S.; Heydari, A.; Saeidifar, M.; Gomroki, M. Biophysical and Computational Comparison on the Binding Affinity of Three Important Nutrients to β-Lactoglobulin: Folic Acid, Ascorbic Acid and Vitamin K3. J Biomol Struct Dyn 2018, 36, 3651–3665. [Google Scholar] [CrossRef]
- Maity, S.; Pal, S.; Sardar, S.; Sepay, N.; Parvej, H.; Chakraborty, J.; Chandra Halder, U. Multispectroscopic Analysis and Molecular Modeling to Investigate the Binding of Beta Lactoglobulin with Curcumin Derivatives. RSC Adv 2016, 6, 112175–112183. [Google Scholar] [CrossRef]
- Mantovani, R.; Hamon, P.; Rousseau, F.; Tavares, G.; Mercadante, A.Z.; Croguennec, T.; Bouhallab, S.; Zerlotti Mer-Cadante, A.; Mantovani, R.A.; Tavares, G.M.; et al. Unraveling the Molecular Mechanisms Underlying Interactions between Caseins and Lutein. Food Research International 2020, 138, 963–9969. [Google Scholar] [CrossRef]
- Zhao, Y.; Chen, F.; Gao, C.; Feng, X.; Tang, X. Structure, Physical and Antioxidant Properties of Quinoa Protein /Hsian-Tsao Gum Composite Biodegradable Active Films. LWT 2022, 155. [Google Scholar] [CrossRef]
- Chilom, C.G.; Bacalum, M.; Stanescu, M.M.; Florescu, M. Insight into the Interaction of Human Serum Albumin with Folic Acid: A Biophysical Study. Spectrochim Acta A Mol Biomol Spectrosc 2018, 204, 648–656. [Google Scholar] [CrossRef] [PubMed]
- Gentile, L. Protein–Polysaccharide Interactions and Aggregates in Food Formulations. Curr Opin Colloid Interface Sci 2020, 48, 18–27. [Google Scholar] [CrossRef]
- Chandel, T.I.; Zaman, M.; Khan, M.V.; Ali, M.; Rabbani, G.; Ishtikhar, M.; Khan, R.H. A Mechanistic Insight into Protein-Ligand Interaction, Folding, Misfolding, Aggregation and Inhibition of Protein Aggregates: An Overview. Int J Biol Macromol 2018, 106, 1115–1129. [Google Scholar] [CrossRef] [PubMed]
- Shimoni, E. Using AFM to Explore Food Nanostructure. Curr Opin Colloid Interface Sci 2008, 13, 368–374. [Google Scholar] [CrossRef]
- Cao, H.; Sun, R.; Shi, J.; Li, M.; Guan, X.; Liu, J.; Huang, K.; Zhang, Y. Effect of Ultrasonic on the Structure and Quality Characteristics of Quinoa Protein Oxidation Aggregates. Ultrason Sonochem 2021, 77. [Google Scholar] [CrossRef] [PubMed]
- Orsini Delgado, M.C.; Nardo, A.; Pavlovic, M.; Rogniaux, H.; Añón, M.C.; Tironi, V.A. Identification and Characterization of Antioxidant Peptides Obtained by Gastrointestinal Digestion of Amaranth Proteins. Food Chem 2016, 197, 1160–1167. [Google Scholar] [CrossRef] [PubMed]
- Gülçin, I. Antioxidant Properties of Resveratrol: A Structure-Activity Insight. Innovative Food Science and Emerging Technologies 2010, 11, 210–218. [Google Scholar] [CrossRef]
- Escribano, J.; Cabanes, J.; Jiménez-Atiénzar, M.; Ibañez-Tremolada, M.; Gómez-Pando, L.R.; García-Carmona, F.; Gandía-Herrero, F. Characterization of Betalains, Saponins and Antioxidant Power in Differently Colored Quinoa (Chenopodium Quinoa) Varieties. Food Chem 2017, 234, 285–294. [Google Scholar] [CrossRef]
- Zhang, X.; Wang, C.; Qi, Z.; Zhao, R.; Wang, C.; Zhang, T. Pea Protein Based Nanocarriers for Lipophilic Polyphenols: Spectroscopic Analysis, Characterization, Chemical Stability, Antioxidant and Molecular Docking. Food Research International 2022, 160. [Google Scholar] [CrossRef]
- Chamizo-González, F.; Heredia, F.J.; Rodríguez-Pulido, F.J.; González-Miret, M.L.; Gordillo, B. Proteomic and Computational Characterisation of 11S Globulins from Grape Seed Flour By-Product and Its Interaction with Malvidin 3-Glucoside by Molecular Docking. Food Chem 2022, 386. [Google Scholar] [CrossRef]
- Patnode, K.; Demchuk, Z.; Johnson, S.; Voronov, A.; Rasulev, B. Computational Protein-Ligand Docking and Experimental Study of Bioplastic Films from Soybean Protein, Zein, and Natural Modifiers. ACS Sustain Chem Eng 2021, 9, 10740–10748. [Google Scholar] [CrossRef]
- Chen, S.; Han, Y.; Huang, J.; Dai, L.; Du, J.; McClements, D.J.; Mao, L.; Liu, J.; Gao, Y. Fabrication and Characterization of Layer-by-Layer Composite Nanoparticles Based on Zein and Hyaluronic Acid for Codelivery of Curcumin and Quercetagetin. ACS Appl Mater Interfaces 2019, 11, 16922–16933. [Google Scholar] [CrossRef] [PubMed]
- Ferina, J.; Daggett, V. Visualizing Protein Folding and Unfolding. J Mol Biol 2019, 431, 1540–1564. [Google Scholar] [CrossRef]
- Li, X.; Ni, T. Probing the Binding Mechanisms of α-Tocopherol to Trypsin and Pepsin Using Isothermal Titration Calorimetry, Spectroscopic, and Molecular Modeling Methods. J Biol Phys 2016, 42, 415–434. [Google Scholar] [CrossRef]
- Wan, Z.L.; Wang, L.Y.; Wang, J.M.; Yuan, Y.; Yang, X.Q. Synergistic Foaming and Surface Properties of a Weakly Interacting Mixture of Soy Glycinin and Biosurfactant Stevioside. J Agric Food Chem 2014, 62, 6834–6843. [Google Scholar] [CrossRef] [PubMed]
- Yang, T.; Yang, H.; Fan, Y.; Li, B.; Hou, H. Interactions of Quercetin, Curcumin, Epigallocatechin Gallate and Folic Acid with Gelatin. Int J Biol Macromol 2018, 118, 124–131. [Google Scholar] [CrossRef]
- Jiang, X.Y.; Li, W.X.; Cao, H. Study of the Interaction between Trans-Resveratrol and BSA by the Multi-Spectroscopic Method. J Solution Chem 2008, 37, 1609–1623. [Google Scholar] [CrossRef]
- Li, W.; Bi, D.; Yi, J.; Yao, L.; Cao, J.; Yang, P.; Li, M.; Wu, Y.; Xu, H.; Hu, Z.; et al. Soy Protein Isolate-Polyguluronate Nanoparticles Loaded with Resveratrol for Effective Treatment of Colitis. Food Chem 2023, 410. [Google Scholar] [CrossRef]
- Khan, M.A.; Fang, Z.; Wusigale; Cheng, H.; Gao, Y.; Deng, Z.; Liang, L. Encapsulation and Protection of Resveratrol in Kafirin and Milk Protein Nanoparticles. Int J Food Sci Technol 2019, 54, 2998–3007. [Google Scholar] [CrossRef]
- Carpentier, J.; Conforto, E.; Chaigneau, C.; Vendeville, J.E.; Maugard, T. Microencapsulation and Controlled Release of α-Tocopherol by Complex Coacervation between Pea Protein and Tragacanth Gum: A Comparative Study with Arabic and Tara Gums. Innovative Food Science and Emerging Technologies 2022, 77. [Google Scholar] [CrossRef]
- Xu, W.; Lv, K.; Mu, W.; Zhou, S.; Yang, Y. Encapsulation of α-Tocopherol in Whey Protein Isolate/Chitosan Particles Using Oil-in-Water Emulsion with Optimal Stability and Bioaccessibility. LWT 2021, 148. [Google Scholar] [CrossRef]
- Penalva, R.; Esparza, I.; Agüeros, M.; Gonzalez-Navarro, C.J.; Gonzalez-Ferrero, C.; Irache, J.M. Casein Nanoparticles as Carriers for the Oral Delivery of Folic Acid. Food Hydrocoll 2015, 44, 399–406. [Google Scholar] [CrossRef]
- Andreeva, Y.I.; Drozdov, A.S.; Fakhardo, A.F.; Cheplagin, N.A.; Shtil, A.A.; Vinogradov, V.V. The Controllable Destabilization Route for Synthesis of Low Cytotoxic Magnetic Nanospheres with Photonic Response. Sci Rep 2017, 7. [Google Scholar] [CrossRef] [PubMed]
- Fröhlich, E. The Role of Surface Charge in Cellular Uptake and Cytotoxicity of Medical Nanoparticles. Int J Nanomedicine 2012, 7, 5577–5591. [Google Scholar] [CrossRef] [PubMed]
- Relkin, P.; Shukat, R. Food Protein Aggregates as Vitamin-Matrix Carriers: Impact of Processing Conditions. Food Chem 2012, 134, 2141–2148. [Google Scholar] [CrossRef] [PubMed]
- Tiwari, K.; Singh, G.; Singh, S.K. Purification and Structural Characterization of N-Terminal 190 Amino Acid Deleted Essential Mammalian Protein; Transcription Termination Factor 1. ACS Omega 2022, 7, 45165–45173. [Google Scholar] [CrossRef] [PubMed]
- Rashidinejad, A.; Birch, E.J.; Sun-Waterhouse, D.; Everett, D.W. Addition of Milk to Tea Infusions_ Helpful or Harmful_ Evidence from in Vitro and in Vivo Studies on Antioxidant Properties. 2017. [CrossRef]
- Pérez, O.E.; Carrera-Sánchez, C.; Rodríguez-Patino, J.M.; Pilosof, A.M.R. Adsorption Dynamics and Surface Activity at Equilibrium of Whey Proteins and Hydroxypropyl-Methyl-Cellulose Mixtures at the Air-Water Interface. Food Hydrocoll 2007, 21, 794–803. [Google Scholar] [CrossRef]
- Izabela Biskup; Iwona Golonka; Andrzej Gamian; Zbigniew Sroka Antioxidant Activity of Selected Phenols Estimated by ABTS and FRAP Methods. 2013, 958–963. [CrossRef]
- Schlesier, K.; Harwat, M.; Böhm, V.; Bitsch, R. Assessment of Antioxidant Activity by Using Different in Vitro Methods. Free Radic Res 2002, 36, 177–187. [Google Scholar] [CrossRef]
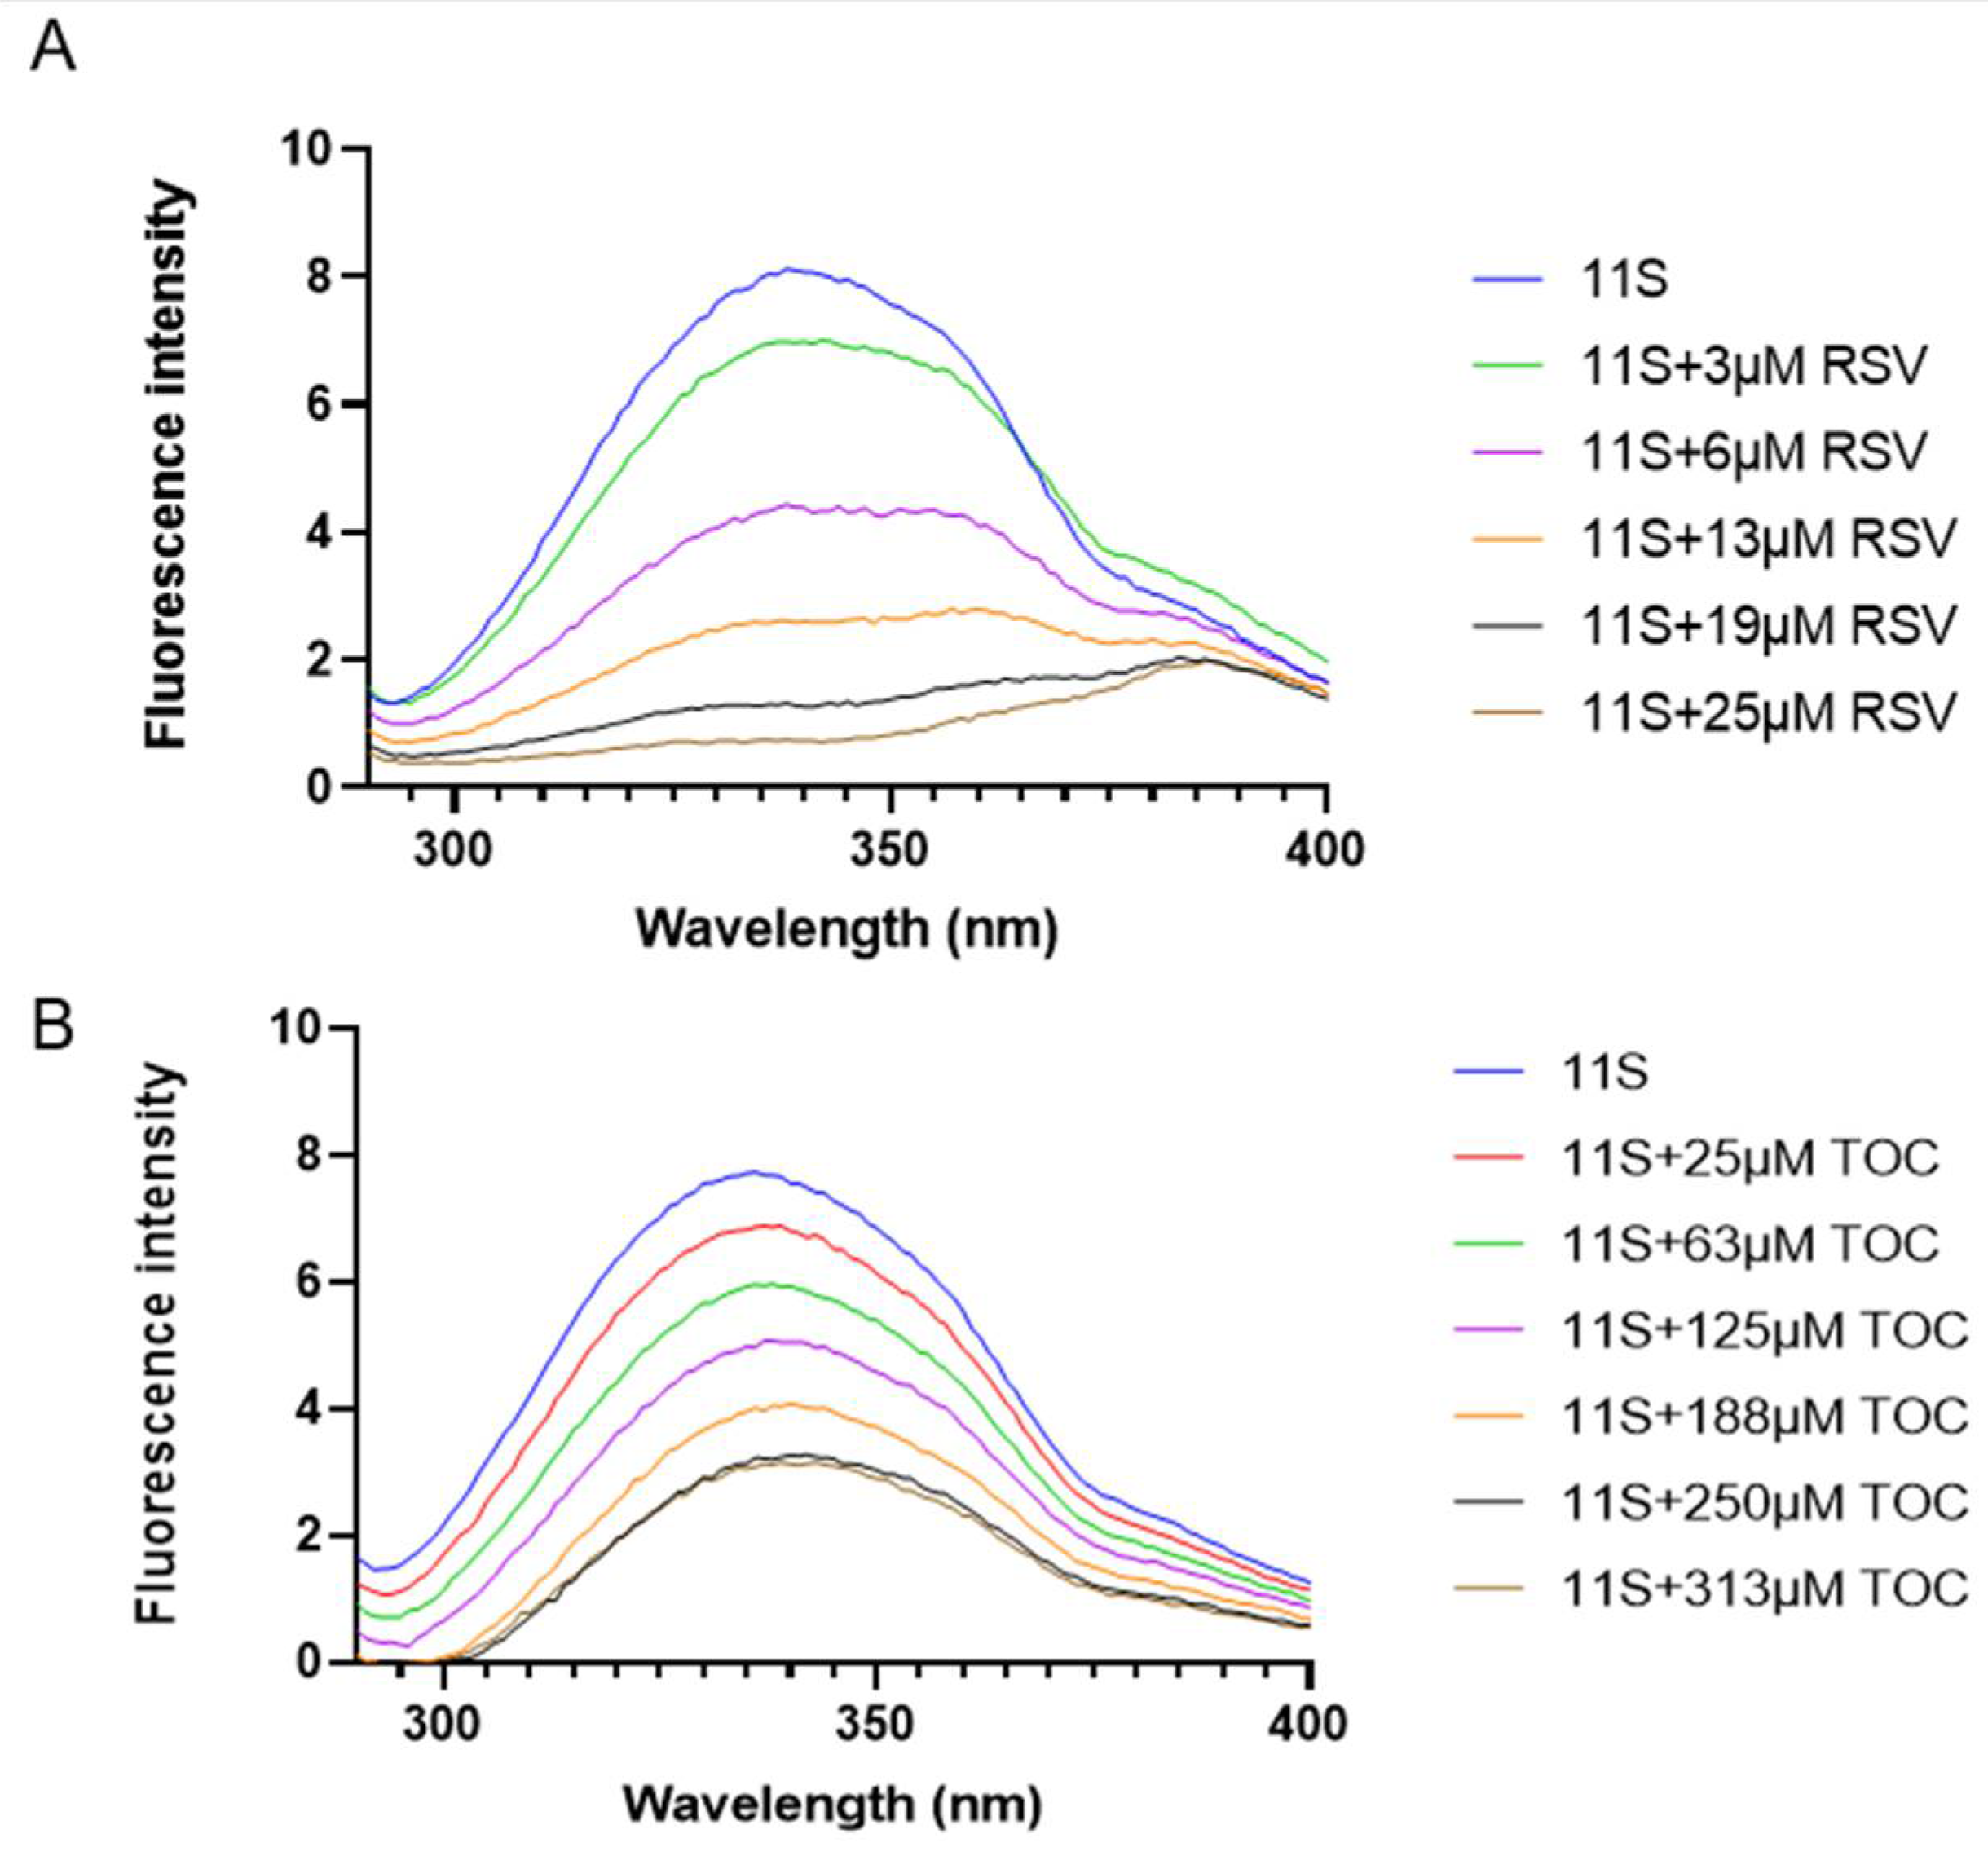
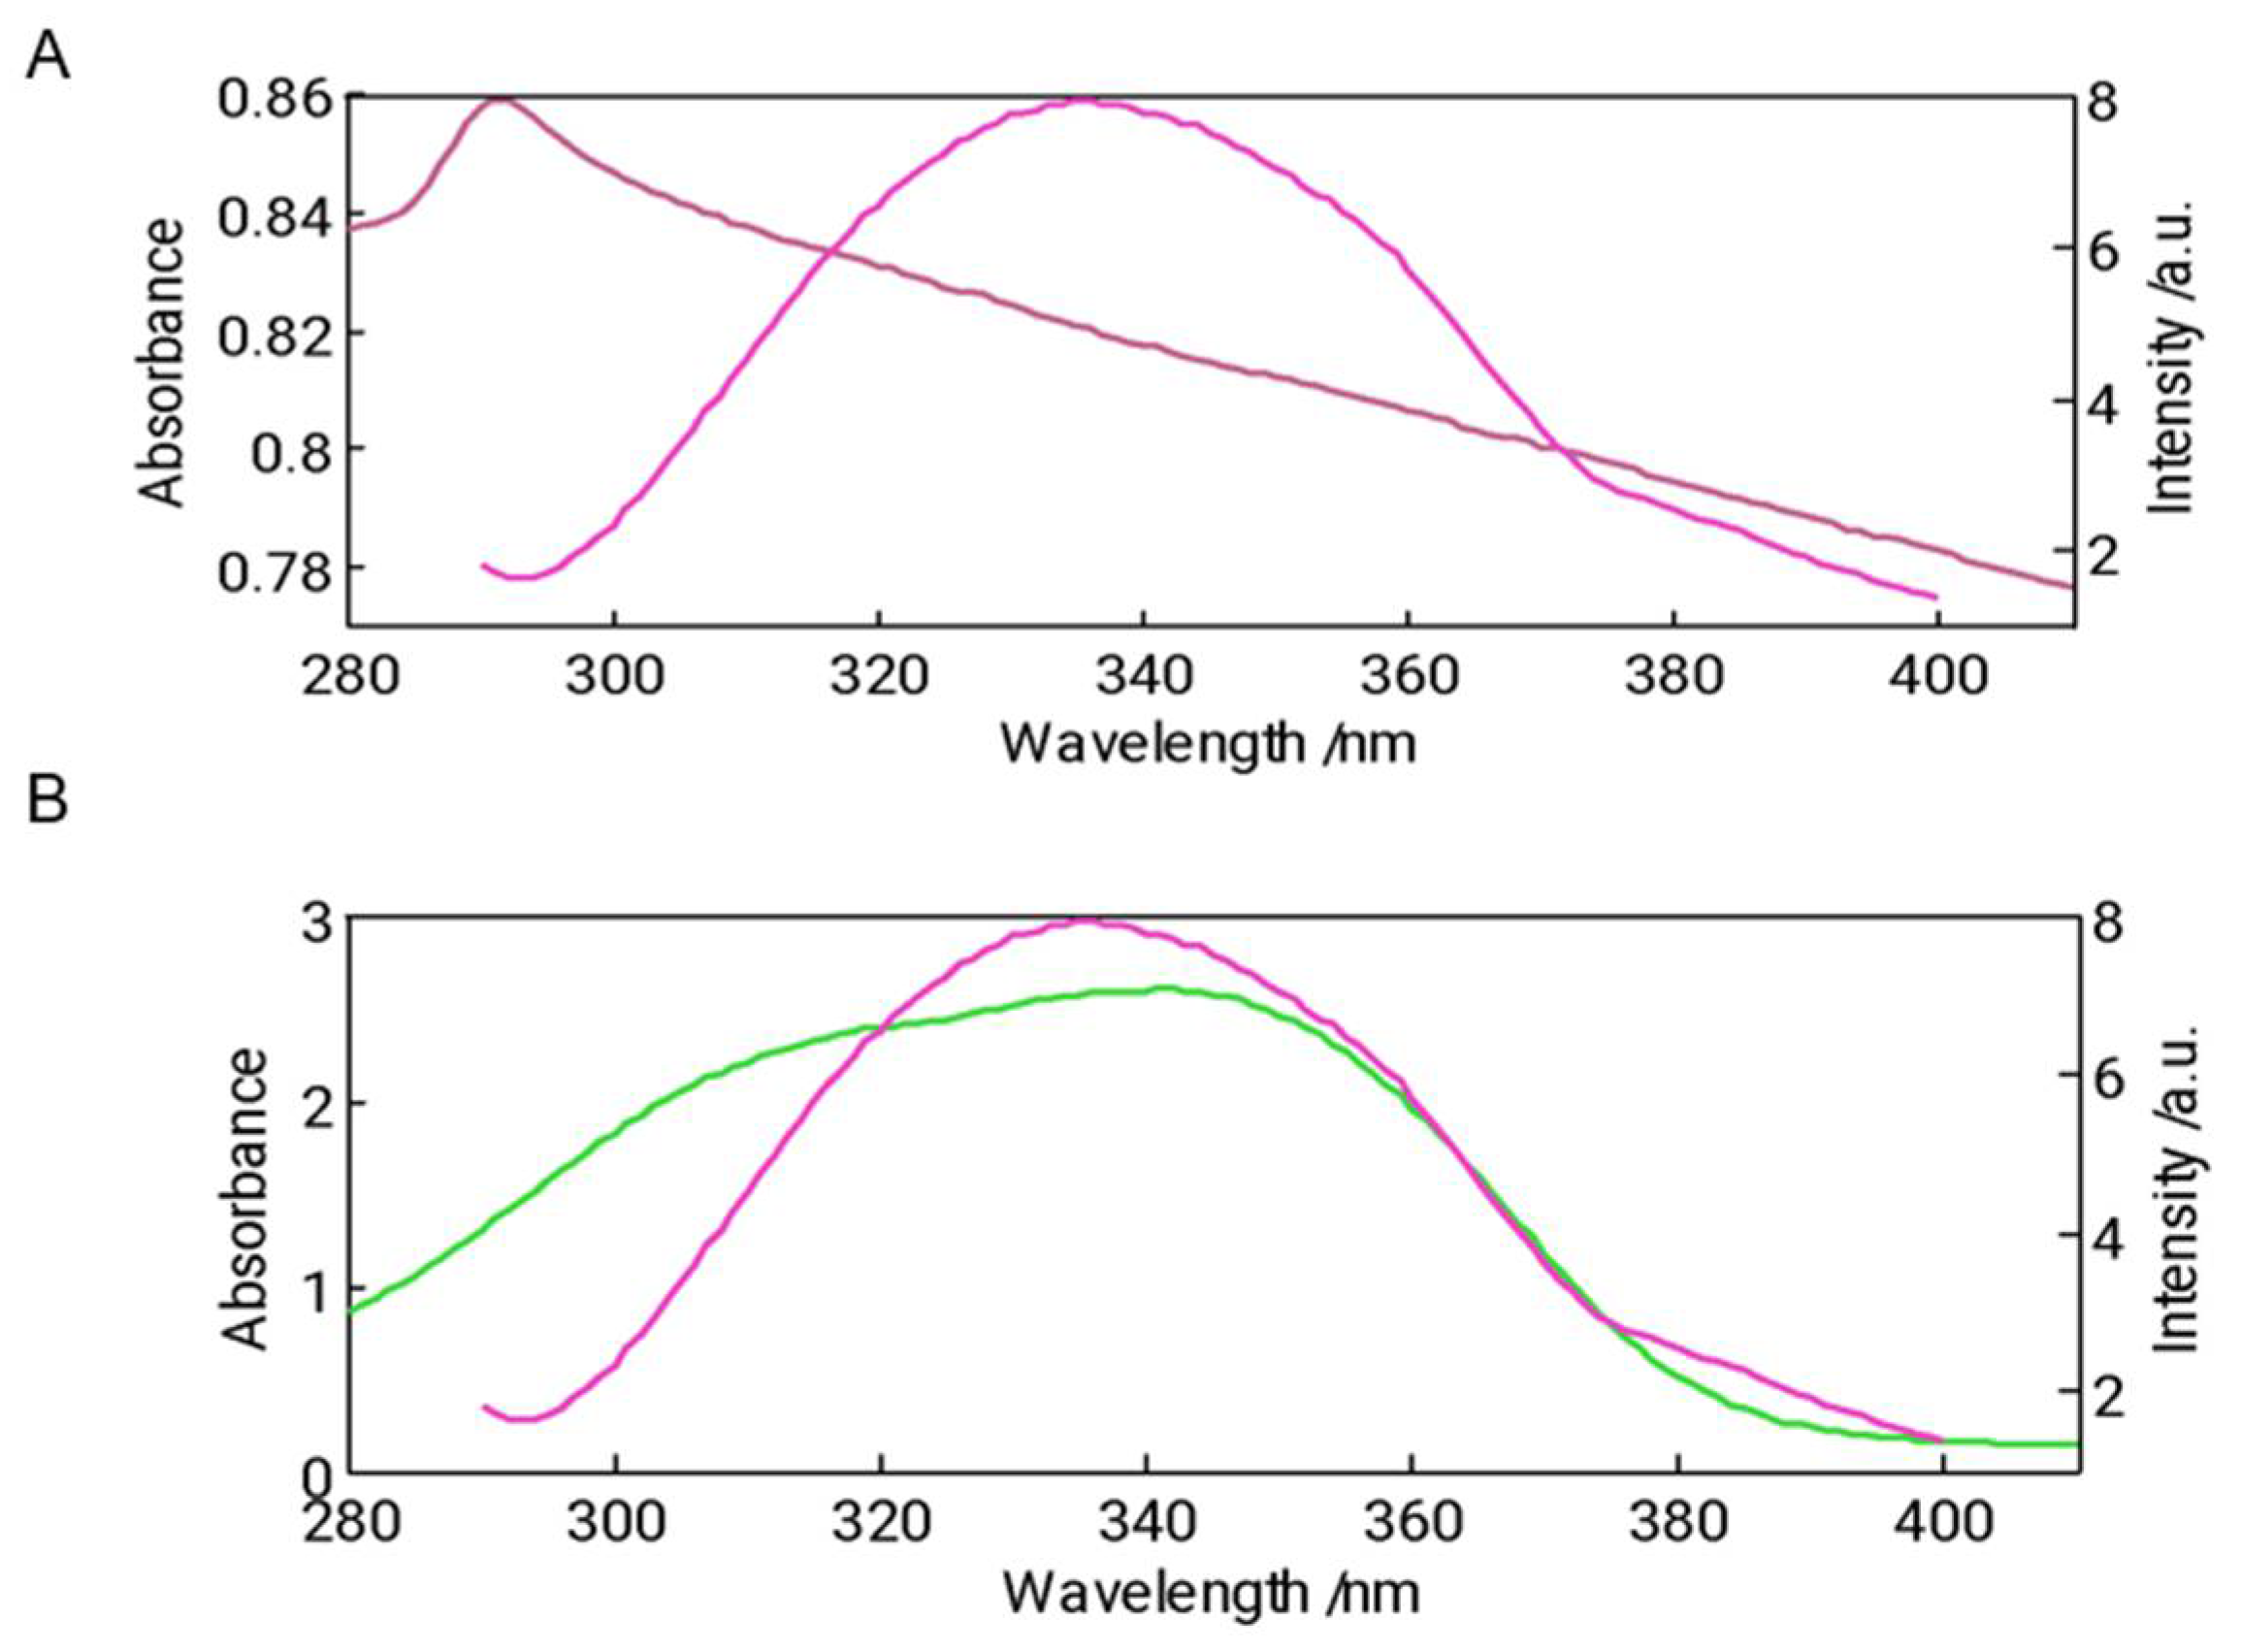
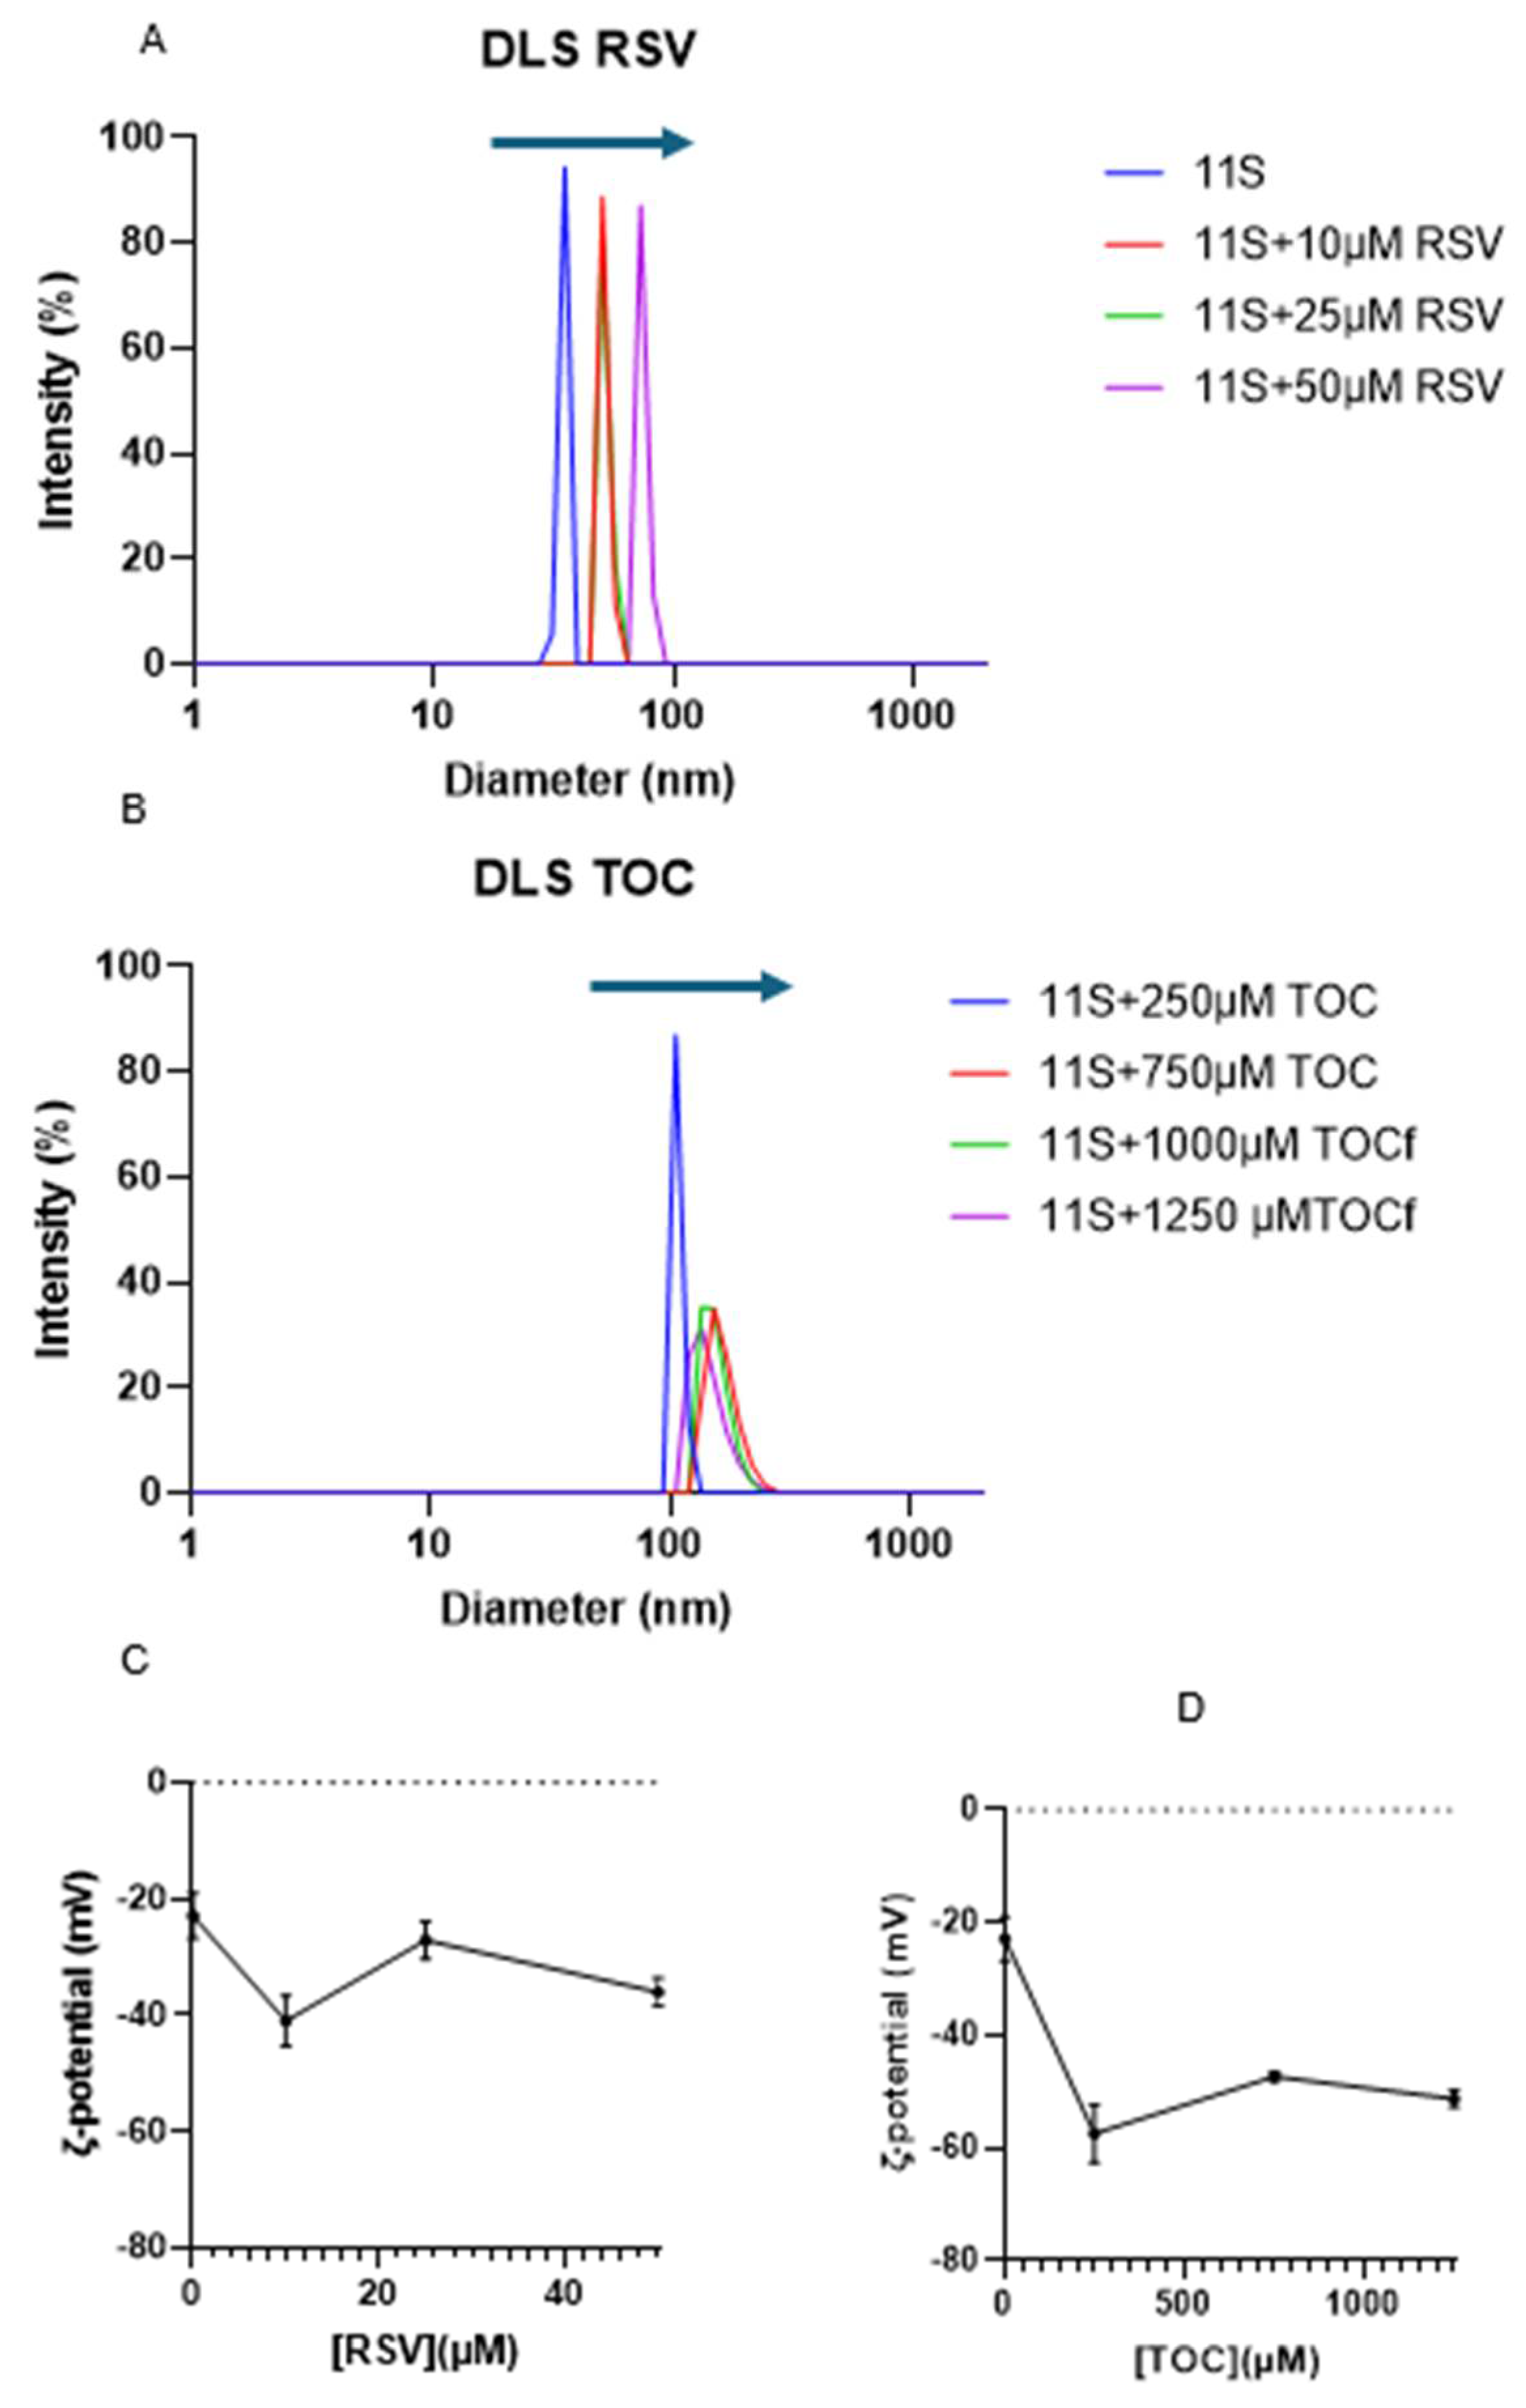
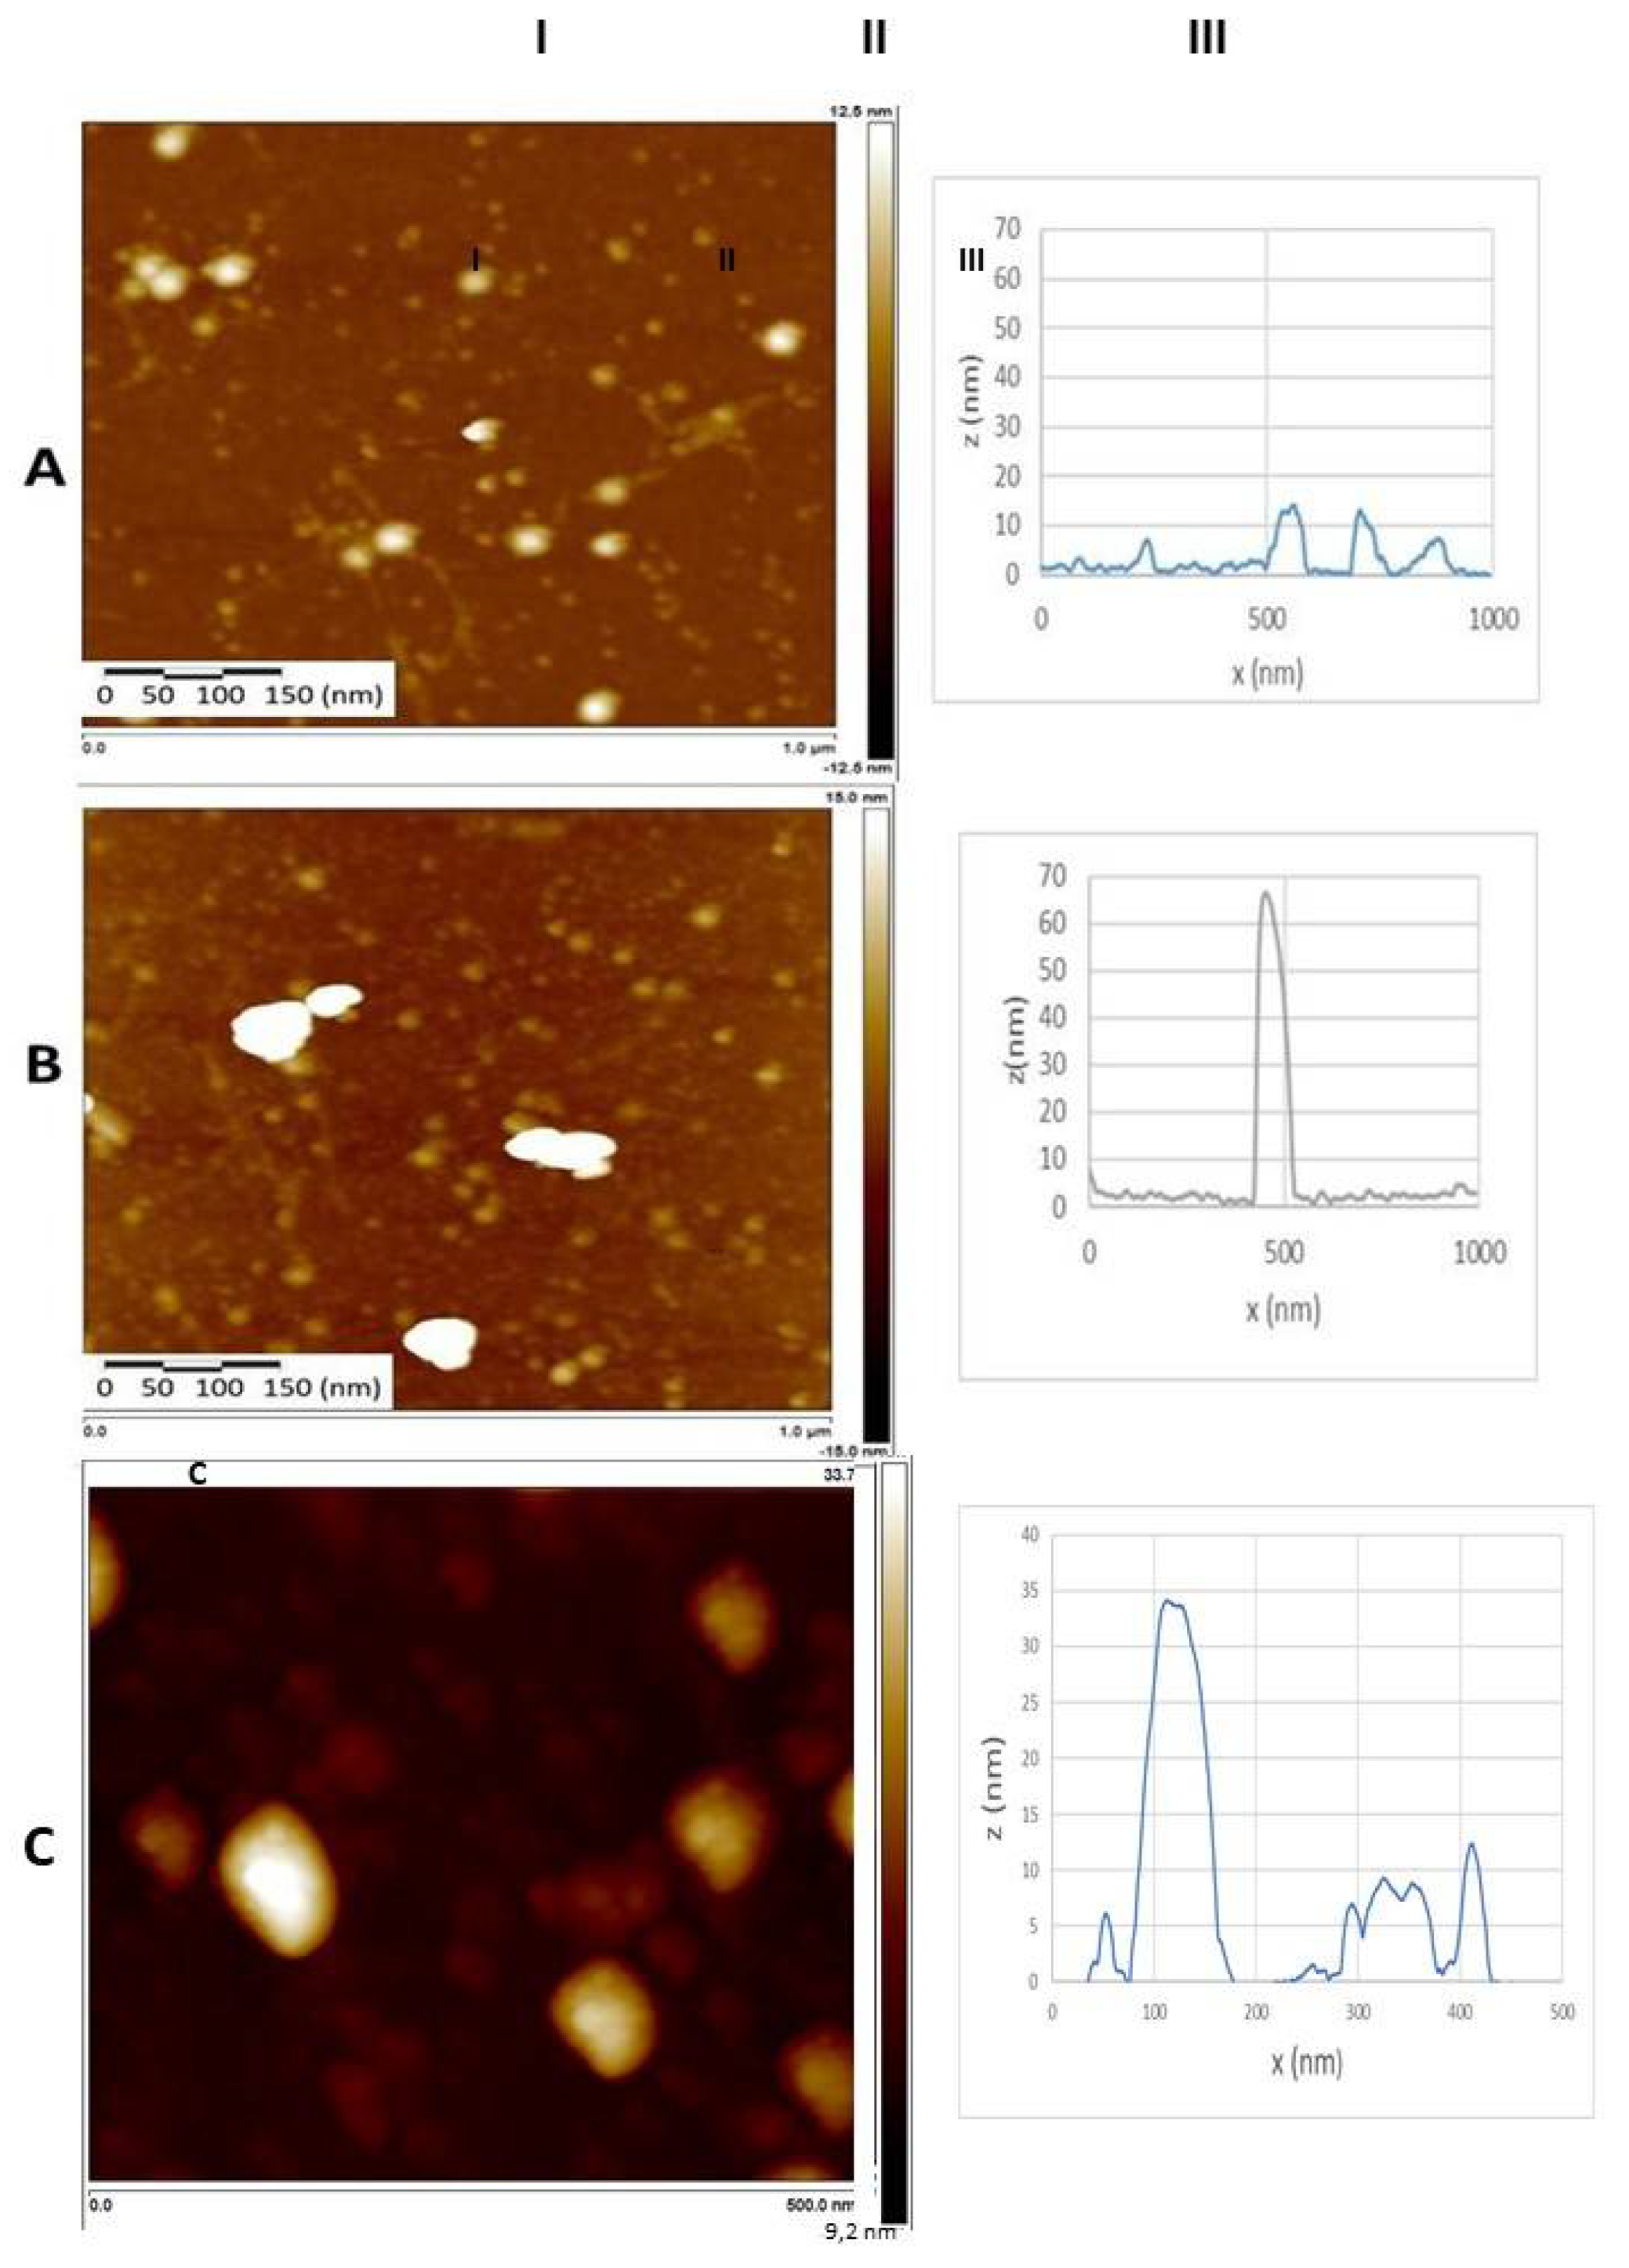
 |
 |
| TOC | RSV | |
| Stern-Volmer model | ||
| Ksv (M-1) | 4800 | 385700 |
| Kq (M-1 s-1) | 1.66*1012 | 1.13*1014 |
| n | 1.04 | 2.35 |
| R2 | 0.9931 | 0.9406 |
| Scatchard model | ||
| K (M-1) | 151478 | 3852674 |
| n | 8.87 | 0.90 |
| R2 | 0.9422 | 0.9707 |
| Förster resonance energy transfer (FRET) | ||
| J (λ) (cm3/M) | 1.14*1013 | 2.67*1013 |
| R0 (nm) | 5.39 | 6.22 |
Disclaimer/Publisher’s Note: The statements, opinions and data contained in all publications are solely those of the individual author(s) and contributor(s) and not of MDPI and/or the editor(s). MDPI and/or the editor(s) disclaim responsibility for any injury to people or property resulting from any ideas, methods, instructions or products referred to in the content. |
© 2024 by the authors. Licensee MDPI, Basel, Switzerland. This article is an open access article distributed under the terms and conditions of the Creative Commons Attribution (CC BY) license (http://creativecommons.org/licenses/by/4.0/).


