Submitted:
12 July 2024
Posted:
15 July 2024
You are already at the latest version
Abstract
Keywords:
1. Introduction
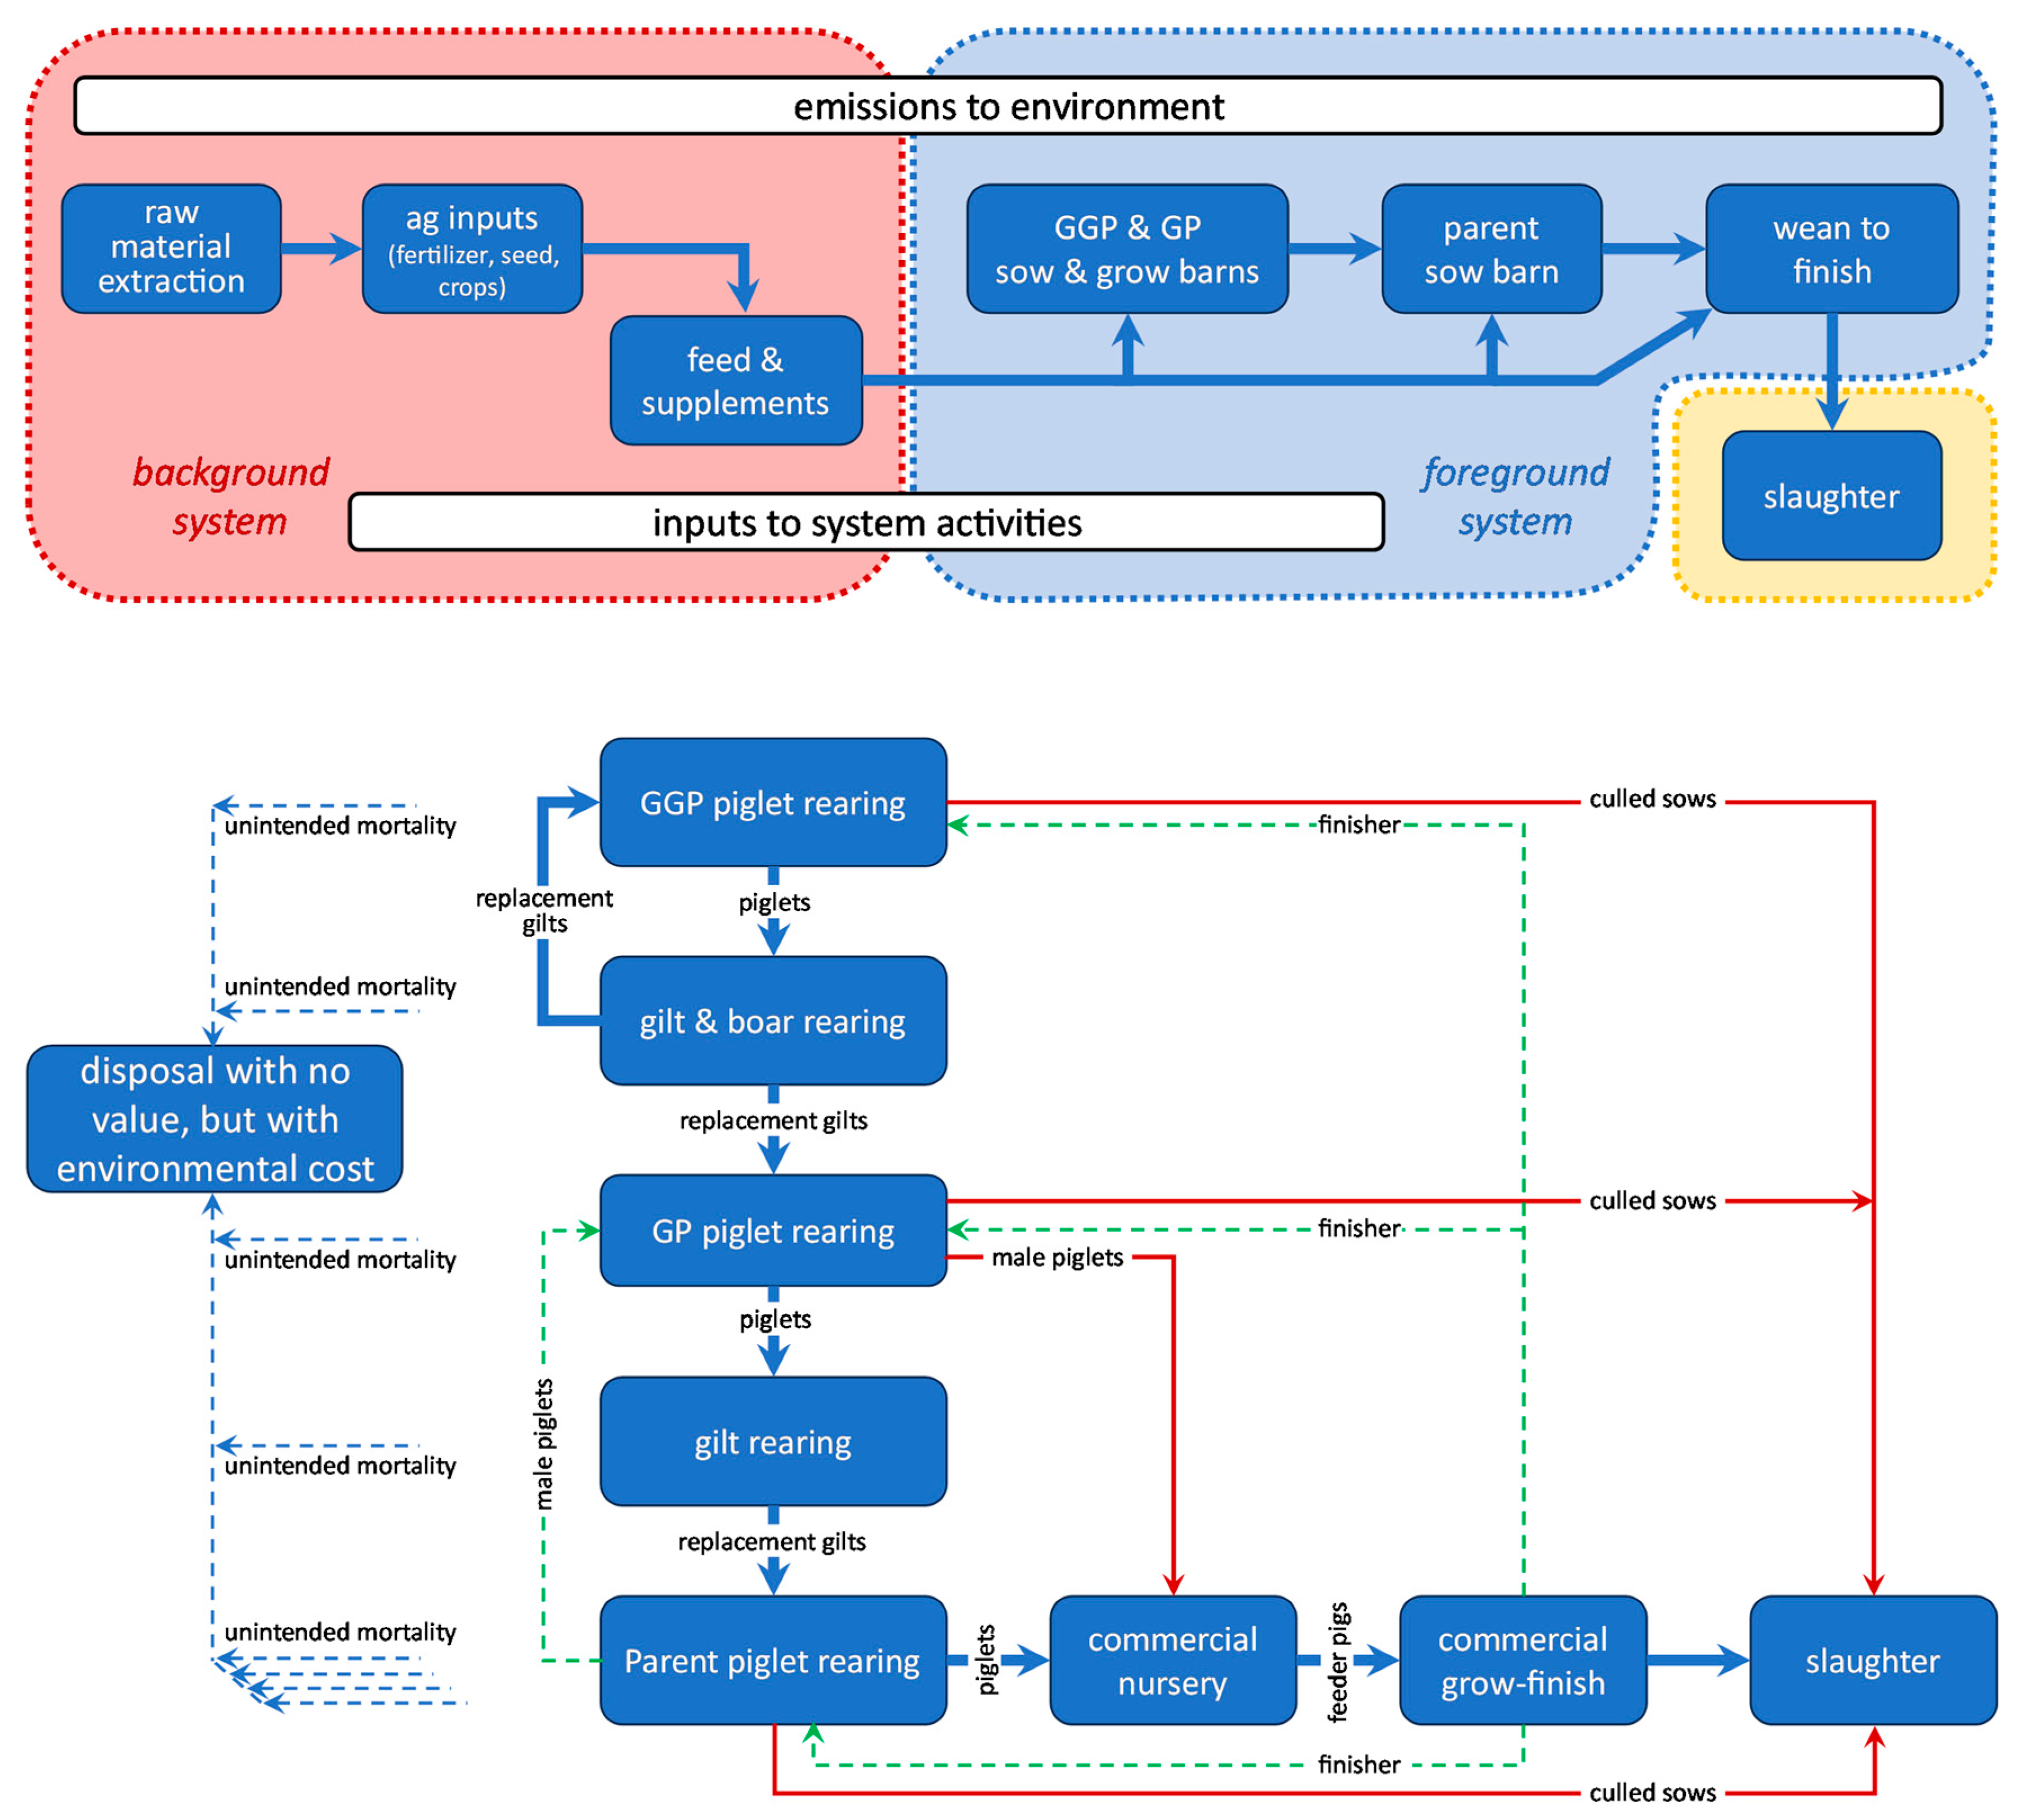
2. Material and Methods, or: Goal and Scope
2.1. Functional Unit, System Boundary, Cut-Off Criteria and Multi-Functionality
2.2. Unit Processes and Their Data Requirements
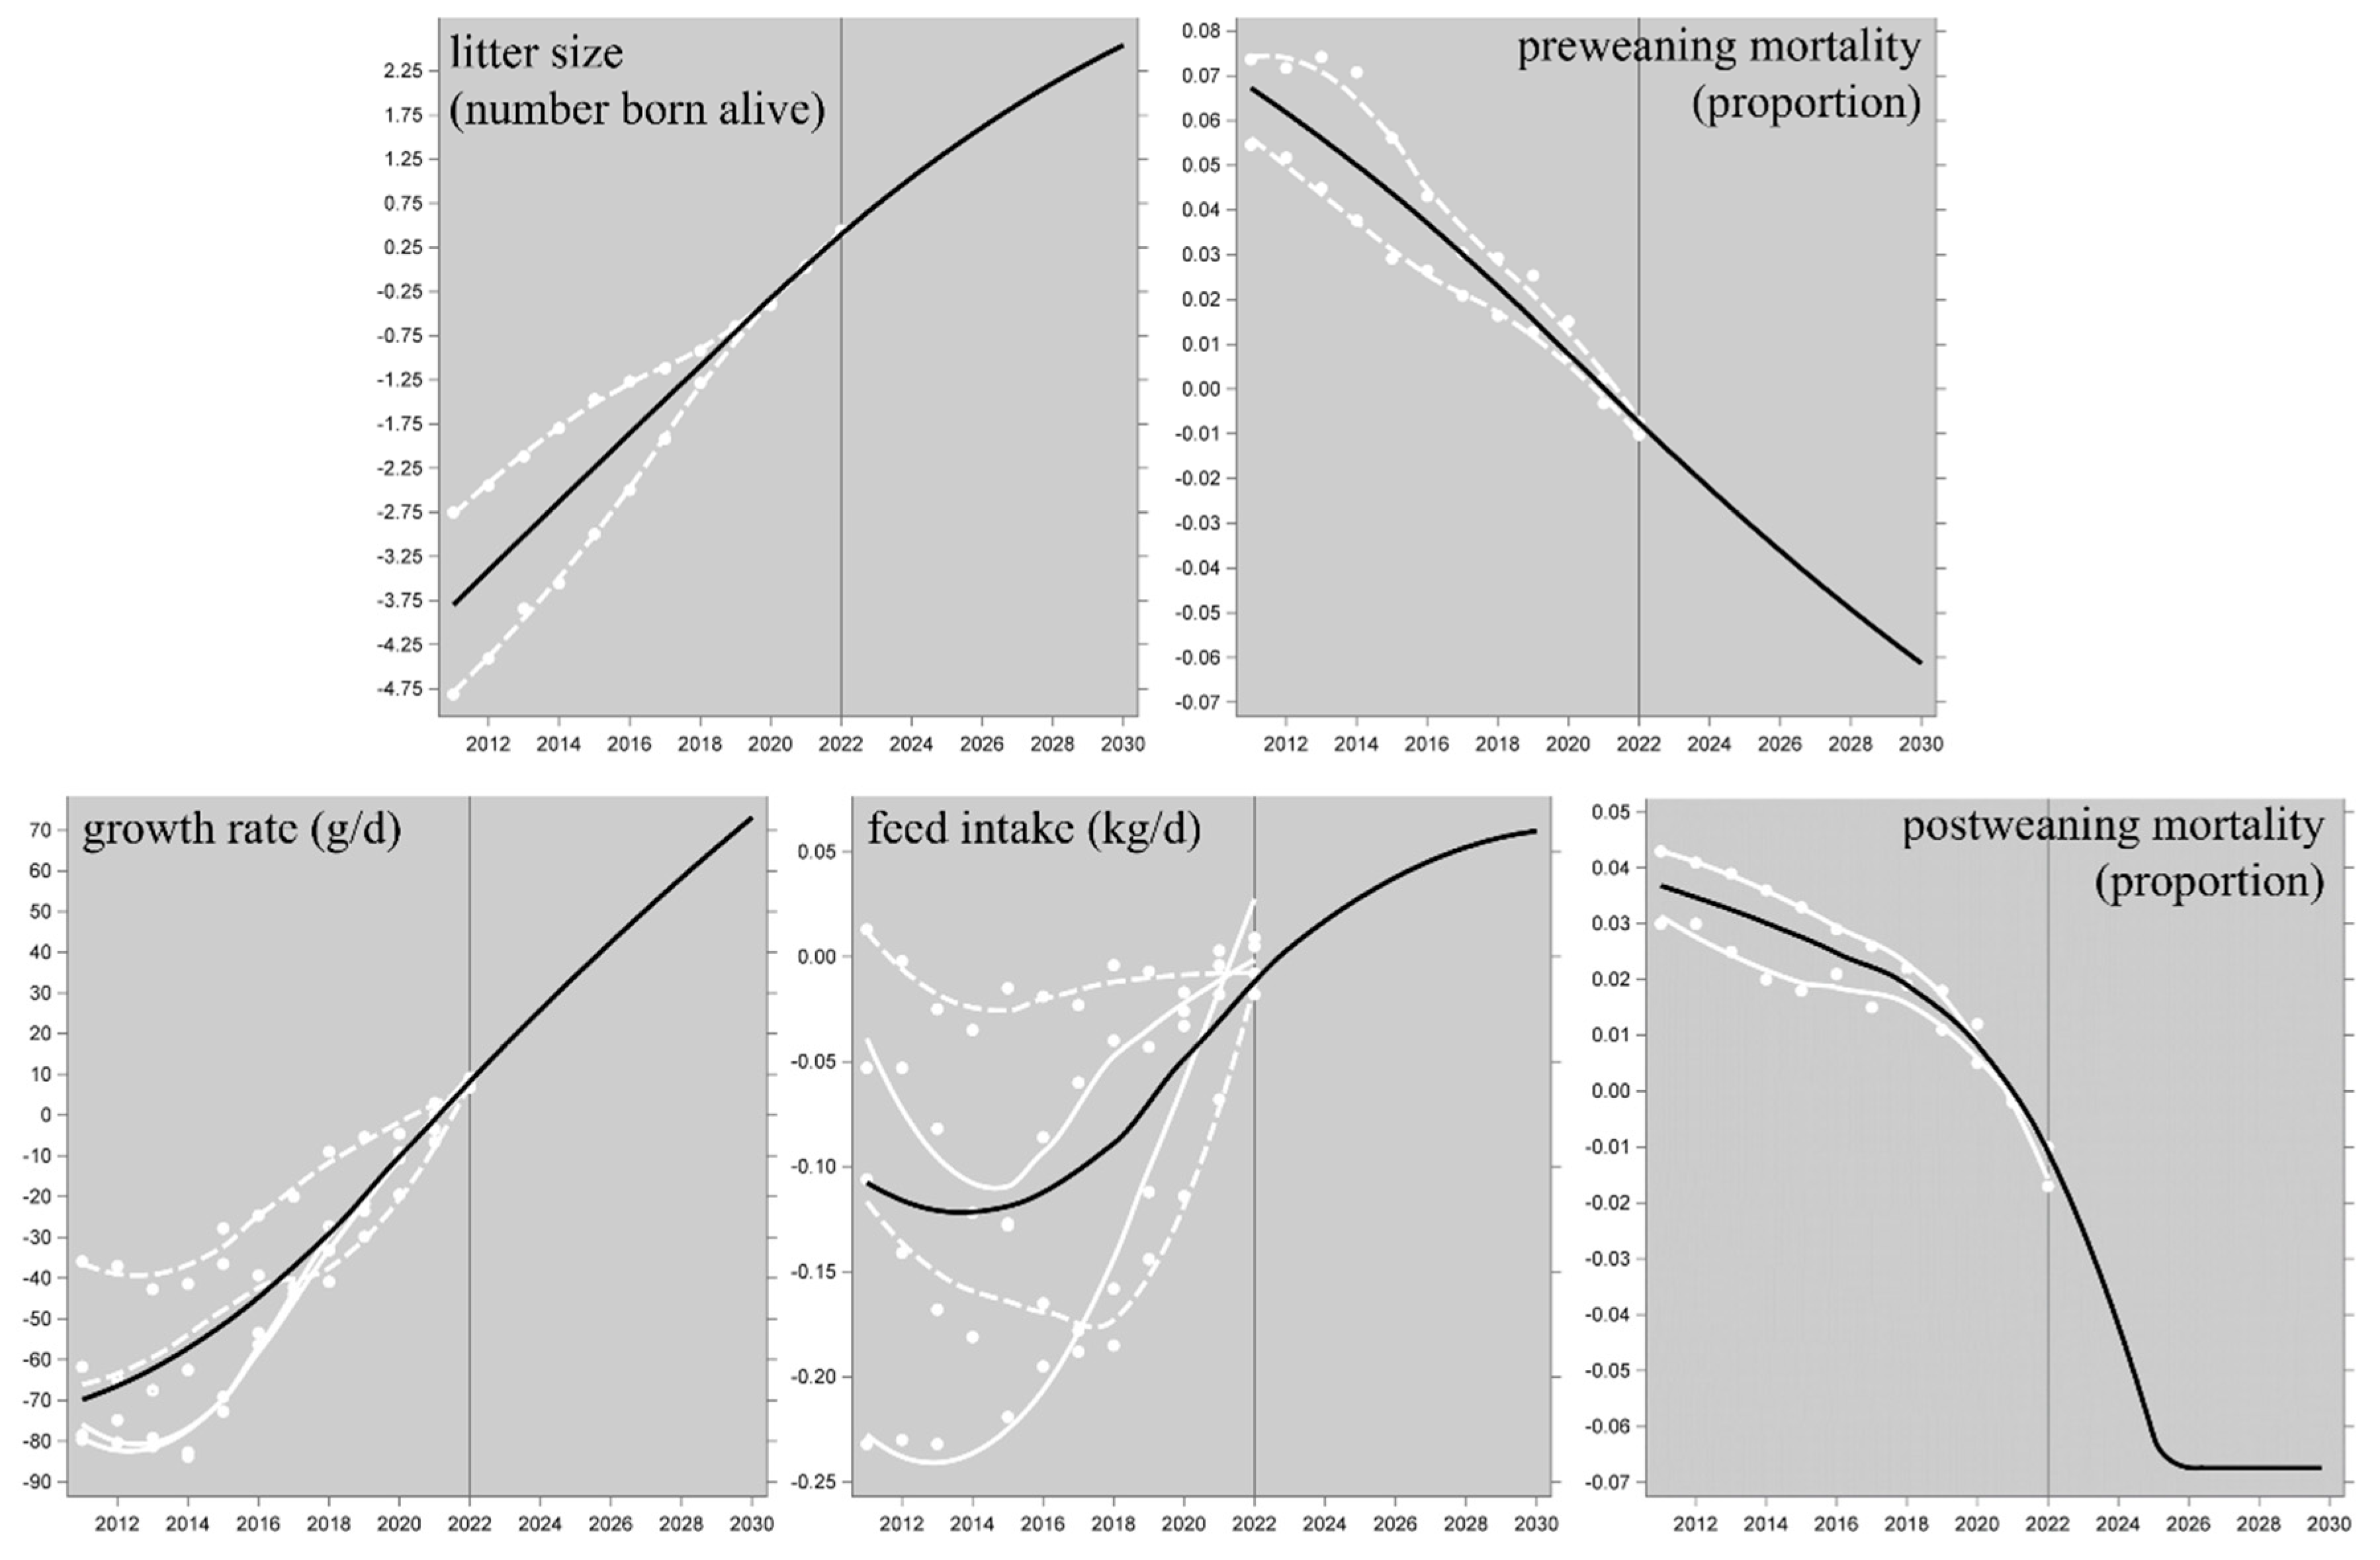
2.3. Realized Genetic Trends in Performance Traits
2.4. Scenario 1: Forecasting to 2030
2.5. Scenario 2: Baseline Comparison
2.5.1. Data
2.5.2. Diet Composition
2.6. Lifecycle Impact Assessment
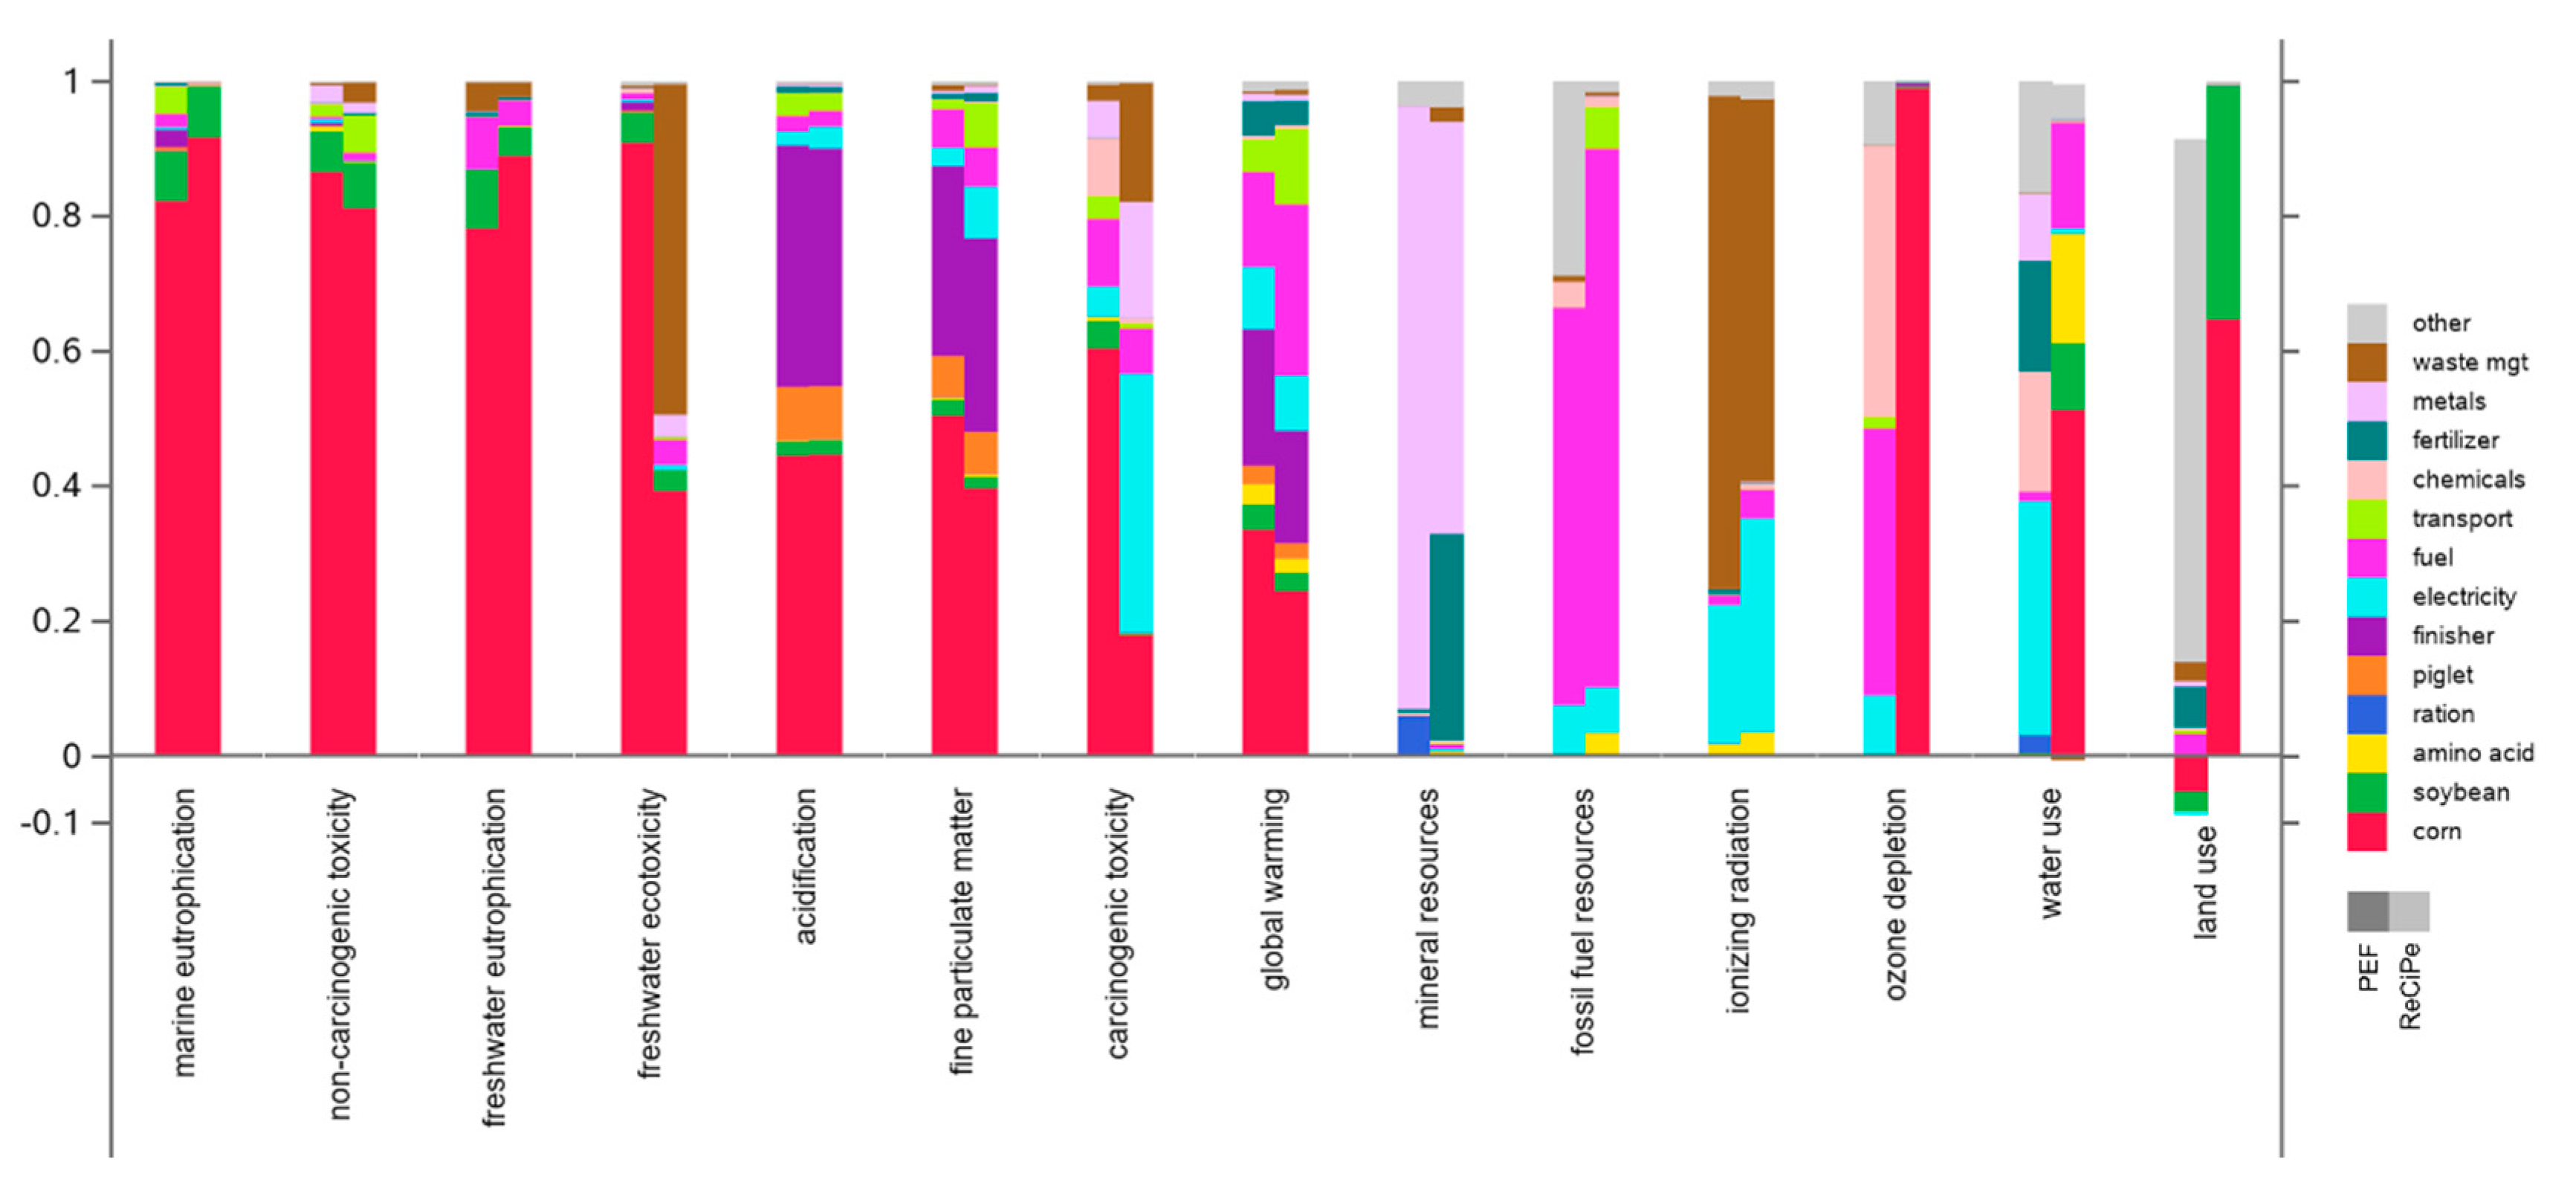
2.7. Contribution Analysis
2.8. Methodological Quality Assessment
3.1. Realized Genetic Trends of Performance Traits
3.2. Scenario Analysis
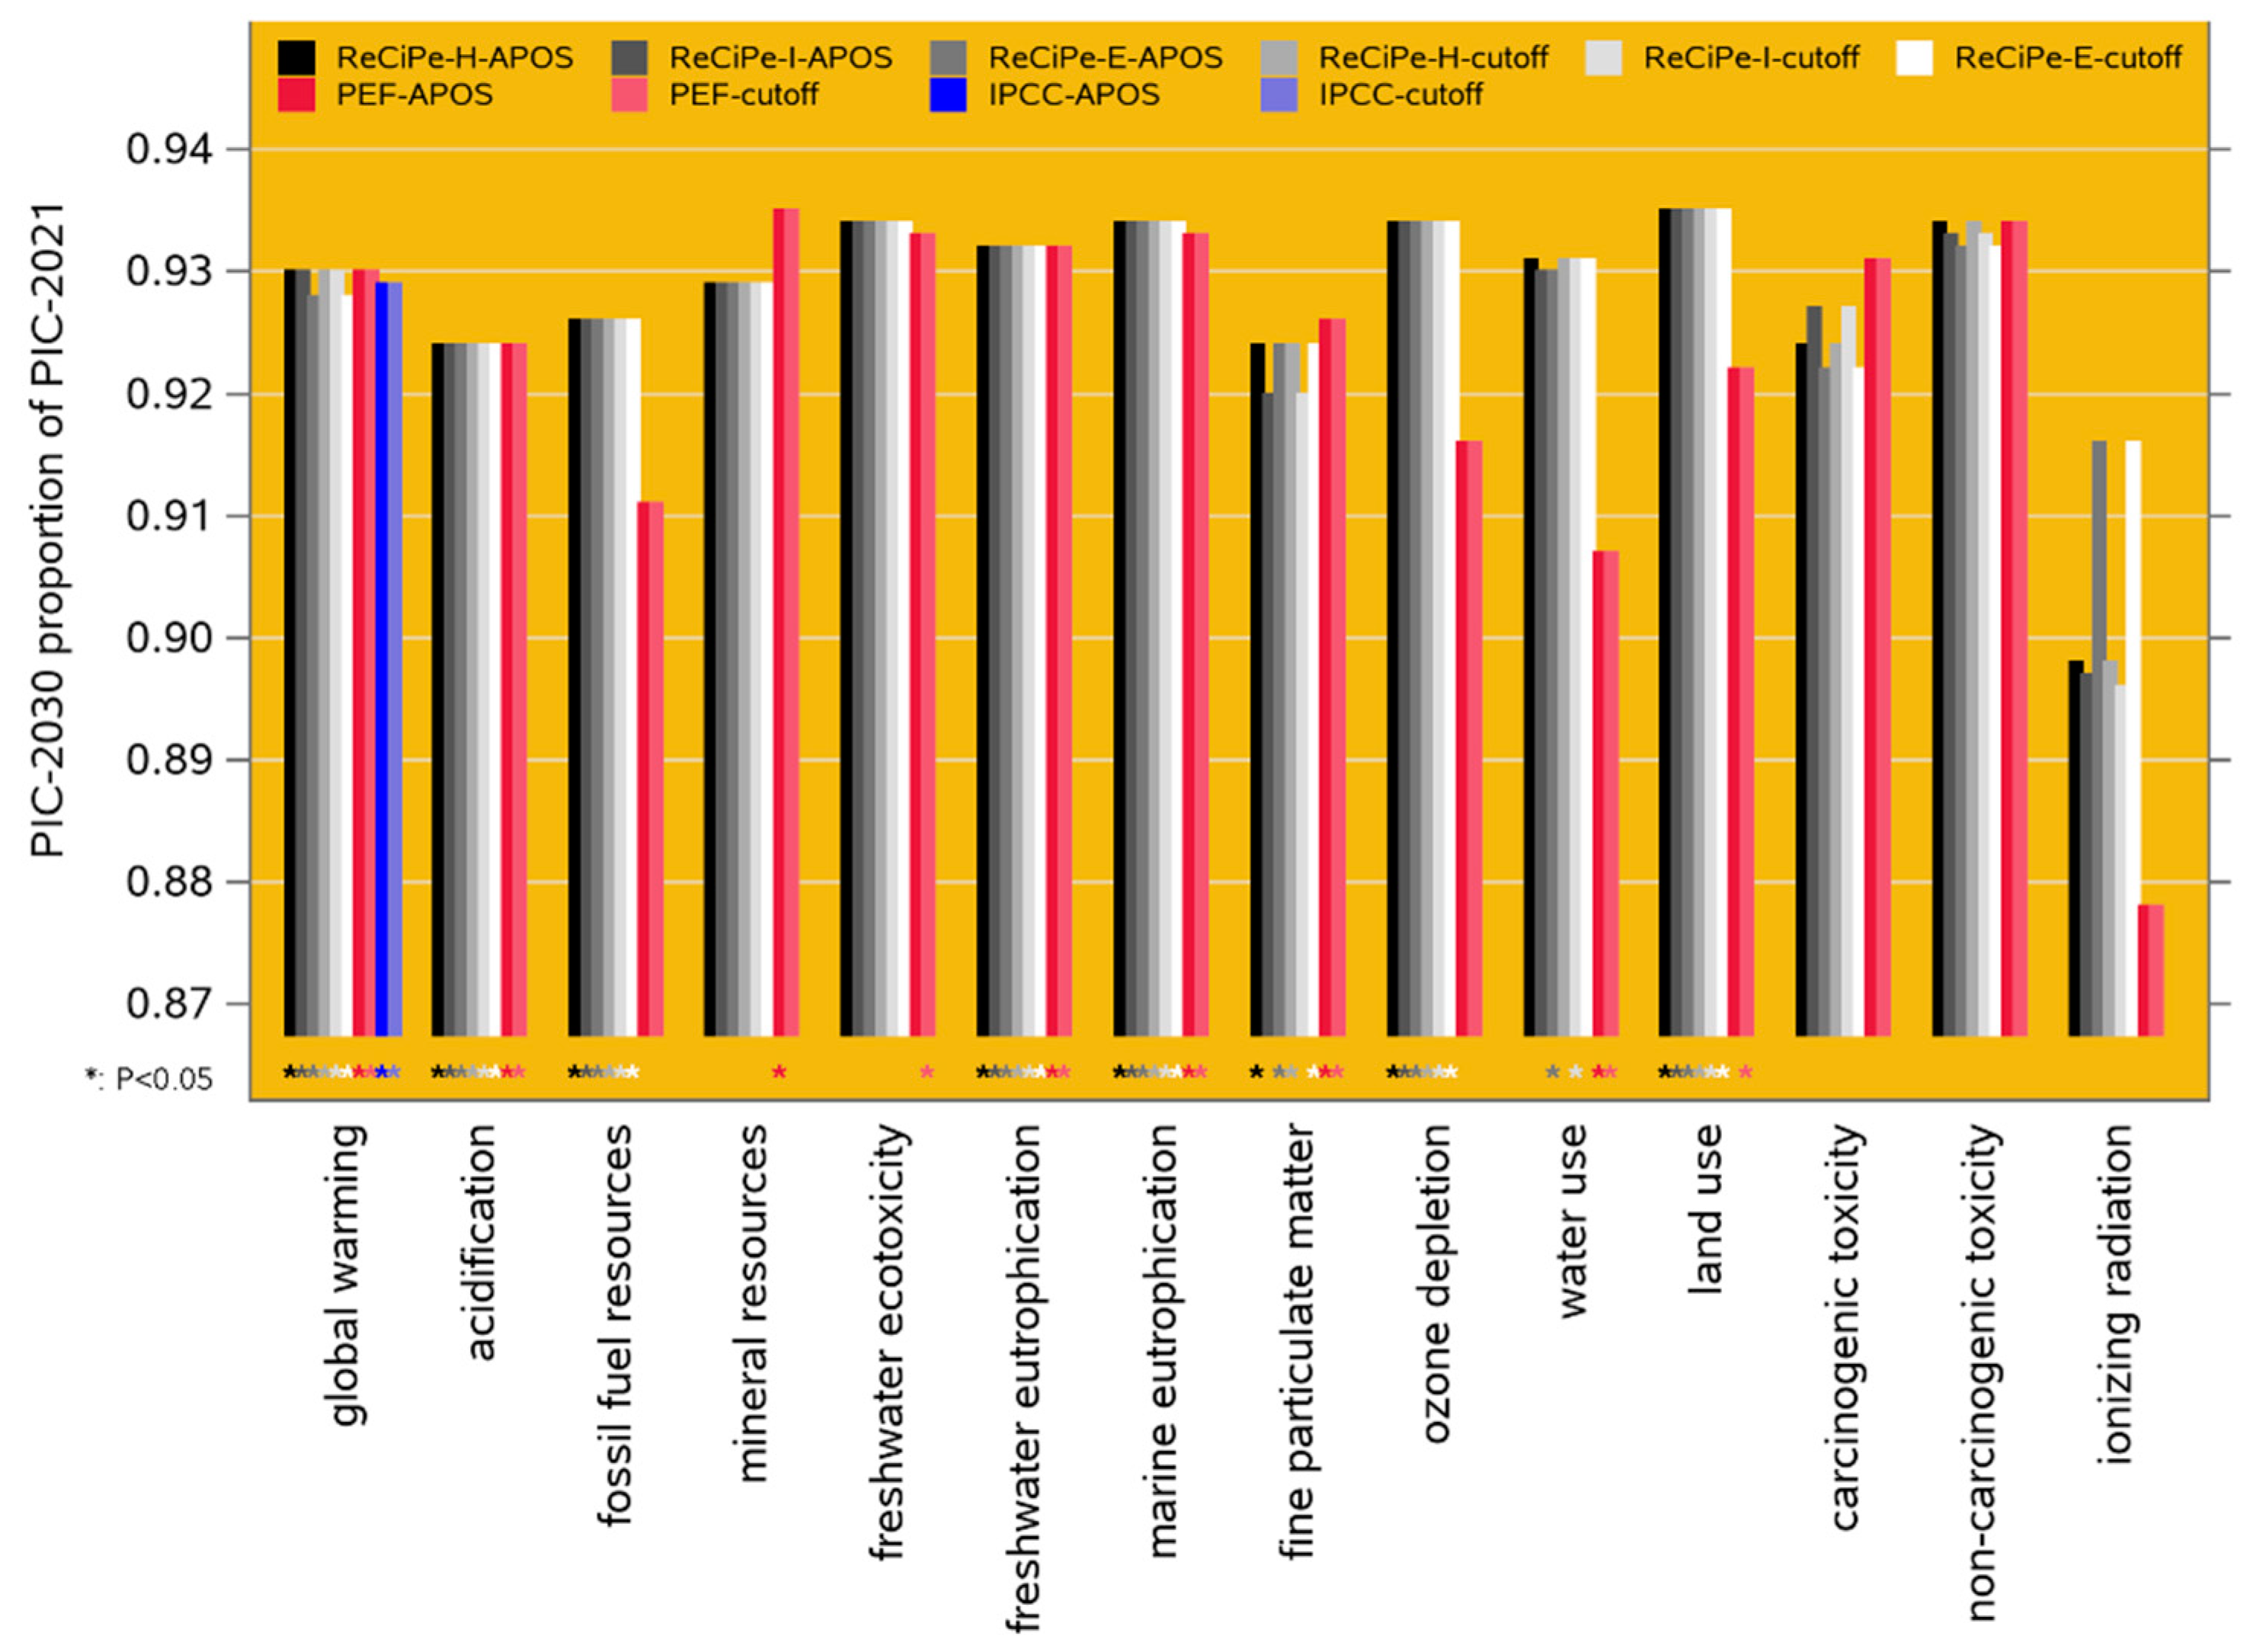
3.2.1. Scenario 1: Forecast to 2030
3.2.1.1. Contribution Analysis
3.2.2. Scenario 2: Baseline Comparison
4. Discussion
4.1. Boundaries within the Current LCA Environment
4.2. Comparison to other Studies
4.3. Scenario 2: Baseline Comparison
4.4. Extrapolation to 2030
4.5. Livestock Genetic Improvement
4.6. Future Work
Supplementary Material
Author contributions
Funding
Data availability
Institutional Review Board Statement
Informed Consent Statement
Acknowledgements
Conflicts of interest
Abbreviations
References
- Alfonso, L. Impact of incorporating greenhouse gas emission intensities in selection indexes for sow productivity traits. Livest. Sci. 2019, 219, 57–61. [Google Scholar] [CrossRef]
- Ali BM, Bastiaansen JWM, De Mey Y, Oude Lansink AGJM (2018) Effects of incorporating environmental cost and risk aversion on economic values of pig breeding goal traits. J. Anim. Breed. Genet. 135:194-207.
- Amer, P.; Hely, F.; Quinton, C.; Cromie, A. A methodology framework for weighting genetic traits that impact greenhouse gas emission intensities in selection indexes. Animal 2018, 12, 5–11. [Google Scholar] [CrossRef] [PubMed]
- Andretta, I.; Hickmann, F.M.W.; Remus, A.; Franceschi, C.H.; Mariani, A.B.; Orso, C.; Kipper, M.; Létourneau-Montminy, M.-P.; Pomar, C. Environmental Impacts of Pig and Poultry Production: Insights From a Systematic Review. Front. Veter- Sci. 2021, 8. [Google Scholar] [CrossRef] [PubMed]
- Berry, D.; Dunne, F.; McHugh, N.; McParland, S.; O’brien, A.; Twomey, A. The development of effective ruminant breeding programmes in Ireland from science to practice. Ir. J. Agric. Food Res. 2022, 61, 38–54. [Google Scholar] [CrossRef]
- Bichard, M. Dissemination of genetic improvement through a livestock industry. Anim. Sci. 1971, 13, 401–411. [Google Scholar] [CrossRef]
- Bidanel JP (2011) Biology and genetics of reproduction. In: The genetics of the pig, 2nd edition (eds. Rothschild MF, Ruvinsky A), pp. 218-241. CABI, Wallingford, UK. ISBN 9781845937560.
- Bodirsky, B.L.; Rolinski, S.; Biewald, A.; Weindl, I.; Popp, A.; Lotze-Campen, H. Global Food Demand Scenarios for the 21st Century. PLOS ONE 2015, 10, e0139201. [Google Scholar] [CrossRef]
- Bonesmo, H.; Enger, E.G. The effects of progress in genetics and management on intensities of greenhouse gas emissions from Norwegian pork production. Livest. Sci. 2021, 254, 104746. [Google Scholar] [CrossRef]
- Boussemart, J.-P.; Leleu, H.; Shen, Z. Worldwide carbon shadow prices during 1990–2011. Energy Policy 2017, 109, 288–296. [Google Scholar] [CrossRef]
- CIEL (2022) Net Zero and livestock: how farmers can reduce emissions. Centre for Innovation & Excellence in Livestock, York, UK. https://cielivestock.co.uk/wp-content/uploads/2022/02/CIEL-LR-220405.pdf.
- Ciroth, A.; Muller, S.; Weidema, B.; Lesage, P. Empirically based uncertainty factors for the pedigree matrix in ecoinvent. Int. J. Life Cycle Assess. 2016, 21, 1338–1348. [Google Scholar] [CrossRef]
- Clutter AC (2011) Genetics of performance traits. In: The genetics of the pig, 2nd edition (eds. Rothschild MF, Ruvinsky A), pp. 325-354. CABI, Wallingford, UK. ISBN 9781845937560.
- De Haas Y, Bink MCAM, Borg R, Koenen EPC, Verschuren LMG, Mollenhorst H (2021) The contribution of animal breeding to reducing the environmental impact of livestock production. Wageningen Livestock Research Report 1156, Wageningen, Netherlands. [CrossRef]
- de Vries, M.; de Boer, I. Comparing environmental impacts for livestock products: A review of life cycle assessments. Livest. Sci. 2010, 128, 1–11. [Google Scholar] [CrossRef]
- Dolphin, G (2022) World carbon pricing database. Resources for the Future, Washington DC, USA. https://www.rff.org/publications/data-tools/world-carbon-pricing-database.
- Dyllick, T.; Hockerts, K. Beyond the business case for corporate sustainability. Bus. Strategy Environ. 2002, 11, 130–141. [Google Scholar] [CrossRef]
- EC (2021) Communication from the Commission on the European Citizens' Initiative (ECI) "End the Cage Age". European Commission, Brussels, Belgium. https://ec.europa.eu/transparency/documents-register/detail?ref=C(2021)4747&lang=en.
- Ewaoluwagbemiga, E.O.; Bee, G.; Kasper, C. Genetic analysis of protein efficiency and its association with performance and meat quality traits under a protein-restricted diet. Genet. Sel. Evol. 2023, 55, 1–16. [Google Scholar] [CrossRef]
- Farrell, L.; McHugh, N.; Pabiou, T.; Bohan, A.; McDermott, K.; Shalloo, L.; Herron, J. 716. Modelling of productivity, profitability, Rotterdam, Netherlands, and greenhouse gas emissions of Irish sheep flocks divergent in genetic merit. In Proceedings of 12th World Congress on Genetics Applied to Livestock Production; pp. 2952–2955.
- Vivanco, D.F. The role of services and capital in footprint modelling. Int. J. Life Cycle Assess. 2019, 25, 280–293. [Google Scholar] [CrossRef]
- Genus (2021) Annual Report 2021. Genus plc, Basingstoke, UK. https://www.genusplc.com/media/1875/genus-plc-annual-report-2021.pdf.
- Genus (2022) Preliminary results year ended 30 June 2022. Genus plc, Basingstoke, UK. https://www.genusplc.com/media/2011/genus_fy22-full-results-final.pdf.
- Gislason, S.; Birkved, M.; Maresca, A. A systematic literature review of life cycle assessments on primary pig production: Impacts, comparisons, and mitigation areas. Sustain. Prod. Consum. 2023, 42, 44–62. [Google Scholar] [CrossRef]
- Enger, E.G.; Bonesmo, H.; Martinsen, K.; Andersen-Ranberg, I.; Olsen, D.; Grindflek, E. 17. The genetic progress has effect on greenhouse gas emission intensities from Norwegian pork production. In Proceedings of the World Congress on Genetics Applied to Livestock Production, Rotterdam, Netherlands; pp. 115–118.
- Hendrickson CT, Lave LB, Matthews HS (2006) Environmental Life Cycle Assessment of goods and services: an Input-Output approach. RFF Press, Washington DC, USA. ISBN 978-1933115246.
- Huijbregts, M.A.J.; Steinmann, Z.J.N.; Elshout, P.M.F.; Stam, G.; Verones, F.; Vieira, M.D.M.; Hollander, A.; Zijp, M.; Van Zelm, R. (2016) ReCiPe 2016 v1.1 A Harmonized Life Cycle Impact Assessment Method at Midpoint and Endpoint Level Report I: Characterization; Available online: https://www.rivm.nl/bibliotheek/rapporten/2016-0104.pdf; National Institute for Public Health and the Environment: Bilthoven, The Netherlands, 2017. [Google Scholar]
- Huijbregts, M.A.J.; Steinmann, Z.J.N.; Elshout, P.M.F.; Stam, G.; Verones, F.; Vieira, M.; Zijp, M.; Hollander, A.; van Zelm, R. ReCiPe2016: A harmonised life cycle impact assessment method at midpoint and endpoint level. Int. J. Life Cycle Assess. 2017, 22, 138–147. [Google Scholar] [CrossRef]
- Interpig (2021) 2021 pig cost of production in selected countries. AHDB, Kenilworth, UK. https://projectblue.blob.core.windows.net/media/Default/Pork/Pork%20MI%20files/CostPigProduction2021_221117_WEB.pdf.
- ISO (2006a) ISO 14040: environmental management life cycle assessment: principles and framework. International Organization for Standardization, Geneva, Switzerland. https://www.iso.org/obp/ui/en/#iso:std:iso:14040:ed-2:v1:en.
- ISO (2006b) ISO 14044: environmental management life cycle assessment: requirements and guidelines. International Organization for Standardization, Geneva, Switzerland. https://www.iso.org/obp/ui/en/#iso:std:iso:14044:ed-1:v1:en.
- Kasper C (2021) Genetic basis of protein efficiency in pigs. Visite étudiantes AgroCampus Ouest à Agroscope-Agridea, Posieux, Switzerland. http://tinyurl.com/355k58fk.
- Knap PW (2012) Pig breeding for increased sustainability. In: Encyclopedia of sustainability science and technology, 1st edition (ed. Meyers RA), volume 11, pp. 7972-8012. Springer Science+Business Media LLC, New York NY, USA. ISBN 978-0387894690.
- Knap PW (2014) Pig breeding goals in competitive markets. 10th WCGALP, Vancouver, Canada; 007. http://www.wcgalp.org/proceedings/2014/pig-breeding-goals-competitive-markets.
- Knap PW, Olson KM, Cleveland MA (2023) Breeding livestock for sustainable systems. Abstracts of 74th annual meeting of the European Federation of Animal Science, Lyon, France; p. 157. https://members.eaap.org/wp-content/uploads/2023/theater/S02T06.pdf.
- Lamnatou, C.; Ezcurra-Ciaurriz, X.; Chemisana, D.; Plà-Aragonés, L. Life Cycle Assessment (LCA) of a food-production system in Spain: Iberian ham based on an extensive system. Sci. Total. Environ. 2022, 808, 151900. [Google Scholar] [CrossRef]
- Legarra, A.; Christensen, O.F.; Aguilar, I.; Misztal, I. Single Step, a general approach for genomic selection. Livest. Sci. 2014, 166, 54–65. [Google Scholar] [CrossRef]
- Liu, D.; Parmiggiani, A.; Psota, E.; Fitzgerald, R.; Norton, T. Where's your head at? Detecting the orientation and position of pigs with rotated bounding boxes. Comput. Electron. Agric. 2023, 212. [Google Scholar] [CrossRef]
- MacLeod M, Leinonen I, Wall E, Houdijk J, Eory V, Burns J, Ahmadi BV, Gómez-Barbero M (2019) Impact of animal breeding on GHG emissions and farm economics. Publications Office of the European Union, Luxembourg, report EUR-29844-EN. [CrossRef]
- McAuliffe, G.A.; Chapman, D.V.; Sage, C.L. A thematic review of life cycle assessment (LCA) applied to pig production. Environ. Impact Assess. Rev. 2016, 56, 12–22. [Google Scholar] [CrossRef]
- McClelland, S.; Arndt, C.; Gordon, D.; Thoma, G. Type and number of environmental impact categories used in livestock life cycle assessment: A systematic review. Livest. Sci. 2018, 209, 39–45. [Google Scholar] [CrossRef]
- Beltran, A.M.; Prado, V.; Vivanco, D.F.; Henriksson, P.J.G.; Guinée, J.B.; Heijungs, R. Quantified Uncertainties in Comparative Life Cycle Assessment: What Can Be Concluded? Environ. Sci. Technol. 2018, 52, 2152–2161. [Google Scholar] [CrossRef] [PubMed]
- MetaFarms (2021) Production analysis summary for, U.S. pork industry: 2017-2021. National Pork Board, Des Moines IO, USA. https://porkcheckoff.org/wp-content/uploads/2022/05/MetaFarms-2021-Production-Analysis-for-NPB.pdf.
- Monteiro, A.N.T.R.; Brossard, L.; Gilbert, H.; Dourmad, J.-Y. Environmental Impacts and Their Association With Performance and Excretion Traits in Growing Pigs. Front. Veter- Sci. 2021, 8. [Google Scholar] [CrossRef]
- Myhre, G.; Shindell, D.; Bréon, F.-M.; Collins, W.; Fuglestvedt, J.; Huang, J.; Koch, D.; Lamarque, J.-F.; Lee, D.; Mendoza, B.; et al. Anthropogenic and Natural Radiative Forcing. In Climate Change 2013: The Physical Science Basis. Contribution of Working Group I to the Fifth Assessment Report of the Intergovernmental Panel on Climate Change; Stocker, T.F., Qin, D., Plattner, G.-K., Tignor, M., Allen, S.K., Boschung, J., Nauels, A., Xia, Y., Bex, V., Midgley, P.M., Eds.; Cambridge University Press: Cambridge, UK; New York, NY, USA, 2013; pp. 659–740. [Google Scholar]
- Neethirajan, S.; Kemp, B. Digital Phenotyping in Livestock Farming. Animals 2021, 11, 2009. [Google Scholar] [CrossRef]
- One Health Commission (2021) World health through collaboration. https://www.onehealthcommission.org.
- Ottosen M (2021) Integrating Life Cycle Assessment with genetic selection to reduce the environmental impacts of pig production. PhD thesis, Newcastle University, UK. http://theses.ncl.ac.uk/jspui/handle/10443/5514.
- Silva, J.P.; Giehl, C.J.; Cardinal, K.M.; Andretta, I.; Ribeiro, A.M.L. Different life cycle assessment methods and causes of variation in estimates of global warming in chicken and pork production systems: A critical systematic review. Livest. Sci. 2023, 276. [Google Scholar] [CrossRef]
- Pexas, G.; Kyriazakis, I. Hotspots and bottlenecks for the enhancement of the environmental sustainability of pig systems, with emphasis on European pig systems. Porc. Heal. Manag. 2023, 9, 1–23. [Google Scholar] [CrossRef] [PubMed]
- PigCHAMP (2023) Benchmarking summaries. PigCHAMP, Ames IO, USA. https://www.pigchamp.com/benchmarking/benchmarking-summaries.
- PIC (2021) PIC nutrition and feeding guidelines. Pig Improvement Company, Hendersonville TN, USA. www.pic.com/resources/pic-nutrition-and-feeding-guidelines-metric.
- Proudfoot, C.; McFarlane, G.; Whitelaw, B.; Lillico, S. Livestock breeding for the 21st century: the promise of the editing revolution. Front. Agric. Sci. Eng. 2020, 7, 129–135. [Google Scholar] [CrossRef]
- Reckmann, K.; Krieter, J. Environmental impacts of the pork supply chain with regard to farm performance. J. Agric. Sci. 2014, 153, 411–421. [Google Scholar] [CrossRef]
- Reisinger, A.; Clark, H.; Cowie, A.L.; Emmet-Booth, J.; Fischer, C.G.; Herrero, M.; Howden, M.; Leahy, S. How necessary and feasible are reductions of methane emissions from livestock to support stringent temperature goals? Philos. Trans. R. Soc. A: Math. Phys. Eng. Sci. 2021, 379, 20200452. [Google Scholar] [CrossRef]
- Rougoor C, Elfrink E, Lap T, Balkema A (2015) LCA of Dutch pork: assessment of three pork production systems in the Netherlands. CLM Onderzoek en Advies, Culemborg, Netherlands. https://www.clm.nl/wp-content/uploads/2021/09/glamur-wp3-dutch-pork.pdf.
- Ruckli, A.K.; Dippel, S.; Durec, N.; Gebska, M.; Guy, J.; Helmerichs, J.; Leeb, C.; Vermeer, H.; Hörtenhuber, S. Environmental Sustainability Assessment of Pig Farms in Selected European Countries: Combining LCA and Key Performance Indicators for Biodiversity Assessment. Sustainability 2021, 13, 11230. [Google Scholar] [CrossRef]
- Saintilan R, Mérour I, Brossard L, Tribout T, Dourmad JY, Sellier P, Bidanel J, Van Milgen J, Gilbert H (2013) Genetics of residual feed intake in growing pigs: relationships with production traits, and nitrogen and phosphorus excretion traits. Journal of Animal Science 91:2542-2554. [CrossRef]
- Sandefur HN, Burek J, Matlock M, Thoma G, Boles EC (2015) Development of Life Cycle Inventory data for U.S. swine production scenarios: dataset documentation and user’s guide version 2. Center for Agricultural and Rural Sustainability, University of Arkansas, Little Rock AR, USA. https://tinyurl.com/mrycpdyk.
- Savian, M.; Simon, C.d.P.; Holden, N.M. Evaluating environmental, economic, and social aspects of an intensive pig production farm in the south of Brazil: a case study. Int. J. Life Cycle Assess. 2023, 28, 1544–1560. [Google Scholar] [CrossRef]
- Schneeberger, M.; Barwick, S.A.; Crow, G.H.; Hammond, K. Economic indices using breeding values predicted by BLUP. J. Anim. Breed. Genet. 1992, 109, 180–187. [Google Scholar] [CrossRef]
- Searle, S.R. The matrix Handling of BLUE and BLUP in the mixed linear model. Linear Algebra its Appl. 1997, 264, 291–311. [Google Scholar] [CrossRef]
- Shirali, M.; Doeschl-Wilson, A.; Knap, P.; Duthie, C.; Kanis, E.; van Arendonk, J.; Roehe, R. Nitrogen excretion at different stages of growth and its association with production traits in growing pigs1. J. Anim. Sci. 2012, 90, 1756–1765. [Google Scholar] [CrossRef] [PubMed]
- Shurson, G.C.; E O Pelton, R.; Yang, Z.; E Urriola, P.; Schmitt, J. Environmental impacts of eco-nutrition swine feeding programs in spatially explicit geographic regions of the United States. J. Anim. Sci. 2022, 100. [Google Scholar] [CrossRef] [PubMed]
- Soleimani, T.; Gilbert, H. Evaluating environmental impacts of selection for residual feed intake in pigs. Animal 2020, 14, 2598–2608. [Google Scholar] [CrossRef] [PubMed]
- Soleimani, T.; Gilbert, H. An approach to achieve overall farm feed efficiency in pig production: environmental evaluation through individual life cycle assessment. Int. J. Life Cycle Assess. 2021, 26, 455–469. [Google Scholar] [CrossRef]
- Tallentire, C.W.; Edwards, S.A.; Van Limbergen, T.; Kyriazakis, I. The challenge of incorporating animal welfare in a social life cycle assessment model of European chicken production. Int. J. Life Cycle Assess. 2019, 24, 1093–1104. [Google Scholar] [CrossRef]
- Thoma GJ (2023) Environmental sustainability evaluation of PIC genetics vs. industry average: North America. Resilience Services pllc, Denver CO, USA. https://tinyurl.com/wtrczjm7.
- Tripodi, P.; Nicastro, N.; Pane, C. Digital applications and artificial intelligence in agriculture toward next-generation plant phenotyping. Crop. Pasture Sci. 2022, 74, 597–614. [Google Scholar] [CrossRef]
- UNEP (2009) Guidelines for social life cycle assessment of products. United Nations Environment Programme, Paris, France. https://www.unep.org/resources/report/guidelines-social-life-cycle-assessment-products.
- van der Peet-Schwering, C.; Jongbloed, A.; Aarnink, A. Nitrogen and phosphorus consumption, utilisation and losses in pig production: The Netherlands. Livest. Prod. Sci. 1999, 58, 213–224. [Google Scholar] [CrossRef]
- van der Werf, H.M.G.; Knudsen, M.T.; Cederberg, C. Towards better representation of organic agriculture in life cycle assessment. Nat. Sustain. 2020, 3, 419–425. [Google Scholar] [CrossRef]
- Van Middelaar CE, Van Zanten HHE, De Boer IJM (2019) Future of animal nutrition: the role of life cycle assessment. In: Poultry and pig nutrition: challenges of the 21st century (eds. Hendriks WH, Verstegen MWA, Babinszky L), pp 307-314. WAP, Wageningen, Netherlands. https://www.wageningenacademic.com/doi/pdf/10.3920/978-90-8686-884-1_14.
- Van Paassen M, Braconi N, Kuling L, Durlinger B, Gual P (2019a) Agri-Footprint 5.0 part 1: methodology and basic principles. Blonk Consultants, Gouda, Netherlands. https://tinyurl.com/47h4a6zc.
- Van Paassen M, Braconi N, Kuling L, Durlinger B, Gual P (2019b) Agri-Footprint 5.0 part 2: description of data. Blonk Consultants, Gouda, Netherlands. https://tinyurl.com/y76cssry.
- Watson K, Wiedemann S, Biggs L, McGahan E (2018) Trends in environmental impacts from the pork industry. Integrity Ag and Environment, Highfields QLD, Australia. https://australianpork.com.au/sites/default/files/2021-07/2017-2212.pdf.
- Weidema BP, Bauer C, Hischier R, Mutel C, Nemecek T, Reinhard J, Vadenbo CO, Wernet G (2013) Overview and methodology: data quality guideline for the ecoinvent database version 3. Ecoinvent Report 1(v3), The Ecoinvent Centre, St. Gallen, Switzerland. https://tinyurl.com/5bhe48ak.
- Wernet, G.; Bauer, C.; Steubing, B.; Reinhard, J.; Moreno-Ruiz, E.; Weidema, B. The ecoinvent database version 3 (part I): overview and methodology. Int. J. Life Cycle Assess. 2016, 21, 1218–1230. [Google Scholar] [CrossRef]
- Yang, P.; Yu, M.; Ma, X.; Deng, D. Carbon Footprint of the Pork Product Chain and Recent Advancements in Mitigation Strategies. Foods 2023, 12, 4203. [Google Scholar] [CrossRef] [PubMed]
- Zira S (2023) Towards sustainable livestock systems: developing and applying methods for broad sustainability assessment of pig and cattle systems. PhD thesis, Swedish University of Agricultural Sciences, Uppsala. https://pub.epsilon.slu.se/28531/1/zira-s-20220824.pdf.
- Zira, S.; Röös, E.; Ivarsson, E.; Friman, J.; Møller, H.; Samsonstuen, S.; Olsen, H.; Rydhmer, L. An assessment of scenarios for future pig production using a One Health approach. Livest. Sci. 2022, 260, 104929. [Google Scholar] [CrossRef]

| PIC-USA internal benchmark |
North American prominent industry benchmark |
|
|---|---|---|
| Sow performance | ||
| Number of sows | 1,093,952 | 1,273,698 |
| Farrowing rate (%) | 85.7 ± 4.12 | 91.6 ± 4.74 |
| Total number born | 15.2 ± 0.68 | 15.1 ± 0.62 |
| Number born alive | 13.7 ± 0.62 | 13.7 ± 0.53 |
| Lactation mortality rate (%) | 15.8 ± 3.69 | 16.2 ± 2.63 |
| Weaning age (days) | 21.4 ± 2.01 | 21.0 ± 1.42 |
| Number weaned | 11.6 ± 0.59 | 11.5 ± 0.62 |
| PWMFY1 | 26.5 ± 4.17 | 27.0 ± 1.99 |
| Sow mortality rate (%) | 15.0 ± 4.70 | 14.1 ± 3.69 |
| Wean-to-finish performance | ||
| Number of pigs | 4,741,133 | 9,134,940 |
| Start weight (kg) | 5.98 ± 0.59 | 5.53 ± 0.39 |
| End weight (kg) | 129.0 ± 5.31 | 129.1 ± 2.09 |
| Days on feed | 158.7 ± 14.7 | 167.1 ± 5.15 |
| Growth rate (kg/d) | 0.77 ± 0.060 | 0.74 ± 0.023 |
| Feed intake (kg/d) | 1.96 ± 0.15 | 1.94 ± 0.11 |
| Feed conversion ratio | 2.55 ± 0.17 | 2.63 ± 0.12 |
| Mortality rate (%) | 6.30 ± 4.40 | 9.88 ± 3.48 |
| 1 PWMFY: piglets weaned per mated female per year | ||
| Species | Location | Annual reductiondue to genetics | Source | Comments | |||
| kg CO2eq per animal | % ofbase level | ||||||
| Sheep | Ireland | 0.12 % | Farrell et al. (2022)Berry et al. (2022) | Correlated GHG reduction due to selection for breeding goals that do not include feed intake or feed efficiency (the traits with the strongest connection to GHG). | |||
| Pigs | Netherlands | 1.26 | 0.7 % | De Haas et al. (2021) | 2014 and 2016 cohorts grown on an experimental farm with unchanged housing and nutrition. The 2016 cohort showed a 1.2 to 1.5 % lower GHG emission, at a base level of 180 kg CO2eq (22-120 kg liveweight). | ||
| Pigs | Norway | 2.61 - 3.54 | 1.4 - 1.9 % | Bonesmo & Gjerlaug-Enger (2021)Gjerlaug-Enger et al. (2022) | Correlated GHG reduction due to realized genetic change in feed efficiency, postweaning mortality and sow reproductive output (2021), at a base level of 186 kg CO2eq (80 kg carcass weight). | ||
| Pigs | North Americaand Europe | 2.93 | Knap et al. (2023) | Realized genetic change in (re)production traits (2012-2023) was converted to a change in whole-enterprise FCR, and from there to a change in GHG emission. GHG base level unknown. | |||
| Pigs | Western world | 2.4 | 1.2 % | Overall trend | |||
Disclaimer/Publisher’s Note: The statements, opinions and data contained in all publications are solely those of the individual author(s) and contributor(s) and not of MDPI and/or the editor(s). MDPI and/or the editor(s) disclaim responsibility for any injury to people or property resulting from any ideas, methods, instructions or products referred to in the content. |
© 2024 by the authors. Licensee MDPI, Basel, Switzerland. This article is an open access article distributed under the terms and conditions of the Creative Commons Attribution (CC BY) license (http://creativecommons.org/licenses/by/4.0/).


