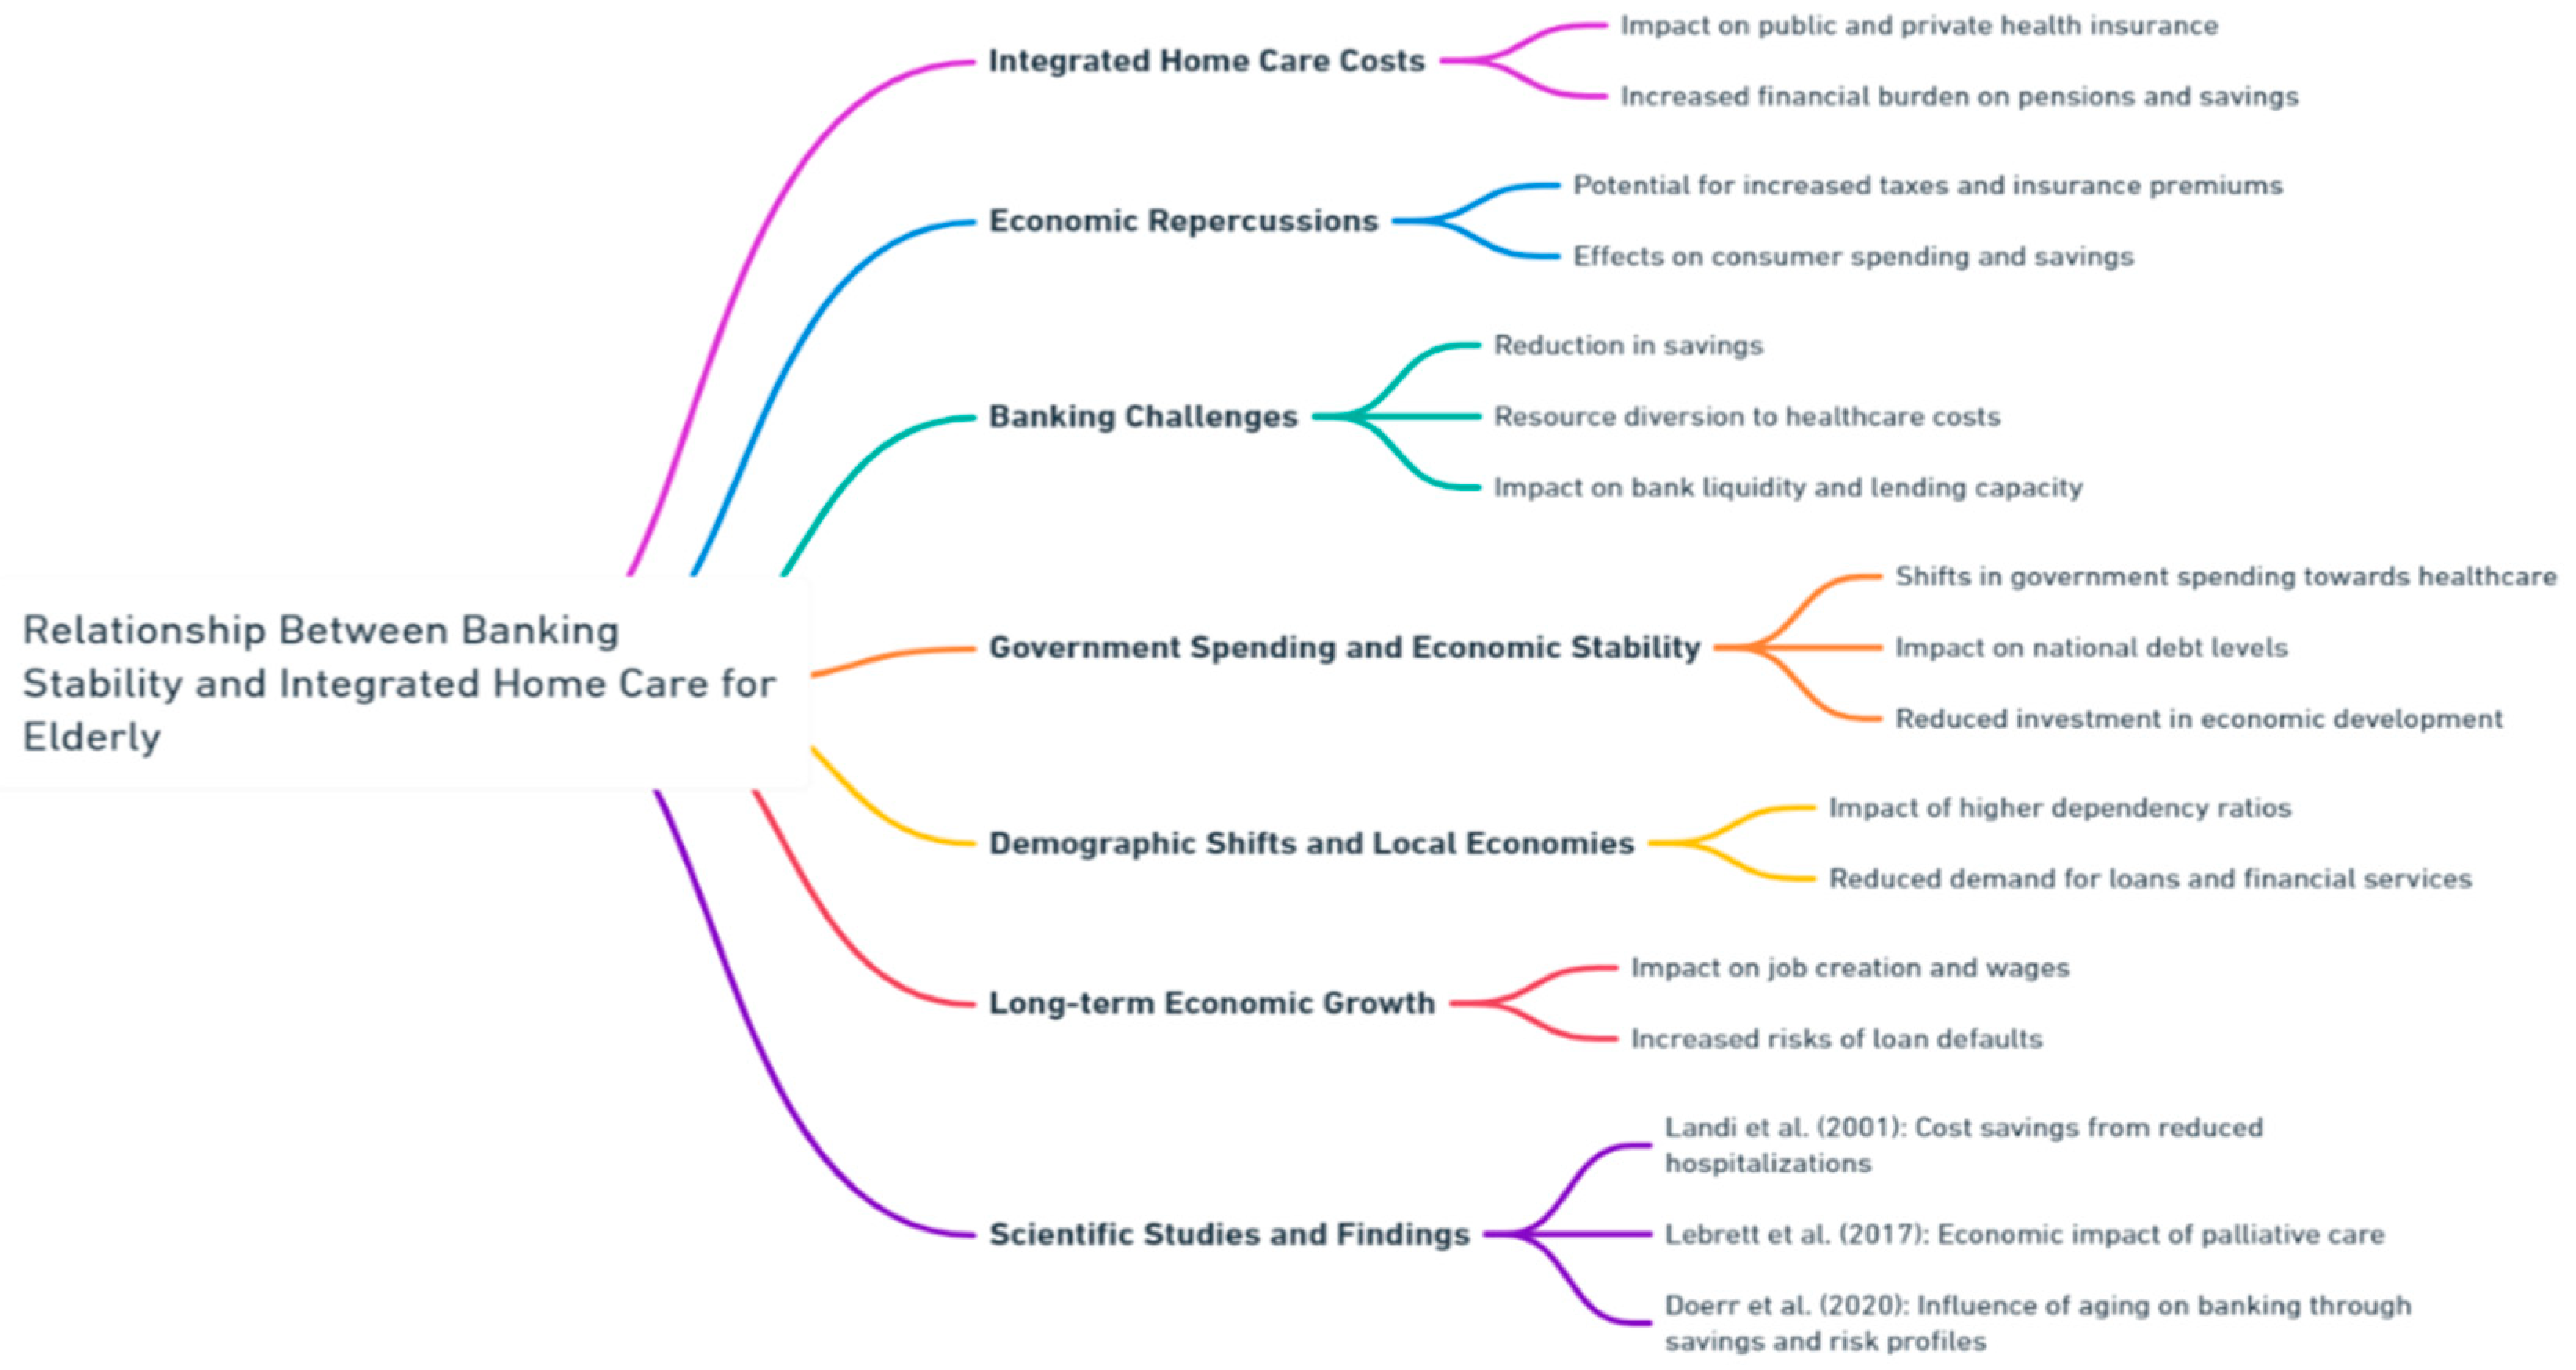
1. Introduction
In recent years, ESG issues have gained significant importance in the scientific debate. This is because the three pillars encompass a significant variety of problems that can represent both threats and opportunities for SME growth. Therefore, a company aiming to enhance its ability to manage various types of external shocks (economic, geopolitical, energy-related, climatic) more effectively, benefit from quicker and less costly access to bank credit, and devise successful strategies focusing not only on short-term but also medium to long-term horizons, cannot overlook ESG issues anymore. With reference to the management of crises of various natures, the Forum for Sustainable Finance (2023) coined the term "policrisis." Through interviews with 450 managers of Italian companies operating in four macro-sectors (such as manufacturing, construction, logistics, and agri-food), it concluded that this concept is assuming increasingly significant importance in the awareness of Italian entrepreneurs. Indeed, 48% of the interviewed SMEs have heard of policrisis. Nevertheless, two different interpretations of the phenomenon emerge: while for 19% it represents only a problem, 73% also see opportunities for the future (which even surpass risks for 14%). The succession of such diverse types of crises, according to 84% of the surveyed companies, has caused an increase in the cost of raw materials and energy across all sectors. Effects of lesser severity are instead perceived in the losses associated with environmental disasters, rising temperatures, and the contraction of export flows. More than 50% of the companies also perceive the different crises as generators of opportunities. Primarily, they have spurred the development of new products and the implementation of new projects focused on the value of sustainability. Mergers and acquisitions as responses to crises are also considered beneficial, as reactions to the various crises, as well as the exploration of new markets (according to 43% and 51% of the surveyed companies, respectively). Among the benefits of adopting sustainability elements in business operations are cost reduction (29%), the strengthening of competitive capacity in markets (26%), and facilitated taxation along with new financing tools available to companies (22%).These perceived benefits of integrating sustainability as a central element of crisis management strategies highlight that the availability of a much more structured bank-enterprise relationship, based on principles of greater transparency, and the construction of networks facilitating communication between those in need of financial resources and those who can provide them, are moving towards reducing financial constraints that slow down the growth paths of SMEs.
The introduction of ESG factors has drastically changed the concept of sustainability, giving it a multidimensional nature. Alongside the economic-financial dimension, the three corresponding dimensions of the ESG pillars must necessarily be considered. The E (Environmental) pillar encompasses a variety of issues related to climate change and carbon emissions, air and water pollution, biodiversity reduction, deforestation, energy inefficiencies, waste management, and water scarcity. The S (Social) profile primarily concerns the relationships between the company and its stakeholders: customer satisfaction, compliance with privacy and data protection regulations, consideration of minorities, including gender, employee inclusion, elimination of disparities in treatment among different groups, relations with the local community and territory, and respect for human rights. The G (Governance) pillar serves as a link between the social aspects and the environmental impacts of the company; only a company with effective governance will be able to achieve environmental and social sustainability goals. To assess the adequacy of corporate governance structures, it is necessary to analyze the composition and skills of the board of directors and control bodies, anti-corruption and anti-fraud regulations, remuneration of strategic executives, any lobbying activities, and whistleblowing policies.
In light of these considerations, the present study aims to address two research questions:
-
1.
How has the introduction of ESG factors contributed to the scientific debate on the evolution of the concept of corporate sustainability?
-
2.
What kind of relationship exists between non-performing loans and ESG factors?
To assess the state of the art in the application of the multidimensional concept of sustainability among Italian companies, a three-step approach will be followed. The first step involves a literature review aimed at identifying the distinctive features that define an ESG sustainable company. This will highlight the impacts of sustainability on production processes, human capital management, energy transition, governance, and the strategic choices adopted, along with their related business models. The second step involves an empirical analysis aimed at estimating various econometric models to assess how non-performing loans vary within the context of the ESG model. The third step concludes.
2. The Evolution of the Concept of Sustainability: From Economic Sustainability to ESG Sustainability
In recent years, there has been a proliferation of studies seeking to quantify and identify the repercussions associated with the integration of ESG factors into business models. The focus is primarily on SMEs and startups, as 99% of wealth creation opportunities stem from these categories both globally and in the European context (EC 2022). The concept of sustainability becomes the focal point of strategies that companies must adopt to strengthen their competitive capacity in the market over the long term. For this reason, in reference to the strategic choices of the company, we talk about sustainable strategies. Among the benefits attributable to the application of operational models focused on sustainability are easier access to credit, greater capacity for internationalization, availability of qualified human resources, and the establishment of partnership networks with stakeholders representing local needs.
In addition, sustainability is no longer solely conceived by companies in financial terms; rather, considering the other ESG dimensions enhances the competitive value of the company in relation to the sustainable development goals of the Agenda 2030. This would allow companies to play a more active role in building more homogeneous and cohesive paths of local growth.
In the economic-business context, companies that focus on ESG factors are labeled as "sustainable corporations." These companies have a triple focus: Profit, Planet, People (Elkington 1997). A distinguishing feature of an ESG company compared to others is that it does not view financial sustainability as separate from social, environmental, and governance issues.
These introductory considerations support the idea that aspects such as ESG sustainability and social responsibility represent the response of consumers, SMEs, and policymakers to the threat of irresponsible behavior from multinational corporations and large enterprises. These behaviors have been fueled by the progressive financialization of capitalist systems (Zanda 2012). Faced with exogenous economic shocks such as the financial crisis of 2007-2011, the Covid-19 pandemic, and the impact on energy prices due to the invasion of Ukraine by Russia, the opinion has solidified that the resilience of an economic system of a territory is increasingly conditioned by the company's ability to create and maintain an operating mode aimed at generating wealth for all stakeholders, including the territory itself.
Business sustainability becomes a crucial element of a company's resilience, and likewise, for the environment in which they are situated.
The centrality of ESG factors in the scientific (and not only) debate has fostered the evolution of the concept of sustainability itself: from exclusively economic-financial sustainability, typical of the 1970s, to a sustainability "in general," characterized by a limiting overlap with the environmental dimension and by a sole consideration of the macroeconomic dimension of sustainable development alongside the microeconomic dimension of individual companies. Several studies have highlighted how the application of ESG factors in corporate production processes significantly enhances the company's value, leading to better financial outcomes more easily (Fatemi et al. 2017, Harrison and Wicks 2013, Friede et al. 2015). Devalle et al. (2017) demonstrate that ESG factors are increasingly indispensable elements for achieving sustainability, not only financial but especially as a distinctive element of management capable of creating value beyond economic and financial realms.
Among the benefits of such synergistic corporate behavior are increased efficiency in production processes, both in terms of costs and speed, improved reputation, and a stronger competitive advantage (Henisz et al. 2019). These are micro objectives encompassed within two more significant goals: greater social sustainability, namely, building a climate of trust with the company's stakeholders and local stakeholders, and environmental sustainability related to low-impact green investments.
Corporate sustainability in recent years has become the result of a process that combines the economy of management with the dimension of collective economy or macroeconomicity (economic, social, and environmental sustainability). This has increasingly led companies to adopt integrated corporate management policies. However, these policies may not yield the desired results if not contextualized within an adequate regulatory framework. In the presence of a deficient regulatory system, companies may implement marketing initiatives and public relations efforts that increase the risk of greenwashing. For this reason, the effectiveness of sustainability as a multidimensional concept requires companies to adopt a systemic perspective, namely, a business sustainability where the economic dimension does not conflict with the environmental, social, and governance dimensions (Borgonovi et al. 2017).
The three ESG dimensions, although referring to different areas, are deeply interconnected within the theoretical framework of social responsibility. Therefore, to analyze the evolution of the concept of corporate sustainability, one cannot ignore the study of the relationships between the latter and social responsibility.
The majority of authors agree that sustainability and social responsibility encompass all those voluntarily conducted activities by companies aimed at integrating environmental and social goals into their business. This correlation between two key aspects of corporate conduct is labeled in literature with the term "Triple-Bottom Line" (Del Baldo 2015, Ashrafi et al. 2020).
Ashrafi et al. (2020) identified the following elements as trade unions for all possible definitions of corporate social responsibility (CSR): voluntary nature, social and environmental dimension, and attention to meeting the goals of overall stakeholders. In this direction, the European Commission (2001) defined corporate social responsibility as a voluntary process of integrating companies' commercial objectives with a particular focus on social and environmental impacts.
Ebner and Baumgartnet (2006) conducted a literature review of a sample of 55 articles published in the previous eight years and concluded that CSR could be considered under three alternative dimensions. Some researchers focus mainly on the social dimension derived from that of sustainability. According to other authors, CSR could be considered as the microeconomic level of the broader concept of sustainable development. According to yet other authors, CSR should be understood as synonymous with sustainability. This latter interpretation is reached by Sarvaiya and Wu (2014) who interviewed senior managers of eleven New Zealand companies between 2011 and 2012.
The correlation between CSR (Corporate Social Responsibility) and the implementation of sustainable actions by companies has increasingly captured the attention of scholars since the 2008 financial crisis. These authors have sought to outline a more precise profile of an "irresponsible company" (Gallino 2005, Jaquillat 2009). Especially in recent years, sustainability has been used as a marketing tool for the production and sale of eco-friendly products and services (from the food sector to tourism) and for the promotion of circular economy models. Many studies have also aimed to promote more efficient social communication aimed at strengthening the reputation of companies and obtaining consent and legitimacy from stakeholders for their operations (Matacena 2009, 2005, Baldarelli 2009). Another key factor in fostering responsible corporate behavior towards sustainability is the presence of a solid regulatory framework and an adequate system of sanctions and controls on the effective and transparent application of regulations. Self-regulation by companies alone was not sufficient to promote virtuous behaviors (Belcredi and Bozzi 2022). This aims to avoid the risk that business managers, instead of pursuing sustainability goals, exclusively pursue the remuneration of risk capital (and indirectly their own capital), failing to provide adequate responses to the expressed needs of multiple internal and external stakeholders (Alford and Compagnoni 2008). Recently, some authors have contributed to advancing the scientific debate on the distinctive features of sustainable management from ESG (Environmental, Social, and Governance) perspectives, drawing on the concept of the "Triple Bottom Line." Among them, Schaltegger et al. (2012) identified a series of profitability objectives (cost and risk reduction, improved turnover and profitability margins, reputation and brand value, attractiveness of the company, and innovation capacity) to be considered as inputs for the economic-financial performance of the company, necessary for the construction of more or less integrated business models towards sustainability goals. Judici and Bonaventura (2018), considering stocks with different levels of capitalization of companies located in 17 European countries, highlight a positive correlation between ESG factors and market performance measured through various financial ratios (turnover variation, operating margin variation, leverage effect, tax effect, dividend yield). Henisz et al. (2019) also found a positive correlation between the adoption of ESG factors and companies' competitive performance in terms of increased turnover volumes and investment levels, reduced production and procurement costs, lower legal risks, and increased employee productivity. Eliwa et al. (2019), considering a sample of 6,018 companies operating in various sectors across 15 EU countries, found a negative correlation between ESG performance and the cost of debt. Svensson et al. (2016), examining a sample of 110 Norwegian companies varied by sector and size, observed a significant gap between theoretical knowledge of sustainability issues and its practical application. They observe the real difficulties managers encounter in measuring the impact of their sustainability policies. Evans et al. (2017) highlight that the sustainable value of corporate business depends on the company's ability to integrate economic, social, and environmental objectives and transfer sustainability policies into the business model. They also note the challenge of achieving a comprehensive measure of sustainability due to the complex process of harmonization through a multi-stakeholder approach involving all objectives of all parties interacting with the company. Cardoni et al. (2022) also highlight that studies on sustainability have evolved towards identifying a sustainable business that fully integrates economic and financial goals with social and environmental ones, including the community and the environment as "non-human stakeholders" among stakeholders. Lazzano (2017) also highlights companies' commitment to promoting sustainability in markets to meet all possible stakeholder needs. Hoffman (2018) identifies the following distinctive features of sustainable business: "enterprise integration" and "market transformation." Ciesielska and Iskoujina (2017) describe some virtuous business models in which companies increase their economic value while pursuing sustainability. Other authors, such as Garavan and McGuire (2010), attribute a crucial role to management as a promoter of actions capable of integrating sustainability, responsibility, and ethics into management. Eccles et al. (2014), considering a sample of 180 American companies, demonstrate that those adopting sustainability initiatives have various elements of competitive advantage, such as a responsible and sustainability-oriented board of directors, decision-making processes involving strong stakeholder engagement, a preference for long-term horizons in management processes, and better financial results. According to Kotsantonis et al. (2016), ESG companies are more easily able to establish lasting relationships with investors and are more efficient, making it easier for them to explore new markets compared to those not oriented towards sustainability. Lins et al. (2017), in a sample of 3,000 American companies, conclude that only those with high social capital have achieved better economic results.
Alongside these studies, there have been others that, while representing applications of the "Triple Bottom Line," actually place greater emphasis on environmental dimensions (Milne and Gray 2013, Hoffman 2018). In recent years, literature on ESG sustainability has followed a specific trend shifting from a "shareholder-oriented" approach to a "stakeholder-oriented" one (Arnone and Leogrande 2024).
In light of the previous considerations, many studies argue that the ESG concept is the modern idea of corporate social responsibility (Aguinis 2011; Hassel and Semenova 2013, Taliento et al. 2019). Terms such as ESG, corporate social responsibility, and ESGE, which stands for economic, governance, social, and environmental sustainability, are used interchangeably in the scientific debate.
If we were to place ESG issues within an evolutionary path of the concept of corporate social responsibility, three elements of novelty associated with the ESG concept can be identified:
- 3.
Extension of environmental and social issues to the financial sector, particularly concerning investment evaluation.
- 4.
Inclusion of governance as an indispensable prerequisite for implementing social and environmental impact policies.
- 5.
Increased focus on reporting processes to construct more reliable metrics of the results of green and social actions.
According to some authors, ESG is mistakenly used as a synonym for sustainability. This is because, in reality, sustainability represents only one of the categories that enable the realization of the E pillar and the three dimensions of ESG (Shmatov and Castelli 2023). According to other authors, the acronym ESG denotes the three pillars of corporate social responsibility (Nirino et al. 2021, Gillan et al. 2021). Still, other authors consider terms like "green financing," "responsible investing," "sustainable investing," and "ESG" to be equivalent (Sinha and Sinha 2022).
A recent survey on the level of awareness of ESG issues among Italian companies was conducted by the Forum for Sustainable Finance in 2023. Specifically, 450 interviews were conducted with micro, small, and medium-sized enterprises with at least 3 employees, distributed throughout the national territory and active in the following sectors: agri-food sector (21%); industry (34%); logistics and transportation (34%); construction (11%). The sampled companies are mainly located in the Northwest regions (31%) and Southern Italy (29%), with lower percentages in the rest of Italy (22% in the Northeast and 18% in the Center). A very interesting result that attests to the increasing commitment of Italian companies to sustainability is as follows: 56% of the companies believe that ESG issues play a very important role in strategic and investment decisions. This data indicates a significant increase compared to the 27% reported in the survey conducted three years earlier in 2020. Furthermore, another interesting aspect is that this attention to ESG issues is not a stance shared by all sectors. This evolution of corporate sustainability towards ESG sustainability has also been driven by stimuli not only from entrepreneurial choices (thus from the supply side) but also from customer demands (thus from the demand side). In this regard, 70% of the SMEs involved in the survey declare to have received specific requests: in 35% of cases from customers (especially companies active in the "business to business" sector) and, following them, from internal stakeholders (employees and management), banks, insurance companies, suppliers, and private and/or public investors. For 68% of companies, satisfying ESG sustainability is a response to regulatory obligations and market expectations, while for 86% it can become a competitive factor and therefore an opportunity for companies and crucial for mitigating significant risks also from an economic-financial perspective (for 82% of companies). In terms of time horizon, companies are mostly oriented towards medium and long-term ESG strategies (7 out of 10); in fact, over 80% believe that sustainability initiatives focused only in the short term entail excessive costs. Companies recognize several benefits associated with sustainability: cost and consumption reduction through the use of renewable energies (in 44% of cases), the possibility of accessing new markets (32%), advantages in terms of reputation (27%) and marketing and communication (26%), greater economic stability (22%), and cost reduction due to damages caused by extreme weather events (22%). Among the most perceived obstacles in promoting sustainable business models were identified: bureaucratic difficulties and concerns about higher management costs, problems in obtaining financial resources to fund projects (in 40% of cases), lack of internal skills and knowledge on ESG issues, and difficulty in projecting into the medium to long term along with the need to focus on other priorities. The main financing method for sustainable initiatives adopted by the surveyed companies is self-financing (47%), followed by bank credit and public funds (European, state, or regional). Among the enabling factors for the design and implementation of sustainability initiatives, accessing forms of tax incentives is considered the most significant aspect (90% agree quite or very much), but external consultancy for regulatory aspects (84% agree quite or very much) is also relevant, as well as for the search for new financial resources, funds, and financing (over 80% agree quite or very much), and for guidance on sustainability issues (80% agree quite or very much). Regarding the achieved results in the three individual pillars, with reference to the environmental dimension, there is a consolidation of initiatives in the field of environmental sustainability compared to the 2020 survey. The use of renewable sources has increased (85% compared to 76% in 2020), as well as the introduction of measures to reduce greenhouse gas emissions (74% compared to 61% in 2020). Furthermore, the increased frequency and intensity of extreme weather events have prompted a greater number of companies to introduce adaptation measures to limit the damage resulting from these phenomena (64% of SMEs already use them compared to 54% in 2020). Regarding the Social pillar, ensuring workplace safety (9 out of 10 companies have already taken steps to improve or plan to do so, respectively, 69% and 21%). Following this, initiatives such as dedicated listening to employees (e.g., satisfaction and well-being surveys), collaborations with schools and institutions for youth employment, initiatives aimed at the community and local area, safety-related certifications and standards, and inclusion initiatives. With regard to the Governance pillar, the aspect considered most strategic for companies is represented by relationships with stakeholders (transparent communication, ethical codes, customer satisfaction surveys). On the other hand, interventions concerning internal organization are less widespread or considered difficult to implement.
Investigating the individual ESG dimensions, concerning the environmental pillar (E), a study by AIFIRM (2021) demonstrates that environmental risks directly impact the value of companies' assets and thus their creditworthiness. Capasso et al. (2020), sampling 458 companies between 2007 and 2017, showed that the default risk is higher in the presence of higher levels of CO2 emissions per unit of product. Regarding the impact of the environmental dimension (factor E), some authors have considered green bonds. For instance, Gianfrate and Peri (2019) demonstrated that green bonds have lower spreads compared to traditional bonds, highlighting that sustainable activities benefiting from these new financial instruments falling under the so-called "green finance" are perceived as less risky from the investors' standpoint. Eichholtz et al. (2019), focusing not on companies but on real estate investment trusts, found that mortgages secured by environmentally certified properties have a lower cost compared to those secured by non-certified properties.
Referring to the social pillar (S), studies investigating the social dimension (factor S) mainly concern the relationships established by the company with its employees and also with external parties, primarily communities, territories, customers, and suppliers. According to Servaes and Tamayo (2017), companies striving to adopt socially responsible behaviors must identify that balanced allocation of their financial resources corresponding to the equality between the marginal costs and revenues associated with socially responsible investments. For example, Goss and Roberts (2011), and a few years later Cooper and Uzun (2015), focusing on American companies, demonstrated that firms with lower social responsibility incur higher borrowing costs. The relationship between corporate social responsibility and ESG risks in connection with all other financial risks is investigated by Farah et al. (2021). According to this author, such a relationship follows an inverted U-shaped pattern initially increasing (with costs outweighing benefits) and then decreasing (with costs lower than benefits). This trend highlights that the integration of ESG factors into companies' operations is a change that does not happen overnight, as otherwise, companies would face excessively high costs and be vulnerable to significant reputational risks, regulatory risks (more generally, transition risks). Barnett et al. (2012), with a sample of 3100 companies, find the same inverted U-shaped relationship considering both social and financial responsibility. This is because stakeholders can translate good social outcomes into excellent financial performance. Some studies (Attig et al., 2013; Ferriani and Natoli, 2020; Nofsinger and Varma, 2014) provide a measurement of the impact of the social factor on the creditworthiness of companies. Lodhi (2020), Sun et al. (2014) indicate that companies whose strategic choices and modus operandi are designed with consideration of possible social impacts have a lower risk of default. Dorfleitner and Gleber (2020) highlight that this relationship between corporate social responsibility and credit rating manifests with different intensities in North America, Europe, and Asia. Companies located in the first two continents benefit from a greater impact of social factors on the evaluation conducted by rating agencies, unlike Asian companies.
Regarding the third pillar, Governance, studies investigating the impacts of the "Governance" factor have followed two directions. In the first direction, Bradley et al. (2011) highlight how executive incentives favoring the adoption of responsible behaviors result in higher ratings and lower yield spreads for companies. Zhu (2014) demonstrates that companies operating internationally with good corporate governance are associated with lower costs of equity and debt capital. These positive effects on financing costs are weaker in countries with lower legal protection, poor transparency, and low government quality. In the second direction, Lins et al. (2020) find that Taiwanese companies should have good governance and adopt activities according to corporate social responsibility principles to improve their ratings. These considerations, according to the authors, are more relevant for large companies rather than small ones or those with family governance. According to Derbali et al. (2022), the quality of audit review and the possession of financial expertise by companies significantly influence the assessment of creditworthiness by financial intermediaries in the credit provision process. The presence of these factors, along with independent directors on the board, significantly reduces the cost of debt for companies.
3. Data and Methods
Data. The data set used for this article is composed of two different sources, namely the Bank of Italy, as regards the data relating to Non-Performing Loans and the ISTAT-BES database, as regards the variables of the econometric model. We considered 122 variables from the ISTAT-BES model which were divided into three macro-groups in order to capture the E-Environment, S-Social and G- Governance elements of the ESG model. By dividing the 122 variables into 3 subsets in this way, we were able to better analyze the relationships between NPL and the components of the ESG model. The data refers to the 20 Italian regions in the period between 2004-2023. The variables that we subsequently chose, based on the levels of statistical significance, are indicated in the
Table 1 below.
Methods. The methodology used for the quantitative investigation of the data is composed of three analytical structures, one of which, i.e. the econometric model, is further structured into three other parts. First of all, we carried out a static analysis of the distribution of Non-Performing Loans in the Italian regions and macro-regions between 2004 and 2023. The static analysis has the aim of understanding how the phenomenon is distributed and what are the characteristic elements of the trends . The data were also analyzed with reference to the Italian macro-regions, namely: North, Center and South. The analysis was also conducted in light of the need to identify the presence of elements capable of highlighting the presence of the North-North divide. South. Subsequently, clustering was carried out with a k-Means algorithm optimized with both the Silhouette Coefficient and the Elbow Method. We compared the two methods in order to subsequently choose, based on the knowledge base in our possession, which clustering model was most suitable for the analysis of Non- Performing Loans based on the levels of heterogeneity of the Italian regions. We then analyzed the models using econometric models. There are three econometric models used: Panel Data with Fixed Effects, Panel Data with Variable Effects, and Weighted Least Square-WLS. However, we have not proposed a single econometric equation to estimate the impact of Non-Performing Loans on the variables of the ESG model. On the contrary, we proposed three different equations, one to estimate the effects on the E-Environment variable, one to estimate the effects on the S-Social variable and one to estimate the effects on the G-Governance variable in the ESG model. We therefore estimated three different econometric equations using three different estimation models. However, having an interest in the analysis of banking stability, we have established an inverse relationship between the value of banking stability and Non-Performing loans in order to be able to interpret the data in light of banking stability.
4. Static Analysis of the Trend of Non-Performing Loans in the Italian Regions and Macro-Regions
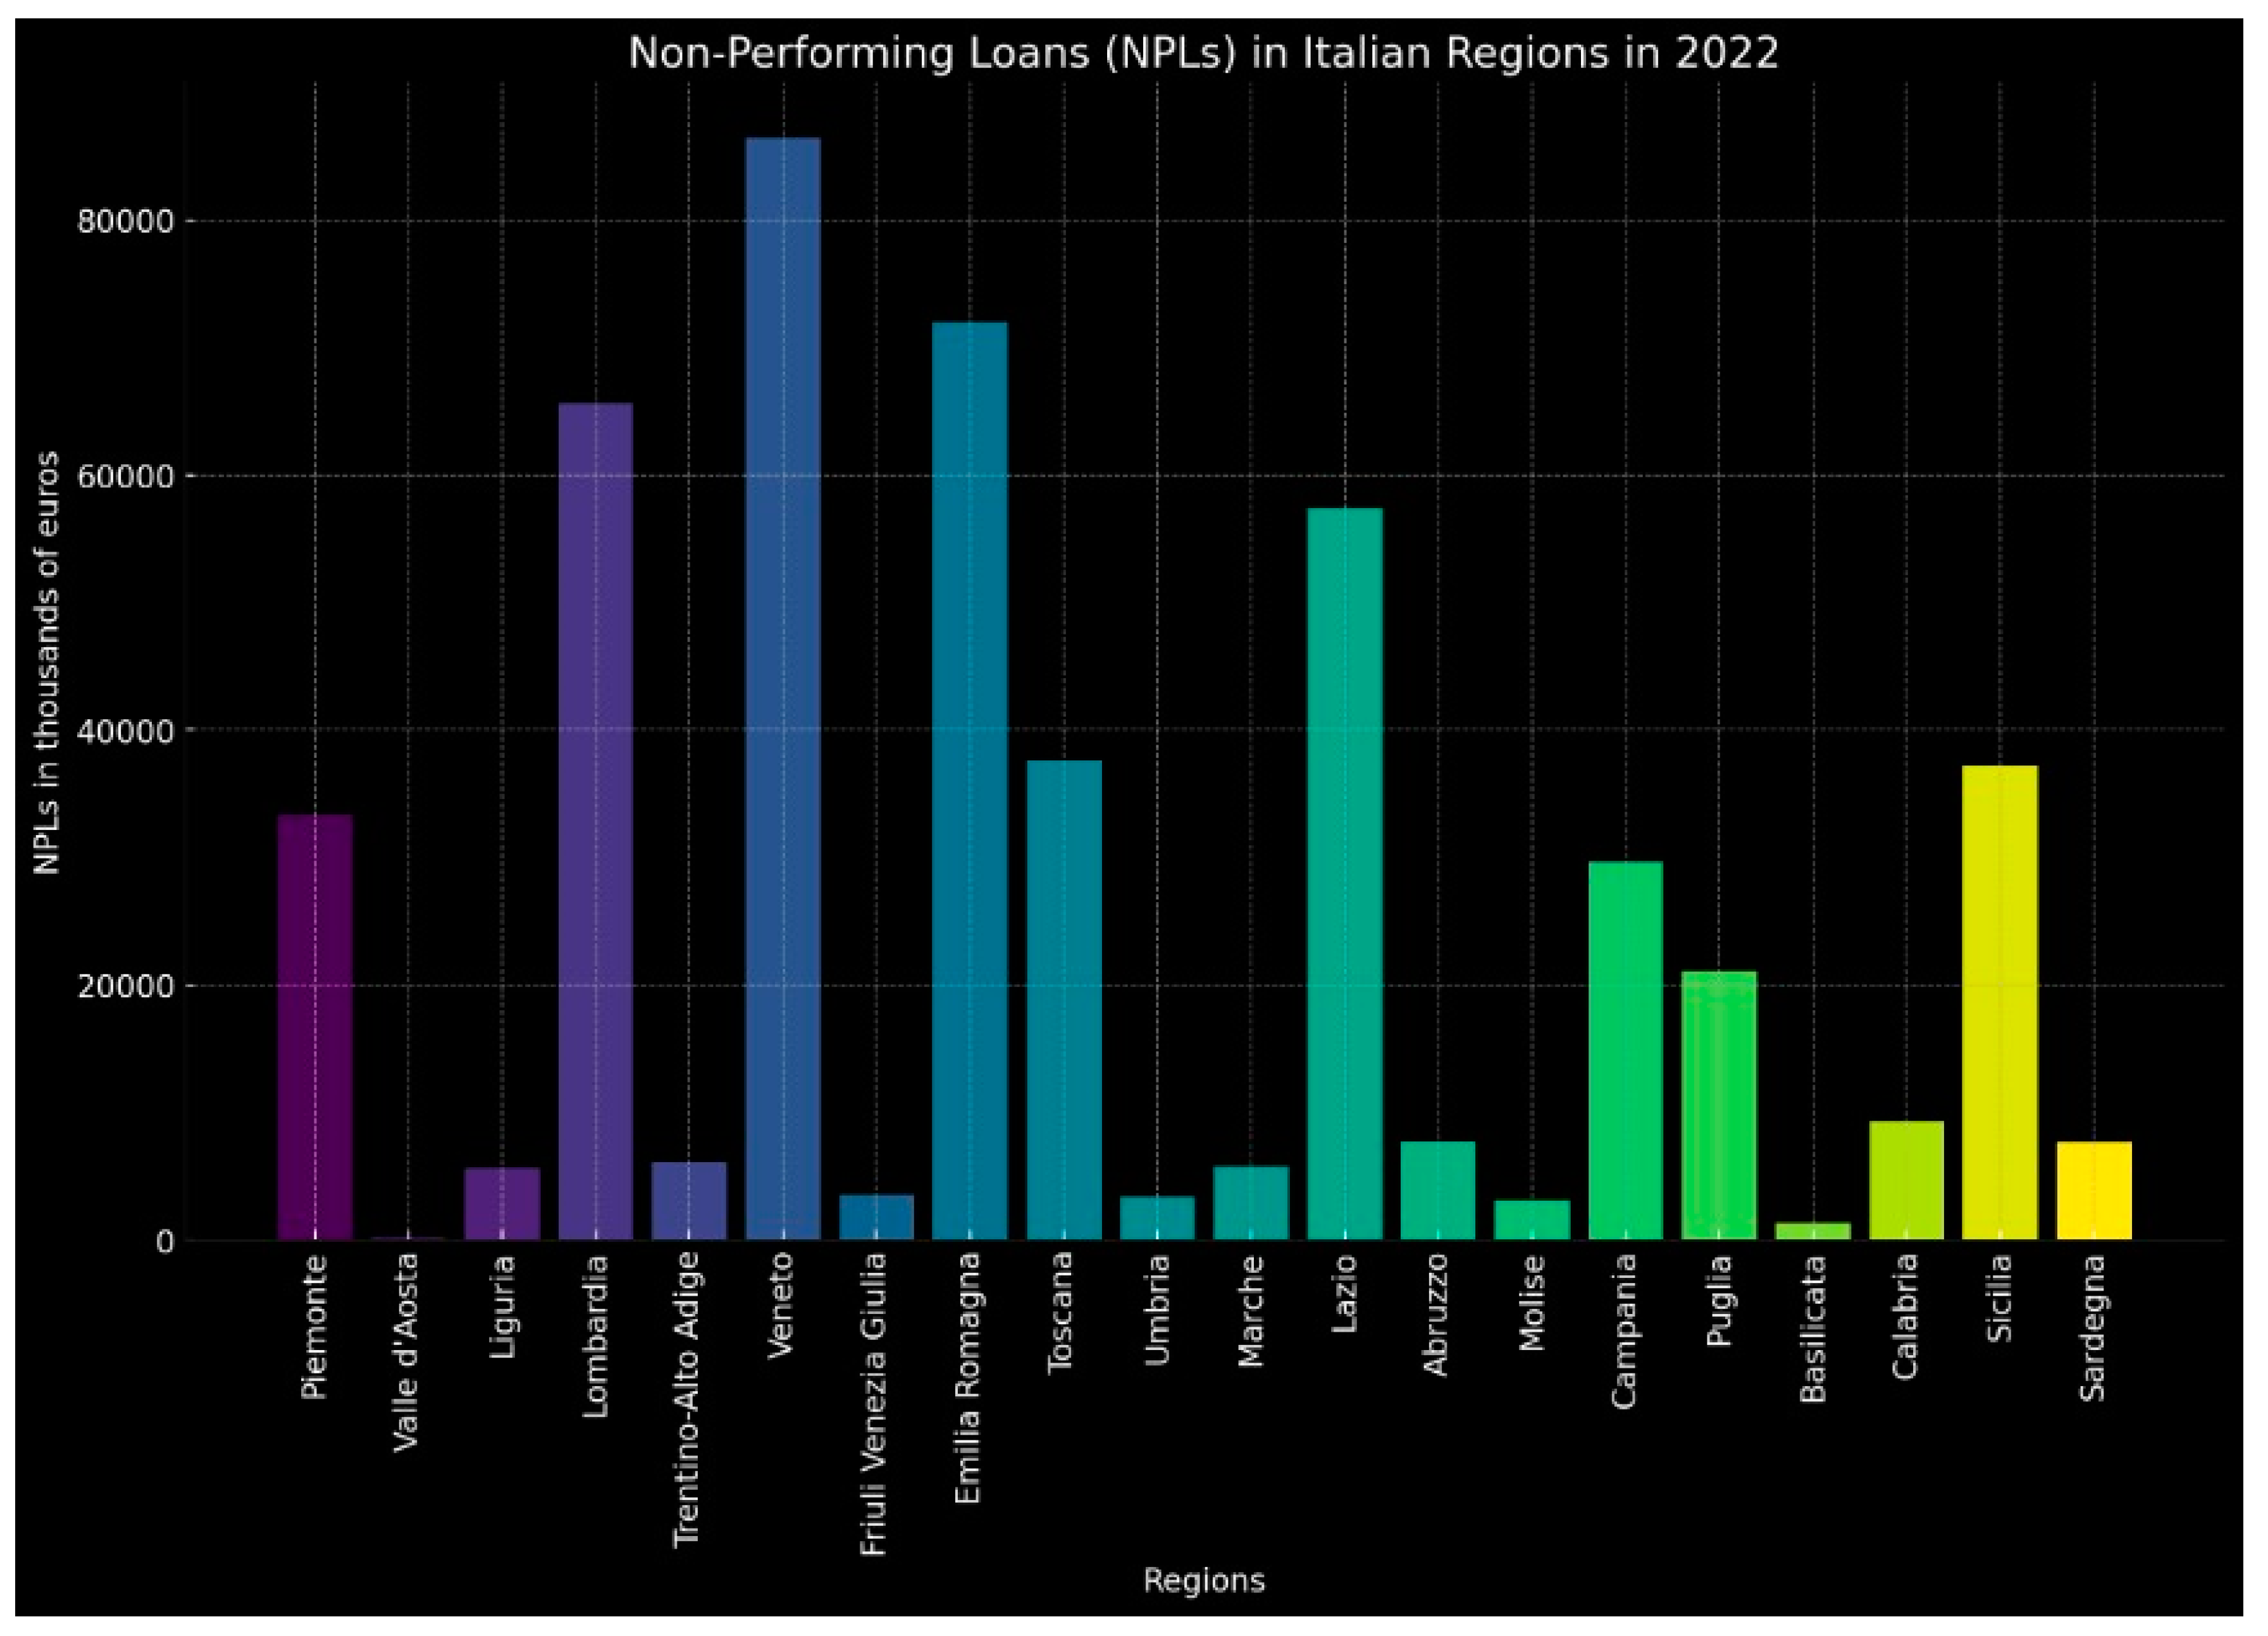
Trend of non-performing loans in the Italian regions in 2022. The data on Non-Performing Loans (NPLs) across various Italian regions for the year 2022 reveals an intricate tapestry of economic health, highlighting pronounced regional disparities that reflect both the vibrancy and the challenges within Italy’s diverse economic landscape. This analysis delves into these differences, seeking to unpack the implications behind the numbers and the potential pathways for regional economic policies. Non-Performing Loans are a critical indicator in financial analysis, signifying loans on which borrowers are late on their payments or are in breach of other terms. A high level of NPLs can indicate economic distress, affecting financial institutions' balance sheets and overall economic growth due to restricted lending capabilities and increased risk aversion among banks. The 2022 data shows a stark contrast in NPLs across Italy’s regions. Veneto, Emilia Romagna, and Lombardia, among the wealthiest and most economically active regions, report the highest NPLs—86488, 72008, and 65633 thousand euros respectively. These figures are somewhat expected given the higher economic activity levels, which correlate with a larger volume of loans. However, they also reflect underlying economic pressures even in wealthier areas, possibly exacerbated by sectors vulnerable to economic downturns, such as manufacturing and services, which dominate these regions. Conversely, regions such as Valle d'Aosta and Basilicata, with NPL figures at 187 and 1310 thousand euros respectively, showcase the other end of the spectrum. The significantly lower numbers could reflect a smaller economic base and a correspondingly lower volume of credit extended. This might seem positive at first glance but can also indicate a lack of economic dynamism. Lower levels of lending and investment can stifle growth, entrepreneurship, and development, keeping these regions economically stagnant. Furthermore, middle-tier regions like Sicilia and Campania, with NPLs at 37192 and 29625 thousand euros, respectively, highlight the challenges facing areas with medium- level economic activities. These regions, often caught between declining traditional industries and underdeveloped new sectors, show that moderate NPL levels can still underscore significant economic struggles, including high unemployment and low GDP per capita. The regional disparities in NPLs can also be seen through the lens of Italy’s broader north-south economic divide. Northern regions generally display higher economic activity and, correspondingly, higher NPLs, reflecting both the volume of financial transactions and the impact of economic downturns on larger economies. Southern regions, traditionally less economically developed, show lower NPLs but face their own unique challenges, such as lower investment levels and infrastructural deficits, which can hamper economic recovery and growth. The implications of these disparities are significant for policymakers. For regions with high NPLs, there is a critical need for strategies that can help mitigate the risk to financial institutions and support economic sectors under strain. This might include restructuring debt, enhancing support for struggling industries, and innovating new economic initiatives to diversify regional economies. For regions with low NPLs due to low economic activity, the focus should be on stimulating economic development through increased investment in infrastructure, fostering entrepreneurship, and attracting both domestic and foreign investments. Policies aimed at enhancing education and skills training can also empower the workforce, making these regions more attractive for new business sectors. Moreover, tackling the NPL challenge requires a nuanced approach that considers the unique economic compositions and needs of each region. Financial institutions play a crucial role in this, as they need to balance risk management with the need to support economic activities through lending. Effective regulation, aimed at ensuring financial stability while promoting economic growth, is key to managing the NPL issue without stifling economic potential (
Figure 1).
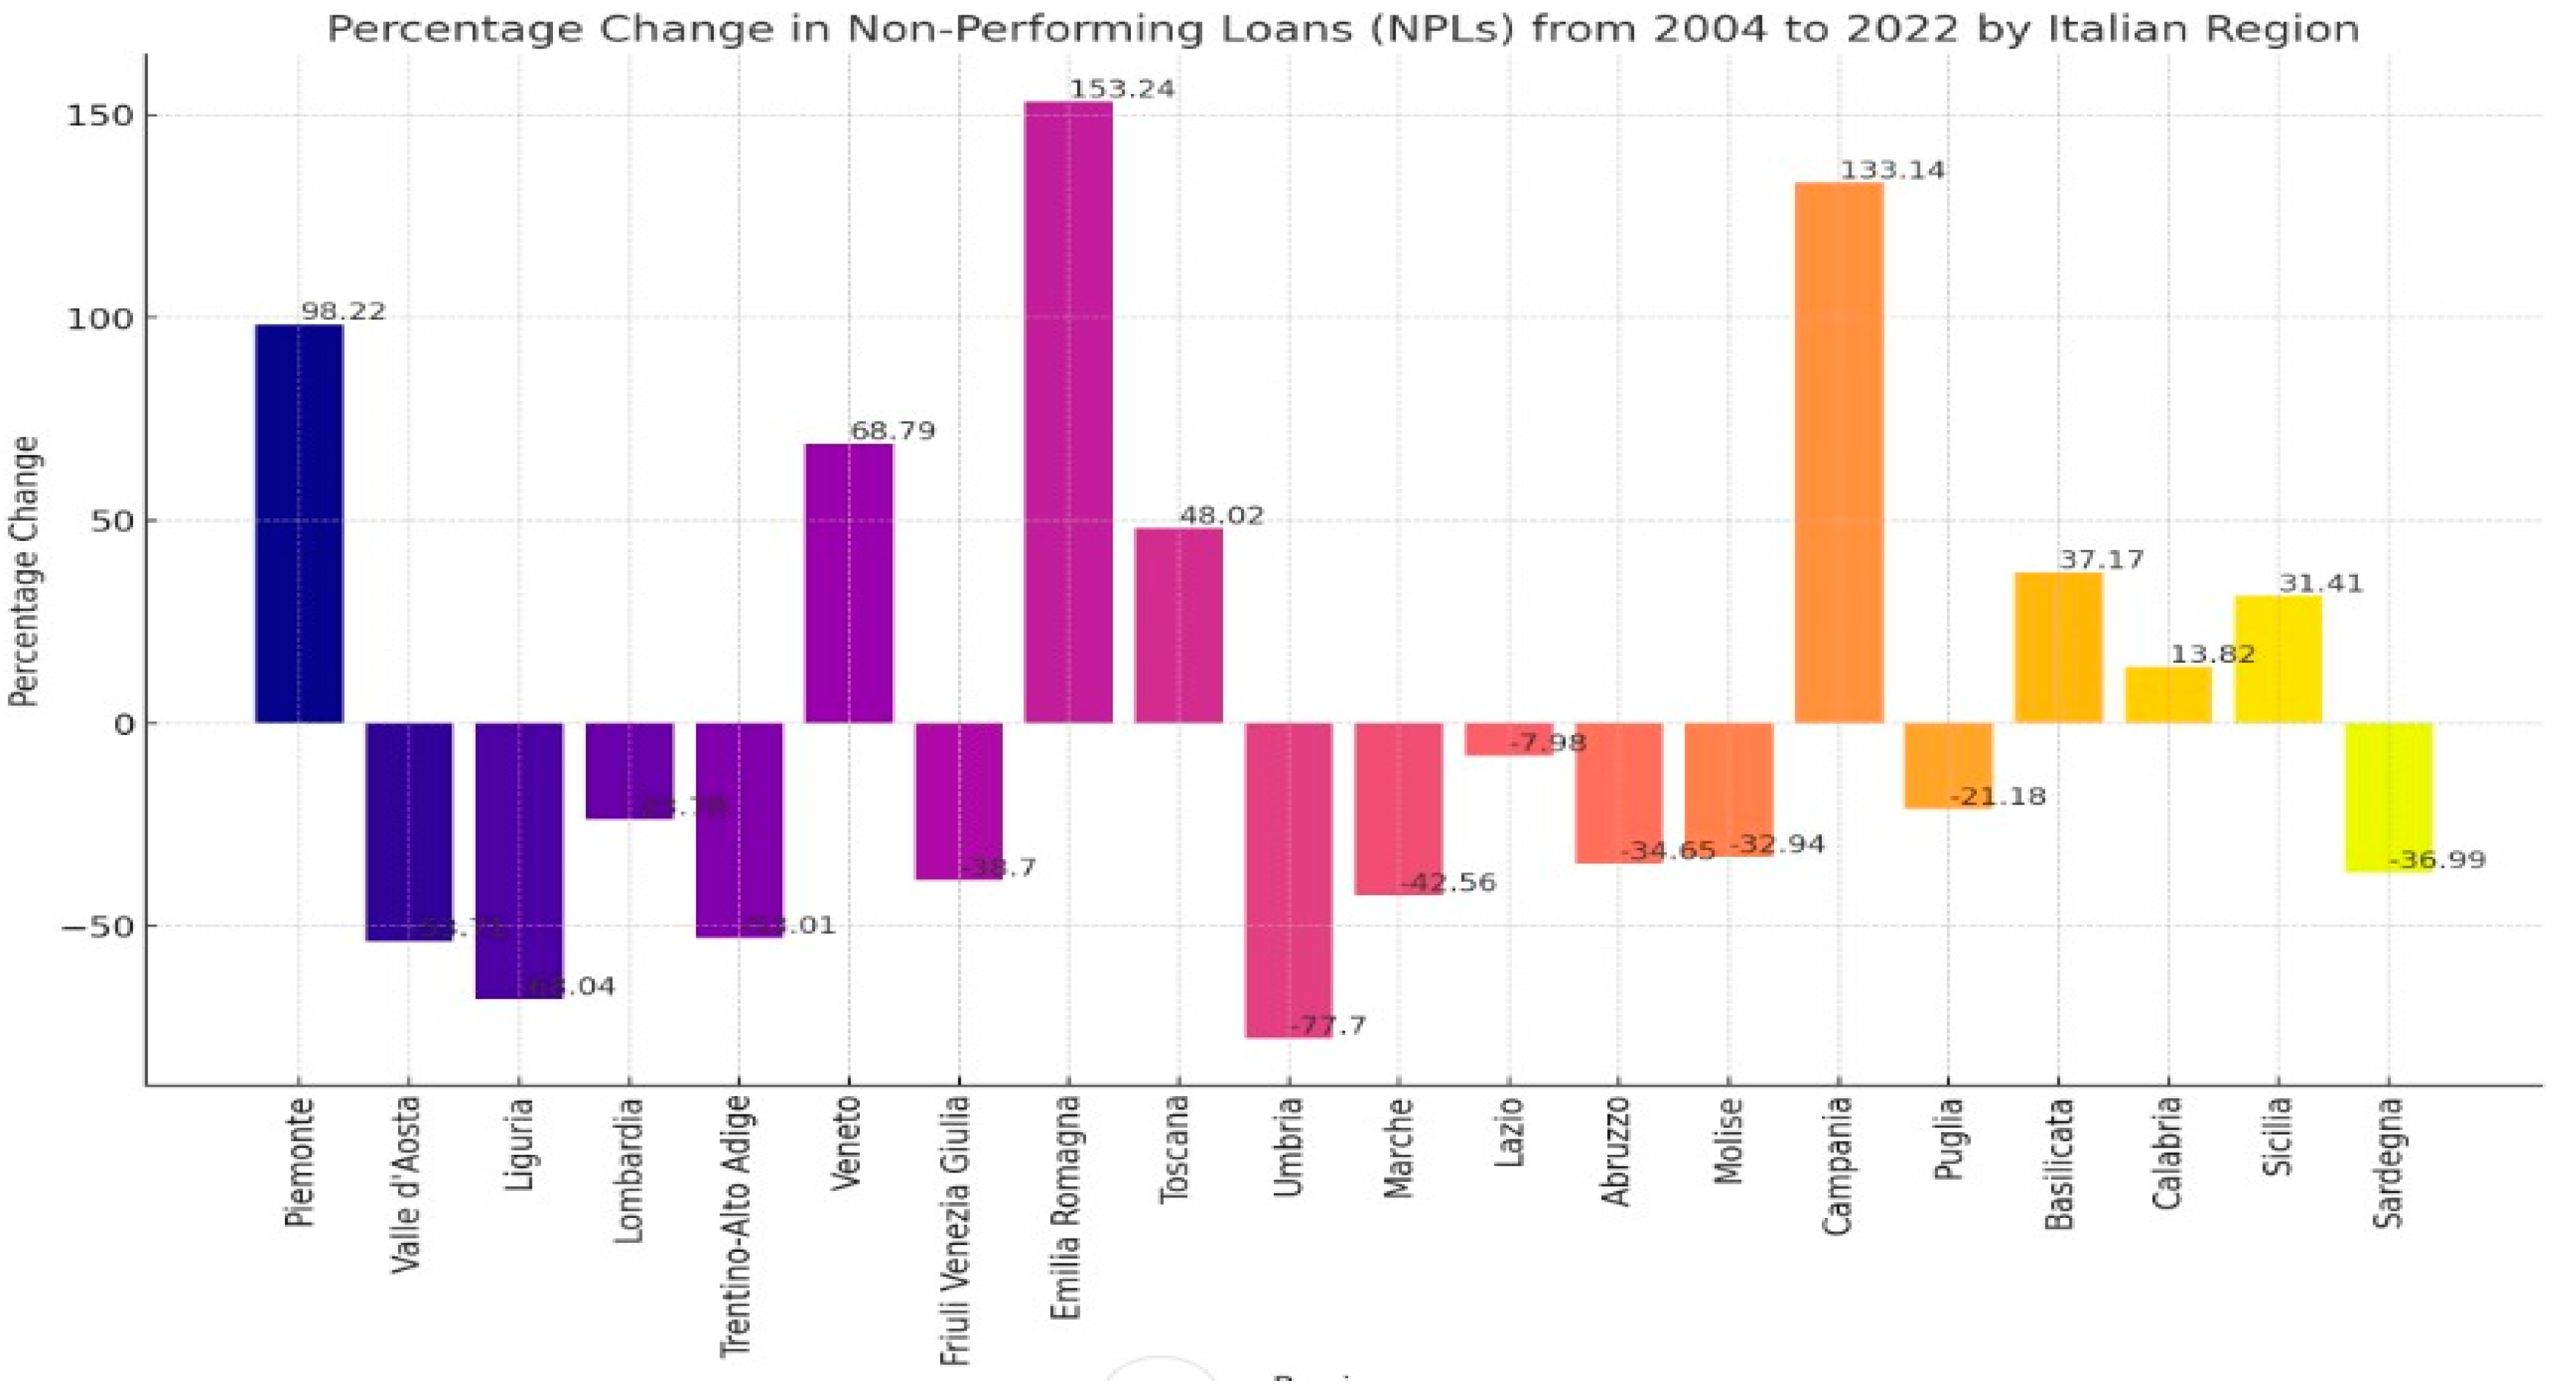
Trend of non-performing loans in the Italian regions between 2018 and 2022. The data on Non- Performing Loans (NPLs) in Italian regions for the years 2004 and 2022, along with their absolute and percentage changes, reveals significant shifts in the economic landscapes of these regions over an 18-year period. This analysis sheds light on regional financial health and trends that could inform future economic and financial policies. Starting with the overall trends, the data shows diverse trajectories in NPL changes across Italy. Veneto and Emilia Romagna stand out with substantial increases in NPLs, by 68.79% and 153.24% respectively. These increases may reflect higher economic activity levels that, while generating more wealth, also expose these regions to increased financial risk, particularly in expansive sectors like manufacturing and real estate. Conversely, regions like Valle d'Aosta, Liguria, and Umbria saw significant reductions in their NPLs, with decreases of 53.71%, 68.04%, and 77.70% respectively. The sharp decline in Umbria is particularly notable, possibly indicating effective financial management or recovery strategies post-economic downturns. However, it's essential to consider that such decreases might also reflect a contracting regional economy where fewer loans are issued overall. In terms of absolute changes, Piemonte and Campania witnessed large increases in their NPLs by 16507 and 16918 thousand euros, signaling heightened financial distress. This could be attributed to various factors, including industrial decline, insufficient economic diversification, or broader economic downturns impacting these regions more heavily. On the other end of the spectrum, regions like Lombardia and Friuli Venezia Giulia experienced significant drops in their NPLs by 20477 and 2226 thousand euros respectively. For Lombardia, despite this decrease, it remains one of the regions with the highest volume of NPLs, which aligns with its status as an economic powerhouse, harbouring a vast amount of Italy's business activities. A deeper look into smaller regions such as Basilicata and Calabria reveals an increase in NPLs, albeit at a more moderate scale. These increases may reflect emerging economic challenges or potentially an increase in lending activities, offering a mixed signal of economic dynamism coupled with increased financial risk. The analysis of percentage changes further illuminates regional dynamics. Dramatic increases in NPL percentages in Emilia Romagna and Veneto contrast starkly with significant reductions in regions like Umbria and Trentino-Alto Adige. This variance could be influenced by regional economic policies, sectoral compositions, and local economic conditions that either buffer against or exacerbate financial vulnerabilities. The nuanced landscape of NPL evolution in Italy points to the need for region-specific financial strategies. For regions with increasing NPLs, particularly where these changes outpace economic growth, targeted interventions to support debt restructuring, enhance financial oversight, and stimulate economic diversification could be vital. Conversely, regions with decreasing NPLs must not become complacent but should strengthen economic foundations to sustain these improvements (
Figure 2).
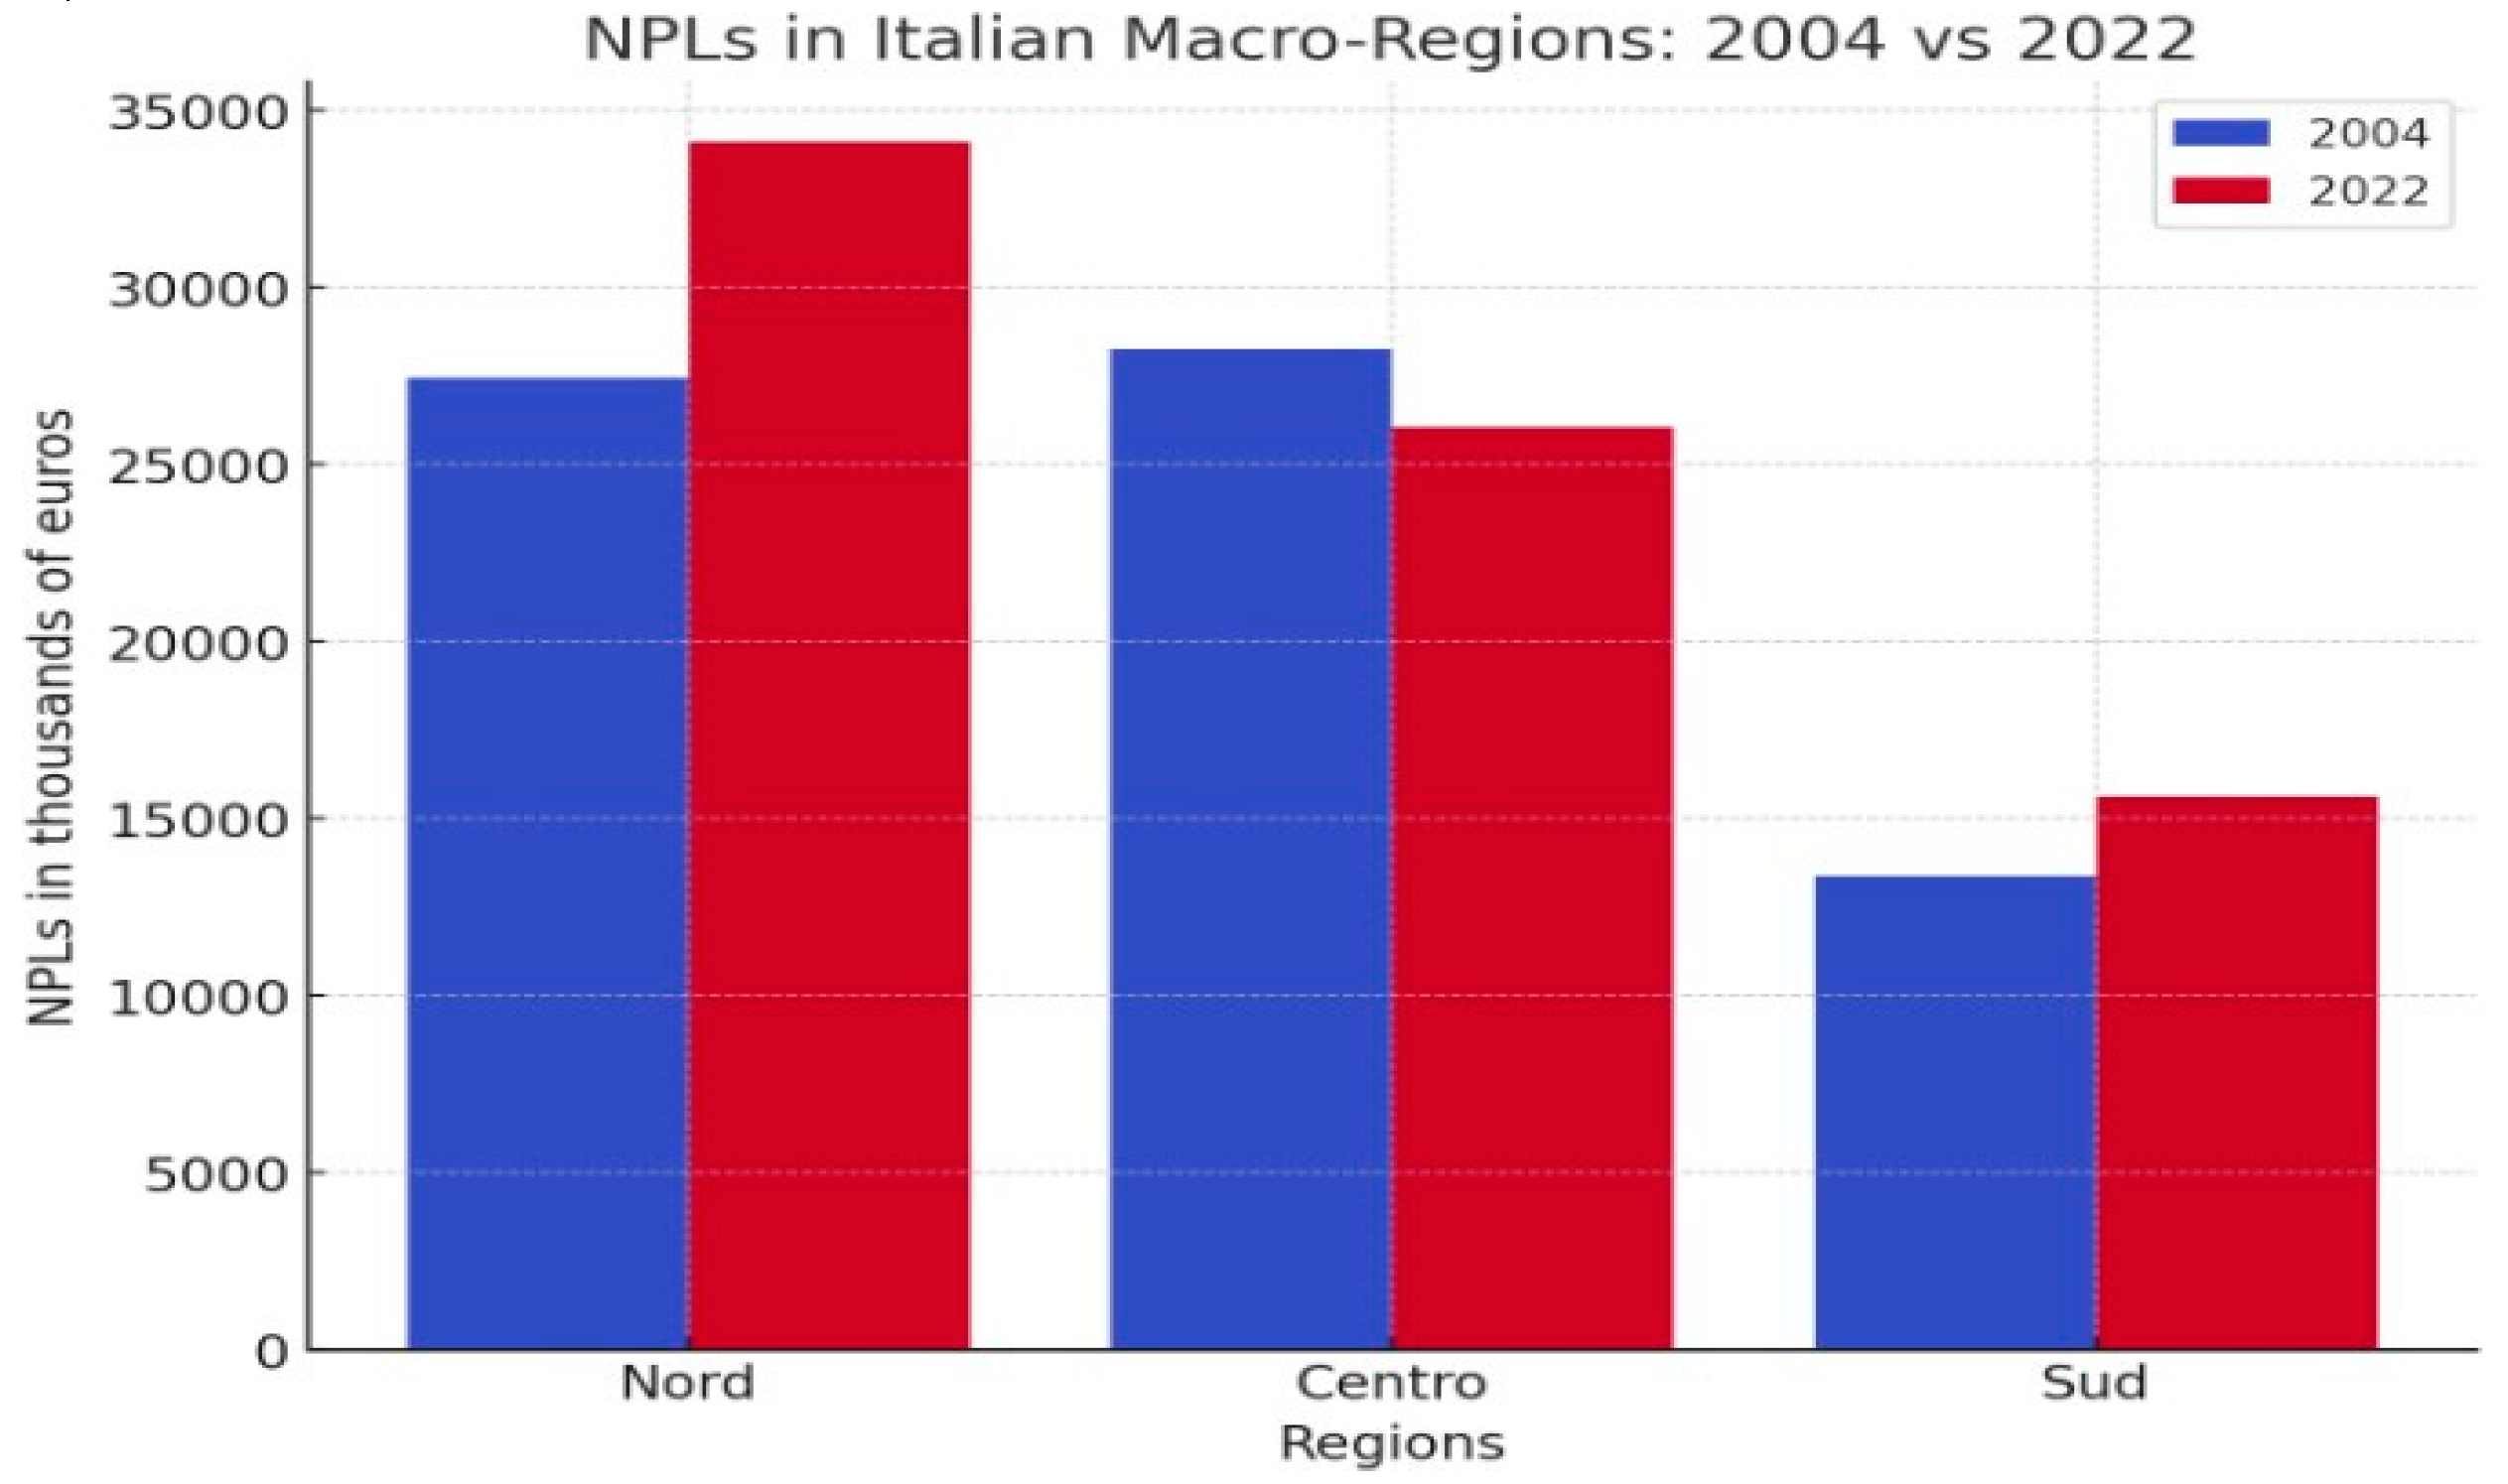
Trend of non-performing loans in the Italian macro-regions between 2018 and 2022. The data relating to the macro-regions were obtained by averaging the respective regions. The analysis of Non- Performing Loans (NPLs) data for Italian macro-regions (Nord, Centro, and Sud) from 2004 to 2022 provides a snapshot of regional financial dynamics and their evolution. This data underscores broader economic trends and regional disparities within Italy. Starting with the Northern region, which encompasses Italy's most economically developed areas, there is a noted increase in NPLs from 27,436.38 thousand euros in 2004 to 34,115.75 thousand euros in 2022. This translates to a 24.34% rise. The increase in NPLs in this region could be attributed to its high density of industrial and financial activities. The economic slowdowns, possibly due to global financial crises or local recessions, might have exacerbated the NPL rates, reflecting the higher financial risks associated with bustling economic centers. Conversely, the Central Italian region shows a decrease in NPLs by 7.86%, moving from 28,267.00 thousand euros in 2004 to 26,046.25 thousand euros in 2022. This reduction may indicate more robust economic conditions or effective credit management strategies implemented by financial institutions in the region. It might also suggest that economic growth in the Centro region has been stable, with better risk management practices in place compared to other regions. In the Southern region there is an evident increase in NPLs by 16.61%, rising from 13,388.00 thousand euros in 2004 to 15,611.57 thousand euros in 2022. This region traditionally faces economic challenges, including lower levels of industrial activity and higher unemployment rates, which likely contribute to the higher incidence of non-performing loans. The increase in NPLs here might reflect persistent socio-economic challenges, such as lower income levels, higher unemployment, and less access to financial services, which exacerbate loan repayment issues. This divergent trend across the regions not only highlights the varying economic conditions but also points to the impact of regional policies, economic diversification, and the financial health of businesses and consumers across Italy. For instance, while the Northern and Southern macro-regions saw increases in NPLs, the factors driving these increases are likely different, rooted in regional economic structures and financial ecosystems. The increase in the Northern region may stem from economic saturation and high exposure to financial risks, while the rise in Southern region could be due to chronic economic underdevelopment and associated financial instability. For policymakers and financial institutions, understanding these dynamics is crucial. In the Northern region, there may be a need to reinforce financial risk assessments and introduce more stringent credit controls to manage the growing NPLs effectively. Meanwhile, in the Southern region, strategies to stimulate economic growth, improve employment rates, and enhance financial literacy could help mitigate the risk of NPLs. For the Central region, maintaining current risk management practices could be key to sustaining its relatively healthier financial state (
Figure 3).
North-South divide. The data on Non-Performing Loans (NPLs) in Italian macro-regions suggests a North-South divide, with distinct trends and implications for each region's economic health and banking sector. Northern Italy shows an increase in NPLs from 2004 to 2022. This increase might reflect the larger volume of loans due to the higher economic activity in this region. The rise in NPLs could also indicate exposure to financial risks associated with economic downturns that impact businesses and consumers in this densely populated and industrially diverse region. However, the overall increase is relatively moderate at 24.34%, which suggests that while there has been an increase in financial distress, it is within a manageable scope given the region's economic size. Central Italy shows a decrease in NPLs, with a reduction of 7.86%. This could be indicative of stronger economic conditions or perhaps more conservative lending practices and better risk management in the banking sector. The decline in NPLs is a positive sign, showing potentially healthier economic activity or effective financial remediation efforts within the region. Southern Italy shows an increase in NPLs by 16.61%. This is a significant concern as it reflects ongoing economic struggles. The rise in NPLs in the South could indicate persistent financial instability, weaker economic growth, and the continuing struggle of businesses and households to meet loan obligations. These patterns highlight the economic disparities between the North and South of Italy, with the North showing a more robust economic structure capable of managing higher levels of debt, albeit with an increase in NPLs. In contrast, the South shows signs of deeper financial distress as reflected by the rise in NPLs, underscoring the need for targeted economic and financial policies to address these regional disparities. The North-South divide in terms of NPLs is emblematic of broader economic inequalities across Italy, necessitating nuanced approaches to economic development and financial management tailored to the unique needs and challenges of each region.
5. Clusterization with K-Means Algorithms Confronting Silhouette Coefficient and Elbow Method
In the following paragraph, we present a clustering with a k-Means algorithm comparing the results obtained through two different methods, namely the Elbow method and the Silhouette coefficient. Comparing and contrasting clusterization using the k-Means algorithm optimized with the Silhouette Coefficient and with the Elbow Method provides valuable insights into the effectiveness of these techniques in determining the optimal number of clusters for a given dataset. The k-Means algorithm is a widely used unsupervised learning algorithm for partitioning a dataset into k clusters. However, one of its main challenges lies in determining the optimal number of clusters, which is crucial for the quality of the clustering results. This is where optimization techniques such as the Silhouette Coefficient and the Elbow Method come into play. The Silhouette Coefficient measures how well each data point fits into its assigned cluster, taking into account both cohesion within clusters and separation between clusters. By iterating over different values of k and selecting the value that maximizes the average Silhouette Coefficient across all data points, we can optimize the k-Means algorithm for the given dataset. On the other hand, the Elbow Method focuses on the within-cluster sum of squares (WCSS), plotting it against the number of clusters and identifying the "elbow" point where the rate of decrease in WCSS slows down significantly. This heuristic helps in determining the optimal number of clusters by balancing the trade-off between the number of clusters and the compactness of each cluster. Comparing these two optimization techniques allows us to gain a deeper understanding of their strengths and limitations. The Silhouette Coefficient offers a more nuanced assessment of clustering quality by considering both cohesion and separation, making it suitable for datasets where clusters may have irregular shapes or varying densities. In contrast, the Elbow Method provides a simple and intuitive heuristic for determining the optimal number of clusters based on the compactness of clusters alone. While the Silhouette Coefficient focuses on the quality of clustering, the Elbow Method primarily considers the quantity of clusters, highlighting the trade-off between complexity and interpretability.
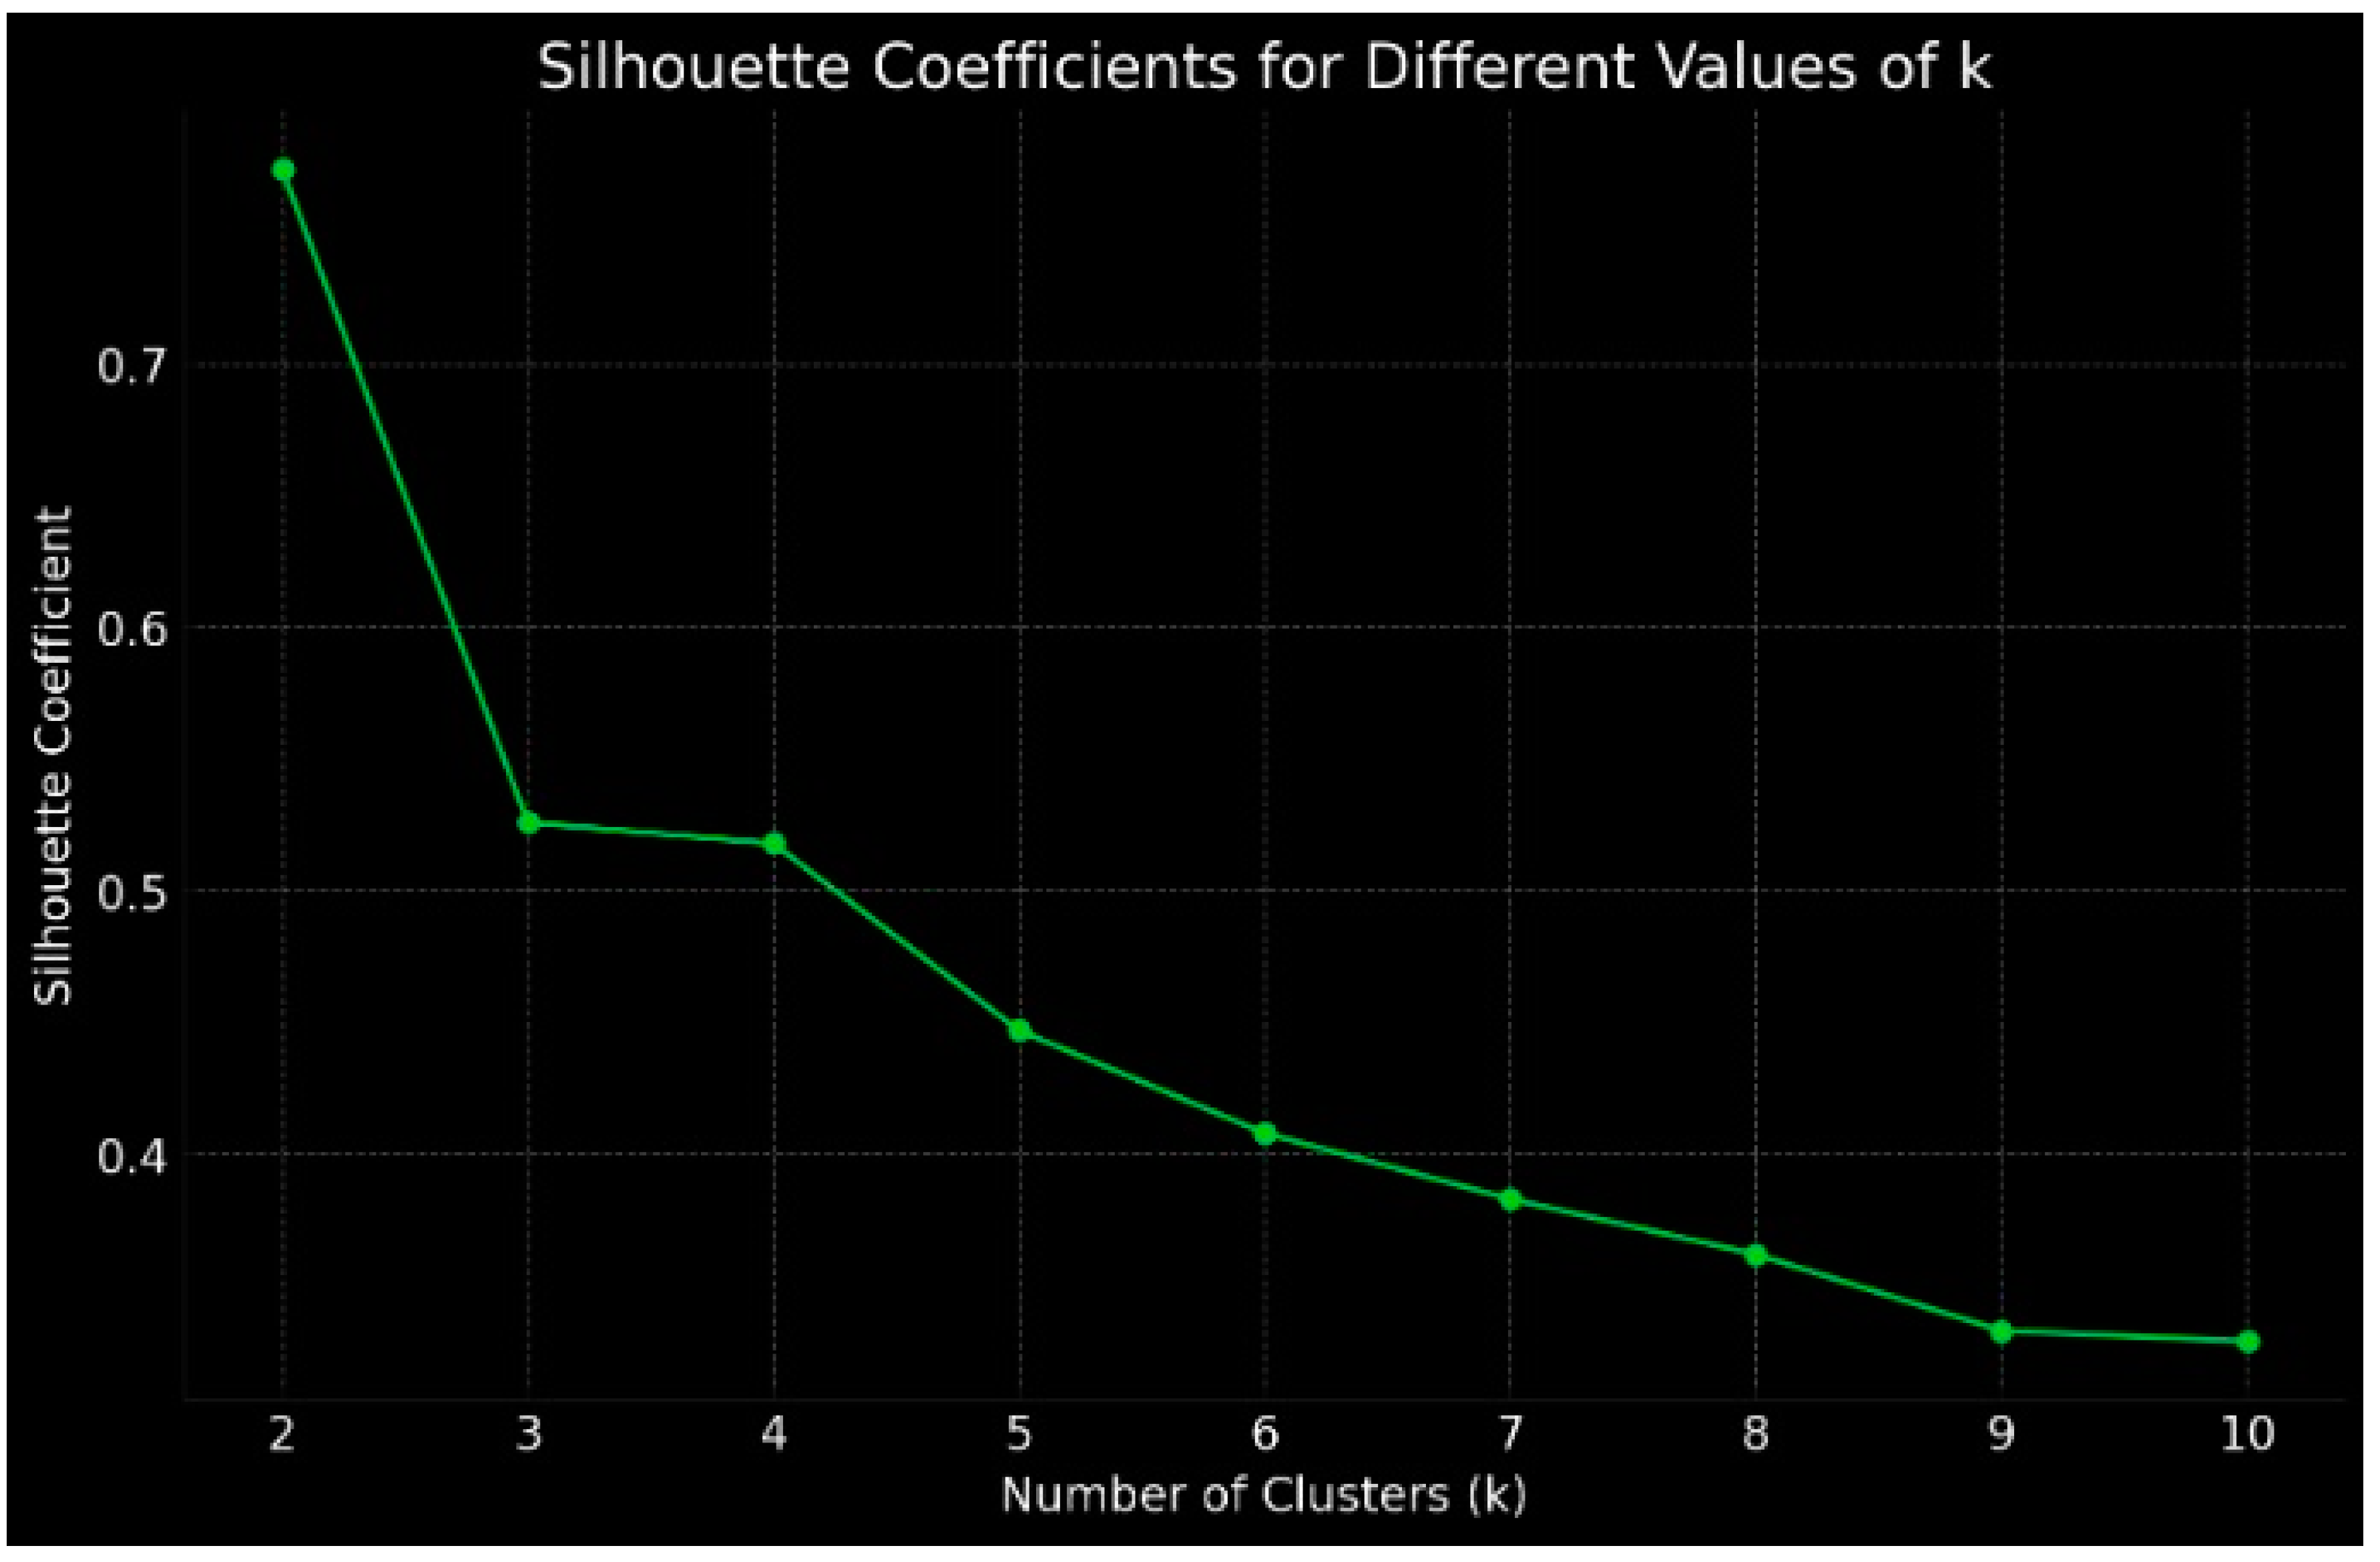
Clusterization with k-Means algorithm optimized with the Silhouette Coefficient. In the following analysis we take into consideration the clustering with k-Means algorithm optimized with the Silhouette Coefficient (
Figure 4).
The results of the analysis highlight that the optimal number of clusters is equal to k=2. The composition of the clusters is indicated below:
Cluster 0: includes Piemonte, Valle d'Aosta, Liguria, Trentino Alto Adige, Veneto, Friuli Venezia Giulia, Emilia Romagna, Toscana, Umbria, Marche, Lazio, Abruzzo, Molise, Campania, Puglia, Basilicata, Calabria, Sicilia, Sardegna. This cluster represents a diverse array of economic environments from the industrialized and wealthy northern regions such as Veneto and Emilia Romagna, to the more agrarian and economically challenged southern areas like Calabria and Sicilia. The inclusion of these varied regions into a single cluster suggests a level of homogeneity in their NPL characteristics. This could imply similar patterns in the scale of lending, the prevalence of smaller loans, or perhaps a shared conservative approach to credit issuance. These regions typically include a mix of sectors from agriculture to manufacturing and services, each contributing differently but consistently to the NPL rates. Economic challenges like lower GDP per capita, higher unemployment rates, and less diversified economies, especially in the southern regions, often translate into higher risk in lending, impacting the NPL rates.
Cluster 1: consists solely of Lombardia. Lombardia hosts a vast portion of the nation’s corporate headquarters, large industries, and financial institutions. The region's unique placement in the clustering framework emphasizes its distinct economic environment, characterized by larger loan volumes and perhaps a higher absolute value of NPLs. However, these NPL characteristics are shaped by high-value loans typically associated with corporate financing, which, when non-performing, can significantly impact the financial landscape. Lombardia’s differentiation could also reflect its economic resilience, dynamism, and possibly more aggressive financial activities. Despite Lombardia's larger and more complex economic activities, which potentially include higher-risk financial ventures, the region's financial infrastructure and credit management practices are robust enough to isolate it from the rest of Italy in terms of NPL behavior.
The insights drawn from this clustering based on NPLs are crucial for financial analysts, policymakers, and regional administrators. For Cluster 0, strategies might need to focus on enhancing financial literacy, diversifying economic activities to reduce dependency on single sectors, and implementing supportive policies that mitigate the impact of economic downturns. In contrast, for Lombardia in Cluster 1, there might be a need for rigorous risk assessment models tailored to the high-stake financial environment, ensuring that while the region continues to lead in economic activities, it also maintains a handle on the quality of its credit portfolio.
Clusterization with k-Means algorithm optimized with the Elbow Method. In the following analysis we take into consideration the clustering with k-Means algorithm optimized with the Elbow Method.
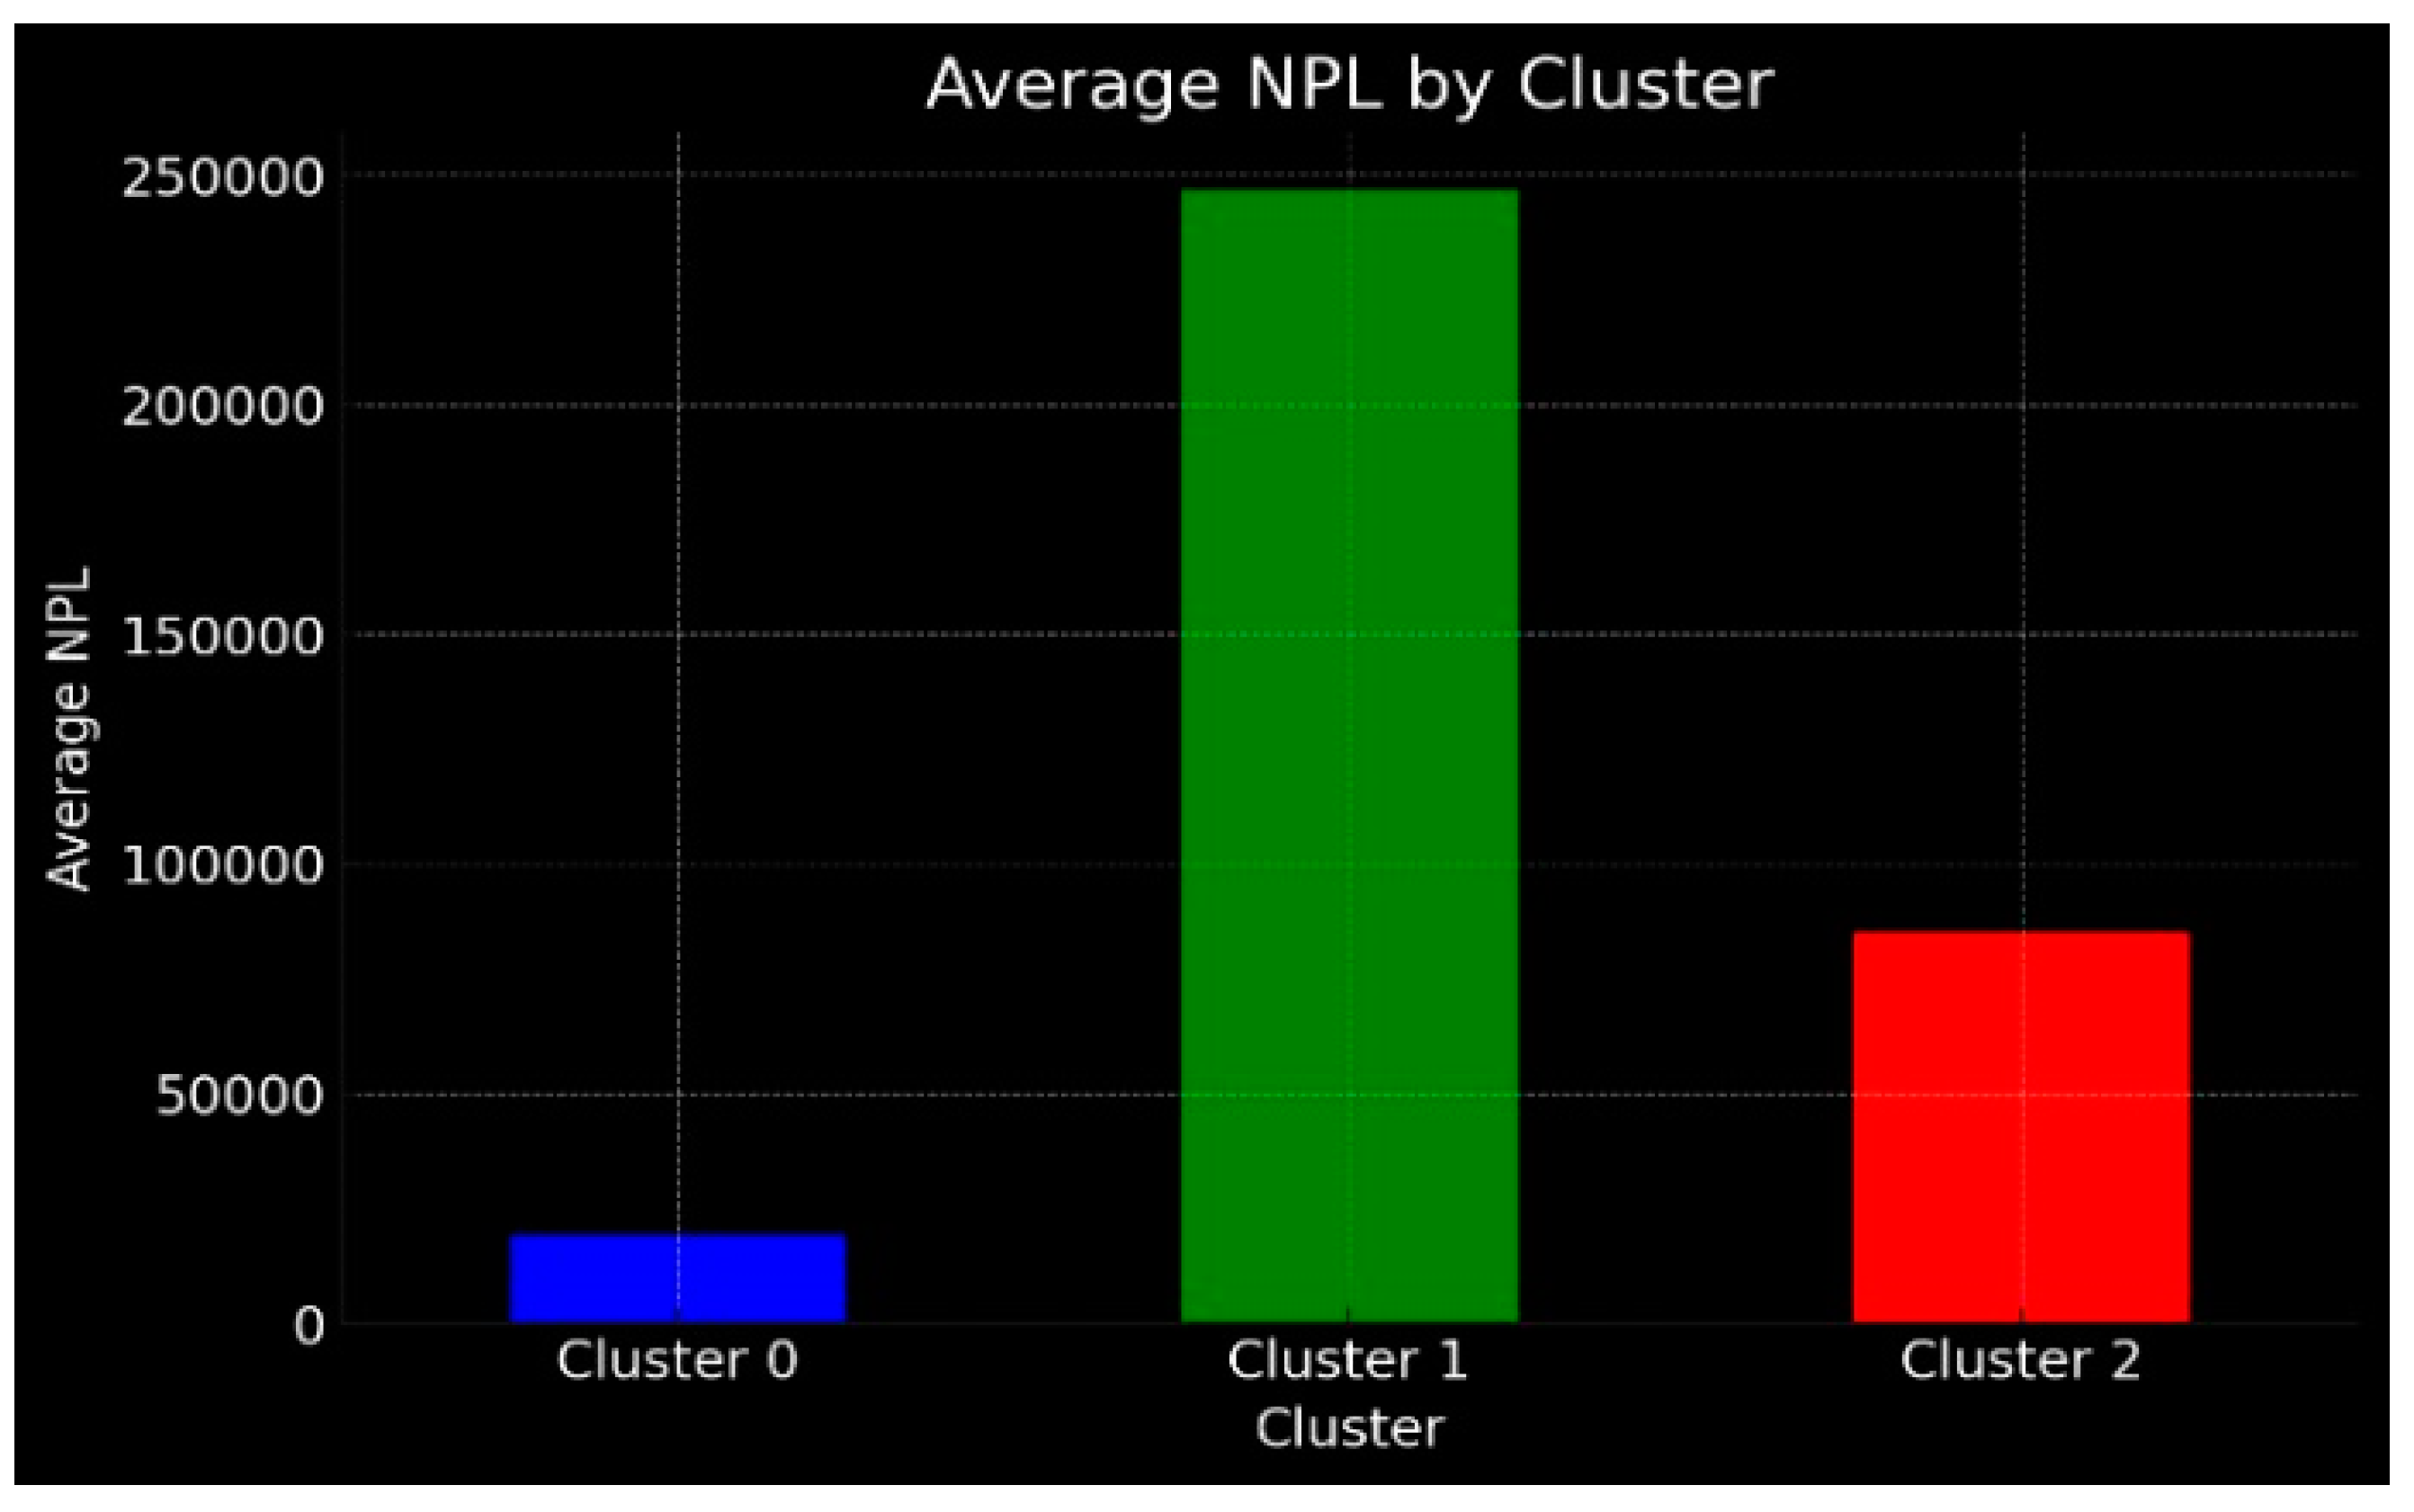
The results of the analysis highlight that the optimal number of clusters is equal to k=3. The composition of the clusters is indicated below:
Cluster 0: includes Piemonte, Valle d'Aosta, Liguria, Trentino-Alto Adige, Friuli Venezia Giulia, Umbria, Marche, Abruzzo, Molise, Puglia, Basilicata, Calabria, Sicilia, Sardegna. The commonality in their NPL characteristics could be driven by several factors, including less volatile economic activities or perhaps more conservative banking practices. The predominance of smaller enterprises and family-owned businesses, particularly in regions like Molise, Basilicata, and Sardegna, might contribute to a more stable but constrained financial environment where banks exercise caution in lending. Additionally, these regions, particularly those in the south, have historically faced economic challenges, including higher unemployment rates and lower GDP per capita, which could influence their NPL profiles by necessitating stringent credit controls and proactive risk management.;
Cluster 1: consists solely of Lombardia. Lombardia's differentiation in NPL clustering can be attributed to its high concentration of corporate headquarters, large businesses, and a dynamic financial sector that includes a significant portion of Italy's banking industry. This concentration can lead to a higher volume of large loans, which, when they become non- performing, impact the financial health distinctly compared to other regions. Furthermore, the economic diversity within Lombardia with sectors ranging from fashion and manufacturing to technology and services contributes to a complex credit environment where NPLs might stem from varied sources unlike in more economically homogeneous regions.
Cluster 2: includes Veneto, Emilia Romagna, Toscana, Lazio, Campania, indicating these regions share similar NPL characteristics. The presence of significant industrial activities in Emilia Romagna and Veneto, combined with the heavy tourist flows in Toscana and Lazio, contributes to a dynamic economic environment where the performance of loans could be affected by seasonal fluctuations and sector-specific economic pressures. These regions' inclusion in the same cluster might suggest similar financial handling of loans and risk, possibly influenced by regional policies that foster economic growth, albeit with the inherent risk of NPLs due to aggressive lending practices to support business expansions and tourism infrastructures.
Figure 6.
Average value of the clusters with k-Means algorithm optimized with the Elbow method.
Figure 6.
Average value of the clusters with k-Means algorithm optimized with the Elbow method.
The NPL-based clustering illuminates not just the financial health but also the underlying economic conditions of these regions. For policymakers and financial institutions, these insights are crucial for developing tailored strategies that address the specific needs and challenges of each cluster. For Cluster 0, interventions might focus on stimulating economic growth and enhancing financial literacy and risk management in smaller enterprises. For Lombardia in Cluster 1, there may be a need for sophisticated risk assessment models that reflect its diverse and dynamic economic landscape. Meanwhile, for Cluster 2, balancing economic growth with sustainable lending practices might be key to managing the seasonal and sector-induced fluctuations in loan performance.
Silhouette Coefficient Vs. Elbow Method. Once the analysis has been conducted, it is necessary to choose between the results proposed by the clustering model optimized with the Silhouette coefficient and the model optimized with the Elbow Method. The choice is made through the use of the knowledge base. In this regard, we choose clustering with the Elbow Method as it presents a higher level of complexity than the clustering model through the Silhouette Coefficient. In fact, while on the one hand the clustering with the Silhouette Coefficient highlighted a value of k=2, on the other hand the clustering with the Elbow Method highlighted an optimal value with k=3. The only element in common between the two models is that they both highlighted the presence of a dominant cluster consisting of the Lombardy region alone. However, in the treatment of the remaining 19 variables, the ability of clustering with the Elbow Method to capture a complexity that is instead absent in the Silhouette coefficient is evident. Therefore, based on the available data and results we believe that the optimal clustering is with k=3 as indicated by the Elbow Method.
6. Econometric Models for Estimating the Value of Banking Stability with Respect to the Variables of the ESG Model in the Italian Regions
In the following analysis we take into consideration the impact of non-performing loans on the three factors of the ESG model, namely E-Environment, S-Social and G-Governance. By analysing the impact of non-performing loans on the variables of the ESG model, we ask ourselves whether banking stability increases or decreases in connection with the individual factors of the ESG model.
6.1. Banking Stability and E-Environment
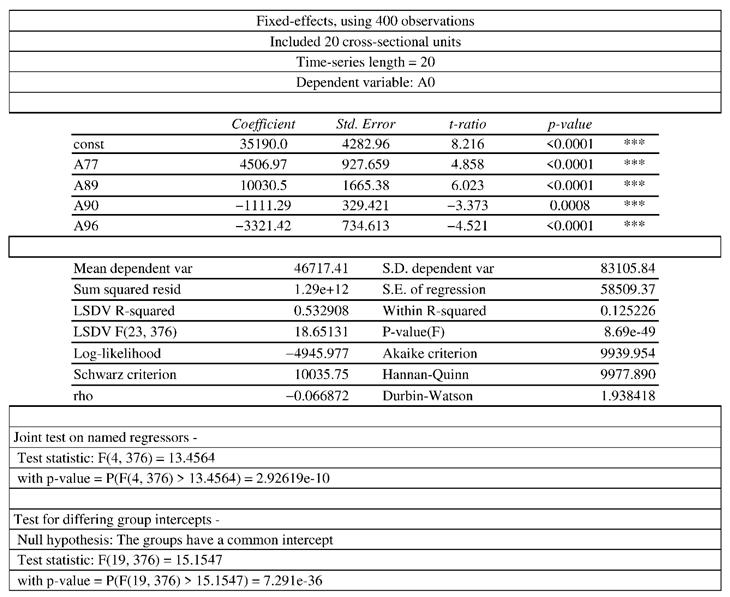
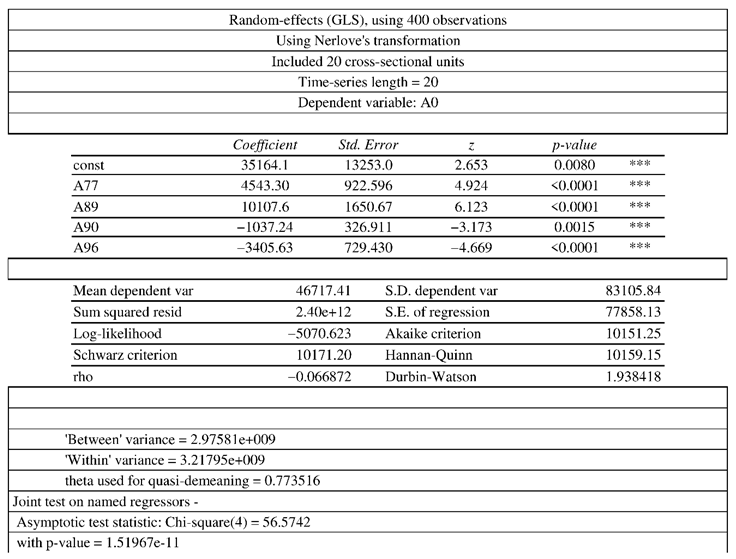
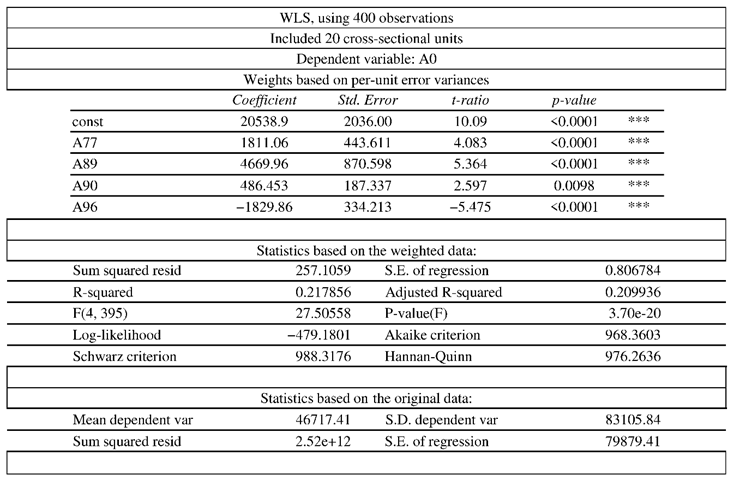
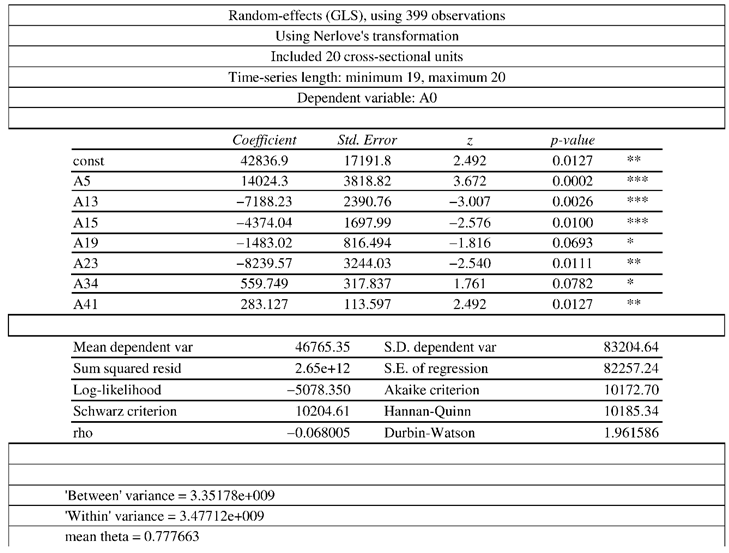
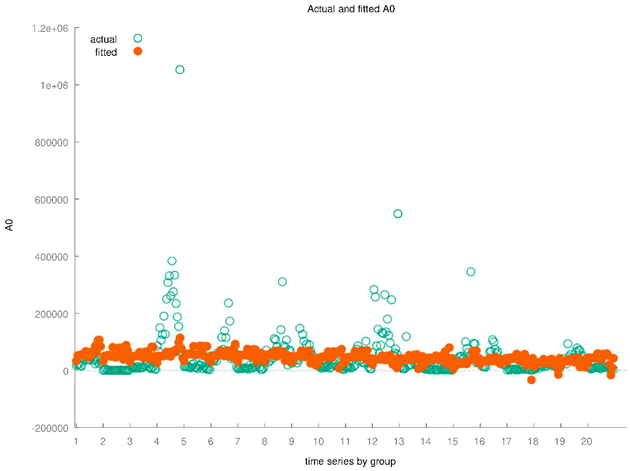
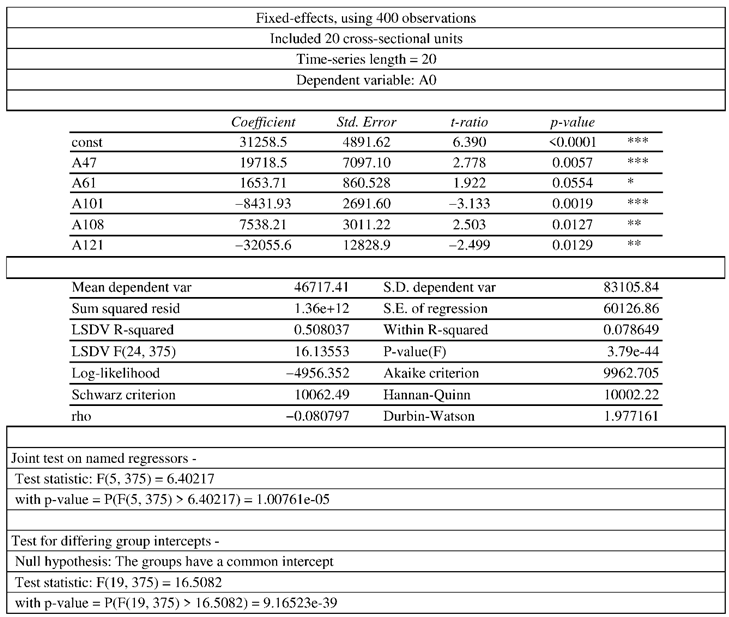
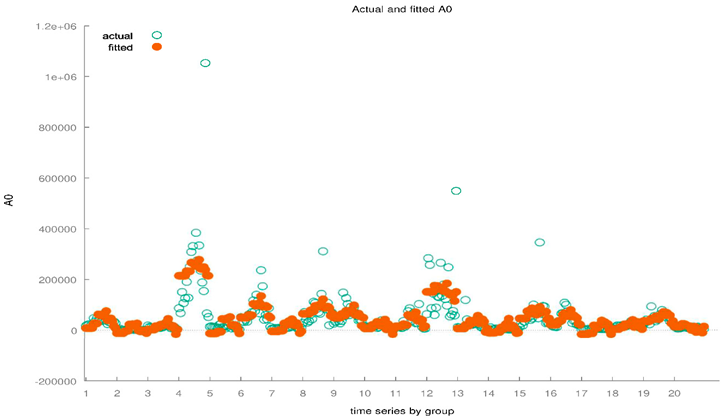
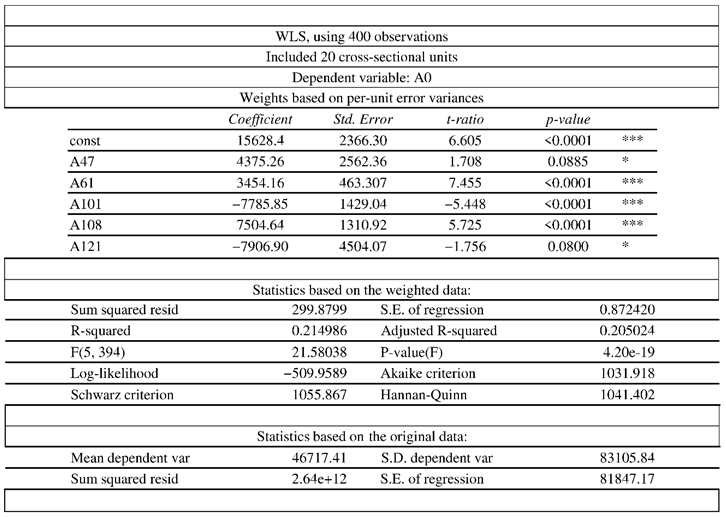
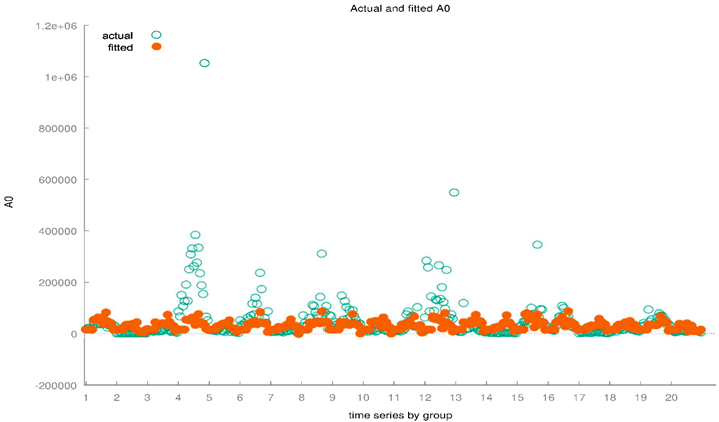
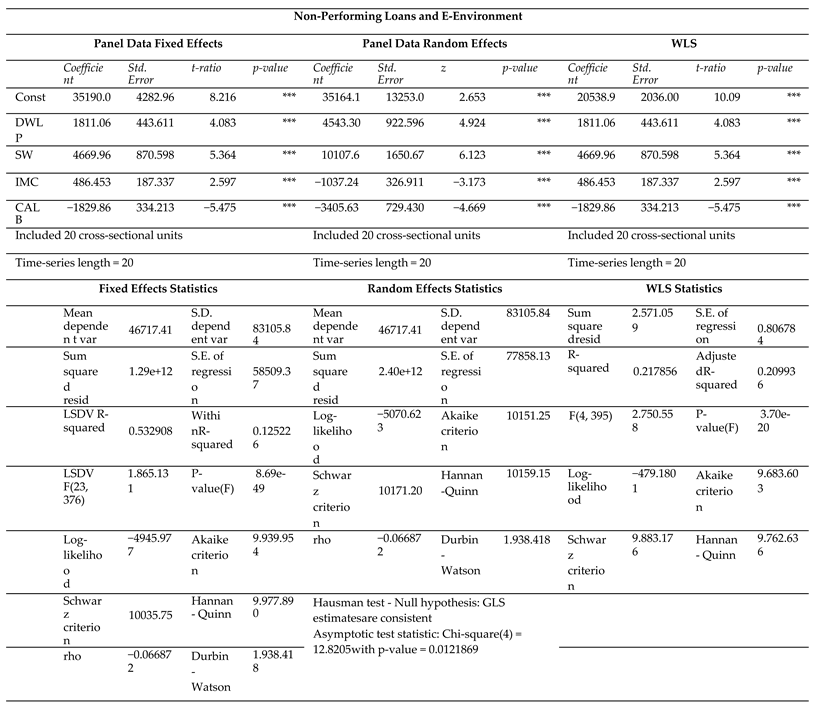
In the following analysis, we take into consideration the relationship between non-performing loans and some variables relating to the E-Environment component of the ESG model. The data refers to the Italian regions between 2004 and 2023. A negative relationship is established between the value of Non-Performing Loans and banking stability. Specifically, we estimated the equation shown below:
where i=20 and t=[2004;2023]. The results of the econometric estimates are shown in the
Table 2 below.
Obviously, since we have estimated the value of Non-Performing Loans-NPL it is necessary to make some modifications compared to the results obtained from the econometric estimates. In particular, it must be considered that there is an inverse relationship between non-performing loans and banking stability. That is, banking stability tends to decrease with the growth of non-performing loans. It follows that it is necessary to modify the sign of the relationships estimated in the econometric model. We analyze the modified results in the sense of banking stability below.
Banking stability is negatively connected with the following variables, namely:
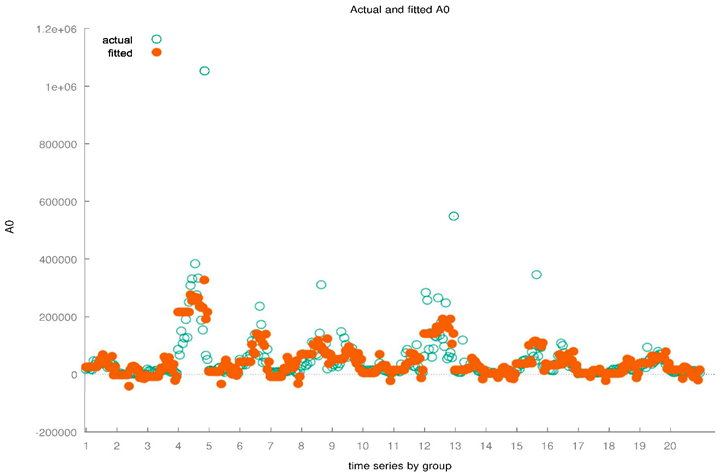
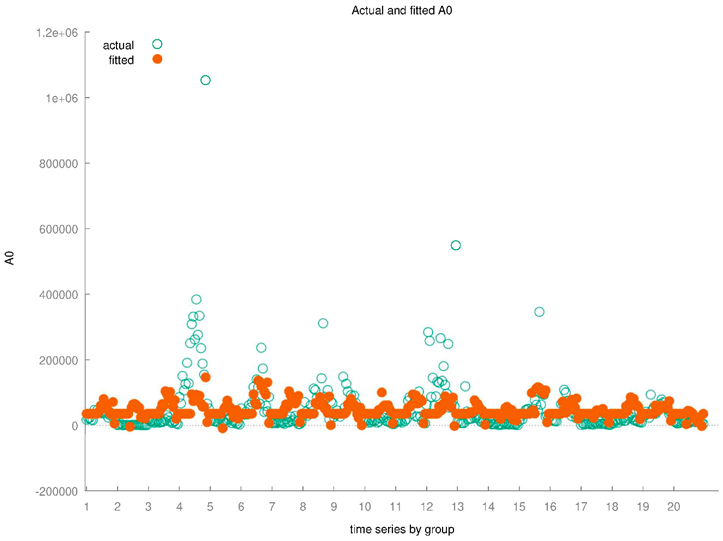
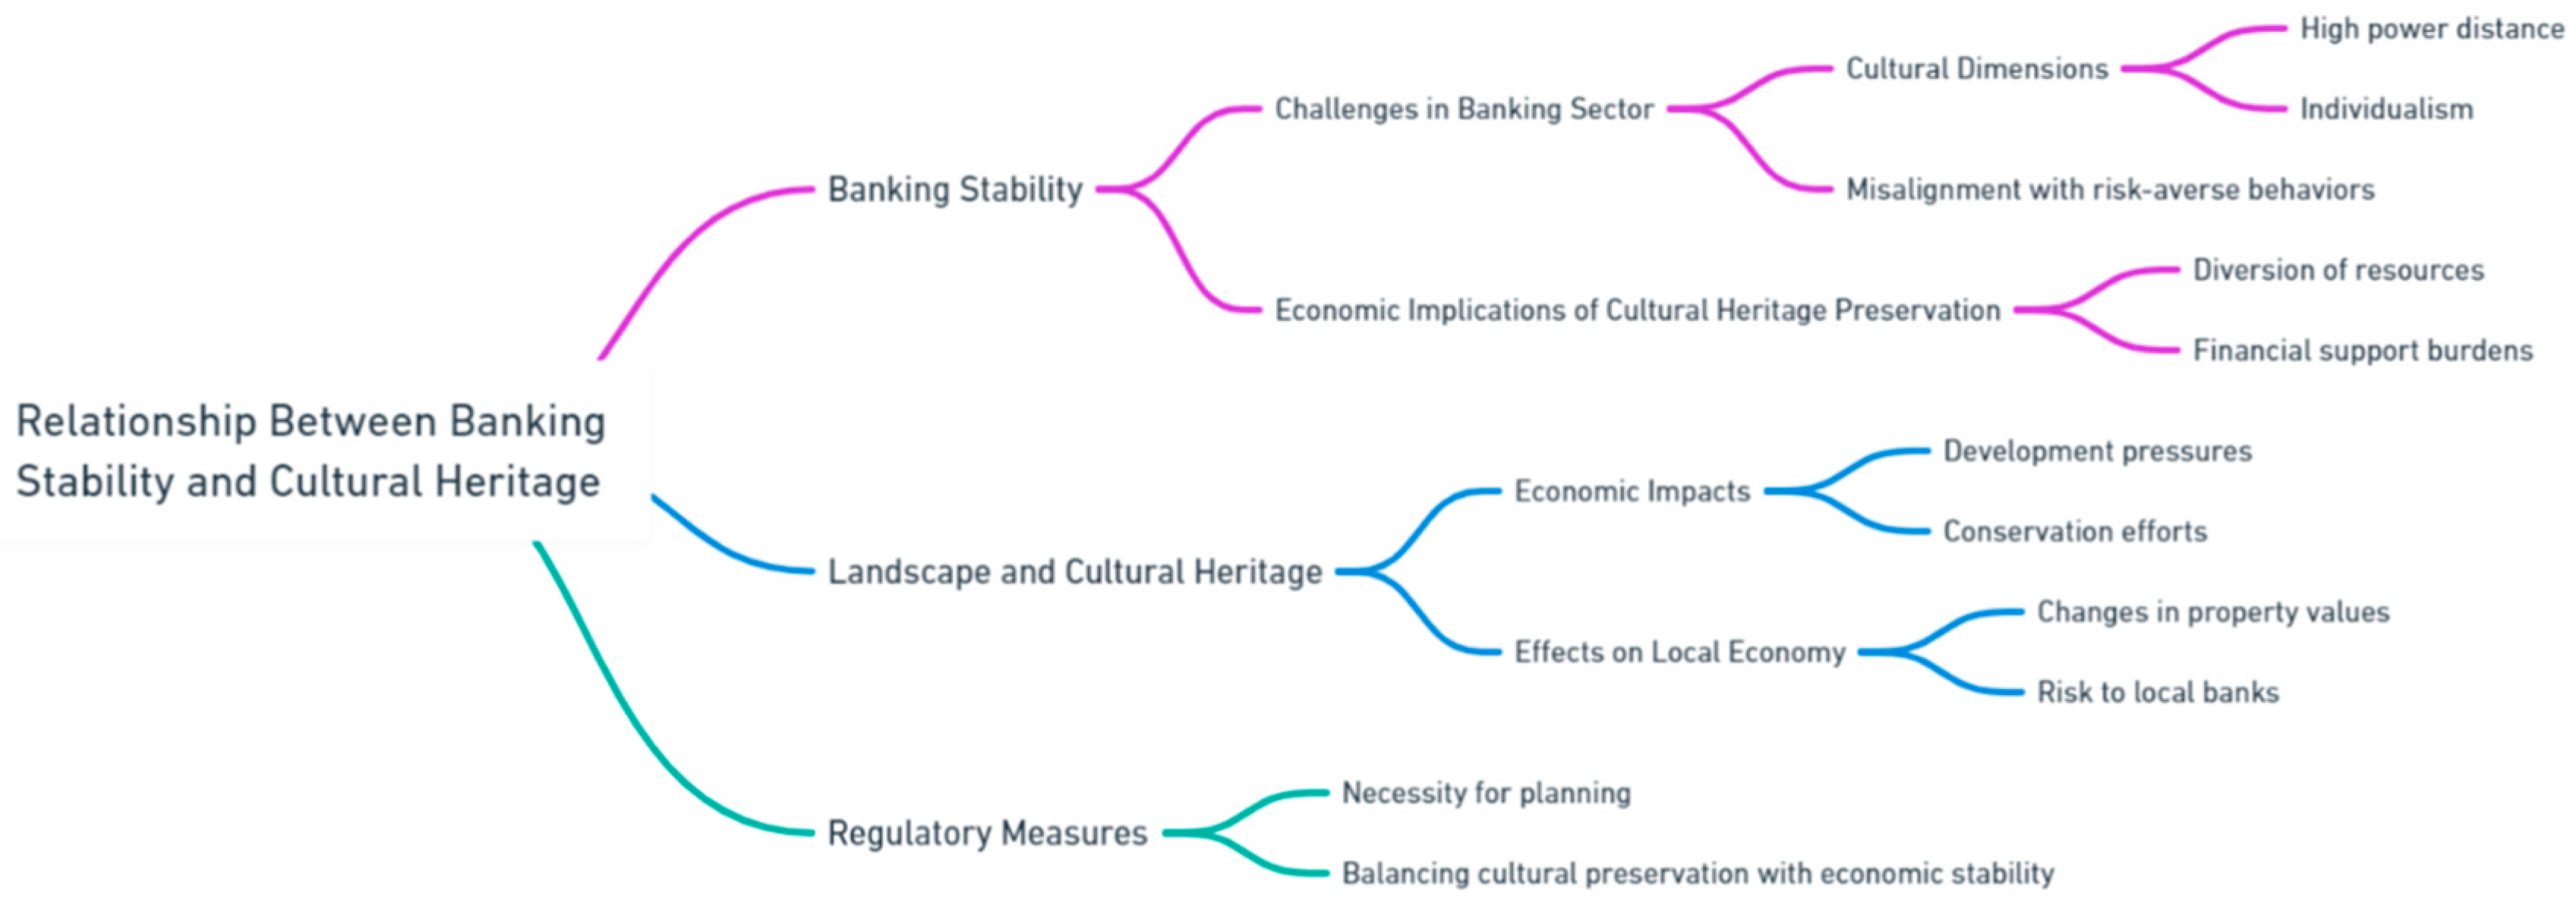
DWLP: investigating the negative relationship between banking stability and landscape and cultural heritage reveals that several factors can contribute to potential challenges in the banking sector. Certain cultural dimensions, such as high power distance and individualism, can foster banking practices that may not align with risk-averse behaviors, potentially destabilizing the banking sector. This misalignment can be particularly problematic in regions where such cultural traits dominate the banking sector's strategic orientation (Damtsa et al., 2020). In some cases, the efforts to preserve cultural heritage can have economic implications that affect the financial stability of local banks. Investments in heritage conservation might divert resources from other economic activities or require substantial financial support from local banks, which could impact their stability, especially if these investments do not yield immediate economic benefits (Nocca, 2017). Changes in the landscape, whether due to development pressures or conservation efforts, can affect the local economy. This, in turn, impacts the financial sector, particularly local banks which might face increased risks due to shifts in the economic landscape or in property values tied to these areas (Fairclough, 2018). The relationship between banking stability and landscape and cultural heritage can sometimes be strained by cultural practices that promote riskier banking behaviours and the economic burdens of preserving cultural heritage. These factors necessitate careful planning and regulatory measures to balance cultural preservation with economic and financial stability (
Figure 7).
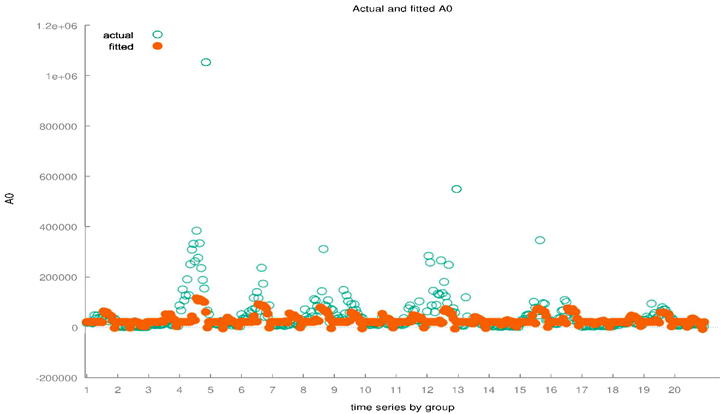
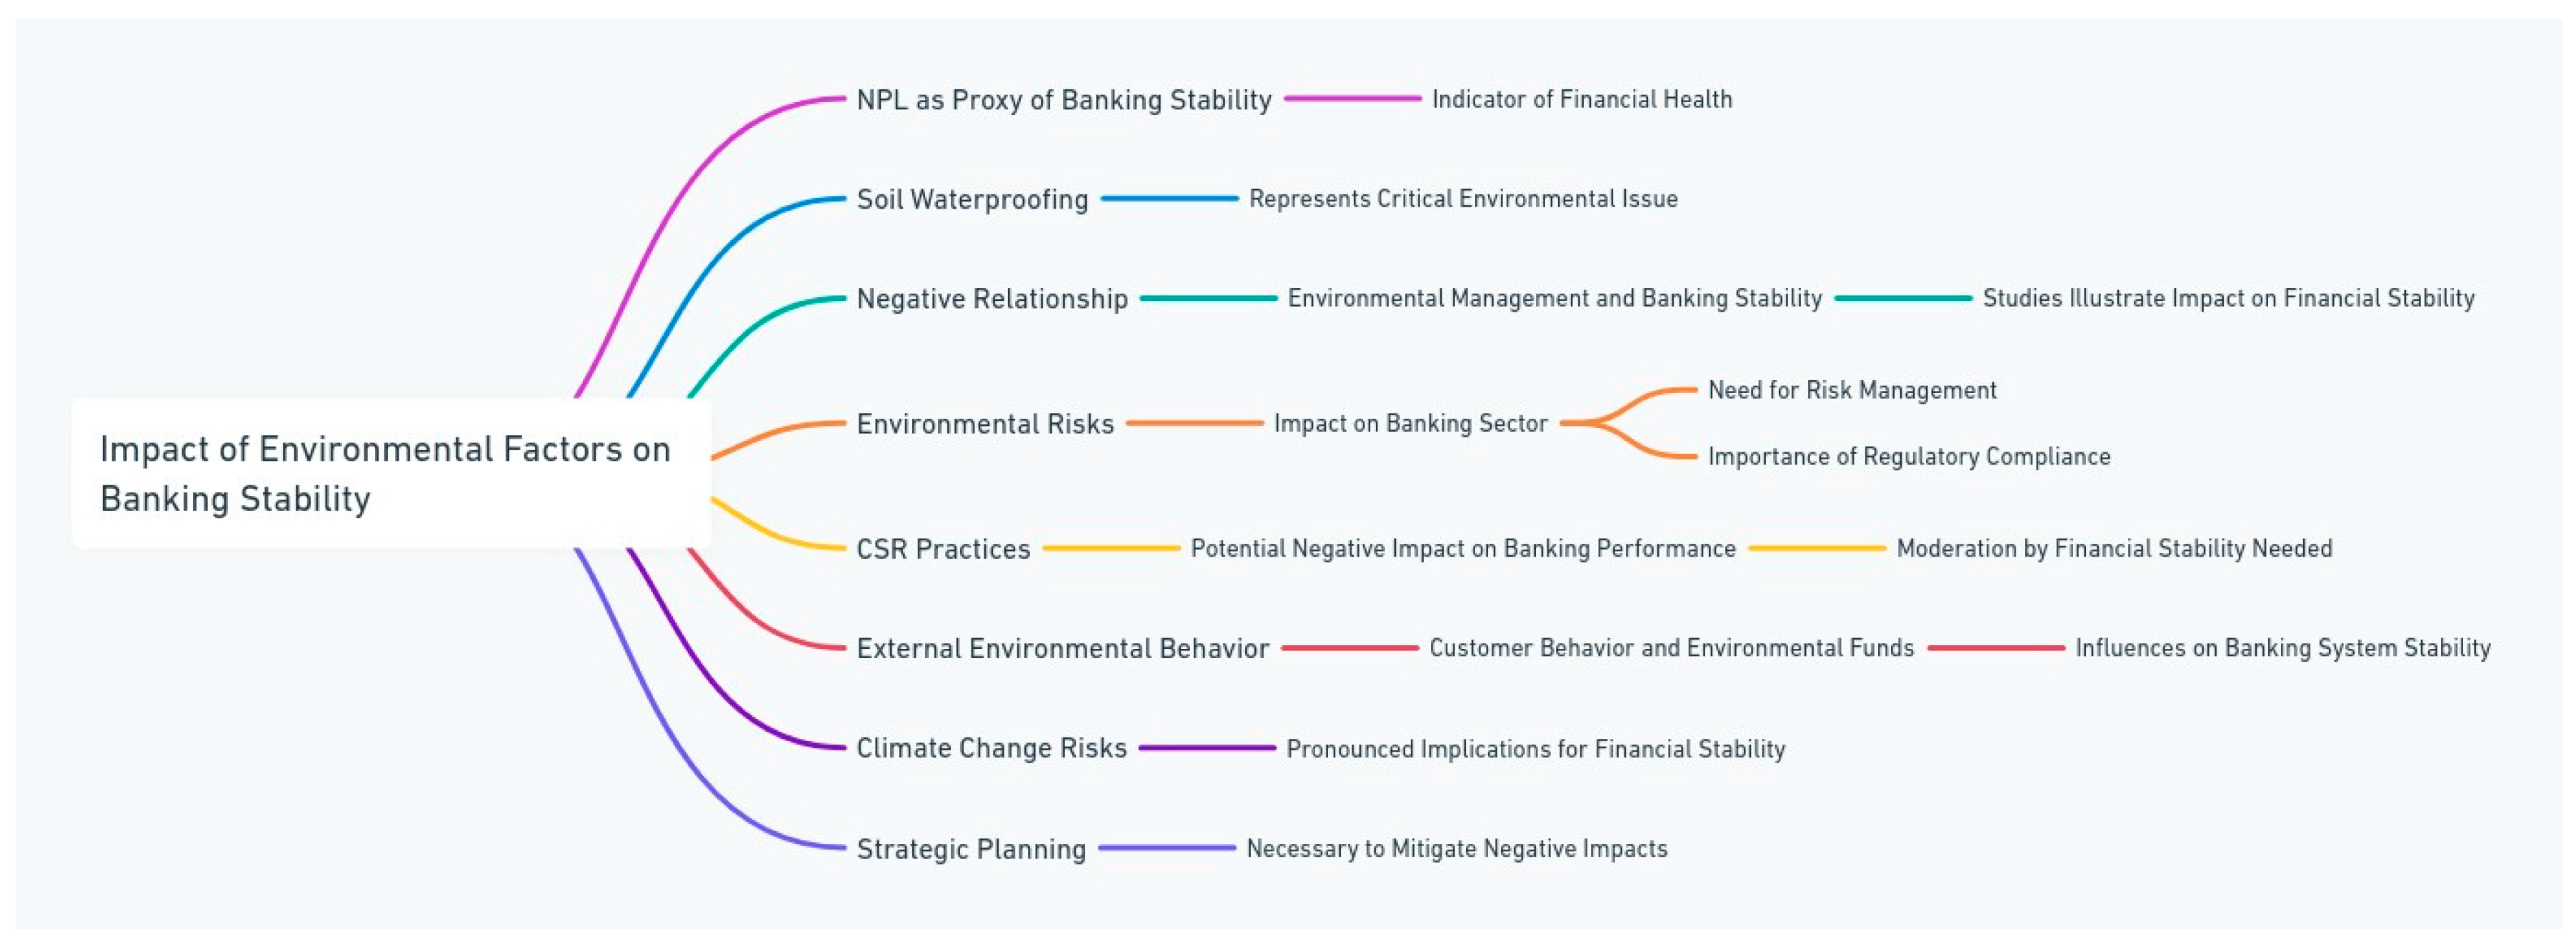
SW: in this case we take into consideration the value of NPL, as a proxy of banking stability, and the variable relating to soil waterproofing which is considered as a variable capable of representing a critical issue from an environmental point of view. The negative relationship between banking stability and environmental management is illustrated by various studies, emphasizing how environmental risks and management practices can impact financial stability in the banking sector. Environmental practices within corporate social responsibility (CSR) can have a significant negative impact on banking performance, particularly when not moderated by financial stability (Saadaoui & Ben Salah, 2022) The external environmental behavior, including customer behavior and environmental funds, significantly influences banking system stability, suggesting that environmental factors play a crucial role in maintaining or destabilizing financial systems (Guleva & Dukhanov, 2015) Banks facing high environmental risks need to consider these factors in their risk management and regulatory compliance to prevent financial instability. This is particularly critical as climate change risks have pronounced implications for financial stability (Nieto, 2017). The negative impacts of poor environmental management on banking stability are substantial, necessitating strategic planning and regulatory compliance to mitigate these effects (
Figure 8).
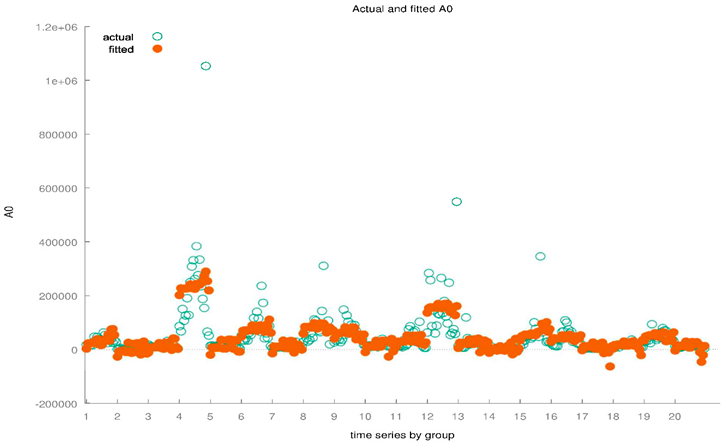
IMC: the relationship between banking stability and material consumption is not well present in the literature. However, by bringing the category of material consumption back to the broader category of excessive use of resources and waste, it is possible to identify references in the literature. Financial instability negatively affects economic growth, which might imply that during periods of financial instability, there could be higher material consumption and waste due to less efficient resource allocation and environmental oversight (Creel et al., 2015). There is a discussion on the negative effects of financial development on environmental quality, suggesting that greater financial stability might lead to increased material consumption and potentially more waste, unless managed properly with sustainable policies (Kırıkkaleli & Sofuoğlu, 2023). A study focusing on the effect of GDP, energy consumption, and material consumption on waste generation illustrates that economic activities related to higher material consumption can lead to increased waste, hinting at the need for better financial and environmental governance to ensure stability and sustainability (Gardiner & Hájek, 2020). These insights suggest a complex relationship where banking stability might indirectly affect material consumption and waste management through economic activities and financial policies. Improved financial stability can either mitigate or exacerbate environmental impacts based on how it influences economic practices and regulatory measures. More targeted research would be necessary to explicitly connect these dots within a single study (
Figure 9).
Banking stability is positively connected with the following variable namely:
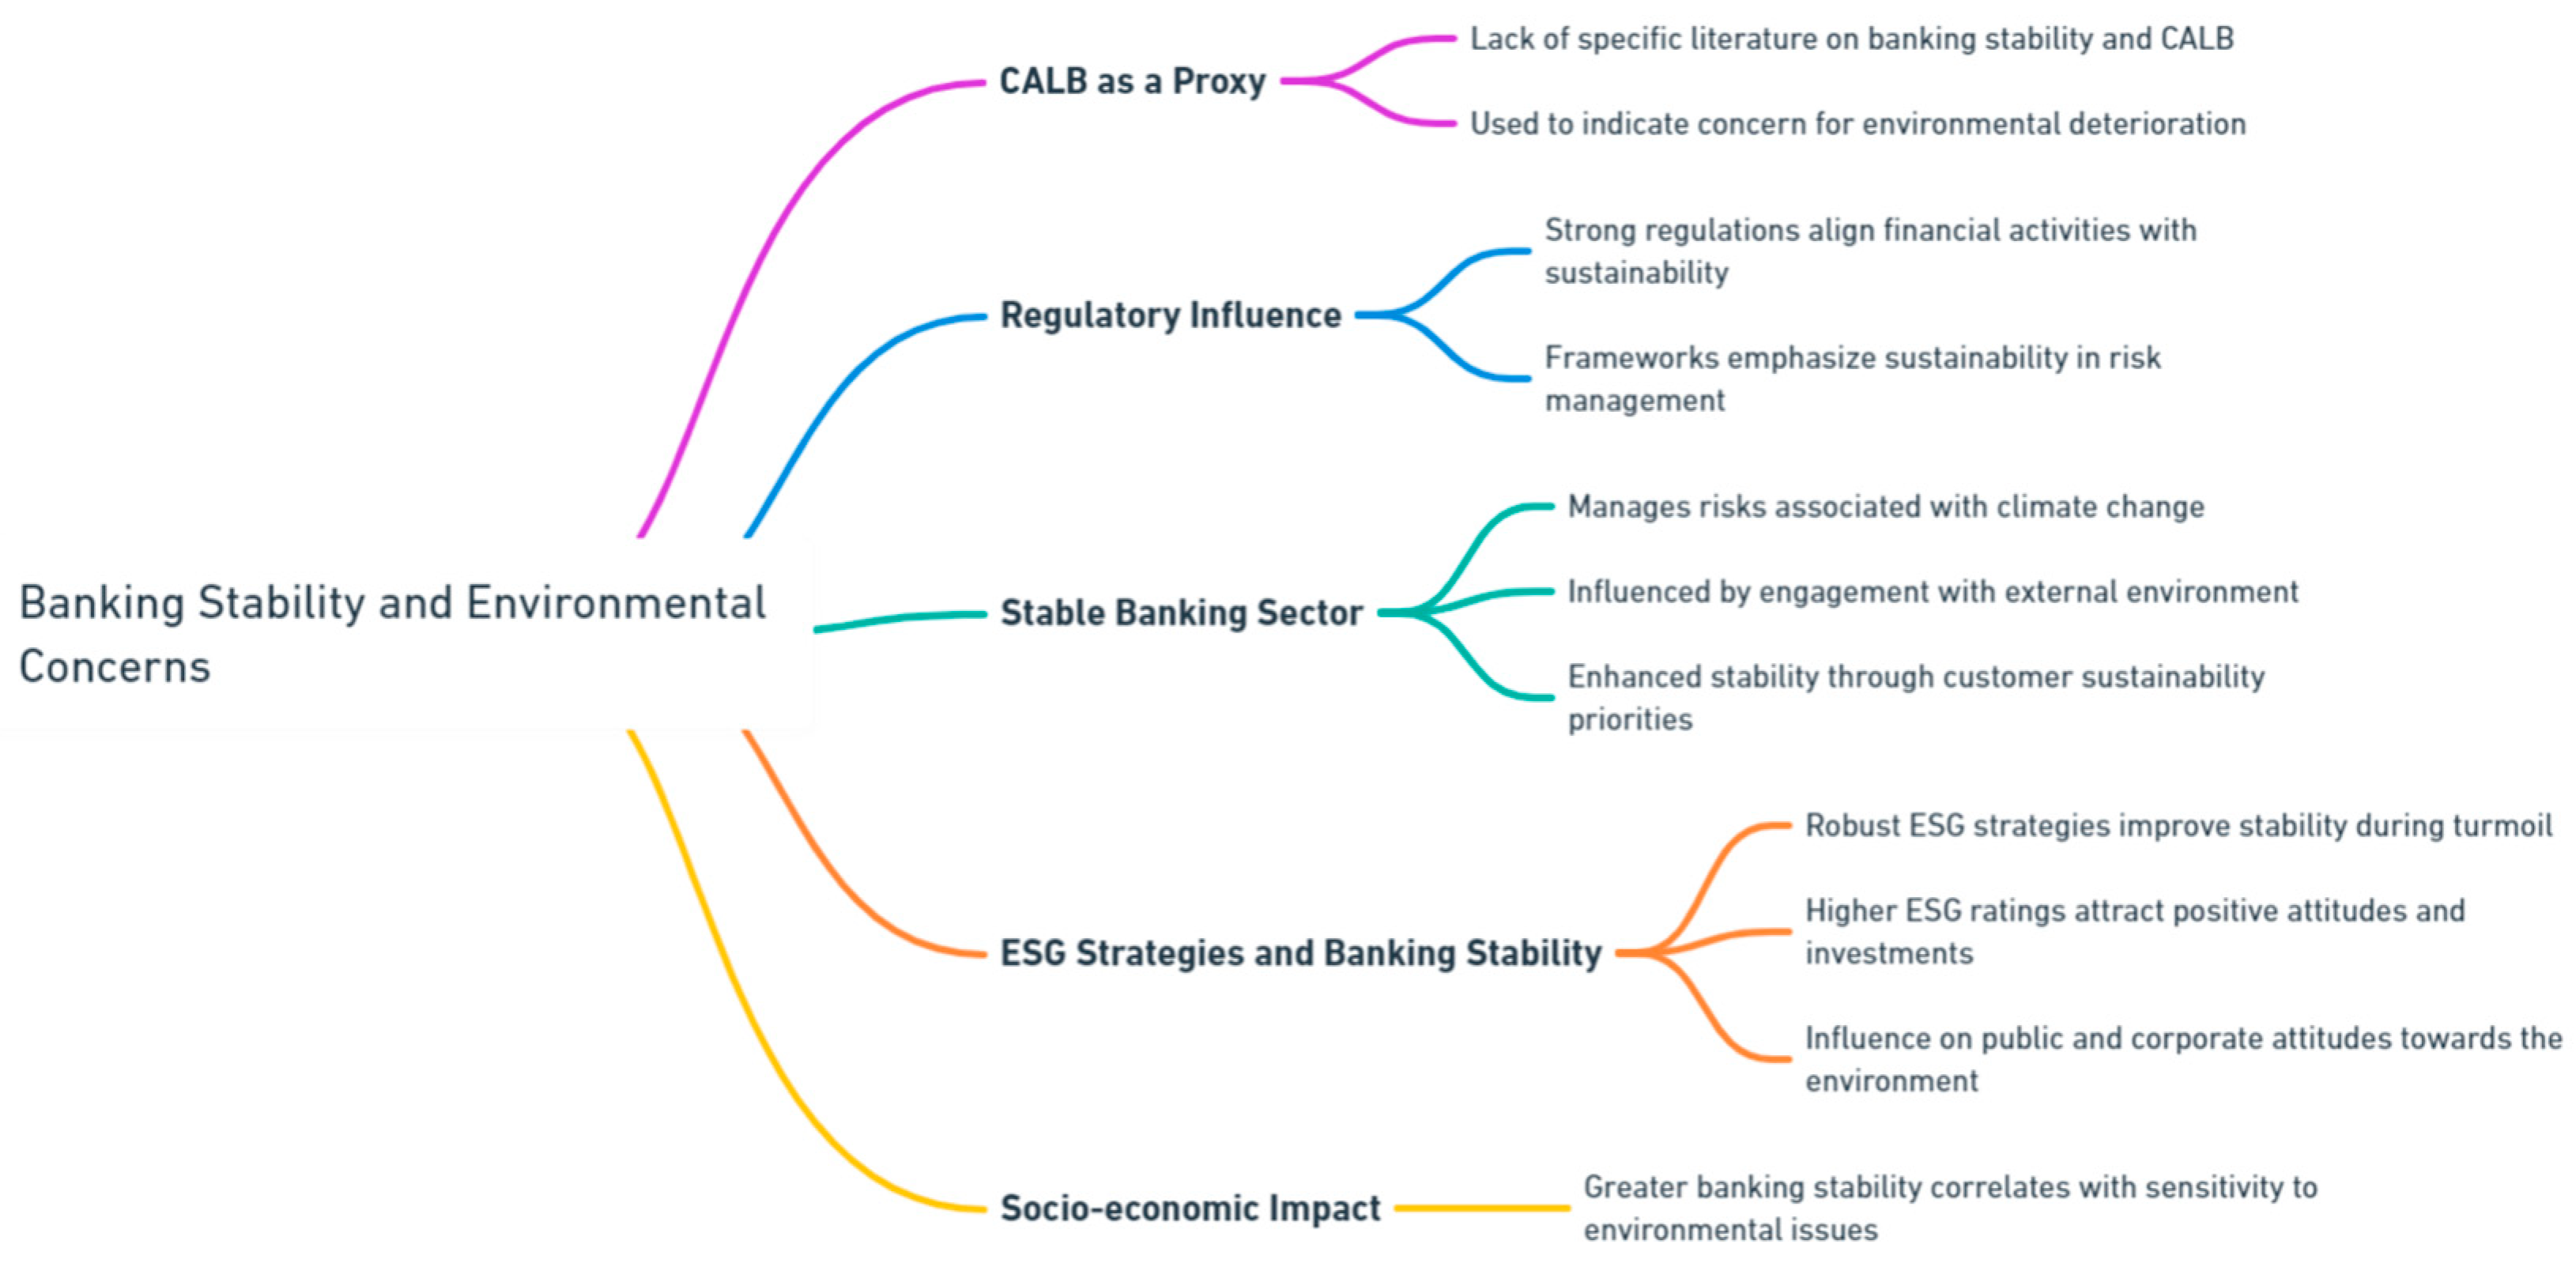
CALB: also in this case, as in the previous ones, there are no specific scientific literature references that could refer to the relationship between banking stability and CALB. However, considering CALB as a proxy of the concern for the deterioration of the environmental condition it is possible to identify traces in the reference literature. Strong banking regulations can help in aligning financial activities with sustainability goals, including environmental conservation. Regulatory frameworks that emphasize sustainability can guide banks to incorporate environmental risks into their risk management strategies, which can affect their stability. A stable banking sector that follows stringent regulations regarding environmental issues can better manage the financial risks associated with climate change and environmental degradation (Alexander & Fisher, 2018). The stability of the banking sector can also be influenced by its engagement with the external environment, including how it responds to customer behaviors regarding sustainability. Banks that actively manage their environmental impact may experience enhanced stability by attracting customers who prioritize sustainability, thus broadening their customer base and improving risk diversification (Guleva & Dukhanov, 2015). Banks that adopt robust ESG strategies tend to experience better stability, particularly during financial turmoil. This is because sustainable practices can enhance a bank's reputation, attract investment, and reduce operational risks related to environmental factors. Thus, banks with higher ESG ratings may find themselves better positioned in terms of stability, which can influence public and corporate attitudes towards environmental concerns (Chiaramonte et al., 2021). These factors illustrate that while banking stability itself might not directly address environmental concerns, the approaches and strategies within stable banks regarding environmental sustainability can influence public concern and actions towards worsening environmental conditions. this condition highlights the originality of our analysis which specifically highlights the positive relationship between banking stability and concern for the environmental condition and biodiversity. In summary, from a strictly socio-economic point of view, it is possible to underline that in regions where there is greater banking stability there is also greater sensitivity to environmental and biodiversity issues (
Figure 10).
In summary, we can note that banking stability, approximated by a relationship inversely proportional to the estimated value of NPL, tends to worsen with the deterioration of the environment and landscape and is positively connected to the development of sensitivity towards the environment and biodiversity.
6.2. Banking Stability and S-Social
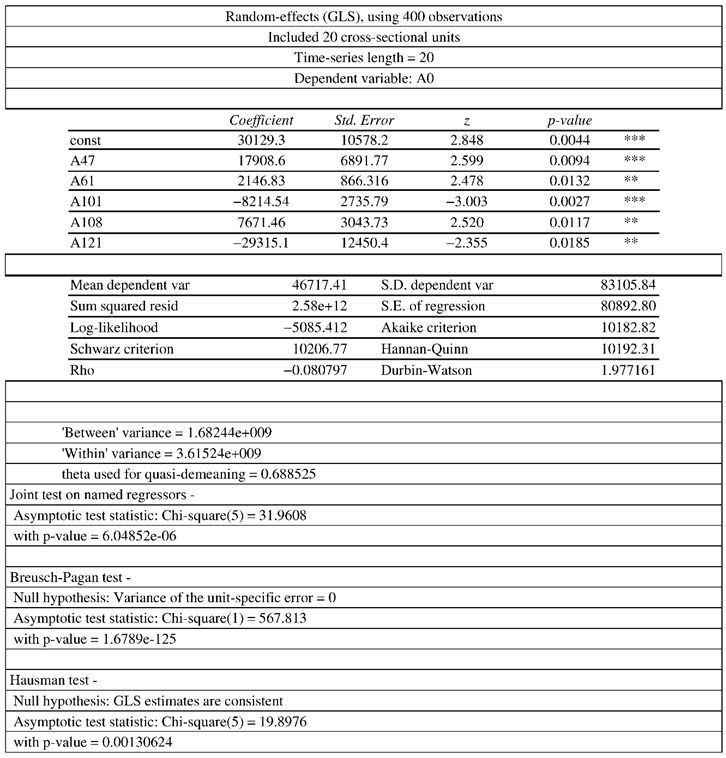
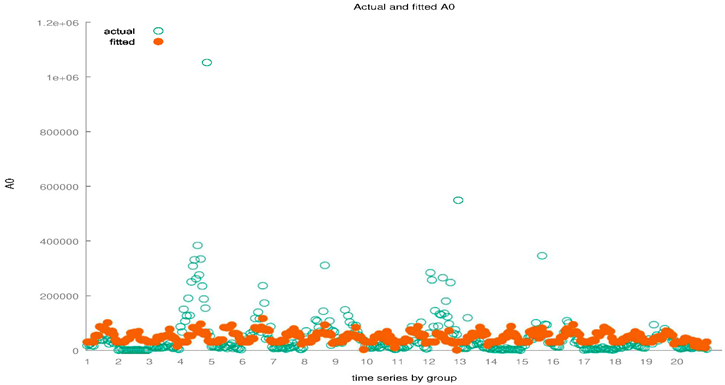
In the following analysis we take into consideration the relationship between non-performing loans and some variables relating to the S-Social component of the ESG model. The data refers to the Italian regions between 2004 and 2023. A negative relationship is established between the value of Non- Performing Loans and banking stability.
Specifically, we estimated the equation shown below:
where i=20 and t=[2004; 2023]. The results are shown in the
Table 3 below.
The positive relationship between banking stability and:
TUJ: banking stability plays a crucial role in fostering economic growth and job stability, acting as a foundation for broader economic health. Research has demonstrated a significant positive correlation between the stability of the banking sector and real output growth, particularly highlighting how stable banking conditions can mitigate economic downturns and support sustained economic growth (Jokipii & Monnin, 2013). Additionally, stable banking environments contribute to more predictable and robust job markets. For instance, individuals in more stable job situations tend to accumulate greater wealth, suggesting a direct benefit from economic stability influenced by the banking sector (Kuhn & Ploj, 2020) Furthermore, transformations within the banking sectors, such as those observed in South-East Europe, show that stability and transformation in banking are closely linked to economic and job market stability, which could facilitate transitions from unstable to more stable job conditions (Kubiszewska, 2017). Thus, a stable banking sector not only supports economic growth but also enhances job stability, ultimately contributing to a healthier job market (
Figure 11).
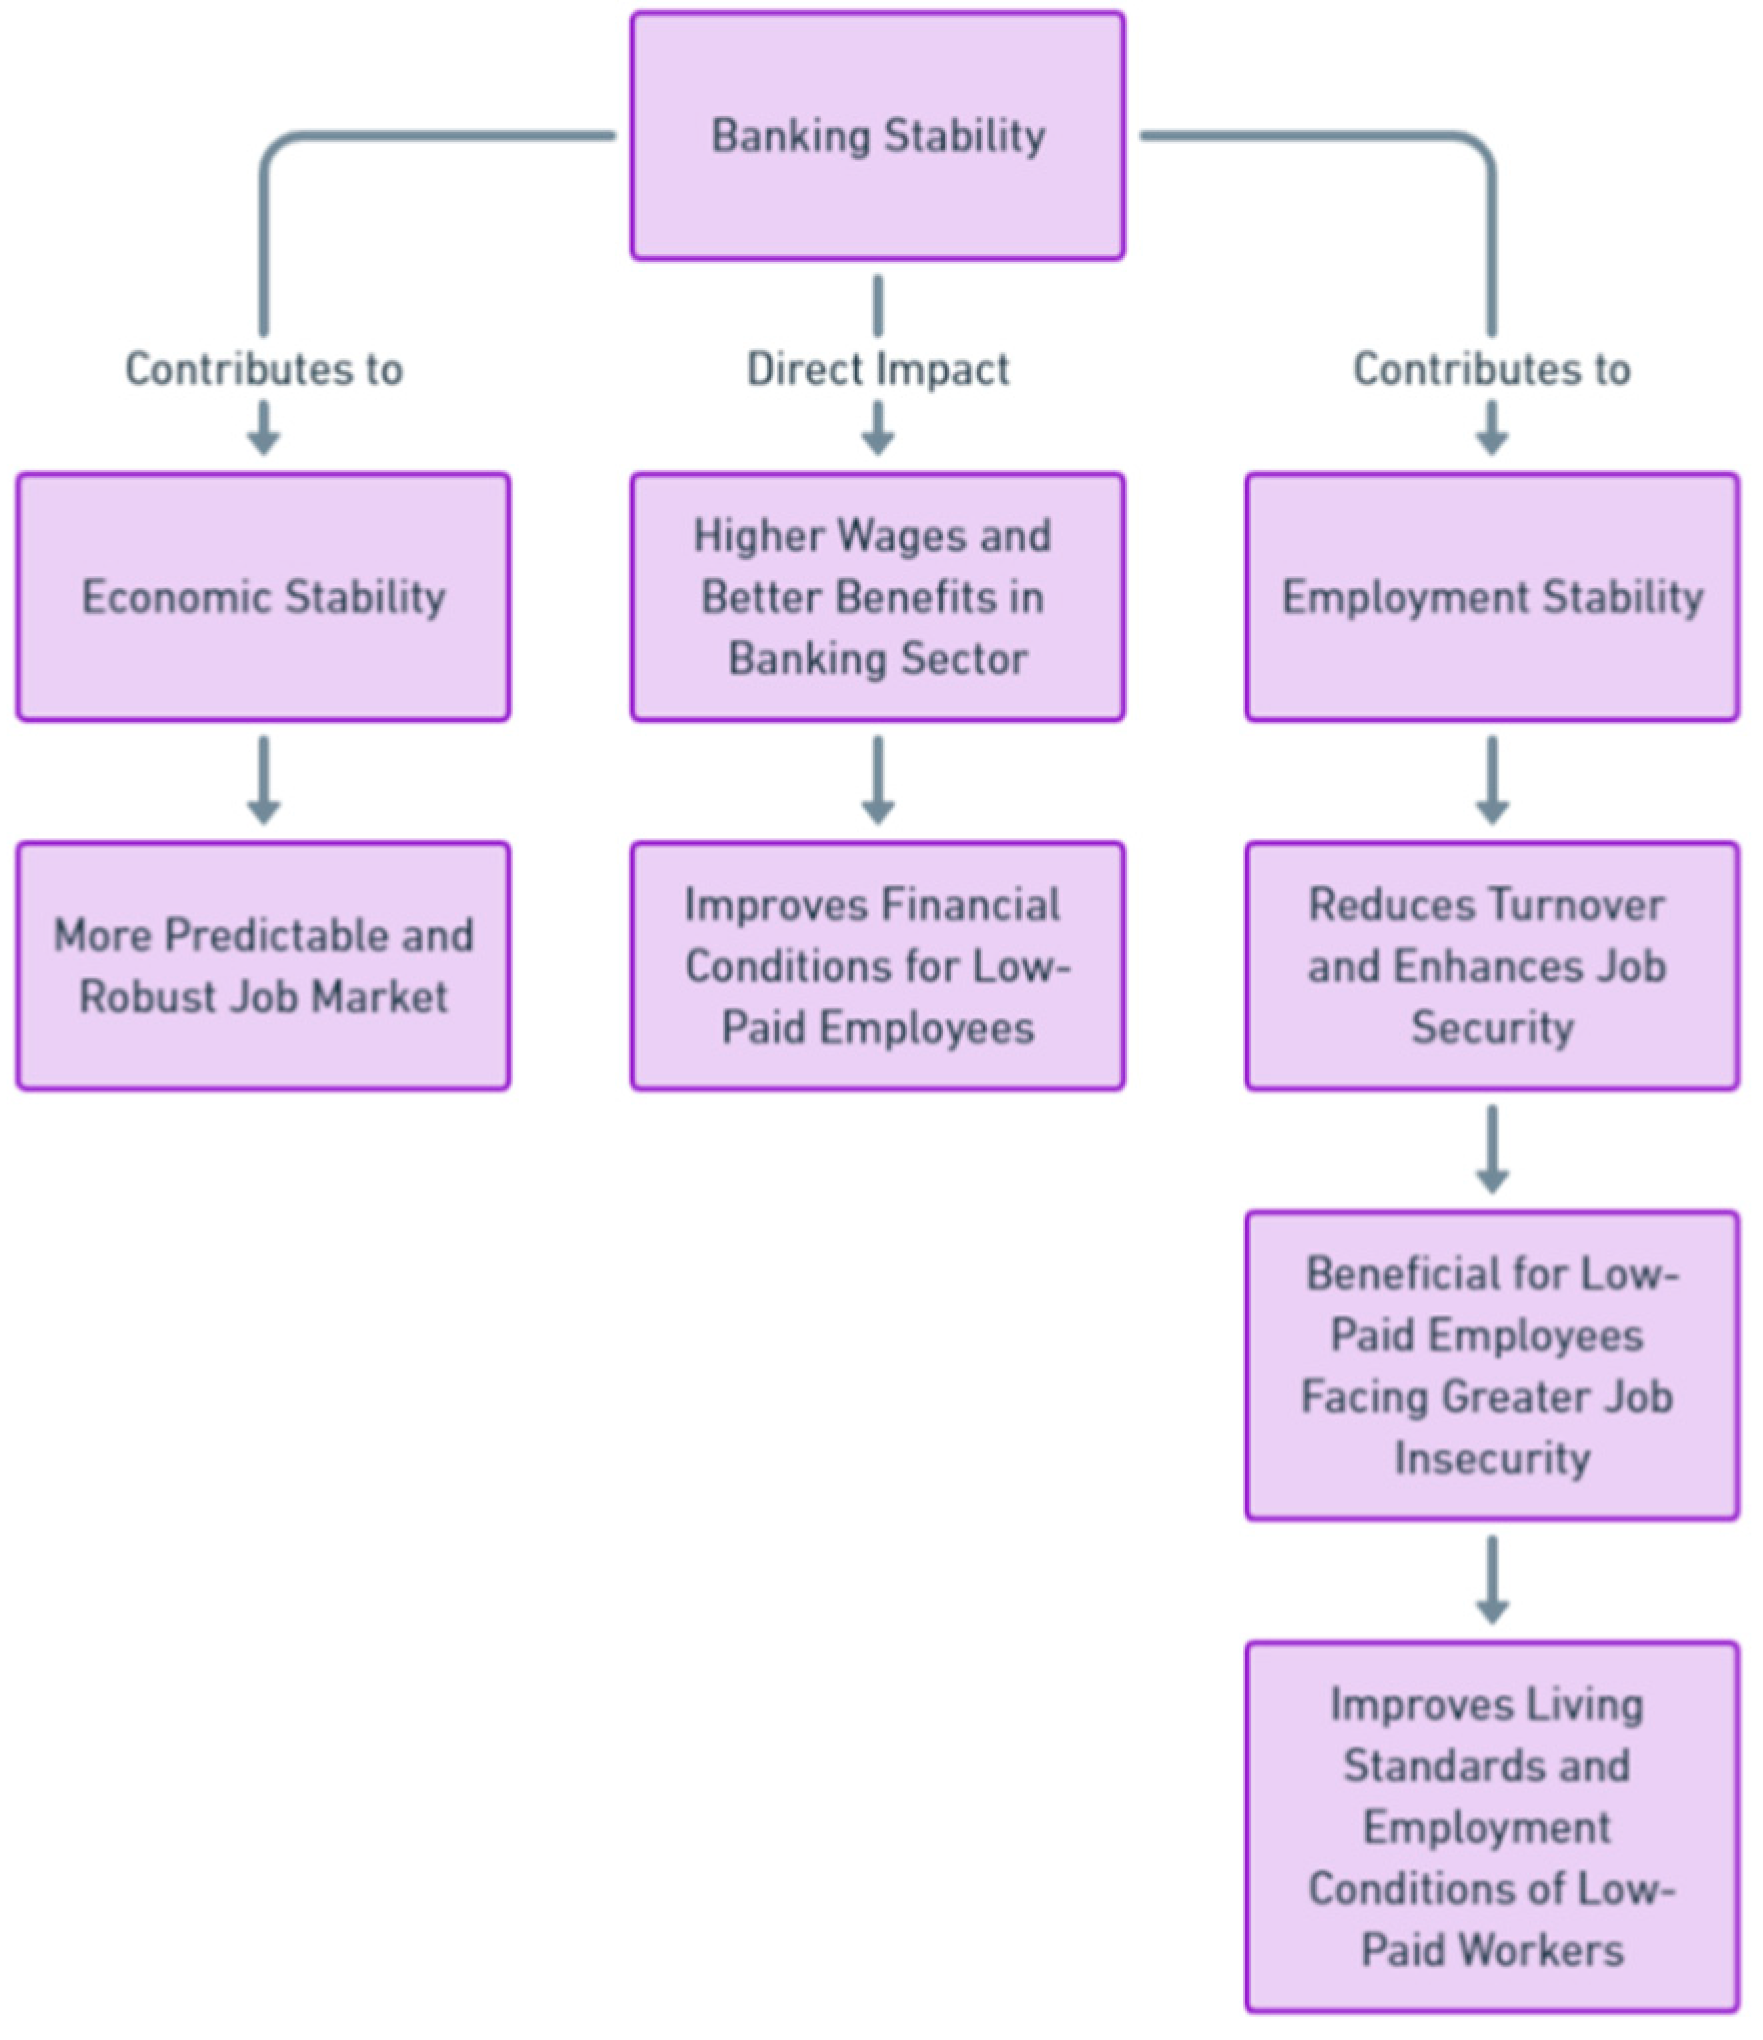
LPE: banking stability plays a significant role in enhancing the economic conditions for low- paid employees, both directly and indirectly. Stable banks tend to contribute to overall economic stability, which in turn can create a more predictable and robust job market (Jokipii & Monnin, 2013). Within the banking sector itself, well-capitalized and stable banks often offer higher wages and better benefits, directly improving the financial conditions of their employees, including those in lower-paid positions (Bertay & Uras, 2016). Moreover, the stability of the banking sector contributes to employment stability, reducing turnover and enhancing job security, which is especially beneficial for low-paid employees who typically face greater job insecurity (Luo, 2014). Thus, the stability of banks not only supports broader economic growth but also tangibly improves the living standards and employment conditions of low-paid workers (
Figure 12).
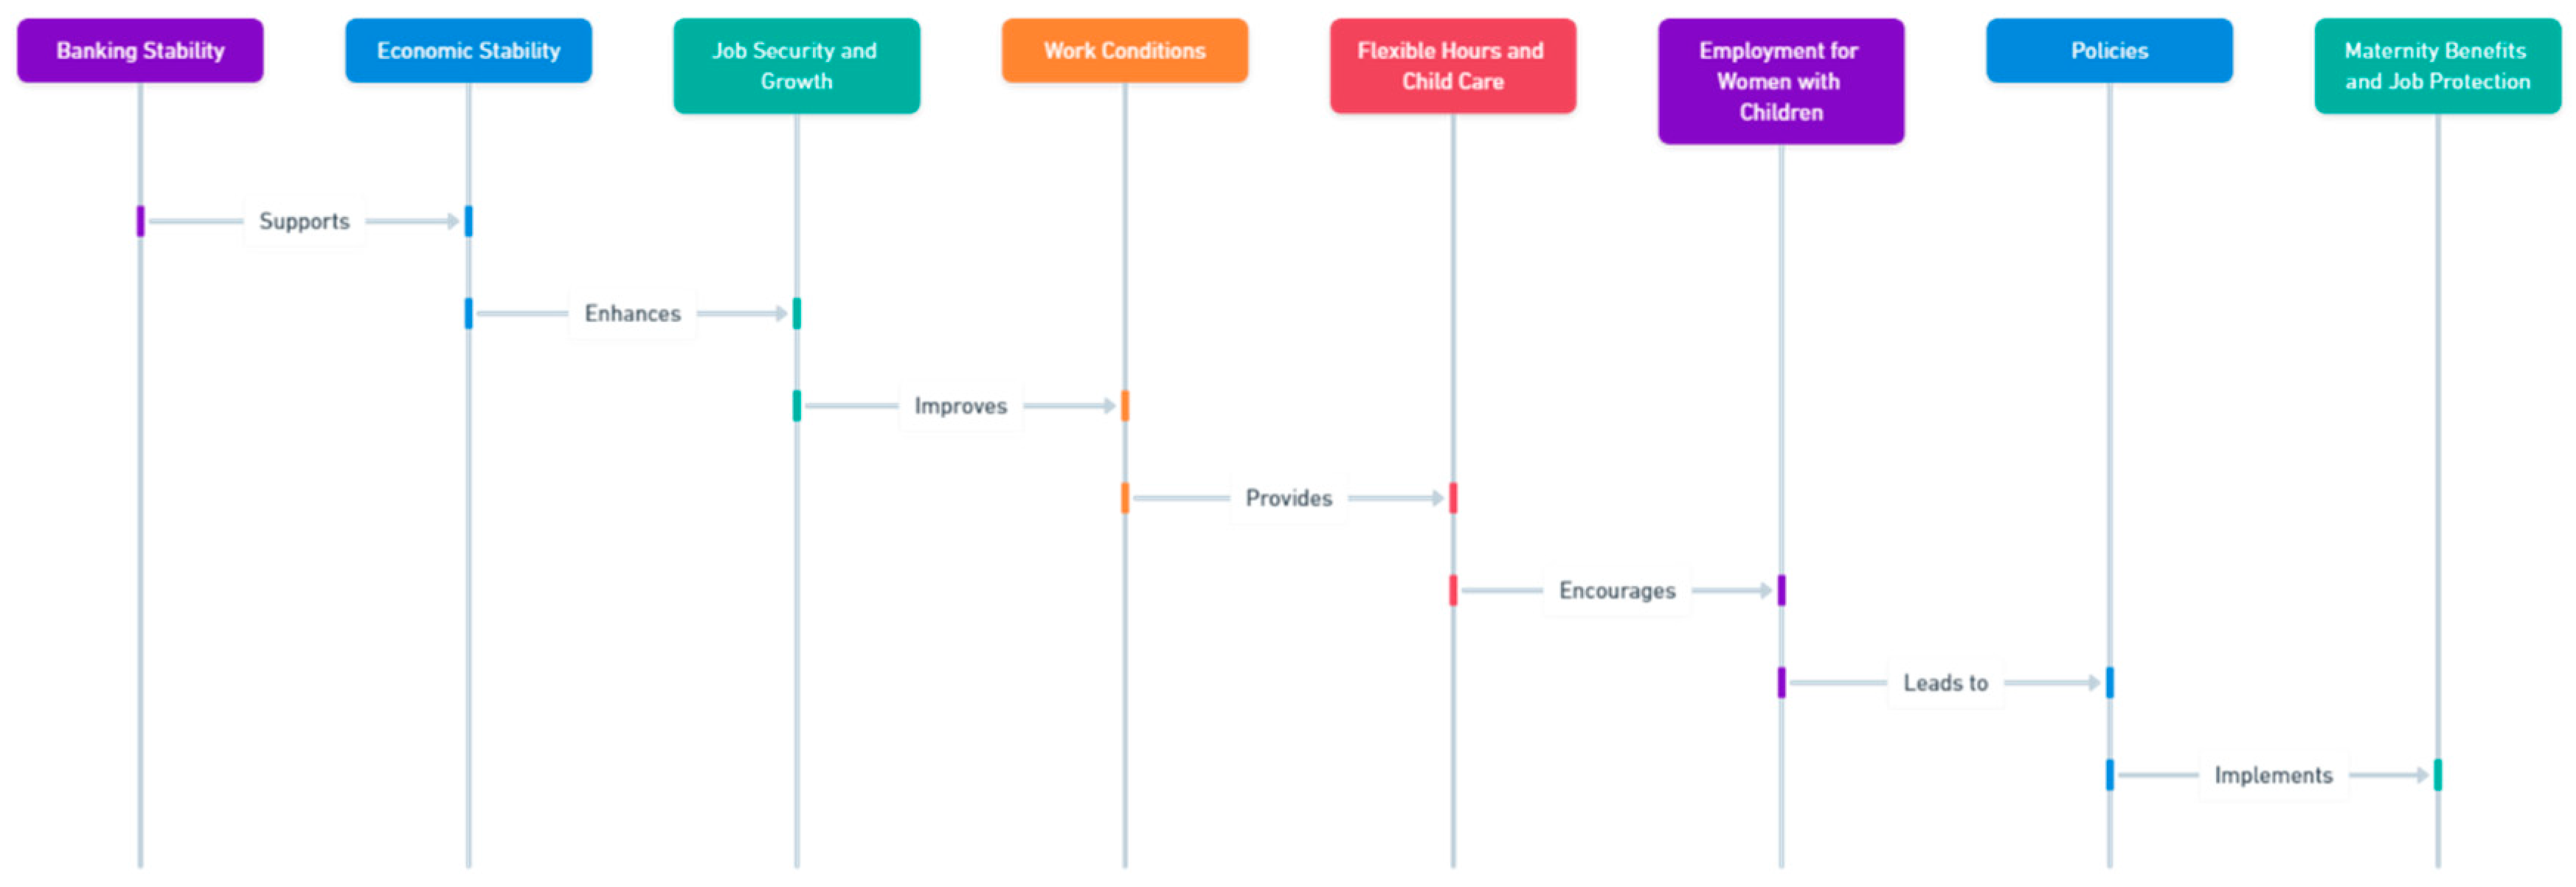
RERW: the relationship between banking stability and the employment rates of women with children can be inferred through broader economic effects, as direct studies on this specific correlation seem limited. Banking stability contributes to overall economic stability, which is crucial for creating and sustaining employment opportunities. Stable economic conditions supported by reliable banking systems can enhance job security and growth, which are beneficial for women with children who require stable employment to manage both work and family life (Metz, 2005). In a stable banking environment, there could be more resources available for creating supportive work conditions that include flexible working hours and child care benefits. These factors significantly affect the ability of women with children to remain in or seek employment (Granleese, 2004). Stronger economic conditions, underpinned by banking stability, can lead to the implementation of policies that support family life, such as maternity benefits and job protection for mothers, which directly encourage higher employment rates among women with children (Noseleit, 2014). These points suggest that while the direct relationship between banking stability and the employment rates of women with children might not be explicitly documented, a stable banking sector likely plays a significant role in fostering favourable economic conditions that support higher employment rates among this demographic (
Figure 13).
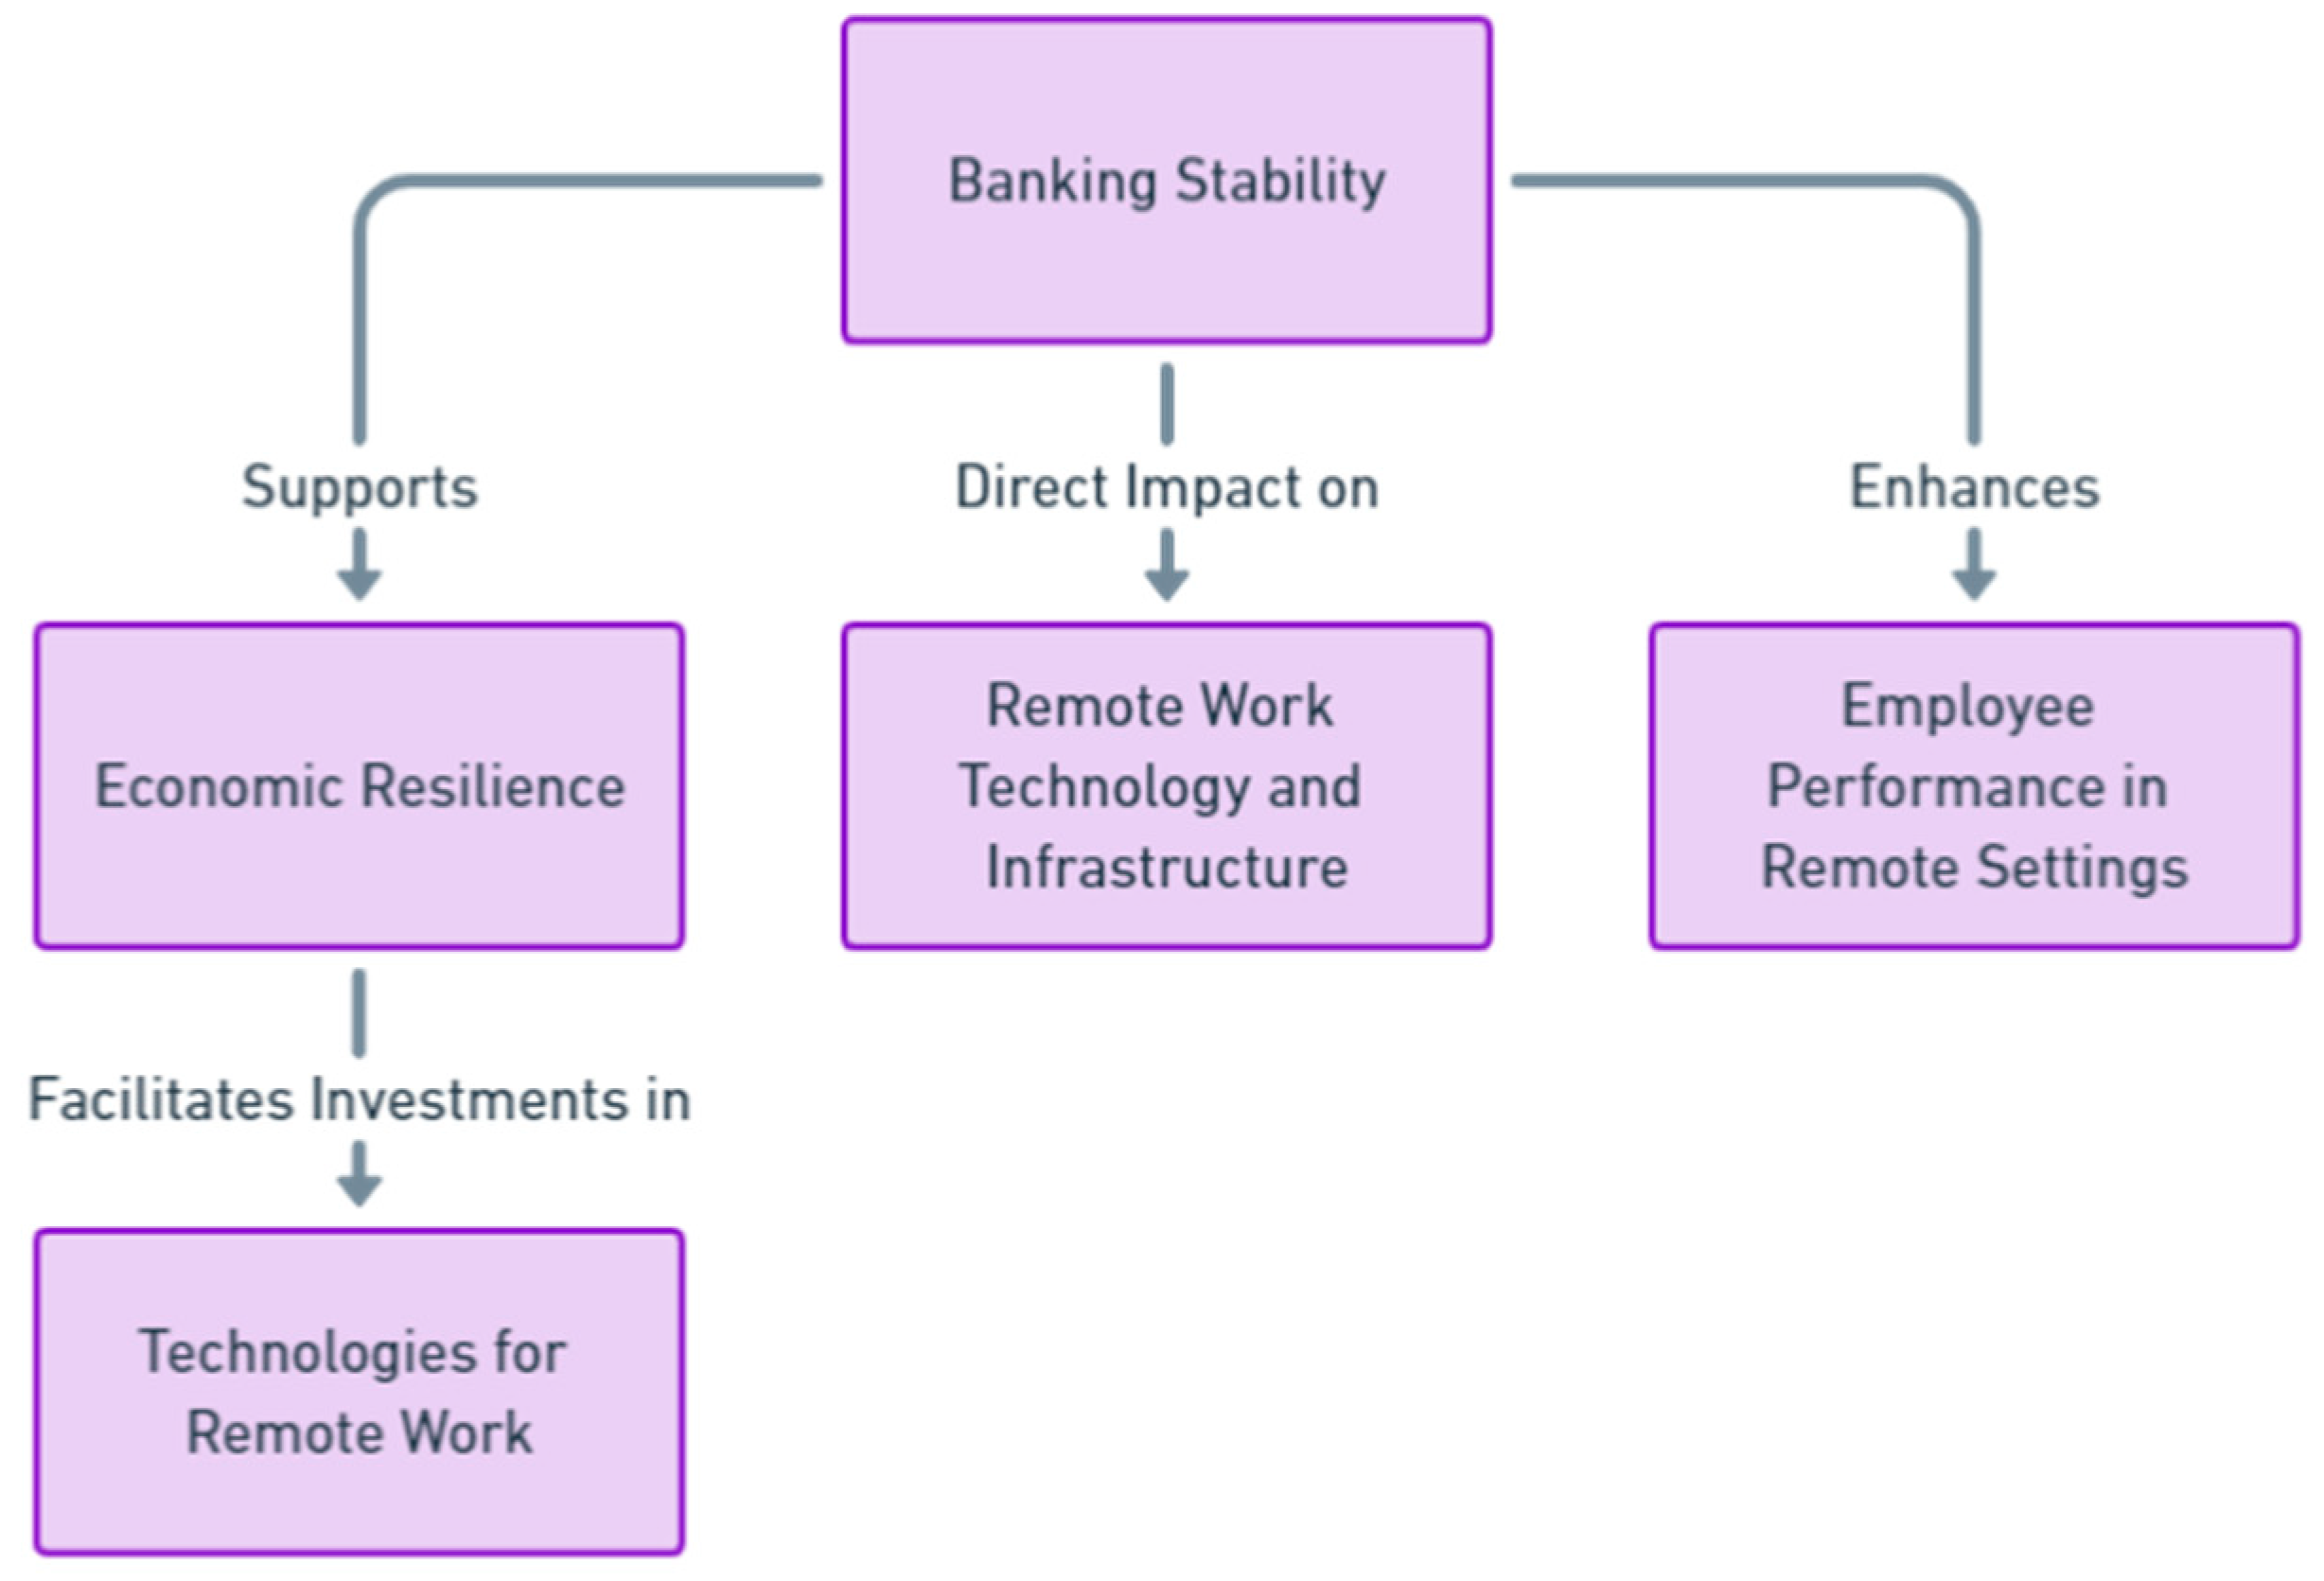
EPWH: the stability of the banking sector is a cornerstone for broader economic resilience and directly impacts the capacity for technological and infrastructural advancements necessary for effective remote work setups. Research conducted by Sarifuddin et al. (2021) during the COVID-19 pandemic highlighted how factors such as authentic leadership and psychological capital within the banking industry play significant roles in optimizing employee performance in remote work settings. Additionally, Jokipii and Monnin (2013) have shown that banking sector stability bolsters the real economy, indirectly facilitating investments in the technologies essential for remote work. Moreover, Prasetyaningtyas et al. (2021) observed that work-from-home practices, supported by stable economic conditions, can enhance productivity within the banking sector. Together, these studies provide both theoretical and empirical evidence that banking stability not only supports economic growth but also creates an environment conducive to the adoption and success of remote work infrastructures, underscoring its pivotal role in adapting to modern work dynamics and sustaining productivity through challenging periods (
Figure 14).
The negative relationship between banking stability and:
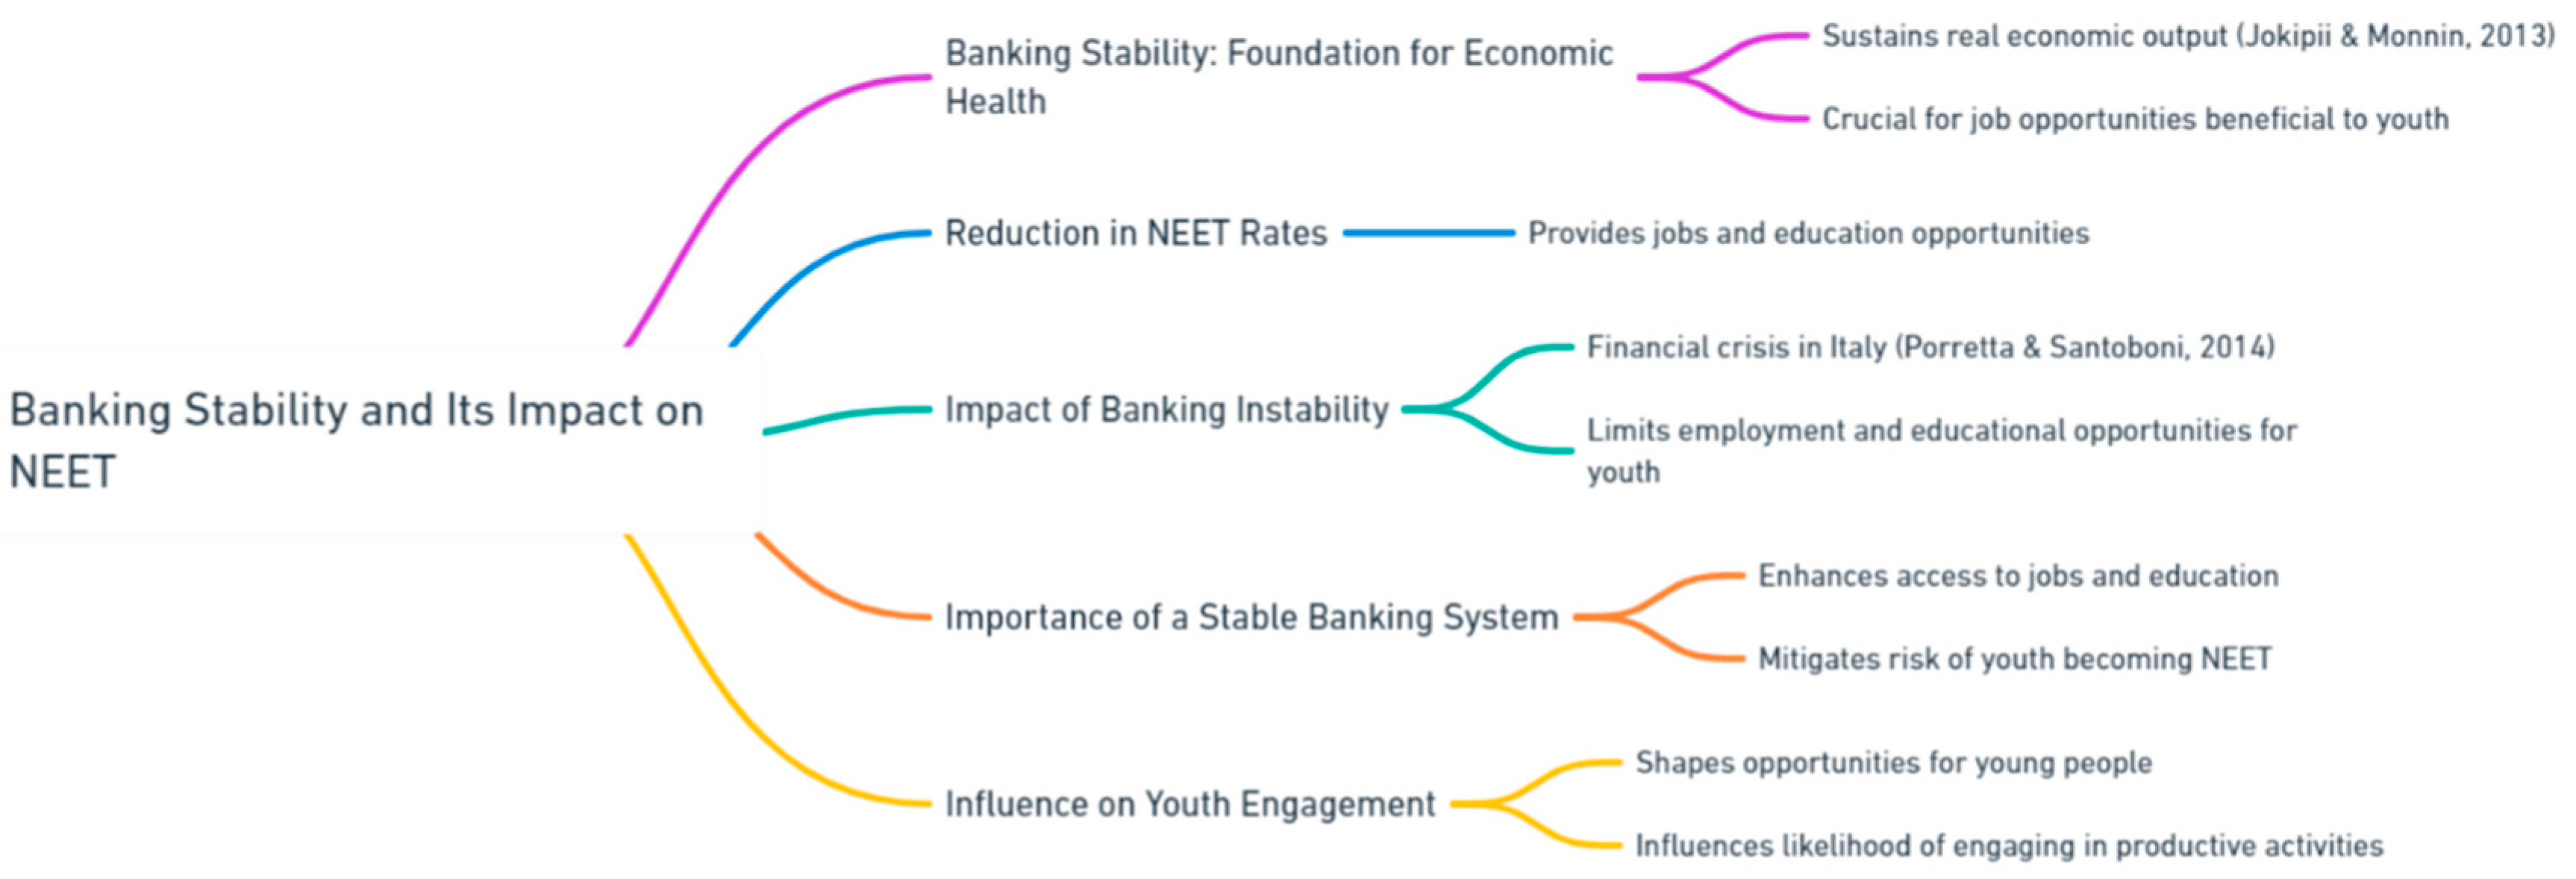
NEET: the relationship between banking stability and the social and economic conditions affecting youth, particularly those not engaged in education, employment, or training (NEET), is substantiated through key studies that explore the broader implications of economic stability. Jokipii and Monnin (2013) provide critical insights into how stability within the banking sector contributes to sustained real economic output. This stability is crucial for maintaining and creating job opportunities beneficial to young individuals entering the workforce, thus potentially reducing NEET rates. Moreover, Porretta and Santoboni (2014) specifically address the repercussions of banking instability during the financial crisis in Italy, demonstrating how such economic turmoil particularly hinders the young population by limiting access to both employment and educational opportunities. Together, these studies underscore the significance of a stable banking system as foundational not only for overall economic health but also for fostering environments where youth have better access to jobs and education, thereby mitigating the risk of becoming NEET. These references collectively argue that banking stability is a pivotal element in shaping the opportunities available to young people, influencing their likelihood of remaining engaged in productive activities (
Figure 15).
SWFR: the relationship between economic stability, including the stability of the banking sector, and various aspects of social well-being, such as satisfaction with friendships, can be inferred through a combination of studies on related topics. Amati et al. (2018) explore the role of friendships in overall life satisfaction, highlighting how both the intensity and quality of friendships contribute to an individual's well-being in Italy, indirectly suggesting that economic factors that support better quality of life could also enhance friendship satisfaction. In the workplace, Winstead et al. (1995) find that the quality of workplace friendships significantly impacts job satisfaction, a factor that can be influenced by the economic and organizational stability provided by stable banking conditions. Additionally, Robert Putnam’s analysis of social capital underscores how economic and community stability, potentially supported by stable banking systems, enhances social networks and community engagement, further affecting social relationships (Putnam, 2000). These studies collectively provide insight into how banking stability might indirectly influence satisfaction with friendship relationships through its impact on economic and social environments, though more direct research would be needed to specifically connect banking stability to changes in social relationship satisfaction (
Figure 16).
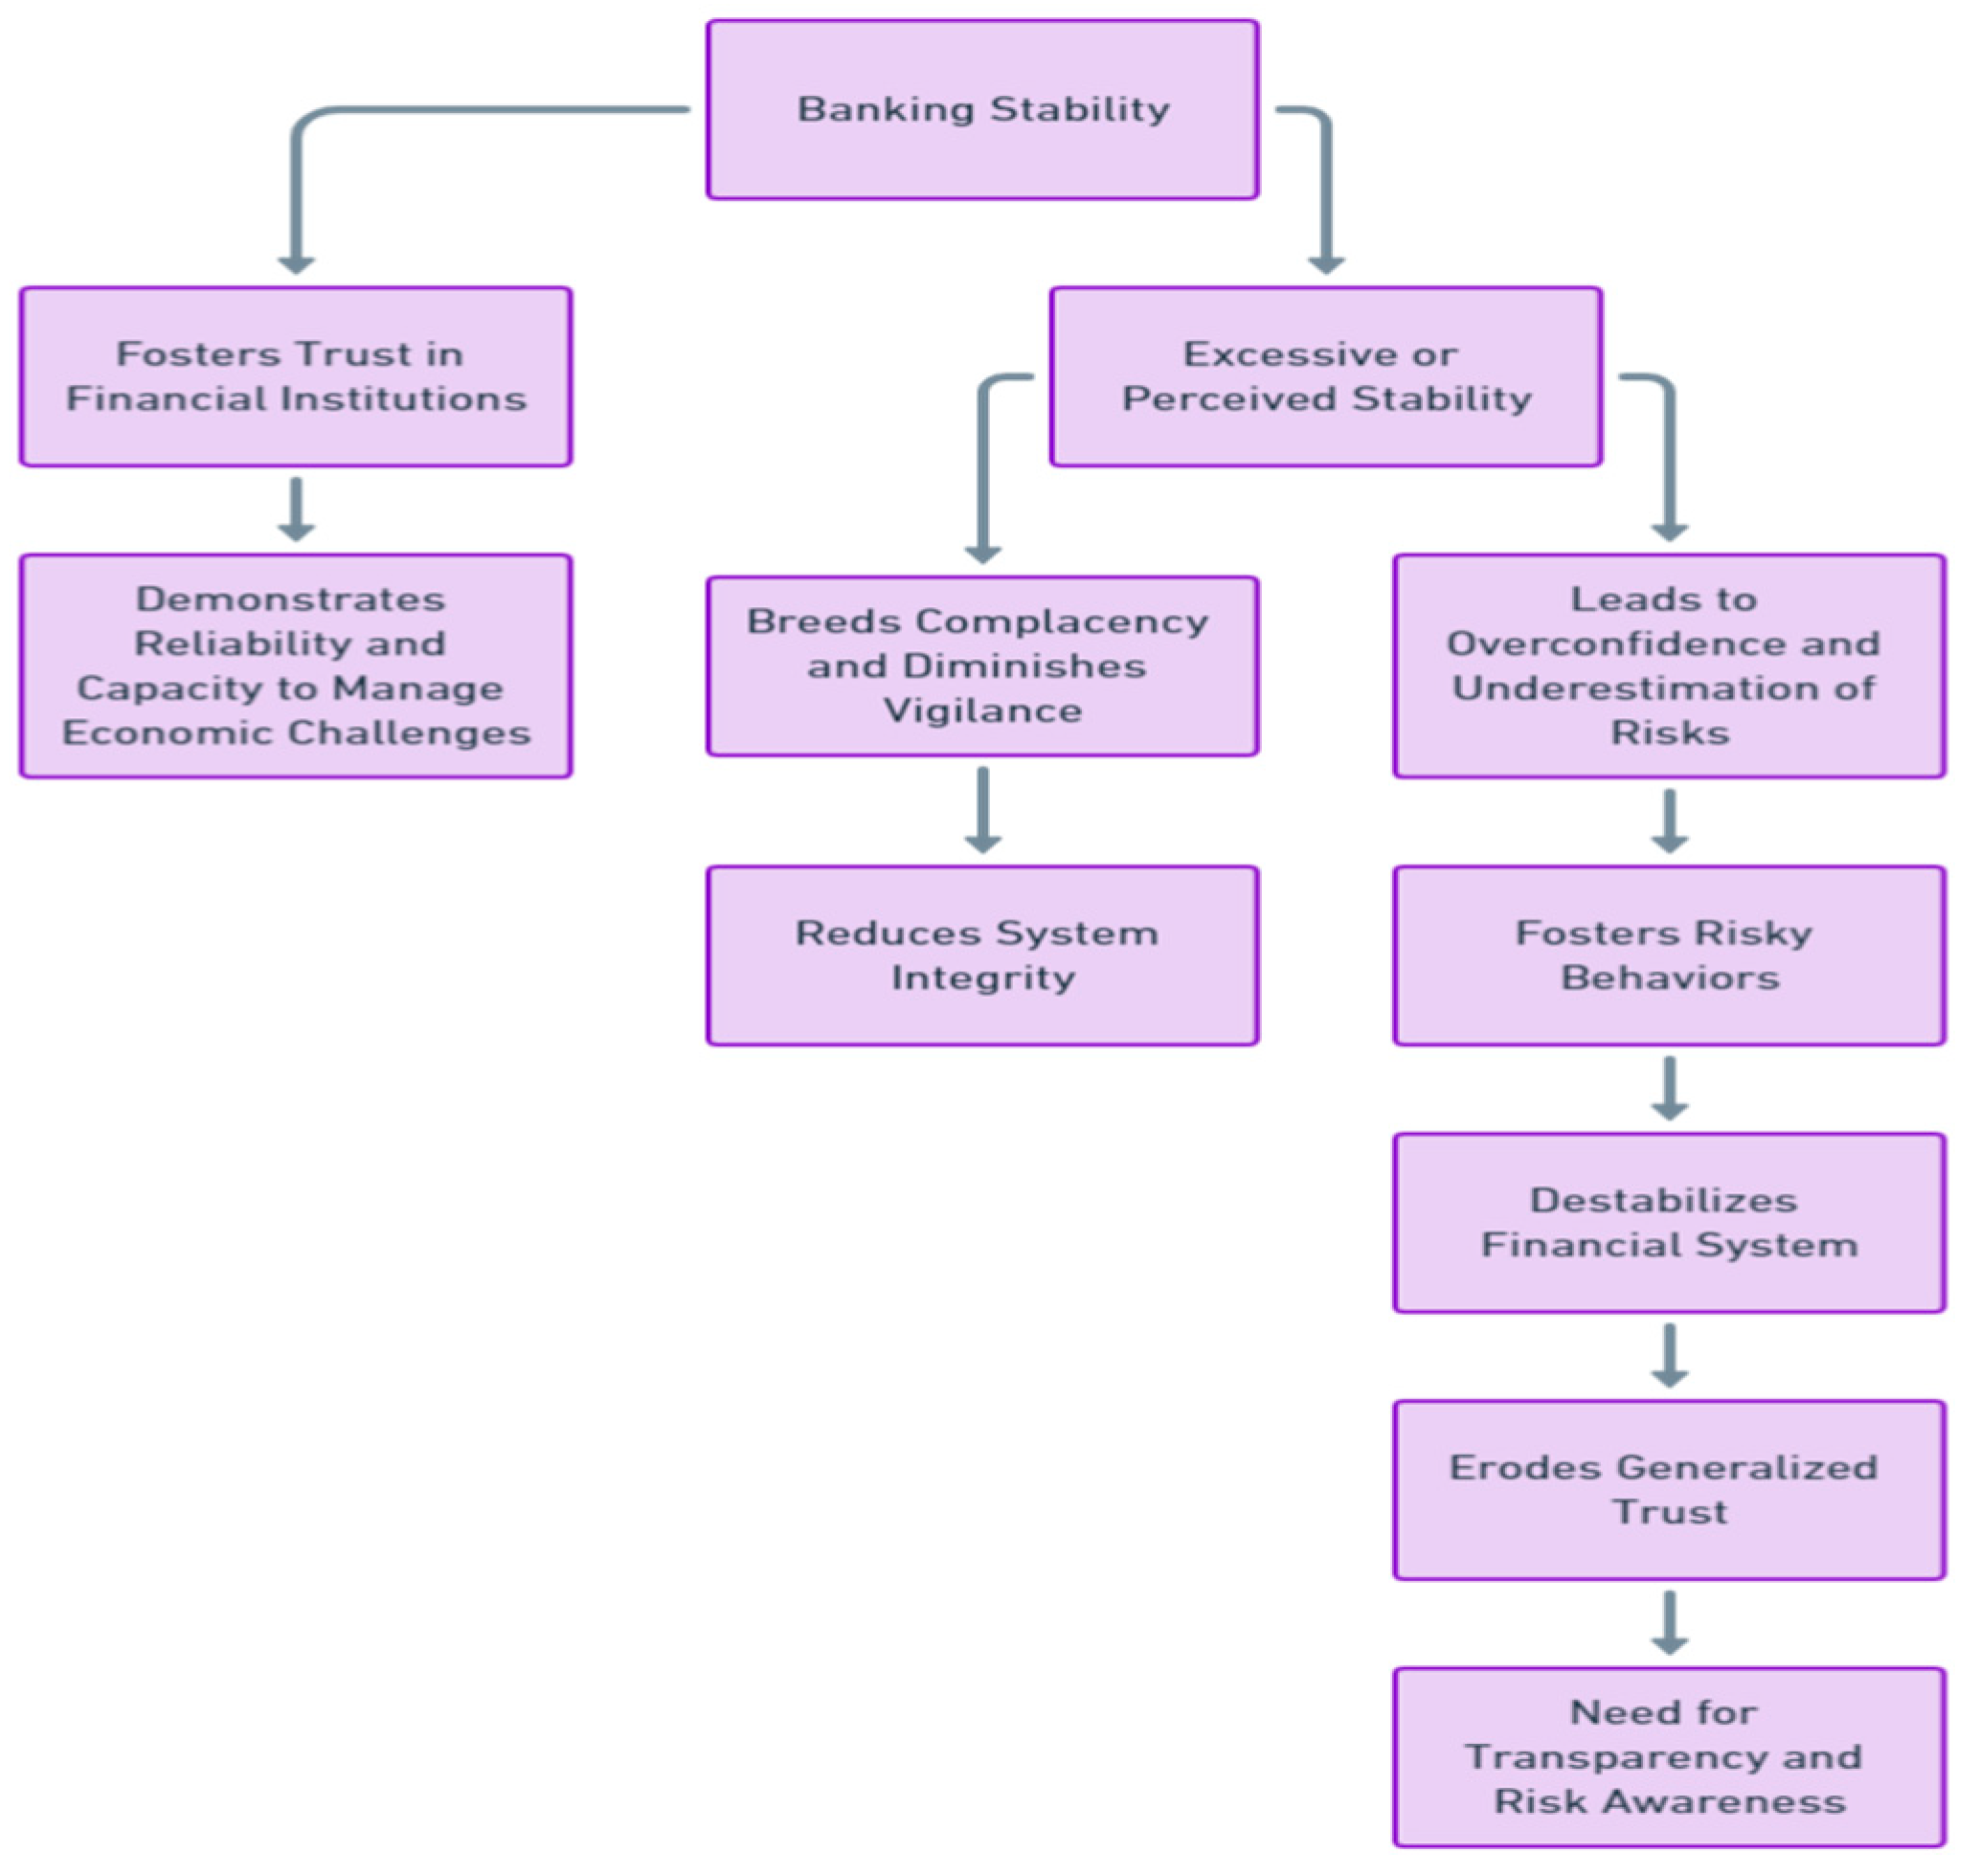
GT: although the search did not directly uncover studies explicitly discussing a negative relationship between banking stability and generalized trust, the topic can be indirectly addressed through the broader implications of how banking stability influences societal trust and public perceptions. Banking stability usually fosters trust in financial institutions by demonstrating their reliability and capacity to manage economic challenges effectively. However, an excessive or perceived stability may breed complacency, diminishing the necessary vigilance and skepticism among banks and their customers, which are essential for maintaining system integrity. Historical financial crises reveal that while stability generally builds trust, the aftermath of instability, following periods of perceived stability, can severely erode it. For example, the global financial crisis of 2008 significantly undermined trust in banking institutions due to the failures that emerged, despite prior perceptions of stability. Furthermore, if banks are seen as overly stable, this might lead to overconfidence and underestimation of risks, fostering risky behaviors that can ultimately destabilize the financial system. This perceived overconfidence can degrade generalized trust as stakeholders might begin to view banks as reckless rather than prudent. These considerations point to a complex interplay between banking stability and generalized trust, suggesting that stability, while generally beneficial, can lead to trust erosion if not managed with sufficient transparency and risk awareness. This nuanced relationship underscores the need for further research to fully understand how banking stability impacts generalized trust in various socio-economic contexts (
Figure 17).
In summary we can underline that there is a generally positive relationship between banking stability and the value of the S-Social component within the ESG model.
6.3. Banking Stability and G-Governance
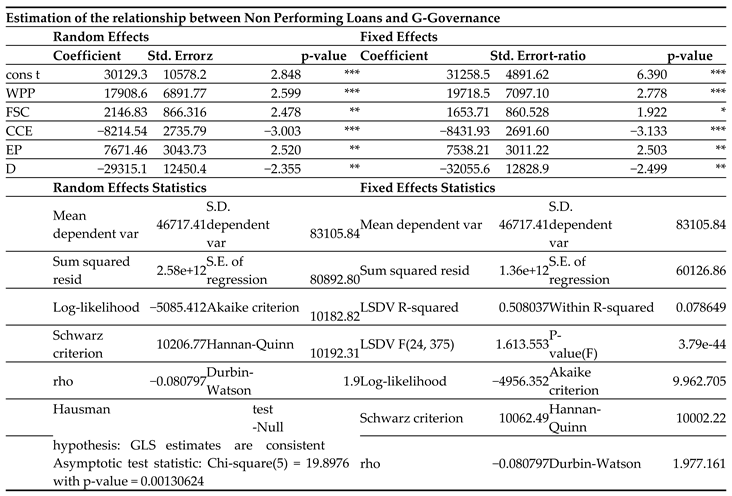
In the following analysis, we take into consideration the relationship between non-performing loans and some variables relating to the G-Governance component of the ESG model. The data refers to the Italian regions between 2004 and 2023. A negative relationship is established between the value of Non-Performing Loans and banking stability. Specifically, we estimated the equation shown below:
where i=20 and t=[2004; 2023]. The results are shown in the
Table 4 below.
Banking stability is positively associated to:
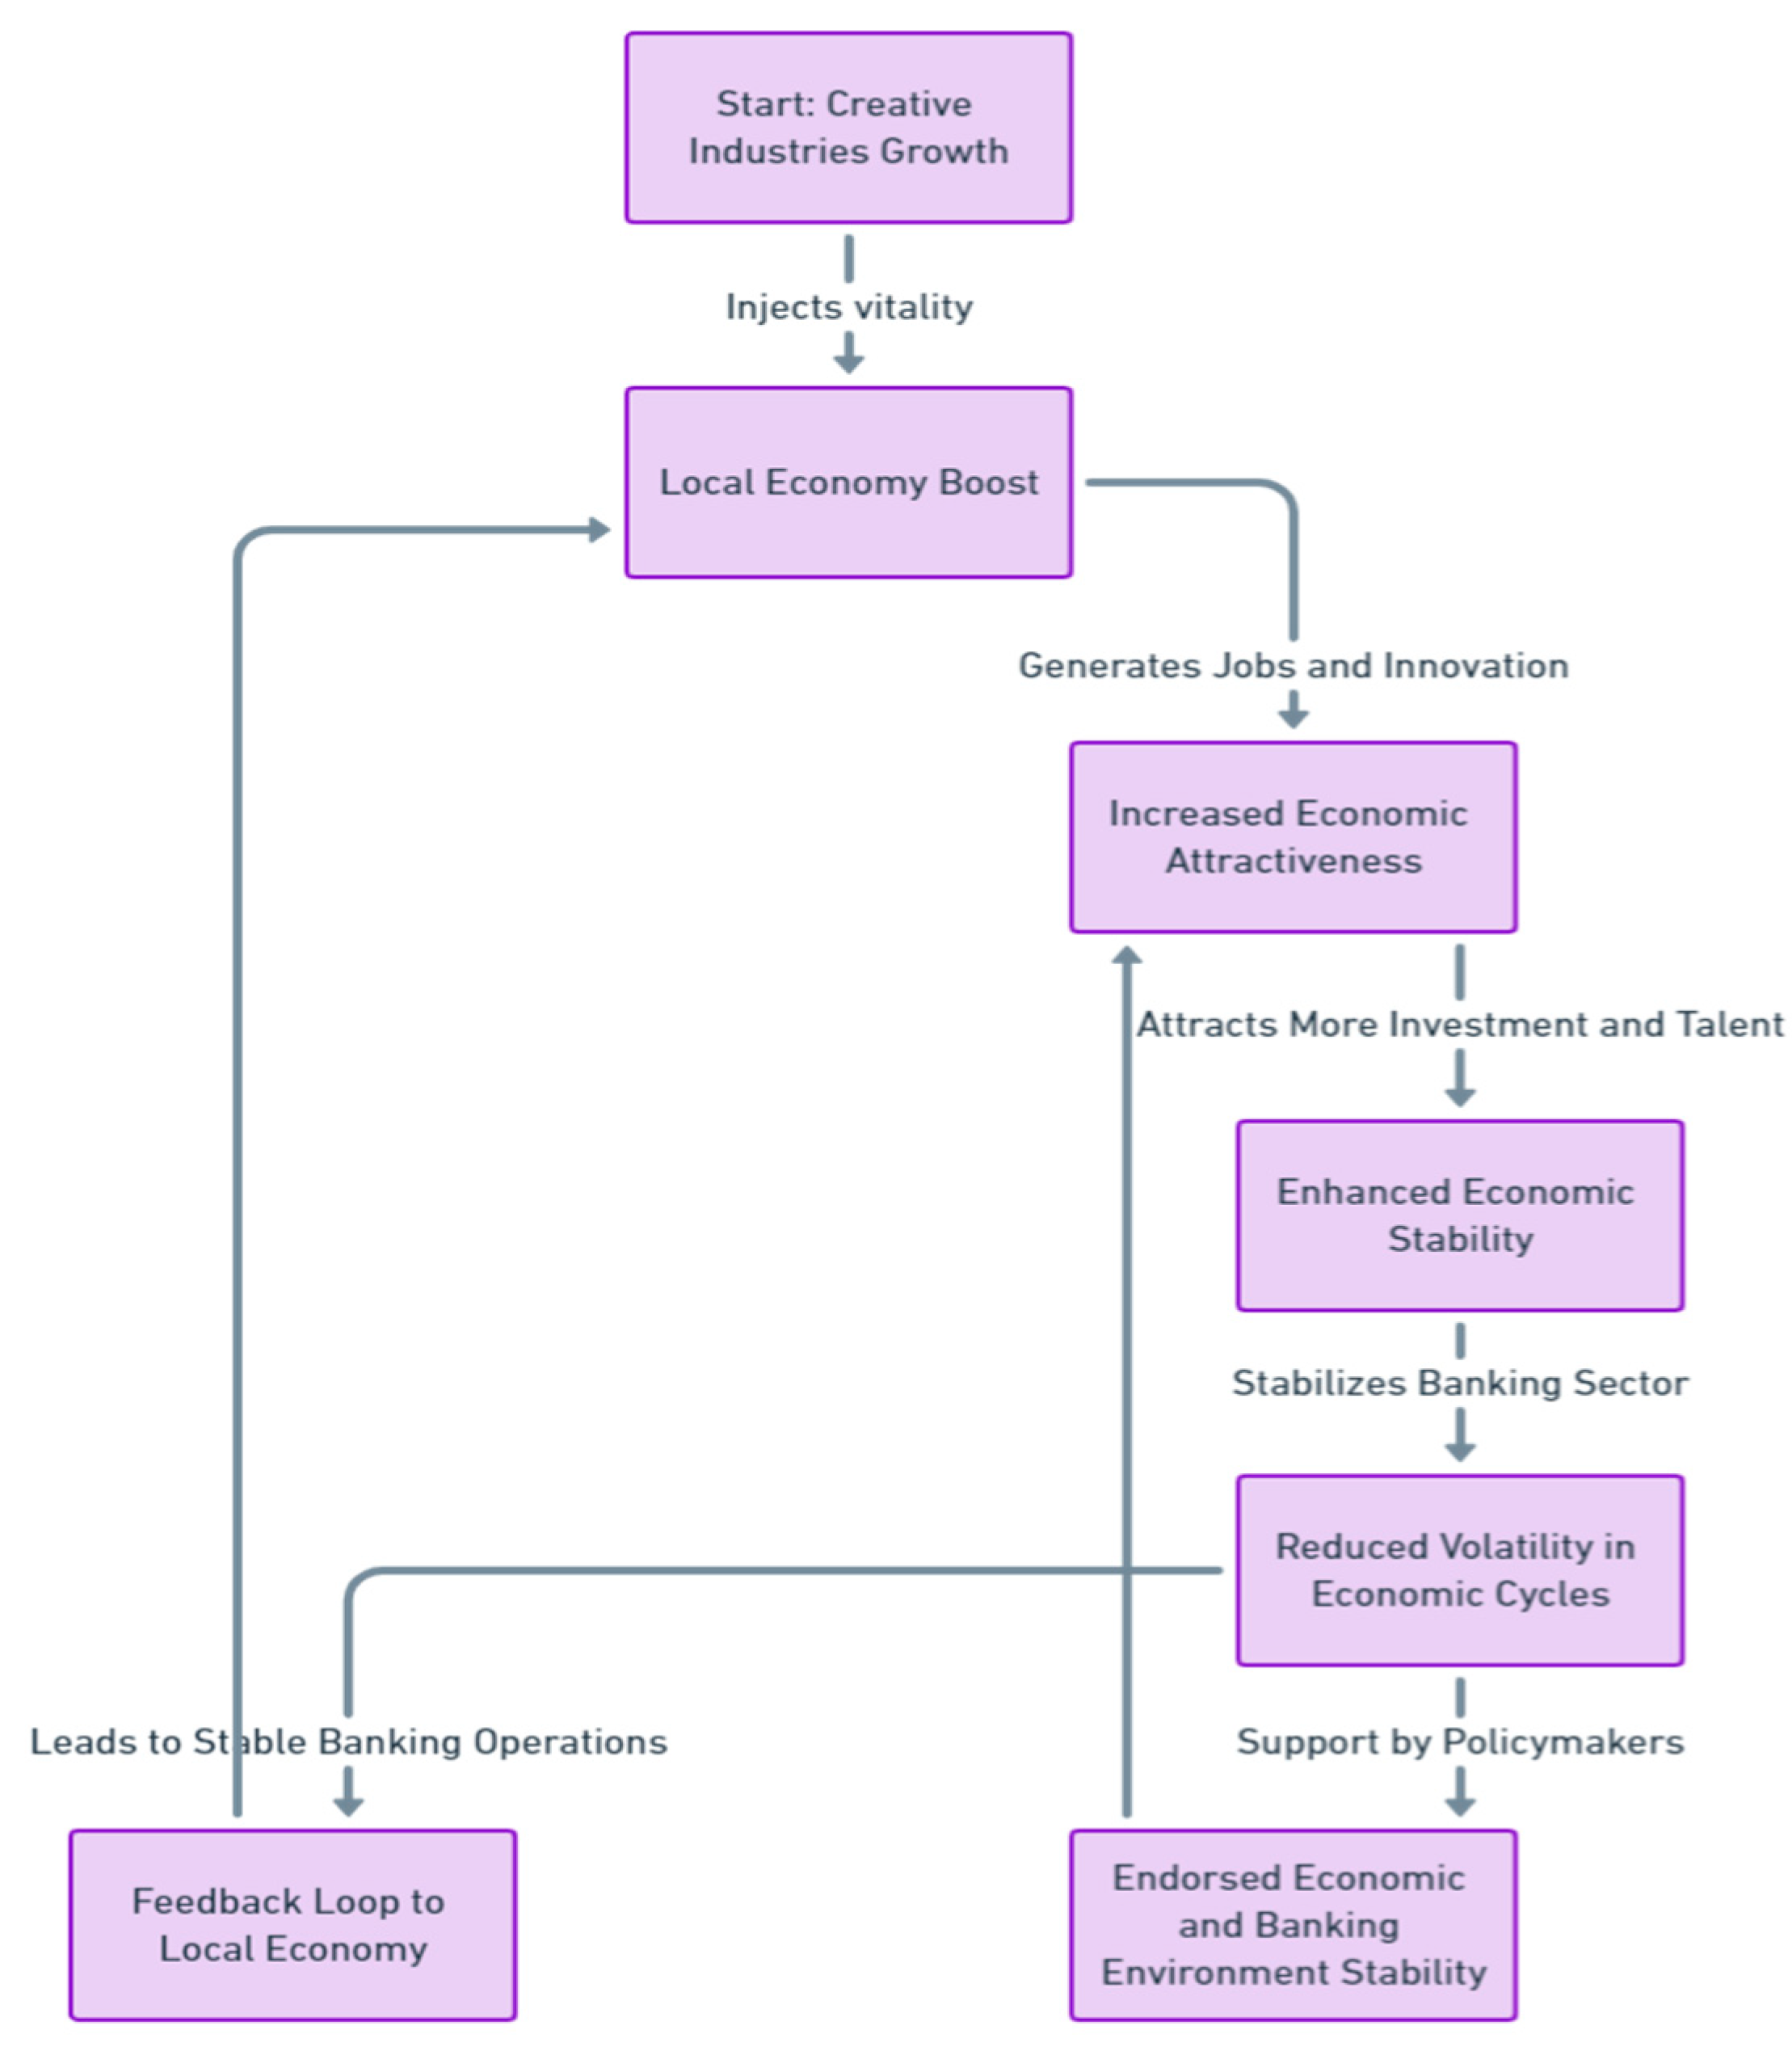
CCE: our findings are coherent with that of Marco-Serrano et al. (2014). Their research highlights the significant role that the creative industries play as catalysts for economic growth, particularly through the creation of a positive feedback loop between employment in these sectors and regional economic prosperity. The creative sectors, encompassing industries like art, media, and design, inject vitality into local economies. By generating new job opportunities and fostering innovation, these industries not only contribute to the cultural richness of a region but also to its economic dynamism. This process supports broader economic stability which, in turn, underpins banking stability. The study points out that as cultural and creative industries thrive, they increase the economic attractiveness of a region. This, in turn, attracts more investment and talent to the area, which further stimulates the local economy. The increased economic activity enhances the stability and growth of local banking sectors, as banks see an uptick in deposits and investment opportunities. The enhanced economic environment, buoyed by the thriving cultural and creative sectors, leads to greater economic stability. This stability is beneficial for the banking sector as it reduces the volatility in economic cycles, leading to more predictable and stable banking operations. The findings suggest that policymakers should consider supporting the cultural and creative industries as part of economic development strategies. By doing so, they not only enrich the cultural landscape but also create a more resilient and stable economic and banking environment (
Figure 18).
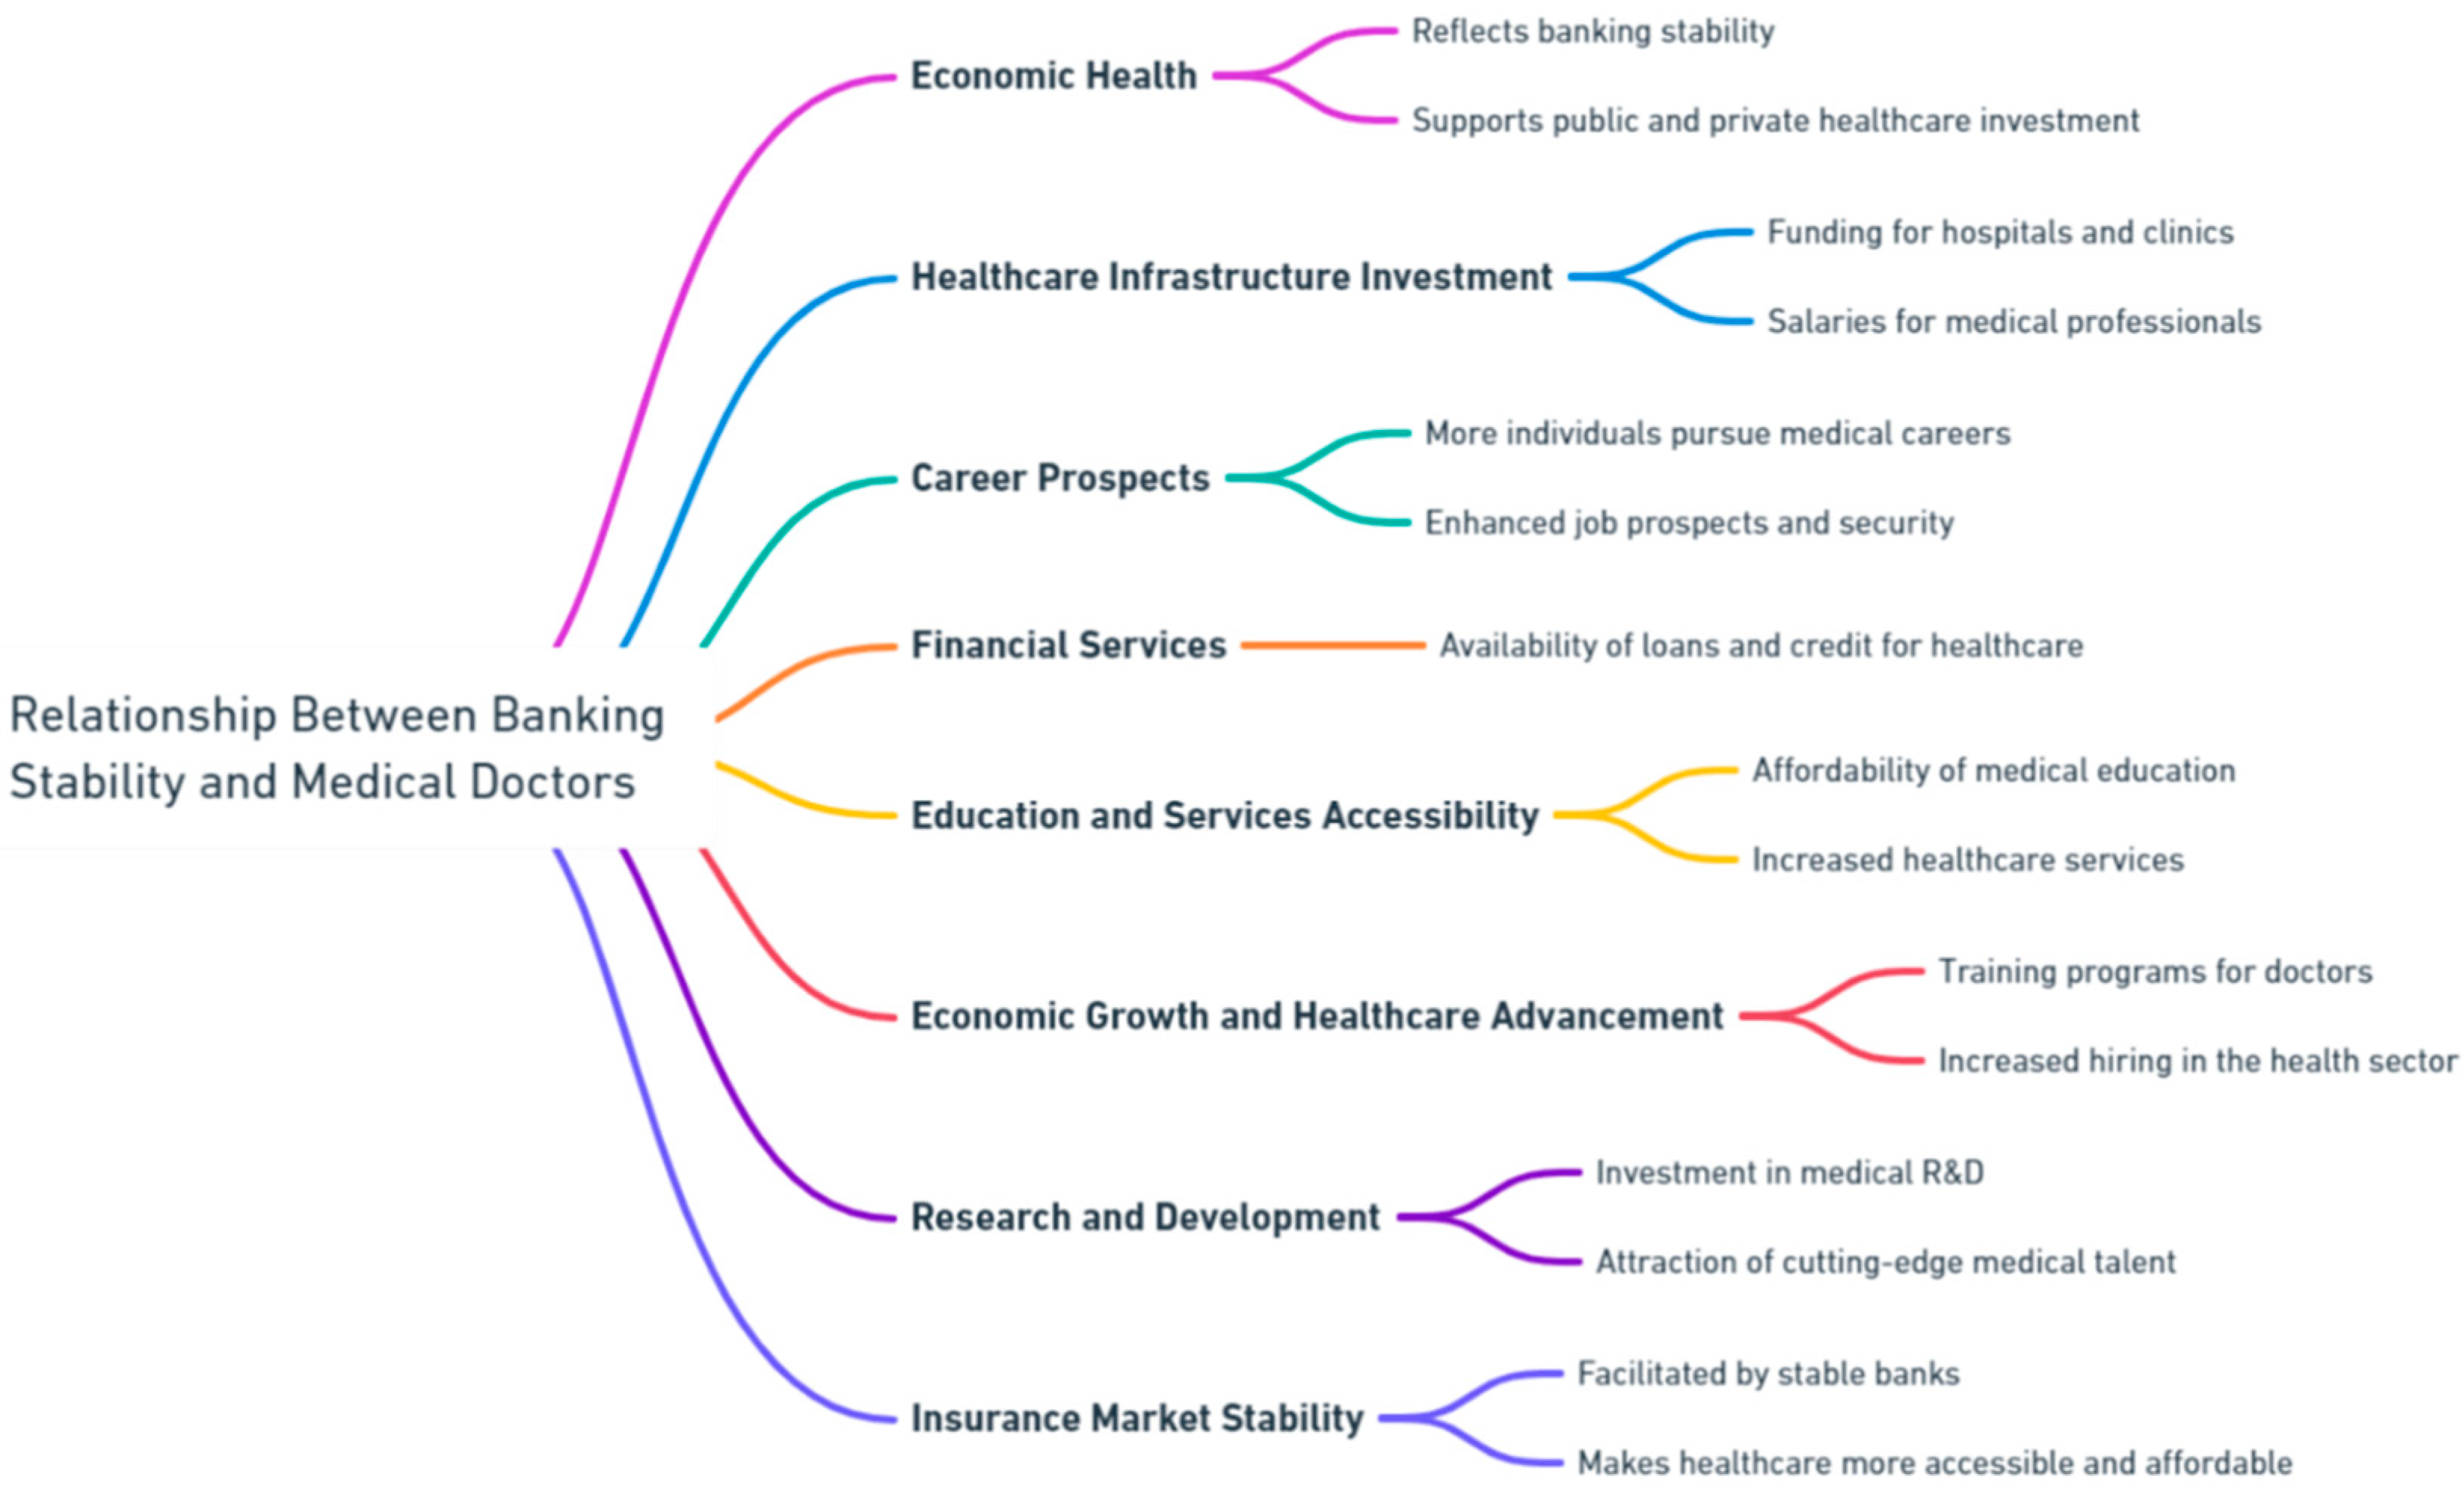
D: the relationship between banking stability and the number of medical doctors in a region can be complex and multidimensional. Banking stability often reflects broader economic health, which can mean more public and private investment in healthcare infrastructure. This includes hospitals, clinics, and salaries for medical professionals. With better funding, more individuals might pursue medical careers due to better job prospects and security. Stable banking systems can enhance the availability of financial services, including loans and credit for healthcare needs. This can enable more people to afford medical education and healthcare services, thereby potentially increasing the number of medical professionals and improving health outcomes. In regions where the economy, underpinned by a stable banking sector, grows robustly, there tends to be more emphasis on advancing healthcare services as part of enhancing the quality of life. This can lead to more training programs for doctors and increased hiring in the health sector. Financial stability allows for greater investment in research and development in the medical field. This can attract more doctors and researchers to the area, interested in cutting-edge medical technology and treatments. Banks and financial institutions often work closely with insurance companies. A stable banking system can facilitate a robust insurance market, which in turn can make healthcare more accessible and affordable, encouraging a healthier population and a more vibrant medical profession (
Figure 19).
Banking stability is negatively associated to:
WPP: women in parliament might push for more stringent regulations on financial institutions to ensure stability and protect consumers. This could be perceived as negative by the banking sector if it leads to increased costs or limits on their operations. There could be perceptions or biases suggesting that women might prioritize social or ethical dimensions over economic performance, which could be viewed negatively by markets or investors focused on short- term financial metrics. A study by Del Prete and Stefani (2013) discusses the representation of women on Italian bank boards, noting that banks with women in top decision-making positions often exhibit less risky credit policies. This is attributed to a potential higher risk aversion among women, which could align with advocating for stringent regulations for long- term stability, albeit this doesn't directly address the negative impacts on banking flexibility or competitiveness. Another study investigating the effects of gender diversity on the risk profiles of Italian banks finds that banks led by women tend to be less risky, which again suggests a possible inclination towards conservative financial practices that may not be favored in more aggressive competitive markets (Menicucci & Paolucci, 2021). (
Figure 20).
FSC: the negative relationship between banking stability and the fear of crime is intriguing and involves psychological, societal, and economic dimensions. When fear of crime is prevalent in a society, it can lead to broader economic and social consequences that indirectly impact banking stability. Fear of crime can lead to decreased consumer confidence, as individuals may choose to avoid certain transactions or limit their movement to safer areas, directly affecting retail and commercial banking sectors. Reduced consumer spending can slow economic growth, which in turn can affect the stability of banks dependent on robust economic activity. High crime rates or the fear of crime can deter investment in affected areas. This can lead to lower property values and decreased business activities, affecting the collateral value on loans and overall investment returns for banks. Banks operating in high- crime areas might see a degradation in asset quality if businesses fail or property values decline. Banks in areas with high crime rates might need to spend more on security measures to protect their physical branches, staff, and ATMs. This increase in operational costs can reduce profitability and strain resources that could otherwise be used for business development or innovation. In extreme cases, persistent fear of crime can lead to a lack of trust in public institutions, including banks. This can trigger bank runs or financial panic, especially if people believe that their money is not safe in a banking institution due to security concerns or potential financial instability fueled by crime. As a response to crime fears, banks might alter their practices, including tightening credit, increasing interest rates to compensate for higher perceived risks, or even withdrawing from high-risk areas. These changes can negatively impact local economies and further contribute to the instability of the banking sector in those regions. These relationships are also reported in the scientific literature. Shi- Qi Liu et al. (2019) discuss the impact of consumer confidence on financial stability in China. They find that improved consumer confidence supports the stability of the financial market, which is crucial during periods of economic uncertainty. This study suggests that consumer sentiment, which could be affected by fear of crime, plays a critical role in maintaining financial stability (Liu, Qi, Qin, & Su, 2019). A study by Stafford et al. (2007) indicates that fear of crime is associated with poorer mental health and reduced physical functioning, which can lead to decreased consumer engagement in various activities. This reduction in consumer activity could indirectly impact economic growth and banking stability, as people might limit their financial transactions or investments in areas perceived as unsafe. Jokipii and Monnin (2013) explore how banking sector stability influences real output growth. Their findings indicate that banking stability is crucial for sustaining economic growth, which could be jeopardized by widespread fear of crime leading to economic downturns and reduced banking stability. Rosenfeld and Fornango (2008) discuss how economic perceptions (e.g., consumer sentiment) significantly impact crime rates, including robbery and property crime, independent of actual economic conditions. This relationship highlights how fear of crime, influenced by economic perceptions, could indirectly affect banking stability by altering consumer behavior and economic conditions (
Figure 21).
EP: the relationship between banking stability and elderly people treated in integrated home care is not immediately intuitive and does not inherently suggest a direct negative connection. However, exploring potential indirect impacts or broader economic implications can shed some light on how these two aspects could intersect negatively under certain conditions. Integrated home care for the elderly, which often involves comprehensive medical and social services delivered at home, can be expensive. As populations age and more people require such services, the financial burden on public and private health insurance systems, including pensions and savings, increases. If these costs are not managed effectively, there could be broader economic repercussions, including increased taxes or insurance premiums. These changes can affect consumer spending and savings behaviors, which are integral to banking stability. Banks might face challenges if there is a general reduction in savings or if significant resources are redirected towards healthcare costs. Elderly individuals receiving integrated home care might need to use a significant portion of their savings or divert their investments to cover healthcare costs. This reduction in deposits and investments can impact banks' liquidity and their ability to lend, potentially leading to a less stable banking environment. If government spending shifts significantly towards supporting integrated home care and other healthcare services for the elderly, there might be less investment in other areas, including economic development initiatives that can indirectly support banking stability. Furthermore, increased government borrowing to fund these initiatives could affect national debt levels and economic stability, factors closely watched by banks and investors. As more elderly people opt for integrated home care, there could be demographic shifts in certain areas, impacting local economies. Areas with a higher dependency ratio (more non-working people compared to working-age people) might see reduced economic activity. Banks in these regions could face challenges related to reduced demand for loans and financial services, impacting their profitability and stability. A significant allocation of resources towards caring for the elderly, especially in societies with rapidly aging populations, can impact long-term economic growth. Slower growth can affect job creation, wages, and ultimately, the financial health of banks due to decreased lending opportunities and higher risks of loan defaults. These ideas are also present in the relevant scientific literature. A study by Landi et al. (2001) found that an integrated home care program for the elderly significantly reduced hospitalizations, suggesting cost savings which could indirectly benefit economic stability including the banking sector, by potentially reducing the healthcare burden. Lebrett et al. (2017) investigated the economic impact of palliative care among elderly cancer patients, showing cost savings from early palliative care integration, which could alleviate economic pressures on healthcare systems and indirectly support banking stability by maintaining consumer financial health. Research by Doerr et al. (2020) explored how population aging influences banking, revealing that higher savings by seniors lead to an increase in bank deposits and credit supply but also an increase in risk-taking. This indicates that aging populations could affect banking stability through changes in savings patterns and risk profiles (
Figure 22).
In summary, we can underline that there is a generally negative relationship between banking stability and the value of the G-Governance component within the ESG model.
7. Economic Policies to Reduce the Value of Non-Performing Loans and Increase Banking Stability in the Italian Regions
Reducing the value of non-performing loans (NPLs) and increasing banking stability in the Italian regions requires a heterogeneous approach that addresses both macroeconomic and microeconomic factors.
Asset Quality Reviews (AQRs) and Stress Tests. Asset Quality Reviews (AQRs) and Stress Tests play a crucial role in assessing the health of banks' balance sheets and identifying potential vulnerabilities. AQRs involve a thorough examination of banks' assets, including loans and investments, to ensure their quality and accuracy in valuation. This process helps uncover any hidden risks or weaknesses that may not be immediately apparent, particularly regarding non-performing loans (NPLs). By conducting AQRs, regulators and policymakers gain valuable insights into the true extent of NPLs within the banking system, allowing for a more accurate assessment of systemic risks and vulnerabilities. Stress tests, on the other hand, simulate adverse economic scenarios to evaluate banks' resilience under adverse conditions. By subjecting banks to hypothetical scenarios, such as economic downturns or market shocks, stress tests reveal how well-equipped they are to withstand various stressors, including the impact of high NPL levels. Together, AQRs and stress tests provide a comprehensive picture of the banking sector's health, enabling regulators to identify weaknesses, implement corrective measures, and formulate targeted interventions to address NPLs effectively.
Enhanced Regulatory Oversight. Strengthening regulatory oversight is pivotal in ensuring the soundness and stability of the banking sector, particularly concerning the proper classification and provisioning for Non-Performing Loans (NPLs). This entails implementing a robust framework of rules and standards that govern banks' practices in identifying, reporting, and managing NPLs. To achieve this, regulators may opt for stricter enforcement of existing regulations, intensifying monitoring mechanisms, and imposing more stringent penalties for non-compliance. Additionally, introducing new measures tailored to mitigate the accumulation of NPLs is imperative. This could involve setting stricter criteria for loan origination, such as enhanced credit risk assessments and loan- to-value ratios, to prevent the issuance of loans with higher default probabilities. Moreover, implementing guidelines for early detection and proactive management of potential NPLs can help banks address issues at an early stage, reducing the likelihood of loans deteriorating into non-performing status.
|
Asset Management Companies (AMCs). Asset Management Companies (AMCs) play a crucial role in addressing the challenge of Non-Performing Loans (NPLs) by providing a dedicated platform for the efficient resolution of distressed assets. Establishing or bolstering AMCs is instrumental in facilitating the transfer of NPLs from banks' balance sheets, thereby relieving them of the burden of managing these problematic loans. AMCs are uniquely positioned to handle NPLs with expertise and agility, as they can focus solely on the task of resolving these assets. By consolidating NPLs under one entity, AMCs can streamline the resolution process, employing various strategies such as debt restructuring, asset monetization, or loan portfolio sales. Moreover, AMCs have the flexibility to engage with investors and potential buyers to offload NPLs at discounted rates, thereby minimizing losses for banks and injecting liquidity back into the financial system. Additionally, AMCs can leverage their specialized knowledge and resources to implement innovative solutions for resolving NPLs, including workout arrangements with borrowers or pursuing legal avenues for asset recovery. Debt Restructuring and Workouts. Debt restructuring and workouts serve as vital mechanisms for resolving Non-Performing Loans (NPLs) by facilitating negotiations between banks and borrowers to reach mutually beneficial agreements outside of formal insolvency proceedings. Promoting debt restructuring initiatives involves incentivizing banks and borrowers to engage in constructive dialogue aimed at restructuring loan terms to make them more manageable for distressed borrowers. By offering flexible repayment schedules, reduced interest rates, or principal forgiveness, banks can help alleviate the financial strain on borrowers and increase the likelihood of loan repayment. Furthermore, providing incentives for banks to restructure loans, such as offering equity stakes in distressed companies, can incentivize them to proactively address NPLs and explore alternative resolution strategies. This approach not only aligns the interests of banks with those of borrowers but also encourages a collaborative effort to find sustainable solutions to financial distress.
Legal and Judicial Reforms. Legal and judicial reforms are indispensable in expediting the resolution of Non-Performing Loans (NPLs) by enhancing the efficiency and effectiveness of the legal system. Improving the legal framework involves streamlining court procedures to reduce delays and inefficiencies in the resolution of NPL-related cases. This could entail introducing specialized courts or tribunals dedicated to handling insolvency and debt recovery matters, thus ensuring that cases are adjudicated in a timely manner by judges with expertise in financial law. Additionally, enhancing the enforcement of collateral rights is critical for facilitating faster loan recovery and minimizing losses for lenders. This may involve strengthening legal mechanisms for the enforcement of security interests, such as mortgages or pledges, thereby enabling creditors to seize and liquidate collateral in the event of default. Moreover, introducing alternative dispute resolution mechanisms, such as mediation or arbitration, can provide a more expedient and cost-effective means of resolving NPL- related disputes outside of formal court proceedings.
|
Credit Guarantee Schemes. Credit Guarantee Schemes serve as instrumental tools in fostering access to finance for small and medium-sized enterprises (SMEs) while mitigating the risk for lenders. Introducing or expanding credit guarantee schemes involves establishing mechanisms whereby governments or specialized agencies provide guarantees to banks or other financial institutions against potential losses on loans extended to SMEs with higher credit risk profiles. By offering these guarantees, credit guarantee schemes incentivize lenders to extend financing to SMEs that may otherwise struggle to access credit due to perceived credit risks. This initiative not only promotes the growth and development of SMEs, which are vital engines of economic growth and job creation, but also contributes to the overall health and resilience of the financial system. By reducing the risk exposure of lenders, credit guarantee schemes encourage banks to expand their lending activities to a broader range of borrowers, including those with limited collateral or track records. This, in turn, enhances the flow of credit to viable businesses, enabling them to invest in growth opportunities, innovation, and job creation.
|
Promoting Economic Growth. Promoting economic growth requires a concerted effort to implement policies that stimulate investment, innovation, and entrepreneurship across Italian regions. Infrastructure investment stands as a cornerstone, with strategic funding directed towards the development of transportation networks, energy systems, and digital infrastructure. By modernizing infrastructure, businesses gain improved access to markets and resources, driving productivity gains and fostering economic activity. Furthermore, tax incentives tailored to businesses can incentivize investment and expansion, spurring job creation and revenue generation. These incentives may include tax credits for research and development, investment allowances, or reduced corporate tax rates, all of which stimulate business investment and innovation. Additionally, fostering a supportive environment for entrepreneurship through targeted support programs and access to financing can unleash the potential of small businesses and startups, driving job creation and economic dynamism. By nurturing a thriving ecosystem of innovation and entrepreneurship, Italian regions can diversify their economies, attract investment, and create new opportunities for growth.
Financial Education and Consumer Protection. Enhancing financial education initiatives and consumer protection measures is paramount in preventing the accumulation of Non-Performing Loans (NPLs) by households, thereby fostering financial stability and resilience. By expanding financial education initiatives, governments and financial institutions can empower individuals with the knowledge and skills necessary to make informed financial decisions. This may include providing resources, workshops, and online courses on topics such as budgeting, saving, investing, and debt management. Additionally, consumer protection measures play a crucial role in safeguarding individuals from predatory lending practices and ensuring transparency in financial transactions. This may involve enacting regulations that mandate clear and concise disclosure of terms and conditions for financial products, as well as establishing mechanisms for resolving disputes and grievances. Moreover, promoting responsible lending practices and discouraging excessive debt accumulation can help mitigate the risk of NPLs among households. This may include implementing guidelines for responsible lending, conducting affordability assessments before extending credit, and offering financial counseling services to individuals facing financial difficulties.
Regional Development Programs. Implementing targeted regional development programs is essential to address economic disparities and foster inclusive growth across Italian regions. These programs aim to stimulate economic activity, create employment opportunities, and reduce the incidence of Non-Performing Loans (NPLs) by addressing structural challenges and promoting local entrepreneurship. Infrastructure improvement stands as a linchpin of regional development initiatives, with investments directed towards upgrading transportation networks, utilities, and digital connectivity. By enhancing infrastructure, regions can attract investment, facilitate the movement of goods and services, and spur economic growth. Improved infrastructure also lays the foundation for businesses to thrive, leading to job creation and increased economic activity. Moreover, fostering local entrepreneurship through support programs, access to financing, and incubation centers can unleash the potential of small businesses and startups. By nurturing a vibrant ecosystem of entrepreneurship, regions can diversify their economies, promote innovation, and create new opportunities for growth. This, in turn, reduces reliance on traditional industries and enhances resilience to economic downturns, thereby mitigating the risk of NPLs. Additionally, targeted initiatives to address specific economic challenges in disadvantaged regions, such as skills training programs, business incubators, and investment incentives, can further accelerate economic development and reduce regional disparities.
8. Conclusions
In the following article we analyzed the relationship between banking stability and the individual E- Environment, S-Social and G-Governance components of the ESG model in the Italian regions. This indicates that aspects of ESG such as environmental degradation, social issues like employment stability, and governance factors such as political representation and crime fear are influential on the stability of banking in Italian regions. The econometric analysis shows that banking stability in the Italian regions tends to be positively associated either with the variables of the E-Environment component and also with those representative of the S-Social component. On the contrary, banking stability in the Italian regions is negatively associated with the G-Governance component. The analysis underscores stark disparities in economic health across Italian regions, reflected through the lens of non-performing loans. Regions with higher economic activities, like Lombardy and Veneto, exhibit higher NPLs, suggesting both a vibrant economic activity and increased financial risks. Conversely, regions with lower NPLs may experience economic stagnation or lack of dynamism, impacting banking stability. The article provides insights into methodological approaches like clustering with k-Means optimized by Silhouette Coefficient and Elbow Method, revealing differences in regional banking stability. Such methodological depth aids in understanding the nuanced financial landscapes of different regions. The findings suggest a need for region-specific financial strategies. For regions with high NPLs, strategies might involve mitigating risks to financial institutions and supporting sectors under strain. For regions with low NPLs but stagnant economic activity, the focus should be on stimulating economic development and investment. The article hints at areas for further research, particularly in exploring more deeply the links between specific ESG components and banking stability, and how these relationships evolve over time or under different economic conditions. There are recommendations for economic policies aimed at reducing NPLs and increasing banking stability, such as enhancing regulatory oversight, fostering economic growth, promoting financial education, and implementing targeted regional development programs. Overall, the article contributes to the understanding of how ESG factors influence banking stability across different Italian regions, offering suggestions for targeted policy interventions and further academic inquiry into sustainable finance.
Funding
The author received no financial support for the research, authorship, and/or publication of this article.
Data Availability Statement
The data presented in this study are available on request from the corresponding author.
Declaration of Competing Interest
The author declares that there is no conflict of interests regarding the publication of this manuscript. In addition, the ethical issues, including plagiarism, informed consent, misconduct, data fabrication and/or falsification, double publication.
Appendix A
Appendix A.1. NPL and E-Environment
Appendix A.2. NLP and S-Social
Appendix A.3. NLP and G-Governance
References
- Aguinis H. (2011), Organizational responsibility: Doing good and doing well, in Zedeck S. (Ed.), APA handbook of industrial and organizational psychology, Vol. 3. Maintaining, expanding, and contracting the organization (pp. 855–879), American Psychological Association.
- AIFIRM (2021), L'integrazione dei fattori ESG nella valutazione del rischio di credito, Position Papern. 29, Associazione Italiana Financial Industry Risk Managers.
- Alford H.K., Compagnoni F. (2008), Fondare la responsabilità sociale d’impresa, Città Nuova Amati, V., Meggiolaro, S., Rivellini, G., & Zaccarin, S. (2018). Social relations and life satisfaction: the role of friends. Genus, 74.
- Arnone M., Leogrande A. (2024), I fattori ESG come leva strategica per una crescita sostenibile delle imprese italiane, Rassegna Economica (Special Issue) “Fattori di sviluppo ai tempi della sostenibilità: tra legalità e nuovi equilibri geoeconomici “(prossima pubblicazione entro Maggio).
- Ashrafi G.M., Magnan M., adams M., Waler T.R. (2020), Understanding the conceptual evolutionary path and theoretical underpinnings of corporate social responsibility and corporate sustainability, Sustainability n.12, pp. 1-17.
- Attig N., El Ghoul S., Guedhami O., Suh J., (2013), Corporate Social Responsiblity and Credit Ratings, Journal of Business Ethics, 117, pp. 679-694.
- Baldarelli M.G. (2009), la responsabilità sociale nel III millennio: prospettive economico-aziendali, in Matacena A., Del Baldo M., Responsabilità sociale d’impresa e territorio, Franco Angeli.
- Barnett M.L., Salomon R.M. (2012), Does it pay to be ‘really’ good? Addressing the shape of the relationship between social and financial performance, Strategic Management Journal, vol. 33, no. 11, 2012, pp. 1304–1320.
- Belcredi M., Bozzi S. (2022), le società quotate italiane davanti alla sostenibilità, Vita e Pensiero, n. 2, pp. 50-56.
- Bertay, A., & Uras, B. (2016). Leverage, Bank Employee Compensation and Institutions. Organizations & Markets: Motivation & Incentives eJournal.
- Borgonovi E., Aiello G., Fellegara A.M. (2017), Sviluppo, sostenibilità e competitività delle aziende. Il contributo degli economisti aziendali, Il Mulino Editore.
- Bradley M., Chen D. (2011), Corporate Governance and the Cost of Debt: Evidence from Director Limited Liability and Indemnification Provisions, Journal of Corporate Finance, Volume 17, Issue 1, February 2011, pp. 83-107.
- Cardoni A., Kiseleva E., Arduini S., Terzani S. (2022), From sustainable value to shareholder value. The impact of sustainable governance and anti-corruption programs on market value, Business Strategy and the Environment, special issue, December.
- Ciesielska M., Iskoujina Z. (2017), Sustainability: insight from a business model perspective, Journal of Critical Organization Inquiry, vol. 15, n. 3-4, pp. 249-256.
- Commissione Europea (2001), Libro verde. Promuovere un quadro europeo per la responsabilità sociale delle imprese.
- Commissione Europea (2022), Internal Market, Industry, Entrepreneurship and SMEs.
- Cooper E. W., Uzun H. (2015), Corporate Social Responsibility and the Cost of Debt, Journal of Accounting & Finance, Vol. 15(8), pp. 2158-3625.
- Creel, J., Hubert, P., & Labondance, F. (2015). Financial stability and economic performance. Economic Modelling.
- Damtsa, S., Milidonis, A., & Stathopoulos, K. (2020). National Culture and Bank Deposits. ERN: Other Macroeconomics: Consumption.
- Del Baldo M. (2015), Beyond CSR: the virtues-based approach to corporate responsibility and sustainability in Italian SMEs, International Journal of Environment and Health, Issue 7, n.4, pp. 394-413. [CrossRef]
- Derbali A., Jamel L., Chenguel M.B. (2022), The nexus between governance structure and cost of debt, International Journal of the Economics of Business, Vol. 29, Issue 1, pp. 119- 136. [CrossRef]
- Devalle A. Fiandrino S., Cantino V. (2017), “ESG sustainability and financial capital structure: where they stand nowadays”, International Journal of Business and Social Science, Vol. 8, No. 5, p. 116 Doerr, S., Kabaş, G., & Ongena, S. (2020). Population Aging and Bank Risk-Taking. Innovation Finance & Accounting eJournal.
- Dorfleitner G., Gleber J. (2020), The social and environmental drivers of corporate credit ratings: international evidence, Business Research, 13, pp. 1343–1415.
- Ebner D., Baumgartner R. (2006), The relationship between sustainable development and corporate social responsibility, Corporate Responsibility Research Conference, Dublin.
- Eccles R.G., Krzus M.P. (2019), Implementing the Task Force on Climate-related Financial Disclosures Recommendations: An Assessment of Corporate Readiness, Schmalenbach Business Review, n.71, pp. 287-293. [CrossRef]
- Eichholtz P., Holtermans R., Koke N. (2019), Environmental Performance of Commercial Real Estate: New Insights into Energy Efficiency Improvements, The Journal of Portfolio Management, Volume 45, Issue pp. 113-129. [CrossRef]
- Eliwa Y., Aboud A., Saleh A. (2019), “ESG practices and the cost of debt: Evidence from EU countries”, Critical Perspectives on Accounting, vol. (In-press), 102097, pp. (In-press). [CrossRef]
- Elkington J. (1997), “Cannibals with Forks: The Triple Bottom Line of 21st Century Business. Capstone”, Oxford.
- Evans S., Vladimirova D., Holgado M., Van Fossen K., Yang M., Silva E.A. (2017), Business model for sustainability: towards a unified perspectives for creation of sustainable business model, Business Strategy and the Environment, n.26, pp. 597-608. [CrossRef]
- Fairclough, G. (2018). Landscape and heritage: ideas from Europe for culturally based solutions in rural environments. Journal of Environmental Planning and Management, 62, 1149 – 1165. [CrossRef]
- Farah T,, Jialong L., Zhicheng L., Shamsuddin A., (2021), The non-linear effect of CSR on firms’ systematic risk: International evidence, Journal of International Financial Markets, Institutions and Money, Volume 71, issue C. [CrossRef]
- Fatemi A., Glaum M., Kaiser S. (2017). ESG performance and firm value: The moderating role of disclosure”. Global Finance Journal. [CrossRef]
- Ferriani F., Natoli F. (2020), ESG risks in times of Covid-19, Applied Economics Letters, Volume 28, 2021 - Issue 18, pp. 1537-1541. [CrossRef]
- Forum per la finanza sostenibile (2023), PMI italiane, policrisi e finanza sostenibile: le opportunità per le imprese.
- Friede G., Busch T., Bassen A. (2015), “ESG and financial performance: Aggregated evidence from more than 2000 empirical studies”, Journal of Sustainable Finance & Investment, 5(4), 210-233. [CrossRef]
- Gallino L. (2005), L’impresa irresponsabile, Einaudi.
- Garavan T.N., Mcguire D. (2010), Human resource development and society: human resource development’s role in embedding corporate social responsibility, sustainability, and ethics in Organization, Advances in Developing Human Resources, vol. 12, n. 5, pp- 487-507.
- Gardiner, R., & Hájek, P. (2020). Effect of GDP, Energy Consumption, and Material Consumption on Waste Generation: The Case of EU-28 Countries.
- Gianfrate G., Peri M. (2019), The green advantage: Exploring the convenience of issuing green bonds,.
-
Journal of Cleaner Production Volume 219, 10 May 2019, pp. 127-135.
- Gillan S.L., Koch A., Starks L.T. (2021), Firms and social responsibility: a review of ESG and CSR research in corporate finance, Journal of Corporate Finance, n. 66 pp. 1-16. [CrossRef]
- Giudici G., Bonaventura M. (2018), “La relazione fra rating ESG e performance di mercato: uno studio sui titoli dell’indice Stoxx Europe 600”, disponibile sul sito www.banor.it.
- Goss A., Roberts G.S.(2011), The impact of corporate social responsibility on the cost of bank loans,.
-
Journal of Banking & Finance, 35, issue 7, p. 1794-1810.
- Granleese, J. (2004). Occupational pressures in banking: gender differences. Women in Management Review, 19, pp. 219-226. [CrossRef]
- Guleva, V., & Dukhanov, A. (2015). Influence of the External Environment Behaviour on the Banking System Stability., 1603-1612. [CrossRef]
- Harrison, J. S., & Wicks, A. C. (2013). “Stakeholder theory, value, and firm performance”. Business Ethics Quarterly, 23(1), 97–124.
- Hassel L.G., Semenova N. (2013), The Added Value of Environmental, Social and Governance Performance and Sustainable and Responsible Investment on Company and Portfolio Levels - What Can We Learn from Research?, Midttun A. (ED.), CSR and Beyond - A Nordic Perspective, Publisher: Cappelen Damm.
- Henisz W., Koller T., Nuttall R. (2019), “Five ways that ESG creates value Getting your environmental, social, and governance (ESG) proposition right links to higher value creation. Here’s why”, McKinsey Quarterly, November.
- Hoffman A.J. (2018), The next phase of business sustainability, Stanford Social Innovation Review, Spring, pp. 35.-39.
- Jacquillat B. (2009), La montèe en puissance de la finance est-elle-soutenable?, Revue Francaise de gestion, n. 198-199, pp. 229-240. [CrossRef]
- Jokipii, T., & Monnin, P. (2013). The Impact of Banking Sector Stability on the Real Economy. Journal of International Money and Finance, 32, pp. 1-16. [CrossRef]
- Kırıkkaleli, D., & Sofuoğlu, E. (2023). Does financial stability matter for environmental degradation?. Geological Journal, 58, 3268 – 3277. [CrossRef]
- Kotsantonis S., Pinney C., Serafeim G. (2016), ESG integration in investment management: myths and realities, Journal of Applied Corporate Finance, vol. 28, n. 2, pp. 10-16. [CrossRef]
- Kubiszewska, K. (2017). Transformation of The Banking Sector as An Element of Economic Transformation in South-East Europe., pp. 237-251. [CrossRef]
- Kuhn, M., & Ploj, G. (2020). Job Stability, Earnings Dynamics, and Life-Cycle Savings. ERN: Life Cycle Models (Topic).
- Landi, F., Onder, G., Russo, A., Tabaccanti, S., Rollo, R., Federici, S., Tua, E., Cesari, M., & Bernabei, R. (2001). A new model of integrated home care for the elderly: impact on hospital use.. Journal of clinical epidemiology, 54 9, pp. 968-70.
- Lebrett, W., Roeland, E., Bruggeman, A., Yeung, H., & Murphy, J. (2017). Economic impact of palliative care among elderly cancer patients.. Journal of Clinical Oncology, 35, pp. 91-91. [CrossRef]
- Lins C.M., Sheng Chen C.C., Yang S.Y.,Wang W.R. (2020), The Effects of Corporate Governance on Credit Ratings: The Role of Corporate Social Responsibility, Emerging Markets Finance & Trade, 56 pp. 1093–1112.
- Liu, S., Qi, X., Qin, M., & Su, C. (2019). Financial Stability or Instability? Impact from Chinese Consumer Confidence. Romanian Journal of Economic Forecasting, pp. 25-43.
- Lodh A. (2020), ESG and the cost of capital, MCSCI Research.
- Luo, Q. (2014). Optimization of Employee Salary and Benefits Based on Employment Stability. Journal of Guangdong AIB Polytechnic College.
- Matacena A. (2005), responsabilità sociale d’impresa: momenti interpretativi, Non Profit, n.1, pp. 15- 40.
- Matacena A. (2009), La responsabilità sociale dell’impresa: dal capitalismo dell’età dell’oro al turbocapitalismo, in Matacena A., Del Baldo M., Responsabilità sociale dell’impresa e territorio, Franco Angeli.
- Menicucci, E., & Paolucci, G. (2021). Gender diversity and bank risk-taking: an empirical investigation in Italy. Corporate Governance: The International Journal of Business in Society Metz, I. (2005). Advancing the careers of women with children. Career Development International, 10, 228-245.
- Milne M.J., Gray R. (2013), Whither ecology? The triple bottom line, the global reporting initiative and corporate sustainability reporting, Journal of Business Ethics, n. 118, pp. 13-29.
- Nieto, M. (2017). Banks and Environmental Sustainability: Some Financial Stability Reflections. Governance.
- Nocca, F. (2017). The Role of Cultural Heritage in Sustainable Development: Multidimensional Indicators as Decision-Making Tool. Sustainability, 9, 1882.
- Nofsinger J., Varma A.(2014), Socially responsible funds and market crises, Journal of Banking & Finance, Elsevier, vol. 48(C), pp. 180-193. [CrossRef]
- Noseleit, F. (2014). Female self-employment and children. Small Business Economics, 43, 549-569 Porretta, P., & Santoboni, F. (2014). Banks and Young People in Italy: Financial Product, Credit and Other Features. Social Science Research Network.
- Prasetyaningtyas, S., Heryanto, C., Nurfauzi, N., & Tanjung, S. (2021). THE EFFECT OF WORK FROM HOME ON EMPLOYEE PRODUCTIVITY IN BANKING INDUSTRY. Jurnal Aplikasi Manajemen.
- Prete, S., & Stefani, M. (2013). Women on Italian Bank Boards: Are They 'Gold Dust'?. Organizational Behavior & Key Stakeholders eJournal.
- Putnam, R. D. (2000). Bowling alone: The collapse and revival of American community. Simon and schuster.
- Rosenfeld, R., & Fornango, R. (2008). THE IMPACT OF ECONOMIC CONDITIONS ON ROBBERY AND PROPERTY CRIME: THE ROLE OF CONSUMER SENTIMENT*. Criminology, 45, 735-769. [CrossRef]
- Saadaoui, A., & Salah, O. (2022). The moderating effect of financial stability on the CSR and bank performance. EuroMed Journal of Business.
- Sarifuddin, A., Habibah, N., Chalil, R., & Prasetyaningtyas, S. (2021). Working from Home During the Corona Pandemic: Investigating the Role of Authentic Leadership, Psychological Capital, and Gender on Employee Performance in Banking. Proceedings of the 2021 4th International Conference on Education Technology Management.
- Sarvaiya M., Wu M. (2914), An integrated approach for corporate social responsibility and corporate sustainability, Asian Social Science, Ussue 10, n. 17, pp. 57-70.
- Schaltegger S., Ludeke-Freund F., Hansen E.G. (2012), Business case for sustainability: the role of business model innovation for corporate sustainability, International Journal of Innovation and Sustainable Development, Issue 6, n.22, pp. 95-119. [CrossRef]
- Servaes H., Lins K.L., Tamayo A. (2017), Social Capital, Trust, and Firm Performance: The Value of Corporate Social Responsibility during the Financial Crisis, Journal of Finance, American Finance Association, vol. 72(4), pp. 1785-1824. [CrossRef]
- Shmatov C., Castelli C.R. (2023), Quantitative methods for ESG finance, Wiley&Sons, Croydon Sinha A.B., Sinha A. (2022), Green finance and ESG: compliance of global stock exchange, The IUP Journal of Applied Finance, vol. 28, n.3, pp. 23-33.
- Stafford, M., Chandola, T., & Marmot, M. (2007). Association between fear of crime and mental health and physical functioning.. American journal of public health, 97 11, 2076-81. [CrossRef]
- Sun W., Cui K. (2014), Linking corporate social responsibility to firm default risk, European Management Journal, Vol. 32, Issue 2, pp. 275-287.
- Taliento M., Favino C., Netti A. (2019), Impact of Environmental, Social, and Governance Information on Economic Performance: Evidence of a Corporate ‘Sustainability Advantage’ from Europe, Sustainability, Vol. 11, No. 6:1738. [CrossRef]
- Winstead, B., Derlega, V., Montgomery, M., & Pilkington, C. (1995). The Quality of Friendships at Work and Job Satisfaction. Journal of Social and Personal Relationships, 12, 199 – 215. [CrossRef]
- Zanda G. (2012), Corporate Management in a Knowledge-Based Economy, Palgrave MacMillan, New York.
- Zhu F. (2014), Corporate Governance and the Cost of Capital: An International Study, International Review of Finance, Volume 14 Issue 3, September 2014, pp. 393-429. [CrossRef]
Figure 1.
Non-Performing Loans (NPLs) in thousands of euros for Italian regions in 2022. The graph displays each region along the x-axis and the corresponding NPL amounts along the y-axis, providing a clear visual comparison across the regions.
Figure 1.
Non-Performing Loans (NPLs) in thousands of euros for Italian regions in 2022. The graph displays each region along the x-axis and the corresponding NPL amounts along the y-axis, providing a clear visual comparison across the regions.
Figure 2.
Non-Performing Loans (NPLs) from 2004 to 2022 for each Italian region.
Figure 2.
Non-Performing Loans (NPLs) from 2004 to 2022 for each Italian region.
Figure 3.
NPL across Italian macro-regions.
Figure 3.
NPL across Italian macro-regions.
Figure 4.
Here's the graph depicting the Silhouette Coefficients for different values of k from 2 to 10. The plot clearly shows that the highest coefficient is for k=2, suggesting it as the most distinct clustering solution. As k increases, the Silhouette Coefficient generally decreases, indicating less optimal clustering.
Figure 5.
Clustering with k-Means algorithm optimized with the Elbow method.
Figure 5.
Clustering with k-Means algorithm optimized with the Elbow method.
Figure 7.
Relationship between Banking Stability and Cultural Heritage.
Figure 7.
Relationship between Banking Stability and Cultural Heritage.
Figure 8.
Relationship between Banking Stability and Environmental Factors.
Figure 8.
Relationship between Banking Stability and Environmental Factors.
Figure 9.
Relationship between Banking Stability and Material Consumption.
Figure 9.
Relationship between Banking Stability and Material Consumption.
Figure 10.
Relationship between Banking Stability and Environmental Concerns.
Figure 10.
Relationship between Banking Stability and Environmental Concerns.
Figure 11.
Relationship between Banking Stability, Economic Growth and Job Stability.
Figure 11.
Relationship between Banking Stability, Economic Growth and Job Stability.
Figure 12.
Relationships between banking stability and low payed employees.
Figure 12.
Relationships between banking stability and low payed employees.
Figure 13.
Relationships between banking stability and Ratio between employment rates (25-49 years) of women with pre-school children and women without children,.
Figure 13.
Relationships between banking stability and Ratio between employment rates (25-49 years) of women with pre-school children and women without children,.
Figure 14.
Relationship between banking stability and employed people working from home.
Figure 14.
Relationship between banking stability and employed people working from home.
Figure 15.
Relationship between banking stability and NEET.
Figure 15.
Relationship between banking stability and NEET.
Figure 16.
Relationships between banking stability and satisfaction with friendship relationships.
Figure 16.
Relationships between banking stability and satisfaction with friendship relationships.
Figure 17.
Relationship between banking stability and general trust.
Figure 17.
Relationship between banking stability and general trust.
Figure 18.
Relationships between banking stability and cultural and creative employment.
Figure 18.
Relationships between banking stability and cultural and creative employment.
Figure 19.
Relationship between banking stability and medical doctors.
Figure 19.
Relationship between banking stability and medical doctors.
Figure 20.
Relationship between banking stability and women and political representation in Parliament.
Figure 20.
Relationship between banking stability and women and political representation in Parliament.
Figure 21.
Relationship between banking stability and fear of being about to suffer a crime.
Figure 21.
Relationship between banking stability and fear of being about to suffer a crime.
Figure 22.
Relationship between banking stability and Integrated Home Care for Elderly.
Figure 22.
Relationship between banking stability and Integrated Home Care for Elderly.
Table 1.
Description of the model variables with indications of the E-Environment, S-Social and G-Governance component.
Table 1.
Description of the model variables with indications of the E-Environment, S-Social and G-Governance component.
| Description of the model variables with indications of the E-Environment, S-Social and G-Governance component |
|---|
| Macro |
Variables |
Abbreviations |
Description |
| Banking stability |
Non Performing Loans |
NPL |
Bad debt adjustments for the Italian regions. Values in thousands of euros. Only the values as of 12/31 for
each year were considered. Source: Bank of Italy |
| E-Environment |
Dissatisfaction with the landscape of the living place |
DWLP |
Percentage of people aged 14 and over reporting that the landscape of the living place is affected by obvious degradation on the total number of people
aged 14 and over. Source: ISTAT-BES |
| Soil waterproofing from artificial cover |
SW |
Percentage of waterproofed soil on total land area. Source: ISTAT-BES |
| Internal material consumption |
IMC |
Material consumption internal is a measure of the quantity of matter, different from water and air, used every year by the social system economical and released into the environment (incorporated into emissions or wastewater) or accumulated in new
anthropogenic stocks (both capital goods and other durable goods and waste). Source: ISTAT-BES |
| Concern about the loss of biodiversity |
CALB |
Percentage of people aged 14 and over who believe the extinction of plant/animal species among the 5 concerns priority environmental issues. Source:
ISTAT-BES |
| S-Social |
Young people who do not work or study (NEET) |
NEET |
Percentage of people aged 15-29 neither employed nor included in an education or training course on total number of people aged 15-29. Source: ISTAT-
BES |
| Transformations from unstable jobs to stable jobs |
TUJ |
Percentage of employed in unstable jobs at time t0 (term employees + collaborators) than one year away they have a stable job (employees a permanent) on the total number of people employed in unstable jobs at
time t0. Source: ISTAT-BES |
| Low paid employees |
LPE |
Percentage of employees with an hourly wage of less
than 2/3 of the median one out of the total employees. Source: ISTAT-BES |
| Ratio between employment rates (25-49 years) of women with pre-school children and women without children |
RERW |
Employment rate for women 25-49 years old with at least one child aged 0-5 years old employment rate of women aged 25-49 without children per 100. Source:
ISTAT-BES |
| Employed people working from home |
EPWH |
Percentage of employed who carried out their work from home in the last 4 weeks on total employed people. Source: ISTAT-BES |
| Satisfaction with friendship relationships |
SWFR |
Percentage of people aged 14 and over which is very satisfied with relationships with friends out of the total people aged 14 and over. Source: ISTAT-BES |
| Generalized trust |
GT |
Percentage of people of 14 years and more than most people believe is trustworthy out of the total people of 14 years and more. Source: ISTAT-BES |
| G-Governance |
Women and political representation in Parliament |
WPP |
Percentage of women elected to the Senate of Republic and the Chamber of Deputies on the total of the elect. Senators and deputies are excluded elected in the foreign constituencies and the senators
a life. Source: ISTAT-BES |
Fear of being about to suffer a crime |
FSC |
Afraid to stay to suffer a crime: Percentage of people of 14 years and more that they were afraid of being about to suffer a crime in the last 3 months out of the |
| |
|
|
total number of people aged 14 and over. Source:
ISTAT-BES |
Cultural and creative employment |
CCE |
Percentage of employed in professions or sectors of cultural activity and creatives (Isco-08, Nace rev.2) on the total employed (15 years and older). Source:
ISTAT-BES |
Elderly people treated in integrated home care |
EP |
Percentage of elderly people treated in home care integrated into the total elderly population
(65 years and over) resident. Source: ISTAT-BES |
Doctors |
D |
Number of doctors per 1,000 inhabitants. Source: ISTAT-BES |
Table 2.
Non-Performing Loans and E-Environment.
Table 2.
Non-Performing Loans and E-Environment.
Table 3.
Non Performing Loans and S-Social.
Table 3.
Non Performing Loans and S-Social.
| Non Performing Loans and S-Social |
|---|
| |
Fixed-effects |
Random Effects |
| |
Coefficient |
Std. Error |
t-ratio |
p-value |
Coefficient |
Std. Error |
z |
p-value |
| const |
43619.9 |
10871.7 |
4.012 |
*** |
42836.9 |
17191.8 |
2.492 |
** |
| NEET |
13767.9 |
3846.08 |
3.580 |
*** |
14024.3 |
3818.82 |
3.672 |
*** |
| TUJ |
−7041.88 |
2412.09 |
−2.919 |
*** |
−7188.23 |
2390.76 |
−3.007 |
*** |
| LPE |
−4284.21 |
1711.50 |
−2.503 |
** |
−4374.04 |
1697.99 |
−2.576 |
*** |
| RERW |
−1635.48 |
852.588 |
−1.918 |
* |
−1483.02 |
816.494 |
−1.816 |
* |
| EPWH |
−8253.38 |
3268.47 |
−2.525 |
** |
−8239.57 |
3244.03 |
−2.540 |
** |
| SWFR |
585.144 |
324.905 |
1.801 |
* |
559.749 |
317.837 |
1.761 |
* |
| GT |
303.340 |
115.303 |
2.631 |
*** |
283.127 |
113.597 |
2.492 |
** |
| Fixed Effects Statistics |
Random Effects Statistics |
| |
Mean dependent var |
46765.35 |
S.D.
dependent var |
83204.64 |
Mean dependent var |
46765.35 |
S.D.
dependent var |
83204.64 |
| |
Sum squared
resid |
1.39e+12 |
S.E. of
regression |
61069.58 |
Sum squared resid |
2.65e+12 |
S.E. of
regression |
82257.24 |
| |
LSDV R-squared |
0.496482 |
Within R- squared |
0.057114 |
Log-likelihood |
−5078.350 |
Akaike criterion |
10172.70 |
| |
LSDV F(26, 372) |
1.4 |
P-value(F) |
4.86e-
41 |
Schwarz criterion |
10204.61 |
Hannan- Quinn |
10185.34 |
| |
Log-likelihood |
−4949.066 |
Akaike criterion |
9.99 |
rho |
−0.068005 |
Durbin- Watson |
1.9 |
| |
Schwarz
criterion |
10059.83 |
Hannan-
Quinn |
9.99 |
Hausman test -
Null hypothesis: GLS estimates are consistent Asymptotic test statistic: Chi-square(7) = 10.8539 with p-value = 0.14512 |
| |
rho |
−0.068005 |
Durbin- Watson |
1.9 |
Table 4.
Estimation of the relationship between Non Performing Loans and G-Governance.
Table 4.
Estimation of the relationship between Non Performing Loans and G-Governance.
|
Disclaimer/Publisher’s Note: The statements, opinions and data contained in all publications are solely those of the individual author(s) and contributor(s) and not of MDPI and/or the editor(s). MDPI and/or the editor(s) disclaim responsibility for any injury to people or property resulting from any ideas, methods, instructions or products referred to in the content. |
© 2024 by the authors. Licensee MDPI, Basel, Switzerland. This article is an open access article distributed under the terms and conditions of the Creative Commons Attribution (CC BY) license (http://creativecommons.org/licenses/by/4.0/).
