1. Introduction
The underground environment is complex, indeterminate, and irregular because of the combined effects of many factors, such as complex in situ stress field, composition of rock and soil, underground water, etc. Therefore, it is of great significance for deep tunnel construction to investigate the stability and stress fields under complicated environments. Generally, theoretical analysis, test method, and numerical simulation are three common methods in geotechnical engineering analysis. Classic theoretical analysis approach includes the limit equilibrium method and limit analysis theorem. In the limit analysis approach, it is assumed that rock and soil are ideal elastic-plastic materials and obey the associate flow rule in stability analysis. Researchers from various countries carried out many research works on tunnels using the limit analysis theorem [
1,
2,
3]. These investigations mainly include two aspects: the vault and side wall stability, and the tunnel face stability. In this paper, the upper bound solutions of tunnel face supporting pressure, which belongs to the latter one, were obtained.
Concerning the study on the tunnel face supporting pressure and failure mechanism, Leca and Dormieux [
4] proposed three simple rigid cone failure mechanisms for shallow tunnel faces and calculated the upper bound solution of supporting pressure in clay and friction materials. Soubra [
5] improved the failure mechanism by introducing a logarithmic spiral shear block consisting of enormous small cones that were formulated with vertex angles 2
φ and a circular bottom surface. Compared with the previous results, this new failure mechanism shows obvious advantages. To consider spatial variability of the soil shear strength parameters for determining the critical collapse pressure of tunnel faces, Mollon et al. [
6] established new 2D and 3D failure mechanisms by means of applying spatial discretization and ‘point by point’ techniques.
The failure mechanisms of tunnel faces have been gradually improved, and corresponding influencing factors have been introduced into the analysis of these complicated issues. Water, as a predominant element affecting tunnel stability, has received much attention from researchers. Michalowski [
7] first considered the pore water pressure as an external force acting on the soil particles and recognized that the work done by the pore water pressure is the sum of the power on the soil deformation and the power on the boundaries. Thus, water factor could be considered in limit analysis theorem. According to Michalowski’s research, Huang and Yang [
8,
9] derived the collapsing detaching curve functions of tunnel roofs and the corresponding change laws in square and circular tunnels respectively via the upper bound theorem and variation principle under the pore water pressure condition. Zhong et al. [
10] and Hou et al. [
11] calculated the upper bound solutions of tunnel supporting pressure. The influence of excavation velocity and seepage force on the tunnel face stability was investigated.
In the field of plasticity theory, nonlinear failure criterion is widely adopted. Most of the previous investigations on tunnel stability were based on the Mohr-Coulomb linear failure criterion. However, plenty of tests and theoretical studies have already demonstrated that almost all failure envelopes of geotechnical materials obey nonlinear rule, and that linear condition is merely a special case. In order to introduce nonlinear failure criterion into upper bound theorem, Yang and Yin [
12] proposed ‘tangent method’ to investigate the non-linear characteristics of geo-materials with non-linear SQP algorithm for the optimization of practical projects. For tunnel engineering, Fraldi and Guarracino [
13] derived the analytical solution of collapse mechanisms with arbitrary excavation profiles in plastic Hoek-Brown nonlinear rock masses. According to the Power-law nonlinear failure criterion, Yang et al. [
14] obtained the upper bound solutions of the supporting pressure in shallow tunnels with optimization theory, and they proposed the modified tangential technique in the meantime.
Excavation of deep tunnel under high pore water pressure condition is still a challenging program for engineers. It is of analytical and practical importance to analyze the stability of deep tunnel with the nonlinear failure criterion. Therefore, under the consideration of pore water pressure and nonlinear failure criterion, the upper bound solutions of deep tunnel face support pressure with a new failure mechanism based on the modified tangential technique were investigated in this paper.
2. Calculation of Supporting Pressure
2.1. Upper Bound Theorem under the Pore Water Pressure Condition
In order to investigate the stability of various geotechnical structures under the pore water pressure condition with limit analysis theory, Viratjandr and Michalowski [
15] regarded the power generated by pore water pressure as an external power, so that water factor could be considered in the calculating process of energy dissipation in upper bound theorem. They also held the view that the pore water pressure mainly acts on soil skeletons and the kinematical admissible velocity field boundaries. The specific processes of derivation were shown in Viratjandr’s paper, and the final expression for pore water pressure power can be expressed as
where
u is the pore water pressure which can be obtained by multiplying pore water pressure coefficient
ru, soil weight
γ and vertical distance
h from a random underground point to the watertable, i.e.,
u =
ruγh.
means the volumetric strain rate and
V is the failure mechanism element volume.
vi denotes the velocity vector of kinematical admissible velocity field.
ni represents the outward normal vector on detaching surface and
Γ is the failure mechanism boundary.
On the right side of Equation (1), the first part indicates the power generated by pore water pressure acting on soil skeleton and the second part represents the power produced on the boundaries of failure mechanism. Because the failure mechanism adopted in this paper is consisted of rigid blocks, the geometric deformation is negligible. Therefore, the volumetric strain rate is equal to zero, i.e., =0, which shows that the pore water pressure power is completely composed of the part produced on the failure mechanism boundaries.
According to the upper bound theorem [
16], if the hypothetical kinematical admissible velocity field satisfies the displacement boundary conditions, the loads which are obtained by making the external power equal to the energy dissipation rate should be no less than the actual results in limit state. Thus, the formula of the upper bound theorem under the condition of pore water pressure can be acquired.
where
σij and
are the stress tensor and strain rate tensor in a kinematical admissible velocity field, respectively.
Ti represents the load acting on the boundary
Γ and
Xi means the volume force.
2.2. Nonlinear Failure Criterion
2.2.1. Power-Law Nonlinear Failure Criterion
Power-law failure criterion describes the nonlinear relationship between normal stress and shear strength when geotechnical materials reach yield. Because of its simple expression and clear physical meanings, Power-law failure criterion was widely used to solve geotechnical problems [
17,
18]. The formula can be expressed as follows,
where
τ and
σn are the shear strength and normal stress on the detaching surfaces, respectively. Parameter
c0 means the initial cohesion and
σt represents the tensile strength. Parameter
m is the nonlinear coefficient determining the bending degree of the strength envelop. It is obvious that when the nonlinear coefficient
m = 1.0, Equation (3) will be degraded into Mohr-Coulomb failure criterion.
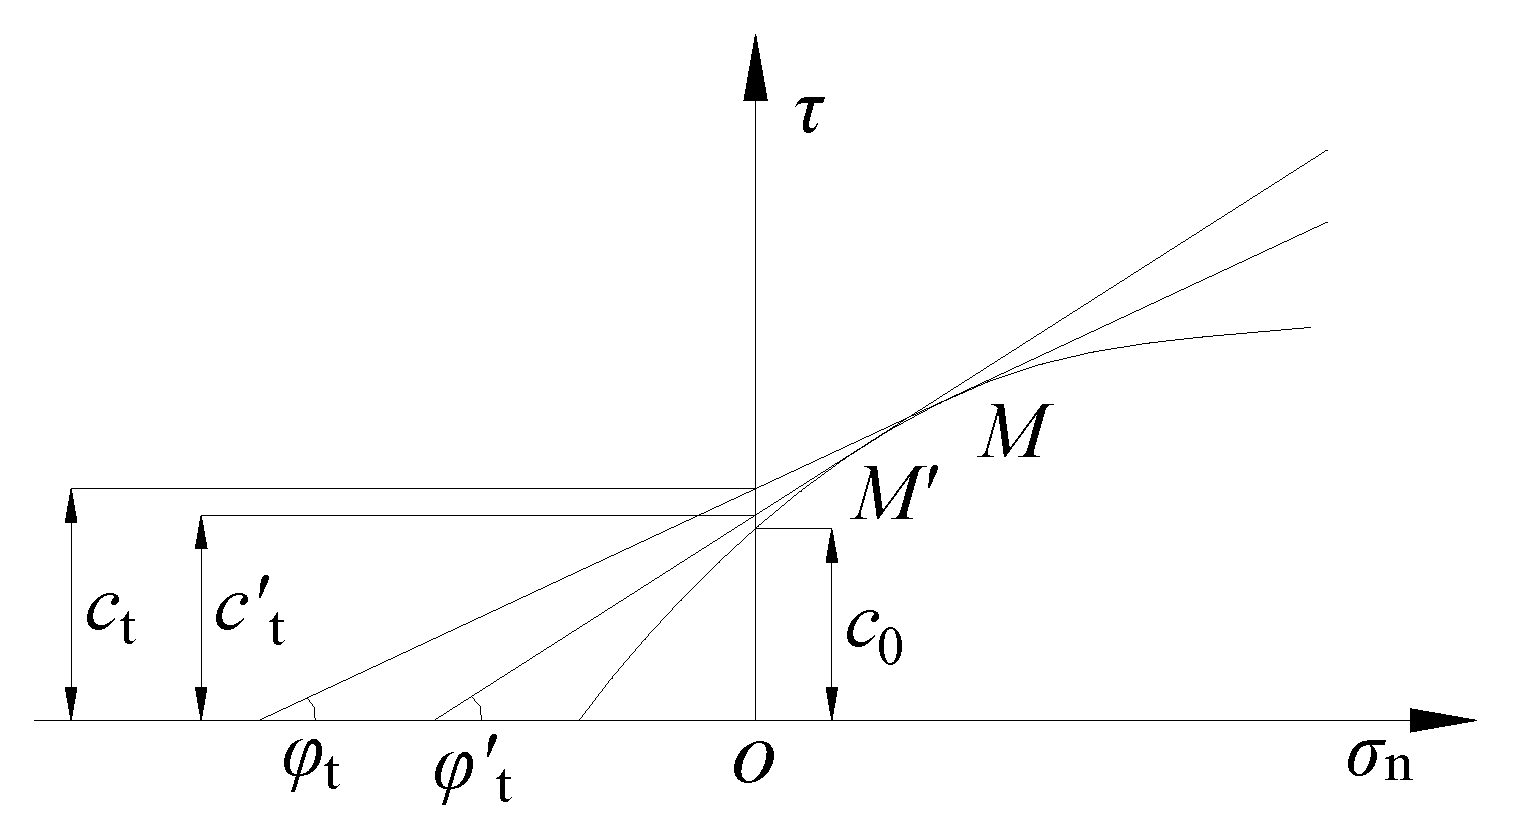
2.2.2. Tangent Method in Nonlinear Strength Criterion
Since the strength envelop of nonlinear failure criterion is a curve, it cannot apply the intercept and gradient directly to determine the strength parameters as the linear failure criterion does. In this case, Yang and Yin [
9] introduced a tangent on the strength envelop of nonlinear failure criterion and regarded its intercept
ct and gradient
φt as the equivalent parameters in linear failure criterion conditions. Thus, the nonlinear strength parameters of geotechnical materials were obtained.
As shown in
Figure 1, the tangent function is
where
ct and tan
φt represent the intercept and gradient of the tangent respectively, and their formulas can be expressed as follows:
2.2.3. Modified Tangential Method
The ordinary approach to obtain the upper bound solutions under the nonlinear conditions is the single tangential method. This method is applied to search for an optimal tangent on the nonlinear strength curve, which can introduce a group of variables (ct, φt) to make the failure mechanism reach the limit state. The single tangential method simplifies the nonlinear failure criterion to a linear one. However, in reality stress field a different normal stress σn will lead to various values of variables (ct, φt).
A modified tangential technique [
11,
12,
13,
14] is proposed based on the single tangential method, with the same formulas of
ct and tan
φt, i.e., Equation (5) and Equation (6). The differences of the variables (
ct,
φt) subjected to the different stress states are considered in the modified tangential technique which introduces several optimal tangents to make the failure mechanism approach the limit state. In other words, the more optimal tangents with different (
ct,
φt) are found on the strength envelope, the more accurate the stress field is. In this way, the modified tangential technique is a strict nonlinear analysis method.
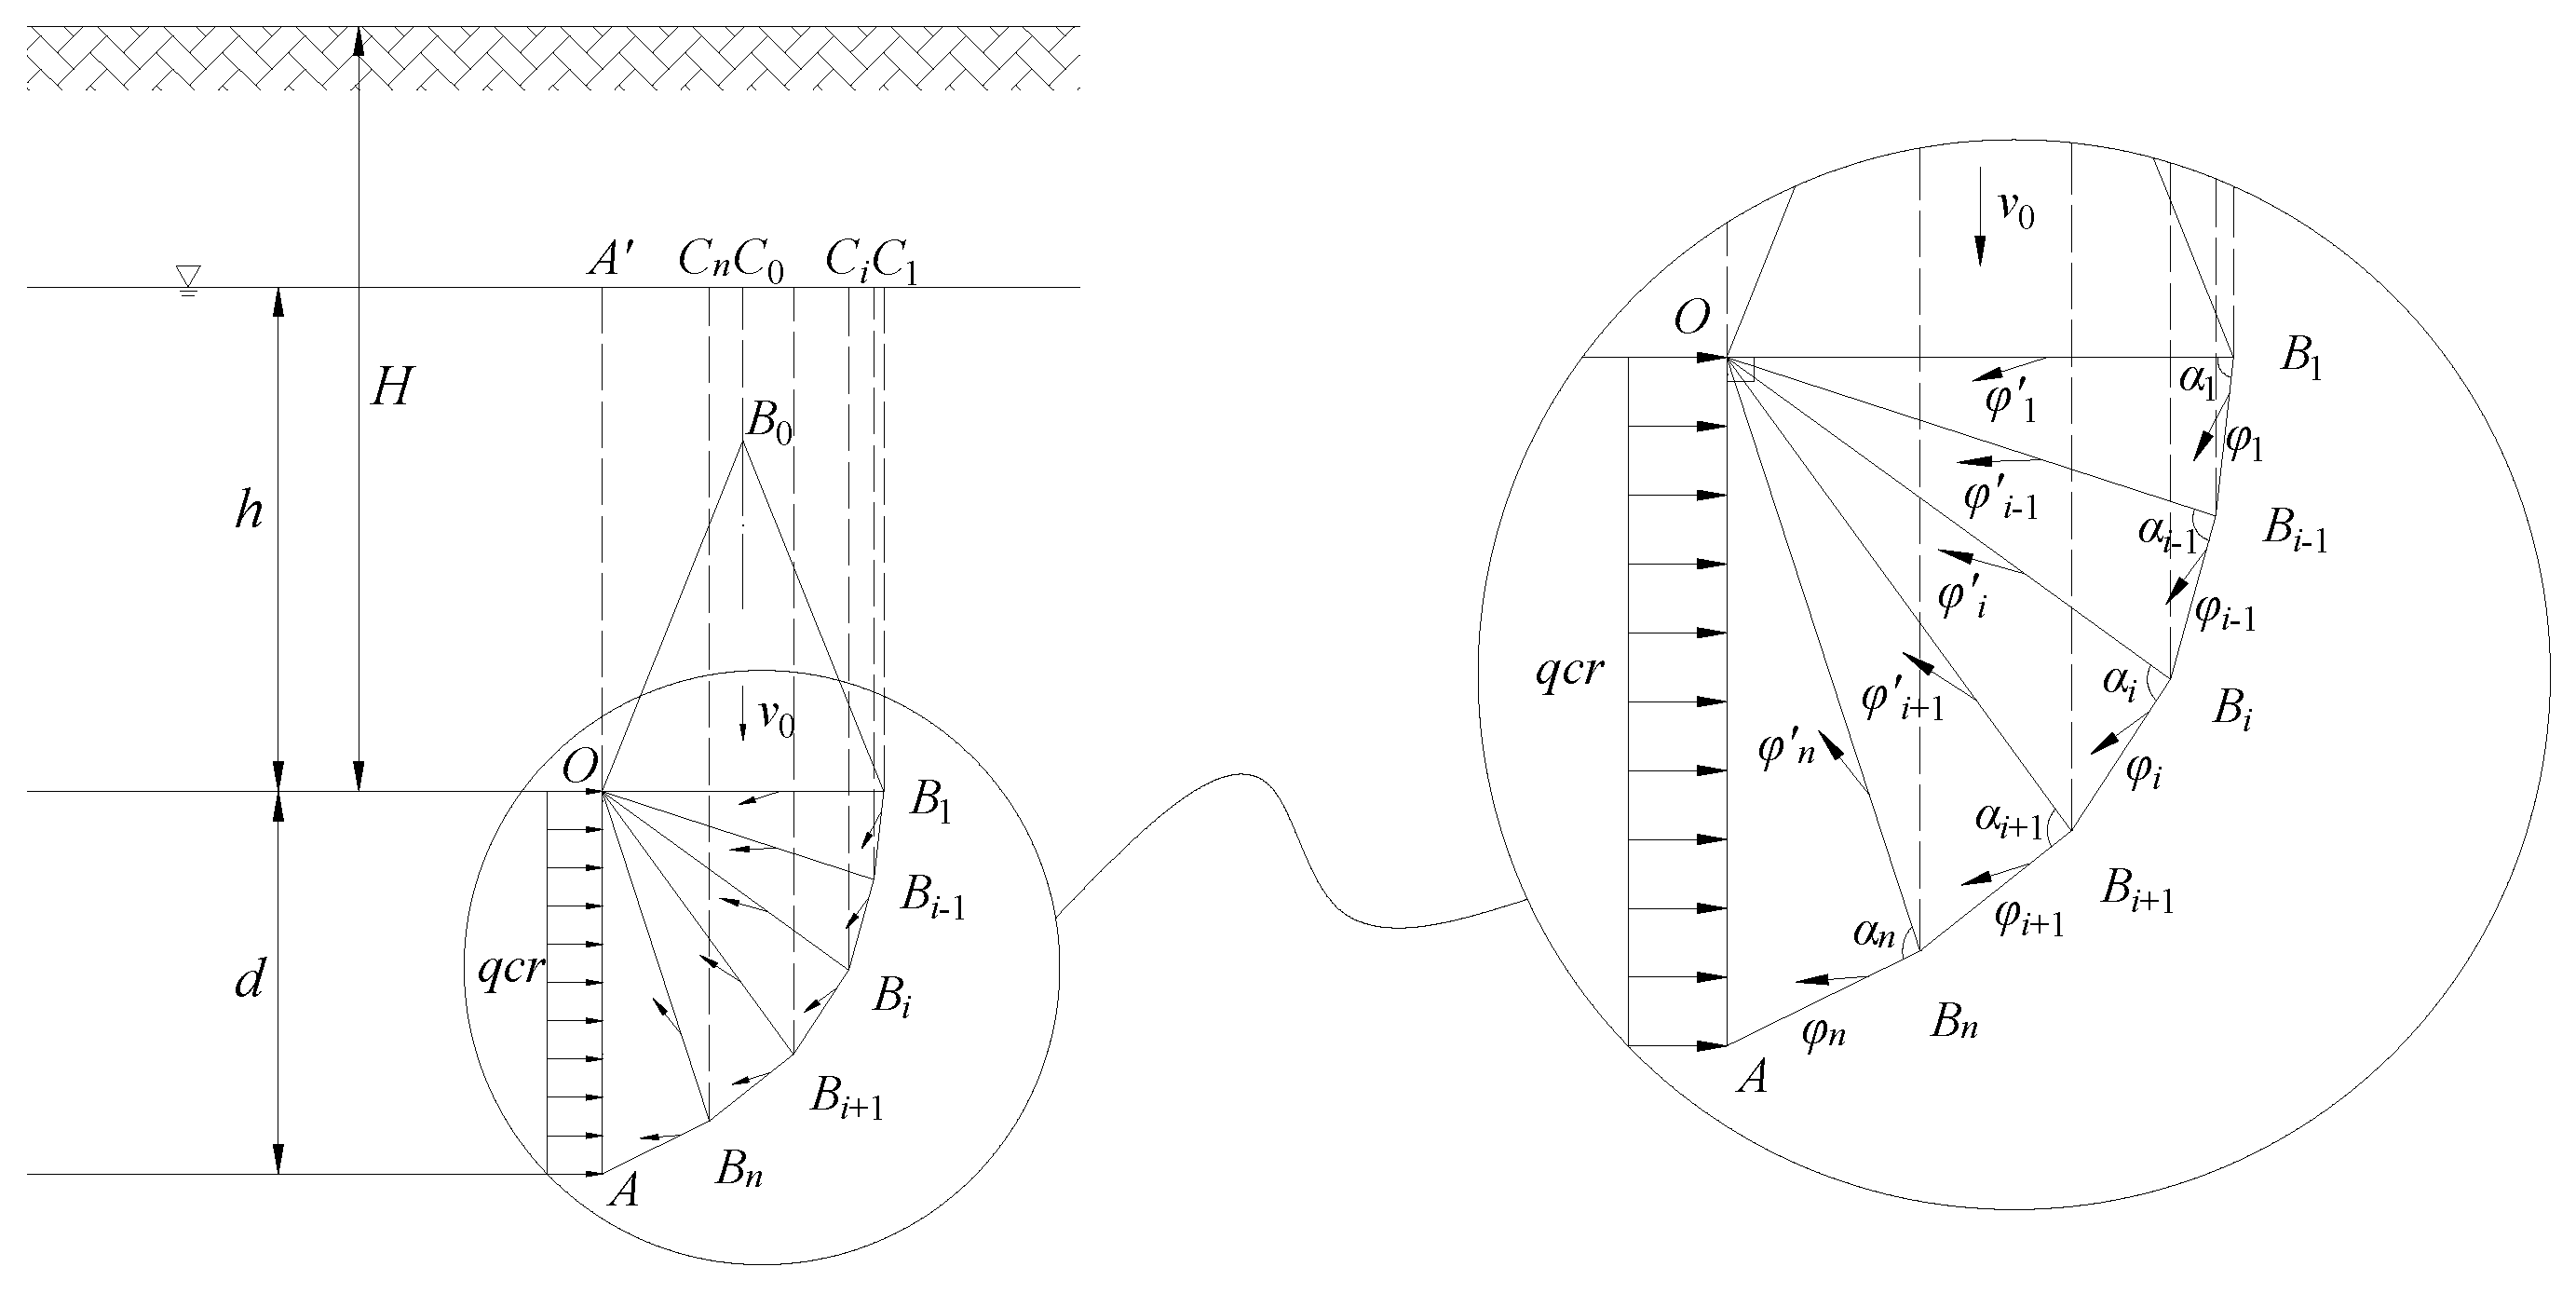
2.3. Determination of Failure Mechanism
Referring to the failure mechanism proposed by Lv and Wang [
19], the one adopted herein with a number of rigid sliding blocks is shown in
Figure 2.
The upper part of this mechanism is an isosceles triangle with a 2φ0 vertex angle, and it has the vertical down direction v0. Parameter φ0 is an unknown variable that needs to be optimized and it represents the internal frictional angle under its current stress state conditions. The lower part is consisted of rigid triangle blocks with the vertex angle of same size . The parameters φi and represent internal frictional angles in each rigid triangle block and are determined by its own stress states. They need to be optimized. h represents the vertical distance from the tunnel vault to the water table, and d means the tunnel span.
2.4. Process of Calculating Supporting Pressure
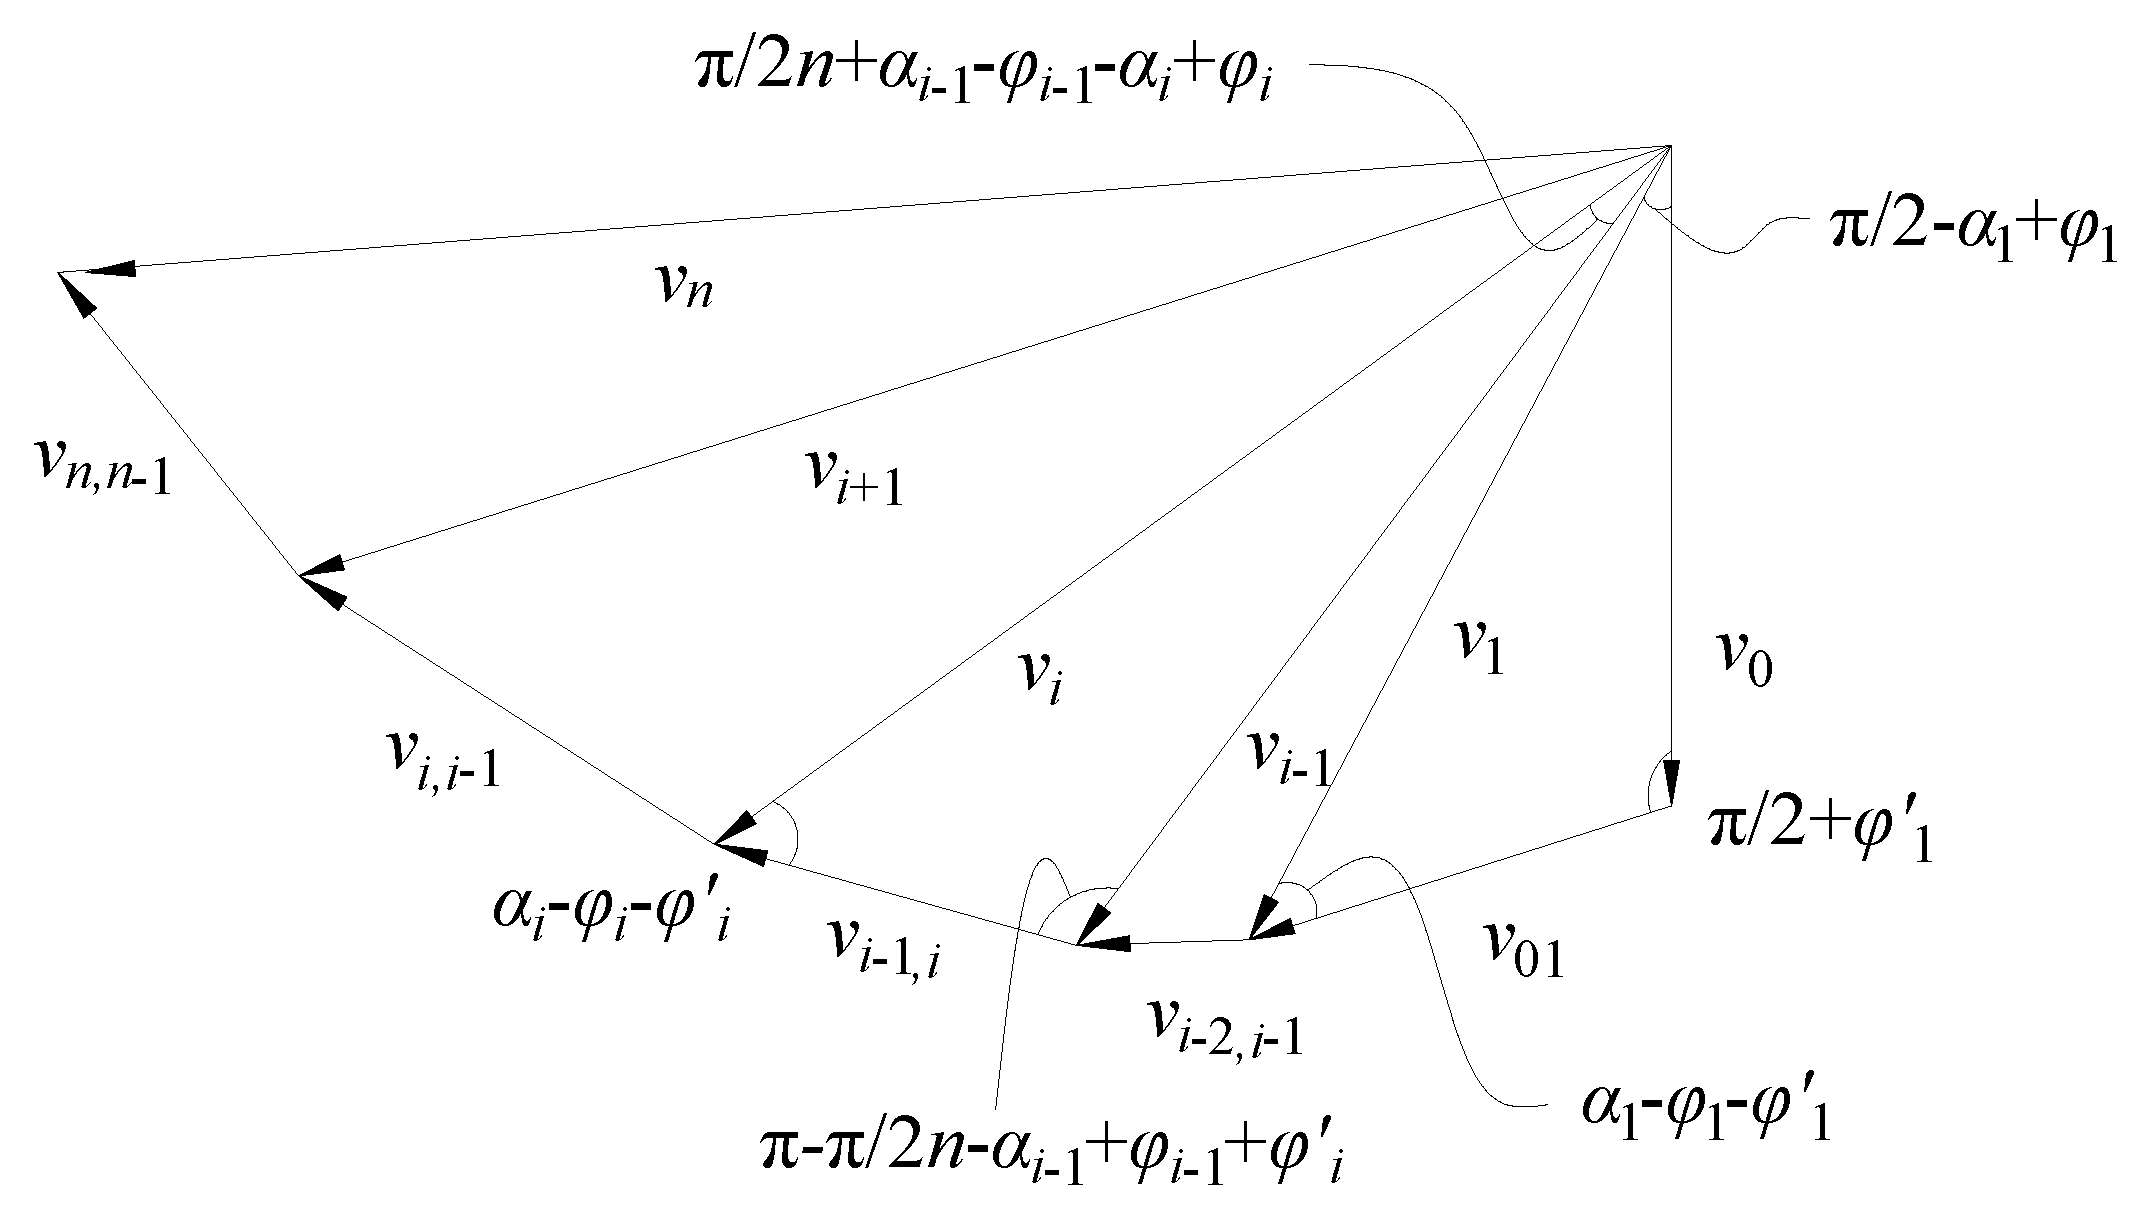
The numerical relationships between each velocity vector can be determined by the trigonometric equations expressed in
Figure 3. The velocity
vi and
vi-1,i represent the absolute and relative velocity of each rigid triangle sliding block respectively.
The geometrical relationships between velocity discontinuous lines are:
When calculating the pore water pressure power, we should set auxiliary lines, as shown in
Figure 2 with dotted lines. And their formulas can be expressed by the length of velocity discontinuous lines.
The areas of the rigid sliding blocks and the polygons composed by auxiliary lines, respectively, are
The self-weight power can be expressed as
Considering the pore water pressure as an external force, its power acting on the failure mechanism boundaries is
The supporting pressure power results
The energy dissipation rate on the velocity discontinuous lines can be expressed as
where
is the cohesion parameter corresponding to the internal frictional angle
φ0 on the upper part of the failure mechanism, which is different from the initial cohesion
c0.
According to the virtual principle that the power generated by external forces is equal to the internal energy dissipation rate, i.e.,
Pγ +
Pu +
Pqcr =
Pv. By substituting the above formulas, the upper bound solutions of supporting pressure are obtained.
2.5. Constraint Conditions
The significance of the constraint conditions is to ensure that the failure mechanism satisfies the geometric relationships and boundary conditions; that is, the sliding interfaces must be generated within a proper range and that the twisted distortions cannot occur in the rigid triangle blocks. According to the velocity vector relationships shown in
Figure 3, the constraint conditions of the failure mechanism are
Because of the adoption of the modified tangential technique and the multi-block failure mechanism, plenty of parameters remain unknown in the process of calculation. Specifically, φi, and αi are unknown in each triangle sliding block. Adding the vertex angle φ0 in isosceles triangle, the sum of the unknown parameters reaches the number of 3n + 1. The value of them should be determined by optimization.
Moreover, it is necessary to note that the internal frictional angle φ0 lacks mutual constraint conditions with other unknown parameters except that it should vary from 0 to . One may not get the global optimal solutions or results that reach convergence from Matlab optimizing process. Therefore, the varying scope of parameter φ0 is controlled artificially within a relatively smaller range compared with (0, ). The controlling principle is based on the general corresponding relationships between parameters of geotechnical materials. In this paper the variation range of φ0 is controlled within 10 degrees, so that it not only could accelerate the speed of computing, but also ensure the correctness of the results.
3. Validation of the Proposed Method
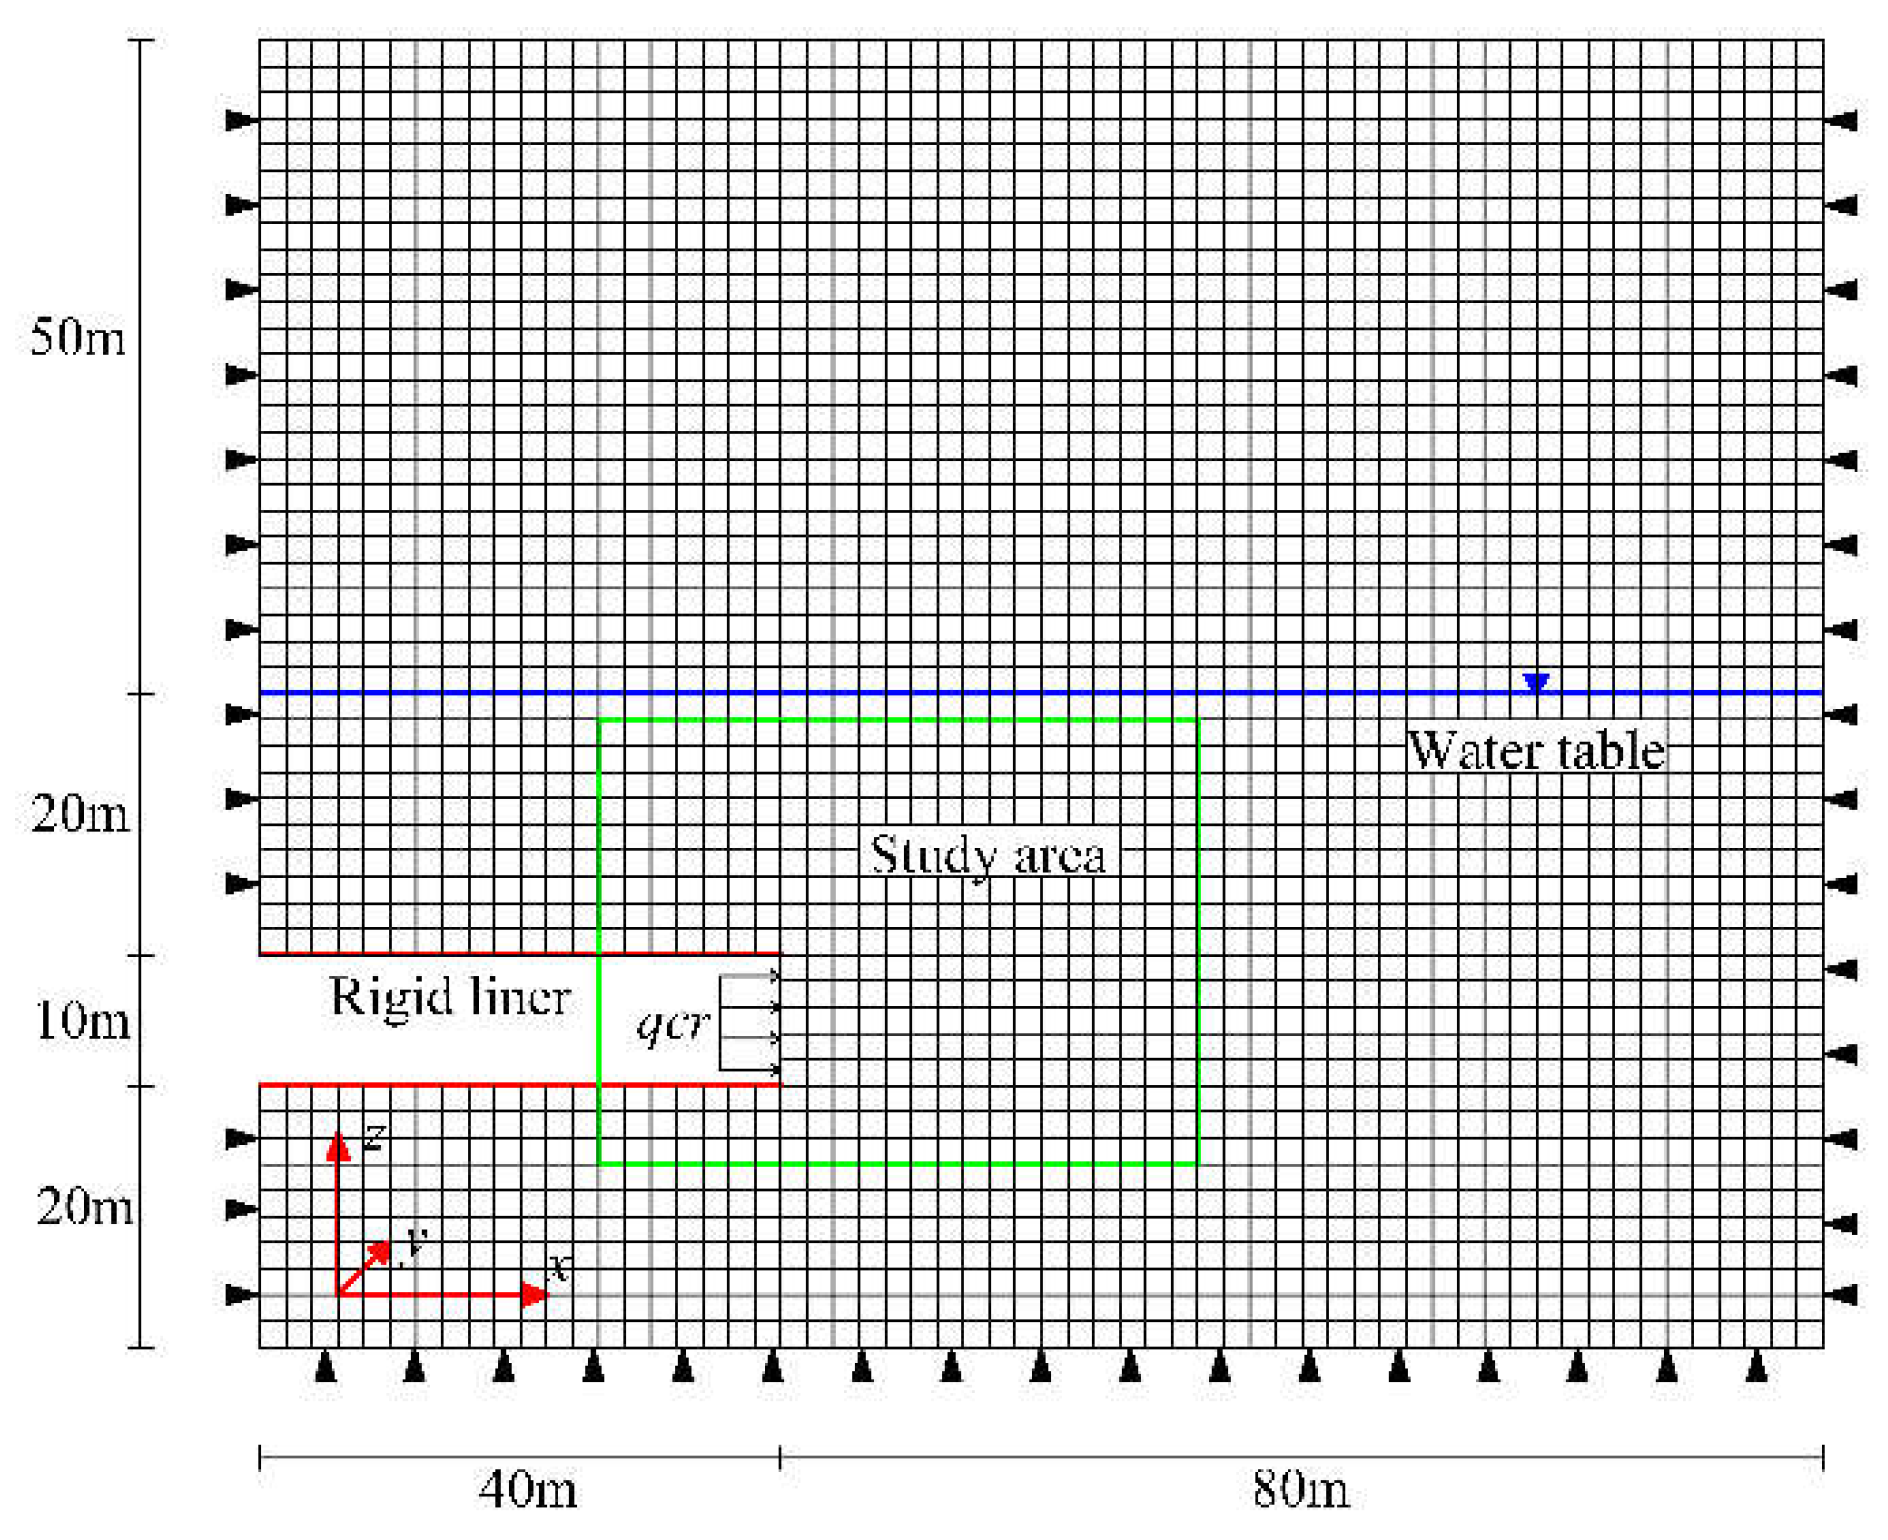
To verify the proposed method, a comparison was made to investigate the difference in the results between the simulation method using the FLAC3D software and the proposed method.
Using the FLAC3D numerical program, the shape of the tunnel face collapse range was obtained with the parameters given as follows:
γ = 22 kN/m
3,
c0 = 20 kPa,
σt =40 kPa,
h = 20 m,
d = 10 m. The numerical model is shown in
Figure 4.
To avoid generating disturbed displacement in the computing process, the bottom boundary of the model was fixed in the normal and horizontal directions, and the right and left side boundaries were fixed in the normal direction. Moreover, a horizontal stress of 65kPa was applied in the model to simulate the support pressure on the tunnel face.
Since the Power-low failure criterion was not available in the
FLAC3D software, the Mohr-Coulomb criterion was adopted in this simulation for simplicity, i.e.,
m = 1.0. The elastic properties were chosen as the same as the article of Mollon [
3], i.e.,
E = 240 MPa and
ν = 0.22, since the collapse shape and range rather than the stress field were more concerned in the plastic collapse state. In addition, a very high value of the elastic modulus
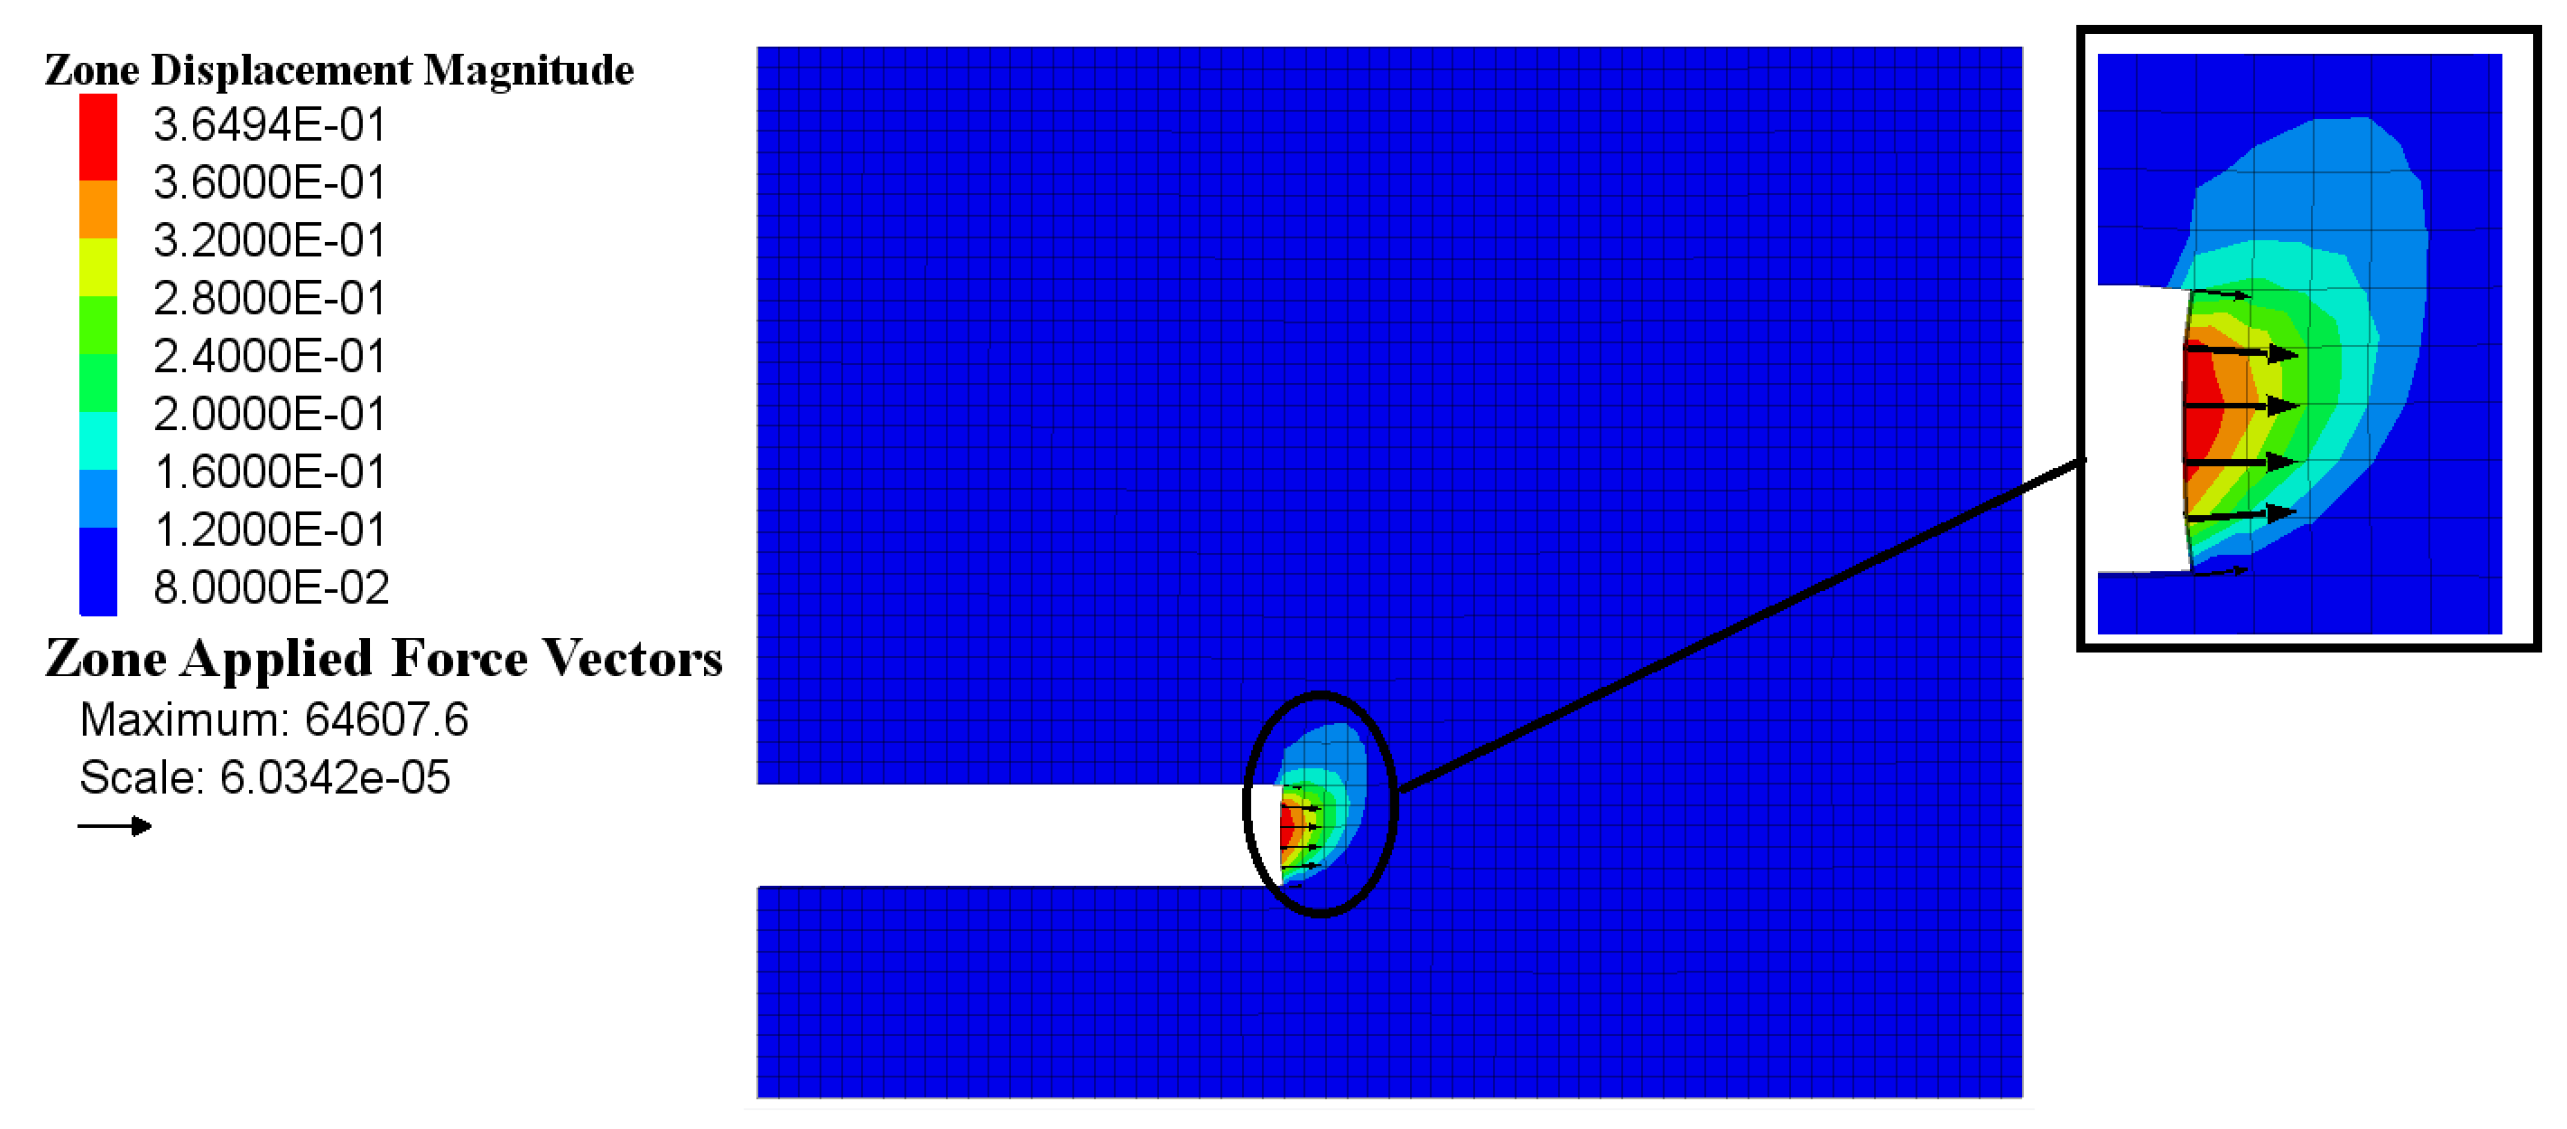
E can greatly stimulate the computation speed. The displacement in the vertical direction around the tunnel face is presented in
Figure 5.
It was manifest from
Figure 5 that the shape of a large deformation area is consistent with the failure mechanism adopted in this paper, which can verify its reasonableness. Moreover, the displacement varies significantly at the top and the bottom of the tunnel face. This is because the boundary conditions change dramatically in these positions; therefore, it is easy to generate the stress concentration phenomenon.
4. Results and Discussion
4.1. Comparison with Theoretical Results
Lv and Wang [
19] investigated the stability of the shield tunnel face and calculated the supporting pressure by means of limit analysis and limit equilibrium theory respectively. They found that when the soil internal frictional angle
φ > 20º, the tunnel depth ratio has little effect on the value of supporting pressure, which is consistent with the finite element simulation results by Vermeer et al. [
20]. The reason is that in a deep tunnel the failure surface cannot extend to the ground due to the soil arching effect, and consequently the increase of overlying soil thickness does not continuously increase the magnitude of the supporting pressure.
Identical parameters are used in this paper,
γ = 17 kN/m
3,
d = 10 m,
c0 = 2 kPa, and the number of rigid sliding blocks refers to
n = 9. Furthermore, since Lv and Wang [
19] adopted Mohr-Coulomb yield criterion and did not consider the pore water pressure factor, the nonlinear coefficient
m and the pore water pressure coefficient
ru here should be equal to 0 and 1.0 respectively. The comparison results are shown in
Table 1.
It is clear from
Table 1 that under the same parameter conditions the two values of supporting pressure are fairly close to each other. Furthermore, with the increase of the internal frictional angle, the differences between these two results tend to diminish. When
φ approaches to 40 degrees, the difference is about 9Pa. In general, the similar results demonstrate the feasibility of the new failure mechanism and the correctness of computing process.
4.2. Influence of Triangle Blocks Quantity on Supporting Pressure
In the new failure mechanism, the number of triangle rigid blocks is variable, and their quantity directly impacts on magnitude and accuracy of the supporting pressure. Therefore, to study the influence of the triangle blocks quantity on supporting pressure, the corresponding parameters are:
h = 20 m,
γ = 22 kN/m
3,
d = 10 m,
ru = 0.3,
c0 = 20 kPa,
σt = 40 kPa. While the values of nonlinear coefficients
m are 1.0, 1.4, 1.8, 2.2, 2.6 respectively. The upper bound solutions of supporting pressure with different nonlinear coefficients are calculated and shown in
Table 2.
Table 2 shows that when the failure mechanism has a few triangle blocks, ranging from 1 to 4, the values of the supporting pressure fluctuate. With the continuous increase in the number of triangle blocks, the supporting pressure value gradually decreases and stabilizes at the end. When the triangle block number reaches 6 and 7, it is found that under the conditions of distinct nonlinear coefficients, the differences between the values of supporting pressure remain within 1.0kPa. Thus, the calculating results can be considered as converged, and the feasibility of the new failure mechanism is also proved.
4.3. Influence of the Pore Water Pressure Coefficient on Supporting Pressure
To investigate the influence of pore water pressure on supporting pressure, the parameters chosen in calculations are as follows:
h = 20 m,
d = 10 m,
γ = 22 kN/m
3,
c0 = 20 kPa,
σt = 40 kPa,
n = 9,
m varies from 1.0 to 2.6, and the pore water pressure coefficient
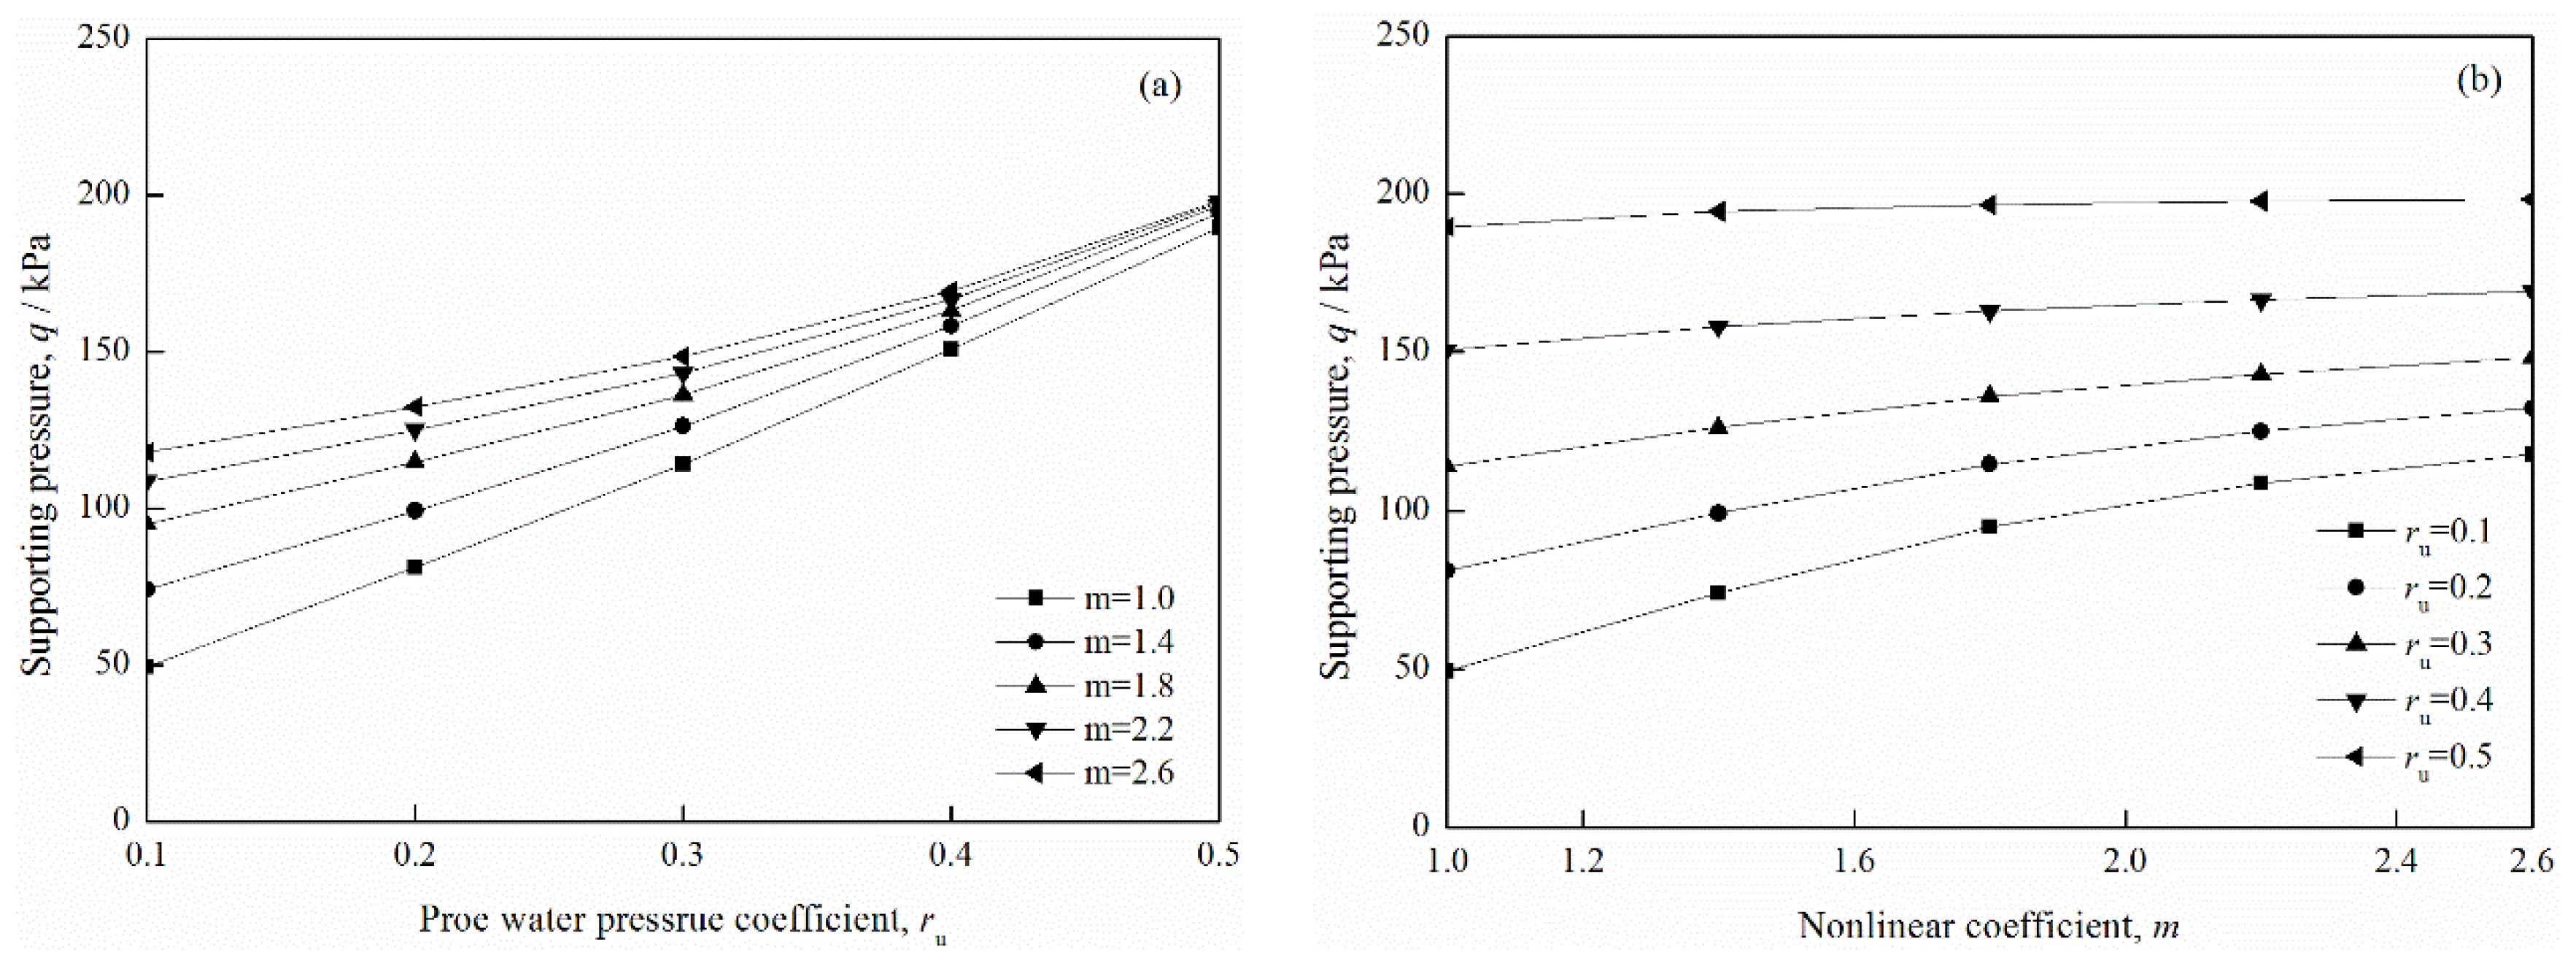
ru changes from 0.1 to 0.5. The upper bound solutions of supporting pressure are presented in
Figure 6.
From
Figure 6 (a), it is found that the value of supporting pressure increases with the increasing number of coefficient
ru, but the increment gradually decreases. When
m = 1.0 the value of supporting pressure presents a linear growth. It is consistent with the feature of the Mohr-Coulomb linear failure criterion, which shows the correctness of the calculating results in this paper. Moreover, the influence of nonlinear coefficient
m on supporting pressure gradually reduces with the increase of coefficient
ru. For example, in
Figure 6 (b) when
ru = 0.5 all the values of supporting pressure with different
m remain within the range of 190 to 200 kN.
4.4. Influence of the Underground Water Table Height on Supporting Pressure
In order to study the influence of the underground water table height on supporting pressure, the parameters chosen in calculations are as follows:
m = 2.0,
d = 10 m,
γ = 22 kN/m
3,
c0 = 20 kPa,
σt = 40 kPa,
n = 9,
ru varies from 0.1 to 0.5, and the underground water table height
h changes from 20 to 40m. The upper bound solutions of supporting pressure are shown in
Figure 5.
It can be found that from
Figure 7a,b that with the increase of the water table and the pore water pressure coefficient, the calculating results of supporting pressure show an upward trend. Moreover, when the parameter
h is fixed, the value of supporting pressure tends to increase in a form of curve, while the results present the characteristic of linear growth when the parameter
ru is fixed.
4.5. Influence of the Tunnel Span on Supporting Pressure
In order to investigate the influence of the tunnel span on supporting pressure, the parameters in calculations are chosen as follows:
γ = 22 kN/m
3,
c0 = 20 kPa,
σt = 40 kPa,
ru = 0.3,
h = 20 m,
n = 9,
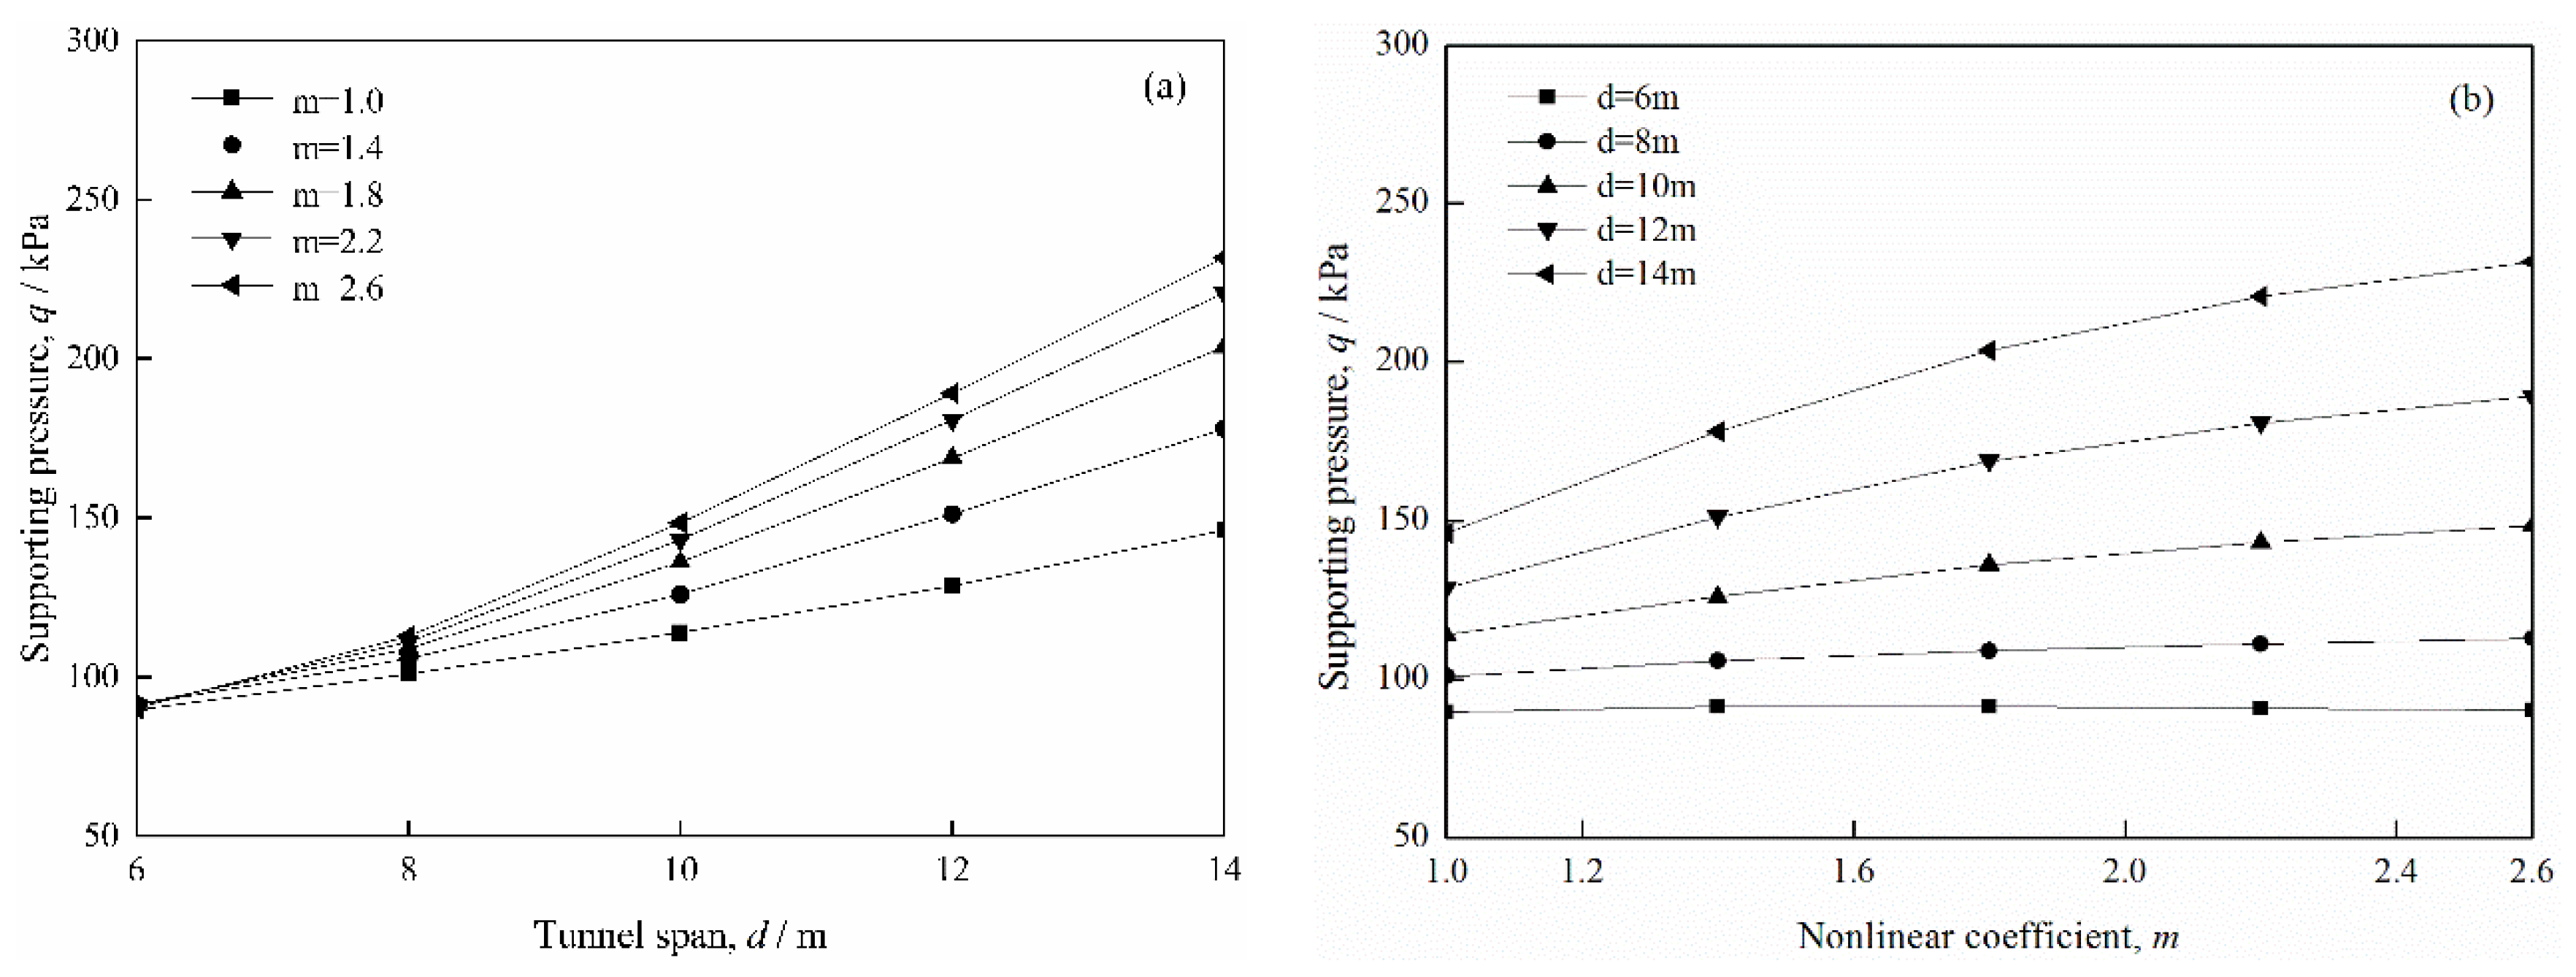
m changes from 1.0 to 2.6, and the tunnel span
d varies from 6 to 14m. The upper bound solutions of supporting pressure are shown in
Figure 6.
It can be seen from
Figure 8a,b that the solutions of supporting pressure increase gradually with the growth of tunnel spans and the nonlinear coefficients. Furthermore, one can also see that when the value of tunnel span remains small, such as
d = 6 m, the changes of nonlinear coefficient almost have no impact on the supporting pressure. The reason is that tunnels with smaller excavation section height have better stability.
4.6. Influence of the Nonlinear Coefficient on Collapse Range
In order to estimate the tunnel face collapse range with different nonlinear coefficients, the parameters selected in calculations are:
γ = 22 kN/m
3,
c0 = 20 kPa,
σt = 40 kPa,
ru = 0.2,
h = 20 m,
d = 10 m,
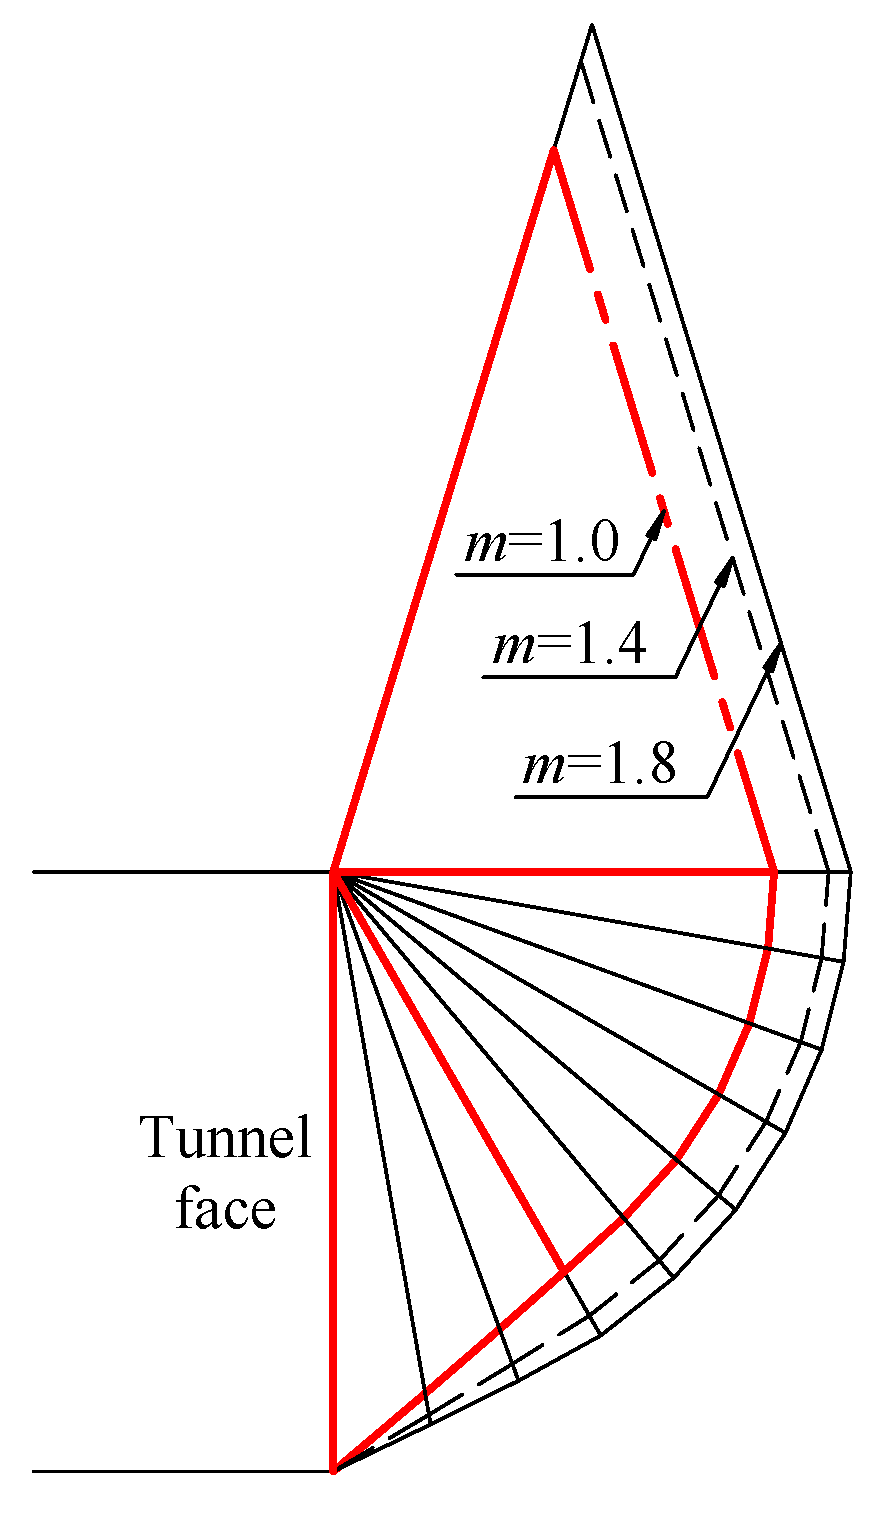
n = 9. According to the optimized angles
αi, the collapse ranges are plotted in
Figure 7 with nonlinear coefficients
m varying from 1.0 to 1.8.
As shown in
Figure 9, the collapse range of tunnel face scales out with the increase of nonlinear coefficient, but the expansion decreases gradually. It is consistent with the variations between the nonlinear coefficient and the supporting pressure.
Judging from the overall shape of the collapse range, the failure mode can be divided into three parts-the triangle sections at the bottom, the curved section in the middle and the isosceles triangle section on the top, showing in
Figure 9 with bold lines. Furthermore, the shape of the collapse range is similar to the tunnel face failure mechanisms proposed by Mollon [
6], which demonstrates that the new failure mechanism adopted in this paper is feasible.
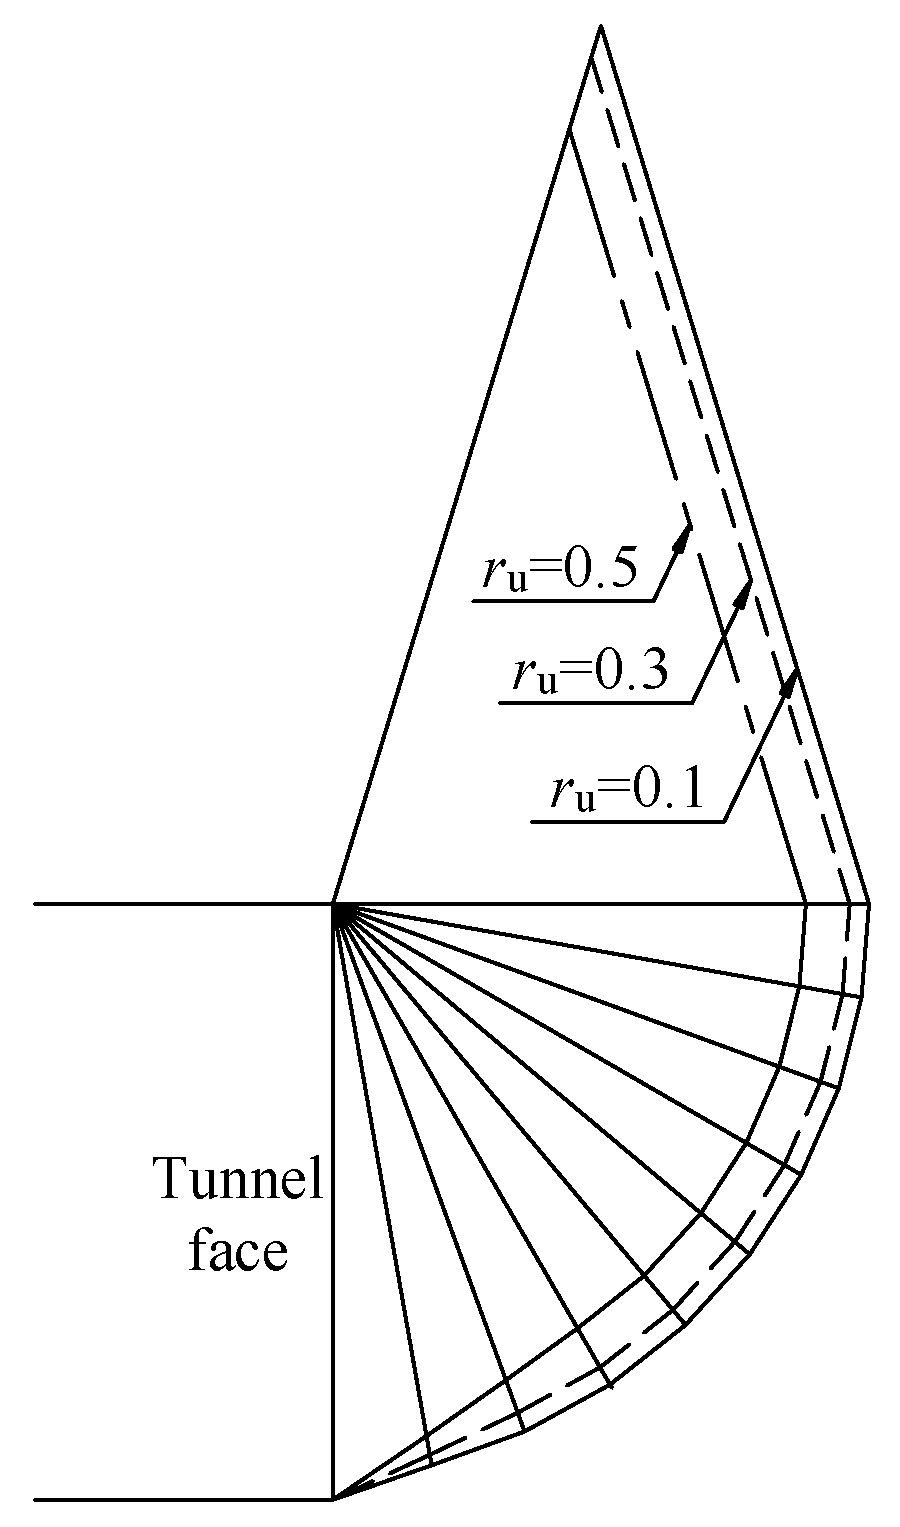
4.7. Influence of the Pore Water Pressure Coefficient on Collapse Range
In order to investigate the collapse range of tunnel face with different pore water pressure coefficients, the parameters in calculations are set as follows:
γ = 22 kN/m
3,
c0 = 20 kPa,
σt = 40 kPa,
m = 2.0,
h = 20 m,
d = 10 m,
n = 9. On the basis of optimized angles
αi the collapse ranges are plotted in
Figure 10 with
ru varying from 0.1 to 1.5.
It shows from
Figure 8 that the change law is opposite to that of
m,i.e., the tunnel face collapse range shrinks gradually with the increase of pore water pressure coefficient, which is in agreement with the results of Huang [
9].
5. Conclusions
A new deep tunnel face failure mechanism with triangle blocks is put forward. According to the nonlinear failure criterion, the upper bound solutions of supporting pressure on a tunnel face are obtained by a modified tangential technique. Compared with previous theoretical results, the correctness of the computing process and the failure mechanism are validated. The formulas of the supporting pressure were deduced.
The influence of different parameters on the supporting pressure is investigated, and the collapse range of the tunnel face is described according to the calculating results. The problem is convergent as the triangle block number in the calculation increases. It is found that the upper bound solutions of supporting pressure increase with the growth of the nonlinear coefficient, pore water pressure coefficient, height of the underground water table, and tunnel span. The collapse range of the tunnel face scales out with the increase of the nonlinear coefficient; however, it shrinks with the increase of the pore water pressure coefficient. Moreover, with the increase of the nonlinear coefficient, the impact strength on supporting pressure and collapse range declines gradually.
In order to avoid the case that the optimizing process cannot converge, the range of parameter φ0 was restricted on the basis of the general corresponding relationship between parameters. Therefore, the failure mechanism adopted in this paper could be further improved to solve the problem without restricting the parameter φ0.
Author Contributions
Zihan Yang: Methodology, Validation, Formal analysis, Data curation, Writing, original draft, Visualization. Yongxin Li: Validation, Formal analysis, Data curation, Writing, Original draft. Jingshu Xu: Validation, Formal analysis, Data curation, Writing, Original draft.
Data Availability Statement
The datasets in the current study available from the corresponding author on reasonable request.
Acknowledgements
The preparation of the paper has received financial supports from the National Natural Science Foundation of China (52208409, 52108312, 52208327), Hunan Provincial Natural Science Foundation of China (2022JJ40531) and China State Construction Engineering Corporation Limited Funded Project (CSCEC-2022-Z-16). The financial supports are greatly appreciated.
Conflicts of Interest
The authors declare that they have no known competing financial interests or personal relationships that could have appeared to influence the work reported in this paper.
References
- Hou, C.T.; Yang, X.L. 3D stability analysis of tunnel face with influence of unsaturated transient flow. Tunnelling and Underground Space Technology 2022, 123, 104414. [Google Scholar] [CrossRef]
- Zhong, J.H.; Yang, X.L. Kinematic analysis of the three-dimensional stability for tunnel faces by pseudodynamic approach. Computers and Geotechnics 2021, 128, 103802. [Google Scholar] [CrossRef]
- Li, T.Z.; Gong, W.P.; Yang, X.L. Stability analysis of a non-circular tunnel face in soils characterized by modified Mohr-Coulomb yield criterion. Tunnelling and Underground Space Technology 2021, 109, 103785. [Google Scholar] [CrossRef]
- Leca, E.; Dormieux, L. Upper and lower bound solutions for the face stability of shallow circular tunnels in frictional material. Geotechnique 1990, 40, 581–606. [Google Scholar] [CrossRef]
- Soubra, A.H. Three-dimensional face stability analysis of shallow circular tunnels. International Society for Rock Mechanics, Melbourne: CRC 2000, 19–24. [Google Scholar]
- Mollon, G.; Phoon, K.; Dias, D.; Soubra, A. Validation of a new 2D failure mechanism for the stability analysis of a pressurized tunnel face in a spatially varying sand. Journal of Engineering Mechanics 2011, 137, 8–21. [Google Scholar] [CrossRef]
- Michalowski, R.L. Slope stability analysis: a kinematical approach. Geotechnique 1995, 45, 283–293. [Google Scholar] [CrossRef]
- Huang, F.; Yang, X.L. Upper bound limit analysis of collapse shape for circular tunnel subjected to pore pressure based on the Hoek-Brown failure criterion. Tunneling and Underground Space Technology 2011, 26, 614–618. [Google Scholar] [CrossRef]
- Huang, F.; Zhang, D.B.; Sun, Z.B.; Wu, B. Influence of pore water pressure on upper bound analysis of collapse shape for square tunnel in Hoek-Brown media. Journal of Central South University of Technology 2011, 18, 530–535. [Google Scholar] [CrossRef]
- Zhong, J.H.; Hou, C.T.; Yang, X.L. Three-dimensional face stability analysis of rock tunnels excavated in Hoek-Brown media with a novel multi-cone mechanism. Computers and Geotechnics 2023, 154, 105158. [Google Scholar] [CrossRef]
- Hou, C.T.; Zhong, J.H.; Yang, X.L. Three-dimensional stability assessments of a non-circular tunnel face reinforced by bolts under seepage flow conditions. Tunnelling and Underground Space Technology 2023, 131, 104831. [Google Scholar] [CrossRef]
- Yang, X.L.; Yin, J.H. Slope stability analysis with nonlinear failure criterion. Journal of Engineering Mechanics 2004, 130, 267–273. [Google Scholar] [CrossRef]
- Fraldi, M.; Guarracino, F. Analytical solutions for collapse mechanisms in tunnels with arbitrary cross sections. International Journal of Solids and Structures 2010, 47, 216–223. [Google Scholar] [CrossRef]
- Yang, X.L.; Yang, Z.H.; Li, Y.X.; Li, S.C. Upper bound solution for supporting pressure acting on shallow tunnel based on modified tangential technique. Journal of Central South University 2013, 20, 3676–3682. [Google Scholar] [CrossRef]
- Viratjandr, C.; Michalowski, R.L. Limit analysis of submerged slopes subjected to water drawdown. Canadian Geotechnical Journal 2006, 43, 802–814. [Google Scholar] [CrossRef]
- Chen, W.F. Limit analysis and soil plasticity. The Netherland: Elsevier 1975, 37-39.
- Zhang, X.J.; Chen, W.F. Stability analysis of slopes with general nonlinear failure criterion. International Journal for Numerical and Analytical Methods in Geomechanics 1987, 11, 33–50. [Google Scholar] [CrossRef]
- Li, X. Finite element analysis of slope stability using a nonlinear failure criterion. Computers and Geotechnics 2007, 34, 127–136. [Google Scholar] [CrossRef]
- Lv, X.L.; Wang, H.R.; Huang, M.S. Limit theoretical study on face stability of shield tunnels. Chinese Journal of Geotechnical Engineering (In Chinese). 2011, 33, 57–62. [Google Scholar]
- Vermeer, P.A.; Ruse, N.; Marcher, T. Tunnel heading stability in drained ground. Felsbau 2002, 20, 8–18. [Google Scholar]
|
Disclaimer/Publisher’s Note: The statements, opinions and data contained in all publications are solely those of the individual author(s) and contributor(s) and not of MDPI and/or the editor(s). MDPI and/or the editor(s) disclaim responsibility for any injury to people or property resulting from any ideas, methods, instructions or products referred to in the content. |
© 2024 by the authors. Licensee MDPI, Basel, Switzerland. This article is an open access article distributed under the terms and conditions of the Creative Commons Attribution (CC BY) license (http://creativecommons.org/licenses/by/4.0/).
