Preprint
Article

Predictive Analysis for Road Safety Enhancement in Chicago County

Altmetrics

Downloads

117

Views

58

Comments

0

This version is not peer-reviewed

Submitted:

12 July 2024

Posted:

15 July 2024

You are already at the latest version

Alerts
Abstract
With the increasing incidents of fatal road injuries, there is an urgent need for developing effective road safety management systems. The study aims to develop predictive models based on machine learning to forecast the likelihood of road collisions depending on factors like weather, road condition, time, and driver behaviour in Chicago, USA. A machine learning approach has been applied to the crash dataset to evaluate the factors affecting the prevalence of road accidents. Python programming and the Jupyter Notebook platform have been used for performing descriptive statistics, correlation and three classification algorithms (Random Forest, K-Nearest Neighbor (KNN), Decision Tree and MLP Classification). Obtained accuracy of the KNN classifier is slightly higher than the other two classification models. The research explored insights into collision patterns related to roads, locations, and intersections. The study helps to increase road safety through targeted interventions with resource prioritisation, reducing the frequency and severity of traffic incidents by leveraging historical accident data with diverse spatial analysis techniques.
Keywords: 
Subject: Computer Science and Mathematics  -   Artificial Intelligence and Machine Learning

1. Introduction

1.1. Background of the Study

Artificial intelligence (AI) has shown a huge success in different domain such as image [1–10] audio [11–17] and many others [18,19]. An increase in traffic accidents is one of the many externalities brought about by the population and country expansion. Every year, road accidents result in millions of lives in addition to significant economic, social and environmental ramifications [1]. Numerous attempts such as traffic management, road clearance have been undertaken to lower the severity and frequency of the road accidents [2]. However, due to lack of proper road safety measurements, these conventionalr methods have not been able to properly handle road safety.

1.2. Problem Statement

There is still potential for progress in addressing this issue and more creative methods can be developed to increase the effectiveness of road safety management. Therefore, this study aims to address the road safety and collision issues in Chicago through a detailed predictive modelling which can be built based on past road traffic and collision data.

1.3. Research Rationale

Considering the benefits of the latest technologies like ML, the research is also motivated to apply the ML models like ANN, DNN, or classification algorithms to real-life cases like road safety enhancement in Chicago. Thus, the research intends to apply the ML models for forecasting the collisions which would help in improving overall public safety and well-being.

1.4. Research Aims and Objectives

Research Aims
  • Primary aim: The primary aim of the study is to identify the key factors contributing to the traffic collisions in Chicago by comprehensively analysing the crash dataset.
  • Secondary aim: The secondary aim of the study is to develop predictive models that can be able to forecast the possibilities of different collisions depending on factors like weather, road condition, time, and driver behaviour.
Research Objectives
Primary Objective
  • To extensively analyse the crash dataset for gaining an in-depth understanding of the factors such as weather, road conditions and driving behaviours contributing to the collisions in Chicago.
Secondary Objectives
  • To generate predictive models for forecasting the likelihood of the different types of collisions based on a range of factors including weather, time of the day, road conditions.
  • To perform analysis of the dataset, identifying collision hotspots and patterns related to specific locations, roads, and intersections.

1.5. Research Questions

Primary Research Question
  • What are the key primary factors contributing to the traffic collisions in Chicago?
Secondary Research Questions
  • How well can machine learning models forecast the possibility of various collision types depending on changing conditions like the weather, state of the road, and the time of the day?
  • What are the locations, roads and intersections that are related to certain collision hotspots in Chicago?

1.6. Research Hypothesis

  • The machine learning models developed in this research project and the results obtained from this analysis will be extendable on other similar datasets from other parts of the world.
  • Specific machine learning algorithms developed as part of this research might perform better or worse based on the nature of the data, its complexity, and the relationship between features and outcomes.
  • Machine learning algorithms can uncover hidden patterns, relationships, or associations within the data that might not be immediately apparent through traditional analysis.
  • Machine learning models will identify and utilise the most relevant features, thereby improving prediction accuracy and reducing overfitting.

1.7. Novelty of the Research

Analysing the elements such as road conditions, and driving behaviours that influence the number of traffic accidents helps to enhance road safety. This research represents a novel approach through the application of predictive modelling for addressing the complex relationship between factors such as road condition, driver behaviour, and time of the day, contributing to road collisions.

1.8. Organisation of the Study

  • The introduction explains the foundation for research while outlining the objective and reason for the study.
  • The literature review reviews past publications on this issue and highlights shortcomings to be addressed.
  • Research Methodology explains the models, and data collection approach, along with the method and philosophy undertaken to ethically establish the research.
  • Data Analytics applies the ML models to the collected data for predictive analytics.
  • The discussion summarises the findings from the models and aligns with prior research.
  • The conclusion addresses the research problem concerning the findings and also provides suggestions for future study.

2. Literature Review

2.1. Trends in Traffic Accidents and Fatalities Across the World

Traffic accidents have emerged as a major reason for health problems such as bone injuries, trauma, soft tissue injuries where the action and reaction of a person or an object causes personal injury as well as property damage. An estimated 1.35 million people die or become disabled as a consequence of traffic accidents each year, with vulnerable road users including pedestrians, cycles, and motorcycles accounting for a large percentage of these deaths [3]. Millions of people sustain non-fatal injuries in addition to fatal ones, which causes impairments and financial difficulties because of lost income and medical expenditures.

2.2. Factors Included in Major Traffic Accidents

The number of collisions and fatalities on the roads nowadays is one of the biggest problems facing the entire world. The primary predictors of the frequency of incidents, as identified by researchers, include inattention, reckless driving, overturn and brake failure incidents, average relative humidity and temperature, and collisions between passenger cars and pickup trucks [4]. Diverse studies showed a clear positive correlation between driving during the day and unfavourable weather conditions such as rain, fog, and slippery pavement and traffic accidents [5]. Therefore, it can be stated that both driving behavioural factors and environmental factors along with the present road condition usually influence traffic incidents, reducing road safety.

2.3. Role of Technology in Road Safety

The latest digital technologies such as AI, ML, Internet of Things (IoT), Global Positioning System (GPS), simulators, and big data are helpful in determining and offering data on factors related to road safety such as operating environment, road characteristics and road user behaviour. The impact of random variations on roadway security can be easily identified through the Smart Road Traffic Management System or SRTMS [8]. Technology-driven strategies put traffic safety first, raise driver awareness and make a major difference in preventing and reducing accidents on roads, which raise the overall road safety standards.

2.4. Predictive Modelling for Enhancing Road Safety

On highways, traffic accidents continue to be the primary reason for fatalities, serious injuries and major disruptions. Diverse research studies also developed a dataset to identify potentially risky routes in response to an increase in traffic accidents, which disproportionately harm women [7]. Establishing a high-precision model that presents the likelihood of every category of future accidents may be achieved by modelling the magnitude of accidents utilising the most effective factors like behavioural and environmental factors. Therefore, it can be stated that predictive modelling using advanced algorithms offer promising solutions for enhancing road safety, however, their effectiveness is highly dependent on the data and models used.

2.5. Literature Gap

Even though the analysis of prior research showcases a comprehensive overview of the present research problem, there is still room for improvement. For more precise accident prediction and prevention, additional research is needed to create predictive models that take into account real-time data [6,9]. Therefore, this research seeks to consider the diverse factors influencing road accidents in Chicago, USA where the majority of the traffic incidents are reported, with the application of latest predictive modelling algorithms like Random Forest.

3. Methodology

3.1. Proposed Methodological Architecture

Figure 1. Flow Chart of the process of developing the artefact
Preprints 112028 g001
The above methodological architecture mainly follows a structured approach emphasising diverse stages such as data loading, importing necessary libraries, and data exploration involving analysis of its shape, present columns, and dataset information. Data cleaning and preprocessing contain handling null values, dropping irrelevant columns, encoding categorical features, and grouping target variable total injuries. Data visualisations then help to understand the patterns and trends of the features enlisted in the data. After that, data splitting helps to train and test the predictive model for accuracy prediction in this context. Predictive models such as Random Forest Classifier, K-Nearest Neighbour Classifier, Decision Tree Classifier and MLP Classification are performed with significant metrics of accuracy percentage, classification report. The Comparison based on the accuracy score explores the next-fitted model to predict the total injuries adequately.

3.2. Data Collection

This dataset enables a thorough exploration of factors impacting traffic accidents, providing informed decision-making with accident prevention strategies. Initially, a case study of Montgomery County was selected but after extensive research it was found that the Chicago county of the US has the highest number of road crashes as well as traffic related problems as compared to Montgomery County. This has helped to gather a dataset which helps to understand all the factors leading to traffic crashes leading to developing the models with proper results.

3.3. Machine Learning Models

Machine learning models like Random Forest, K-Nearest Neighbour Classifier,Decision Tree Classifier and MLP Classifier are suitable for analysing crash data due to their capability to handle complicated patterns and nonlinear relationships within the data. Thus, these effective machine learning models are employed in this context to analyse traffic crash data adequately.

3.4. Chapter Summary

With approaching a positivist belief, deductive technique and quantitative analysis, multiple ML models have been applied to the Chicago crash data. This methodology chapter has thus demonstrated the systematic approach taken for this research to properly develop the prediction models through ML algorithms.

4. Data Analysis and Findings

4.1. Introduction

Data analysis is the process of evaluating data for the fulfilment of the research aim and objectives. In this context, a machine learning approach of data analysis has been performed to evaluate the factors affecting road crashes in Chicago city through the application of descriptive (summary statistics, visualisation and correlation) and predictive analytics (classification algorithms).

4.2. Dataset Exploration

The shape of the dataset has been checked using the ‘shape’ function in Python, from which the observed shape of the dataset is (746498,49), indicating the dataset has 746498 observations and 49 features [Refer to Figure 2].

4.3. Data Preprocessing

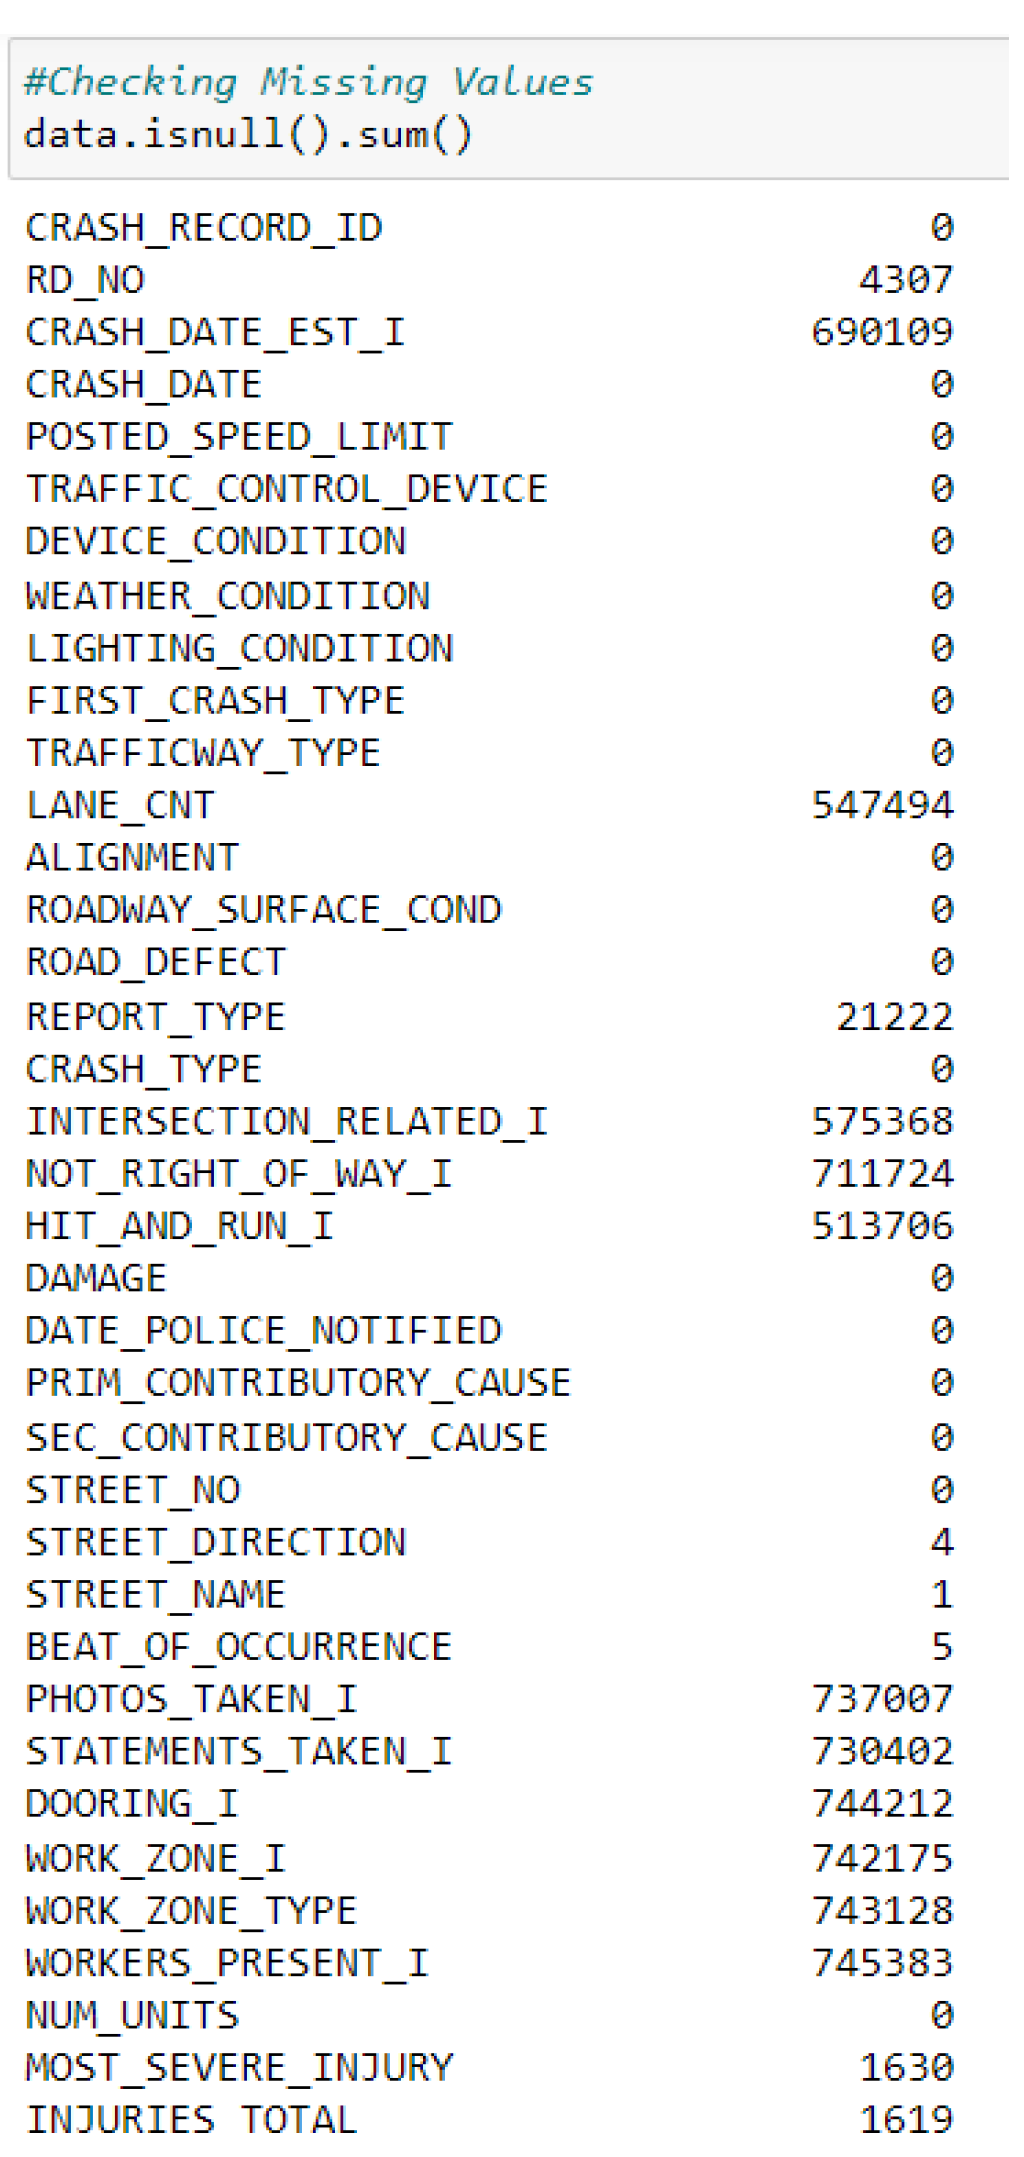
Null values in the dataset have been checked using the isnull ().sum() function in Python. As a result, the columns with missing values have been dropped from the dataset using the ‘data.drop’ function in Python, reducing data redundancy in the dataset [Refer to Figure 3 ].
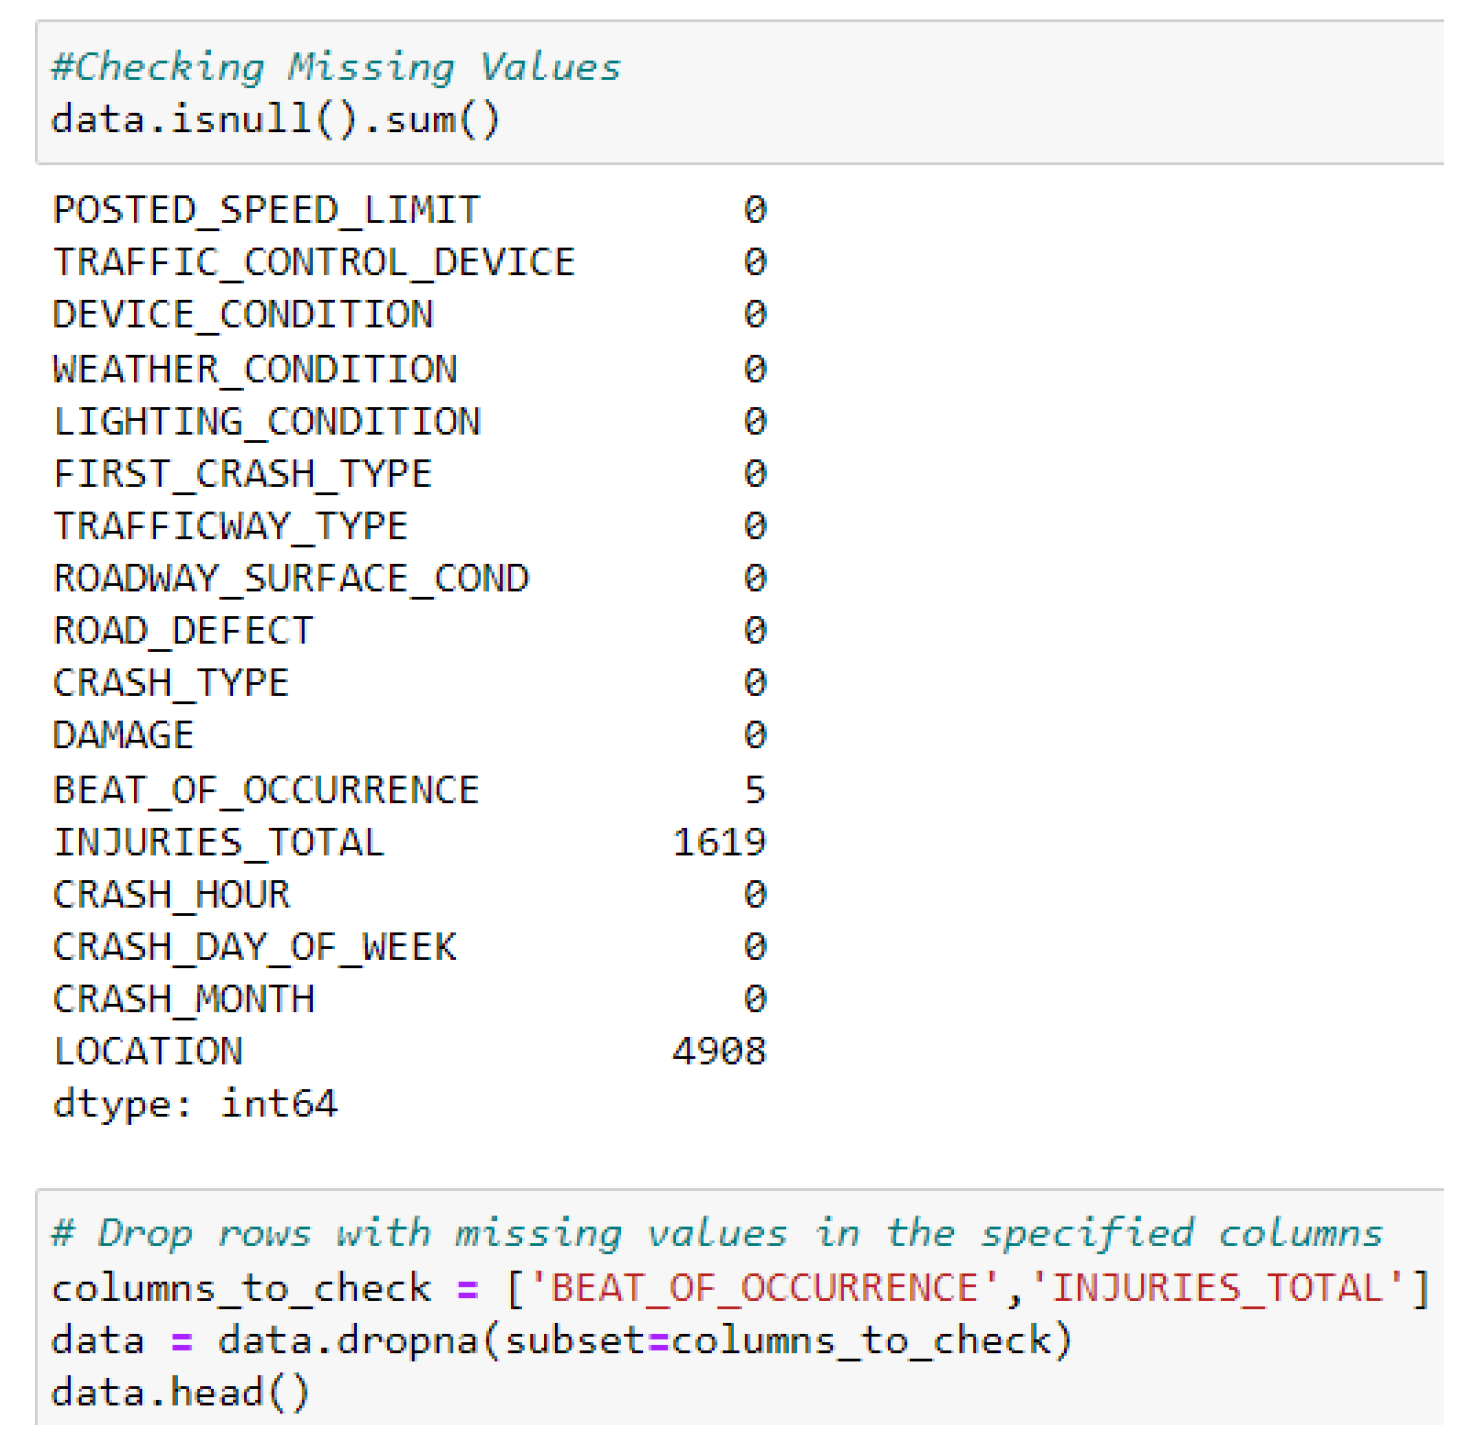
Figure 5 demonstrates that the variables ‘INJURIES TOTAL’ and ‘LOCATION’ contain 1619 and 4988 missing values. Due to this, these two columns (‘INJURIES TOTAL’ and ‘LOCATION’) have been dropped from the dataset, helping in the improvement of the structural integrity of the dataset.
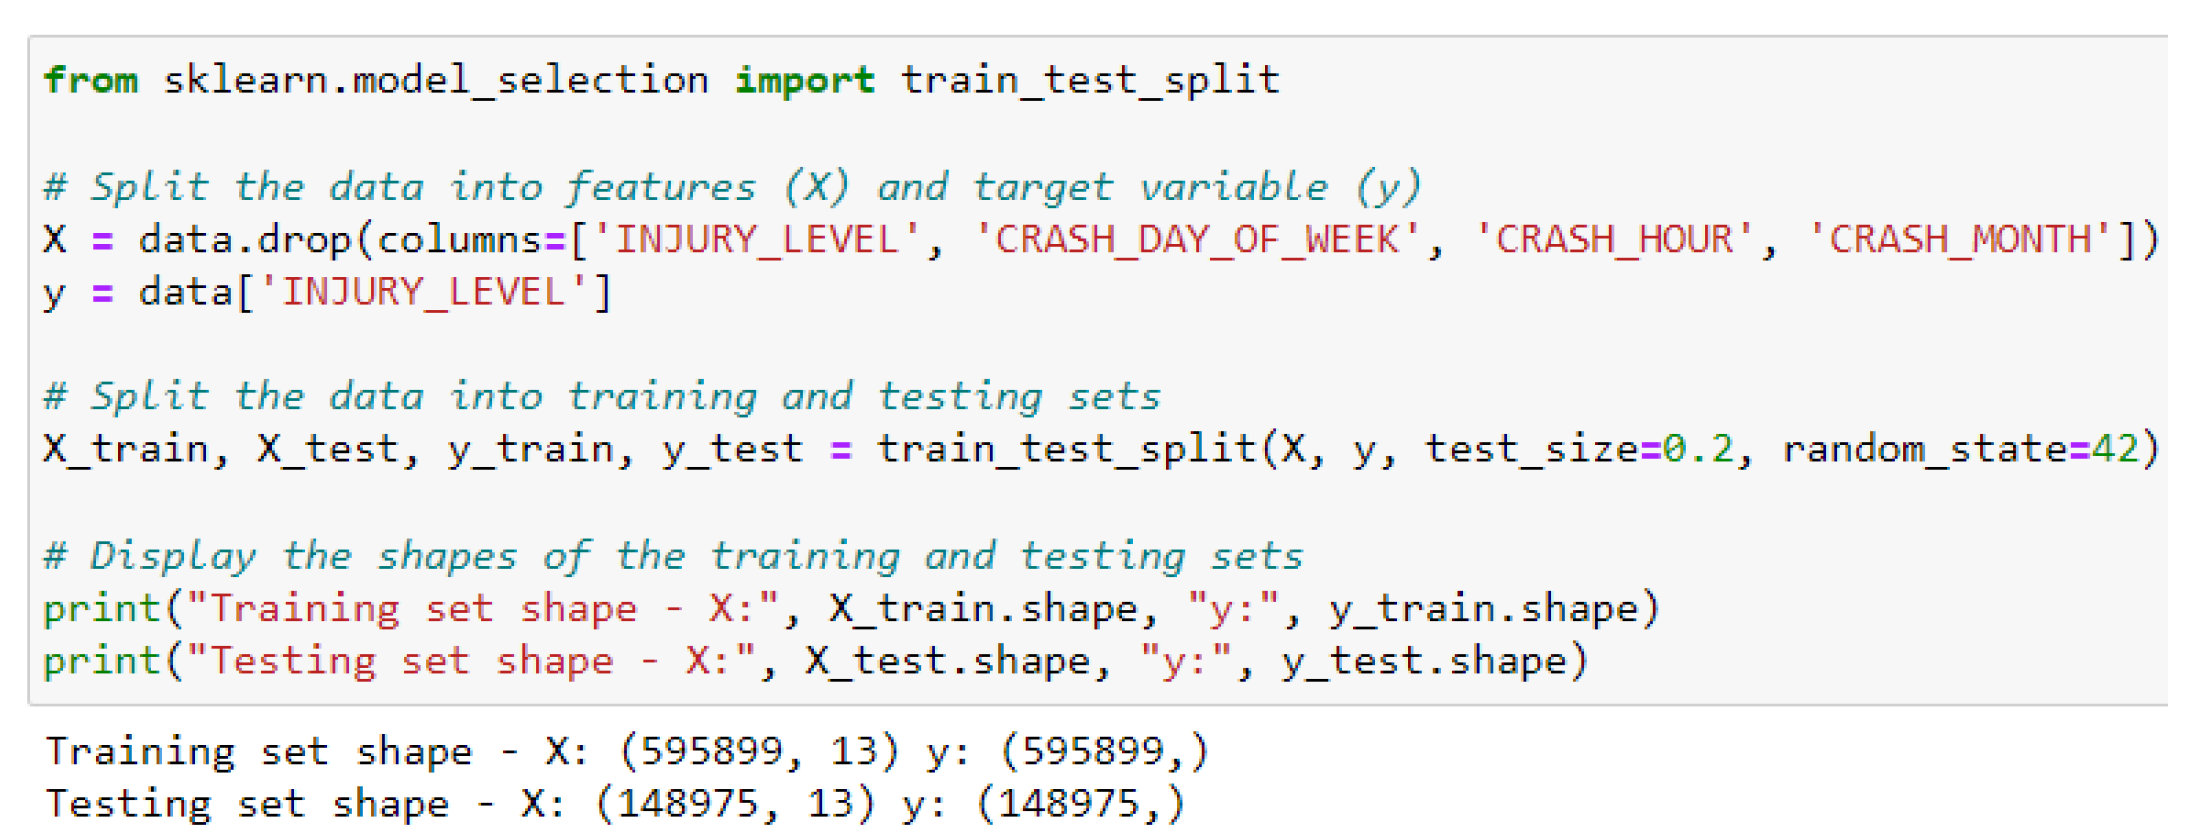
The data is split into training and testing sets by using an 80-20 ratio, as shown in Figure 6. This specific approach helps prevent overfitting by allowing the models to eventually generalise to unseen data, thus offering a more reliable assessment of their predictive ability [Refer to Figure 6].

4.4. Exploratory Data Analysis and Data Visualisations

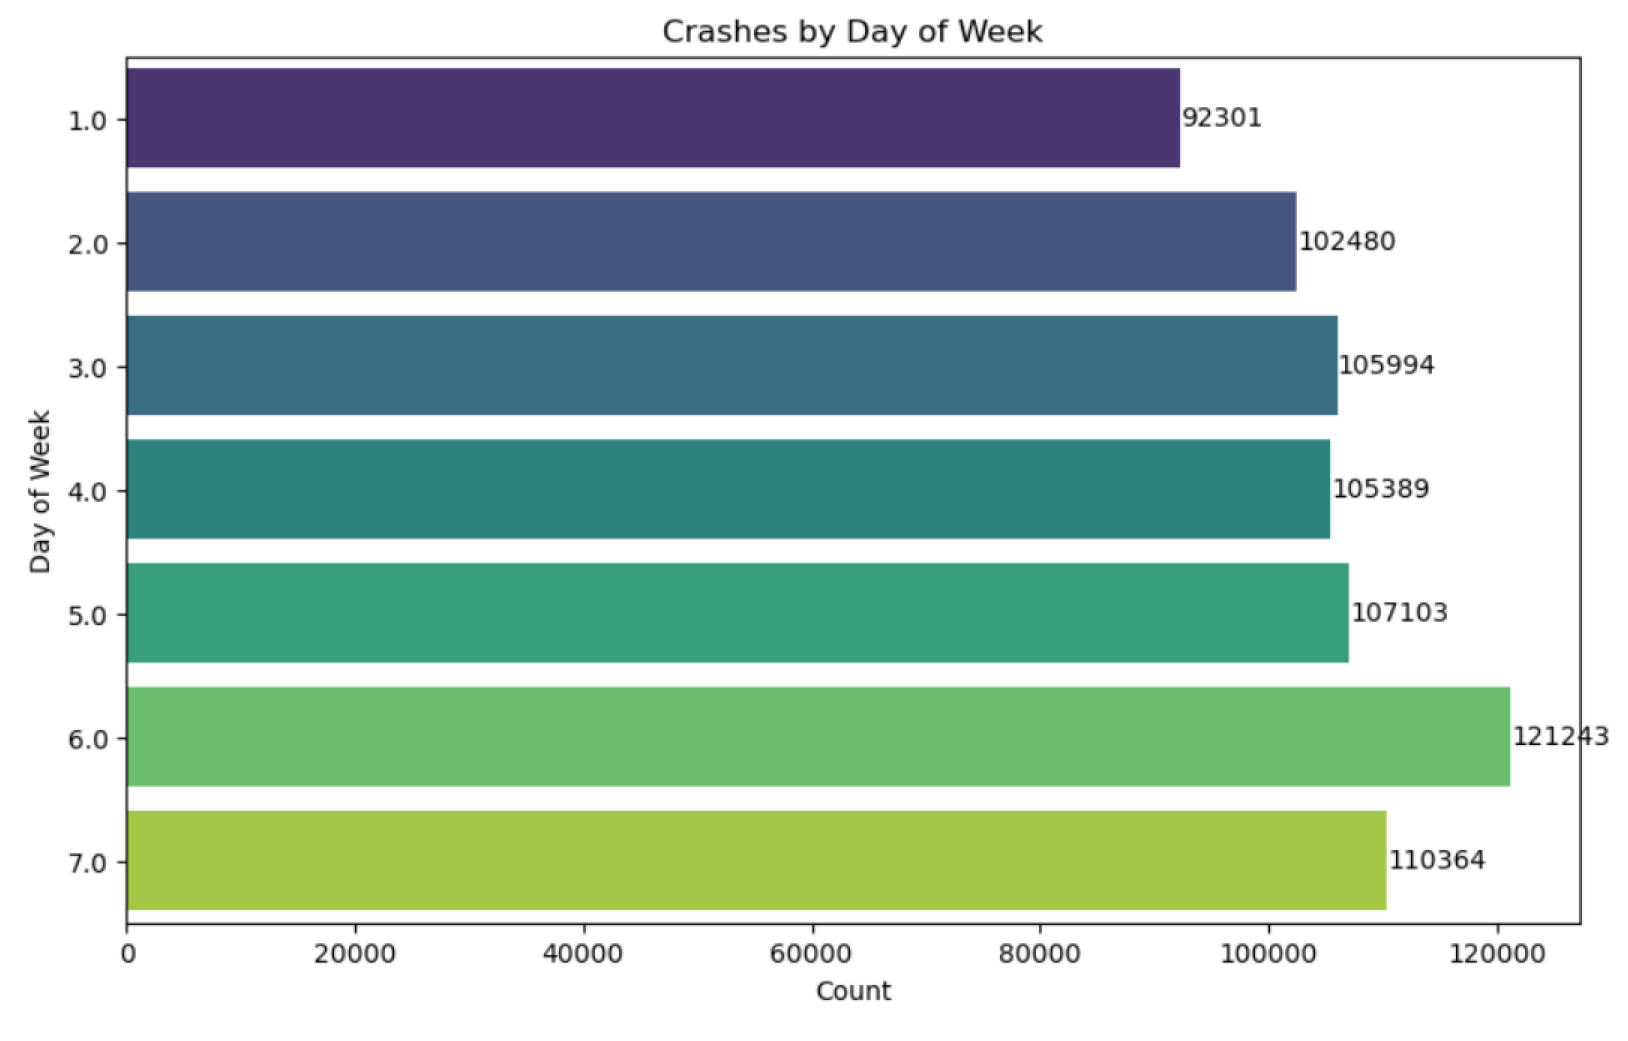
Figure 7 demonstrates the distribution of crashes across the day of the week, from which it can be observed that the number of crashes was comparatively higher on Saturday (121243) and Sunday (110364). On the other hand, the prevalence of crashes was comparatively low (92301) on Monday in Chicago.
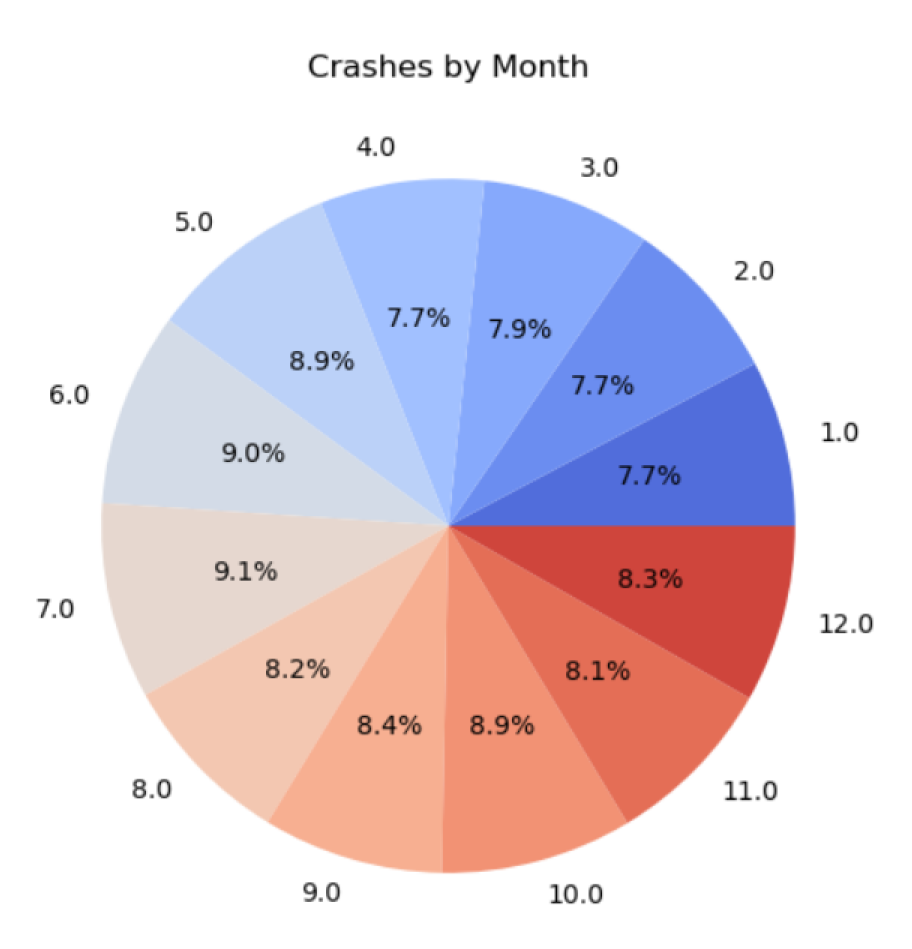
Figure 8 shows the distribution of crashes in Chicago in each of the 12 months of the year. From the above Figure, it can be inferred that the prevalence of crashes was nearly the same (approximately (8percent-9 percent) across the 12 months of the year.
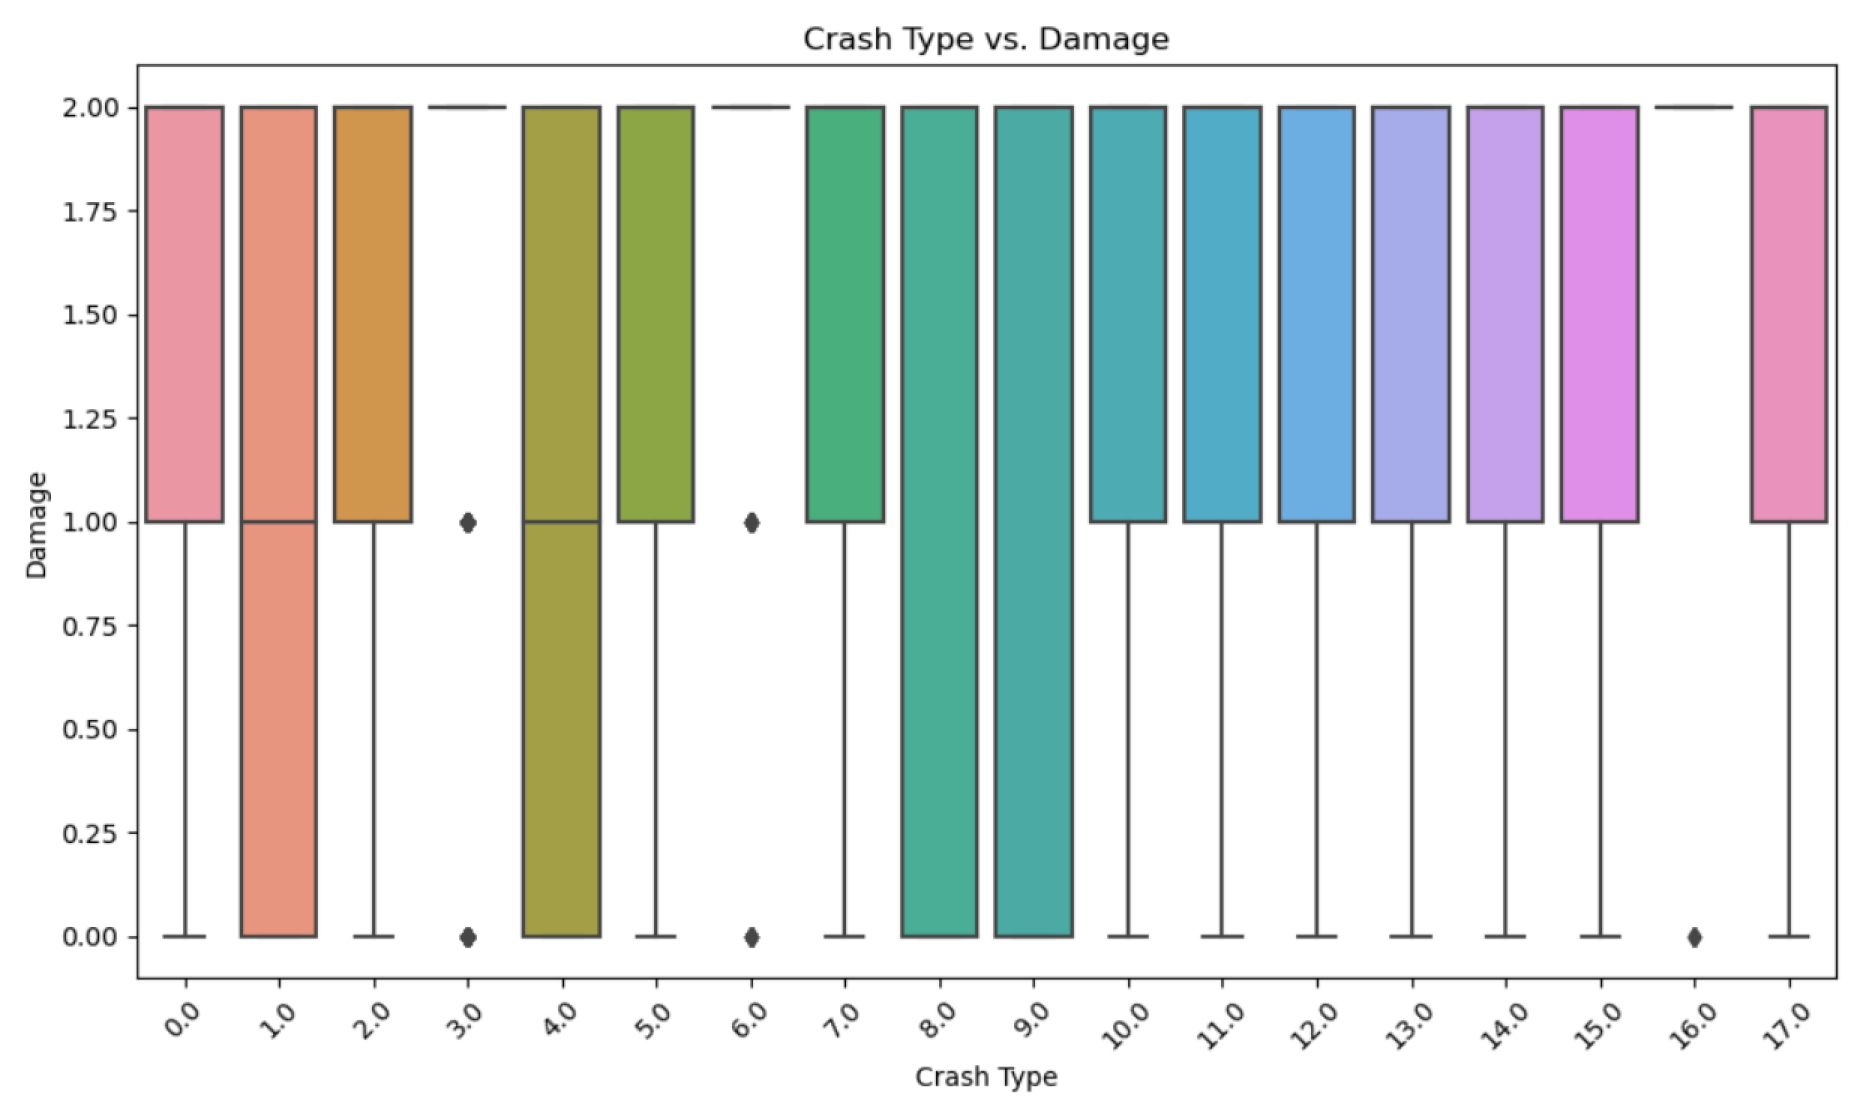
Figure 9 demonstrates the distribution of crash types by damage level, from which it can be observed that damage levels were highest for crash types 8 and 9. On the other hand, the damage levels for crash types 0, 7, 15 and 17 (less severe crashes) were considerably low. This leads to the possible indication that Crash types 8 and 9 may involve scenarios such as head-on collisions or collisions with fixed objects like trees or barriers, which fundamentally result in more extensive damage due to the high-impact forces involved.

4.5. Predictive Models

4.5.1. Random Forest Classifier
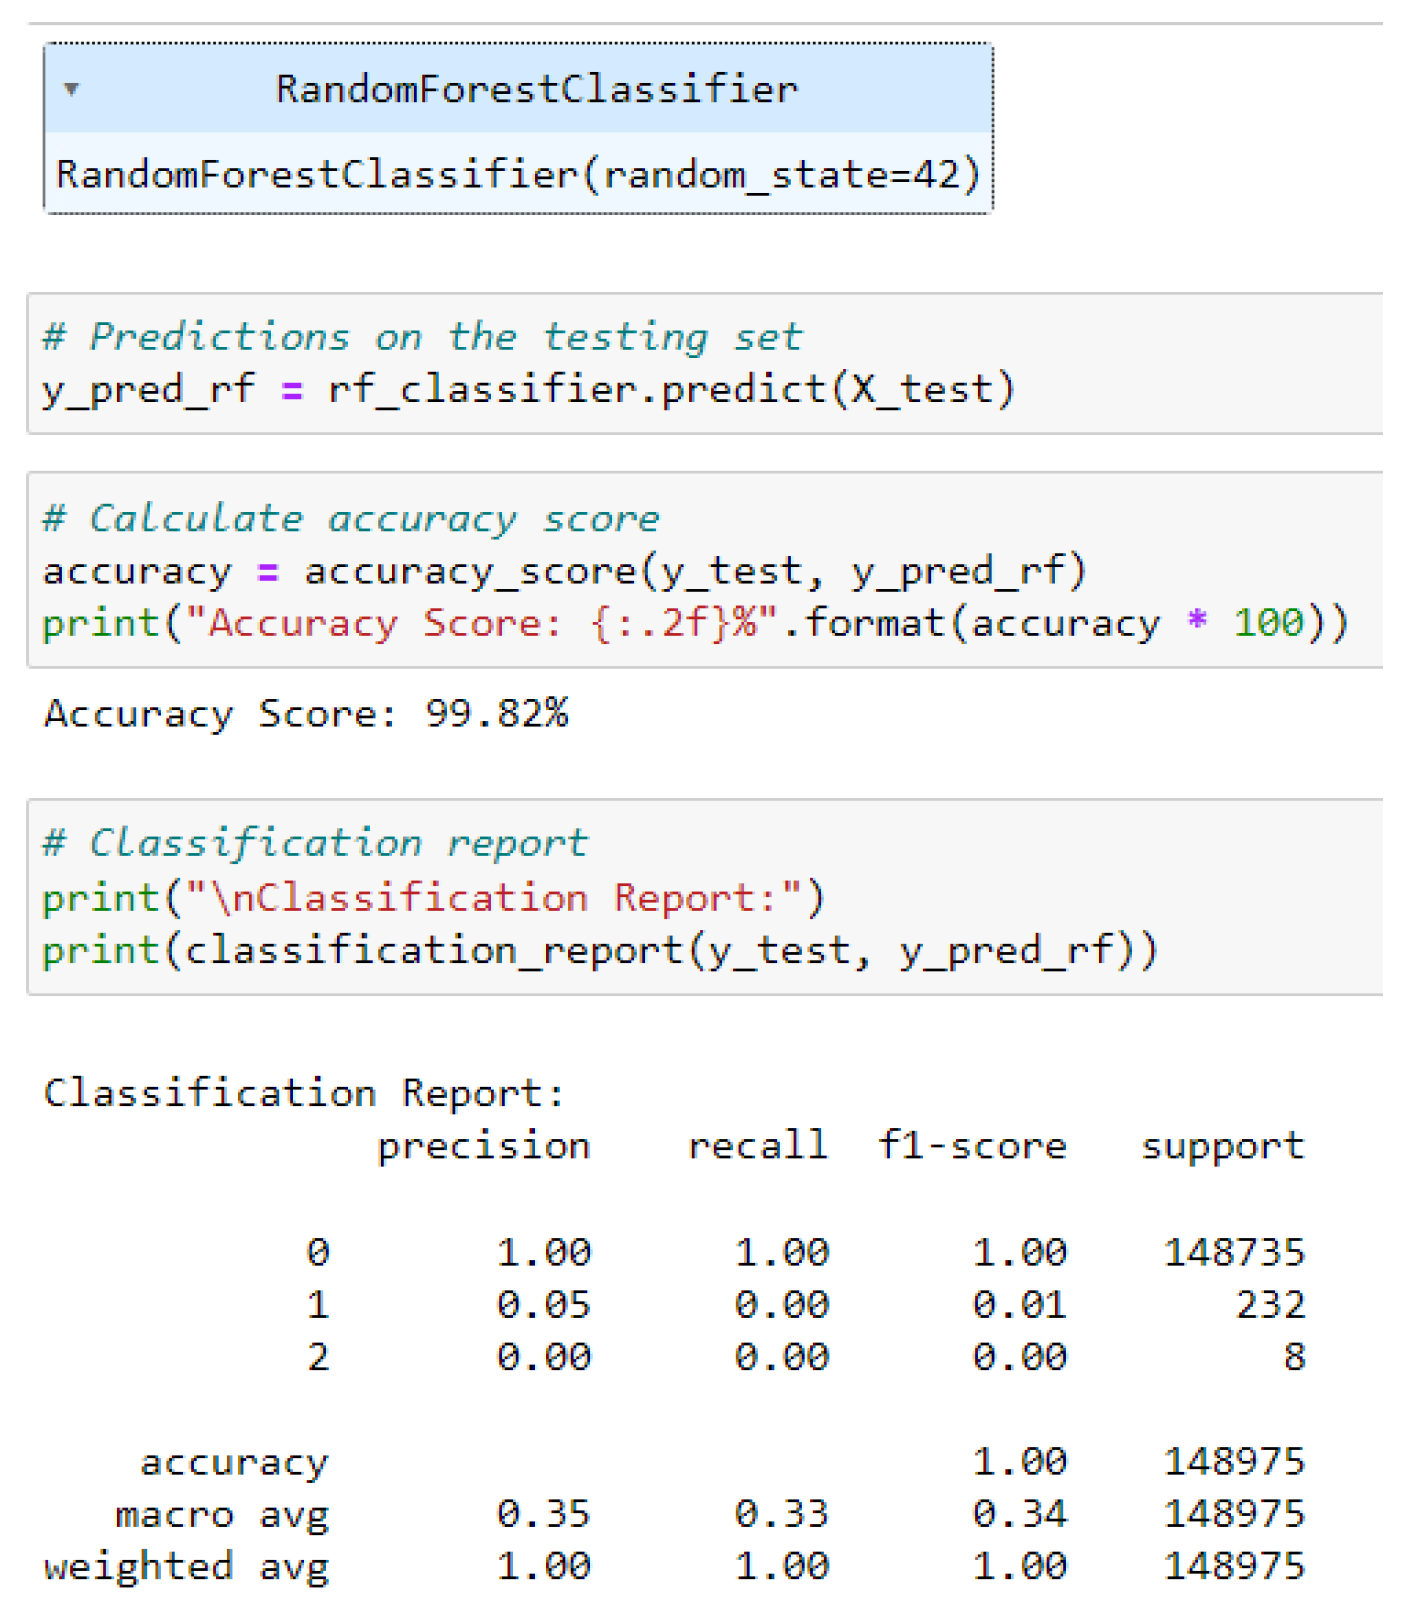
Figure 10. Evaluation of Random Forest Classifier
Preprints 112028 g010
The random forest classifier is trained on the training set and accomplished an accuracy score of 99.82 percentage on the testing set, signifying high performance. Moreover, upon close inspection using the classification report, it is observed that the model struggles with minority classes.

4.5.2. KNN Classifier

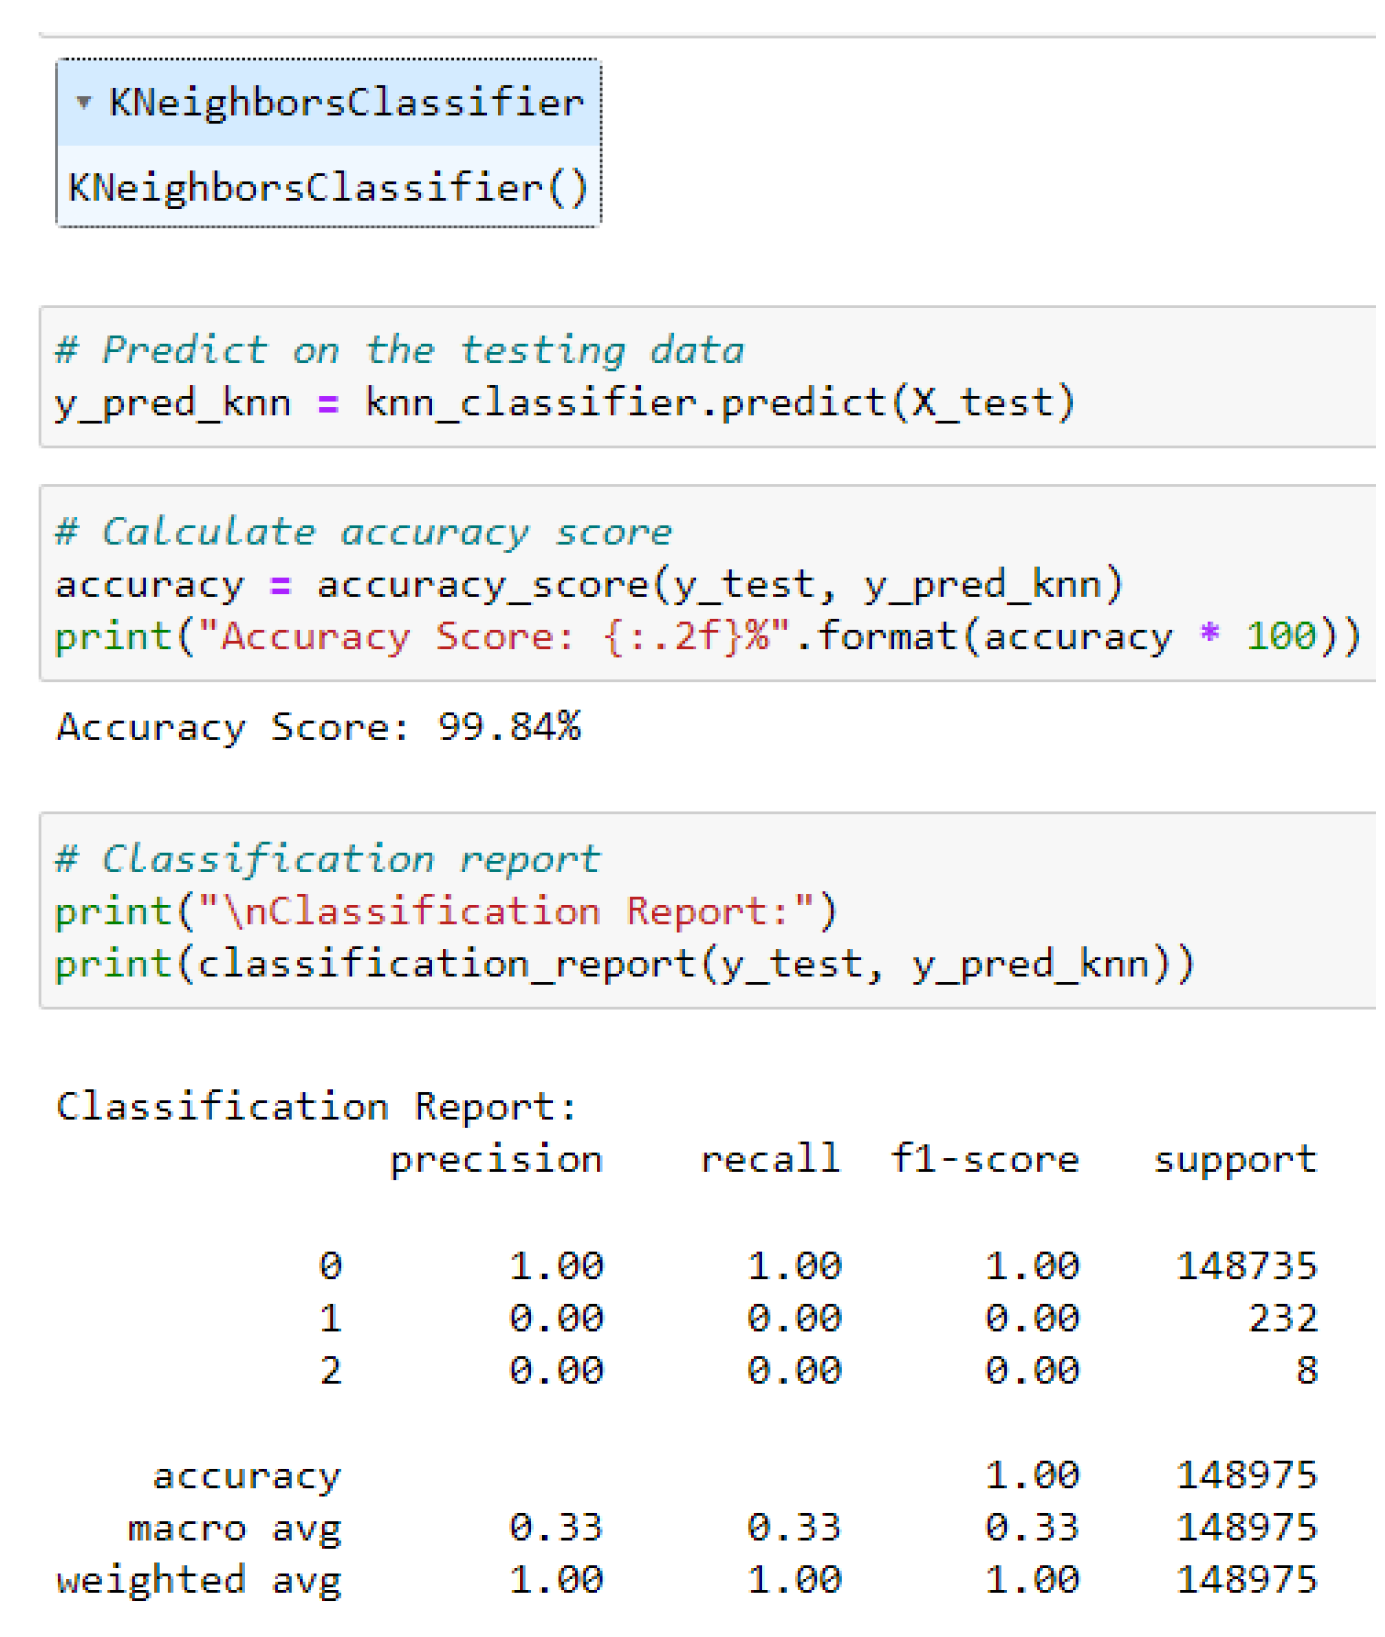
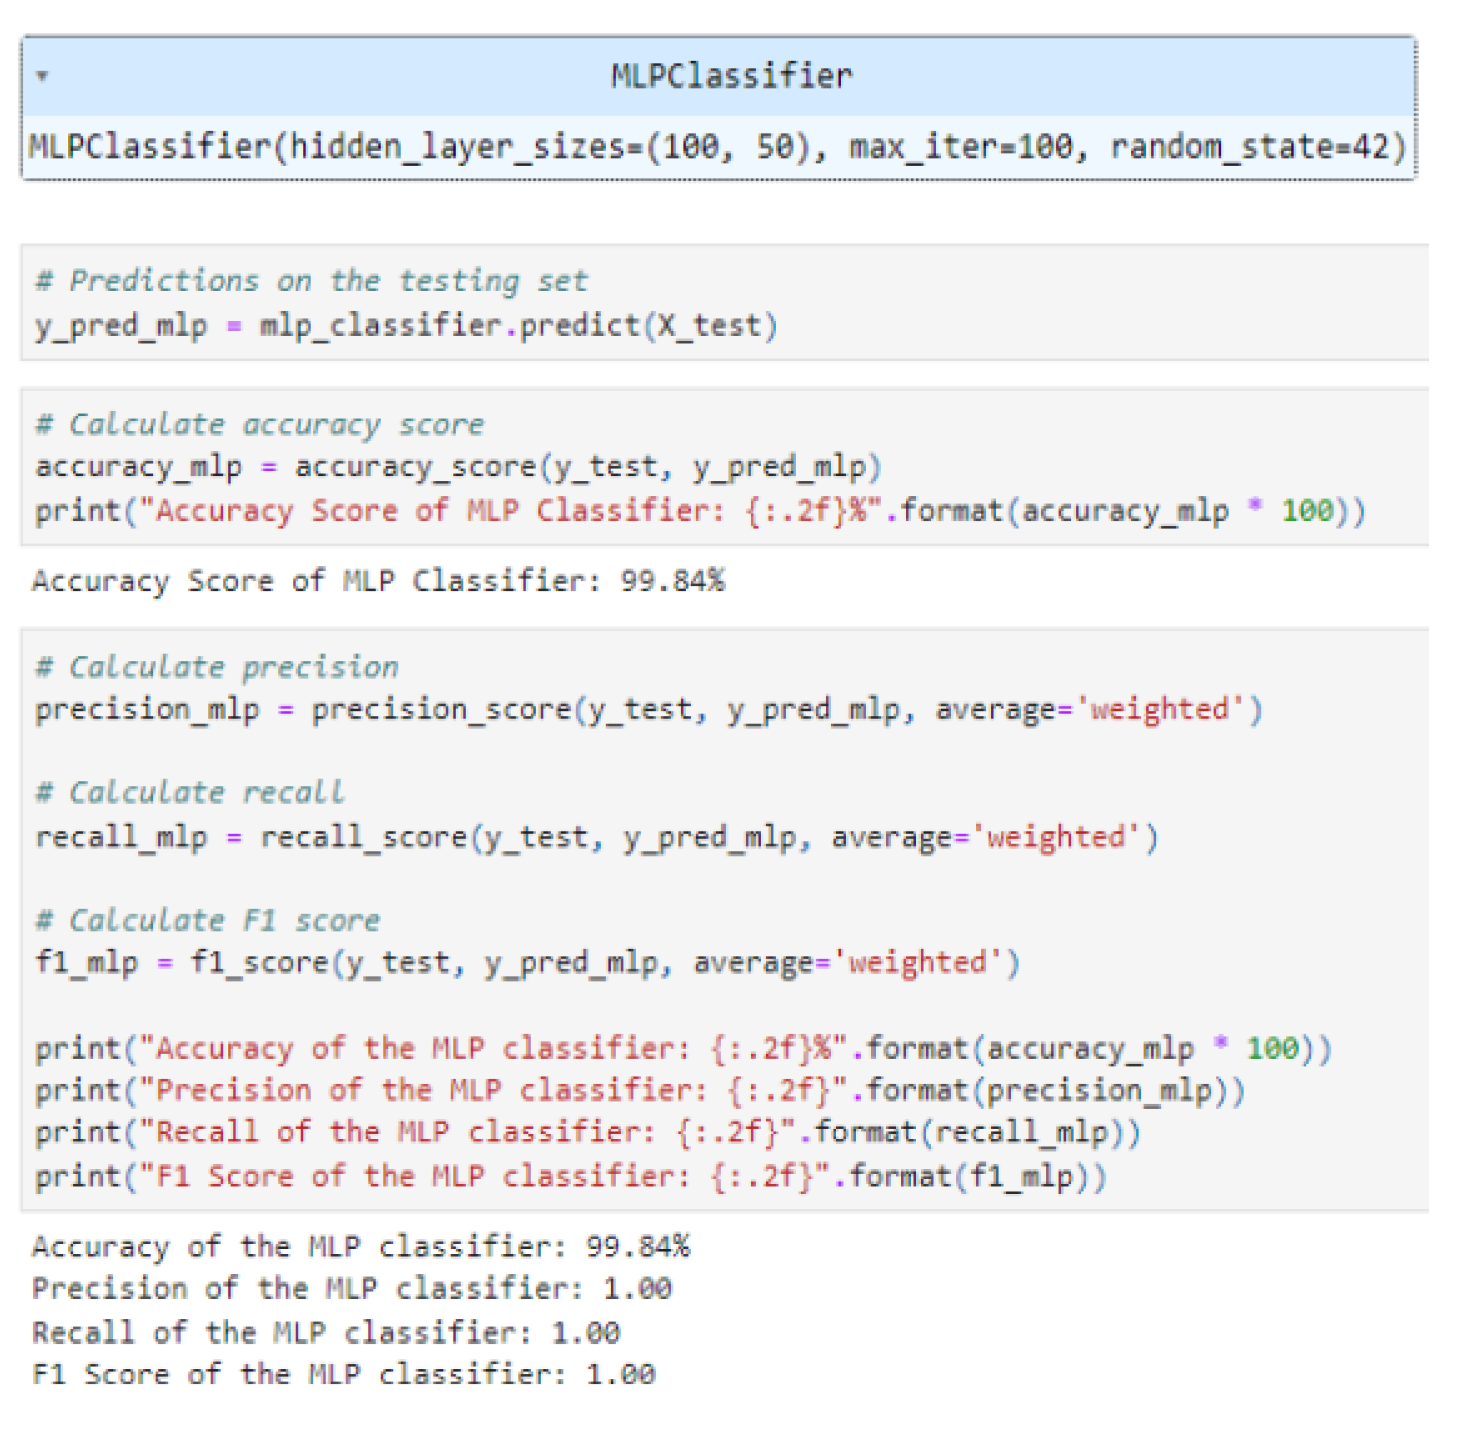
The KNN classifier accomplishes a commendable accuracy score of 99.84 percent on the testing crash data. However, its evaluation performance on minority classes (1 and 2) is insignificant as shown by the classification report in Figure 11

4.5.3. Decision Tree Classifier

Figure 12. Evaluation Performance of Decision Tree Classifier
Preprints 112028 g012
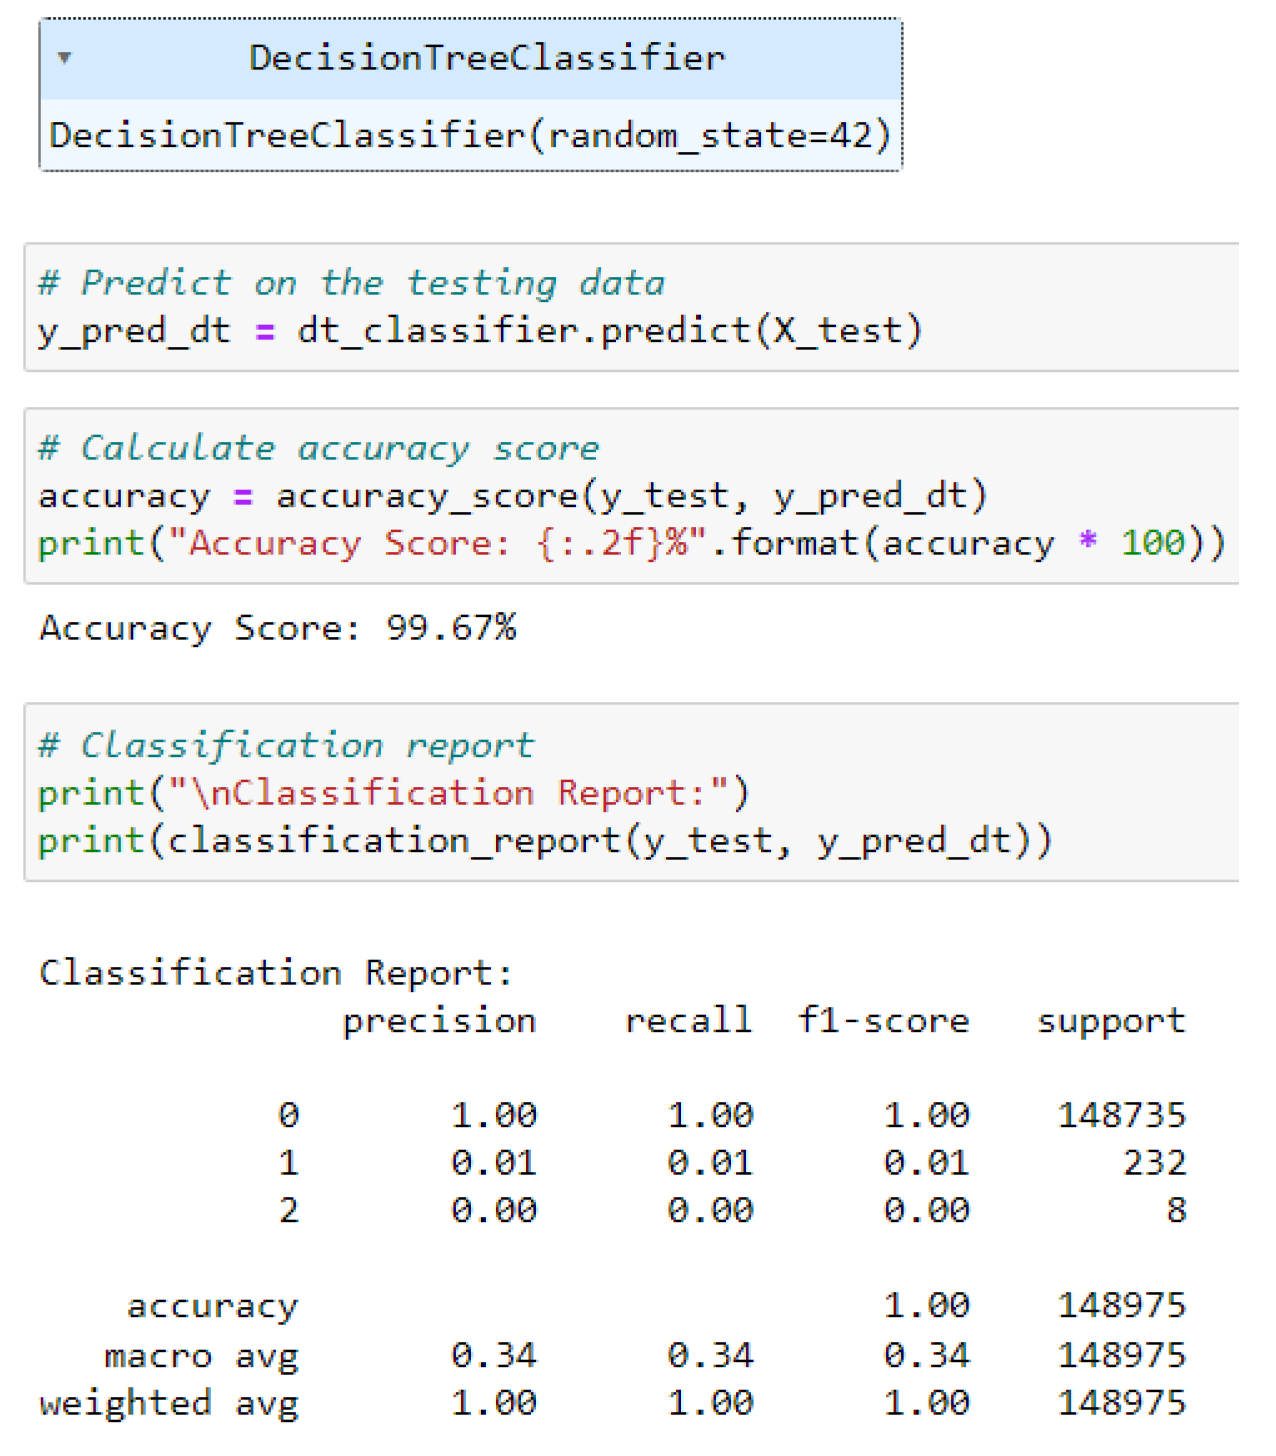
The Decision Tree classifier illustrates a robust accuracy of 99.67 percent, as evidenced by the classification report in Figure 9. However, it also struggles similarly to the previous classification models in accurately predicting minority classes with low precision and recall scores for classes 1 and 2.

4.5.4. MLP Classifier

The accuracy obtained from the MLP classifier is 0.9984, indicating that 99.84 percent of the instances were accurately captured by the MLP model [Refer to Figure 13]. This highlights the significantly high accuracy of the model for the prediction of road crashes in Chicago.

4.6. Comparison Between the Model Accuracy

Table 1, represents the classification accuracy of the three classification models, from which the obtained accuracy for the KNN model is slightly higher (99.84 percent) than the other two models MLP classifier (99.84 percent), Random Forest (99.82 percent) and Decision tree classifier model (99.67 percent).

5. Discussion

5.1. Summary of Findings

Upon splitting the data into training and testing sets with an 80-20 ratio, classification models are trained as well as evaluated, involving Random Forest, KNN, and Decision Tree classifiers. These classification models mainly exhibit high overall accuracy, accomplishing utmost accuracy, they struggle with minority classes (1 and 2) as evidenced by low precision and recall scores in the classification reports. This highlights potential class imbalance issues, where the predictive models inadequately favour the majority class (0) and struggle to accurately predict instances from minority classes.

5.2. Discussion of the Findings with Respect to Prior Research

A comprehensive understanding of these factors impacting road traffic incidents can easily be gained by analysing the crash dataset. This analysis identifies risk factors and evaluates targeted interventions to enhance road safety. Primary Objective has been discussed through evidenced-based interventions and analysing of the crash dataset to gain an in-depth understanding of each significant feature. The entire analysis explores patterns and correlations within the data, enabling the identification of each key predictor with the evaluation of these predictive models. Thus, Secondary Objective has been discussed through employing the classification models for predicting the likelihood of distinct types of collisions based on the predictors enlisted in the data. In addition to that, spatial analysis techniques can also be employed to recognise clusters of accidents to assess their proximity to diverse road features with infrastructures. Thus, Secondary Objective has been discussed by performing analysis of the data to leverage data-driven insights and address collision hotspots adequately.

6. Conclusions and Future Work

6.1. Linking with Objectives and Hypotheses

Based on the above discussion it can be stated that there exists a significant relationship between fatal road traffic incidents and variables such as type of road, impaired visibility, accident location, weather, and timing of the incident. Findings from past literature through the utilisation of different crash datasets have emphasised the existence of a significant correlation between the fatality of road accidents and factors such as type of road, impaired visibility of the drivers, bad weather conditions and timing of accidents.

6.2. Implications of the Results and Applications of the Research

Establishing a high-precision approach that presents the likelihood of every category of future accidents can be achieved by modelling the magnitude of accidents utilising the most effective factors like behavioural and environmental factors. This model can then be used to help authorities choose remedial actions related to identification of accident-prone zones or areas.

6.3. Recommendations for Future Work

Future study can include more diverse quantitative data to enhance the depth of the findings, leading to the enhancement of the generalisability of the findings. In addition to that, additional factors such as driving behaviour and the effectiveness of the traffic control system can be added in future research to enhance depth of findings.

References

  1. Kumar, T., Mileo, A. & Bendechache, M. KeepOriginalAugment: Single Image-based Better Information-Preserving Data Augmentation Approach. ArXiv Preprint ArXiv:2405.06354. (2024).
  2. Roy, A., Bhaduri, J., Kumar, T. & Raj, K. A computer vision-based object localization model for endangered wildlife detection. Ecological Economics, Forthcoming. (2022).
  3. Kumar, T., Mileo, A., Brennan, R. & Bendechache, M. Image data augmentation approaches: A comprehensive survey and future directions. ArXiv Preprint ArXiv:2301.02830. (2023).
  4. Kumar, T., Mileo, A., Brennan, R. & Bendechache, M. RSMDA: Random Slices Mixing Data Augmentation. Applied Sciences. 13, 1711 (2023).
  5. Chandio, A., Gui, G., Kumar, T., Ullah, I., Ranjbarzadeh, R., Roy, A., Hussain, A. & Shen, Y. Precise single-stage detector. ArXiv Preprint ArXiv:2210.04252. (2022).
  6. Kumar, T., Turab, M., Raj, K., Mileo, A., Brennan, R. & Bendechache, M. Advanced Data Augmentation Approaches: A Comprehensive Survey and Future directions. arXiv 2023. ArXiv Preprint ArXiv:2301.02830.
  7. Kumar, T., Park, J., Ali, M., Uddin, A. & Bae, S. Class specific autoencoders enhance sample diversity. Journal Of Broadcast Engineering. 26, 844-854 (2021).
  8. Aleem, S., Kumar, T., Little, S., Bendechache, M., Brennan, R. & McGuinness, K. Random data augmentation based enhancement: A generalized enhancement approach for medical datasets. arXiv 2022. ArXiv Preprint ArXiv:2210.00824.
  9. Kumar, T., Park, J., Ali, M., Uddin, A., Ko, J. & Bae, S. Binary-classifiers-enabled filters for semi-supervised learning. IEEE Access. 9 pp. 167663-167673 (2021).
  10. Chandio, A., Gui, G., Kumar, T., Ullah, I., Ranjbarzadeh, R., Roy, A., Hussain, A. & Shen, Y. Precise single-stage detector. ArXiv Preprint ArXiv:2210.04252. (2022).
  11. Chandio, A., Shen, Y., Bendechache, M., Inayat, I. & Kumar, T. AUDD: audio Urdu digits dataset for automatic audio Urdu digit recognition. Applied Sciences. 11, 8842 (2021).
  12. Turab, M., Kumar, T., Bendechache, M. & Saber, T. Investigating multi-feature selection and ensembling for audio classification. ArXiv Preprint ArXiv:2206.07511. (2022).
  13. Raj, K., Singh, A., Mandal, A., Kumar, T. & Roy, A. Understanding EEG signals for subject-wise definition of armoni activities. ArXiv Preprint ArXiv:2301.00948. (2023).
  14. Kumar, T., Park, J. & Bae, S. Intra-Class Random Erasing (ICRE) augmentation for audio classification. Proceedings Of The Korean Society Of Broadcast Engineers Conference. pp. 244-247 (2020).
  15. Park, J., Kumar, T. & Bae, S. Search for optimal data augmentation policy for environmental sound classification with deep neural networks. Journal Of Broadcast Engineering. 25, 854-860 (2020).
  16. Park, J., Kumar, T. & Bae, S. Search of an optimal sound augmentation policy for environmental sound classification with deep neural networks. Proceedings Of The Korean Society Of Broadcast Engineers Conference. pp. 18-21 (2020).
  17. Kumar, T., Turab, M., Mileo, A., Bendechache, M. & Saber, T. AudRandAug: Random Image Augmentations for Audio Classification. ArXiv Preprint ArXiv:2309.04762. (2023).
  18. Singh, A., Raj, K., Meghwar, T. & Roy, A. Efficient Paddy Grain Quality Assessment Approach Utilizing Affordable Sensors. AI. 5, 686-703 (2024).
  19. Khan, W., Kumar, T., Cheng, Z., Raj, K., Roy, A. & Luo, B. SQL and NoSQL Databases Software architectures performance analysis and assessments—A Systematic Literature review. arXiv 2022. ArXiv Preprint ArXiv:2209.06977.
  20. Silva, P. B., Andrade, M. and Ferreira, S. (2020) ‘Machine learning applied to road safety modelling: A systematic literature review’, Journal of Traffic and Transportation Engineering (English Edition), 7(6), pp. 775–790. [CrossRef]
  21. Gebresenbet, R. F. and Aliyu, A. D. (2019) ‘Injury severity level and associated factors among road traffic accident victims attending emergency department of Tirunesh Beijing Hospital, Addis Ababa, Ethiopia: A cross sectional hospital-based study’, PLOS ONE. Edited by Y. Guo, 14(9), p. e0222793. [CrossRef]
  22. Ahmed, S. K. et al. (2023) ‘Road traffic accidental injuries and deaths: A neglected global health issue’, Health Science Reports, 6(5). [CrossRef]
  23. Goodari, M. B. et al. (2023) ‘Factors affecting the number of road traffic accidents in Kerman province, southeastern Iran (2015–2021)’, Scientific Reports, 13(1). [CrossRef]
  24. Lin, D.-J. et al. (2022) ‘Analysis of Environmental Factors on Intersection Accidents’, Sustainability, 14(3), p. 1764. [CrossRef]
  25. Nizetic, S. et al. (2020) ‘Internet of Things (IoT): Opportunities, issues and challenges towards a smart and sustainable future’, Journal of Cleaner Production, 274(1), p. 122877. [CrossRef]
  26. Satla, S. P., Manchala, S. and Buradagunta, S. (2020) ‘Dangerous Prediction in Roads by Using Machine Learning Models’, Ingénierie des systèmes d’information/Ingénierie des systèmes d’Information, 25(5), pp. 637–644. [CrossRef]
  27. Sharma, A., Awasthi, Y. and Kumar, S. (2020) The Role of Blockchain, AI and IoT for Smart Road Traffic Management System, IEEE Xplore. [CrossRef]
  28. Tonhauser, M. and Ristvej, J. (2021) ‘Implementation of New Technologies to Improve Safety of Road Transport’, Transportation Research Procedia, 55, pp. 1599–1604. [CrossRef]
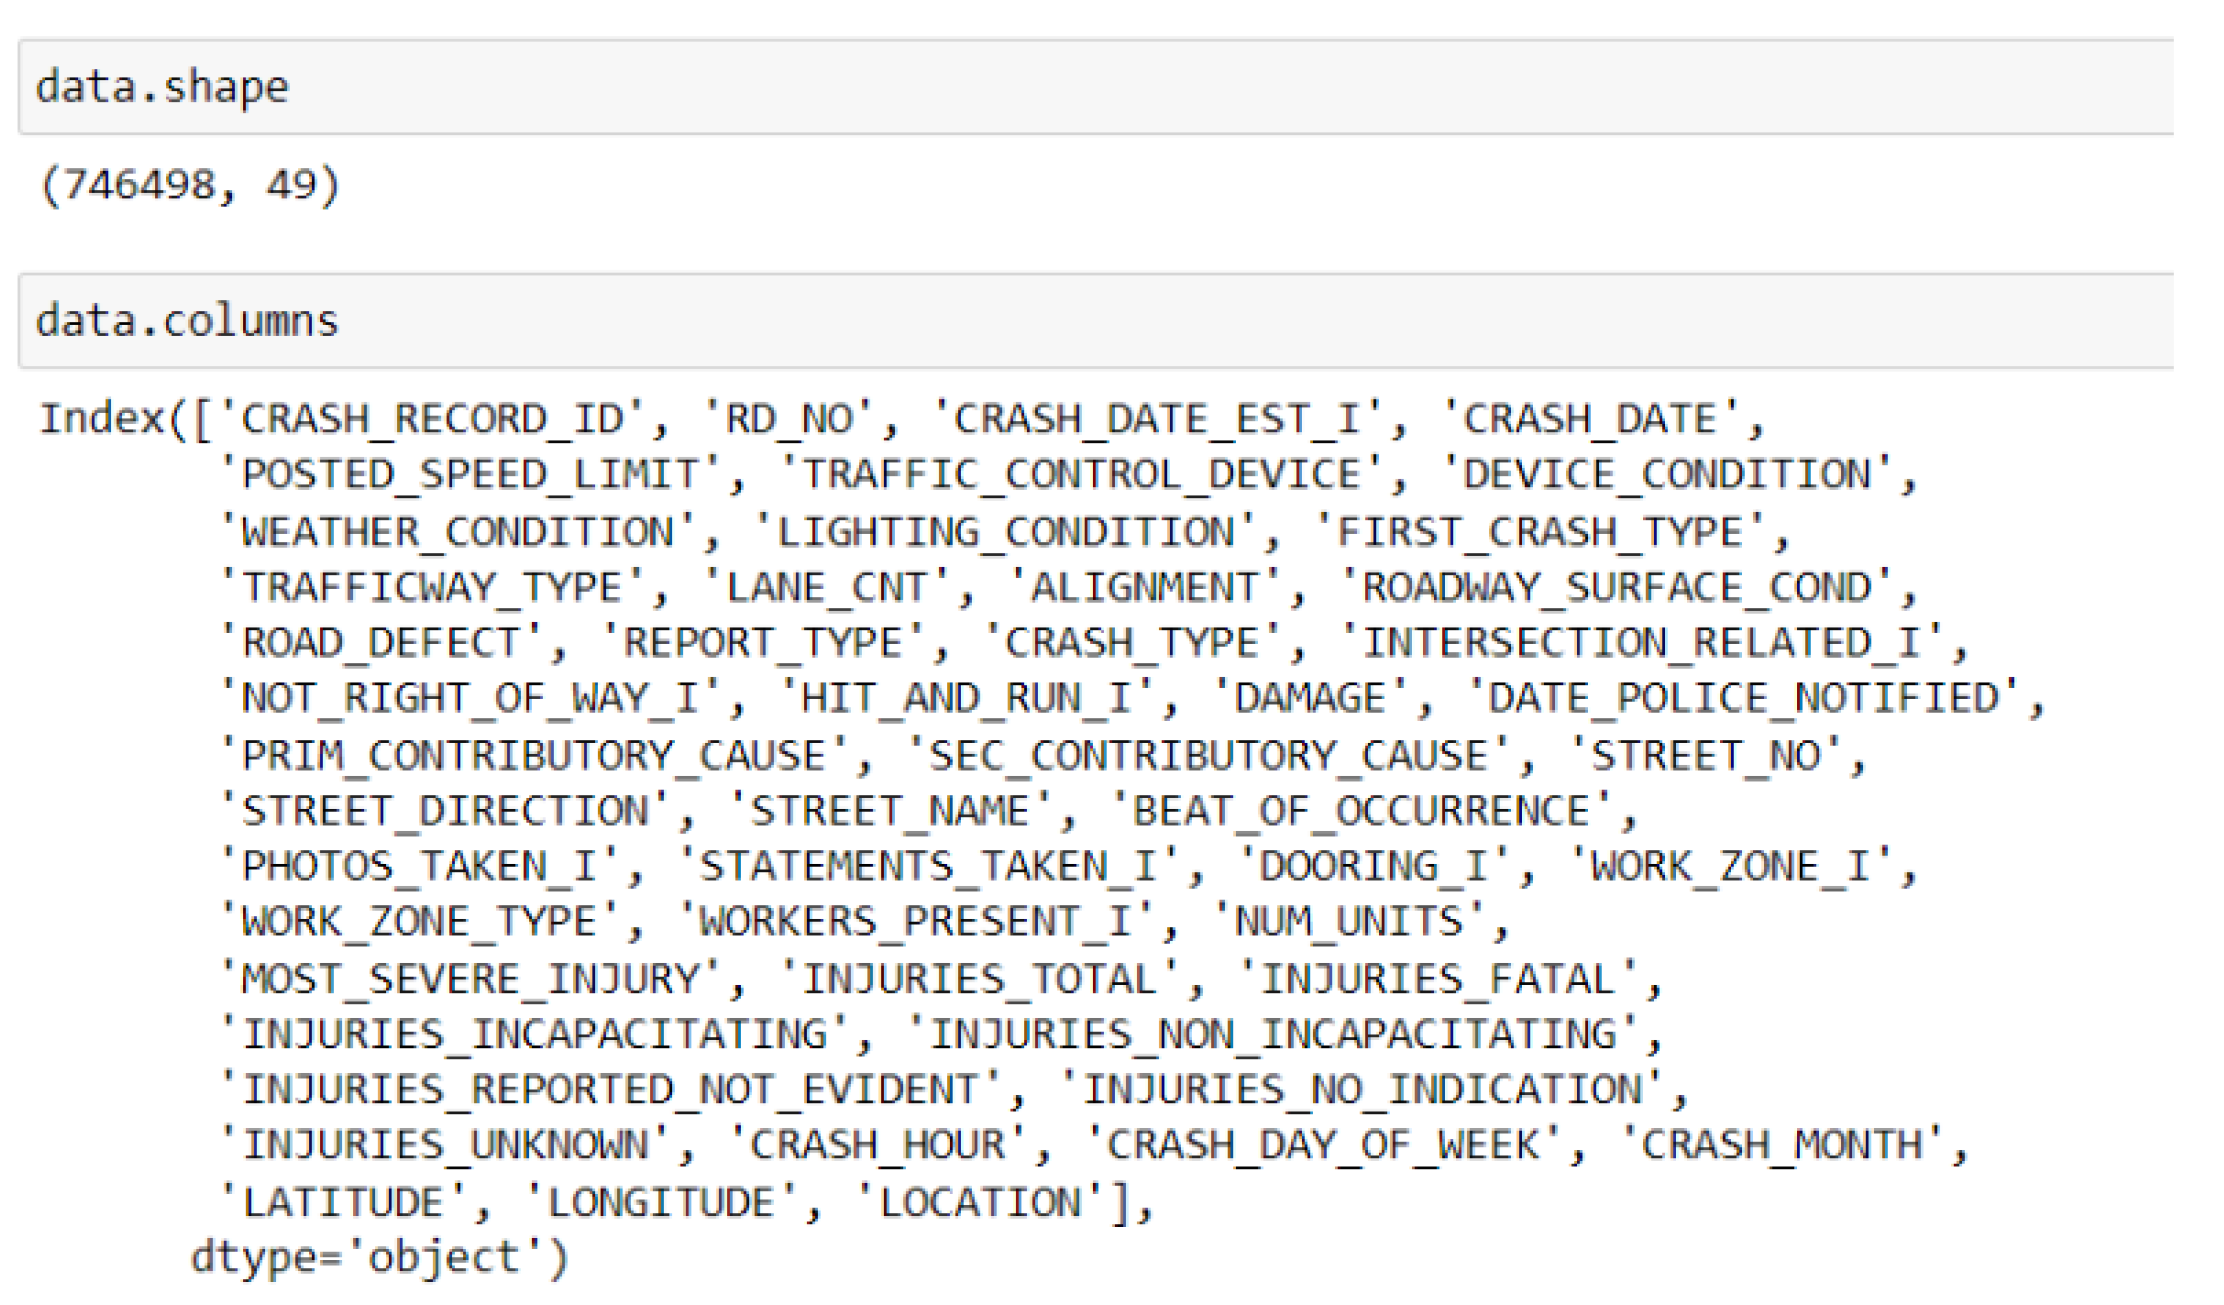
Figure 2. Shape and column of the dataset
Preprints 112028 g002
Figure 3. Sample of Null values in the dataset
Preprints 112028 g003
Figure 4. Dropping the columns that contain a high number of missing values
Preprints 112028 g004
Figure 5. Checking missing values in the dataset after the removal of columns that contain a high number of missing values
Preprints 112028 g005
Figure 6. Data Splitting
Preprints 112028 g006
Figure 7. Distribution of crashes by day of the week
Preprints 112028 g007
Figure 8. Distribution of crashes by month
Preprints 112028 g008
Figure 9. Distribution of Crash type by Damage
Preprints 112028 g009
Figure 11. Evaluation of KNN Classifier
Preprints 112028 g011
Figure 13. Classification report for MLP classifier
Preprints 112028 g013
Table 1. Classifier Accuracy Scores
Classifier Accuracy Score (%)
Random Forest 99.82
KNN 99.84
Decision Tree 99.67
MLP Classifier 99.84
Disclaimer/Publisher’s Note: The statements, opinions and data contained in all publications are solely those of the individual author(s) and contributor(s) and not of MDPI and/or the editor(s). MDPI and/or the editor(s) disclaim responsibility for any injury to people or property resulting from any ideas, methods, instructions or products referred to in the content.
Copyright: This open access article is published under a Creative Commons CC BY 4.0 license, which permit the free download, distribution, and reuse, provided that the author and preprint are cited in any reuse.
Prerpints.org logo

Preprints.org is a free preprint server supported by MDPI in Basel, Switzerland.

Subscribe

© 2024 MDPI (Basel, Switzerland) unless otherwise stated