
Submitted:
12 July 2024
Posted:
15 July 2024
You are already at the latest version
Abstract
Although long-term survival in Rett syndrome (RTT) has been observed, limited information on older people with RTT exists. We hypothesized that increased longevity in RTT would be associated with genetic variants in MECP2 associated with milder severity, and that clinical features would not be static in older individuals. To address these hypotheses, we compared the distribution of MECP2 variants and clinical severity between younger individuals with Classic RTT (under 30 years old) and older individuals (over 30 years old). Contrary to expectation, enrichment of a severe MECP2 variant (R106W) was observed in the older cohort. Overall severity was not different between the cohorts, but specific clinical features varied between the cohorts. Overall severity from first to last visit increased in the younger cohort but not in the older cohort. While some specific clinical features in the older cohort were stable from the first to the last visit, others showed improvement or worsening. These data do not support the hypothesis that mild MECP2 variants or less overall severity leads to increased longevity in RTT but demonstrate that clinical features change with increasing age in adults with RTT. Additional work is needed to understand disease progression in adults with RTT.
Keywords:
Rett syndrome
; MECP2
; old age
; clinical severity
; disease progression
1. Introduction
Rett syndrome (RTT) [1,2] is a significantly disabling neurodevelopmental disorder primarily, but not exclusively, affecting girls and women, that is caused in the majority of cases (>96%) by pathogenic loss of function genetic variants in the X-linked gene methyl-CpG-binding protein 2 (MECP2) gene [3,4,5]. Over the past twenty years, it has been recognized that long-term survival of people with RTT is both possible and likely [6,7]. Data obtained from a North American database demonstrated that median survival of people with RTT is greater than 50 years of age [8]. This finding stands in marked contrast to the observed survival of the cohort of people with RTT originally identified by Andreas Rett beginning in the 1950’s [9]. The observed improvement in survival might relate to factors such as earlier recognition, better management of nutritional concerns, improved physical, occupational, and communication therapies, and better approaches to the associated problems of seizures, gastrointestinal issues, and scoliosis [10,11,12,13,14,15,16,17,18,19,20,21,22].
Although it has been recognized that many individuals with RTT survive into adulthood, limited work has evaluated the clinical features of mature women with this disorder. Lotan et al. [23] reported three women greater than thirty years old in Israel whereas Peron et al. [24] described fifty-six women with RTT age 19-49 in Italy. However, the median age of this latter group was 29 years yielding not more than twenty-eight women 30 years of age or greater. Gross motor skills were evaluated in 24 individuals in Denmark, age 30-66 [25], and medical issues and epilepsy in smaller numbers in Norway [26,27].
Because there is a well-established genotype-phenotype relationship in RTT [28], the hypothesis has been proposed that individuals with MECP2 variants associated with overall milder involvement, (R133C, R294X, R306C, and C-terminal truncations) would demonstrate greater overall survival [28]. The corollary to this is that individuals with more severe variants (R106W, R168X, R255X, R270X and large deletions) would be more likely to succumb earlier such that the percentage of those with mild versus severe mutations would change with increasing age. Among the milder variants, greater maintenance of ambulation and purposeful hand function and lesser difficulties with seizures and scoliosis had been noted previously across the age spectrum [28]. Although previous work evaluating the association between longevity and MECP2 variants did not identify such an association [29], the increased survival observed in the US Rett syndrome and RTT-related Disorders Natural History Study (RNHS), comprising sixteen years of longitudinal data from over 1200 people with RTT, prompted a further evaluation of this hypothesis. Additionally, we sought to evaluate whether clinical features were stable or continued to change in older individuals with RTT.
2. Materials and Methods
2.1. Participants
Participants were enrolled in the Rett syndrome and RTT-related Disorders Natural History Study (RNHS, NCT00299312, NCT02738281), a longitudinal study incorporating caregiver-provided historical and clinically observed information spanning from 2006 to 2021. A total of 1826 individuals participated in the RNHS with an average of 5 visits per individual (ranging from 1 to 18 visits). Participants enrolled had a diagnosis of RTT as well as people who did not meet RTT diagnostic criteria but had pathogenic variants in MECP2, and individuals with RTT-related disorders including MECP2 duplication syndrome, CDKL5 deficiency disorder, and FOXG1 syndrome. For this study, we only included those individuals with a diagnosis of RTT (Classic or Atypical RTT). All participants provided genetic testing results.
To characterize the differences in younger versus older individuals with RTT, participants were divided into cohorts assessed under 30 years old (yo) and those assessed ≥30 yo. We excluded one individual with Classic RTT who had a mutation in SHANK3. For atypical RTT (n=211), only 15 participants were assessed ≥30 yo, so data from individuals with Atypical RTT was not included in the final analyses. Subsequently, a total 1253 participants with Classic RTT and pathological MECP2 loss of function variants were analyzed. Of these, 1195 had visits at ages less than 30 yo, with 1143 seen only when less than 30 yo. One hundred and ten participants were assessed when ≥30 yo, of these 58 had baseline visits ≥30 yo and an additional 52 participants seen at baseline visits under 30 yo but aged to ≥30 yo during the study (Table 1). Visits ranged from one to fourteen specific occurrences. The mean age at last visit in the <30 yo cohort was 13.7 yo (SD, Range: 7.6 yo, 1.9-29.8 yo) compared to mean age at first visit in the ≥30 yo which was 34.5 yo (SD, Range: 6.1 yo, 30.0-66.5 yo). Five of the women over 30 years of age died during the RNHS, accounting for 4.5% of the 111 women with Classic RTT in this study. This was similar to the previously reported 3.9% death rate for all individuals in the RNHS.
2.2. Assessments
Participants were assessed in a structured in-person clinical research visit (lasting ~1-2 hours), which occurred longitudinally at pre-defined intervals based on age of enrollment, ranging from yearly to every other year. In-person evaluations utilizing structured research forms including caregiver completed history and assessment forms and questionnaires, clinical histories, structured clinical exams, and clinician-completed rating scales. Clinical assessment and rating scales were conducted by physician investigators who were trained on the conduct of the study and completion of the forms via in person training at the initiation of the study or the site by the PI of the study (AKP). Clinician-rated assessments included the Clinical Severity Score (CSS) and the Motor Behavioral Assessment (MBA), two RTT specific rating sales that were used throughout the RNHS [30]. The CSS is a clinical rating scale composed of 13 items, each with a Likert Scale from 0-4 or 0-5 (higher numbers representing more severely affected), with a range of total CSS score from 0-58 (0=unaffected, 58=most severely affected). The MBA is a clinical rating scale composed of 34 items, each with a Likert Scale for each item from 0-4 (higher numbers representing more severely affected), and a range of total MBA score from 0-136 (0=unaffected, 136=most severely affected).
2.3. Statistical Analyses and Data Visualization
SPSS v.29.0.0.0 (IBM) was used for statistical analyses and graphical representation. Data is presented as mean values with standard error of the mean (SEM), median, or percentage as appropriate, and p-values ≤0.05 are considered significant. Comparison of the frequency of specific common pathogenic MECP2 variants between the young cohort (<30 yo) versus the old cohort (≥30 yo) were conducted using the Fisher exact test. Difference in continuous variables (total CSS or MBA scores) between the last visit in the young cohort and the first visit in the old cohort were analyzed using one-way ANOVA (factor: age cohort). Comparison of individual items on the CSS or MBA between the last visit in the young cohort and the first visit in the old cohort were analyzed using the Kruskal-Wallis test. Evaluation in the change between the first and last visit in individuals within the young cohort or the old cohort was conducted using paired T-tests for continuous variables (total CSS or MBA score) or using paired Wilcoxon signed rank test for non-continuous variables (individual items in the CSS or MBA).
3. Results
3.1. Distributions of Mutations and Severity in under 30 yo versus over 30 yo Cohorts
We hypothesized that longevity in older women would be associated with MECP2 variants associated with overall milder involvement (R133C, R294X, R306C, and C-terminal truncations [CTT]), versus more severe variants (R106W, R168X, R255X, R270X and large deletions [LargeDel]). However, no significant changes were noted in the proportions of variants between the two cohorts except for a significant enrichment of the relatively more severe variant R106W (3.2% < 30yo versus 8.2% ≥ 30yo, p = 0.014, Fisher’s exact test) in the older cohort (Table 2). Therefore, our initial hypothesis that milder mutations would be overrepresented in older cohort was not confirmed.
Furthermore, no differences were noted in total CSS or MBA scores between <30 yo cohort versus ≥30 yo cohort for the entire group (All, Table 2). However, withing specific MECP2 variant groups, we found changes in the total CSS or MBA scores between <30 yo cohort versus ≥30 yo cohort. In individuals with the R255X variant (a severe variant), both the total CSS and MBA scores showed increased severity in the ≥30 yo cohort. In contrast, CSS decreased in severity in individuals with the R270X variant (a severe variant), and MBA increased in severity in individuals with the R306C variant (a mild variant). Thus, we did not identify that there was an enrichment in more mildly affected individuals in the ≥30 yo cohort, nor did we find that there was any consistent finding that individuals with severe MECP2 variants who survived over 30 yo were less affected than those with the same variants under 30 yo or the converse that individuals with mild MECP2 variants who survived over 30 yo were less affected than those with the same variants under 30 yo.
3.2. Differences in Clinical Features between under 30 yo versus ≥30 yo cohorts
Although overall severity between the young versus the old cohort was not different, we evaluated whether there were differences between age cohorts of specific clinical features through analyses of individual items in the CSS and MBA. The features analyzed did not include historical items (e.g., onset of regression, onset of stereotypies, head growth) or lower priority and relatively subjective items (e.g., excluded Overly active/passive, toileting, self-mutilation, pain tolerance, biting, truncal rocking, myoclonus and hyperreflexia) but focused on items representing highly relevant clinical features in RTT.
Each Item in the CSS and MBA is scored over a range of 0 (feature not present) to 4 or 5 (feature continuously present or severe), with the range noted for each Item and the mean and median for that Item in each cohort indicated in Table 3. Significant differences were observed between last visit in <30 yo cohort and first visit in ≥30 yo cohort for several items (Table 3). The distribution of scores (Figure 1) demonstrates the differences in severity for comparisons between the younger versus older cohorts for representative items with differences between the cohorts. Several items were more severe in the older cohort: CSS and MBA Scoliosis, CSS Nonverbal, MBA Sustained Interest, MBA Does Not Follow Verbal Commands, MBA Bradykinesia and MBA Hypertonia (Table 3 and Figure 1). Several items were less severe in the older cohort: CSS Ambulation, CSS Breathing, MBA Breath Holding, MBA Hyperventilation, MBA Mouthing Hands/Objects and MBA Stereotypies (Table 3 and Figure 1). Notably, no differences in hand skills or language were found between the last visit in <30 yo cohort and first visit in ≥30 yo cohort. So, while the overall severity scores (CSS/MBA) were not different between last visit in <30 yo cohort and first visit in ≥30 yo cohort, individual clinical features are consistent with observed clinical observations (more scoliosis, more bradykinesia/rigidity, less interactive, better breathing/hand stereotypies), but also better walking, to result in no overall differences between the two cohorts.
3.3. Longitudinal Progression of Overall Severity in under 30 yo versus ≥30 yo Cohorts
The previous analyses do not necessarily indicate improvement or worsening of specific features between cohorts; rather, the cohorts are overall similar but with specific differences of clinical features. In order to evaluate whether or not longitudinal alterations of clinical severity occurred, the total CSS and total MBA from the first visit to last visit in the <30 yo cohort were compared to the first visit to last visit in the ≥30 yo cohort. The analysis was restricted to participants with more than one visit in an age cohort (n=985 <30 yo cohort, n=76 ≥30 yo cohort), with the average age at first visit of 8.3 yo in the <30 yo cohort versus 34.1 yo in the ≥30 yo cohort (specifics for each group are noted in Table 4). No difference was noted in mean change in age between first-last visits in <30 yo vs ≥30 yo cohorts (p=0.517, one-way ANOVA) indicating that the individuals within each cohort are similar with regard to the longitudinal durations assessed (5.3-5.6 years). In the <30 yo cohort, both total CSS and total MBA increased from first to last visit (Table 5). Comparatively, no change was seen in total CSS and MBA in the ≥30 yo cohort from first to last visit (Table 5).
3.4. Longitudinal Progression of Clinical Features in under 30 yo versus ≥30 yo Cohorts
Using a similar approach to compare the clinical features of these cohorts, specific clinical items from the CSS and MBA were compared from the first visit to last visit in the <30 yo cohort and contrasted to comparisons from first visit to last visit in the ≥30 yo cohort (Table 6). A number of clinical features worsen from first to last visit in <30 yo group, such as in gross motor function (CSS Sitting, CSS Ambulation, MBA Motor Skills), fine motor skills (CSS Hand Use, MBA Does Not Reach for Objects/People, MBA Hand Clumsiness), verbal communication (CSS Language, MBA Verbal Skills, MBA Speech Disturbance), oro-motor function (MBA Feeding Difficulties, MBA Chewing Difficulties), musculoskeletal abnormalities (CSS Scoliosis, MBA Scoliosis, MBA Bradykinesia, MBA Dystonia, MBA Dyskinesias, MBA Hypertonia), and seizures (CSS Seizures, MBA Seizures). These findings are as expected given the clinical progression observed in people with RTT in younger ages, such as on-going reduction of hand use [31] and ambulation. In contrast, some clinical features improved in the <30 yo cohort from first visit to last visit, such as in nonverbal communication (CSS Nonverbal Communication, MBA Does Not Follow Verbal Commands), behavior (MBA Irritability or Tantrums, MBA Aggressiveness), and features such as teeth grinding, saliva expulsion, and hand mouthing (MBA Bruxism, MBA Air/Saliva Expulsion, MBA Mouthing Hands/Objects). Again, these are consistent with observed age-related changes in younger individuals with RTT.
Within the older cohort (≥30 yo), a number of clinical features were unchanged from the first to last visit (Table 6), similar to previous reports indicating that clinical features are stable in older individuals with RTT [32]. However, a number of clinical features were different between first to last visit in ≥30 yo cohort (Table 6). Worsening for the ≥30 yo was observed for gross motor skills (MBA Motor Skills, CSS Ambulation trend p=0.089), fine motor abilities (CSS Hand Use, MBA Does Not Reach for Objects/People), verbal communications (CSS Language, MBA Verbal Skills, MBA Speech Disturbance), oro-motor function (MBA Chewing Difficulties), and movement disorders (MBA Hand Stereotypies, MBA Dystonia, MBA Dyskinesia). Interestingly, nonverbal communication (CSS Nonverbal Communication, MBA Does Not Follow Verbal Commands) showed improvement from the first to last visit in the ≥30 yo cohort. Representative distributions of CSS or MBA items that had significant change from first to last visit in the ≥30 yo cohort are shown in Figure 2 displays representative distributions of selected CSS items that show change from first to last visit in both the <30 yo and ≥30 yo cohorts, with CSS Ambulation, CSS Hand Use, and CSS Language showing progressive worsening in both the younger and older cohorts (Figure 2A-C), and CSS Nonverbal Communication showing progressive improvement in both cohorts (Figure 2D). Overall, while the progressive worsening in some clinical features is expected in the <30 yo group, these results demonstrate that some clinical features improve in the <30 yo group and in contrast to previous reports, older people with RTT continue to show changes in clinical features with ongoing worsening of many functional skills, but improvement in nonverbal communication.
4. Discussion
Prolonged survival of individuals with RTT has been known for more than fifteen years [8], but the specific features of those surviving past thirty years has received scant attention. The RNHS evaluated more than 1600 girls and women with RTT over the past sixteen years and among this group we analyzed 1253 with classic RTT; 1143 were under 30 yo at the last visit (mean age 13.9 yo), while 110 were ≥30 yo at their last visit (mean age 39.4 yo). The presumption was that maintenance of ambulation and purposeful hand function and lesser difficulties with seizures and scoliosis associated with specific point mutations (R133C, R294X, R306C and CTT) would influence the likelihood of longevity preferentially.
Contrary to our expectation, we did not see a notable difference in the distribution of specific point mutations between the younger and older cohorts, arguing against increased survival specifically in individuals with mild mutations. In other words, older age people with RTT were not dominated by mild MECP2 mutations or overall decreased severity. Additionally, no difference in overall severity was noted between these two groups. However, an ongoing progression of clinical features with worsening functional skills loss and motor features but improvement in nonverbal communication with age was observed. Overall, this indicates a further need to improve our understanding of age-related progression in RTT. Other factors must underlie the inability to support our initial hypotheses. Improved nutrition, better management of epilepsy, pulmonary, and gastrointestinal issues, consistent physical, occupational, and communication therapies, and better attention to orthopedic issues such as scoliosis and joint deformities all promote better health and could be a reason for improved longevity in all variant groups. Further, overall increase in experience of child neurologists, geneticists, and primary care physicians with RTT has advanced the care of these issues during the past twenty or more years. The improvement in care in these domains could be the explanation for prolongation of survival and are areas for further research in the future. Environmental conditions could also be important factors affecting longevity. Most individuals with RTT in the US are cared for in their own homes where enrichment is more likely. Nevertheless, once individuals with developmental issues such as RTT age out of school-based programs, typically at age 22 years, their ability to access programs that increase socialization and provide quality therapeutic programs becomes increasingly more difficult. Differences in access to these programs is also one possible reason for better survival. Indeed, animal studies have shown that clear differences in outcome are related to the quality and quantity of environmental factors including environmental enrichment and socialization [33,34,35]. Although evidence on the role of other genetic factors is lacking, these could be at play as well.
While it had been thought that clinical features are stable after 30 yo in RTT, progressive worsening of functional skills such as hand use, ambulation, and speech, and worsening of features such as chewing, feeding, dystonia, dyskinesia, and decreased sustained interest. However, this is accompanied by stability in many clinical domains such as epilepsy and improvements in nonverbal skills. It is important for clinicians and caregivers to recognize the progression of these clinical features with age. Awareness of this important aspect is vital for discussions with families both at the time of diagnosis when young, but also during transition of care from pediatricians and pediatric subspecialists to their adult counterparts. Knowing that these RTT women can live long lives means our communities need to keep focused on providing high quality medical and allied health needs and ensuring enrichment programs throughout their lives. Importantly, as therapies become available, caregivers and providers should ensure these individuals have access to any new therapeutic modalities. Indeed, the recent approval of trofinetide (Daybue) offers a specific oral therapy for individuals with RTT [36,37]. Other agents are currently under study and two gene therapy programs (Taysha Gene Therapies-NCT05606614 and Neurogene-NCT05898620) have now begun.
Limitations to this study are noted. While representing the largest older cohort to date, the overall number of people evaluated in the older cohort is still relatively small and there remains a need for further characterization of the longitudinal progression with age in RTT. Additionally, there may be a selection bias present in the ≥30yo cohort, as many people with RTT ≥30yo do not have a diagnosis due to the availability of clinical diagnosis and testing, which often happens only in pediatric populations. Further, those with a diagnosis ≥30 yo may have multiple features, including different socio-economic status, living near a tertiary academic center with access to diagnostic and research opportunities and overall better health, that allowed them to participate in this study. Our ability to capture all individuals with RTT in future “real-world” clinical studies will permit better evaluation of these factors.
Author Contributions
Conceptualization, Jeffrey Neul, Timothy Benke, Eric Marsh and Alan Percy; Data curation, Jeffrey Neul; Formal analysis, Jeffrey Neul and Alan Percy; Funding acquisition, Jeffrey Neul and Alan Percy; Investigation, Jeffrey Neul, Timothy Benke, Eric Marsh, Bernhard Suter, Cary Fu, Robin Ryther, Steven Skinner, David Lieberman, Timothy Feyma, Arthur Beisang, Peter Heydemann, Sarika Peters, Amitha Ananth and Alan Percy; Methodology, Jeffrey Neul and Alan Percy; Project administration, Jeffrey Neul and Alan Percy; Supervision, Jeffrey Neul and Alan Percy; Visualization, Jeffrey Neul; Writing—original draft, Jeffrey Neul and Alan Percy; Writing—review & editing, Jeffrey Neul, Timothy Benke, Eric Marsh, Bernhard Suter, Cary Fu, Robin Ryther, Steven Skinner, David Lieberman, Timothy Feyma, Arthur Beisang, Peter Heydemann, Sarika Peters, Amitha Ananth and Alan Percy. All authors have read and agreed to the published version of the manuscript.
Funding
This research was supported by funding from the National Institutes of Health grants U54HD061222 (A.K.P.), P50HD103537 (J.L.N.), UL1TR0030396 (the UAB Clinical Translational Research Center), UL1TR002243 (Vanderbilt University Medical Center Clinical Translational Research Center), Children’s Hospital Colorado Foundation Ponzio Family Chair in Neurology Research (T.A.B), and the International Rett Syndrome Foundation (A.K.P., J.L.N., and R.C.R.). The content is solely the responsibility of the authors and does not necessarily represent the official views of the National Institutes of Health or the Eunice Kennedy Shriver Child Health and Human Development Institute (NICHD).
Institutional Review Board Statement
All participants or their legally authorized representatives provided informed consent before participation in the study. The study was conducted in accordance with the Declaration of Helsinki. The study was approved by the University of Alabama, Birmingham Institutional Review Board (#F150518001, Approval date 27 May 2015), and by the Vanderbilt University Medical Center Institutional Review Board (#151104, Approval date 20 July 2015). A Certificate of Confidentiality was provided by the National Institute of Child Health and Development (NICHD). These non-interventional clinical study protocols were registered with Clinical Trials.Gov (NCT00299312 and NCT02738281).
Informed Consent Statement
Informed consent was obtained from all subjects involved in the study.
Data Availability Statement
The datasets from the Rett syndrome and Rett-related Disorders Natural History Study (RNHS) have been deposited to the database of Genotypes and Phenotypes (dbGAP) repository, phs000574.v1.p1 and hyperlink to dataset(s) in https://www.ncbi.nlm.nih.gov/projects/gap/cgi-bin/study.cgi?study_id=phs000574.v1.p1, and deposited to dbGAP per a predefined schedule at regular intervals. Additionally, datasets used for the analysis conducted within this work are available from the corresponding author on reasonable request and pursuant to any required data transfer and use agreements.
Acknowledgments
The authors extend their gratitude for the people and their caregivers who participated in the Rett Syndrome Natural History Study. The authors acknowledge the contribution of other site investigators who contributed to the Rett Syndrome Natural History Study including Daniel Glaze, MD (Baylor College of Medicine, Houston, TX), Richard H. Haas, MD (University of California San Diego, San Diego, CA), and Shannon M. Standridge, MD (Cincinnati Children’s Hospital, Cincinnati, OH).
Conflicts of Interest
The funders had no role in the design of the study; in the collection, analyses, or interpretation of data; in the writing of the manuscript; or in the decision to publish the results. The authors declare that the research was conducted in the absence of any commercial or financial relationships that could be construed as a potential conflict of interest.
References
- Rett, A. [On a unusual brain atrophy syndrome in hyperammonemia in childhood]. Wien Med Wochenschr 1966, 116, 723–6.
- Hagberg, B., J. Aicardi, K. Dias, and O. Ramos. “A Progressive Syndrome of Autism, Dementia, Ataxia, and Loss of Purposeful Hand Use in Girls: Rett’s Syndrome: Report of 35 Cases.” Ann Neurol 14, no. 4 (1983): 471-9. [CrossRef]
- Amir, R. E., I. B. Van den Veyver, M. Wan, C. Q. Tran, U. Francke, and H. Y. Zoghbi. “Rett Syndrome Is Caused by Mutations in X-Linked Mecp2, Encoding Methyl-Cpg-Binding Protein 2.” Nat Genet 23, no. 2 (1999): 185-8. [CrossRef]
- Lombardi, L.M.; Baker, S.A.; Zoghbi, H.Y. MECP2 disorders: from the clinic to mice and back. J. Clin. Investig. 2015, 125, 2914–2923. [CrossRef]
- Sandweiss, A.J.; Brandt, V.L.; Zoghbi, H.Y. Advances in understanding of Rett syndrome and MECP2 duplication syndrome: prospects for future therapies. Lancet Neurol. 2020, 19, 689–698. [CrossRef]
- Laurvick, C.L.; de Klerk, N.; Bower, C.; Christodoulou, J.; Ravine, D.; Ellaway, C.; Williamson, S.; Leonard, H. Rett syndrome in Australia: A review of the epidemiology. J. Pediatr. 2006, 148, 347–352. [CrossRef]
- Fehr, S.; Bebbington, A.; Nassar, N.; Downs, J.; Ronen, G.M.; De Klerk, N.; Leonard, H. Trends in the Diagnosis of Rett Syndrome in Australia. Pediatr. Res. 2011, 70, 313–319. [CrossRef]
- Kirby, R.S.; Lane, J.B.; Childers, J.; Skinner, S.A.; Annese, F.; Barrish, J.O.; Glaze, D.G.; MacLeod, P.; Percy, A.K. Longevity in Rett Syndrome: Analysis of the North American Database. J. Pediatr. 2009, 156, 135–138.e1. [CrossRef]
- Freilinger, M.; Bebbington, A.; Lanator, I.; De Klerk, N.; Dunkler, D.; Seidl, R.; Leonard, H.; Ronen, G.M. Survival with Rett syndrome: comparing Rett’s original sample with data from the Australian Rett Syndrome Database. Dev. Med. Child Neurol. 2010, 52, 962–965. [CrossRef]
- A Gold, W.; Krishnarajy, R.; Ellaway, C.; Christodoulou, J. Rett Syndrome: A Genetic Update and Clinical Review Focusing on Comorbidities. ACS Chem. Neurosci. 2017, 9, 167–176. [CrossRef]
- Singh, J.; Santosh, P. Key issues in Rett syndrome: emotional, behavioural and autonomic dysregulation (EBAD) - a target for clinical trials. Orphanet J. Rare Dis. 2018, 13, 1–17. [CrossRef]
- Banerjee, A.; Miller, M.T.; Li, K.; Sur, M.; E Kaufmann, W. Towards a better diagnosis and treatment of Rett syndrome: a model synaptic disorder. Brain 2019, 142, 239–248. [CrossRef]
- Kadam, S.D.; Sullivan, B.J.; Goyal, A.; Blue, M.E.; Smith-Hicks, C. Rett Syndrome and CDKL5 Deficiency Disorder: From Bench to Clinic. Int. J. Mol. Sci. 2019, 20, 5098. [CrossRef]
- Fagiolini, M., A. Patrizi, J. LeBlanc, L. W. Jin, I. Maezawa, S. Sinnett, S. J. Gray, S. Molholm, J. J. Foxe, M. V. Johnston, S. Naidu, M. Blue, A. Hossain, S. Kadam, X. Zhao, Q. Chang, Z. Zhou, and H. Zoghbi. “Intellectual and Developmental Disabilities Research Centers: A Multidisciplinary Approach to Understand the Pathogenesis of Methyl-Cpg Binding Protein 2-Related Disorders.” Neuroscience 445 (2020): 190-206. [CrossRef]
- Yang, D.; Robertson, H.L.; Condliffe, E.G.; Carter, M.T.; Dewan, T.; Gnanakumar, V. Rehabilitation therapies in Rett syndrome across the lifespan: A scoping review of human and animal studies. J. Pediatr. Rehabilitation Med. 2021, 14, 69–95. [CrossRef]
- Fonzo, M.; Sirico, F.; Corrado, B. Evidence-Based Physical Therapy for Individuals with Rett Syndrome: A Systematic Review. Brain Sci. 2020, 10, 410. [CrossRef]
- Vilvarajan, S.; McDonald, M.; Douglas, L.; Newham, J.; Kirkland, R.; Tzannes, G.; Tay, D.; Christodoulou, J.; Thompson, S.; Ellaway, C. Multidisciplinary Management of Rett Syndrome: Twenty Years’ Experience. Genes 2023, 14, 1607. [CrossRef]
- Townend, G.S.; Bartolotta, T.E.; Urbanowicz, A.; Wandin, H.; Curfs, L.M. Development of consensus-based guidelines for managing communication of individuals with Rett syndrome. Augment. Altern. Commun. 2020, 36, 71–81. [CrossRef]
- Brunetti, S.; Lumsden, D.E. Rett Syndrome as a movement and motor disorder – A narrative review. Eur. J. Paediatr. Neurol. 2020, 28, 29–37. [CrossRef]
- Ramirez, J.-M.; Karlen-Amarante, M.; Wang, J.-D.J.; Bush, N.E.; Carroll, M.S.; Weese-Mayer, D.E.; Huff, A. The Pathophysiology of Rett Syndrome With a Focus on Breathing Dysfunctions. Physiology 2020, 35, 375–390. [CrossRef]
- Tascini, G.; Dell’Isola, G.B.; Mencaroni, E.; Di Cara, G.; Striano, P.; Verrotti, A. Sleep Disorders in Rett Syndrome and Rett-Related Disorders: A Narrative Review. Front. Neurol. 2022, 13, 817195. [CrossRef]
- Lim, J.; Greenspoon, D.; Hunt, A.; McAdam, L. Rehabilitation interventions in Rett syndrome: a scoping review. Dev. Med. Child Neurol. 2020, 62, 906–916. [CrossRef]
- Lotan, M.; Merrick, J.; Kandel, I.; Morad, M. Aging in Persons with Rett Syndrome: An Updated Review. Sci. World J. 2010, 10, 778–787. [CrossRef]
- Peron, A.; Canevini, M.P.; Ghelma, F.; Arancio, R.; Savini, M.N.; Vignoli, A. Phenotypes in adult patients with Rett syndrome: results of a 13-year experience and insights into healthcare transition. J. Med Genet. 2020, 59, 39–45. [CrossRef]
- Bisgaard, A.; Wong, K.; Højfeldt, A.; Larsen, J.L.; Schönewolf-Greulich, B.; Rønde, G.; Downs, J.; Stahlhut, M. Decline in gross motor skills in adult Rett syndrome; results from a Danish longitudinal study. Am. J. Med Genet. Part A 2021, 185, 3683–3693. [CrossRef]
- Henriksen, M.W.; Breck, H.; von Tetzchner, S.; Paus, B.; Skjeldal, O.H.; Brodtkorb, E. Epilepsy in classic Rett syndrome: Course and characteristics in adult age. Epilepsy Res. 2018, 145, 134–139. [CrossRef]
- Henriksen, M.W.; Breck, H.; von Tetzchner, S.; Paus, B.; Skjeldal, O.H. Medical Issues in Adults with Rett Syndrome - A National Survey. Dev. Neurorehabilit. 2020, 23, 106–112. [CrossRef]
- Cuddapah, V. A., R. B. Pillai, K. V. Shekar, J. B. Lane, K. J. Motil, S. A. Skinner, D. C. Tarquinio, D. G. Glaze, G. McGwin, W. E. Kaufmann, A. K. Percy, J. L. Neul, and M. L. Olsen. “Methyl-Cpg-Binding Protein 2 (Mecp2) Mutation Type Is Associated with Disease Severity in Rett Syndrome.” J Med Genet 51, no. 3 (2014): 152-8. [CrossRef]
- Anderson, A., K. Wong, P. Jacoby, J. Downs, and H. Leonard. “Twenty Years of Surveillance in Rett Syndrome: What Does This Tell Us?” Orphanet J Rare Dis 9 (2014): 87. [CrossRef]
- Neul, J.L.; Lane, J.B.; Lee, H.-S.; Geerts, S.; O Barrish, J.; Annese, F.; Baggett, L.M.; Barnes, K.; A Skinner, S.; Motil, K.J.; et al. Developmental delay in Rett syndrome: data from the natural history study. J. Neurodev. Disord. 2014, 6, 20–20. [CrossRef]
- Neul, J.L.; Benke, T.A.; Marsh, E.D.; Lane, J.B.; Lieberman, D.N.; Skinner, S.A.; Glaze, D.G.; Suter, B.; Heydemann, P.T.; Beisang, A.A.; et al. Distribution of hand function by age in individuals with Rett syndrome. Ann. Child Neurol. Soc. 2023, 1, 228–238. [CrossRef]
- Kerr, A.M.; Prescott, R.J. Predictive value of the early clinical signs in Rett disorder. Brain Dev. 2005, 27, S20–S24. [CrossRef]
- Lonetti, G.; Angelucci, A.; Morando, L.; Boggio, E.M.; Giustetto, M.; Pizzorusso, T. Early Environmental Enrichment Moderates the Behavioral and Synaptic Phenotype of MeCP2 Null Mice. Biol. Psychiatry 2010, 67, 657–665. [CrossRef]
- Nag, N.; Moriuchi, J.M.; Peitzman, C.G.; Ward, B.C.; Kolodny, N.H.; Berger-Sweeney, J.E. Environmental enrichment alters locomotor behaviour and ventricular volume in Mecp21lox mice. Behav. Brain Res. 2009, 196, 44–48. [CrossRef]
- Kondo, M.; Gray, L.J.; Pelka, G.J.; Christodoulou, J.; Tam, P.P.L.; Hannan, A.J. Environmental enrichment ameliorates a motor coordination deficit in a mouse model of Rett syndrome –Mecp2gene dosage effects and BDNF expression. Eur. J. Neurosci. 2008, 27, 3342–3350. [CrossRef]
- Neul, J.L.; Percy, A.K.; Benke, T.A.; Berry-Kravis, E.M.; Glaze, D.G.; Marsh, E.D.; Lin, T.; Stankovic, S.; Bishop, K.M.; Youakim, J.M. Trofinetide for the treatment of Rett syndrome: a randomized phase 3 study. Nat. Med. 2023, 29, 1468–1475. [CrossRef]
- Hudu, S.A.; Elmigdadi, F.; Al Qtaitat, A.; Almehmadi, M.; Alsaiari, A.A.; Allahyani, M.; Aljuaid, A.; Salih, M.; Alghamdi, A.; Alrofaidi, M.A.; et al. Trofinetide for Rett Syndrome: Highlights on the Development and Related Inventions of the First USFDA-Approved Treatment for Rare Pediatric Unmet Medical Need. J. Clin. Med. 2023, 12, 5114. [CrossRef]
Figure 1.
Distributions of selected CSS and MBA item scores. Differences of clinical features between last visit in <30 yo cohort are compared to first visit in ≥30 yo cohort. (A-C) display the score distribution for representative items from the CSS or MBA that were increased in severity on the older (≥30 yo) compared to the younger (<30 yo) cohort. (D-F) display the score distribution for representative items from the CSS or MBA that were decreased in severity on the older (≥30 yo) compared to the younger (<30 yo) cohort. The specific items in each panel are labeled at the top of the graph, with the legend showing the item score responses and color labels. Graphs show the percentage of each item score response, with the least severe (score 0, light blue) on top to most severe score (score 4, dark green; or score 5, dark blue) on bottom.
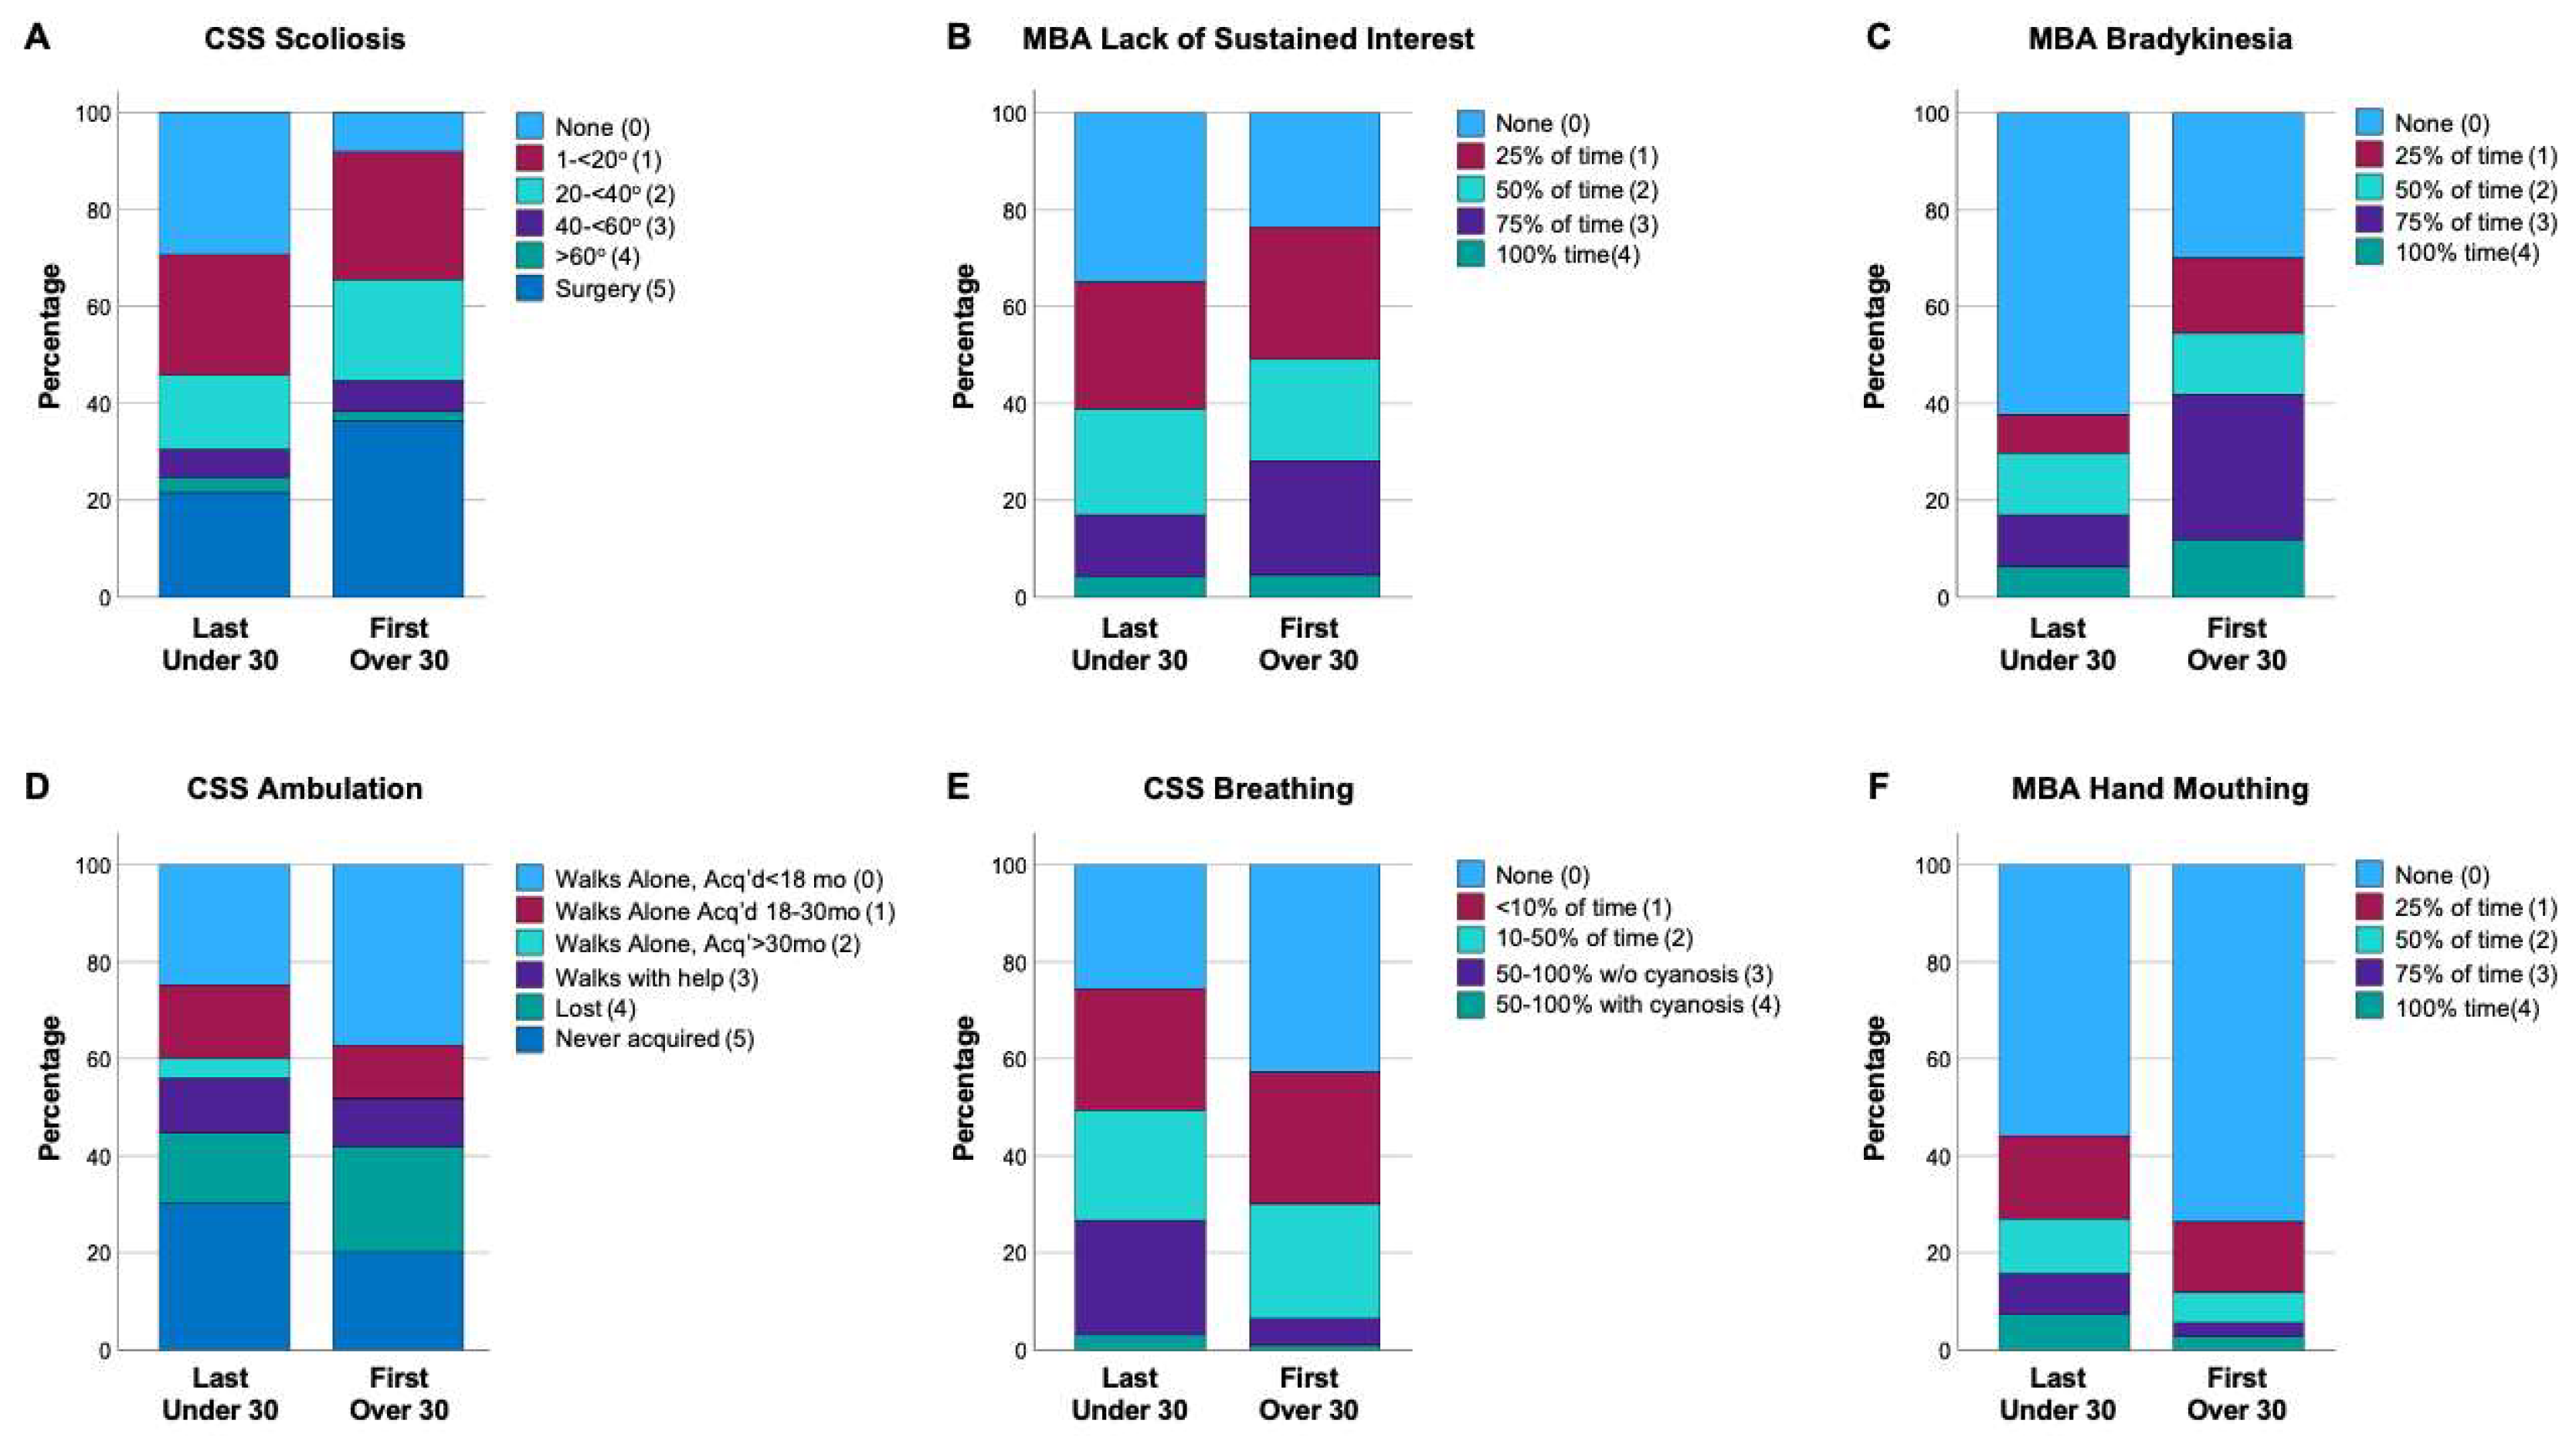
Figure 2.
Change in individual participant’s clinical features between first to last visit in younger (<30yo) and older (≥30yo) cohorts. (A-C) display clinical features that show progressive worsening from first to last visit in both cohorts. (D) displays a clinical feature (nonverbal communication) that shows progressive worsening from first to last visit in both cohorts. The specific items in each panel are labeled at the top of the graph, with the legend showing the item score responses and color labels. Graphs show the percentage of each item score response, with the least severe (score 0, light blue) on top to most severe score (score 4, dark green; or score 5, dark blue) on bottom.
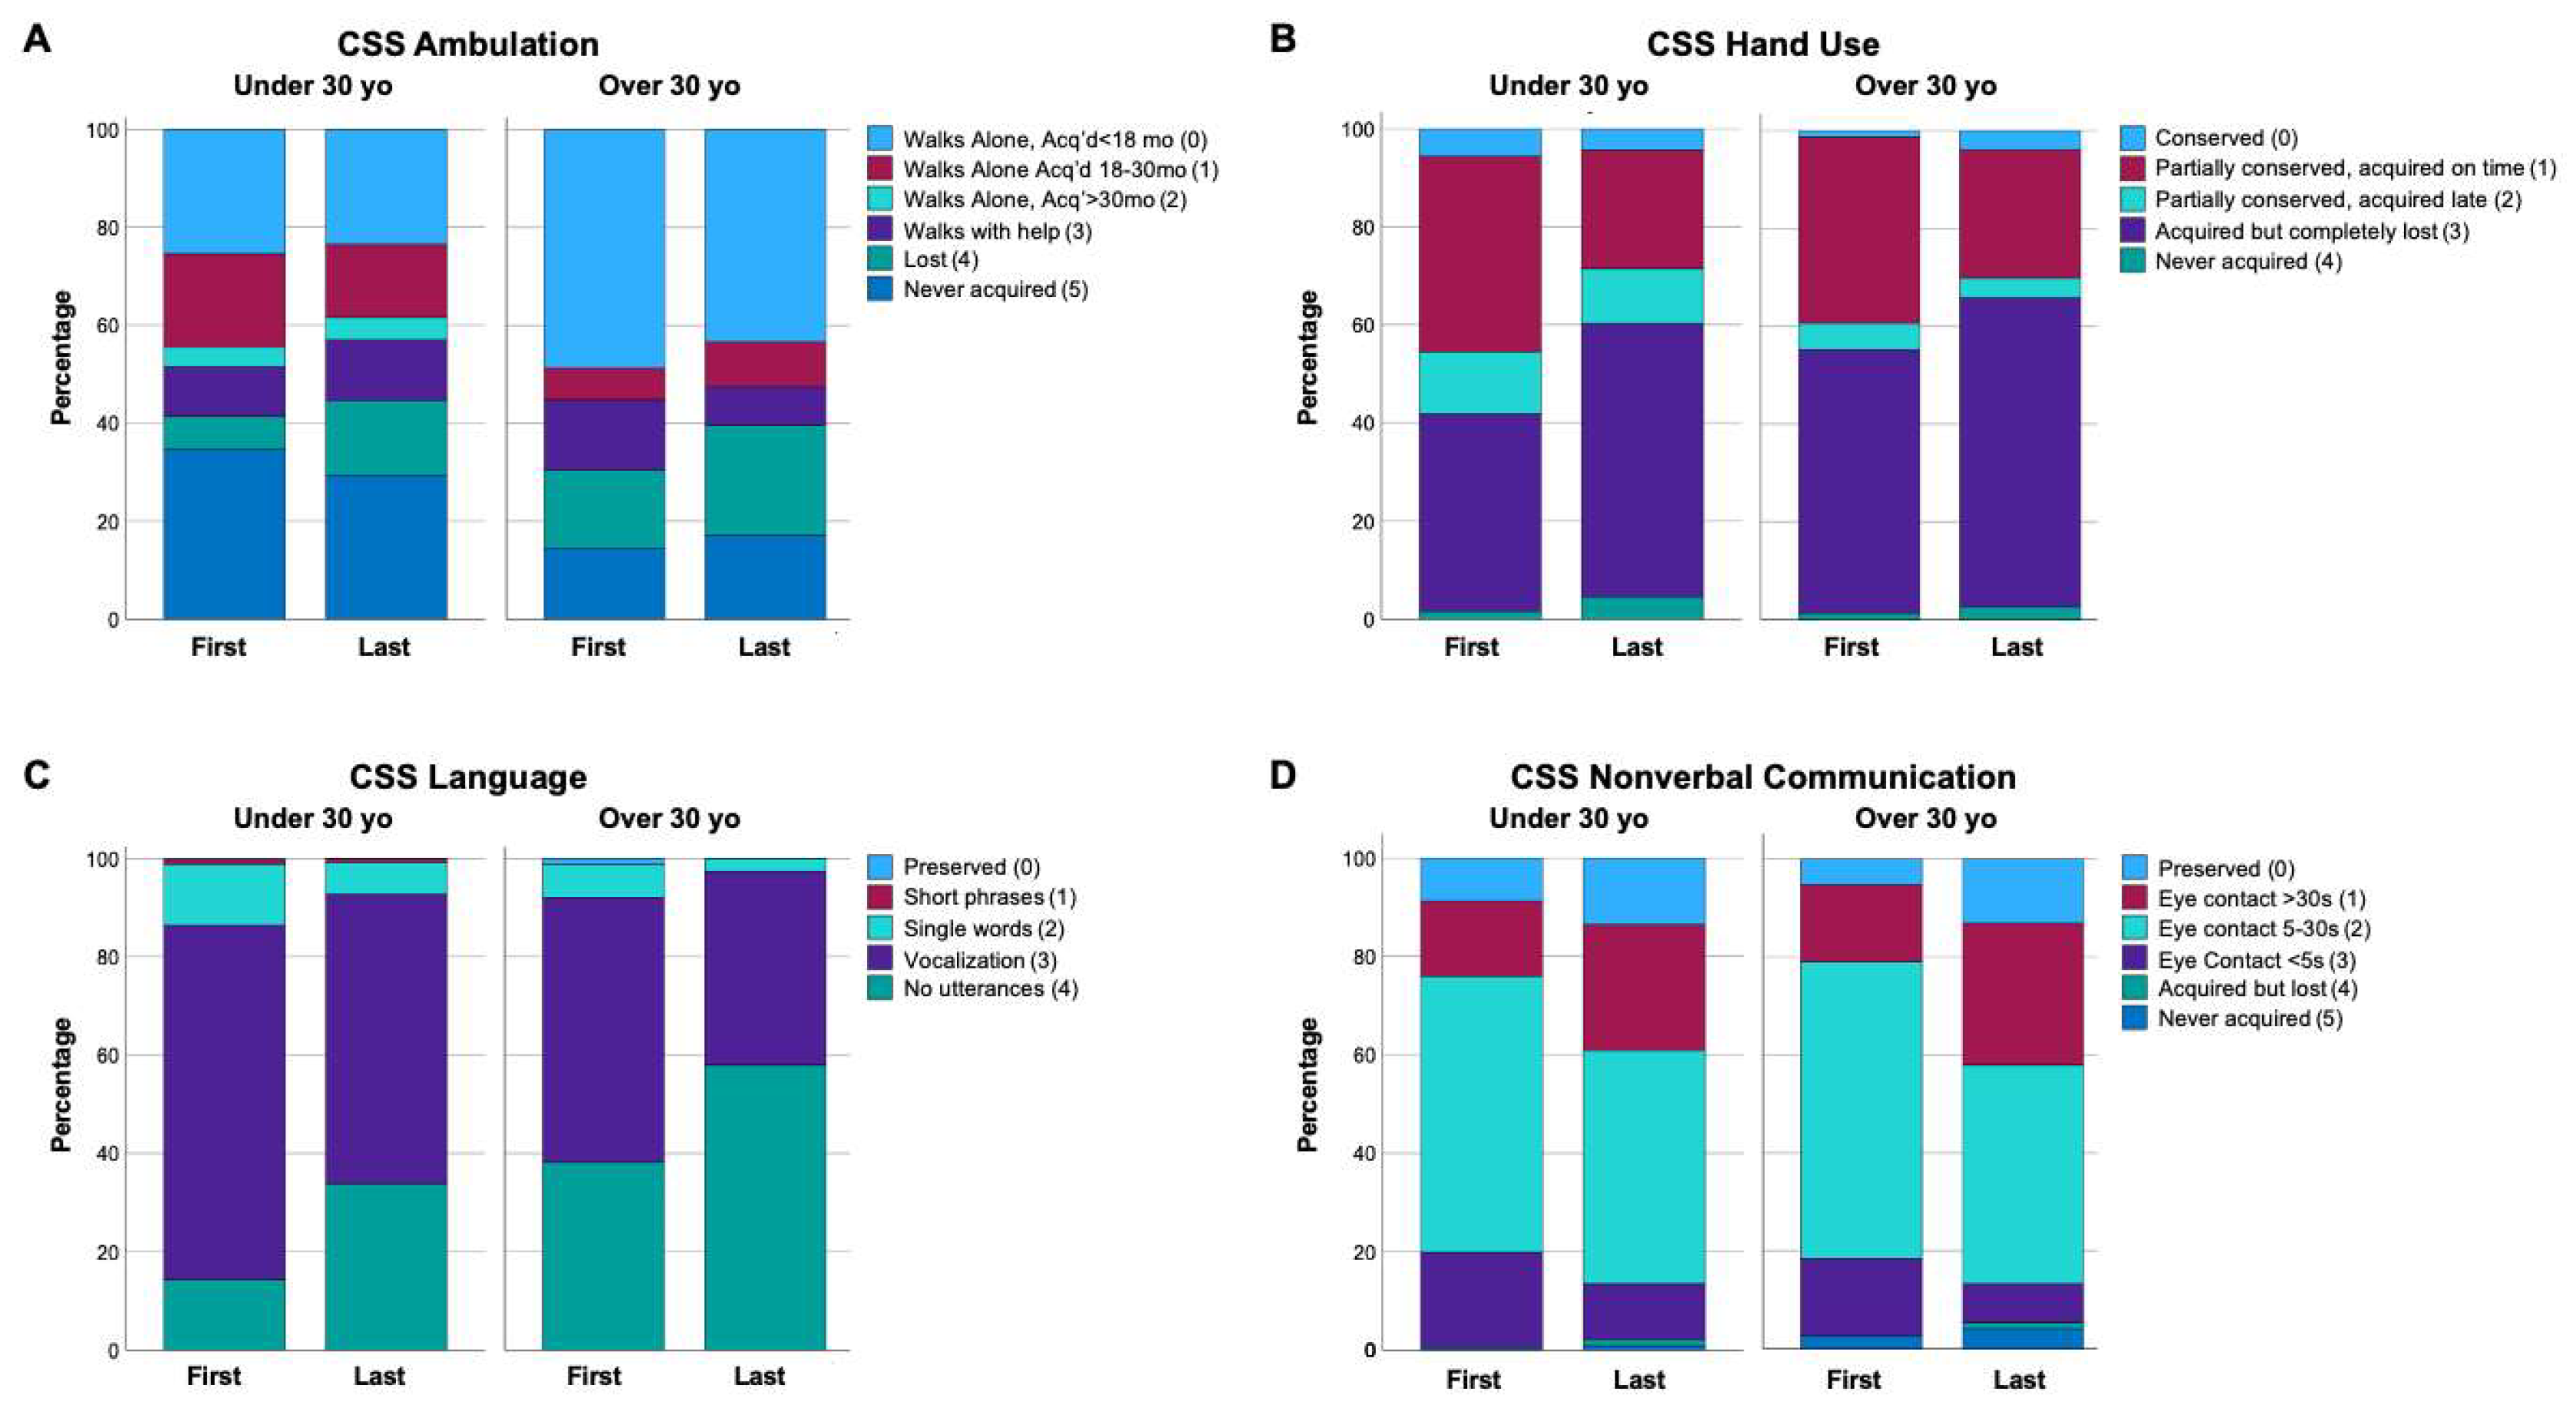

Table 1.
Number of participants with Classic RTT in each cohort.
| Classic RTT | Number |
|---|---|
| All Participants | 1253 |
| Visits <30 yo (all) | 1196 |
| Only seen < 30 yo | 1143 |
| Visits ≥ 30 yo (all) | 110 |
| Baseline visits ≥ 30 yo | 56 |
| Aged > 30 yo during study | 52 |
Table 2.
Severity Scales and distribution of MECP2 mutations between cohorts. Total severity measures using the total CSS or total MBA were compared between the last visit <30yo cohort versus first visit ≥30yo cohort analyzed via one-way ANOVA (factor, cohort), with the mean and standard error of the mean (SEM) presented. Difference indicates the numerical difference between the values for the ≥30yo cohort and the <30 yo cohort. Specific mutation frequency (percentage) between young and old cohorts analyzed using Fisher Exact Test. p-values are displayed, with significant values shown in bold text.
| CSS | MBA | Mutation Percentage | |||||||||||
|---|---|---|---|---|---|---|---|---|---|---|---|---|---|
| Mutation | Age Group | n | Mean (SEM) | Change | p-Value | Mean (SEM) | Change | p- Value | Percentage | Change | p- Value | ||
| All | <30 | 1195 | 24.5 (0.2) | 50.1 (0.4) | NA | NA | NA | ||||||
| ≥30yo | 110 | 24.5 (0.7) | 0 | 0.985 | 52.3 (1.2) | 2.2 | 0.100 | NA | NA | NA | |||
| R106W | <30 | 38 | 26.5 (1.1) | 53 (1.9) | 3.2 | ||||||||
| ≥30yo | 9 | 22 (2.3) | -4.5 | 0.080 | 50.8 (3.9) | -2.2 | 0.616 | 8.2 | 5.0 | 0.014 | |||
| R133C | <30 | 74 | 20.1 (0.8) | 46.8 (1.4) | 6.2 | ||||||||
| ≥30yo | 6 | 17.8 (2.8) | -2.3 | 0.433 | 42.8 (4.7) | -4 | 0.422 | 5.5 | -0.7 | 1.000 | |||
| R168X | <30 | 127 | 27.7 (0.6) | 52.9 (1.2) | 10.6 | ||||||||
| ≥30yo | 11 | 29.8 (2.1) | 2.1 | 0.335 | 59.5 (4.1) | 6.6 | 0.126 | 10.1 | -0.5 | 1.000 | |||
| T158M | <30 | 126 | 24.8 (0.7) | 50.5 (1.2) | 10.5 | ||||||||
| ≥30yo | 8 | 26.5 (2.6) | 1.7 | 0.537 | 54.6 (4.6) | 4.1 | 0.383 | 7.3 | -3.2 | 0.328 | |||
| R255X | <30 | 115 | 27.2 (0.6) | 51.7 (1) | 9.6 | ||||||||
| ≥30yo | 5 | 35.4 (3.1) | 8.2 | 0.010 | 64.2 (4.9) | 12.5 | 0.013 | 4.6 | -5.0 | 0.085 | |||
| R270X | <30 | 72 | 27.6 (0.9) | 53 (1.5) | 6.0 | ||||||||
| ≥30yo | 8 | 22.1 (2.6) | -5.5 | 0.049 | 49.1 (4.4) | -3.9 | 0.407 | 7.3 | 1.3 | 0.537 | |||
| R294X | <30 | 71 | 21 (0.8) | 48.8 (1.6) | 5.9 | ||||||||
| ≥30yo | 11 | 20.6 (1.9) | -0.4 | 0.878 | 45.5 (4.1) | -3.3 | 0.449 | 10.0 | 4.1 | 0.100 | |||
| R306C | <30 | 94 | 20.3 (0.7) | 46.3 (1.3) | 7.9 | ||||||||
| ≥30yo | 6 | 24.7 (2.9) | 4.4 | 0.146 | 57.8 (5.3) | 11.5 | 0.038 | 5.5 | -2.4 | 0.455 | |||
| CTT | <30 | 126 | 22.1 (0.7) | 48.8 (1.2) | 10.5 | ||||||||
| ≥30yo | 13 | 20.7 (2.1) | -1.4 | 0.513 | 49.8 (3.8) | 1 | 0.787 | 11.8 | 1.3 | 0.630 | |||
| LargeDel | <30 | 108 | 26.3 (0.8) | 52.8 (1.3) | 9.0 | ||||||||
| ≥30yo | 13 | 29.2 (2.2) | 2.9 | 0.225 | 55.4 (3.7) | 2.6 | 0.500 | 11.9 | 2.9 | 0.310 | |||
Table 3.
Comparison of clinical features between cohorts. Statistical comparisons (last visit <30yo cohort versus first visit ≥30 yo cohort) via Kruskal-Wallis with p-values are noted. Significant differences are noted in bold text.
Table 3.
Comparison of clinical features between cohorts. Statistical comparisons (last visit <30yo cohort versus first visit ≥30 yo cohort) via Kruskal-Wallis with p-values are noted. Significant differences are noted in bold text.
| Scale | Item | Mean: <30, ≥30 | Median: <30, ≥30 | Test Statistic | p-Value |
|---|---|---|---|---|---|
| CSS | Somatic Growth | 1, 1.3 | 0, 1 | 2.947 | 0.086 |
| Sitting | 1.3, 1.5 | 0, 0 | 0.079 | 0.779 | |
| Ambulation | 2.7, 2.3 | 3, 3 | 4.908 | 0.027 | |
| Hand Use | 2.3, 2.2 | 3, 3 | 0.694 | 0.405 | |
| Scoliosis | 1.9, 2.8 | 1, 2 | 23.601 | 0.000 | |
| Language | 3.2, 3.3 | 3, 3 | 1.795 | 0.180 | |
| Nonverbal | 1.6, 1.9 | 2, 2 | 6.954 | 0.008 | |
| Breathing | 1.5, 0.9 | 1, 1 | 24.919 | 0.000 | |
| Autonomic | 1, 1 | 1, 1 | 0.001 | 0.976 | |
| Seizures | 1.2, 1 | 0, 0 | 0.339 | 0.560 | |
| MBA | Motor Skills | 2.9, 2.8 | 3, 3 | 0.681 | 0.409 |
| Verbal Skills | 1.9, 2 | 2, 2 | 0.035 | 0.852 | |
| Social Eye Contact | 1.4, 1.5 | 1, 2 | 2.283 | 0.131 | |
| Lack of Sustained Interest | 1.2, 1.6 | 1, 1 | 8.136 | 0.004 | |
| Irritability/Tantrums | 0.2, 0.1 | 0, 0 | 3.622 | 0.057 | |
| Does Not Reach for Objects/People | 2.6, 2.6 | 3, 3 | 0 | 0.987 | |
| Does Not Follow Verbal Commands | 1.5, 1.7 | 1, 2 | 4.428 | 0.035 | |
| Feeding Difficulties | 1.7, 1.7 | 2, 1 | 0.09 | 0.764 | |
| Chewing Difficulties | 2, 1.8 | 2, 2 | 1.783 | 0.182 | |
| Aggressiveness | 0.1, 0.1 | 0, 0 | 0.003 | 0.959 | |
| Seizures | 1.4, 1.3 | 1, 1 | 0.542 | 0.461 | |
| Speech Disturbance | 3.2, 3.3 | 3, 3 | 1.323 | 0.250 | |
| Bruxism | 0.8, 0.7 | 0, 0 | 1.897 | 0.168 | |
| Breath Holding | 1.1, 0.9 | 1, 0.5 | 10.666 | 0.001 | |
| Hyperventilation | 0.8, 0.3 | 0, 0 | 30.178 | 0.000 | |
| Air/Saliva Expulsion | 1.3, 1.3 | 1, 1 | 0.106 | 0.744 | |
| Mouthing Hands/Objects | 0.9, 0.5 | 0, 0 | 15.051 | 0.000 | |
| Hand Clumsiness | 3.1, 3.1 | 4, 4 | 0.023 | 0.880 | |
| Hand Stereotypies | 3.3, 2.9 | 4, 3.5 | 6.113 | 0.013 | |
| Bradykinesia | 0.9, 1.8 | 0, 2 | 46.333 | 0.000 | |
| Dystonia | 1.3, 1.4 | 1, 1 | 0.391 | 0.532 | |
| Scoliosis | 1.7, 2.4 | 1, 2 | 22.913 | 0.000 | |
| Dyskinesias | 0.4, 0.3 | 0, 0 | 3.006 | 0.083 | |
| Hypertonia | 1.5, 2.2 | 1, 3 | 17.349 | 0.000 | |
| Vasomotor Disturbance | 1.1, 1.2 | 1, 1 | 2.269 | 0.132 |
Table 4.
Age of cohorts assessed longitudinally. Mean, standard deviation (SD), and range displayed for younger (<30 yo) and older (≥30 yo) cohorts for the first and last visit, and the change in age from first to last visit for both cohorts presented.
Table 4.
Age of cohorts assessed longitudinally. Mean, standard deviation (SD), and range displayed for younger (<30 yo) and older (≥30 yo) cohorts for the first and last visit, and the change in age from first to last visit for both cohorts presented.
| Age Mean (SD, Range) | ||
|---|---|---|
| <30 yo | ≥30 yo | |
| First Visit | 8.3 (6.5, 1.1-29) | 34.1 (5.3, 30-57.1) |
| Last Visit | 13.9 (7.3, 2.4-30) | 39.4 (7, 31.1-64.5) |
| Age Change (First-Last) | 5.6 (3.7, 0.4-15.3) | 5.3 (3.4, 1-13.7) |
Table 5.
Change in total CSS and MBA between first and last visits in <30 yo and ≥30 yo groups. Change in total CSS and MBA were analyzed using paired t-tests with p-values noted. Significant differences are noted in bold text.
Table 5.
Change in total CSS and MBA between first and last visits in <30 yo and ≥30 yo groups. Change in total CSS and MBA were analyzed using paired t-tests with p-values noted. Significant differences are noted in bold text.
| CSS | MBA | ||||||||
|---|---|---|---|---|---|---|---|---|---|
| Age Group | Number | Visit | Mean (SEM) | Change | p-Value | Mean (SEM) | Change | p-Value | |
| <30 | 985 | First | 22.2 (0.2) | 46.9 (0.4) | |||||
| Last | 24.6 (0.2) | 2.5 | 0.000 | 50.7 (0.4) | 3.8 | 0.000 | |||
| ≥30yo | 76 | First | 23.3 (0.9) | 51 (1.5) | |||||
| Last | 23.5 (0.8) | 0.2 | 0.573 | 52.6 (1.4) | 1.6 | 0.151 | |||
Table 6.
Change in clinical features between first-to last visit in <30yo and ≥30yo groups. Differences in clinical features from first to last visit were analyzed using Wilcoxon signed rank (paired) with the test statistic and p-values noted. Significant differences are noted in bold text.
Table 6.
Change in clinical features between first-to last visit in <30yo and ≥30yo groups. Differences in clinical features from first to last visit were analyzed using Wilcoxon signed rank (paired) with the test statistic and p-values noted. Significant differences are noted in bold text.
| Item | Age Group | Mean: First, Last | Median: First, Last | Test Statistic | p-Value | |
|---|---|---|---|---|---|---|
| CSS | Somatic Growth | <30 | 1, 0.9 | 0, 0 | -1.608 | 0.108 |
| ≥30 | 1.3, 1.1 | 0, 0.5 | -1.869 | 0.062 | ||
| Sitting | <30 | 1, 1.3 | 0, 0 | 6.265 | 0.000 | |
| ≥30 | 1.1, 1.3 | 0, 0 | 1.252 | 0.210 | ||
| Ambulation | <30 | 2.6, 2.7 | 3, 3 | 3.208 | 0.001 | |
| ≥30 | 1.9, 2.1 | 1, 1 | 1.701 | 0.089 | ||
| Hand Use | <30 | 1.9, 2.3 | 2, 3 | 12.461 | 0.000 | |
| ≥30 | 2.2, 2.3 | 3, 3 | 2.265 | 0.024 | ||
| Scoliosis | <30 | 1, 2 | 0, 1 | 18.891 | 0.000 | |
| ≥30 | 2.6, 2.7 | 2, 2 | 0.959 | 0.337 | ||
| Language | <30 | 3, 3.3 | 3, 3 | 10.921 | 0.000 | |
| ≥30 | 3.3, 3.6 | 3, 4 | 3.162 | 0.002 | ||
| Nonverbal Communication | <30 | 1.9, 1.6 | 2, 2 | -7.140 | 0.000 | |
| ≥30 | 2, 1.7 | 2, 2 | -2.211 | 0.027 | ||
| Respiratory Dysfunction | <30 | 1.3, 1.5 | 1, 2 | 5.114 | 0.000 | |
| ≥30 | 1.1, 1 | 1, 1 | -0.887 | 0.375 | ||
| Autonomic Symptoms | <30 | 0.9, 1 | 1, 1 | 4.388 | 0.000 | |
| ≥30 | 0.9, 0.9 | 1, 1 | -0.604 | 0.546 | ||
| Seizures | <30 | 0.8, 1.2 | 0, 0 | 6.132 | 0.000 | |
| ≥30 | 0.9, 0.8 | 0, 0 | -1.249 | 0.212 | ||
| MBA | Motor Skills | <30 | 2.6, 3 | 3, 3 | 12.940 | 0.000 |
| ≥30 | 2.7, 3 | 3, 3 | 2.966 | 0.003 | ||
| Verbal Skills | <30 | 1.9, 2 | 1, 2 | 2.359 | 0.018 | |
| ≥30 | 2, 2.6 | 2, 3 | 3.344 | 0.001 | ||
| Social Eye Contact | <30 | 1.1, 1.4 | 1, 1 | 5.124 | 0.000 | |
| ≥30 | 1.5, 1.6 | 2, 2 | 0.215 | 0.830 | ||
| Lack Of Sustained Interest | <30 | 1.2, 1.2 | 1, 1 | -0.819 | 0.413 | |
| ≥30 | 1.7, 1.4 | 2, 1 | -1.813 | 0.070 | ||
| Irritability or Tantrums | <30 | 0.4, 0.2 | 0, 0 | -7.609 | 0.000 | |
| ≥30 | 0.2, 0.1 | 0, 0 | -0.922 | 0.356 | ||
| Does Not Reach for Objects/People | <30 | 1.9, 2.6 | 2, 3 | 13.481 | 0.000 | |
| ≥30 | 2.5, 3 | 3, 4 | 2.967 | 0.003 | ||
| Does Not Follow Verbal Commands | <30 | 1.8, 1.4 | 2, 1 | -8.256 | 0.000 | |
| ≥30 | 1.8, 1.5 | 2, 1 | -2.277 | 0.023 | ||
| Feeding Difficulties | <30 | 1.4, 1.8 | 1, 2 | 9.066 | 0.000 | |
| ≥30 | 1.4, 1.7 | 1, 2 | 1.873 | 0.061 | ||
| Chewing Difficulties | <30 | 1.6, 2.1 | 1, 2 | 11.301 | 0.000 | |
| ≥30 | 1.6, 2 | 1, 2 | 2.886 | 0.004 | ||
| Aggressiveness | <30 | 0.2, 0.1 | 0, 0 | -3.243 | 0.001 | |
| ≥30 | 0.1, 0.1 | 0, 0 | -0.832 | 0.405 | ||
| Seizures | <30 | 1, 1.4 | 0, 1 | 7.546 | 0.000 | |
| ≥30 | 1.2, 1.1 | 1, 1 | -1.062 | 0.288 | ||
| Speech Disturbance | <30 | 2.9, 3.2 | 3, 3 | 13.835 | 0.000 | |
| ≥30 | 3.3, 3.5 | 3, 4 | 3.086 | 0.002 | ||
| Bruxism | <30 | 1.1, 0.7 | 1, 0 | -7.951 | 0.000 | |
| ≥30 | 0.6, 0.5 | 0, 0 | -1.414 | 0.157 | ||
| Breath Holding | <30 | 1.2, 1.1 | 1, 1 | -0.650 | 0.516 | |
| ≥30 | 1, 0.8 | 1, 0 | -1.719 | 0.086 | ||
| Hyperventilation | <30 | 0.9, 0.7 | 0, 0 | -2.635 | 0.008 | |
| ≥30 | 0.3, 0.4 | 0, 0 | 1.296 | 0.195 | ||
| Air/Saliva Expulsion | <30 | 1.4, 1.3 | 1, 1 | -2.343 | 0.019 | |
| ≥30 | 1.2, 1.1 | 1, 1 | -0.566 | 0.571 | ||
| Mouthing Hands/Objects | <30 | 1.4, 0.9 | 1, 0 | -9.066 | 0.000 | |
| ≥30 | 0.4, 0.4 | 0, 0 | -0.083 | 0.934 | ||
| Hand Clumsiness | <30 | 2.8, 3.1 | 3, 4 | 9.574 | 0.000 | |
| ≥30 | 3.1, 3.3 | 4, 4 | 1.947 | 0.052 | ||
| Hand Stereotypies | <30 | 3.3, 3.3 | 4, 4 | -1.756 | 0.079 | |
| ≥30 | 3, 3.3 | 4, 4 | 2.012 | 0.044 | ||
| Bradykinesia | <30 | 0.5, 0.9 | 0, 0 | 11.131 | 0.000 | |
| ≥30 | 1.6, 1.6 | 2, 1 | -0.545 | 0.586 | ||
| Dystonia | <30 | 0.8, 1.4 | 0, 1 | 12.119 | 0.000 | |
| ≥30 | 1.4, 1.8 | 1, 2 | 2.260 | 0.024 | ||
| Scoliosis | <30 | 0.9, 1.7 | 0, 1 | 18.300 | 0.000 | |
| ≥30 | 2.2, 2.3 | 2, 2 | 0.786 | 0.432 | ||
| Dyskinesias | <30 | 0.3, 0.4 | 0, 0 | 2.679 | 0.007 | |
| ≥30 | 0.2, 0.5 | 0, 0 | 2.128 | 0.033 | ||
| Hypertonia | <30 | 0.9, 1.6 | 0, 1 | 12.858 | 0.000 | |
| ≥30 | 2.1, 2.4 | 3, 3 | 1.637 | 0.102 | ||
| Vasomotor Disturbance | <30 | 1, 1.1 | 1, 1 | 2.318 | 0.020 | |
| ≥30 | 1.1, 1 | 1, 1 | -1.139 | 0.255 |
Disclaimer/Publisher’s Note: The statements, opinions and data contained in all publications are solely those of the individual author(s) and contributor(s) and not of MDPI and/or the editor(s). MDPI and/or the editor(s) disclaim responsibility for any injury to people or property resulting from any ideas, methods, instructions or products referred to in the content. |
© 2024 by the authors. Licensee MDPI, Basel, Switzerland. This article is an open access article distributed under the terms and conditions of the Creative Commons Attribution (CC BY) license (http://creativecommons.org/licenses/by/4.0/).
Copyright: This open access article is published under a Creative Commons CC BY 4.0 license, which permit the free download, distribution, and reuse, provided that the author and preprint are cited in any reuse.


