Preprint
Article

Systematic Review of Machine Learning Return-on-Investment Forecasting

Altmetrics

Downloads

174

Views

101

Comments

0

This version is not peer-reviewed

Submitted:

14 July 2024

Posted:

16 July 2024

You are already at the latest version

Alerts
Abstract
In this paper, we investigate the proftability of investing in movies for retail investors, focusing on the return on investment (ROI) metric, which is calculated as revenue divided by budget. Our analysis encompasses 5000 movies from the movie database TMDB, examining factors such as production scale, genres, key actors, directors, and more. Additionally, we employ textual analysis techniques like Latent Semantic Analysis (LSA) on movie overviews and tags to incorporate movie themes. We then evaluate various supervised classifcation models including Logistic Regression, Random Forest, and Light Gradient Boosting (LightGBM), comparing their performance. Our fndings highlight the signifcance of production scale, team structure, and movie themes in identifying potential high-return opportunities for investors.
Keywords: 
Subject: Computer Science and Mathematics  -   Artificial Intelligence and Machine Learning

1. Introduction

1.1. Background and Motivation

In contemporary society, motion pictures represent a significant facet of entertainment and a substantial investment opportunity. As of 2020, the global film and video market attained a value nearing $234.9 billion, reflecting a compound annual growth rate (CAGR) of 2.4% since 2015. Projections indicate that this market will escalate to approximately $318.2 billion by 2025 and $410.6 billion by 2030. Consequently, the pivotal inquiry emerges: how can prospective movie investors effectively evaluate investment opportunities? Traditionally, such decisions have relied heavily on subjective judgments influenced by personal preferences. This study proposes an alternative approach based on modeling techniques aimed at enhancing objectivity and data-driven decision-making among investors with machine learning algorithms.

1.2. Literature Overview

Recent advancements in machine learning have yielded significant improvements across diverse applications.
Deep learning has seen extensive application across various domains, showcasing significant advancements in healthcare, computer vision, and natural language processing (NLP). Zhong et al. (2024) evaluated deep learning solutions for pneumonia detection, comparing custom models with transfer learning approaches, highlighting their performance in medical imaging tasks [28]. Wang et al. (2024a) explored the conversion of 2D images to 3D textures using neural radiance fields, demonstrating its potential in computer graphics and virtual environments [22]. In a related study, Wang et al. (2024b) developed a graph neural network recommendation system tailored for football formation strategies, underscoring the applicability of graph-based approaches in sports analytics [23]. [26] proposes the use of Bayesian variable selection in genome search.
Recent advancements in graph neural networks (GNNs) have also been noteworthy. Peng et al. (2024a) introduced Maxk-GNN, a high-performance GPU kernel designed to accelerate the training of GNNs, enhancing their efficiency in large-scale graph processing tasks [20]. Additionally, Lingcn, proposed by Peng et al. (2024b), innovates with structural linearized graph convolutional networks for homomorphically encrypted inference [19]. In the realm of natural language processing,
Jin et al. (2024a) presented APEER, a framework for enhancing large language model reranking through automatic prompt engineering, illustrating advancements in NLP [8]. Moreover, Dai et al. (2024) discussed AI-based NLP techniques, emphasizing the application and impact of bag-of-words models and TF-IDF in natural language tasks [3]. Li et al. (2024a) explored the application of augmented reality (AR) in remote work and education, highlighting its transformative potential in enhancing collaborative environments [11]. They further investigated deep learning methods to optimize software development processes, addressing efficiency and innovation in software engineering [12]. In addtion, [9] demonstrates AI learning from teaching regularization to imitate the correlations.
Recent studies have also focused on multi-modal learning and vision tasks. Zhu et al. (2024) developed a cross-task multi-branch vision transformer for facial expression and mask-wearing classification, showcasing advancements in visual recognition technologies [31]. Additionally, Wang et al. (2024c) applied BERT-based deep learning algorithms for AI-generated text detection and classification, contributing to advancements in text understanding and document analysis [21]. Yang et al. (2024) optimized diabetic retinopathy detection using Inception-V4 and a dynamic version of the snow leopard optimization algorithm, demonstrating improvements in biomedical signal processing and control systems [25]. [2] explored Few-Shot Learning in Pareto optimal with self-supervised training procedure. Huang et al. (2024) investigated tumor segmentation techniques based on image enhancement methods, highlighting advancements in medical image analysis [6].  [4] discusses the airfreight transportation with double discount and [15] adds into the area of NLP with text sentiment detection and based on Integrated Learning Algorithm.
In the realm of financial modeling, [5] shows the application of artificial intelligence technology in the physical assembly techniques. [27] researches on task allocation planning with hierarchical task network for national economic mobilization. [24] researched into financial risk prediction with deep learning.
In the domain of time series analysis, frameworks like FTS (Framework to Find a Faithful TimeSieve) have been introduced to improve temporal data analysis [10]. Moreover, AI-generated text detection and classification using BERT-based deep learning algorithms have been explored for text analysis tasks [21]. [17] talks about infrared image Super-Resolution via Lightweight Information Split Network. [7] introduces the Carry-Lookahead RNN and [1] proposes to improve seat system with enhanced human-AI interactions.
Medical imaging and healthcare have also benefited from advanced machine learning techniques. Yang et al. demonstrated optimization of diabetic retinopathy detection using Inception-V4 and novel optimization algorithms [25]. Similarly, research continues to evolve in image enhancement methods for tumor segmentation [6]. [18] applies Transformer to improve heart rate prediction instead of statistical approach. Furthermore, applications of machine learning in weather prediction have been investigated, aiming to improve the accuracy of dangerous flight weather predictions [16]. [13] proves that the multi-modal preference alignment can mitigate visual instruction regression of large language model. Furthermore,[14] constructs a large-scale synthetic multi-turn question-answering dataset that can be utilized to improve on training accuracy.
These studies collectively underscore the expansive impact and versatility of machine learning across various fields.

1.3. Problem Statement

From a movie industry investor’s standpoint, a pertinent inquiry arises: how can machine learning algorithms aid in investment decision-making? Specifically, can models effectively determine the viability of investing in a movie? To address these queries, we initially conducted exploratory data analysis (EDA) to glean business insights. Subsequently, we integrated latent semantic analysis (LSA) with classification models to predict future levels of return-on-investment (ROI).

2. Technical Exposition

2.1. Description of Dataset

The dataset we used is "The Movie DataBase" (TMDB) from Kaggle1. It is sourced from the IMDB database and processed into two CSV files.
After combining these two data files, we obtained one dataset with the following variables: movie’s homepage, budget, genres, revenue, title, movie duration, language, plot keywords, overview, tagline, number of voted users on TMDB, average votes, popularity, production country, production company, crew (including the leading director and departments), and cast (including the top 1st, 2nd, and 3rd actors).
The first dataset, tmdb_5000_credits, contains information on movie cast and crew, with each column stored in JSON format. The second dataset, tmdb_5000_movies, contains basic information about movies such as genres, and statistics such as revenue and budget. The movies included in the dataset were mostly released between 1960 and 2020, with revenue figures updated to the dataset’s production time.

2.2. Data Preprocessing

Missing Value Handling

Table 1 shows that approximately 64% of homepage, 51% of companies_3, and 30% of companies_2 values are missing. For homepage, it is likely that some movies do not have a homepage. Regarding production companies, it is reasonable that some movies are produced by only one company. Therefore, we excluded these three variables from further analysis. Missing values in ’companies’, ’actors’, and ’plot-keywords’ were handled by converting them into dummy variables, with the last category labeled as ’other’. The ’Tagline’ variable was subsequently concatenated with ’Overview’ due to their textual nature.

Outlier Handling

We initially removed samples with infinite or zero Return on Investment (ROI), resulting from zero revenue, zero budget, or zero duration. Upon examining the ROI distribution, we identified some extremely large values (up to 1e6). Notably, two outlier samples were identified: the films "Modern Times" and "Nurse 3-D", with reported budgets of 1 and 10, respectively. Upon cross-referencing with Wikipedia, we found discrepancies in the reported budget and box office figures for "Nurse 3-D" (budget: $10,000,000; box office: $80,231). Consequently, recognizing these inaccuracies in the IMDB database, we decided to exclude these records from our dataset.
However, the updated dataset still exhibited several outliers (see Figure 1). Notably, the top outliers included "Paranormal Activity (2007)", which set box office records at its release; "Tarnation", notable for its low budget due to its production from Super 8 footage and VHS tape; and "The Blair Witch Project", renowned for its high box office returns. The further removal of outliers posed a risk of reducing sample size and altering the original ROI distribution, and the outcome indicated that a substantial number of samples were capped.
Therefore, we also adopted a second approach of MAD-based Gerber Robust Covariance and Nested Clustering to remove outliers as proposed in [30]. In the article, the combination of Gerber and Nested Clustering 1 has reduced the dispersion of data distribution and enhanced the information-noise-ratio for financial data. As the Return on Investment data also suffers noises from inaccurate inputs, we applied Mad-based Gerber to truncate ROI values. Finally we categorized ROI into four classes based on quantiles: 25%, 50%, and 75% thresholds. These categories were defined as: VeryLow, Low, Mid, and High.
Algorithm 1 Nested Clustered Optimization
  • Obtain de-noised predictor covariance matrix V ^ and correlation matrix C ^
  • Cluster correlation matrix C ^ into K groups
  • Intra-cluster optimization within each of K groups, concatenate K vectors of weight into R K × N weight matrix, denoted as Ω intra
  • Use the intra-cluster weights to get reduced sample covariance matrix: V reduced = Ω intra V ^ Ω intra
return: final optimal weights allocated on each asset
In the VeryLow class, ROI ranges nearly from 0 to 1.02, indicating insufficient revenue to cover the investment. The Low class encompasses ROI values from 1 to 2, while the Mid class ranges from 2 to 4.5. ROI values above 4.5 fall into the High class. Following this categorization process, we achieved a balanced dataset suitable for classification tasks.

3. Feature Engineering

In addition to existing predictors, we incorporated several new variables. Firstly, recognizing that films produced in multiple languages or countries may exhibit different global impacts, we introduced variables such as the number of languages and countries by transforming the original variables. The scale of production, reflected in the number of actors, different departments, and crew size, was also considered valuable. Furthermore, we converted ’genres’ and the most frequently occurring ’production companies’ (top 10), ’languages’ (top 3), and ’actors’ (top 100) into dummy variables. Additionally, we identified and converted the top ten most frequent plot keywords into dummy variables.
The processed dataset now comprises 3225 samples and 209 variables.

3.1. Exploratory Data Analysis

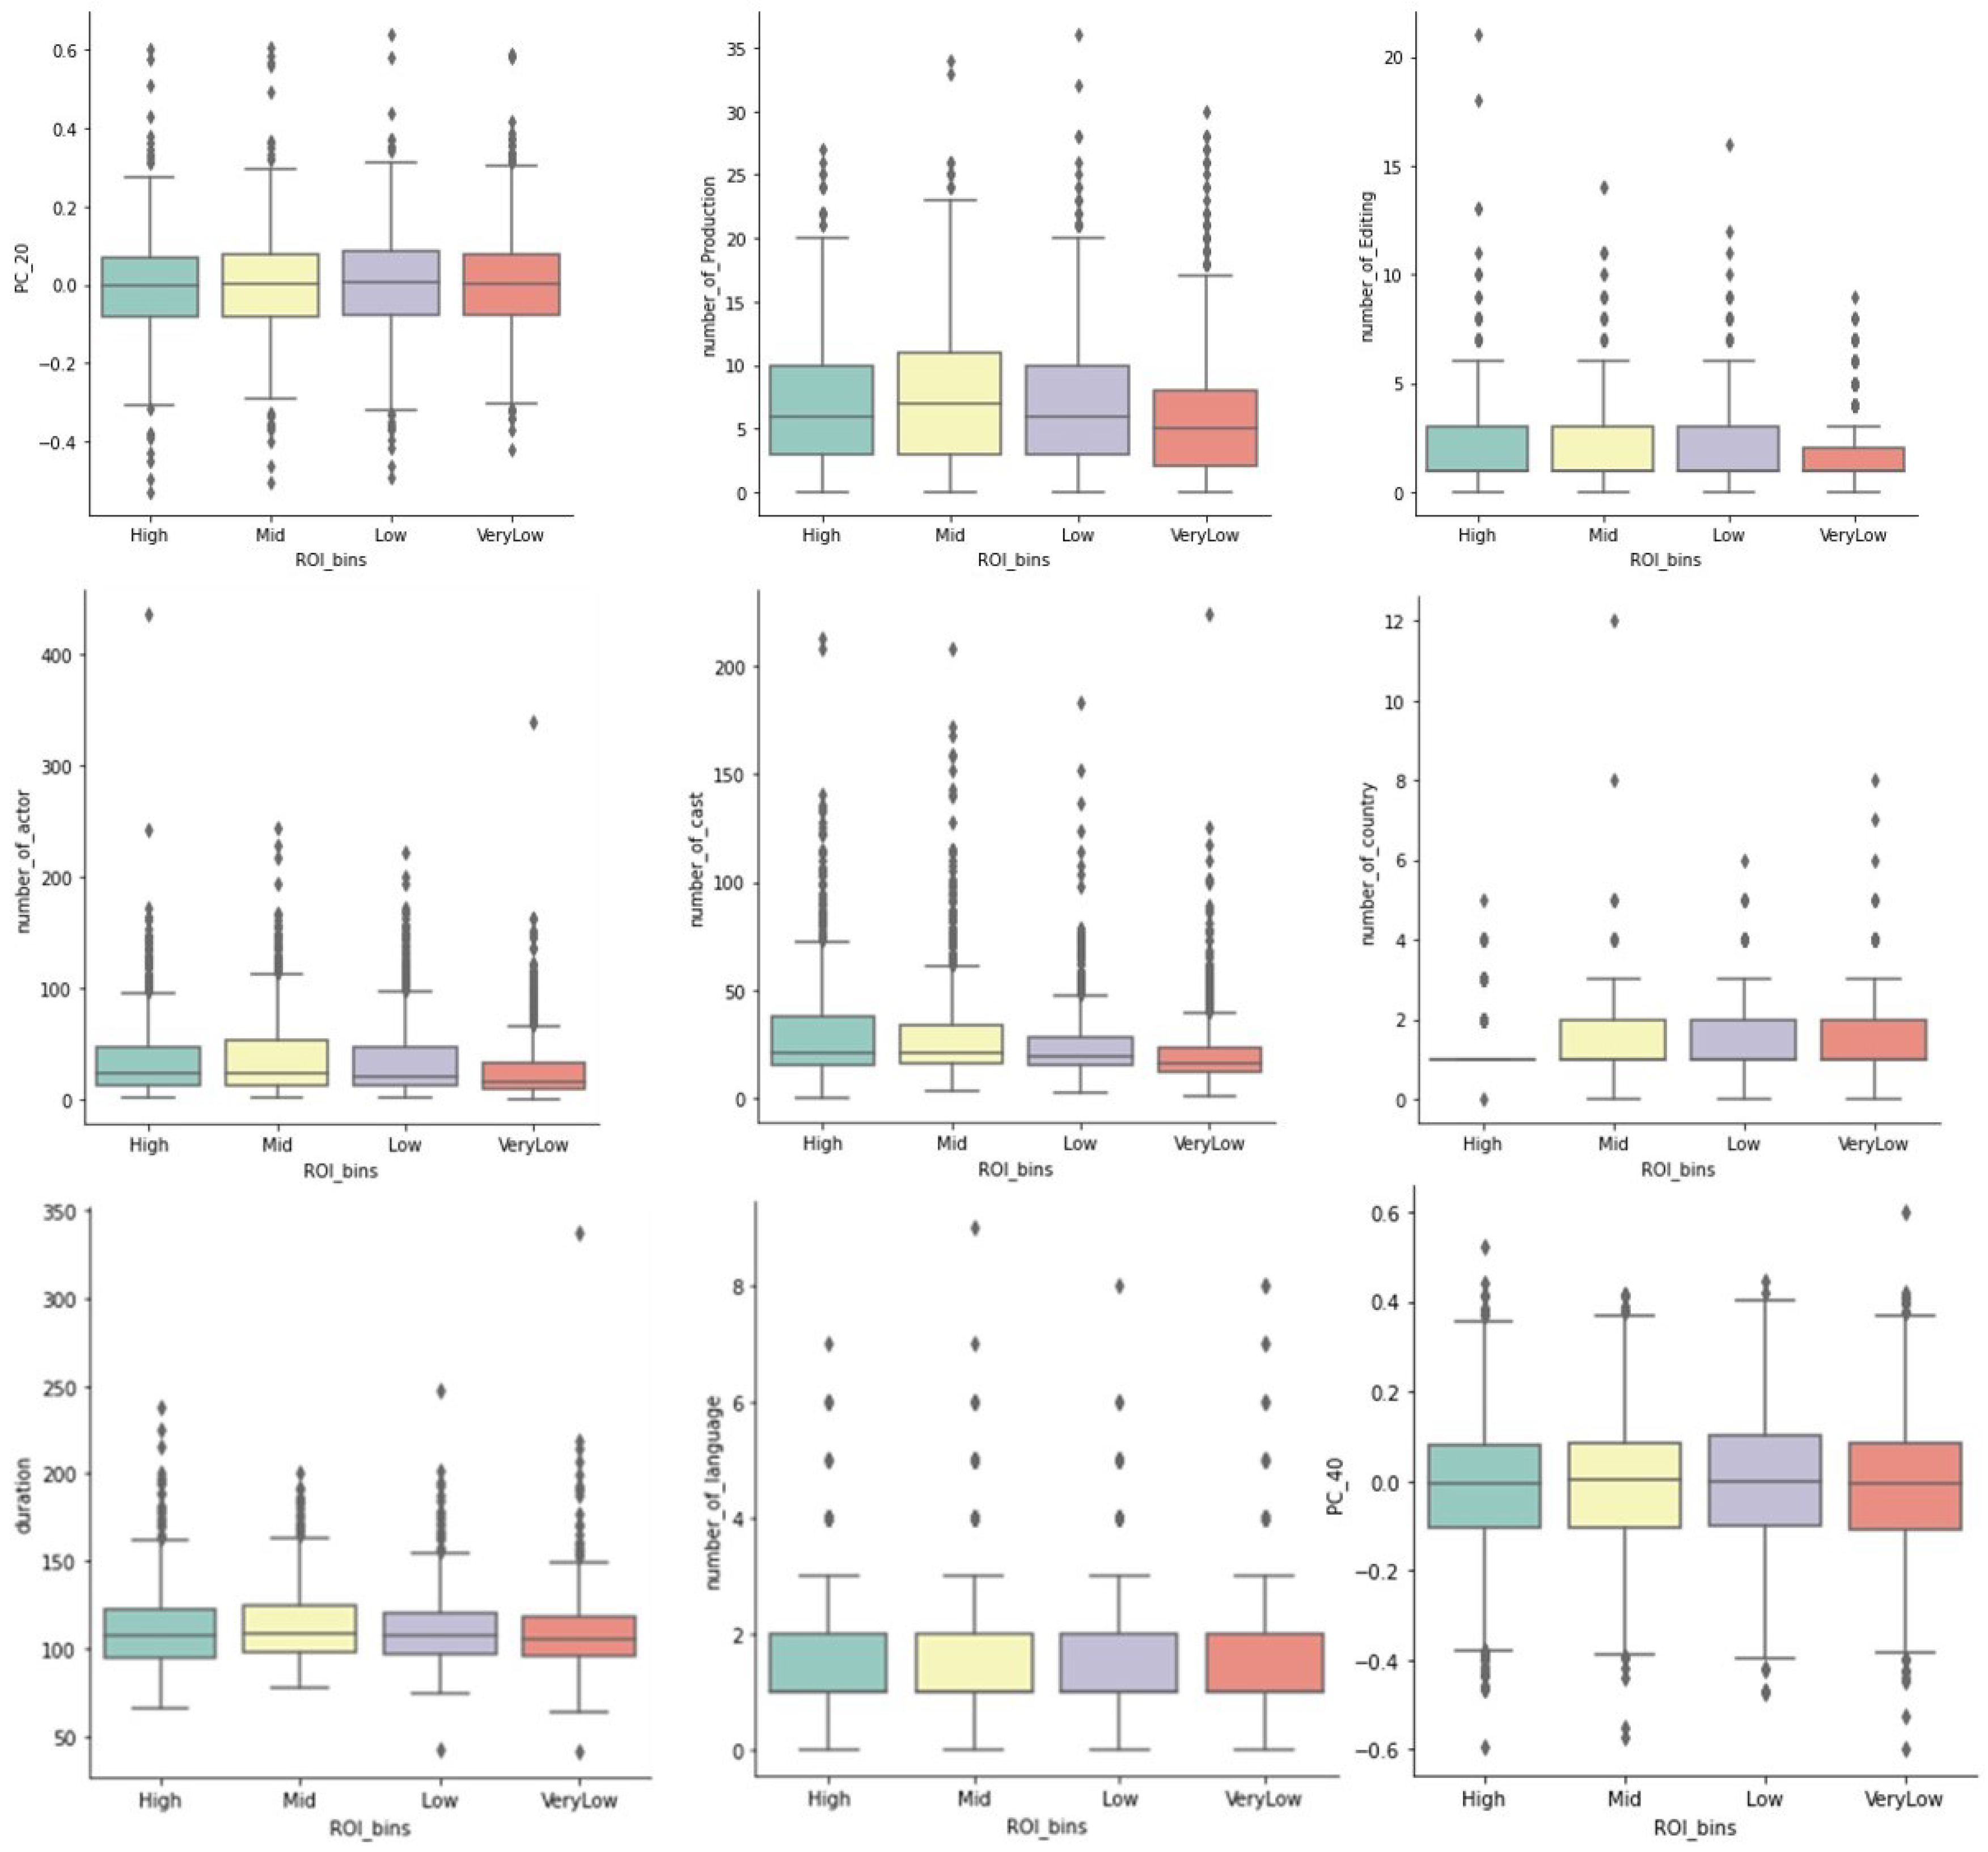
We conducted an exploratory data analysis (EDA) to understand the distributions and relationships within the dataset. Numeric variables were analyzed for variations across different classes (see Figure 2). Notably, variables such as ’number_of_cast’ exhibited significant variation across different classes. Outliers in variables like ’number_of_productions’ and principal components (PCs) from Latent Semantic Analysis (discussed further in Section 3.2.2) demonstrated distinct patterns across classes, suggesting potential influences on predictions for classes labeled VeryLow and High.
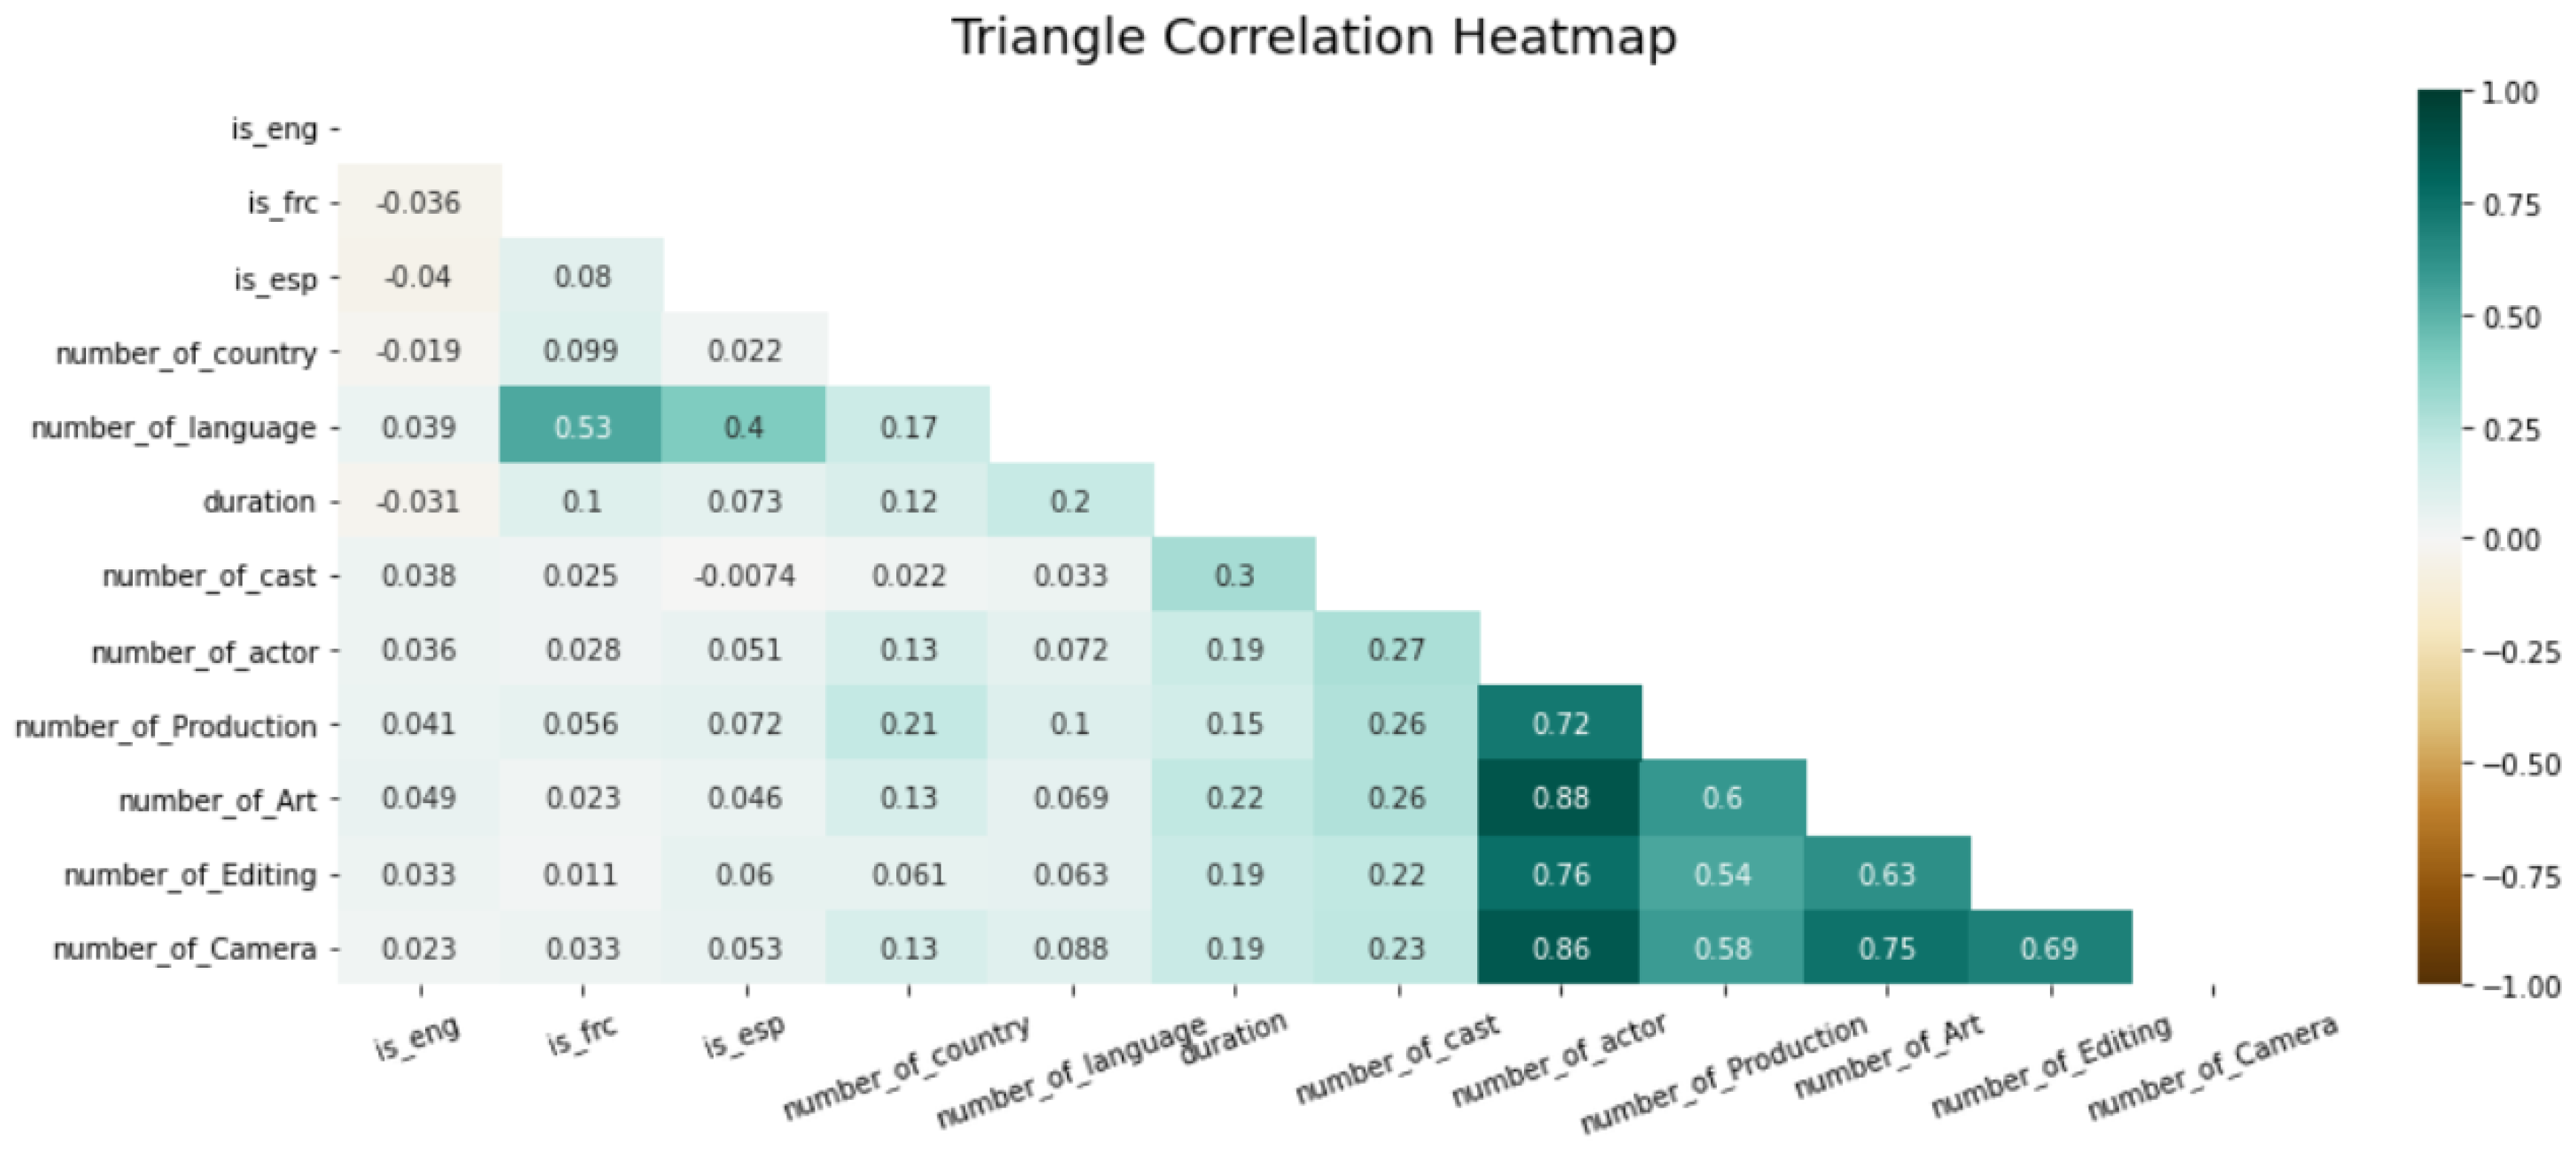
Furthermore, strong correlations were observed among variables such as ’number_of_actors’, ’number_of_cameras’, and ’number_of_art’ (see Figure 3). Some of these correlated variables may be considered for exclusion in subsequent analyses, or may be disregarded by feature selection models such as Lasso Regression.

4. Methodology

4.1. Independent and Dependent Variables

As mentioned previously, our objective is to address a multi-classification problem to predict ROI levels. The response variable is categorized into ROI levels, excluding variables such as popularity and votes that are not available before a movie’s release.
Our independent variables comprise three main categories: original variables, generated dummy variables, and principal components derived from Latent Semantic Analysis (LSA). Table 2 summarizes both the independent and dependent variables used in our classification task.

4.2. Models and Model Selection

Prior to fitting prediction models, we defined "High Precision Rate" as our primary evaluation metric (further discussed in Section 3.2.1). Additionally, we applied Latent Semantic Analysis (LSA) to extract meaningful text features from movie taglines and overviews (further discussed in Section 3.2.2).
For supervised learning, we employed several models: multinomial logistic regression, random forest, and boosted trees. In logistic regression, we incorporated an l 1 penalty (Lasso Regression) for feature selection. Boosted tree models included both gradient boosting and XGBoost. The dataset was split into training (2/3 of data) and test sets (1/3 of data). Models were trained on the training set and optimized using k-fold cross-validation.

4.2.1. Evaluation Metrics

Given our focus on improving investment decisions, we prioritized models that effectively predict movies with high ROI or at least medium ROI with high precision. This metric, termed High Precision Rate (HPR), is defined as:
H P R = # of movies with high or medium ROI predicted as high ROI total # of movies predicted as high ROI

4.3. Latent Semantic Analysis

We utilized Latent Semantic Analysis (LSA) to extract meaningful information from textual data. Algorithm 2 outlines the steps involved in this process, where we derived 50 principal components (PCs) from the original textual contents to serve as new features.
Algorithm 2 LSA based on TF-IDF and PCA
1:
Input: 
2:
(i) Textual contents: ’tagline’+’overview’ 
3:
(ii) Number of principal components to retain, m 
4:
 
5:
function LSA( Textual contents , m
6:
    (1) Split, stem, and lemmatize words in each sample 
7:
    (2) Remove stopwords and create a 2-gram corpus 
8:
    (3) Compute TF-IDF scores for each sample 
9:
    (4) Apply PCA (or Truncated SVD) on TF-IDF scores and obtain PCs 
10:
  (5) Retain the top m PCs and analyze latent semantics 
11:
end function 
12:
 
13:
Output: m PCA scores of all samples.
In stemming and lemmatization, variations of the same words are normalized (e.g., "cat", "Cat", "cats" → "cat"). We used 2-grams instead of single words to enhance interpretability. Term Frequency-Inverse Document Frequency (TF-IDF) was employed to assign weights to terms based on their relevance to each sample.
The initial dataset had 12,212 dimensions, from which we retained the first 50 principal components based on their cumulative explained variance. These components capture thematic aspects such as "family story" and "true love" from the overview and taglines.

4.4. Logistic Regression

We employed Multinomial Logistic Regression on the training set to predict ROI levels. Given the dataset’s numerous predictors, the model’s interpretability was compromised, potentially leading to overfitting. To mitigate this, we conducted feature selection using l 1 regularization (Lasso Regression). Predictors were standardized, and a 10-fold cross-validation was employed to optimize the regularization parameter. The resulting model retained 228 features with non-zero coefficients, as discussed in Section 4.1.

4.5. Tree-Based Models

Next, we explored three tree-based models: Random Forest, Gradient Boosting, and XGBoost.
For Random Forest, we used m t r y = p , where p denotes the number of predictors, as the size of the feature subset for tree growth.
Gradient Boosting involved optimizing the parameter n . t r e e s through cross-validation with 10 folds. The final model was trained with n . t r e e s = 47 , selected based on minimal cross-validation error.
For XGBoost, we employed the LightGBM framework for computational efficiency. Using grid-search, we identified the optimal model with a learning rate of 0.01, 35 leaves, and an l2 ratio of 0.1. The final model ensemble consisted of 10 models from 10-fold cross-validation, evaluated using HPR as the metric.

4.6. Bayesian Model

Finally, we investigated Bayesian model as it provides more explainability as well as flexibility for us to incorporate prior assumptions into the model. [29] applied the Bayesian approach to Black-Litterman Portfolio Optimization in statistical arbitrage. By adopting the proposed framework of defining prior and posterior adjustment, we are able to expand the confidence interval on the distribution of all predictors.
We assume that Q N ( q , W ) , where q is the expected ROI according to the views, and W is the diagonal covariance matrix of the expressed views, representing the uncertainty in each view. The posterior return m ¯ and covariance matrix M of the posterior distribution are:
m ¯ = S 1 + P T W 1 P 1 S 1 m ^ T + P T W 1 q

5. Analysis of Results

5.1. Linear Models

In our Lasso Logistic Regression analysis, we assessed feature importance using the absolute magnitude of coefficients (with predictors standardized). Figure 4 illustrates the top twenty influential features identified by the model. Notably, production scale indicators such as number of cast members, various production team structures (e.g., writing, sound), renowned directors and actors (Woody Allen, Tom Hanks), and specific movie genres (Horror, Action, Crime) emerged as significant predictors. The confusion matrix reveals a total accuracy of 34.61% with a High Precision Rate (HPR) of 65.10

5.2. Tree-Based Models

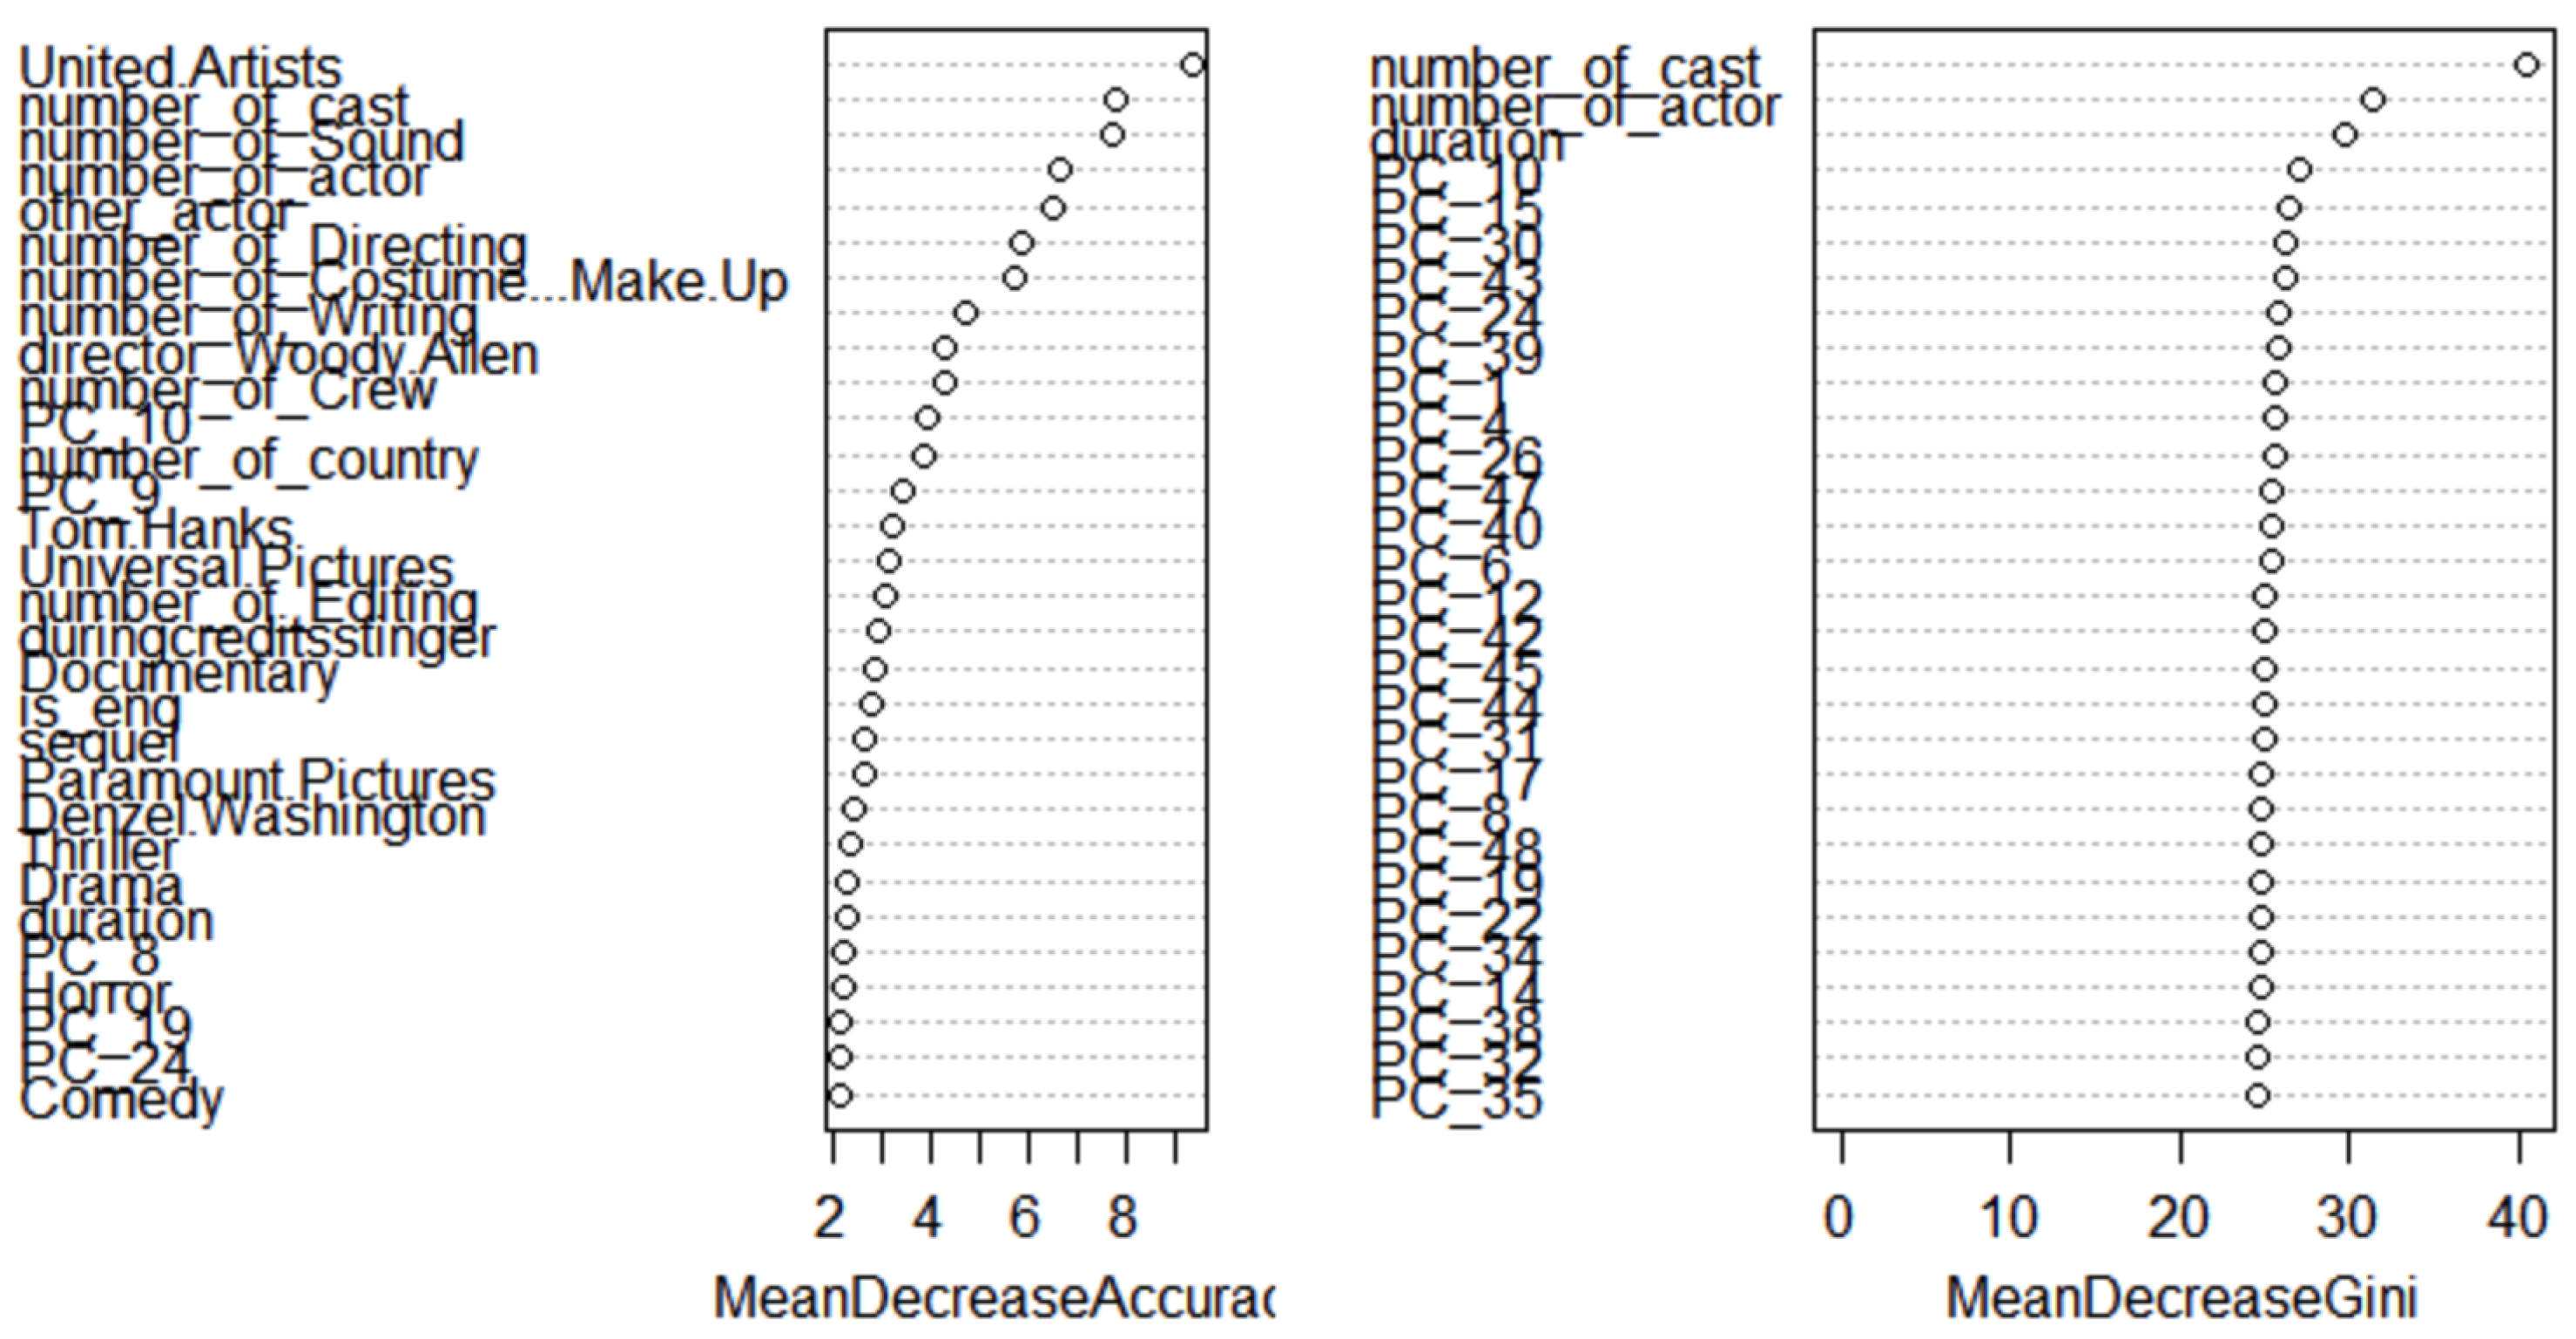
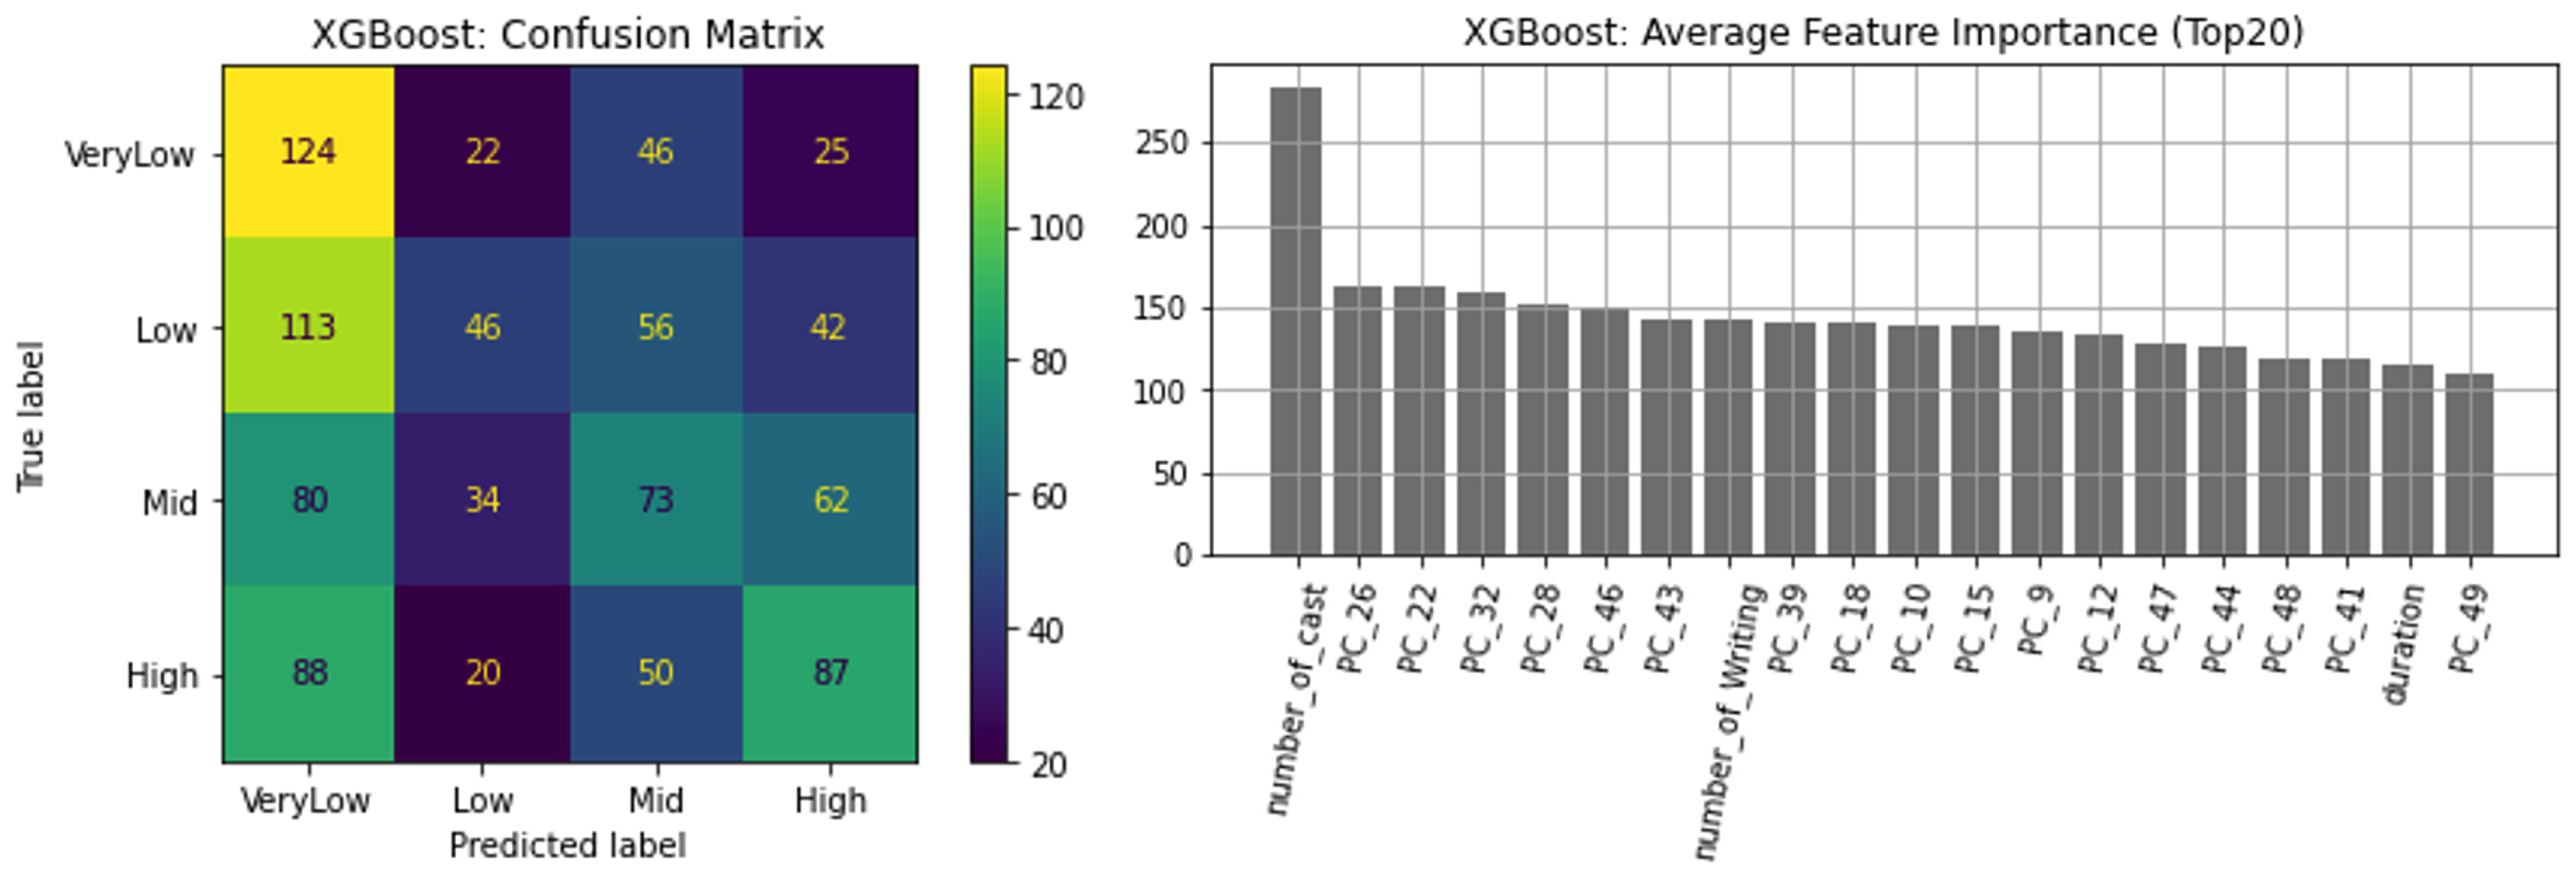
We evaluated the importance of features in predicting movie success across three tree-based models: Random Forest, Gradient Boosting, and LightGBM. Figure 5, Figure 6, and Figure 7 depict the feature importance plots generated for each model. These plots highlight the pivotal role of production scale and team structure features. For instance, "number_of_cast" ranked prominently across models, emphasizing its influence on both prediction accuracy and purity metrics. Notably, production company "United Artists" also emerged as a significant predictor. Conversely, genres and specific high-profile directors and actors showed varying importance levels in accuracy prediction. In terms of purity, topics extracted from movie taglines and overviews proved insightful.
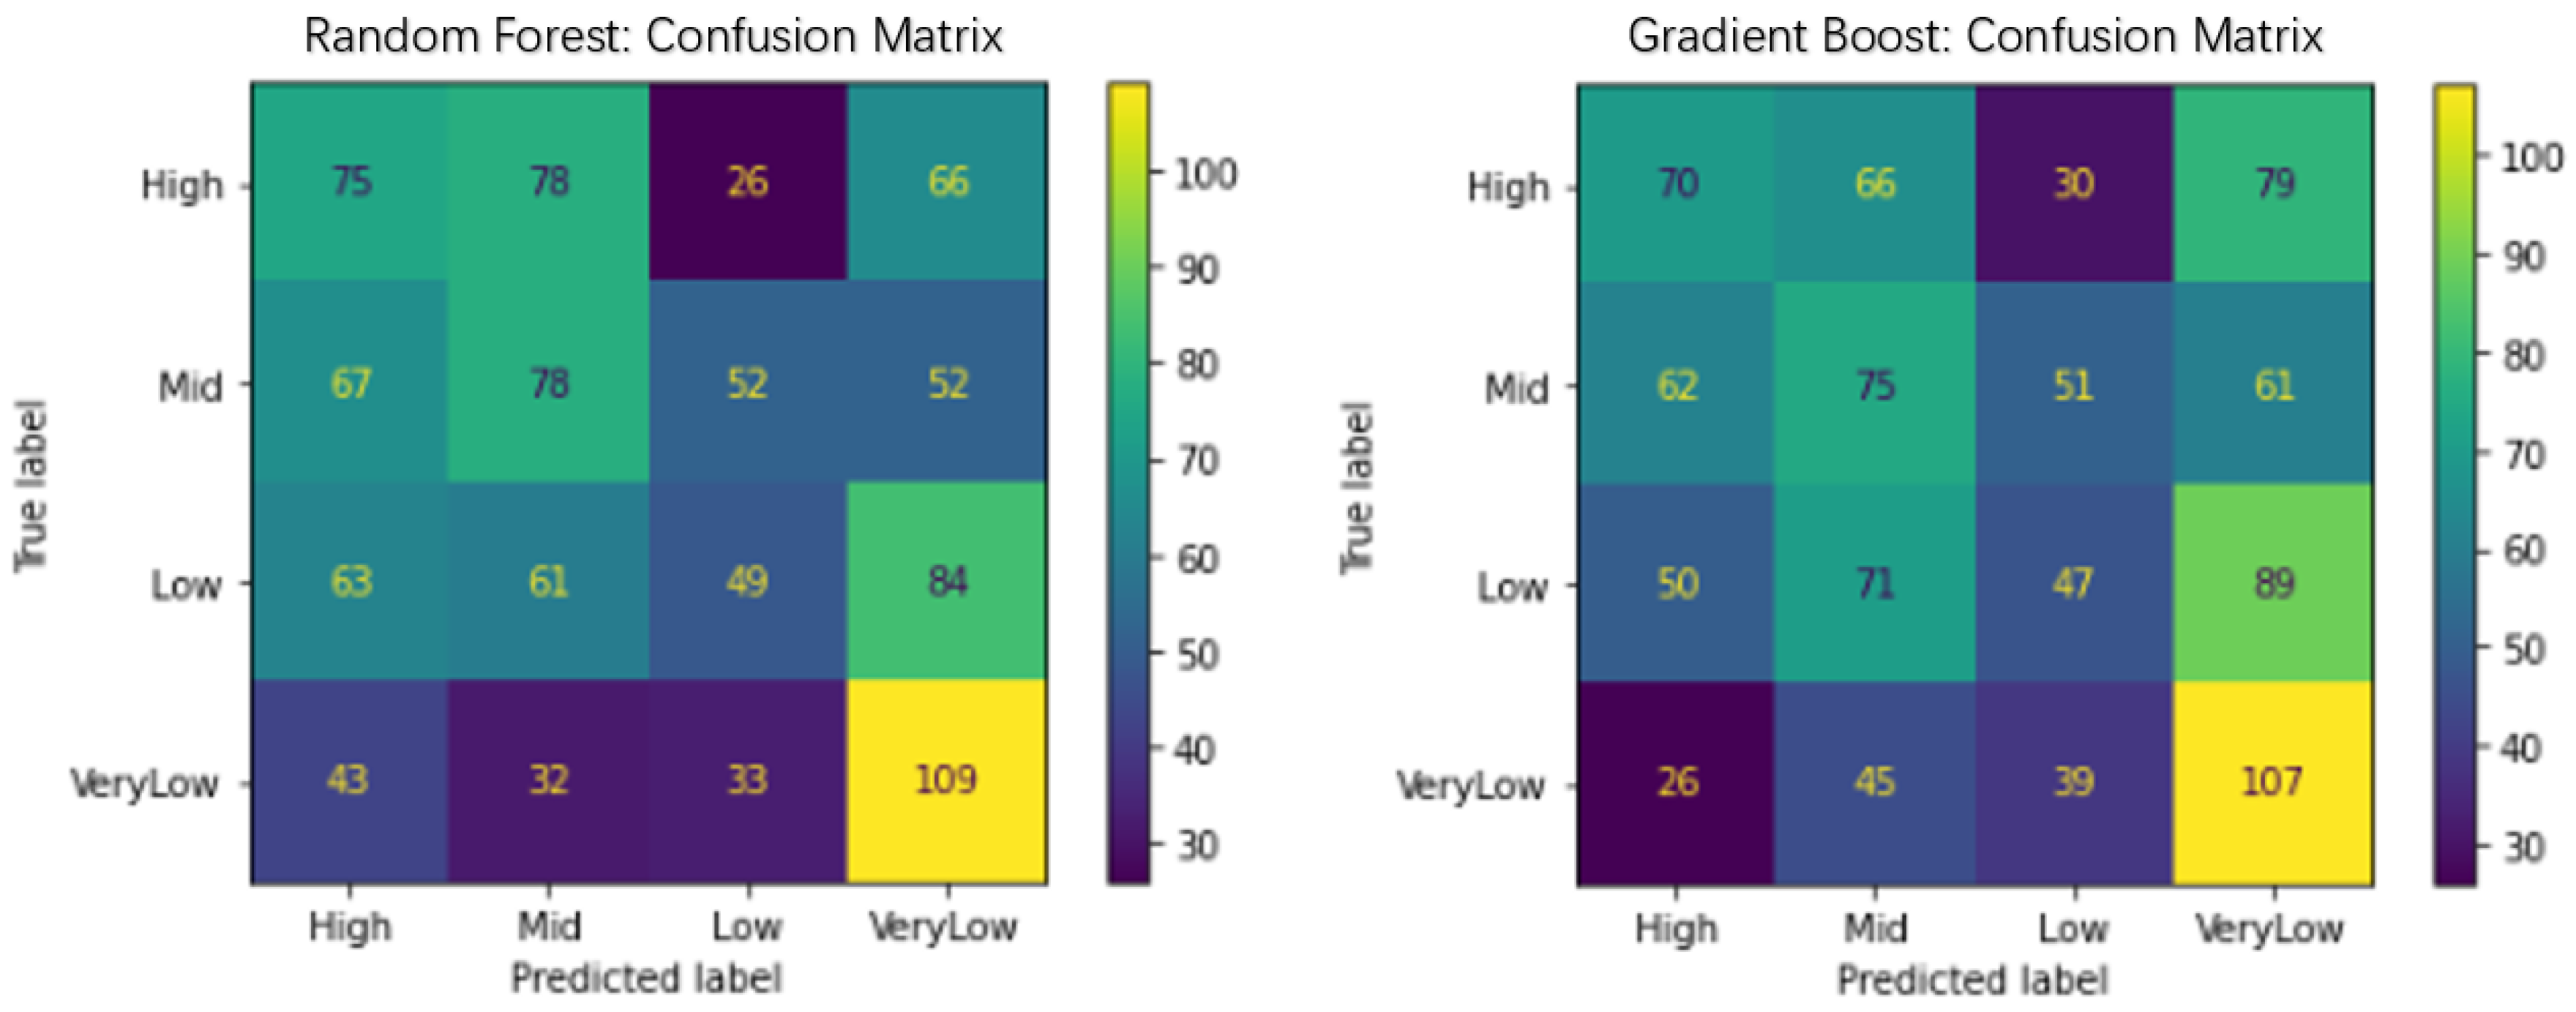
The confusion matrix (Figure 8) for Random Forest and Gradient Boosting models indicates an overall accuracy of approximately 32% and 30.89%, respectively. Random Forest demonstrates better predictive capability for the class VeryLow, suggesting a tendency for consistently underperforming movies. Both models achieved an HPR of 57.26% and 63.46%, respectively.
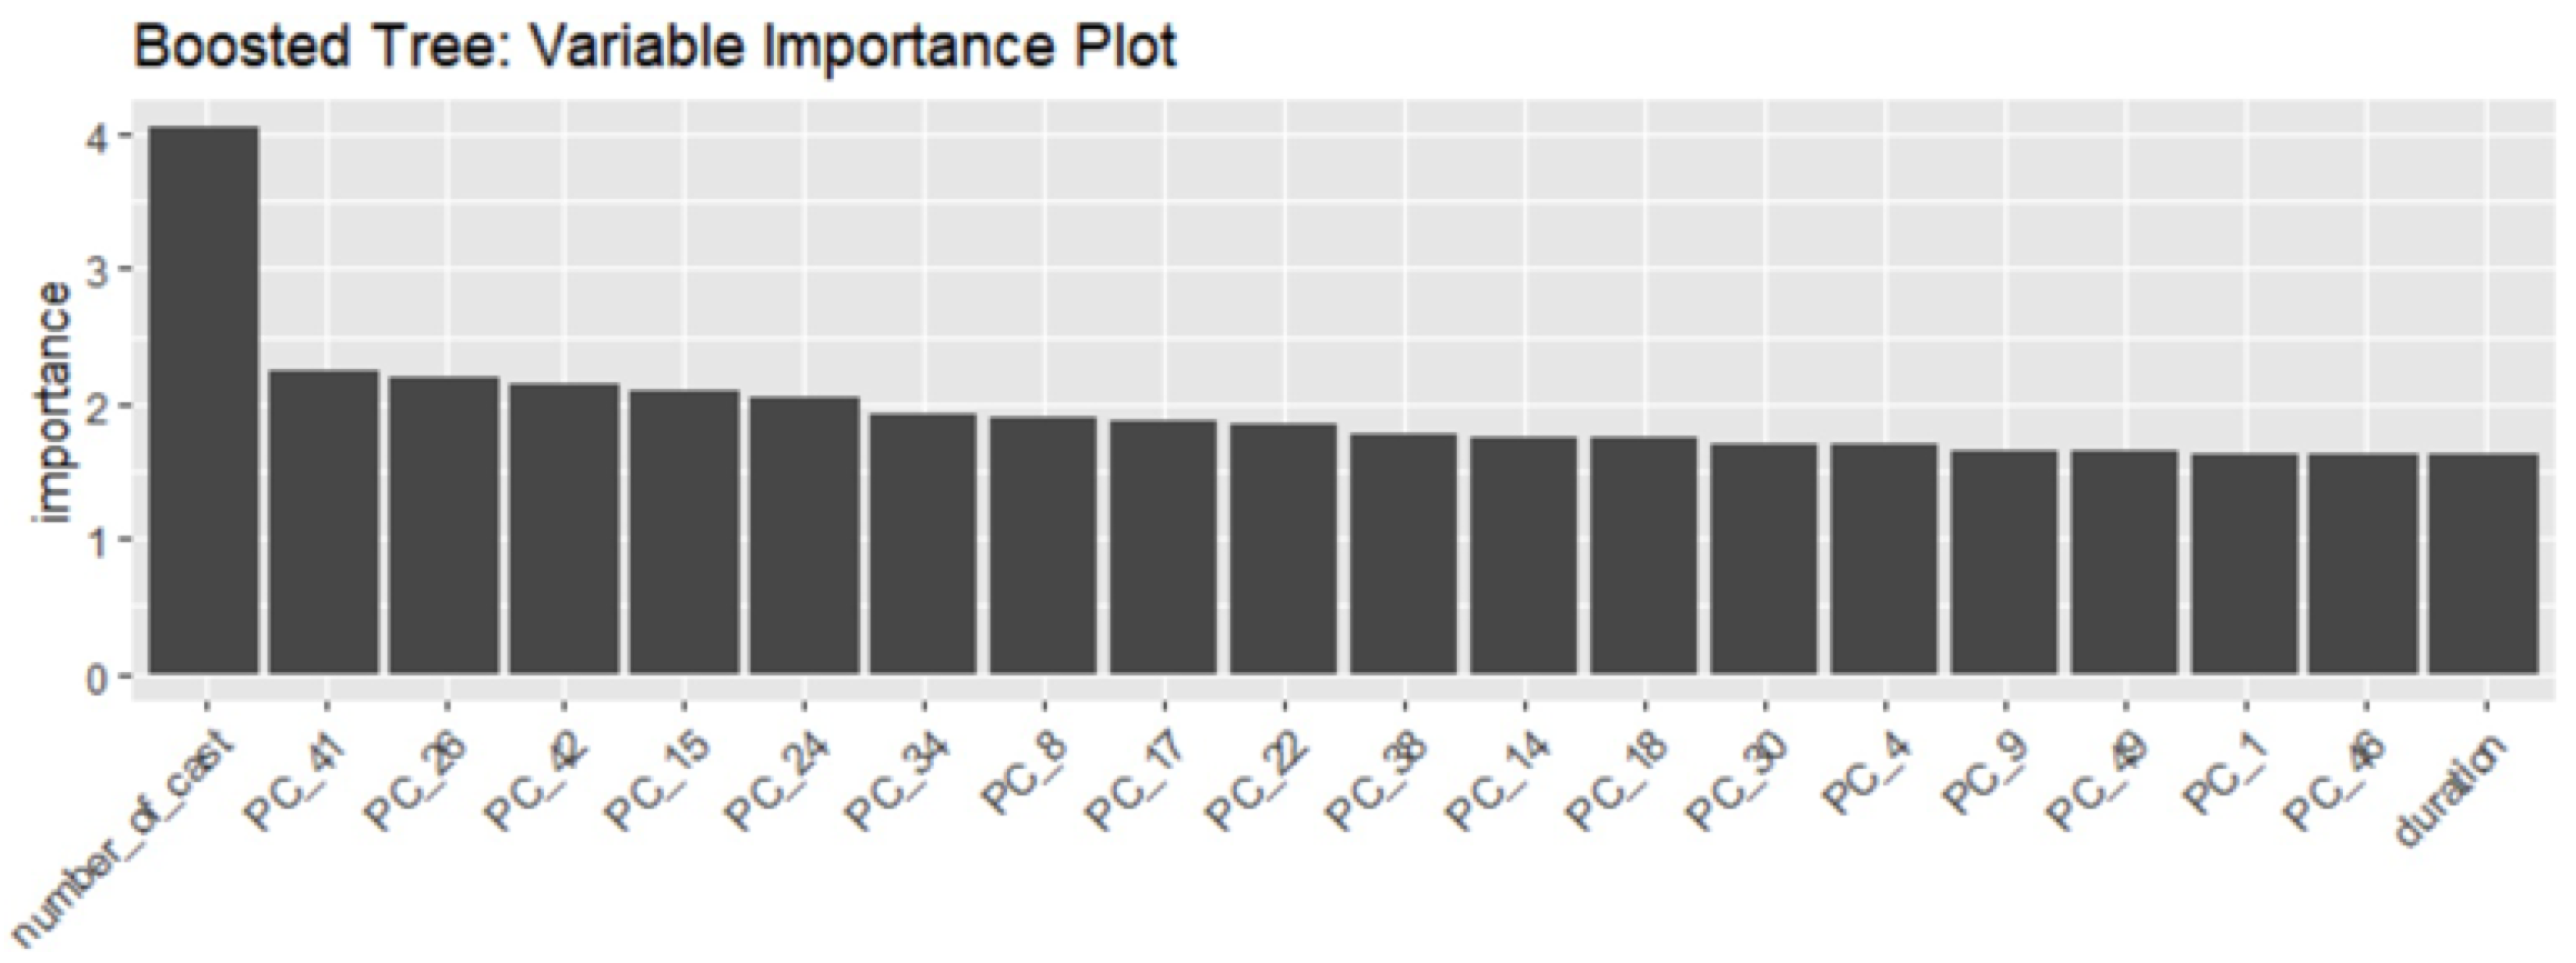
LightGBM (XGBoost), after parameter tuning through 10-fold cross-validation, demonstrated superior performance with an enhanced HPR of nearly 69% (Figure 7). Key predictors such as "number of cast" and selected "PCs" (principal components derived from movie taglines and overviews) retained their significance.

5.3. Comparison of Models

Table 3 summarizes the performance metrics across all models. Both total accuracy across all four ROI classes and HPR are reported. Notably, all models exhibit comparable total accuracy levels around one-third, which surpasses the baseline of random guessing (25% for our balanced dataset). In terms of HPR, LightGBM (XGBoost) outperforms other models with an impressive 68.98%, significantly exceeding the random guess baseline of 50%. This underscores the robust predictive capability of our model.
Furthermore, incorporating regularization or constraining model complexity consistently improved both accuracy and HPR, indicating the dataset’s susceptibility to overfitting. This observation validates the effectiveness of employing simple yet powerful techniques such as Lasso Regression for feature selection.

6. Conclusion

This project investigated the factors influencing movie ROI levels by leveraging various predictive modeling techniques based on pre-release movie information. Our evaluation primarily focused on the High Precision Rate (HPR), emphasizing accurate predictions of movies with high ROI potential. In addition to conventional numeric and categorical features, we employed text analysis techniques such as Latent Semantic Analysis (LSA) on movie taglines and overviews to extract key thematic elements as additional predictive features.
Among the models tested, LightGBM (XGBoost) achieved the highest HPR of 68.98%. This outcome underscores the importance of factors related to the scale of movie production, such as the number of cast members, and thematic topics extracted from movie overviews, in predicting movie ROI. These findings highlight crucial considerations for movie investors, suggesting that attention to production team dynamics and movie content is essential before committing investments.
In conclusion, our model offers valuable insights to guide investment decisions in the film industry, aiming to assist investors in making informed choices for maximizing ROI potential.

References

  1. Cao, J., Ku, D., Du, J., Ng, V., Wang, Y., and Dong, W. (2017). A structurally enhanced, ergonomically and human–computer interaction improved intelligent seat’s system. Designs, 1(2):11. [CrossRef]
  2. Chen, Z., Ge, J., Zhan, H., Huang, S., and Wang, D. (2021). Pareto self-supervised training for few-shot learning. In Proceedings of the IEEE/CVF Conference on Computer Vision and Pattern Recognition, pages 13663–13672.
  3. Dai, S., Li, K., Luo, Z., Zhao, P., Hong, B., Zhu, A., and Liu, J. (2024). Ai-based nlp section discusses the application and effect of bag-of-words models and tf-idf in nlp tasks. Journal of Artificial Intelligence General Science (JAIGS), 5(1):13–21.
  4. Elhedhli, S., Li, Z., and Bookbinder, J. H. (2017). Airfreight forwarding under system-wide and double discounts. EURO Journal on Transportation and Logistics, 6(2):165–183.
  5. Hong, B., Zhao, P., Liu, J., Zhu, A., Dai, S., and Li, K. (2024). The application of artificial intelligence technology in assembly techniques within the industrial sector. Journal of Artificial Intelligence General Science (JAIGS), 5(1):1–. [CrossRef]
  6. Huang, D., Liu, Z., and Li, Y. (2024). Research on tumors segmentation based on image enhancement method. arXiv preprint arXiv:2406.05170.
  7. Jiang, H., Qin, F., Cao, J., Peng, Y., and Shao, Y. (2021). Recurrent neural network from adder’s perspective: Carry-lookahead rnn. Neural Networks, 144:297–306.
  8. Jin, C., Peng, H., Zhao, S., Wang, Z., Xu, W., Han, L., Zhao, J., Zhong, K., Rajasekaran, S., and Metaxas, D. N. (2024). Apeer: Automatic prompt engineering enhances large language model reranking. arXiv preprint arXiv:2406.14449.
  9. Jin, C., Che, T., Peng, H., Li, Y., and Pavone, M. (2024). Learning from teaching regularization: Generalizable correlations should be easy to imitate. arXiv preprint arXiv:2402.02769.
  10. Lai, S., Feng, N., Sui, H., Ma, Z., Wang, H., Song, Z., Zhao, H., and Yue, Y. (2024). Fts: A framework to find a faithful timesieve. arXiv preprint arXiv:2405.19647.
  11. Li, K., Peng, X., Song, J., Hong, B., and Wang, J. (2024). The application of augmented reality (ar) in remote work and education. arXiv preprint arXiv:2404.10579.
  12. Li, K., Zhu, A., Zhou, W., Zhao, P., Song, J., and Liu, J. (2024). Utilizing deep learning to optimize software development processes. arXiv preprint arXiv:2404.13630.
  13. Li, S., Lin, R., and Pei, S. (2024). Multi-modal preference alignment remedies regression of visual instruction tuning on language model. arXiv preprint arXiv:2402.10884.
  14. Li, S., and Tajbakhsh, N. (2023). Scigraphqa: A large-scale synthetic multi-turn question-answering dataset for scientific graphs. arXiv preprint arXiv:2308.03349.
  15. Lin, Z., Wang, Z., Zhu, Y., Li, Z., and Qin, H. (2024). Text sentiment detection and classification based on integrated learning algorithm. Applied Science and Engineering Journal for Advanced Research, 3(3):27–33.
  16. Liu, H., Xie, R., Qin, H., and Li, Y. (2024). Research on dangerous flight weather prediction based on machine learning. arXiv preprint arXiv:2406.12298.
  17. Liu, S., Yan, K., Qin, F., Wang, C., Ge, R., Zhang, K., Huang, J., Peng, Y., and Cao, J. (2024). Infrared image super-resolution via lightweight information split network. arXiv preprint arXiv:2405.10561. [CrossRef]
  18. Ni, H., Meng, S., Geng, X., Li, P., Li, Z., Chen, X., Wang, X., and Zhang, S. (2024). Time series modeling for heart rate prediction: From arima to transformers. arXiv preprint arXiv:2406.12199.
  19. Peng, H., Ran, R., Luo, Y., Zhao, J., Huang, S., Thorat, K., Geng, T., Wang, C., Xu, X., Wen, W., et al. (2024). Lingcn: Structural linearized graph convolutional network for homomorphically encrypted inference. Advances in Neural Information Processing Systems, 36.
  20. Peng, H., Xie, X., Shivdikar, K., Hasan, M. A., Zhao, J., Huang, S., Khan, O., Kaeli, D., and Ding, C. (2024). Maxk-gnn: Extremely fast gpu kernel design for accelerating graph neural networks training. In Proceedings of the 29th ACM International Conference on Architectural Support for Programming Languages and Operating Systems, Volume 2, pages 683–698.
  21. Wang, H., Li, J., and Li, Z. (2024). Ai-generated text detection and classification based on bert deep learning algorithm. arXiv preprint arXiv:2405.16422.
  22. Wang, Y., Wang, C., Li, Z., Wang, Z., Liu, X., and Zhu, Y. (2024). Neural radiance fields convert 2d to 3d texture. Applied Science and Biotechnology Journal for Advanced Research, 3(3):40–44.
  23. Wang, Z., Zhu, Y., Li, Z., Wang, Z., Qin, H., and Liu, X. (2024). Graph neural network recommendation system for football formation. Applied Science and Biotechnology Journal for Advanced Research, 3(3):33–39.
  24. Xu, K., Wu, Y., Li, Z., Zhang, R., and Feng, Z. (2024). Investigating financial risk behavior prediction using deep learning and big data. International Journal of Innovative Research in Engineering and Management, 11(3):77–81.
  25. Yang, J., Qin, H., Por, L. Y., Shaikh, Z. A., Alfarraj, O., Tolba, A., Elghatwary, M., and Thwin, M. (2024). Optimizing diabetic retinopathy detection with inception-v4 and dynamic version of snow leopard optimization algorithm. Biomedical Signal Processing and Control, 96(A):106501.
  26. Zhang, W., Ma, Z., Wang, L., Fan, D., and Ho, Y.-Y. (2023). Genome-wide search algorithms for identifying dynamic gene co-expression via bayesian variable selection. Statistics in Medicine, 42(30):5616–5629. [CrossRef]
  27. Zhao, P., Li, K., Hong, B., Zhu, A., Liu, J., and Dai, S. (2024). Task allocation planning based on hierarchical task network for national economic mobilization. Journal of Artificial Intelligence General Science (JAIGS), 5(1):22–31.
  28. Zhong, Y., Liu, Y., Gao, E., Wei, C., Wang, Z., and Yan, C. (2024). Deep learning solutions for pneumonia detection: Performance comparison of custom and transfer learning models. medRxiv.
  29. Zhou, Q. (2024a). Application of black-litterman bayesian in statistical arbitrage. arXiv preprint arXiv:2406.06706.
  30. Zhou, Q. (2024b). Portfolio optimization with robust covariance and conditional value-at-risk constraints. arXiv preprint arXiv:2406.00610.
  31. Zhu, A., Li, K., Wu, T., Zhao, P., Zhou, W., and Hong, B. (2024). Cross-task multi-branch vision transformer for facial expression and mask wearing classification. arXiv preprint arXiv:2404.14606.
  32. Wang, C., Yang, Y., Li, R., Sun, D., Cai, R., Zhang, Y., Fu, C., and Floyd, L. (2024). Adapting llms for efficient context processing through soft prompt compression. arXiv preprint arXiv:2404.04997.
  33. Liu, H., Wang, C., Zhan, X., Zheng, H., and Che, C. (2024). Enhancing 3D Object Detection by Using Neural Network with Self-adaptive Thresholding. arXiv preprint arXiv:2405.07479. [CrossRef]
1
Figure 1. Word Cloud of Key Words (Left) and ROI Outliers (Right).
Preprints 112166 g001
Figure 2. Distribution of Numeric Variables.
Preprints 112166 g002
Figure 3. Correlation among Variables.
Preprints 112166 g003
Figure 4. Confusion Matrix and Feature Importance of Lasso Regression.
Preprints 112166 g004
Figure 5. Feature Importance of Gradient Boosting.
Preprints 112166 g005
Figure 6. Feature Importance of Random Forest.
Preprints 112166 g006
Figure 7. Confusion Matrix and Feature Importance of LightGBM.
Preprints 112166 g007
Figure 8. Confusion Matrix of Random Forest and Gradient Boost.
Preprints 112166 g008
Table 1. Missing Values.
Variables Total Percent
homepage 3091 0.643556
companies_3 2479 0.516136
companies_2 1417 0.295024
tagline 844 0.175724
plot_keywords 412 0.085780
companies_1 351 0.073079
actor_3_name 63 0.013117
actor_2_name 53 0.011035
Table 2. Independent and Dependent Variables for Classification.
Dependent ROI Levels (categorical): divided by quartiles, {’very low’, ’low’, ’mid’, ’high’}
Independent Basic Information (numerical): duration, number of casts, etc
Production Company (dummy): top 10 most frequent companies
Actor (dummy): top 100 most frequent actors
Director (dummy): top 18 most frequent directors
PC (numerical): 50 scores of the corresponding PCs derived from LSA
Table 3. Model Performance Comparison.
Models Total Accuracy HPR
Logistic Regression 33.68% 62.98%
Lasso Logistic Regression 34.61% 65.10%
Random Forest 32.13% 57.26%
Gradient Boost 30.89% 63.46%
LightGBM (XGBoost) 34.10% 68.98%
Disclaimer/Publisher’s Note: The statements, opinions and data contained in all publications are solely those of the individual author(s) and contributor(s) and not of MDPI and/or the editor(s). MDPI and/or the editor(s) disclaim responsibility for any injury to people or property resulting from any ideas, methods, instructions or products referred to in the content.
Copyright: This open access article is published under a Creative Commons CC BY 4.0 license, which permit the free download, distribution, and reuse, provided that the author and preprint are cited in any reuse.
Prerpints.org logo

Preprints.org is a free preprint server supported by MDPI in Basel, Switzerland.

Subscribe

© 2024 MDPI (Basel, Switzerland) unless otherwise stated