1. Introduction1
Remediation of acid mine drainage (AMD) poses significant challenges for the mining sector and environmental professionals worldwide, attributed to its severe impacts and variable site characteristics (Ackil and Koldas 2006; Humphries et al. 2017). AMD originates from the oxidation of pyrite (FeS2) when water interacts with metals and coal in mining operations, which results in the production of sulfuric acid, hydrogen ions, and mobilized metals (Ackil and Koldas 2006; Peterson et al. 2016). Water affected by AMD typically exhibits low pH levels and elevated concentrations of harmful elements and metals such as aluminum (Al), iron (Fe), manganese (Mn), and sulfate (SO42-) (Peterson et al. 2016). Such contamination may spread to nearby aquatic systems, consequently degrading soil and plant life and presenting substantial risks to public health and safety when the contaminated water is used for consumption (Hobbs et al. 2008). The impact of AMD on water quality extends to both proximal and distant ecosystems, with the potential for water resource contamination lingering for decades post-mining operations (Mdlalose 2019; Munnik et al. 2010).
The treatment of AMD water typically focuses on elevating the pH through neutralization and is divided into two fundamental approaches: active and passive treatment systems (Ackil and Koldas 2006; Rambabu et al. 2020). Active treatment strategies involve the deliberate addition of chemical alkaline agents to promote metal precipitation, whereas passive treatments harness natural processes—including physical, chemical, biological, and geological methods—to alleviate acidity (Ford, 2003; Gazea, 1996; Simate and Ndlovu, 2014; Zipper and Skousen, 2014). Among these, passive treatment systems are lauded for their environmental compatibility and their added ecological advantages, positioning them as essential elements of sustainable environmental practices (Daraz et al., 2022; Kalin, 2004; Rambabu et al., 2020).
Since the 1970s, natural and constructed wetlands have been effectively employed as passive treatment systems for AMD water, capitalizing on their natural capacity to buffer, filter, and cleanse polluted water (Batty, 1999; MacFarlane et al., 2016). The complex interaction among the biotic and abiotic components in wetlands—including soil, water dynamics, and organisms—creates ecosystems that are both biodiverse and nutrient-rich (Jackson et al., 2014; Vymazal, 2011). These components act as reservoirs for particles and pollutants, accumulating in the bottom sediment as water flows through the system (Sobolewski, 1999). Wetlands facilitate several processes, such as flocculation, sedimentation, sorption, ion exchange, precipitation, oxidation, reduction, plant absorption, and microbial metabolism. These mechanisms play a crucial role in the sequestration and transformation of metals from AMD, rendering these ecosystems highly effective in managing and remediating emerging pollutants (Matagi et al., 1998; Sheoran and Sheoran, 2006). Nonetheless, it is essential to thoroughly assess the resilience of natural wetlands against the severe conditions induced by AMD to maintain their ecological integrity (De Klerk et al., 2016).
Ecosystem restoration involves reverting degraded ecosystems to conditions that resemble their original natural states, incorporating strategies such as wetland restoration, regeneration and rehabilitation (Grenfell et al., 2007; MacFarlane et al., 2016). Within the realm of environmental management, ecological engineering is pivotal to these restoration and even regeneration efforts (Mander and Mitsch, 2011). Adopting a holistic and non-linear perspective, ecological engineering applies engineering solutions to environmental challenges in a sustainable manner (Mitsch, 2012; Odum and Odum, 2003). A key concept in this field is ecosystem self-design, which allows ecosystems to self-regulate and adapt through strategic interventions to optimize their functionality (Mitsch, 2012; Odum and Odum, 2003). This method promotes sustainable coexistence between human activities, such as mining, and natural settings, including wetlands (Mander and Mitsch, 2011). While ecological engineering principles, especially those applied to wetlands treating AMD have been explored in previous research, their full potential and mechanisms remain incompletely understood (Garcia et al., 2011; Mitsch, 2012; Mitsch et al., 2002).
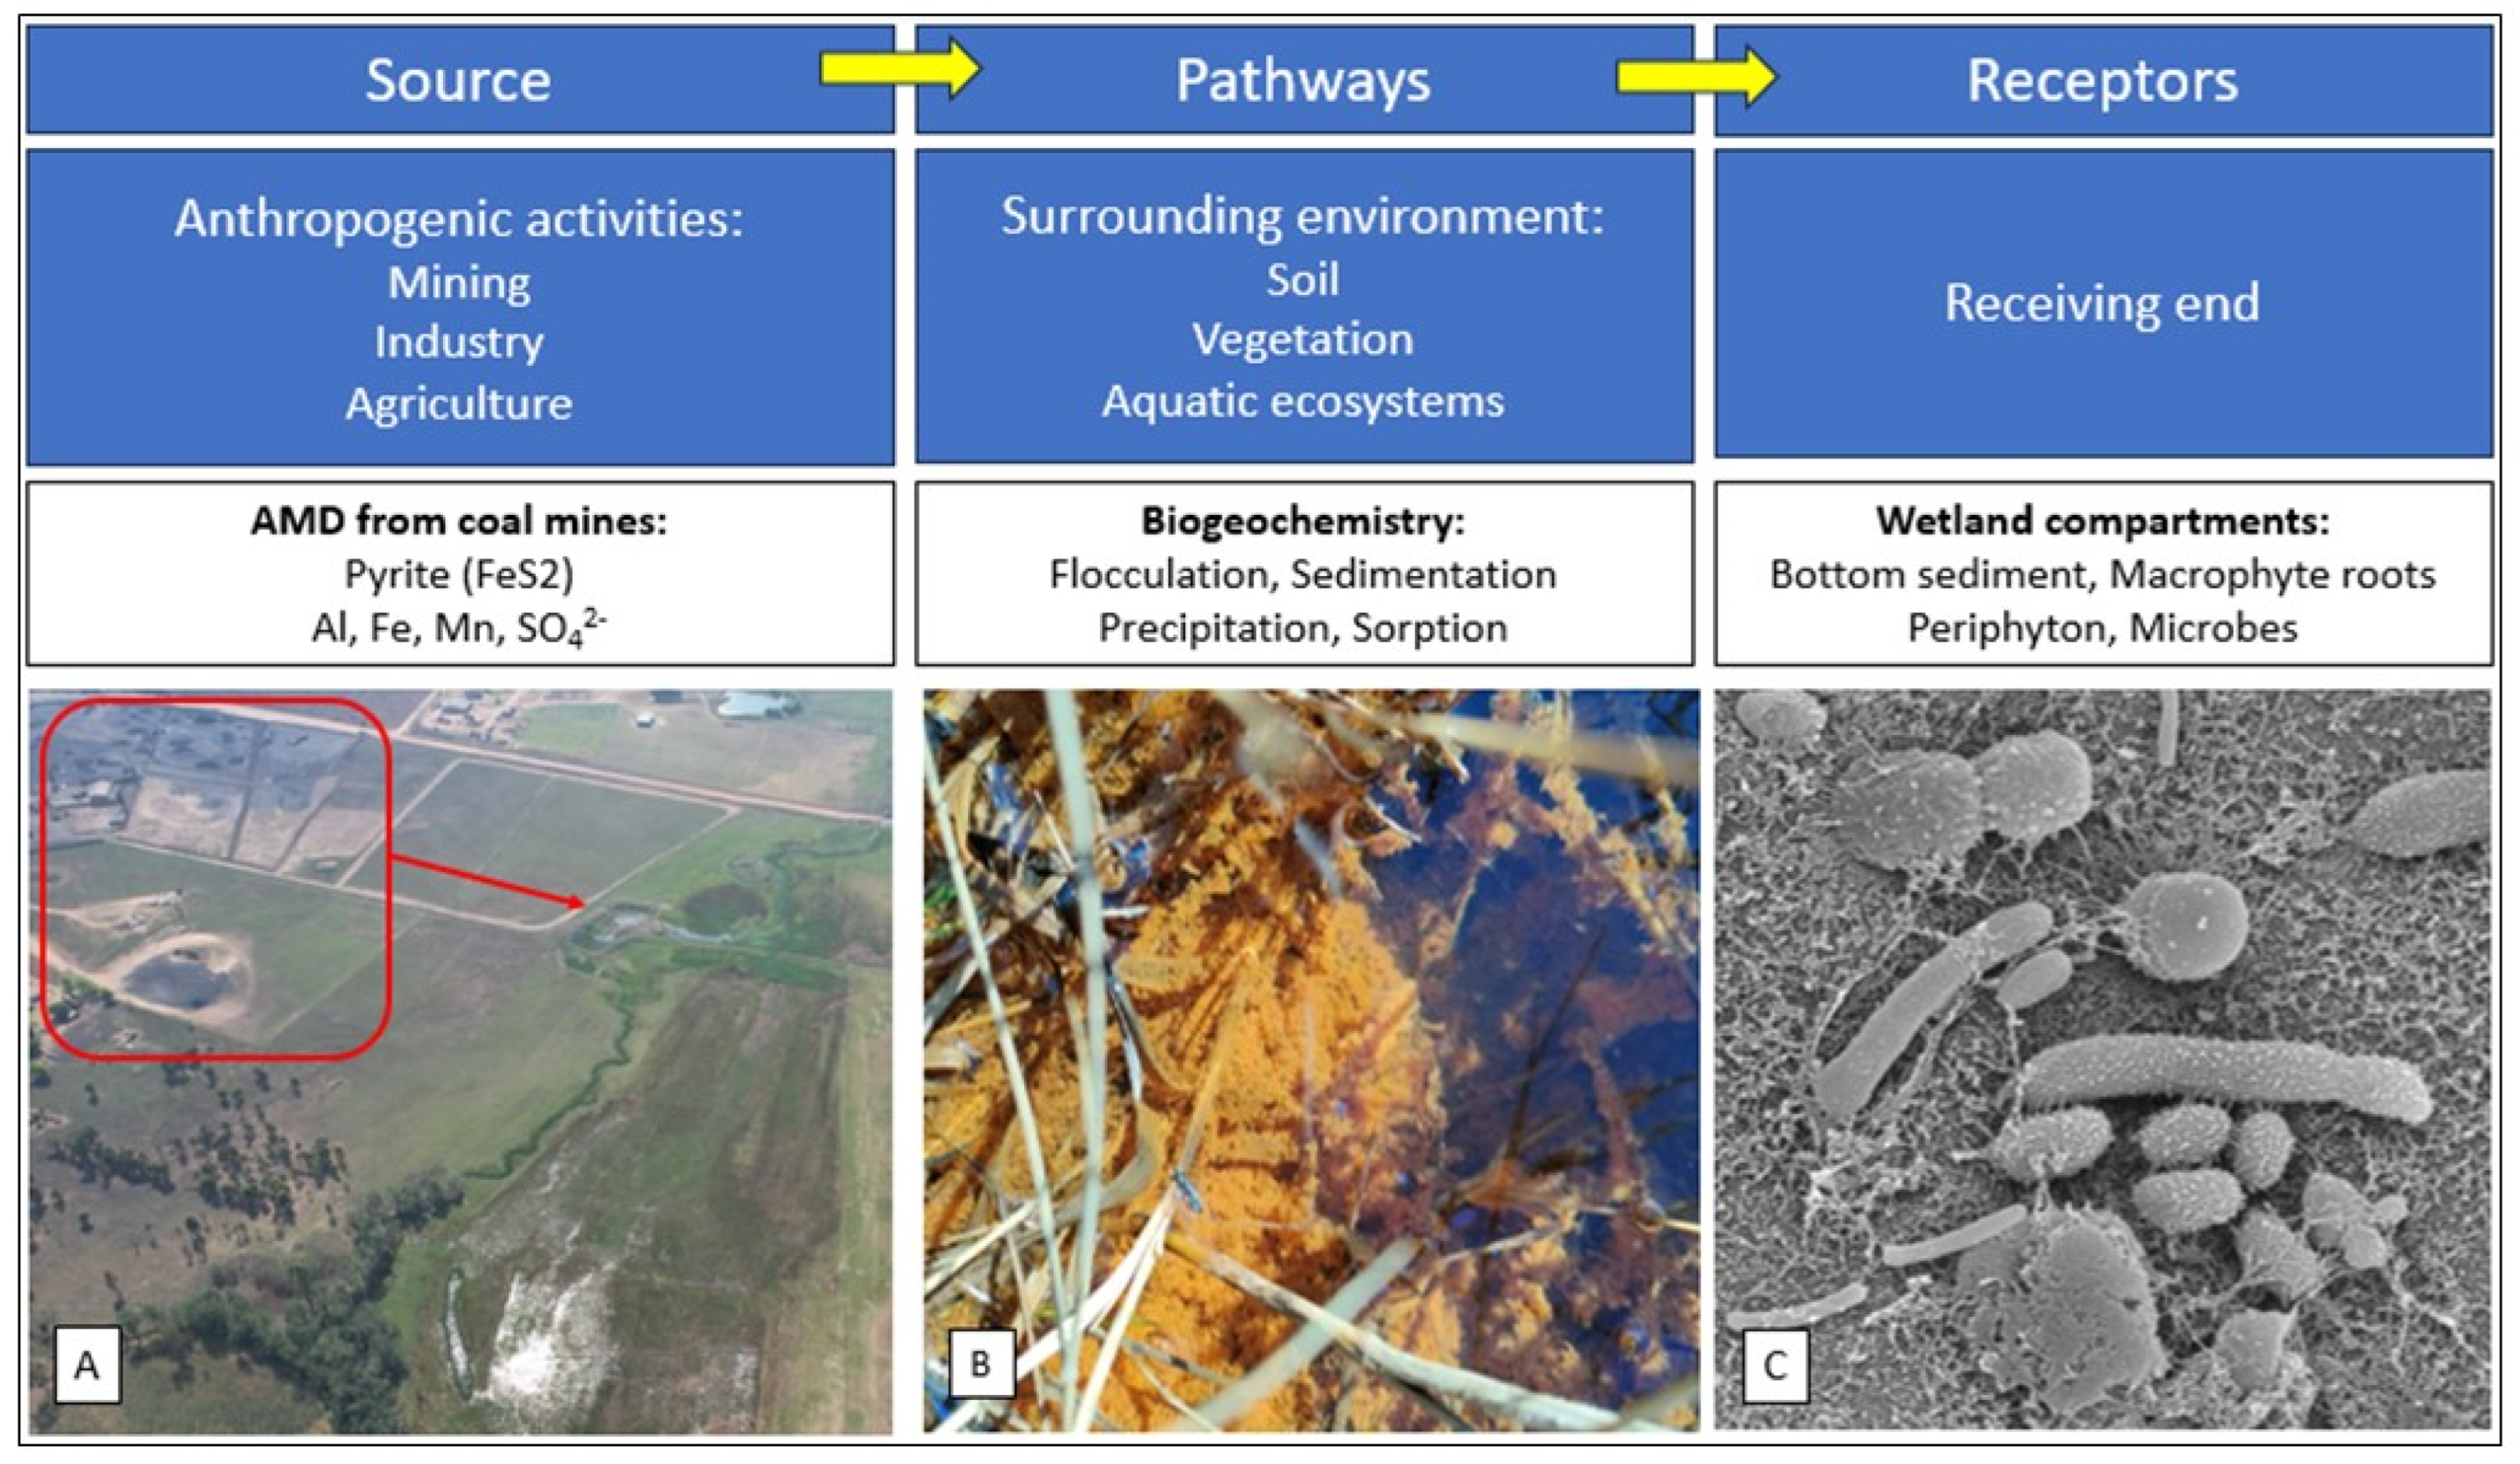
Moreover, there is a pressing need for comprehensive studies on ecologically engineered wetlands that consider the entire ecosystem in their approach (Mitsch et al., 2002).The Zaalklapspruit wetland in South Africa, a valley-bottom wetland severely impacted by AMD from an abandoned upstream coal mine, has demonstrated improved surface water quality following the implementation of ecologically engineered structures (De Klerk et al., 2016, Madlada et al., 2021). The concrete structures were designed to decrease surface water flow rates, increasing the residence time of contaminated water within the wetland. Although influent−effluent comparisons indicated noticeable improvements in water quality parameters, a deeper understanding of wetland dynamics necessitates investigation into the sources, pathways, and receptors of metals and sulphur compounds. This approach is essential for developing appropriate remediation designs and management strategies, ensuring the effectiveness of ecologically engineered wetland treatment as shown in
Figure 1 (Belle et al., 2023). An integrated source−pathway−receptor approach to wetland-based treatment systems is crucial for effectively designing, implementing, and managing ecologically engineered ecosystems.
Considering the pivotal role of mining in South Africa’s economy, environmental degradation is an almost inevitable consequence (De Klerk et al., 2016). The imperative to restore equilibrium between resource utilization and its exploitation is critical. While ecological engineering has been under study since the 1960s, there remains a significant gap in the research concerning the efficacy and sustainability of wetland ecosystems engineered to mitigate the negative impacts of AMD. This research aims to delve into the dynamics within an ecologically engineered wetland affected by AMD, with several key objectives: 1) To evaluate the water quality improvement capabilities of the wetland; 2) To investigate the physical and chemical properties of the wetland’s bottom sediment; 3) To examine the metal adsorption and absorption capacities of macrophyte roots and periphyton; 4) To explore the microbiological diversity within the sediment; and 5) To identify the sources, pathways, and receptors of metals and sulfur compounds in the wetland.
3. Results and Discussion
3.1. Surface Water Quality
Table 2 summarizes the chemical properties of the surface water in the ecologically engineered wetland, highlighting significant improvements in water quality parameters from Site 1 (S1) to Site 3 (S3). The pH of the surface water, initially acidic at the inflow (3.9), rose to a neutral level (7.18) by the time it reached S3, indicating a more hospitable environment for aquatic organisms. Alkalinity also substantially increased, from 22 mg/L CaCO
3 at S1 to 143 mg/L CaCO
3 at S3, demonstrating a strengthened buffering capacity in the water. While EC and TDS remained fairly constant between S1 and S2, a slight decrease of around 15% was noted from S2 to S3. According to the Department of Water Affairs and Forestry (1996), a change greater than 15% in TDS concentrations is deemed significant in aquatic ecosystems.
The dissolved organic carbon (DOC) showed a significant rise from S2 to S3, increasing by 208.88%, which indicates a higher organic load in the surface water. The concentrations of metals typically associated with AMD—Al, Fe, and Mn—followed distinct trends: for Al and Fe, the pattern was S2 > S1 > S3, while for Mn, the pattern was S3 > S2 > S1. Specifically, Al and Fe levels decreased from S1 to S3, whereas Mn levels saw a substantial increase of 243.52% from S1 to S3, exceeding the South African Target Water Quality Range for aquatic ecosystems (Department of Water Affairs and Forestry, 1996). Additionally, sulfate (SO42-) concentrations dropped by about 40% from S1 to S3 of the wetland.
A previous investigation by De Klerk et al. (2016) evaluated the effects of ecological infrastructure on the Zaalklapspruit wetland, focusing on water quality before and after ecological engineering interventions. Their findings showed a marked improvement in surface water quality, with downstream water pH increasing from 5.3 to 7.6. Al and Fe concentrations significantly decreased from 0.89 to less than 0.01 mg/L and from 0.29 to less than 0.01 mg/L, respectively. Similar trends in Al and Fe concentrations between upstream and downstream areas post-intervention were observed in the current study. However, De Klerk et al. (2016) reported a 96% reduction in Mn levels, whereas the current study found an increase in Mn concentrations from the inflow to the outflow. Despite this discrepancy, the results from both studies highlight the beneficial impact of ecological infrastructure on improving water quality within the wetland.
Similarly, the current study’s comparison of surface water quality between the S1 and S3 sites indicates an overall enhancement in water quality, as evidenced by improvements in pH, EC, and reductions in Al, Fe, and SO4 levels. The most notable changes were observed between S2 and S3. These findings underscore the effective treatment capabilities of natural wetlands and highlight the beneficial impact of ecologically engineered infrastructure on enhancing the health and function of wetland ecosystems.
3.2. Bottom Sediment Characterisation
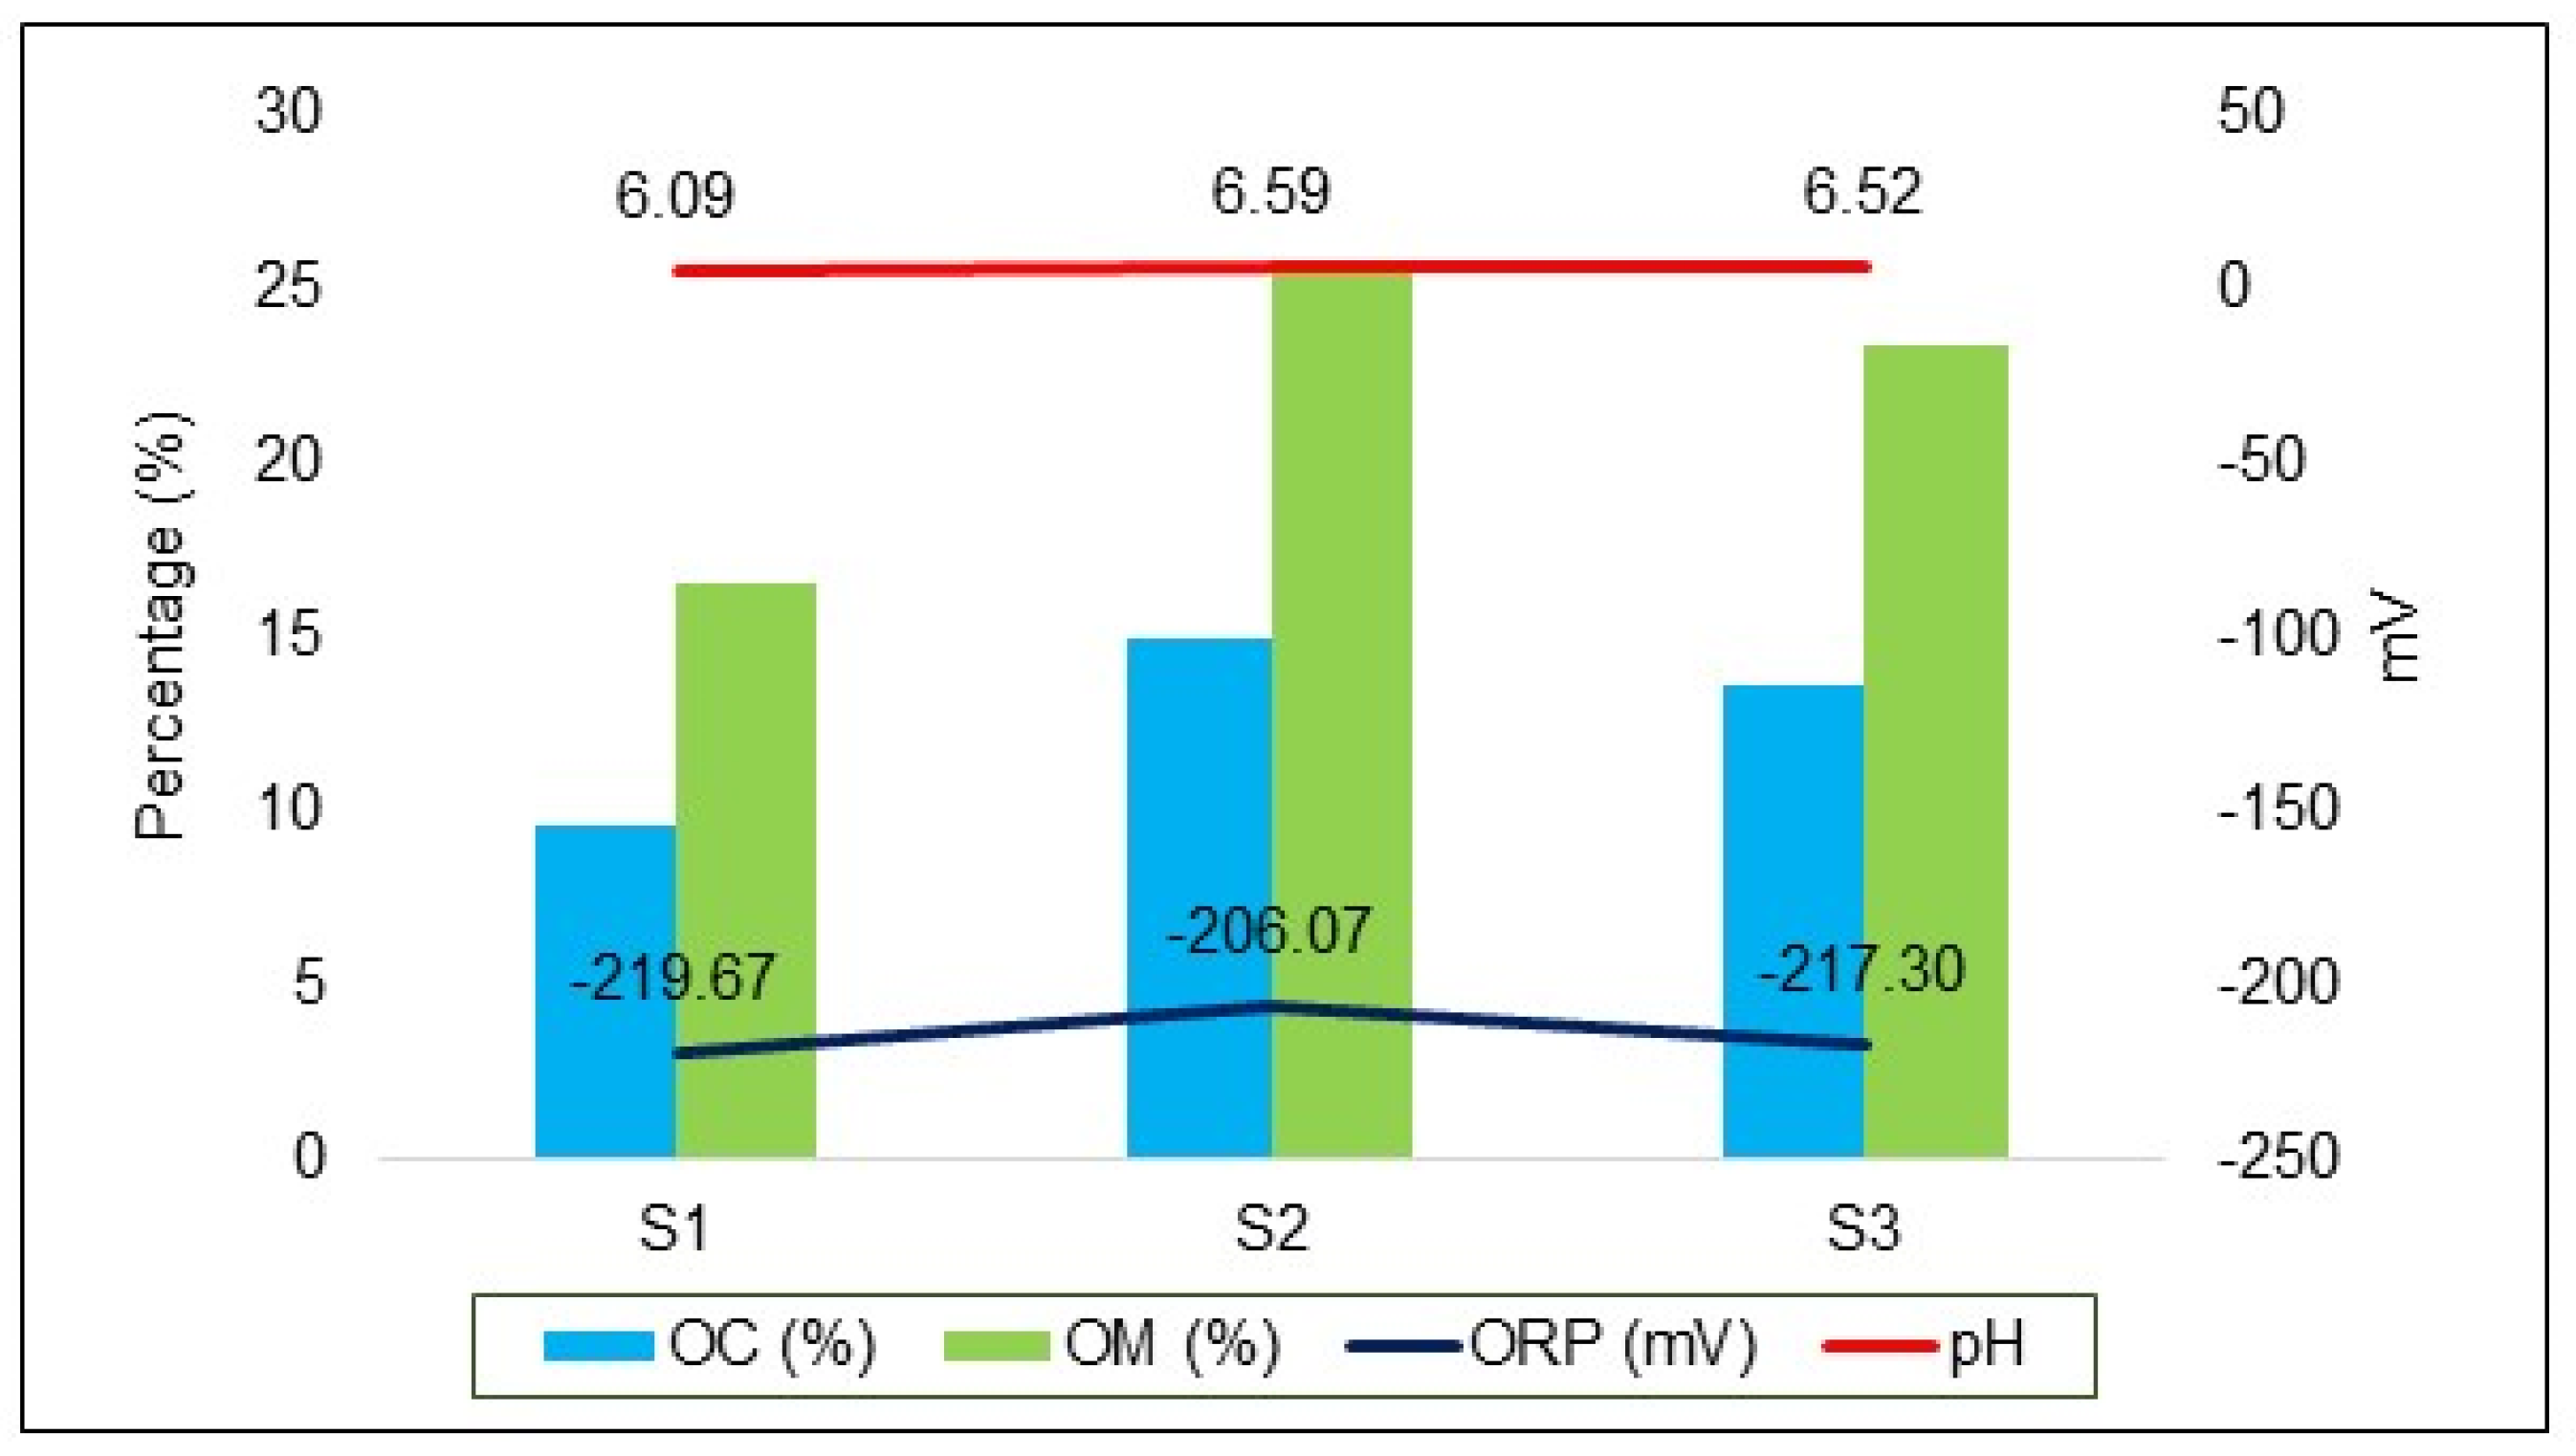
In situ pH and ORP measurements in the bottom sediment exhibited a consistent pattern across the sampling sites. The pH values were 6.09 at S1, 6.59 at S2, and 6.52 at S3. Corresponding ORP values were −219.67 mV at S1, −206.07 mV at S2, and −217.30 mV at S3. The analysis also highlighted a significant presence of OM in the bottom sediment, with notably high concentrations at S2 (25.74%) and S3 (23.43%). These findings suggest a rich organic environment conducive to various biogeochemical processes critical for wetland function and AMD remediation.
The elemental composition of bottom sediment samples from each site was determined using XRF analysis and was found to be relatively consistent across the wetland. The weight percentages (% w/w) of key elements such as Al, Fe, Mn, and S in their oxidized forms are detailed in
Table 3. A uniform pattern was observed at all three sites, following the sequence: Al
2O
3 > Fe
2O
3 > SO
3 > MnO. This stability in elemental composition highlights the uniform distribution of these elements within the wetland’s sediment, which is essential for understanding the sediment’s role in the overall ecosystem function and its capacity to treat AMD.
The Student’s t-test was used to compare the means of bottom sediment characteristics between S1 and S3 of the wetland, as detailed in
Table 3. Given the substantial distance between S1 and S3, ample time and space are provided for biogeochemical reactions to occur, potentially leading to significant changes in the sediment composition. However, the analysis showed no statistically significant differences (p > 0.05) between S1 and S3 in terms of pH, ORP, organic matter percentage (OM%), and elemental composition. In contrast, sediment texture analysis revealed a significant difference (p < 0.05) between these sites.
As particles enter the wetland, they undergo aggregation, flocculation, and sedimentation, settling into the bottom soil (Jackson et al., 2014). This sedimentation process ensures continuous interaction between surface water particles and the wetland bottom sediment (Matagi et al., 1998). Ultimately, water and soil particles combine and settle to form the bottom sediment layer (Sheoran and Sheoran, 2006). Characterizing the bottom sediment is crucial for understanding the functioning of natural wetlands and the dynamics of pollutants, which is fundamental for effective wetland management and restoration (Cai et al., 2021; Kalita et al., 2019).
In previous studies on constructed wetlands designed to treat mine and industrial effluent, sediment pH and ORP measurements ranged from 6.4 to 7.1 and 384 to −261 mV, respectively. These findings are consistent with the current study’s results (Knox et al., 2006; O’Sullivan et al., 1999). Wetland bottom sediment is often characterized by high organic matter content, as observed at S2 and S3 in this study (Jackson et al., 2014). This high organic matter content is due to the balance between carbon fixation and loss, which occurs at different rates under anaerobic conditions in saturated soils. Carbon fixation typically exceeds decomposition, leading to the accumulation of carbon and organic matter (Jackson et al., 2014; Leenheer and Croué, 2003).
In a study by Xu et al. (2019), the effects of plant litter decomposition on wetland sediment were examined. Their research demonstrated that litter decomposition leads to changes in OM, pH, EC, ORP, and the bioavailability of metals in both the sediment and the surrounding water.
Figure 4 in the current study illustrates the relationship between OM%, pH, and ORP. The highest percentages of OM were observed at S2 and S3, which also showed the highest ORP and pH values. This correlation suggests a significant impact of organic matter on the chemical properties of the wetland sediment.
Another critical indicator of soil’s physical, chemical, and biological properties, and consequently the biogeochemical reactions within wetland bottom sediment, is soil particle size distribution (Palihakkara and Vitharana, 2019). Sasaki et al. (2001) found a predominance of clay in the bottom sediment, especially concentrated downstream in a wetland affected by AMD. Contrarily, the present study observed an increase in sand content at downstream sites (
Figure 5). De Klerk et al. (2016) documented sediment textures in an ecologically engineered wetland, primarily composed of sand particles. However, in the current study, clay particles constituted 46.29%, 45.25%, and 27.19% of the sediment textures at S1, S2, and S3, respectively (
Table 3). The differences in particle size distribution among these studies could be attributed to variations in surface water velocity at different points within the wetland (Jackson et al., 2014).
Clay minerals are essential for cation-anion exchange and pH buffering, contributing to the relatively stable pH values observed in the bottom sediments at each site, regardless of surface water pH (Sasaki et al., 2001). Additionally, clay particles’ large surface area and cation-anion exchange capacity enhance soil reactivity and facilitate interactions with OM (Jackson et al., 2014). However, in this study, the relationship between OM% and clay content showed an inverse trend. S1 had the highest clay content but the lowest OM%. This discrepancy could be due to the higher water flow rate at the inflow site (S1), resulting in a shorter residence time and consequently transporting OM further into the wetland, towards the middle (S2 and S3).
Water pollutants have a strong affinity for organic materials, leading to the accumulation of metals and sulfur compounds within the bottom sediment layers of wetlands affected by AMD (Lin and Chen, 1998; Sobolewski, 1999). In this study, oxidized forms of Al, Fe, Mn and S were detected in the bottom sediment, with aluminum oxide (Al2O3) being the most prevalent, followed by iron oxide (Fe2O3). Research on sedimentary metals and sulfur in natural wetlands exposed to AMD has shown a predominance of oxides of Al, Fe, and Mn, especially in oxic sediments, with a decrease in these oxides in the anoxic zones (Engin et al., 2015; Sasaki et al., 2001; Tarutis et al., 1992).
Tarutis et al. (1992) noted that the accumulation, distribution, and oxidative status of metals and sulfur in wetland sediments are influenced by the availability of oxygen (redox profile) in various sedimentary layers (e.g., 0–5 cm, 2.5–7.5 cm, and >7.5 cm). They also found a positive correlation between OM and these elements. Mays and Edwards (2001) observed a similar pattern in their inlet-outlet study of a natural wetland receiving AMD, where OM% increased from the inlet to the outlet (10%–25.4%), and metal accumulation increased for Fe (212–255 µg/g) and Mn (1.6–4.2 µg/g) but not for Al (1.21–1.05 µg/g). In the current study, the highest concentrations of Fe and Al in bottom sediments were recorded at S2, where OM was most abundant, consistent with findings from other studies.
The relationship between OM and ORP is critical in wetlands. Scholz and Lee (2005) explained that OM acts as the terminal electron acceptor under highly reduced redox potentials. The pH, ORP, texture, and OM% in bottom sediments may also be influenced by emergent vegetation and microbiological activities, and vice versa. This interconnected and complex nature of biogeochemical reactions within the bottom sediment cannot be fully understood in isolation (Fang et al., 2021).
3.3. Macrophyte Sorption Abilities
Typha capensis, a macrophyte species, was collected from each site to analyze its ability to adsorb and absorb Al, Fe and Mn. The results from the inductively coupled plasma optical emission spectroscopy (ICP-OES) are summarized in
Table 4, highlighting distinct patterns of metal sorption. For adsorption, the concentration order was Al (S1 > S2 > S3), Fe (S2 > S3 > S1), and Mn (S2 > S3 > S1). In terms of absorption, the concentration order was Al (S1 > S3 > S2), Fe (S2 > S3 > S1), and Mn (S3 > S2 > S1). These findings demonstrate the varying capabilities of
T. capensis to uptake different metals across the sampling sites.
The Student’s t-test was utilized to compare the metal adsorption and absorption capabilities of Typha capensis between the inflow (S1) and the far middle (S3) of the wetland. The results revealed a significant difference (p < 0.05) in the adsorption of Al and Mn between S1 and S3. Specifically, Al was adsorbed in higher quantities at S1, whereas Mn showed greater adsorption at S3. However, the adsorption of Fe remained relatively consistent between S1 and S3 (p > 0.05). In terms of absorption, significant differences were observed for all metals analyzed. Al was absorbed more at S1, while Fe and Mn were predominantly absorbed at S3. This indicates that the adsorption and absorption of Al by T. capensis primarily occurred at S1, whereas Fe and Mn were mainly adsorbed and absorbed at S3.
Wetland bottom sediment provides an optimal growth environment for T. capensis, with its roots playing a crucial role in rhizospheric processes that alter metals and sulfur compounds in AMD-impacted wetlands (Batty, 1999). The rhizosphere, the soil-root interface, involves complex physical, chemical, and biological interactions (McNear, 2013).
Sorption, which includes both adsorption and absorption, is vital for metal removal in wetlands (Michalak et al., 2013; Sheoran and Sheoran, 2006). Adsorption involves the physical adhesion of substances to a solid surface, while absorption entails the incorporation of substances from one state to another (Michalak et al., 2013). In macrophyte roots, adsorption involves ions and molecules binding to the root epidermis surface, precipitating metals (Matagi et al., 1998; Michalak et al., 2013).
Metal precipitation appears as coatings in various colors, such as orange to brown for Fe oxides or dark brown for Mn oxides, indicating adsorption on the root surface (Batty, 1999). This process, known as metal plaque formation, depends on the solubility of Fe and Mn and the oxidizing conditions facilitated by oxygen translocation from roots to the rhizosphere. Oxidized environments promote Mn2+ and Fe3+ oxyhydroxides precipitation on the root surface (Matagi et al., 1998; Sheoran and Sheoran, 2006).
Mn adsorption was most pronounced at S2, where ORP measurements and OM% were highest, suggesting oxygen release from emerging roots promoted Mn precipitation. This highlights the relationship between OM, ORP, and Mn oxidation. Mn adsorption exceeded that of Fe and Al, indicating a higher oxidizing capacity for Mn. In an experimental study, Crowder and Coltman (1993) found Mn plaque concentrations of 983.4 µg/g and internal Mn concentrations of 421.9 µg/g at pH 6, with plaque concentrations surpassing internal concentrations at higher pH levels.
Sediments utilize electron acceptors in order of decreasing free energy yields (Tarutis et al., 1992), with dissolved O
2 consumed in the following order: O
2 > Mn-oxides > Fe-oxides > SO
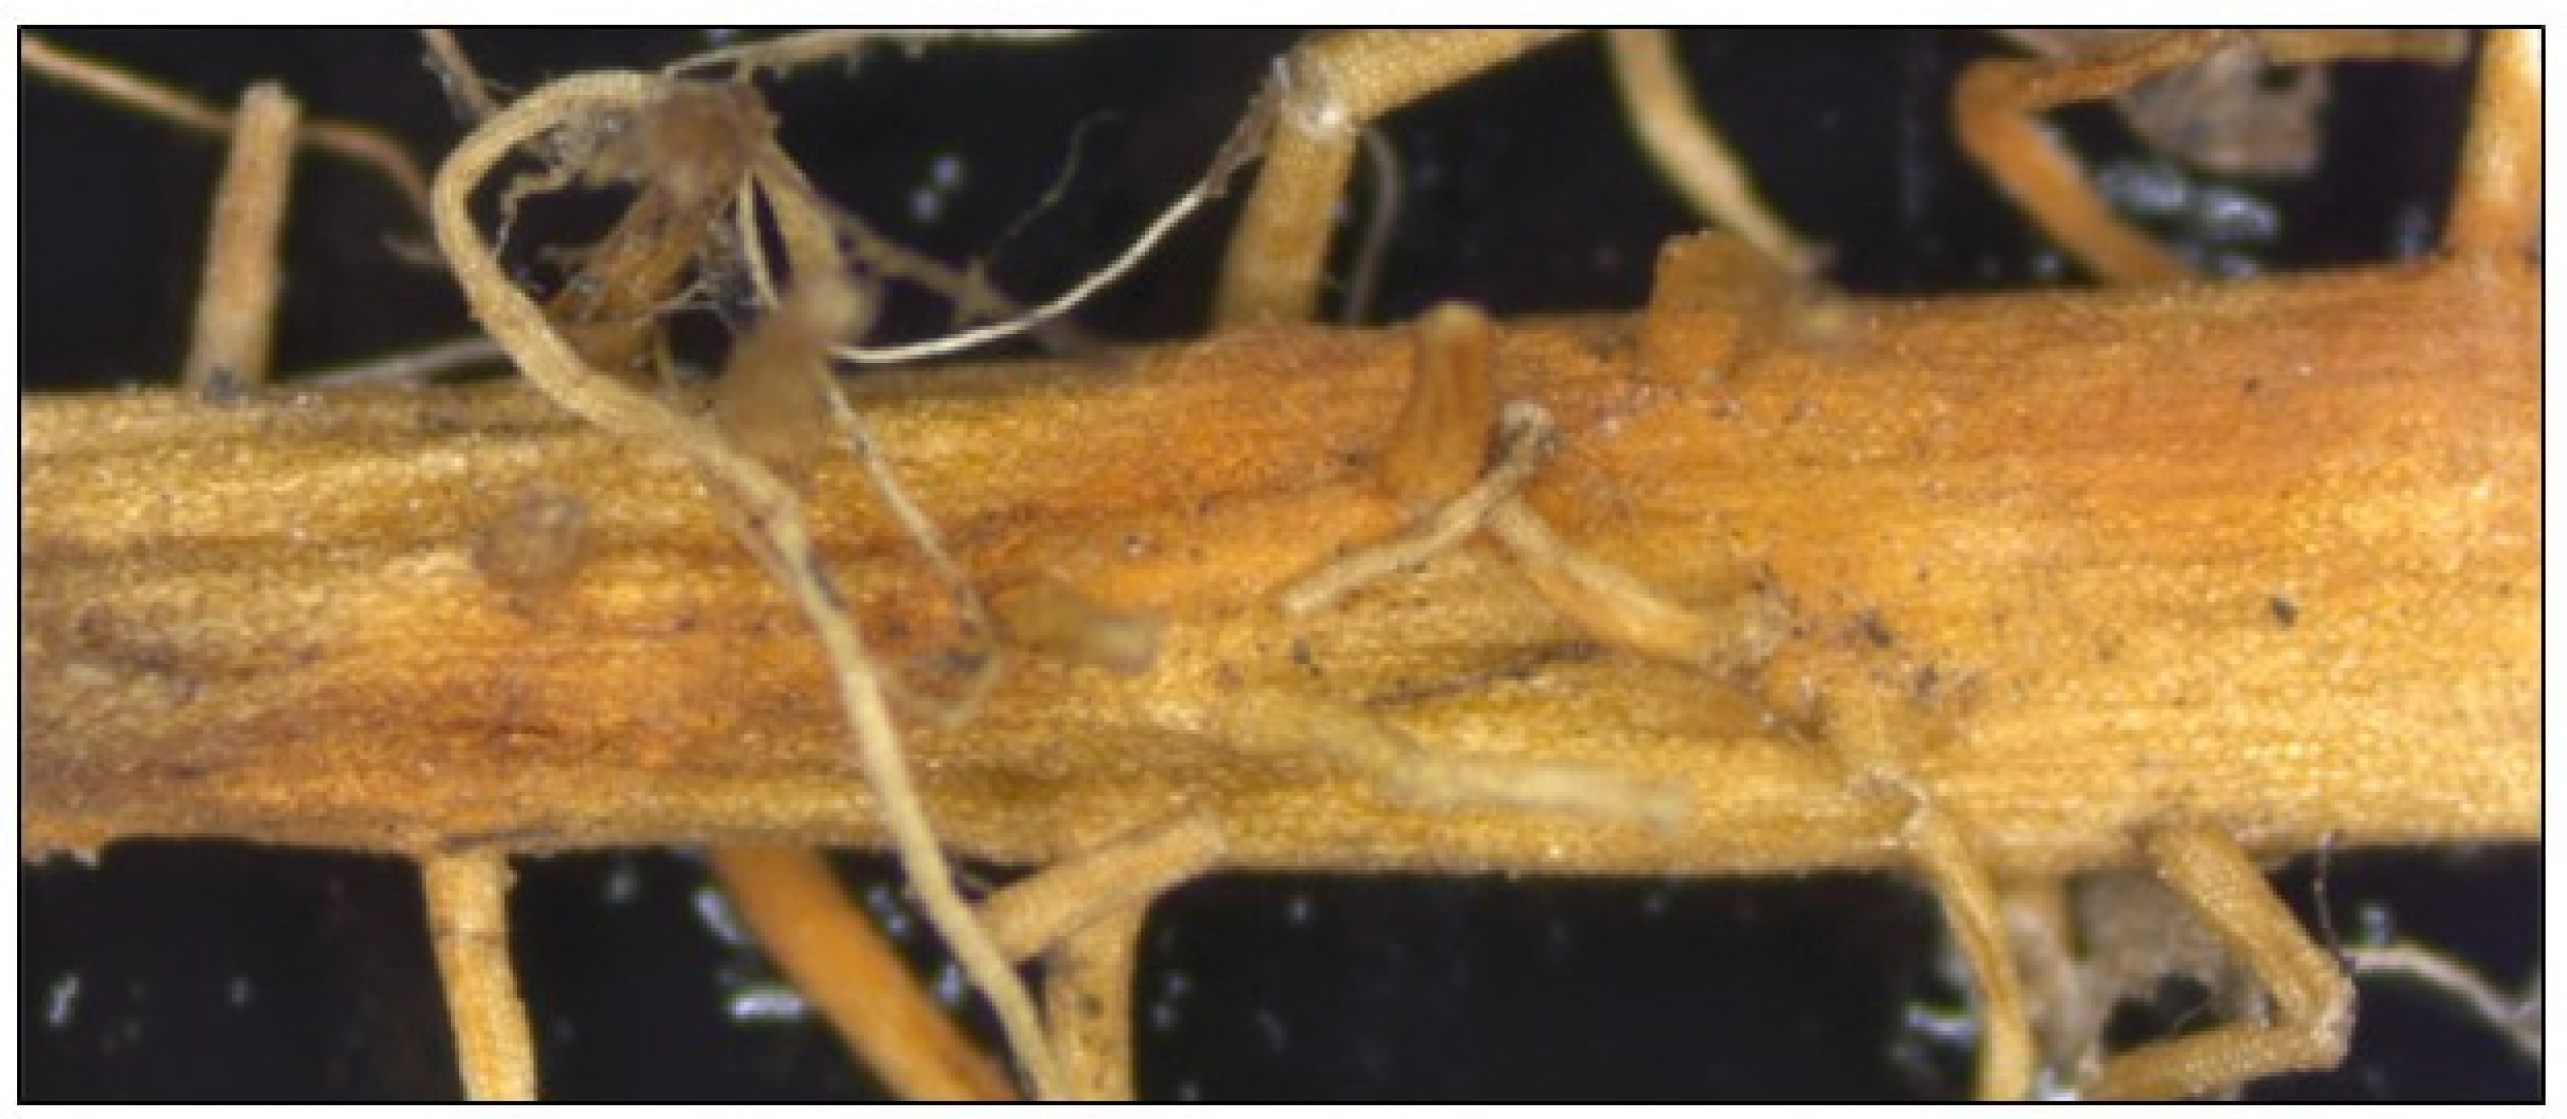
4. Although Mn adsorption exceeded Fe adsorption, the typical orange to brown coloration associated with iron plaque formation was observed on
T. capensis roots both visually and microscopically (
Figure 6).
3.4. Periphyton Sorption Abilities
The dominant periphyton species,
Klebsormidium acidophilum, was collected from S1 and S2 to analyze its metal sorption characteristics using ICP-OES. The results are detailed in
Table 5. The Student’s t-test was applied to compare the mean metal sorption abilities of
K. acidophilum between S1 and S2. The analysis showed no statistically significant difference in the adsorption of Al and Fe between the two sites (p > 0.05). However, there was a significant difference in Mn adsorption, with higher Mn adsorption at S1 compared to S2 (p < 0.05). Regarding metal absorption, a significant difference was observed between the sites (p < 0.05), with Al, Fe, and Mn predominantly absorbed at S1. These findings highlight the varying sorption capacities of
K. acidophilum at different locations within the wetland.
Research on the biosorption of microelements has demonstrated that green macroalgae can effectively accumulate minerals, facilitating the bioaccumulation of specific elements (Michalak et al., 2013). Certain benthic filamentous algae species have shown the ability to absorb metals across various pH levels, making them suitable for passive treatment of AMD-contaminated water (Oberholster et al., 2014). Oberholster et al. (2014) also highlighted that the pH of surface water significantly influences algal metal absorption, with Fe absorption being most efficient at pH 3, and Mn and Al absorption improving at a neutral pH (pH 7.0). The most substantial shifts in periphyton species composition and nutrient cycling typically occur within a pH range of 4.7 to 5.6 (Boekken et al., 2006; Oberholster et al., 2022). However, in the current study, surface water pH values were lower at S1 (pH = 3.9) and S2 (pH = 3.84), compared to S3 (pH = 7.10), where K. acidophilum was absent.
In this study, the metal adsorption sequence for S1 and S2 was Mn > Fe > Al, while metal absorption followed Fe > Al > Mn at both sites. Novis and Harding (2007) emphasized that algal metal accumulation can vary widely depending on the species and types of metals involved. This variability was also observed by Oberholster et al. (2014), where different filamentous algae species exhibited distinct patterns of metal bioaccumulation at various sites. For example, Oedogonium crissum, Klebsormidium krebsii, and Microspora tumidula showed different metal bioconcentration patterns at four different sites: O. crissum at S1 (Al > Fe > Mn), K. krebsii at S2 (Al > Fe > Mn), M. tumidula at S3 (Fe > Al > Mn), and M. tumidula at S4 (Fe > Mn > Al). In this study, K. acidophilum displayed trends similar to M. tumidula, though the latter showed higher bioconcentrations, reaching up to 401,739 mg/kg dry weight for Fe.
Oberholster et al. (2014) also found that Fe bioaccumulation increased as pH decreased, attributed to the precipitation of Fe at pH ≥ 4, making it more available to algal species. Their results suggested that Mn bioaccumulation was favored near neutral pH conditions. However, in this study, Mn adsorption was higher than that of Al and Fe at S1. An experimental study by Vymazal (1984) showed that Fe removal occurred rapidly within the first hour, with up to 94.4% of Fe removed after four hours of exposure to metal-enriched water, whereas Mn exhibited continuous uptake throughout the experiment. These findings by Vymazal (1984) offer valuable insights into the long-term efficiency of metal uptake by periphyton species.
3.5. Microbiological Diversity
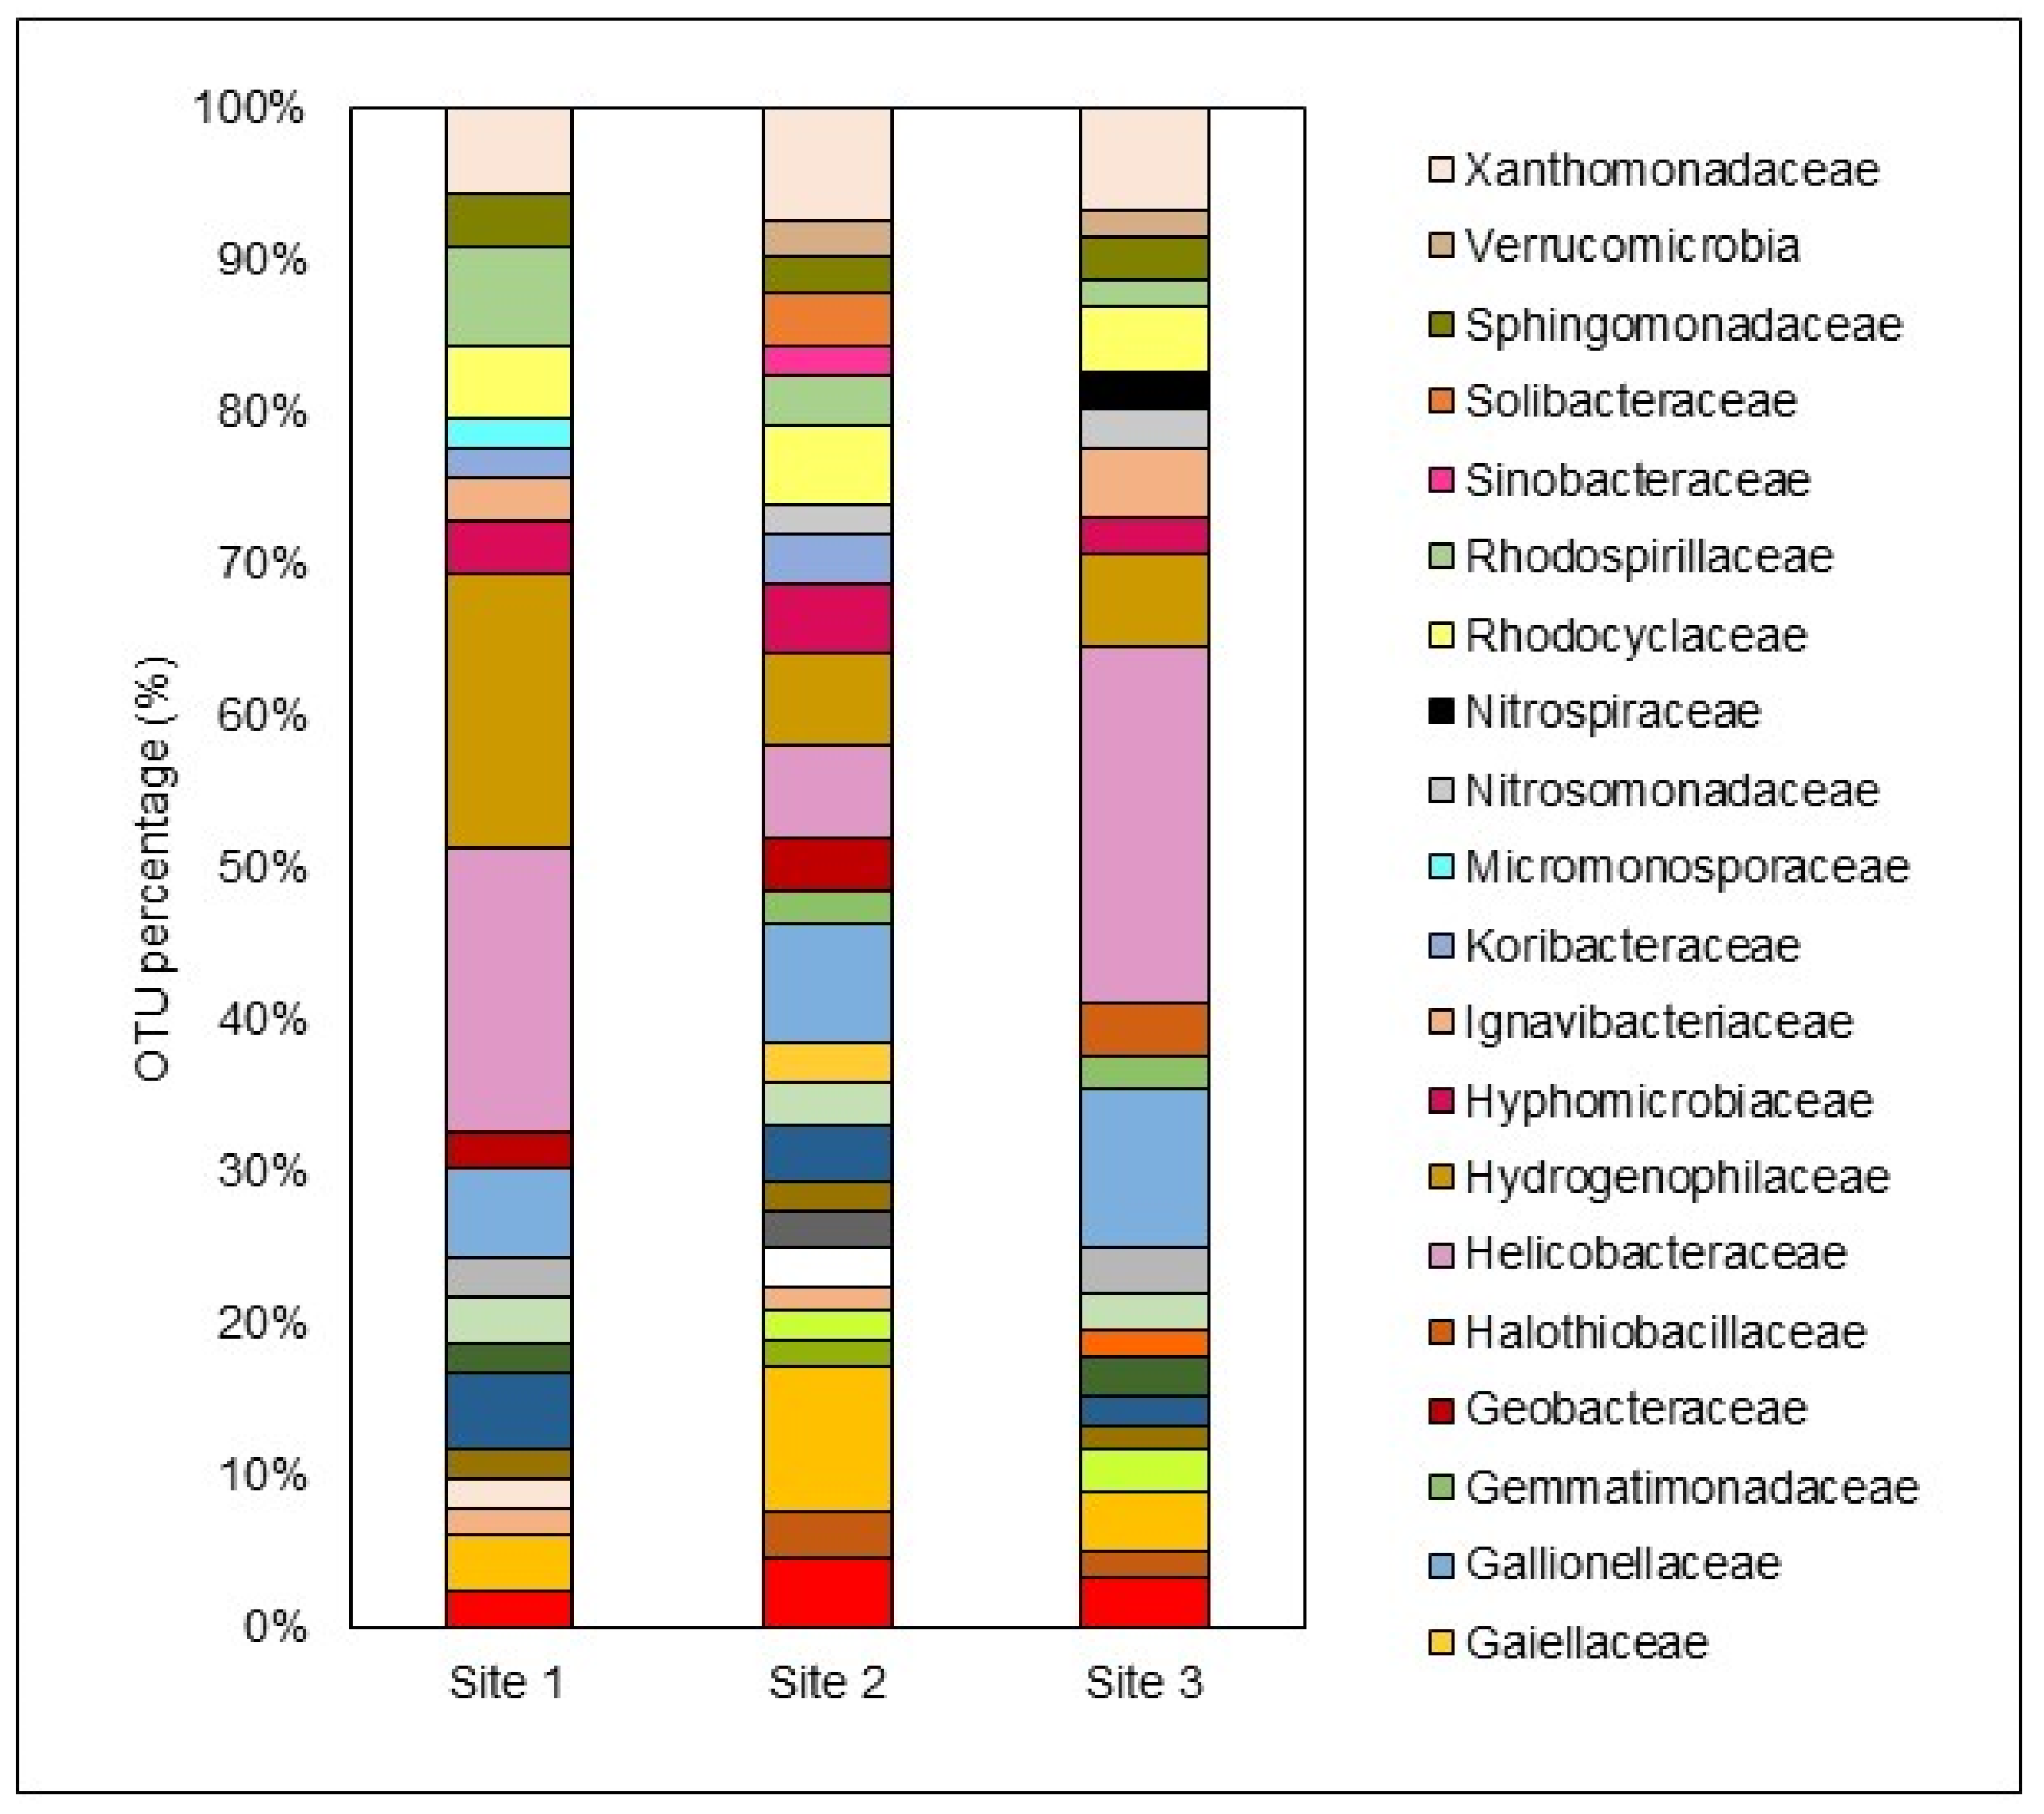
The diversity and abundance of microbiological species in bottom sediment samples, collected at a depth of 8 cm, were analyzed using 16S rRNA next-generation sequencing. Sequences were grouped into operational taxonomic units (OTUs) based on their similarities. The results were categorized into dominant and other taxa, with dominant taxa having an abundance of ≥1%, and other taxa having an abundance of <1%. Notably, the other taxa constituted 44.99%, 38.57%, and 37.33% of the total OTUs detected at S1, S2, and S3, respectively. Although these taxa may be present in small numbers individually, their collective presence indicates a high level of microbial diversity at all three sites.
Figure 7 shows that the dominant taxa included 21, 27, and 24 microbial families at S1, S2, and S3, respectively.
Among the dominant families, those within the phylum Proteobacteria (alpha, beta, and gamma) were the most prevalent. Other significant phyla included Acidobacteria, Firmicutes, and Thermodesulfobacteriota. A previous study on the Zaalklapspruit wetland demonstrated a notable shift in relative abundance and bacterial diversity within the bacterial consortium following ecological engineering interventions. Although Proteobacteria remained the dominant phylum, its relative abundance decreased, while Firmicutes significantly increased (De Klerk et al., 2016). It is important to note that this earlier study focused on the water column bacterial consortium, which might account for the differences in abundance percentages when compared to the sediment samples analyzed in the current study.
Several studies on natural and constructed wetlands receiving AMD have highlighted the abundance of these taxa in sediment samples, underscoring the crucial role of microbially mediated activities in transforming metallic and sulfur compounds during AMD remediation (Aguinaga et al., 2019; Dean et al., 2013; Li et al., 2020). This study identified thirteen comparable families as dominant taxa in the bottom sediment across S1, S2, and S3, reflecting the consistent microbial community structure throughout the wetland. The most prominent families included:
S1: Helicobacteraceae > Hydrogenophilaceae > Rhodospirillaceae > Gallionellaceae > Xanthomonadaceae
S2: Acidobacteriaceae > Gallionellaceae > Xanthomonadaceae > Helicobacteraceae > Hydrogenophilaceae
S3: Helicobacteraceae > Gallionellaceae > Xanthomonadaceae > Hydrogenophilaceae > Rhodospirillaceae
Figure 7.
Distribution of the most dominant microbiological families (relative abundance >1%) in the bottom sediment of each site.
Figure 7.
Distribution of the most dominant microbiological families (relative abundance >1%) in the bottom sediment of each site.
Helicobacteraceae accounted for 19.98%, 6.14%, and 23.53% of the OTUs in the bottom sediment at S1, S2, and S3, respectively. This family, part of the phylum Epsilonproteobacteria, thrives at oxic-anoxic interfaces in sulfur-rich environments (Madigan et al., 2015). Studies have linked Helicobacteraceae with mine effluents high in heavy metals and Fe concentrations, indicating their dominance in metal-polluted aquatic systems (Drennan et al., 2012; Drewniak et al., 2016; Obi et al., 2016). In some cases, they represent up to 65% of the microbial community in such environments.
Hydrogenophilaceae, another significant family observed in this study, are strict autotrophic or facultative anaerobic sulfur oxidizers, playing a crucial role in sulfur utilization in wastewater treatment systems (Zheng et al., 2021). The family Xanthomonadaceae constituted 6.07%, 7.44%, and 6.80% of the OTUs in S1, S2, and S3, respectively. Belonging to the phylum Gammaproteobacteria, Xanthomonadaceae includes iron-reducing bacteria that oxidize Fe(II) for growth and are commonly found in AMD-polluted water bodies (Aguinaga et al., 2019; Leitholf et al., 2019). Leitholf et al. (2019) found that Xanthomonadaceae represented approximately 51% of the detected Gammaproteobacteria in sediments from AMD-induced iron mounds, highlighting their preference for Fe-rich environments.
Gallionellaceae, also associated with Fe(II)-rich sediments and iron oxidation, showed a relative abundance of 10.47% at S3, where Fe
2O
3 was prevalent in the bottom sediment (
Table 3).
Rhodospirillaceae, detected at all three sites, is known to inhabit stagnant water bodies with a pH of around 5.5 and tends to increase in abundance as acidity rises (Biebl and Pfennig, 1981). This family thrives in environments with rapid OM production, aligning with the high OM levels found in this study.
Other abundant families detected at all three sites included Acetobacteraceae, Clostridiaceae, Desulfobulbaceae, Hyphomicrobiaceae, and Sphingomonadaceae. Desulfobulbaceae, part of the phylum Thermodesulfobacteria, are well-known sulfate-reducing bacteria (SRB) involved in sulfate transformation in bottom sediments, playing a crucial role in passive treatment systems like wetlands (Madigan et al., 2015; Oberholzer et al., 2022). SRB phyla is known to mediate AMD-polluted waters, and it includes Proteobacteria, Firmicutes, Thermodesulfobacteria, and Nitrospirae.
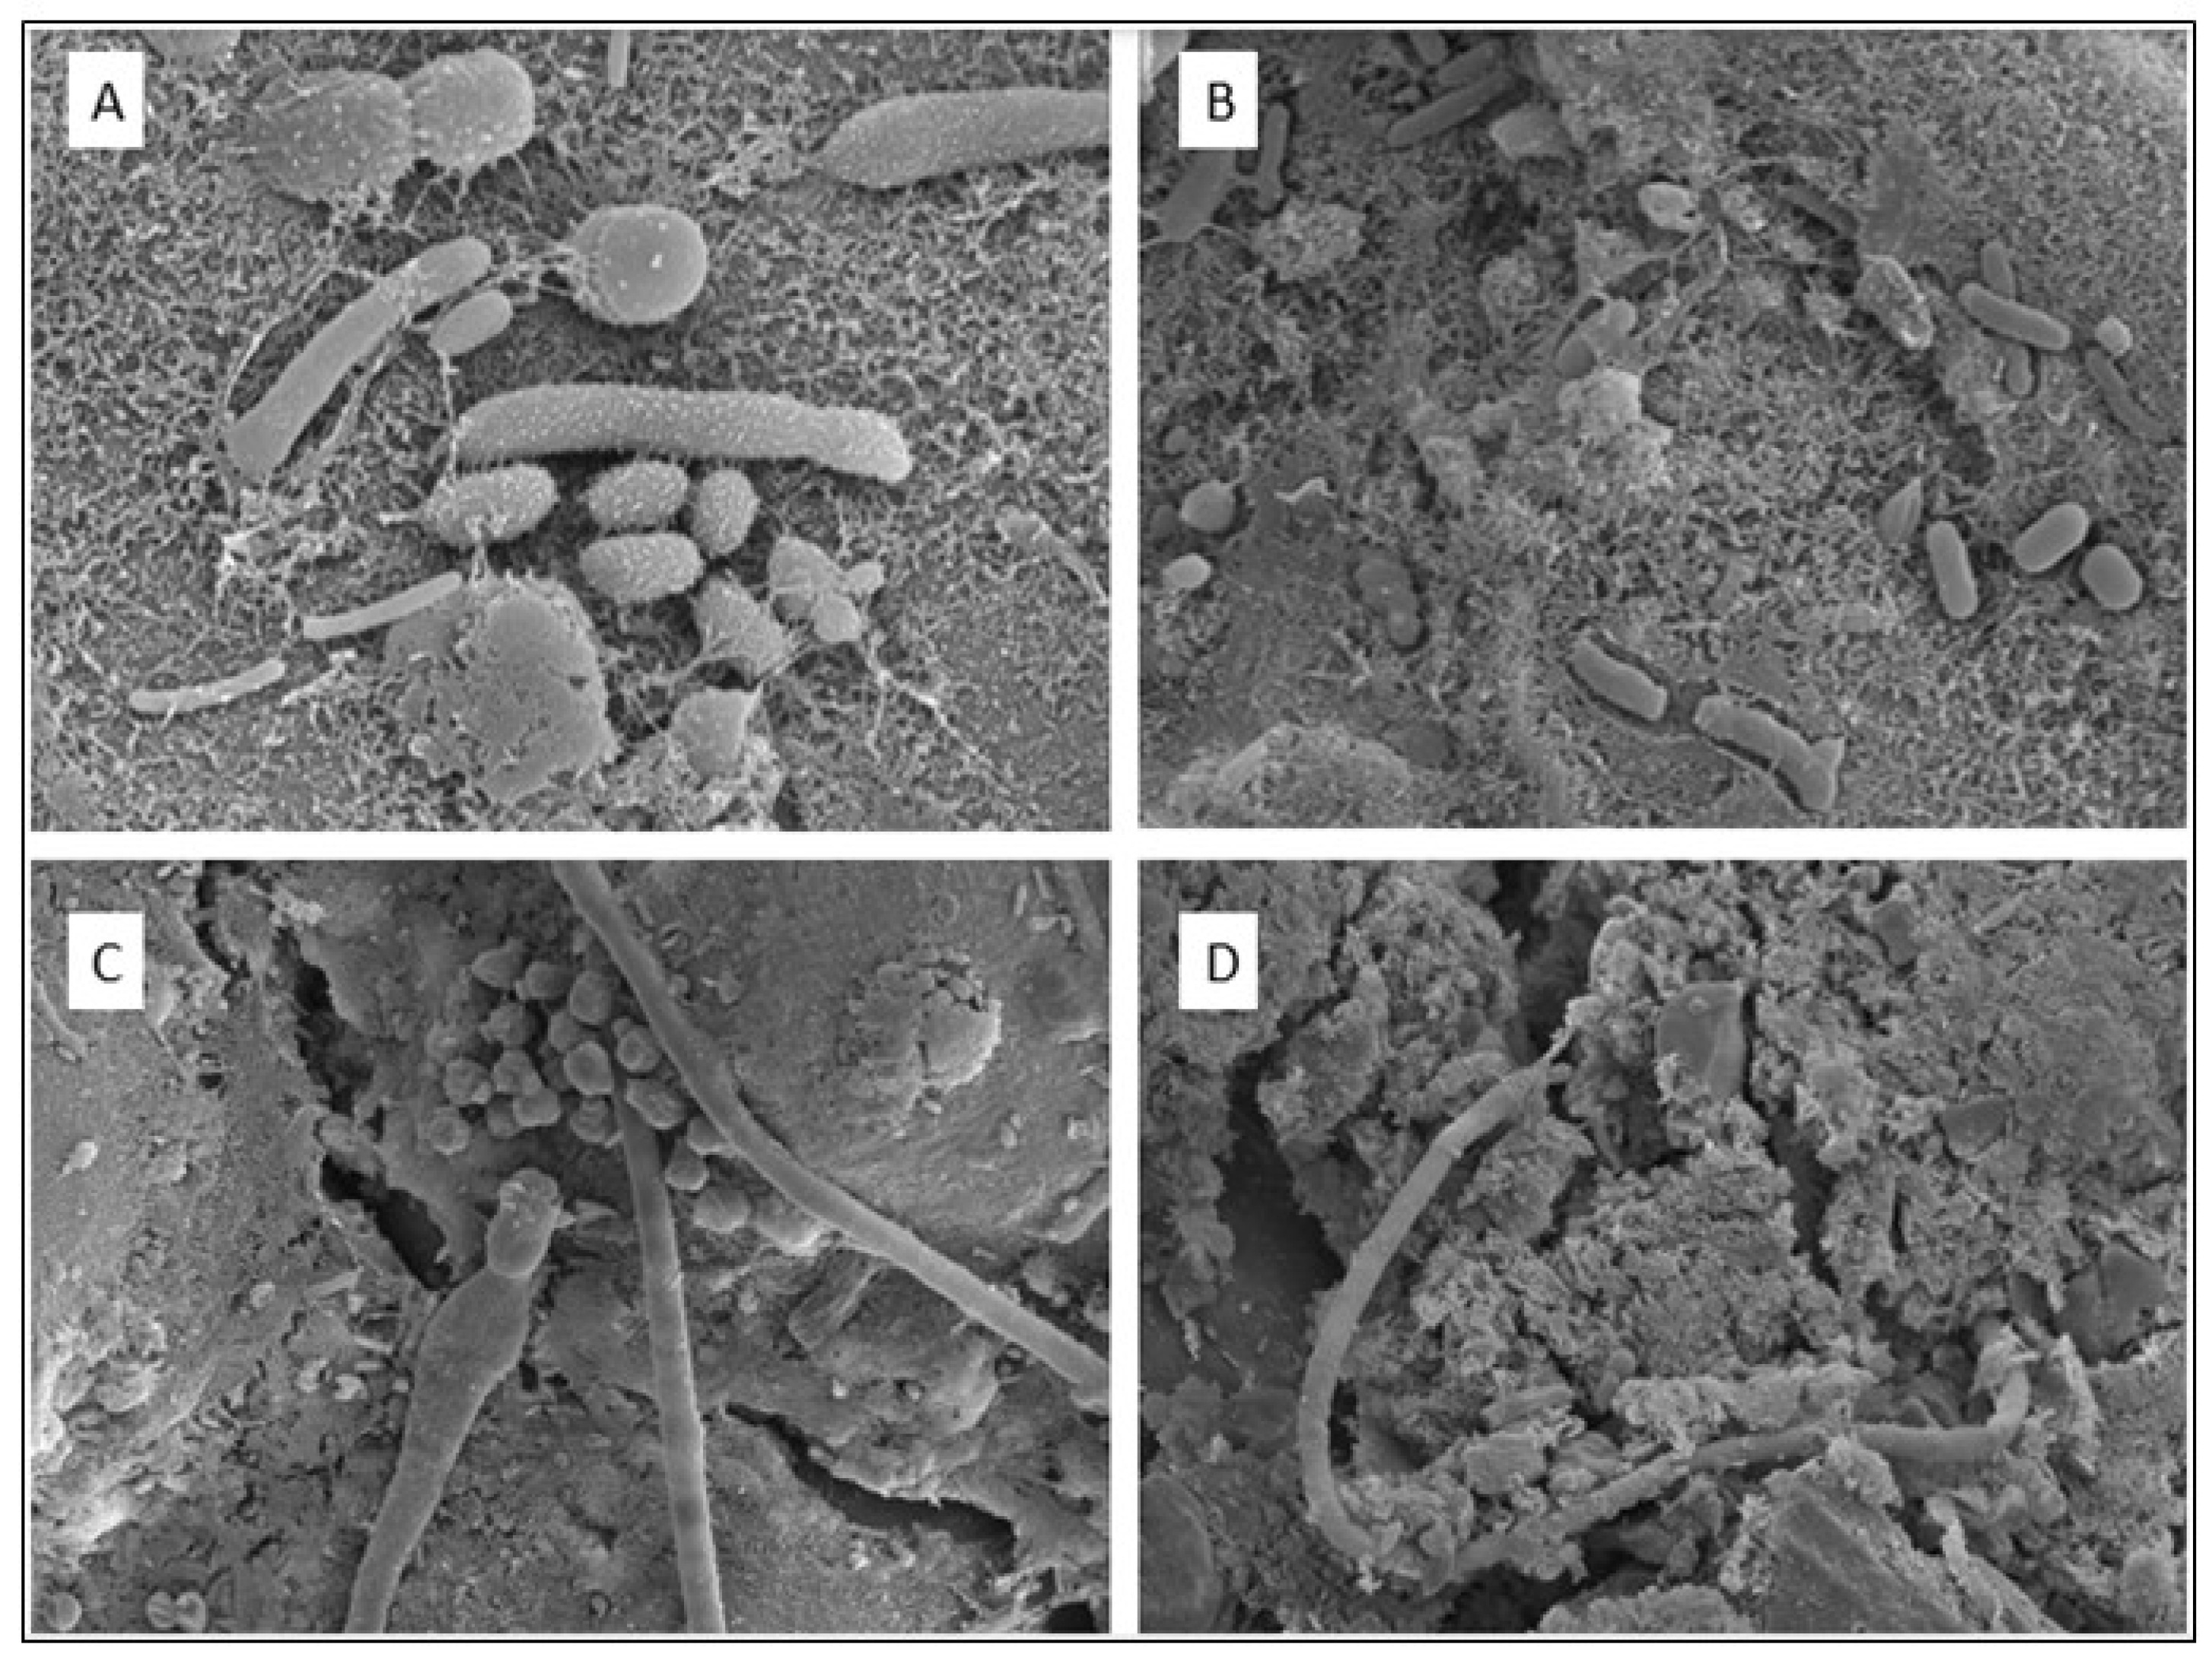
In summary, the 16S rRNA sequencing results indicate a rich diversity of microorganisms in the bottom sediment and rhizosphere, further illustrated by SEM images of the tertiary roots of
T. capensis (
Figure 8).
3.6. Precipitated Mineral Salts
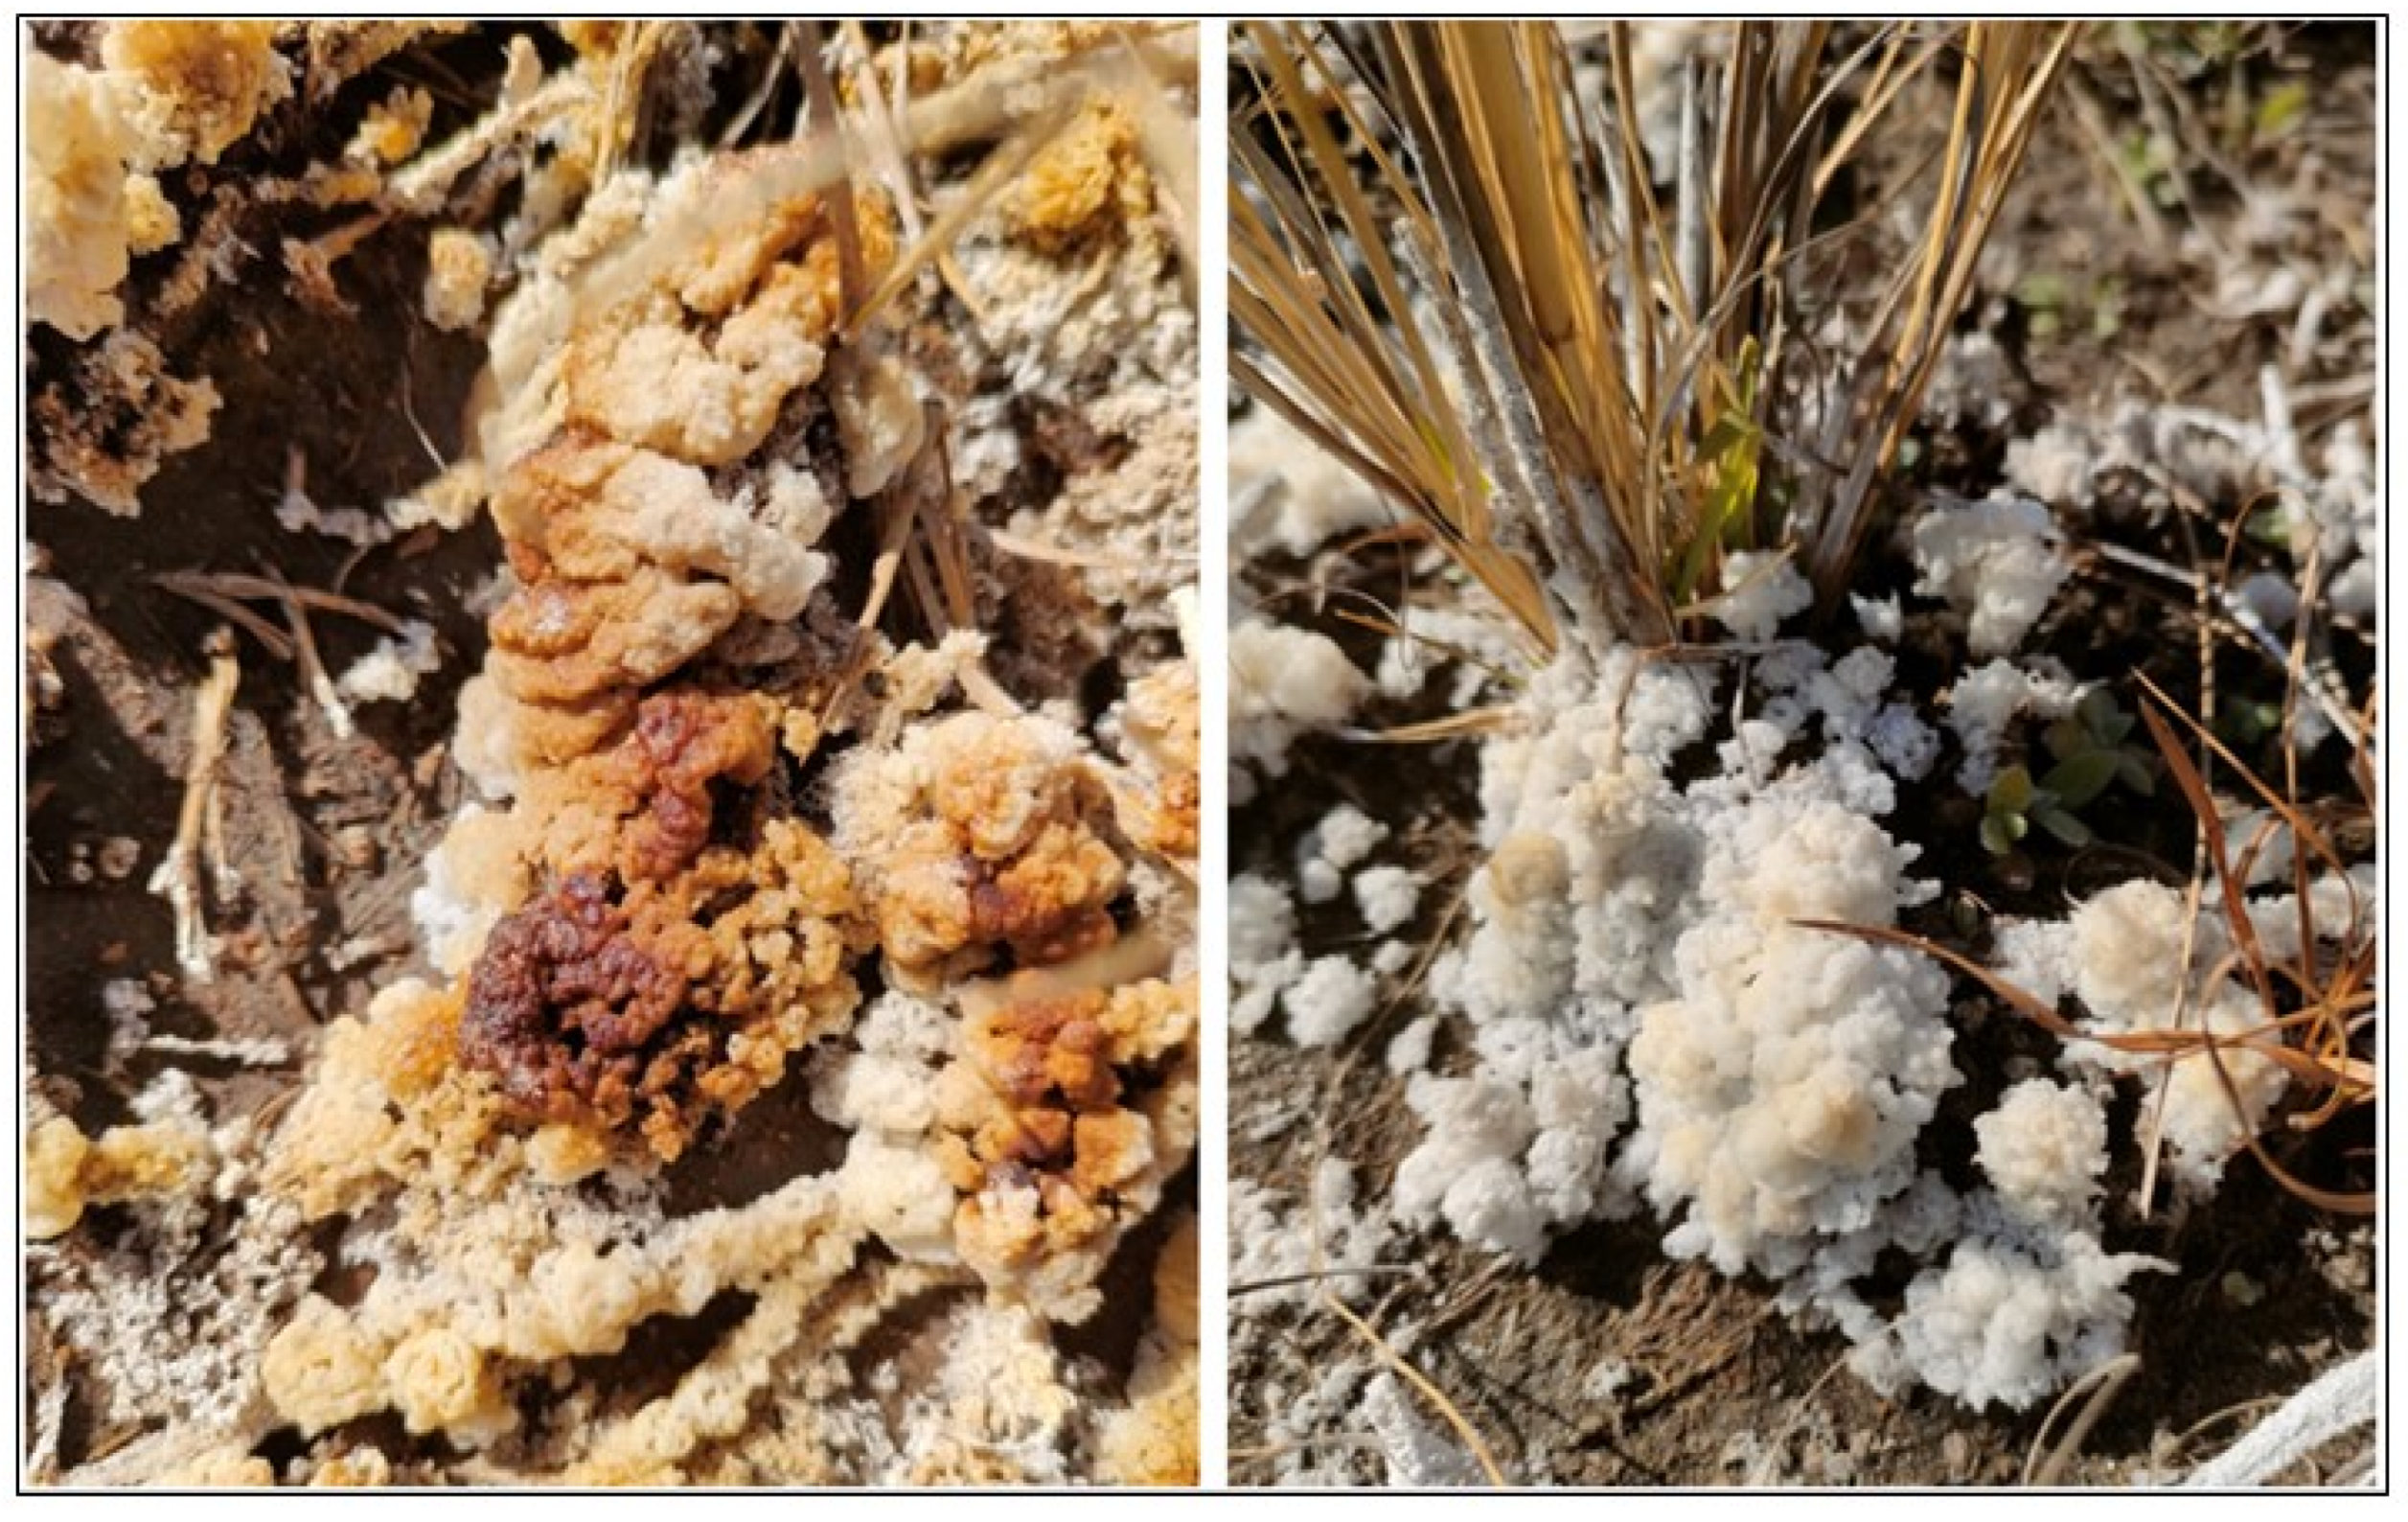
An XRF analysis was conducted to identify the composition of metal and sulfur compounds in the precipitated mineral salts found on the surface of dry wetland soil, as shown in
Figure 9.
Table 6 details the composition of these mineral salts. The analysis revealed significant amounts of metal and sulfur compounds precipitated as mineral salts on the surface soil. Notably, sulfur trioxide (SO
3) was present in the highest concentrations, indicating that precipitation is a key process in retaining sulfur compounds, particularly in areas without surface water flow during the dry season. This suggests that SO
3 is effectively trapped in the soil during dry conditions. However, SO
3 may become mobilized during the wet season, increasing sulfur compound concentrations in areas that had not previously been exposed to surface water. This dynamic highlights the seasonal variations in sulfur compound mobility and the importance of precipitation in managing sulfur levels within the wetland ecosystem.
3.7. Ecological Engineering Interventions and Ecosystem Services
The Zaalklapspruit wetland has effectively integrated ecological engineering interventions to restore and enhance its ecosystem services. These interventions, such as the strategic placement of berm structures to reduce water velocity and increase retention time, have improved water quality and reinstated critical ecosystem functions. By stabilizing pH levels, reducing harmful metal concentrations, and enhancing the buffering capacity of the wetland, these measures have facilitated the development of a more resilient and self-sustaining ecosystem.
The wetland’s ability to adopt these engineered solutions demonstrates the synergy between ecological restoration and engineering practices. The reinstatement of ecosystem services, such as improved water quality, habitat provision, and increased biodiversity, highlights the success of these interventions. The reduction in metal concentrations like Al and Fe and the improved pH levels across the sites illustrate the effectiveness of the engineering measures implemented.
Additionally, the re-establishment of complex biogeochemical processes and microbial diversity within the wetland further underscores the positive impact of these interventions. For instance, diverse microbial communities, including families like Helicobacteraceae, Xanthomonadaceae, and Gallionellaceae, play a crucial role in transforming and stabilizing metals and sulfur compounds in the sediment.
Implementing these ecological engineering interventions has contributed to the mitigation of AMD impacts and promoted the wetland’s overall ecological health and resilience. By fostering natural processes and improving water quality, such interventions ensure that wetlands can continue to provide essential ecological services, supporting biodiversity and enhancing the quality of life for surrounding communities.
Overall, the Zaalklapspruit wetland is a model for utilizing ecological engineering to restore, regenerate and enhance the functionality of natural ecosystems. The positive outcomes observed in this study highlight the importance of continuing to invest in and apply ecological engineering principles to address environmental challenges and promote the sustainable management of natural resources. Integrating these practices not only aids in the recovery of degraded wetlands but also enhances their capacity to support diverse biological communities and maintain vital ecosystem services.
3.8. Integrated Findings
Water flow rates profoundly influence wetlands’ filtration and purification capacity Reduced water flow promotes the aggregation, flocculation, and sedimentation of particles from AMD-affected water, leading to their settling and formation of a bottom sediment layer. This sediment layer remains in continuous contact with surface water, the primary carrier of pollutants stemming from AMD (Cai et al., 2021; Kalita et al., 2019).
Wetland macrophytes undergo decomposition in oxygen-depleted, flooded environments, enriching the OM content within the bottom sediment (Batty, 1999; Tarutis et al., 1992; Xu et al., 2019). Clay minerals, renowned for their robust ion exchange capacity, interact with OM, which metals have a strong affinity for (Jackson et al., 2014; Sasaki et al., 2001). Moreover, sediment characteristics such as pH and ORP are influenced by root exudates containing oxygen and other nutrients (Batty, 1999; Xu et al., 2019). Elevated pH and ORP values facilitate the precipitation and sorption of metals like Mn and Fe, often observed as Fe plaques on root surfaces (Dean et al., 2013; Grybos et al., 2009; Rai, 2009).
Microbial communities thrive on the nutrient-rich environment provided by accumulations in the rhizosphere, modifying metals and sulfur compounds through oxidation and reduction reactions during metabolic activities (McNear, 2013; Weber et al., 2008). Mobilized metals and sulfur compounds are subsequently released into the bottom sediment and readily absorbed into macrophyte root tissues (Kaplan et al., 2016).
The success of this passive treatment system hinges on the intricate interplay among various wetland compartments, all interdependent within the anoxic and potentially toxic environment created by AMD (McNear, 2013; Rambabu et al., 2020).
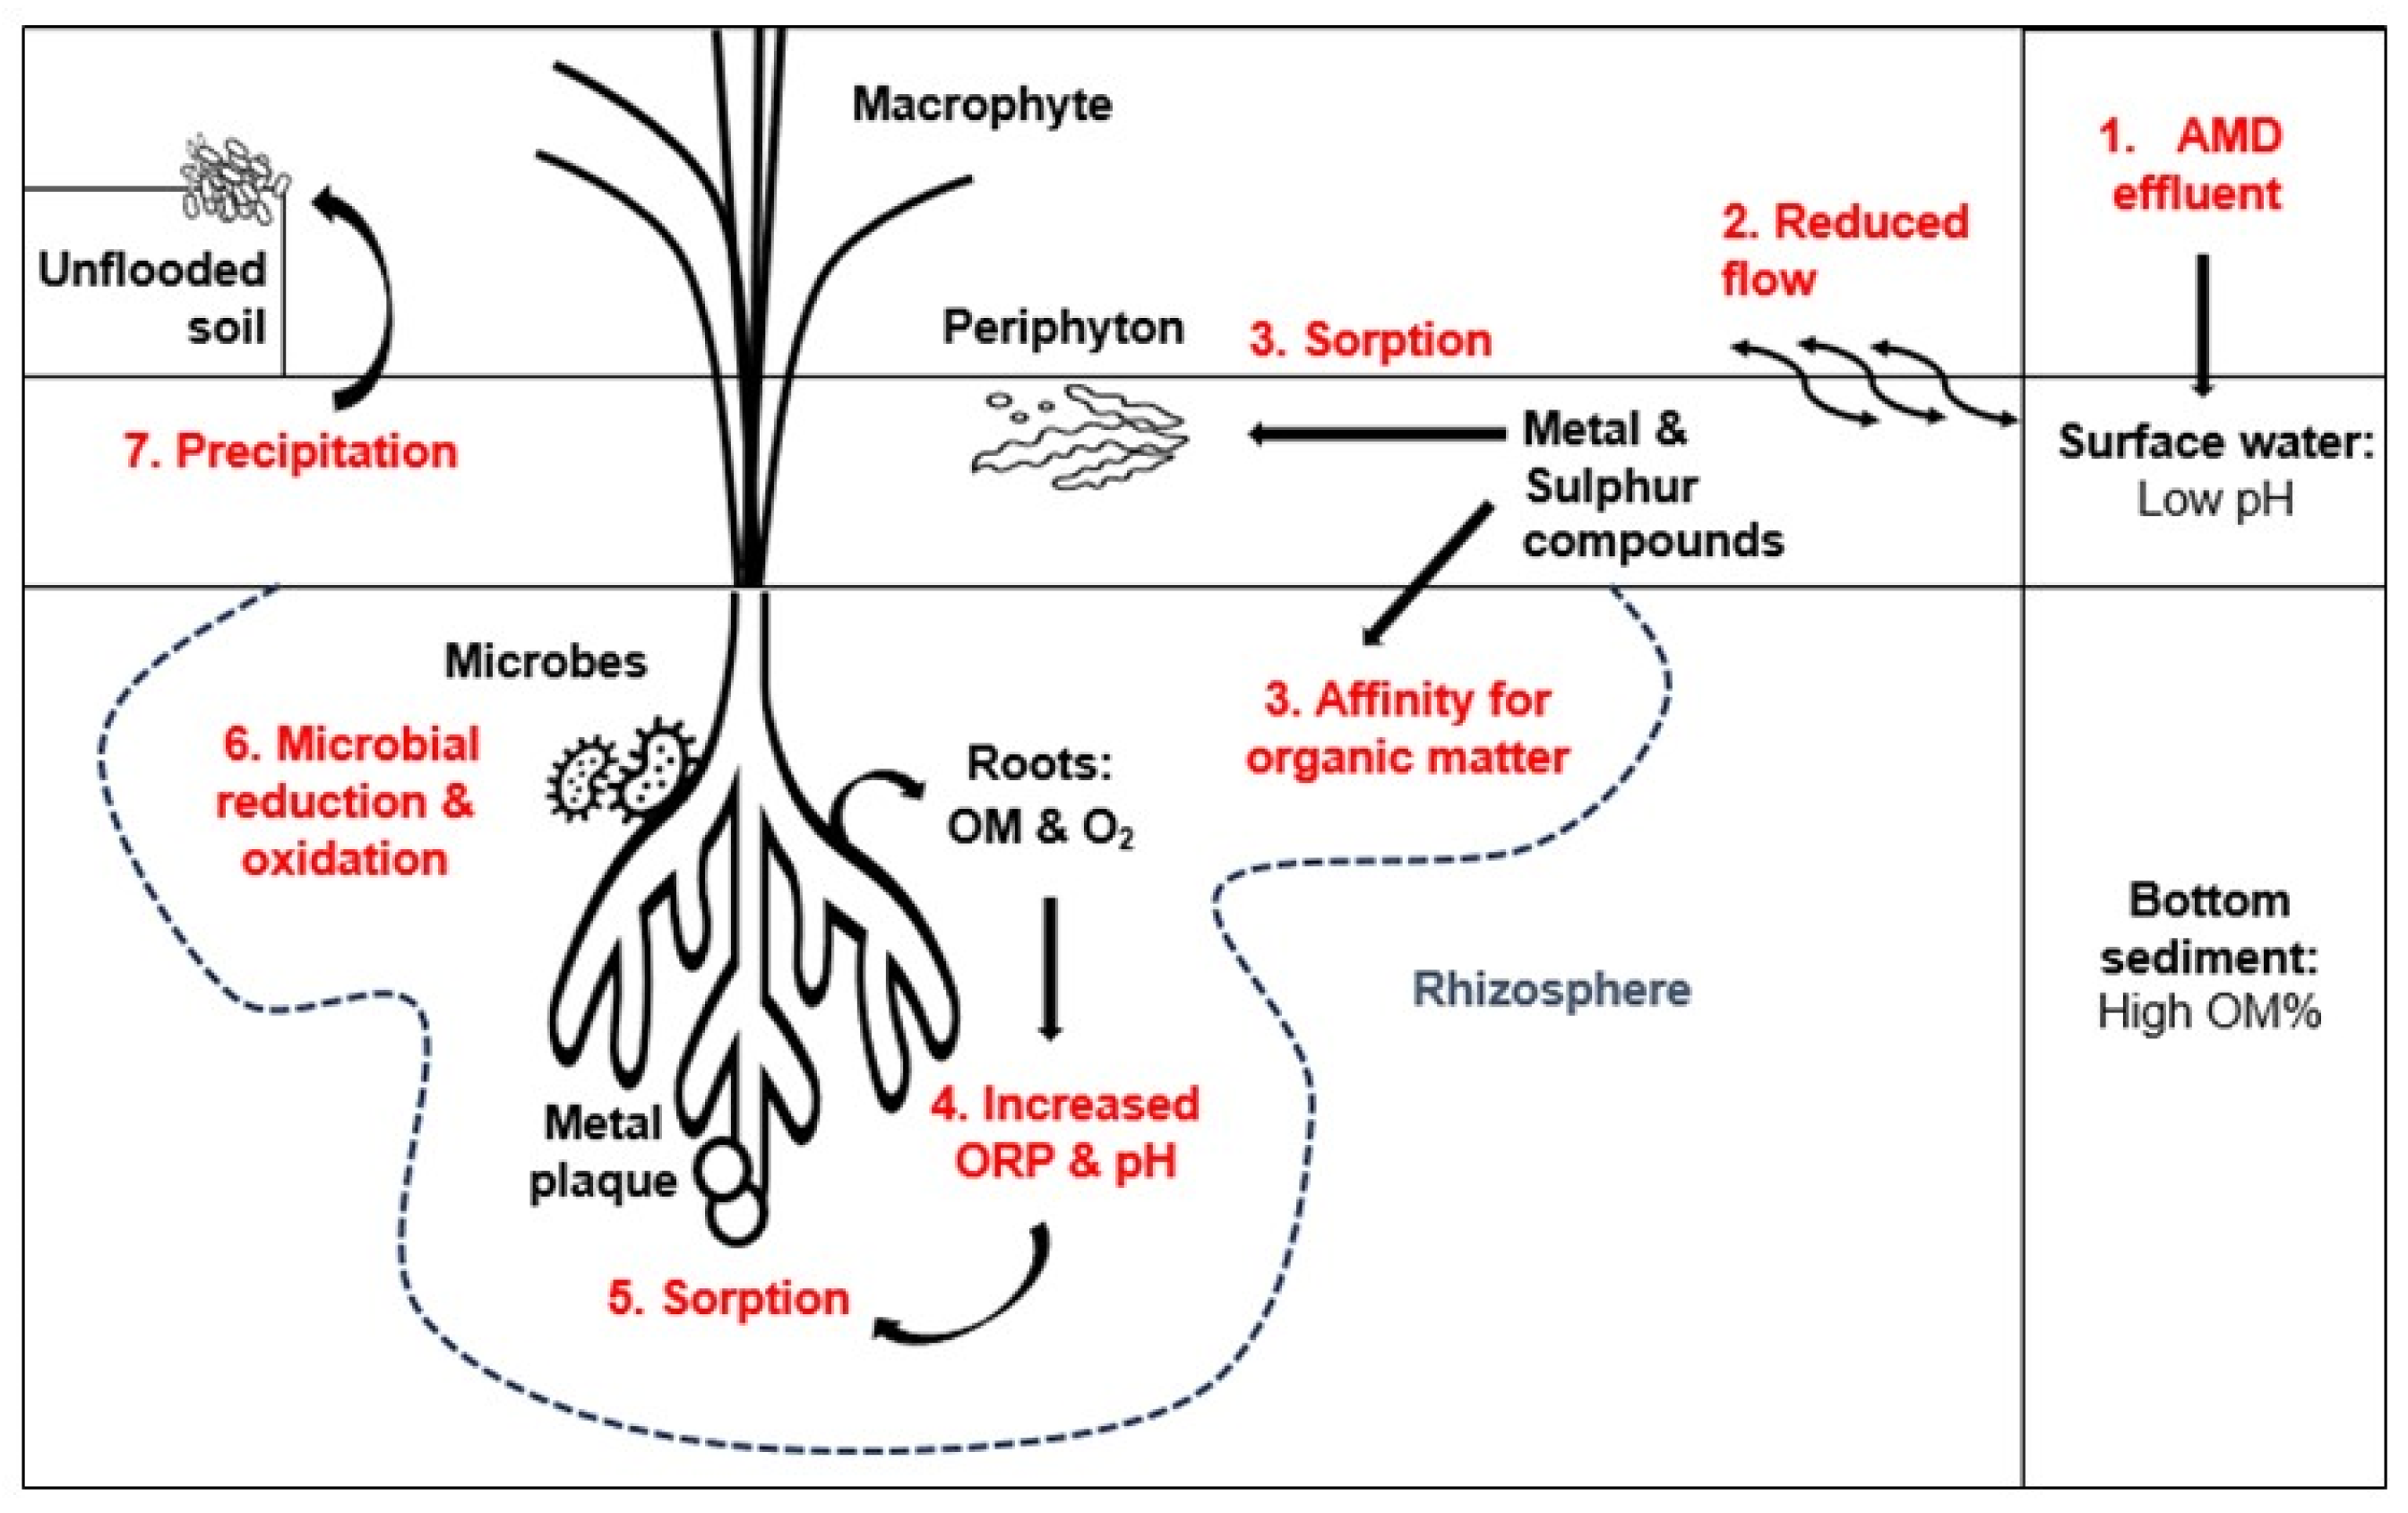
Figure 10 provides a simplified schematic representation of this phenomenon in the current study, illustrating the dynamic interactions within the wetland environment.
4. Conclusion
The implementation of a source-pathway-receptor approach has been pivotal in uncovering how contaminants behave within the ecologically engineered wetland studied here. Contamination originates from AMD effluent discharged by an abandoned coal mine upstream, which infiltrates the wetland’s surface water and flows from the inlet to the outlet.
Significant enhancements in critical surface water quality parameters, such as pH, EC and concentrations of Al, Fe, and SO42-, were observed from the inlet to the central section of the wetland. These improvements underscore the wetland’s substantial role in treating AMD, achieved through a variety of mechanisms and interactions with substrates. Together, these mechanisms, substrates, and processes serve as pathways and receptors for contaminants within this ecosystem.
Critical elements linked to AMD, including Al, Fe, Mn, and sulfur compounds, were found in the bottom sediment, the root systems of T. capensis, and the biomass of periphyton K. acidophilum. Moreover, a diverse array of microorganisms was identified within the bottom sediment, emphasizing these substrates as ultimate receptors for metal and sulfur contaminants in the ecosystem.
The stable attributes of the wetland’s bottom sediment—such as pH, ORP, texture, and OM content—support essential biogeochemical processes like precipitation, sorption, reduction, oxidation, and other vital reactions. These biogeochemical processes, intricately tied to receptor characteristics, work in concert to mitigate the impacts of pollutants.
Processes like flocculation and sedimentation are crucial as they increase the contact time between surface water and substrates, thereby enhancing pollutant removal efficiency. The observed decrease in water flow significantly boosts the treatment effectiveness of the ecologically engineered wetland. Nonetheless, further exploration of hydrological dynamics and seasonal variations is crucial to deepen our comprehension and ensure this ecosystem’s long-term stability and resilience.
These findings carry global significance, offering valuable insights for advancing research, refining management practices, and implementing ecologically engineered strategies in AMD-affected wetlands. Ultimately, these endeavors contribute to the sustainable mitigation of contaminated water resources on a global scale.
Figure 1.
Explanatory schematic representation of the source, pathway and receptor approach to the ecologically engineered wetland that received acid mine drainage. (A) Wastewater is introduced into the wetland from an abandoned coal mine upstream. (B) Pathways: Flocculation of particles in wetland that ensures transfer of contaminants from the surface water to the bottom sediment. (C) Receptors: Scanning electron microscopic (SEM) image of microorganisms in the bottom sediment of the wetland, which is at the receiving end of the ecosystem (Source: Adopted from Belle et al., 2023).
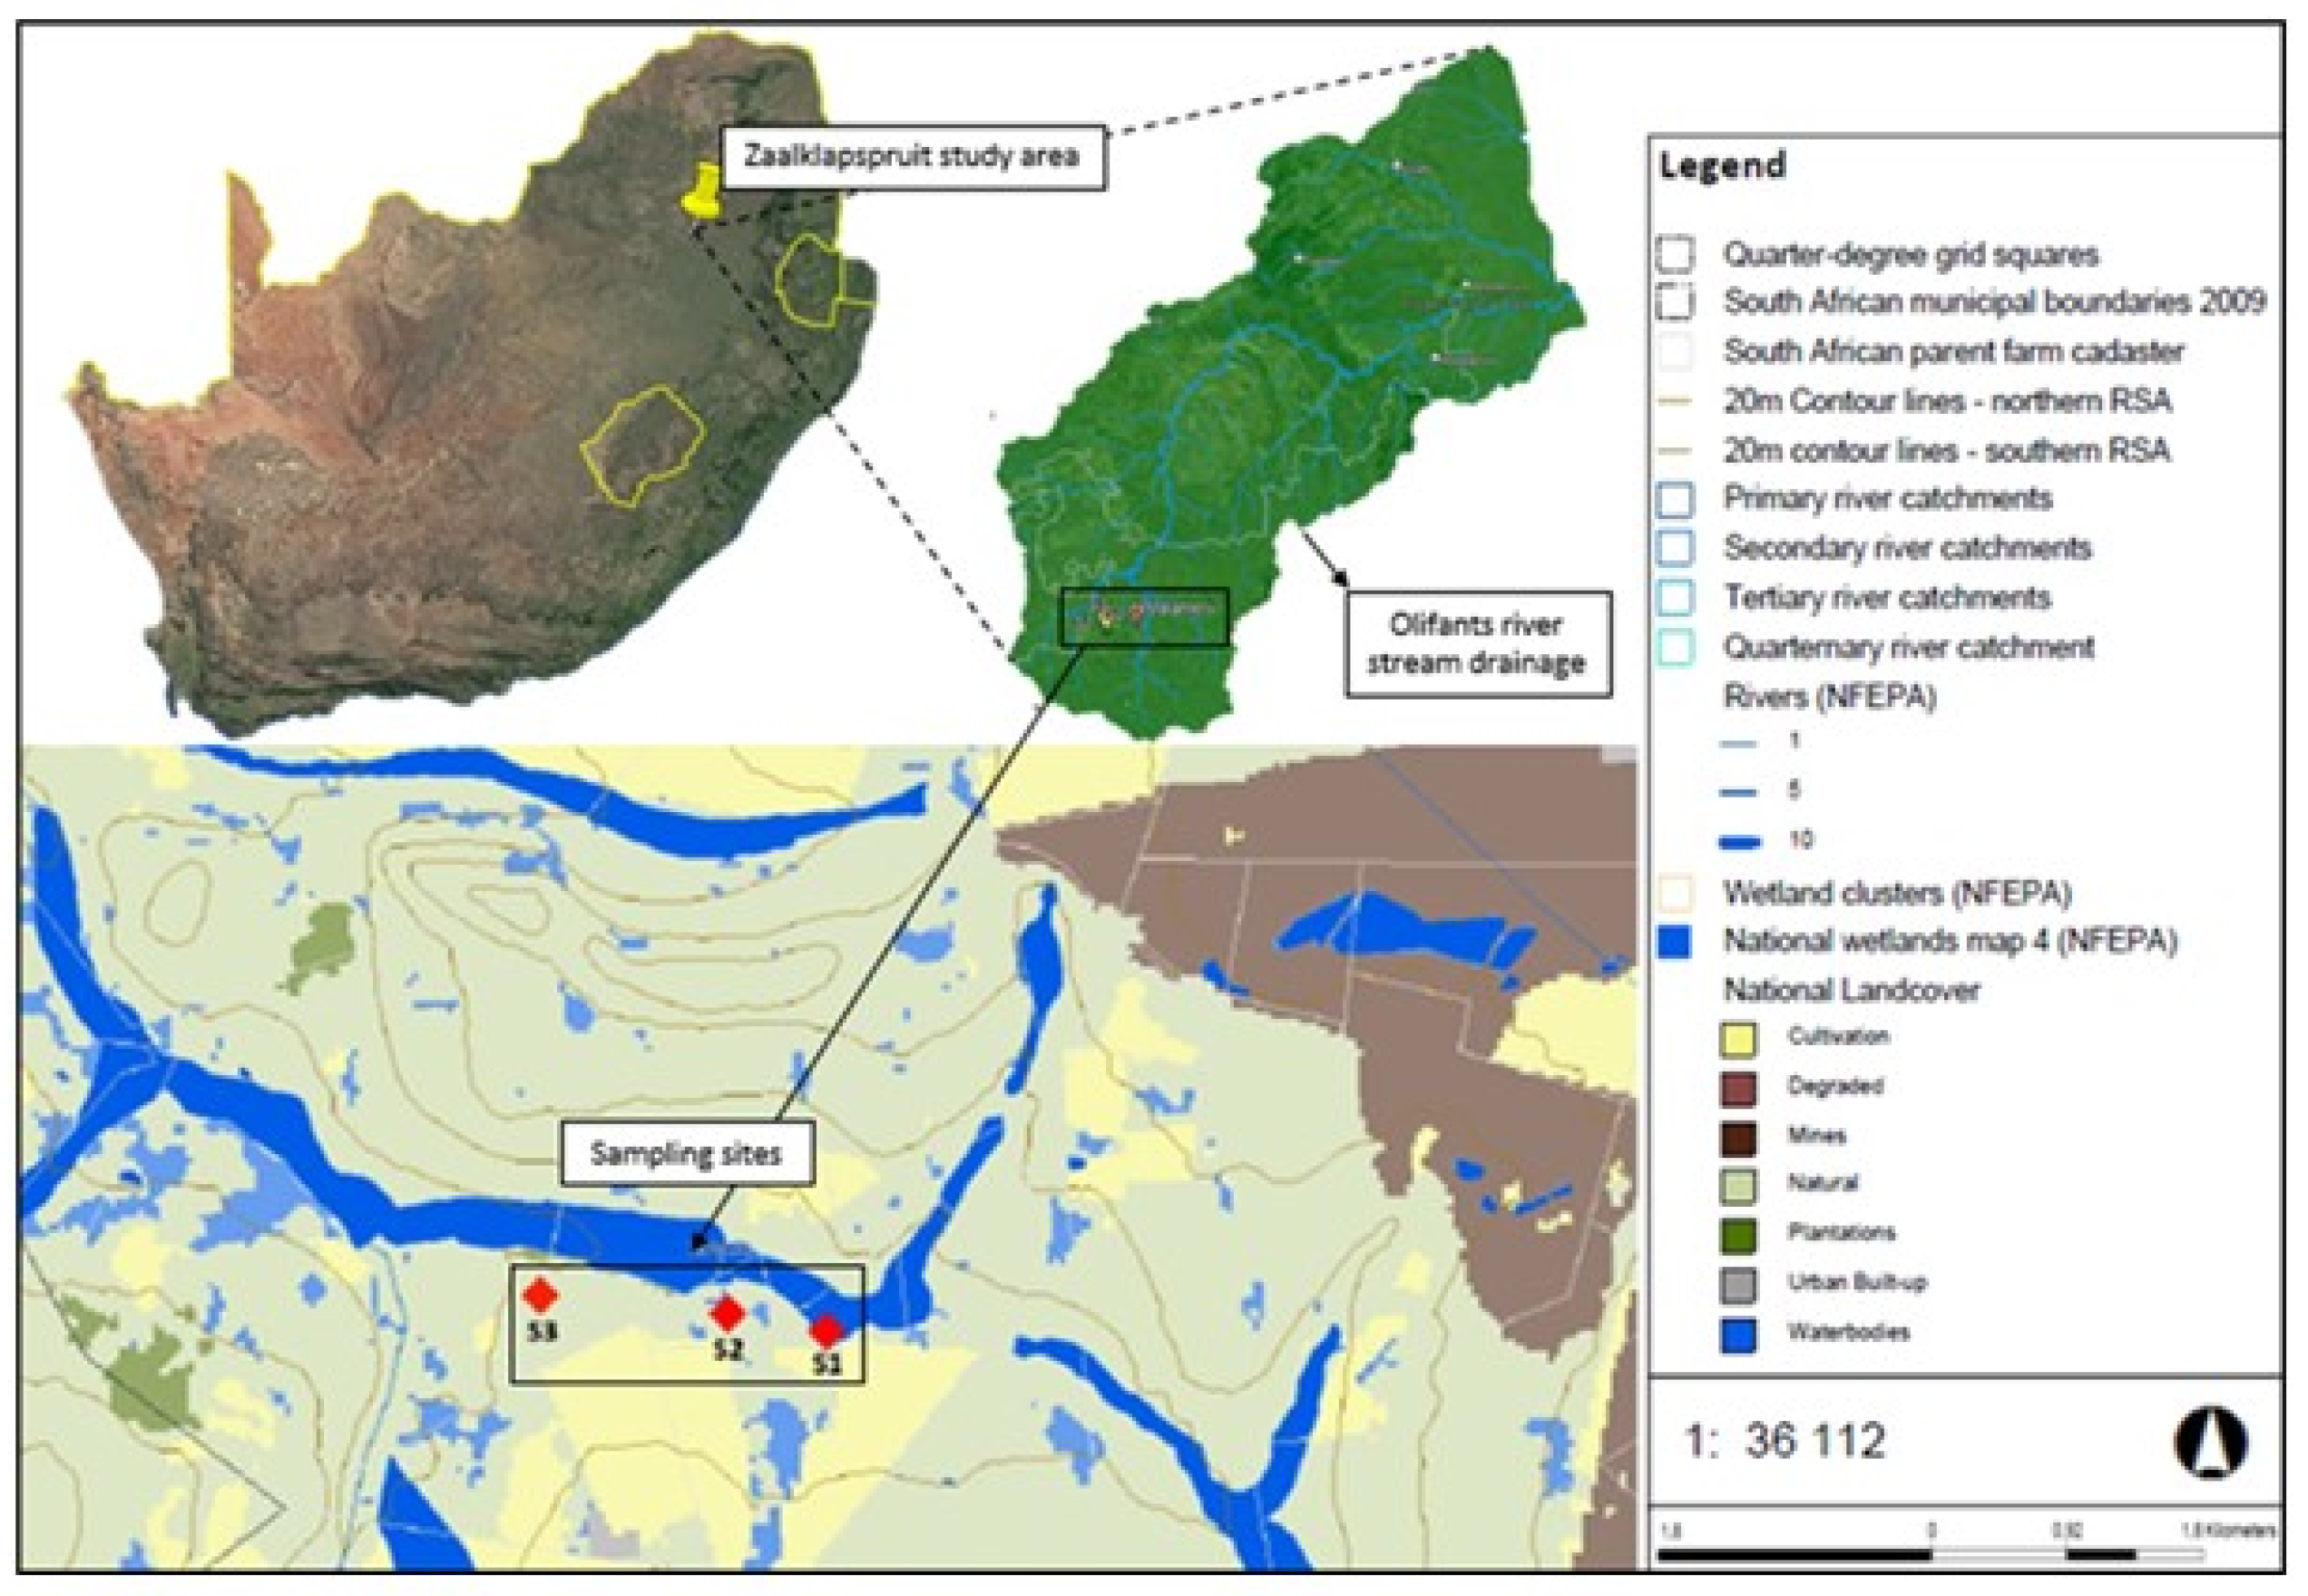
Figure 2.
Map of the Zaalklapspruit study area and sampling sites within the Olifants River drainage system in South Africa (Adapted from the South African National Biodiversity Institute (SANBI) Biodiversity Geographic Information System map viewer, 2023).
Figure 2.
Map of the Zaalklapspruit study area and sampling sites within the Olifants River drainage system in South Africa (Adapted from the South African National Biodiversity Institute (SANBI) Biodiversity Geographic Information System map viewer, 2023).
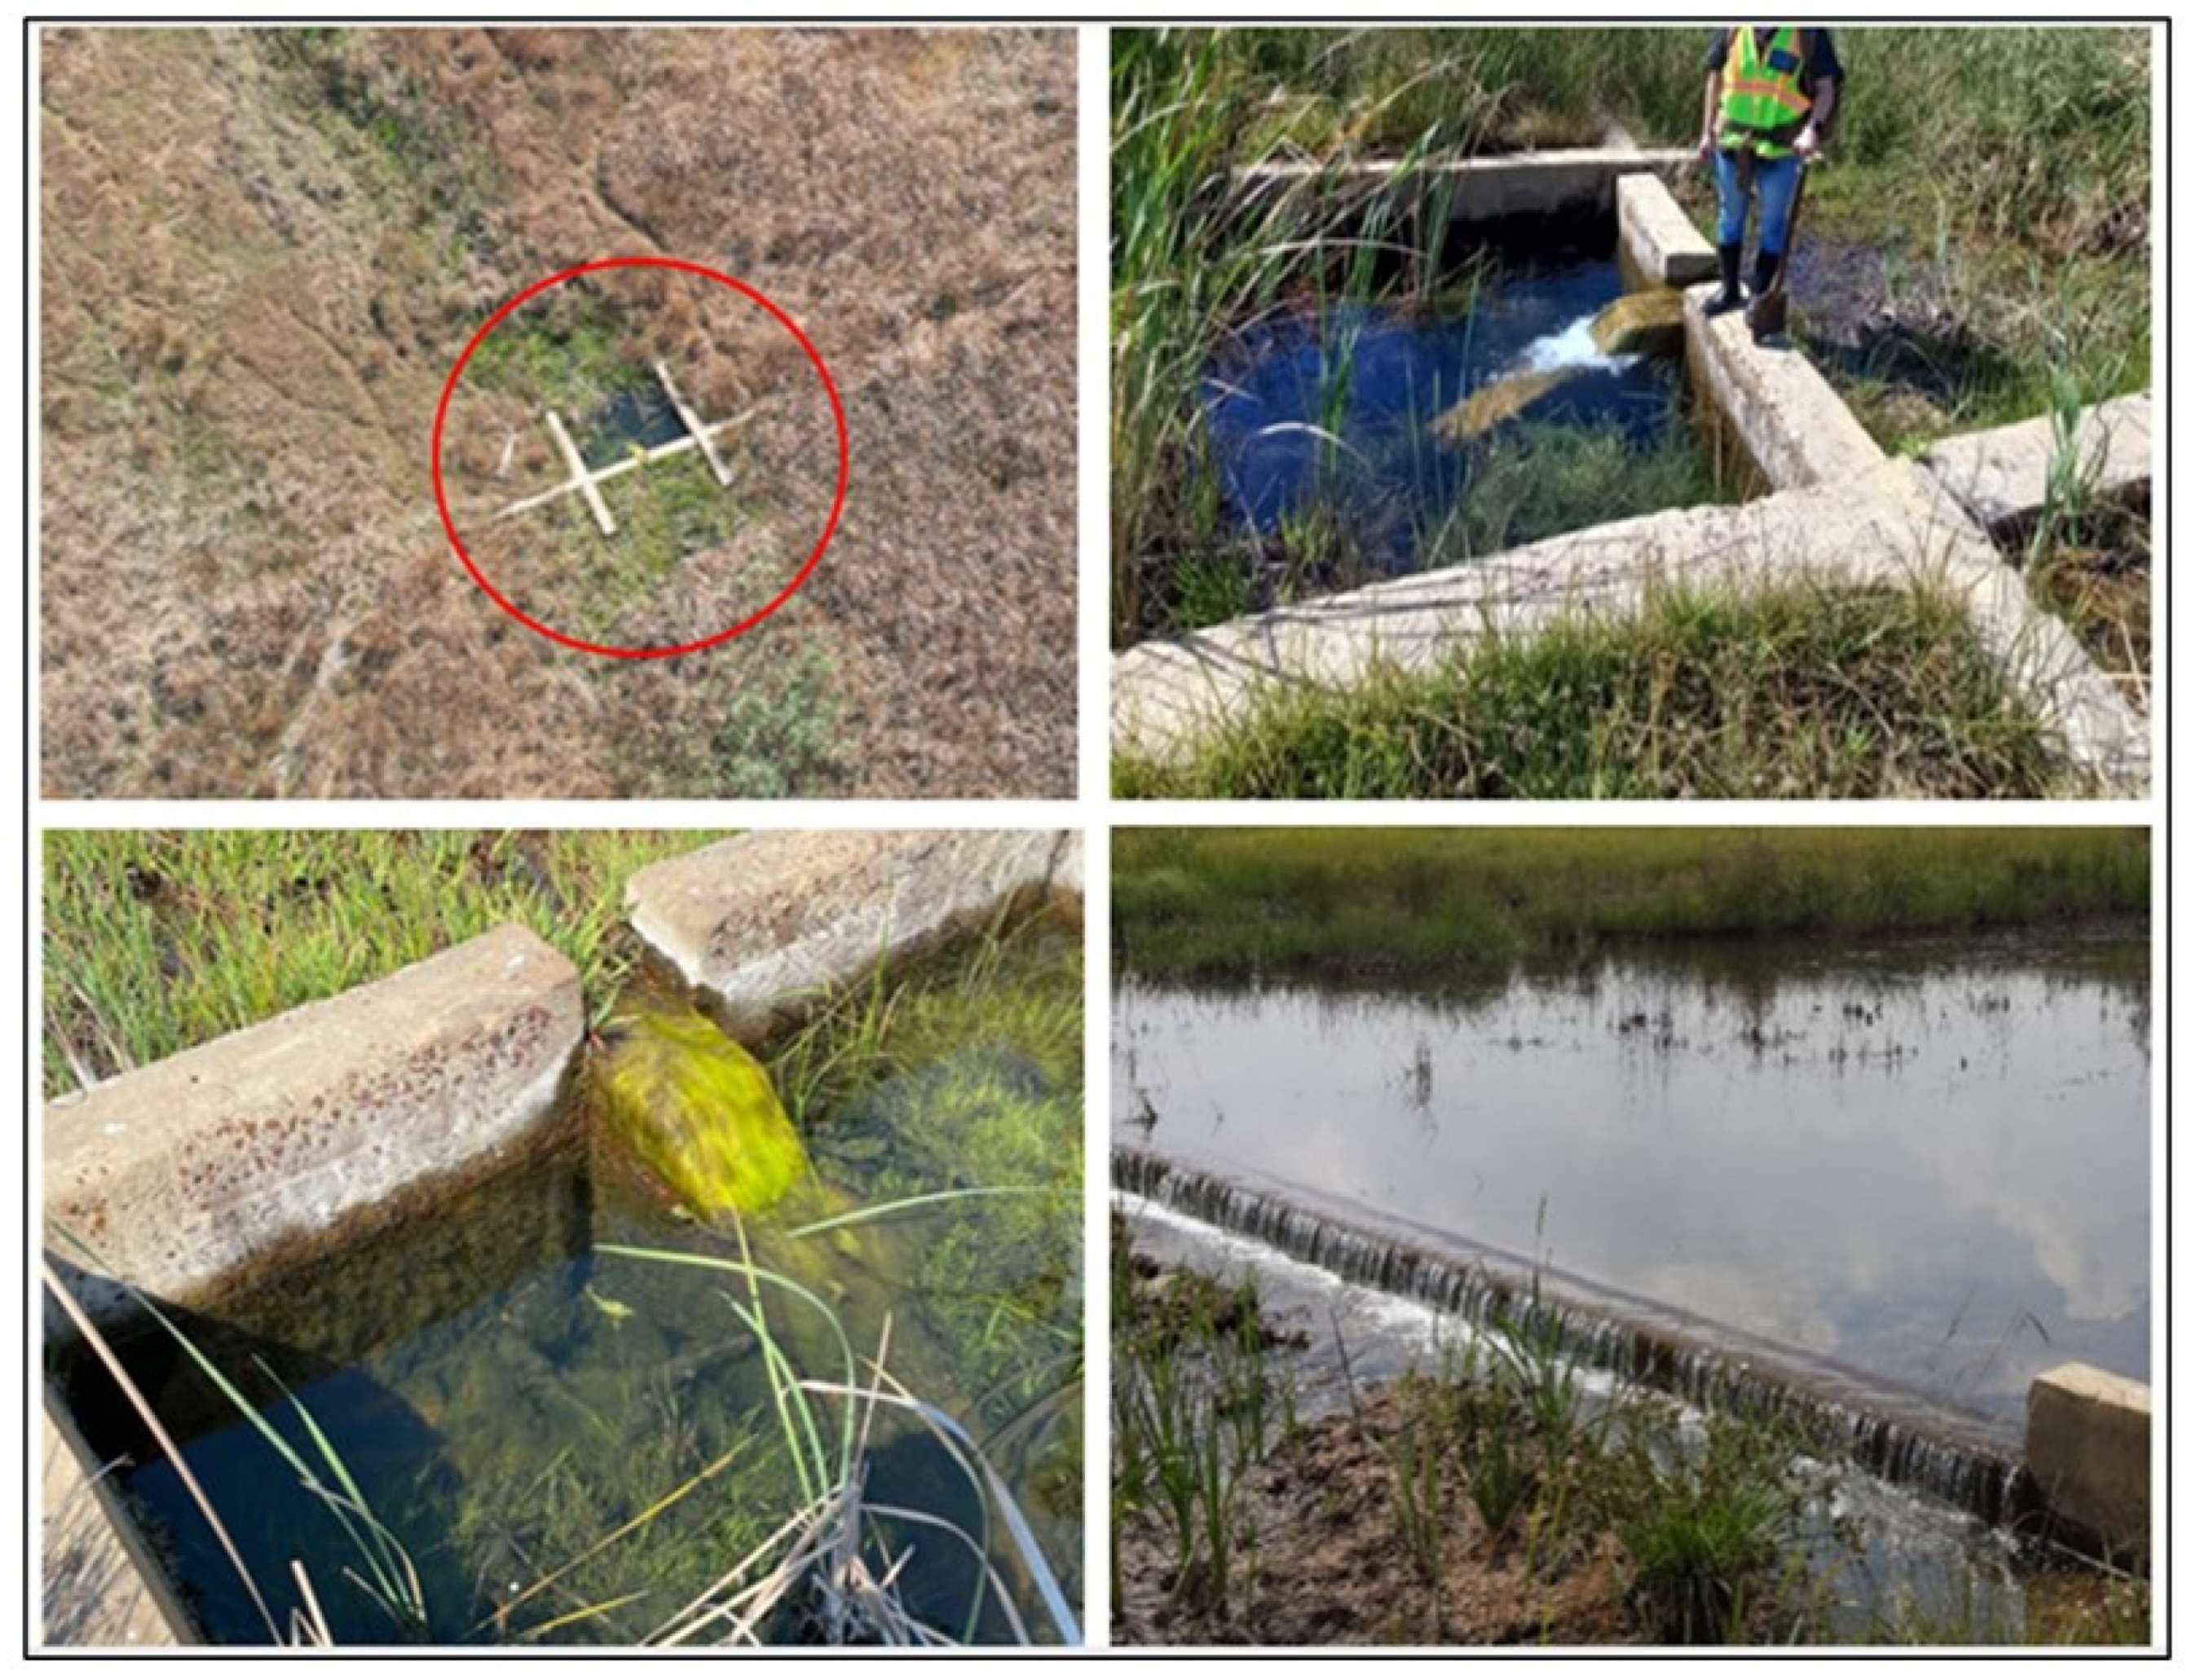
Figure 3.
Concrete structures and weirs to reduce surface water flow in the ecologically engineered wetland, Zaalklapspruit, Mpumalanga, South Africa (2022).
Figure 3.
Concrete structures and weirs to reduce surface water flow in the ecologically engineered wetland, Zaalklapspruit, Mpumalanga, South Africa (2022).
Figure 4.
Relationship between mean OC %, OM %, ORP, and pH in the bottom sediment of each site in the dry season (May 2022).
Figure 4.
Relationship between mean OC %, OM %, ORP, and pH in the bottom sediment of each site in the dry season (May 2022).
Figure 5.
Percentage of clay, silt, and sand in the bottom sediment of each site in the dry season (May 2022).
Figure 5.
Percentage of clay, silt, and sand in the bottom sediment of each site in the dry season (May 2022).
Figure 6.
Light microscopic image of a T. capensis tertiary root that shows orange to brown coloration typically seen with iron plaque formation.
Figure 6.
Light microscopic image of a T. capensis tertiary root that shows orange to brown coloration typically seen with iron plaque formation.
Figure 8.
Scanning electron microscope images of a diverse variety of microorganisms on the tertiary roots of T. capensis. (A) Small round organisms: Micrococcus, long thin organisms: Flavobacterium; (B) Long rods: Pseudomonas, Bacillus, E. coli, SRB, Mycobacterium, shorter rods: Methanogens; (C) Long, big structures: Actinomycetes, small round organisms: Micrococcus; (D) Filamentous, cable-like organism: Desulfobulbaceae.
Figure 9.
Precipitated mineral salts on the surface of dry, unflooded soil in the ecologically engineered wetland.
Figure 9.
Precipitated mineral salts on the surface of dry, unflooded soil in the ecologically engineered wetland.
Figure 10.
Schematic explanatory representation of the pathways and receptors of AMD contaminants in an ecologically engineered wetland. (1) AMD effluent enters the wetland surface water from an abandoned coal mine upstream; (2) Ecological engineered infrastructure reduces surface water flow; (3) Metal and sulphur compounds are adsorbed or absorbed by periphyton species or attracted to OM in the sediment layer, and increase sediment pH and ORP; (4) OM and O2 is released from the roots; (5) Increased ORP and pH promotes sorption and precipitation of elements; (6) Microbial reduction and oxidation of metals and sulphur compounds occurs in the desirable rhizosphere environment; and (7) Mineral precipitate remains on the unflooded wetland soil when surface water evaporates.
Table 1.
Sampled substrates and the corresponding analytical method used for each assessment.
Table 1.
Sampled substrates and the corresponding analytical method used for each assessment.
| Wetland substrate |
Assessment |
Analytical method |
| Surface water |
Physical and chemical characteristics |
Electrometric, conductimetric, inductively coupled plasma (ICP) spectrometry |
| Bottom sediment |
Elemental composition |
X-ray fluorescence (XRF) |
| Sediment texture analysis |
Pipette method for sediment texture analysis |
| Microbiological diversity |
16s RNA sequencing |
| Macrophyte roots and periphyton |
Metal adsorption and absorption |
Inductively coupled plasma optical emission spectroscopy (ICP-OES) |
| Unflooded soil precipitate |
Mineralogy |
X-ray fluorescence (XRF) |
Table 2.
Average physicochemical properties of the surface water at each site and the percentage change from the inflow (S1) to the far middle (S3) of the wetland.
Table 2.
Average physicochemical properties of the surface water at each site and the percentage change from the inflow (S1) to the far middle (S3) of the wetland.
| Parameter |
Unit |
S1 |
S2 |
S3 |
Change (S1:S3) |
% Change (S1:S3) |
| pH |
– |
3.90 |
3.84 |
7.18 |
+3.28 |
84.10 |
| Alkalinity |
mg/ℓ CaCO3
|
22.00 |
<5.00 |
143.00 |
+121.00 |
550.00 |
| Electrical conductivity (EC) |
mS/m |
178.6 |
180.50 |
152.10 |
−26.5 |
14.84 |
| Total dissolved solids (TDS) |
mg/ℓ |
1196.62 |
1209.35 |
1019.07 |
−177.5 |
14.84 |
| Dissolved organic carbon (DOC) |
mg/ℓ |
5.18 |
5.17 |
16.00 |
+10.82 |
208.88 |
| Aluminium (Al) |
mg/ℓ |
1.60 |
1.80 |
<0.01 |
−1.59 |
99.38 |
| Iron (Fe) |
mg/ℓ |
0.33 |
0.58 |
0.26 |
−0.07 |
21.21 |
| Manganese (Mn) |
mg/ℓ |
10.80 |
10.90 |
37.10 |
+26.30 |
243.52 |
| Sulphate (SO42−) |
mg/ℓ |
1310.00 |
579.00 |
774.00 |
−536.00 |
40.07 |
Table 3.
Bottom sediment characteristics of each site and student’s t test results to compare inflow (S1) to the far middle (S3) of the wetland.
Table 3.
Bottom sediment characteristics of each site and student’s t test results to compare inflow (S1) to the far middle (S3) of the wetland.
| Sediment characteristic |
Unit |
Average concentration |
Student’s t test (S1; S3) |
| S1 |
S2 |
S3 |
Mean difference |
t |
p Value |
| pH |
– |
6.09 |
6.59 |
6.52 |
−0.43 |
−1.02 |
0.37 |
| Oxidation–reduction potential (ORP) |
mV |
−219.67 |
−206.07 |
−217.30 |
−2.37 |
−0.02 |
0.99 |
| Organic carbon (OC) |
% |
9.61 |
14.93 |
13.59 |
−3.98 |
−0.83 |
0.49 |
| Organic matter (OM) |
% |
16.57 |
25.74 |
23.43 |
−6.86 |
−0.83 |
0.49 |
| Clay |
% |
46.29 |
45.25 |
27.19 |
19.10 |
7.00 |
0.00 |
| Silt |
% |
13.65 |
16.77 |
8.35 |
5.30 |
3.62 |
0.02 |
| Sand |
% |
40.06 |
37.97 |
64.47 |
−24.41 |
−8.20 |
0.00 |
| Aluminium (Al2O3) |
wt % |
5.19 |
5.87 |
4.55 |
0.64 |
1.29 |
0.29 |
| Iron (Fe2O3) |
wt % |
4.36 |
4.79 |
4.41 |
−0.05 |
−0.08 |
0.94 |
| Manganese (MnO) |
wt % |
0.06 |
0.03 |
0.07 |
−0.02 |
−2.24 |
0.11 |
| Sulphur (SO3) |
wt % |
0.64 |
0.56 |
0.63 |
0.00 |
0.21 |
0.85 |
Table 4.
Average concentration (mg/kg) of Al, Fe and Mn on the root surface (adsorption) and in the root tissue (absorption) of T. capensis, between sites—Student’s t test results to compare the inflow site (S1) to the far middle (S3) of the wetland.
Table 4.
Average concentration (mg/kg) of Al, Fe and Mn on the root surface (adsorption) and in the root tissue (absorption) of T. capensis, between sites—Student’s t test results to compare the inflow site (S1) to the far middle (S3) of the wetland.
| Element |
Unit |
Average concentration |
Student’s t test (S1; S3) |
| S1 |
S2 |
S3 |
Mean difference |
t |
p Value |
| Adsorption |
| Aluminium (Al) |
(mg/kg) |
1.77 |
0.56 |
0.22 |
1.55 |
14.98 |
0.00 |
| Iron (Fe) |
(mg/kg) |
0.54 |
0.72 |
0.57 |
−0.03 |
−0.55 |
0.62 |
| Manganese (Mn) |
(mg/kg) |
2.24 |
14.09 |
7.66 |
−5.42 |
−257.72 |
0.00 |
| Absorption |
| Aluminium (Al) |
(mg/kg) |
192.87 |
154.82 |
178.74 |
14.13 |
8.92 |
0.00 |
| Iron (Fe) |
(mg/kg) |
174.11 |
487.33 |
364.01 |
−189.90 |
−135.94 |
0.00 |
| Manganese (Mn) |
(mg/kg) |
6.62 |
19.68 |
74.35 |
−67.73 |
−117.96 |
0.00 |
Table 5.
Average concentration (mg/kg) of Al, Fe and Mn on the periphyton surface (adsorption) and in the periphyton tissue (absorption) of K. acidophilum, between sites—Student’s t test results to compare the inflow site (S1) to the far middle (S3) of the wetland.
Table 5.
Average concentration (mg/kg) of Al, Fe and Mn on the periphyton surface (adsorption) and in the periphyton tissue (absorption) of K. acidophilum, between sites—Student’s t test results to compare the inflow site (S1) to the far middle (S3) of the wetland.
| Element |
Unit |
Average concentration |
Student’s t test (S1; S2) |
| S1 |
S2 |
Mean difference |
T |
p Value |
| Adsorption |
| Aluminium (Al) |
(mg/kg) |
0.48 |
0.44 |
0.04 |
0.38 |
0.73 |
| Iron (Fe) |
(mg/kg) |
0.79 |
0.78 |
0.01 |
0.22 |
0.84 |
| Manganese (Mn) |
(mg/kg) |
1.13 |
0.37 |
0.76 |
56.24 |
0.00 |
| Absorption |
| Aluminium (Al) |
(mg/kg) |
170.3 |
38.61 |
131.68 |
572.71 |
0.00 |
| Iron (Fe) |
(mg/kg) |
284.78 |
241.43 |
43.34 |
45.63 |
0.00 |
| Manganese (Mn) |
(mg/kg) |
8.91 |
4.41 |
4.50 |
199.84 |
0.00 |
Table 6.
Average concentration of metal and sulphur compounds in precipitated mineral salts for each site.
Table 6.
Average concentration of metal and sulphur compounds in precipitated mineral salts for each site.
| Element |
Unit |
S1 |
S2 |
S3 |
| Aluminium (Al2O3) |
(wt %) |
1.42 |
1.53 |
1.78 |
| Iron (Fe2O3) |
(wt %) |
1.69 |
1.40 |
1.95 |
| Manganese (MnO) |
(wt %) |
0.10 |
0.10 |
0.08 |
| Sulphur (SO3) |
(wt %) |
18.50 |
18.56 |
13.67 |
