1. Introduction
With the rapid urbanization process worldwide, the intensifying human transformation of the natural environment has inevitably led to a series of environmental geology issues [
1,
2,
3,
4,
5], exacerbating the conflict between humans and the natural environment [
6,
7,
8,
9]. Fine-grained geological information not only serves as a scientific guide for urban planning, construction, and management [
10,
11,
12,
13,
14], but also provides a crucial scientific basis and data foundation for the prevention and control of comprehensive environmental geology issues facing cities [
15,
16,
17,
18,
19]. Three-dimensional (3D) geological modeling, as a widely applied technique [
20,
21,
22,
23,
24,
25], aims to delicately characterize the three-dimensional spatial structure of strata [
26,
27,
28,
29,
30]. However, the accuracy of this modeling relies heavily on the quality of modeling data, the selection of modeling methods, and the complexity of the modeling objects [
31,
32]. Given the complexity of geological background conditions in numerous cities in China, coupled with the relative scarcity of modeling data and the presence of multi-source heterogeneous issues [
33,
34,
35,
36,
37], urban 3D geological modeling, especially for megacities, often poses a significant challenge. This study focuses on the 3D geological structural modeling of Wuhan’s urban development area as a case study, aiming to investigate the utilization of multi-source heterogeneous geological data in constructing a 3D geological structural model for megacities with intricate geological structures.
2. Data and Methods
2.1. Study Area
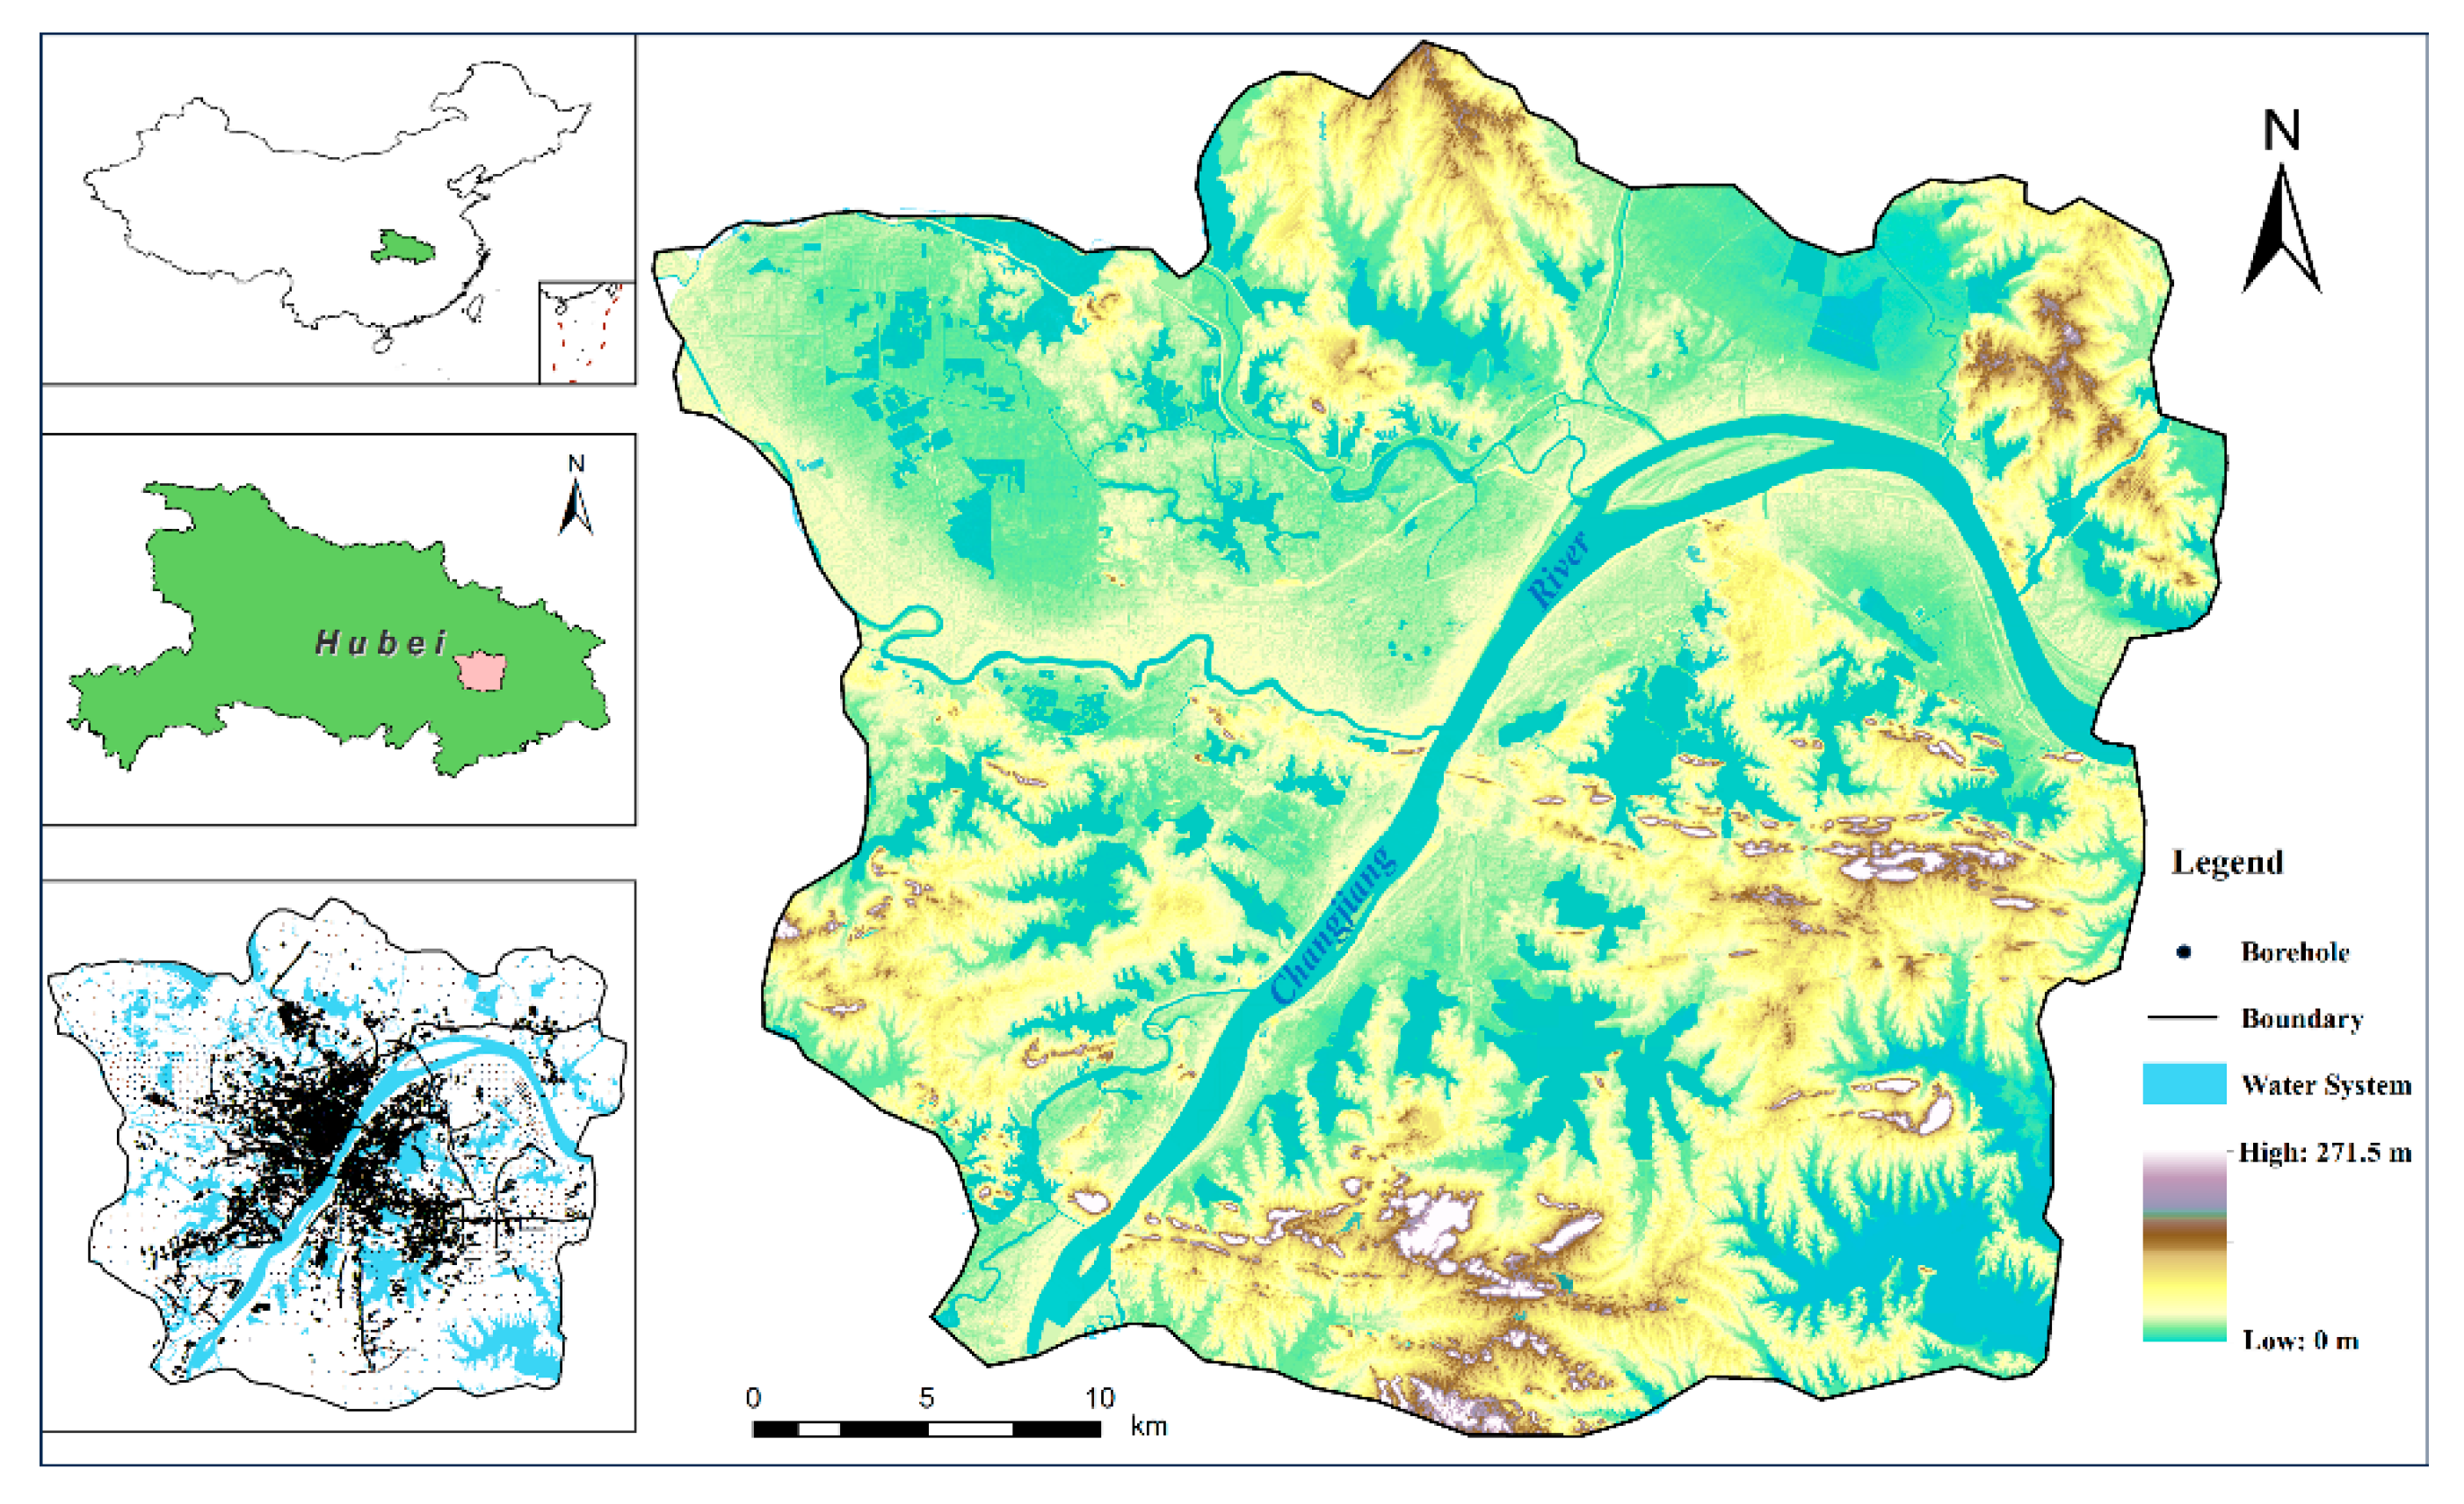
Centrally located in the hinterland of China, Wuhan City is situated in the eastern part of Jianghan Plain in Hubei Province, precisely at the intersection of the Yangtze River and Han River, spanning longitudes 113°41′ to 115°05′E and latitudes 29°58′ to 31°22′N, nestled between the undulating hills of the Dabie Mountains in northeastern Hubei and the Mufu hills in southeastern Hubei. As the urban core, the Wuhan metropolitan development area comprises a total area of 3,400 km² and is primarily characterized by a rolling terrain alternating between hills and plains (
Figure 1).
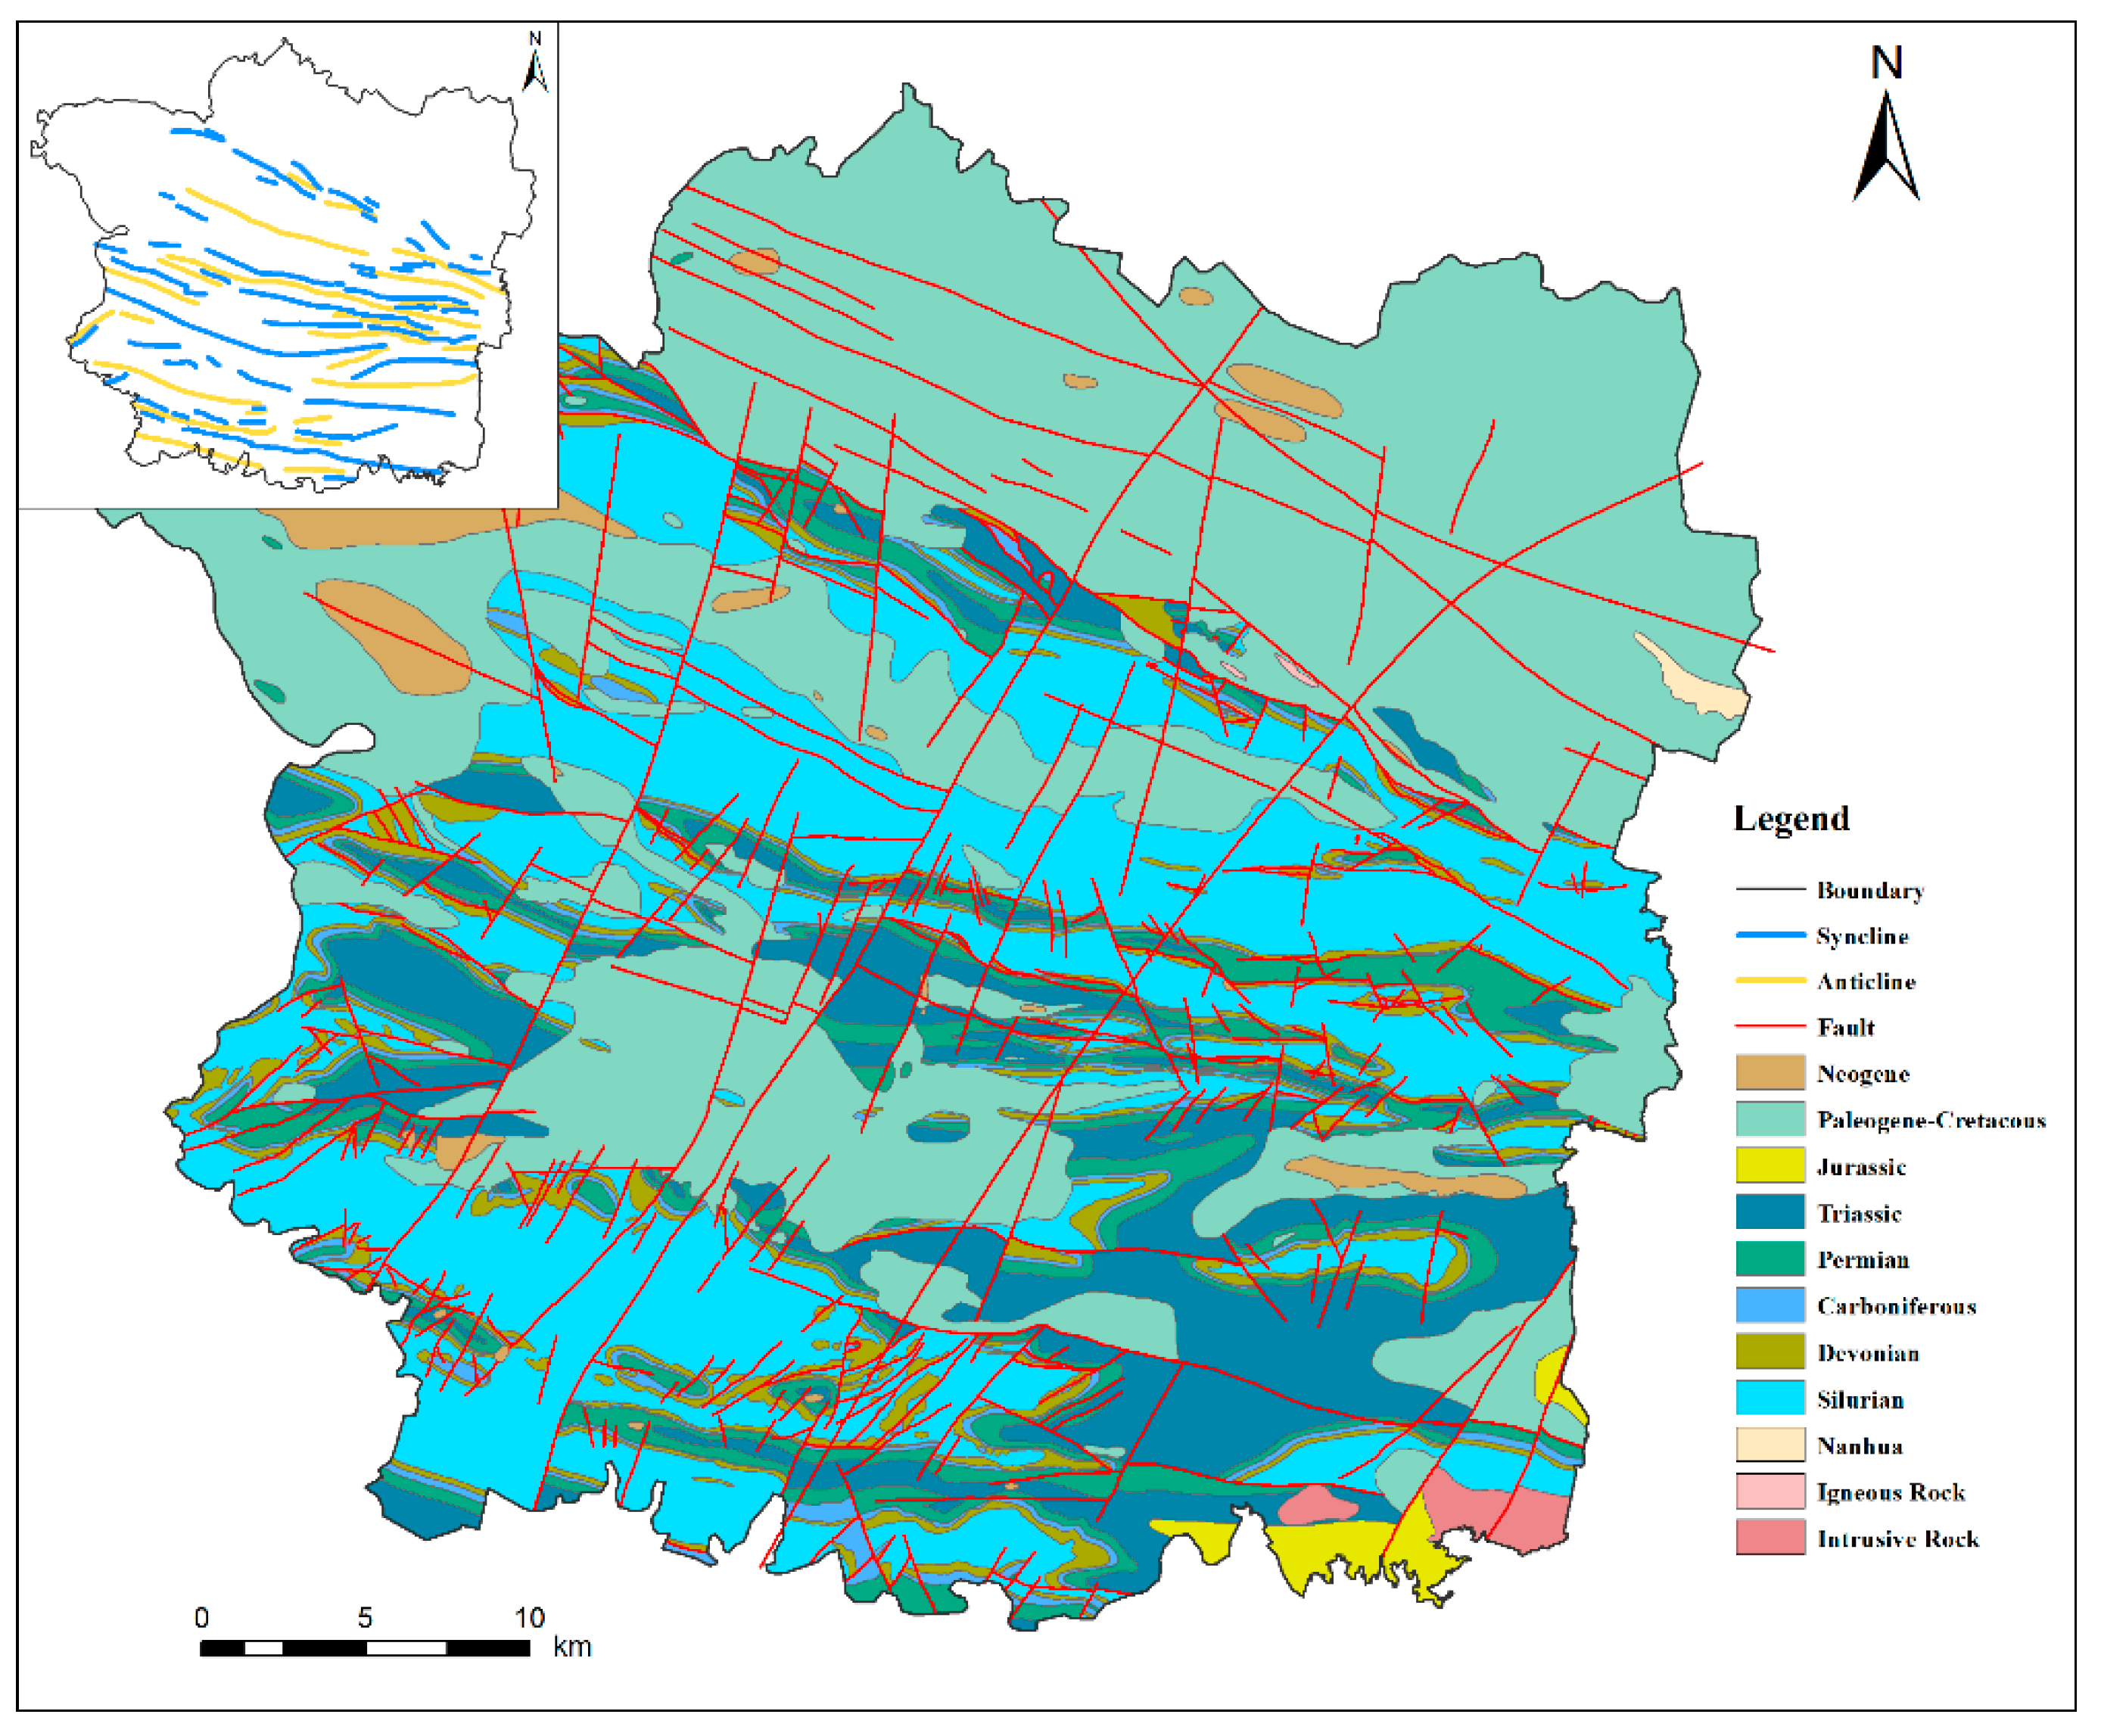
The study area, located at the convergence zone between the Qinling-Dabie orogenic belt and the Yangtze Platform, has experienced a series of geological cycles and multi-stage evolutionary processes. Specifically, the Late Triassic Indo-China orogenic movement significantly shaped the east-west fold framework of the region. Subsequently, the Yanshanian Pacific Rim activities superimposed the northeast-trending fault system, faulted volcanic basins, and intrusive magmatic events. Moreover, the Himalayan intracontinental evolution contributed to the deposition of faults and depression basins, ultimately resulting in the intricate geological structure framework observed in the surveyed region (as illustrated in
Figure 2). Importantly, the neotectonic movement further accentuated the geological diversity within the study area, characterized by substantial variations in the types and thicknesses of Quaternary sediments. This notable variability has given rise to the co-existence of numerous terrace types and landform morphologies in the present-day landscape.
2.2. Strata
The study area consists of two large stratigraphic subdivisions, delineated by the Xiangguang Fault. To the north, the region surrounding Fenghuangshan belongs to the Qinling-Dabie stratigraphic subregion, characterized by a comparatively uncomplicated stratigraphy, with the exposure of strata from the Nanhua system, Cretaceous-Paleogene system, and Quaternary system. South of the fault, which comprises the majority of the surveyed territory, lies the Daye stratigraphic subregion of the Yangtze stratigraphic region. This subregion exhibits a broad exposure of stratum spanning the Silurian, Devonian, Carboniferous, Permian, Triassic, Jurassic, Cretaceous, and Paleogene epochs. Overall, The Quaternary stratum are widely distributed on the surface, and the bedrock outcrops are generally sporadic, with the exception of the Silurian, Devonian, and Permian systems, which are relatively widely distributed, and most of the stratigraphic strata are only sporadically exposed in very small quantities and incompletely exposed (
Figure 2).
Given the exceptionally thin Quaternary unconsolidated strata in the study area, coupled with the similarity in genesis and lithofacies characteristics across different Quaternary epochs, the modeling of Quaternary strata in this research is confined to four “Epoch”-level strata: the Holocene, Late Pleistocene, Middle Pleistocene, and Early Pleistocene, due to the insufficient modeling data to achieve a “Formation”-level refinement.
With regard to the bedrock, considering the intricate geological tectonic evolution history in the study area and the significant variations in genesis, spatial structural characteristics, and lithology among different “Formation”-level strata, the modeling of bedrock strata necessitates a refinement to the “Formation”-level to comprehensively capture the spatial structural features of the bedrock strata in the entire study area. This refinement will further facilitate the provision of detailed 3D geological information for urban geological investigations and comprehensive environmental geological simulations in the study area.
Through a thorough analysis of the geological tectonic evolution history, stratigraphic spatial characteristics, and a synthesis of diverse modeling data including boreholes, geological maps, and geological cross-sections in the study, we have identified a total of 26 strata spanning different geological epochs that will be included in the 3D geological structure modeling of this area. These comprise 4 Quaternary strata and 22 bedrock strata, with the specific stratigraphic sequence outlined in
Table 1.
2.3. Data
the current research on 3D geological modeling primarily centers on investigating and developing methodologies for extracting geological information from various geological datasets and effectively presenting it through advanced 3D visualization techniques. Consequently, the accuracy of 3D geological model is inherently dependent on the quality and quantity of the modeling data. For Urban 3D Geological Modeling, especially on a large scale, the utilization of various types of geological data is often necessary to construct high-precision models. This, however, leads to the challenge of multi-source and heterogeneous modeling data, which poses a significant limitation in 3D geological modeling research.
Within this study, the data types utilized for modeling include borehole data, geological maps, and geological sections, originating from different geological departments and professional domains. Additionally, there are significant variations in the modeling data relied upon by different modeling objects. For instance, the 3D modeling of Quaternary strata primarily depends on 236,000 borehole records and DEM data, whereas bedrock modeling heavily rely on geological maps and geological section data. This is primarily due to the fact that borehole data, primarily derived from engineering exploration, is designed to penetrate the Quaternary loose sedimentary strata and expose the bedrock as a load-bearing layer. Therefore, these borehole data often lack comprehensive information regarding bedrock strata, rendering them unsuitable for bedrock modeling and limiting their usage to verification or calibration purposes.
More generally, the data for bedrock modeling primarily consists of geological maps and sections from various professional fields, such as basic geology, hydrogeology, tectonic geology, and geophysical exploration.
Table 1 outlines the specific types of modeling data relied upon by each modeling object in this study.
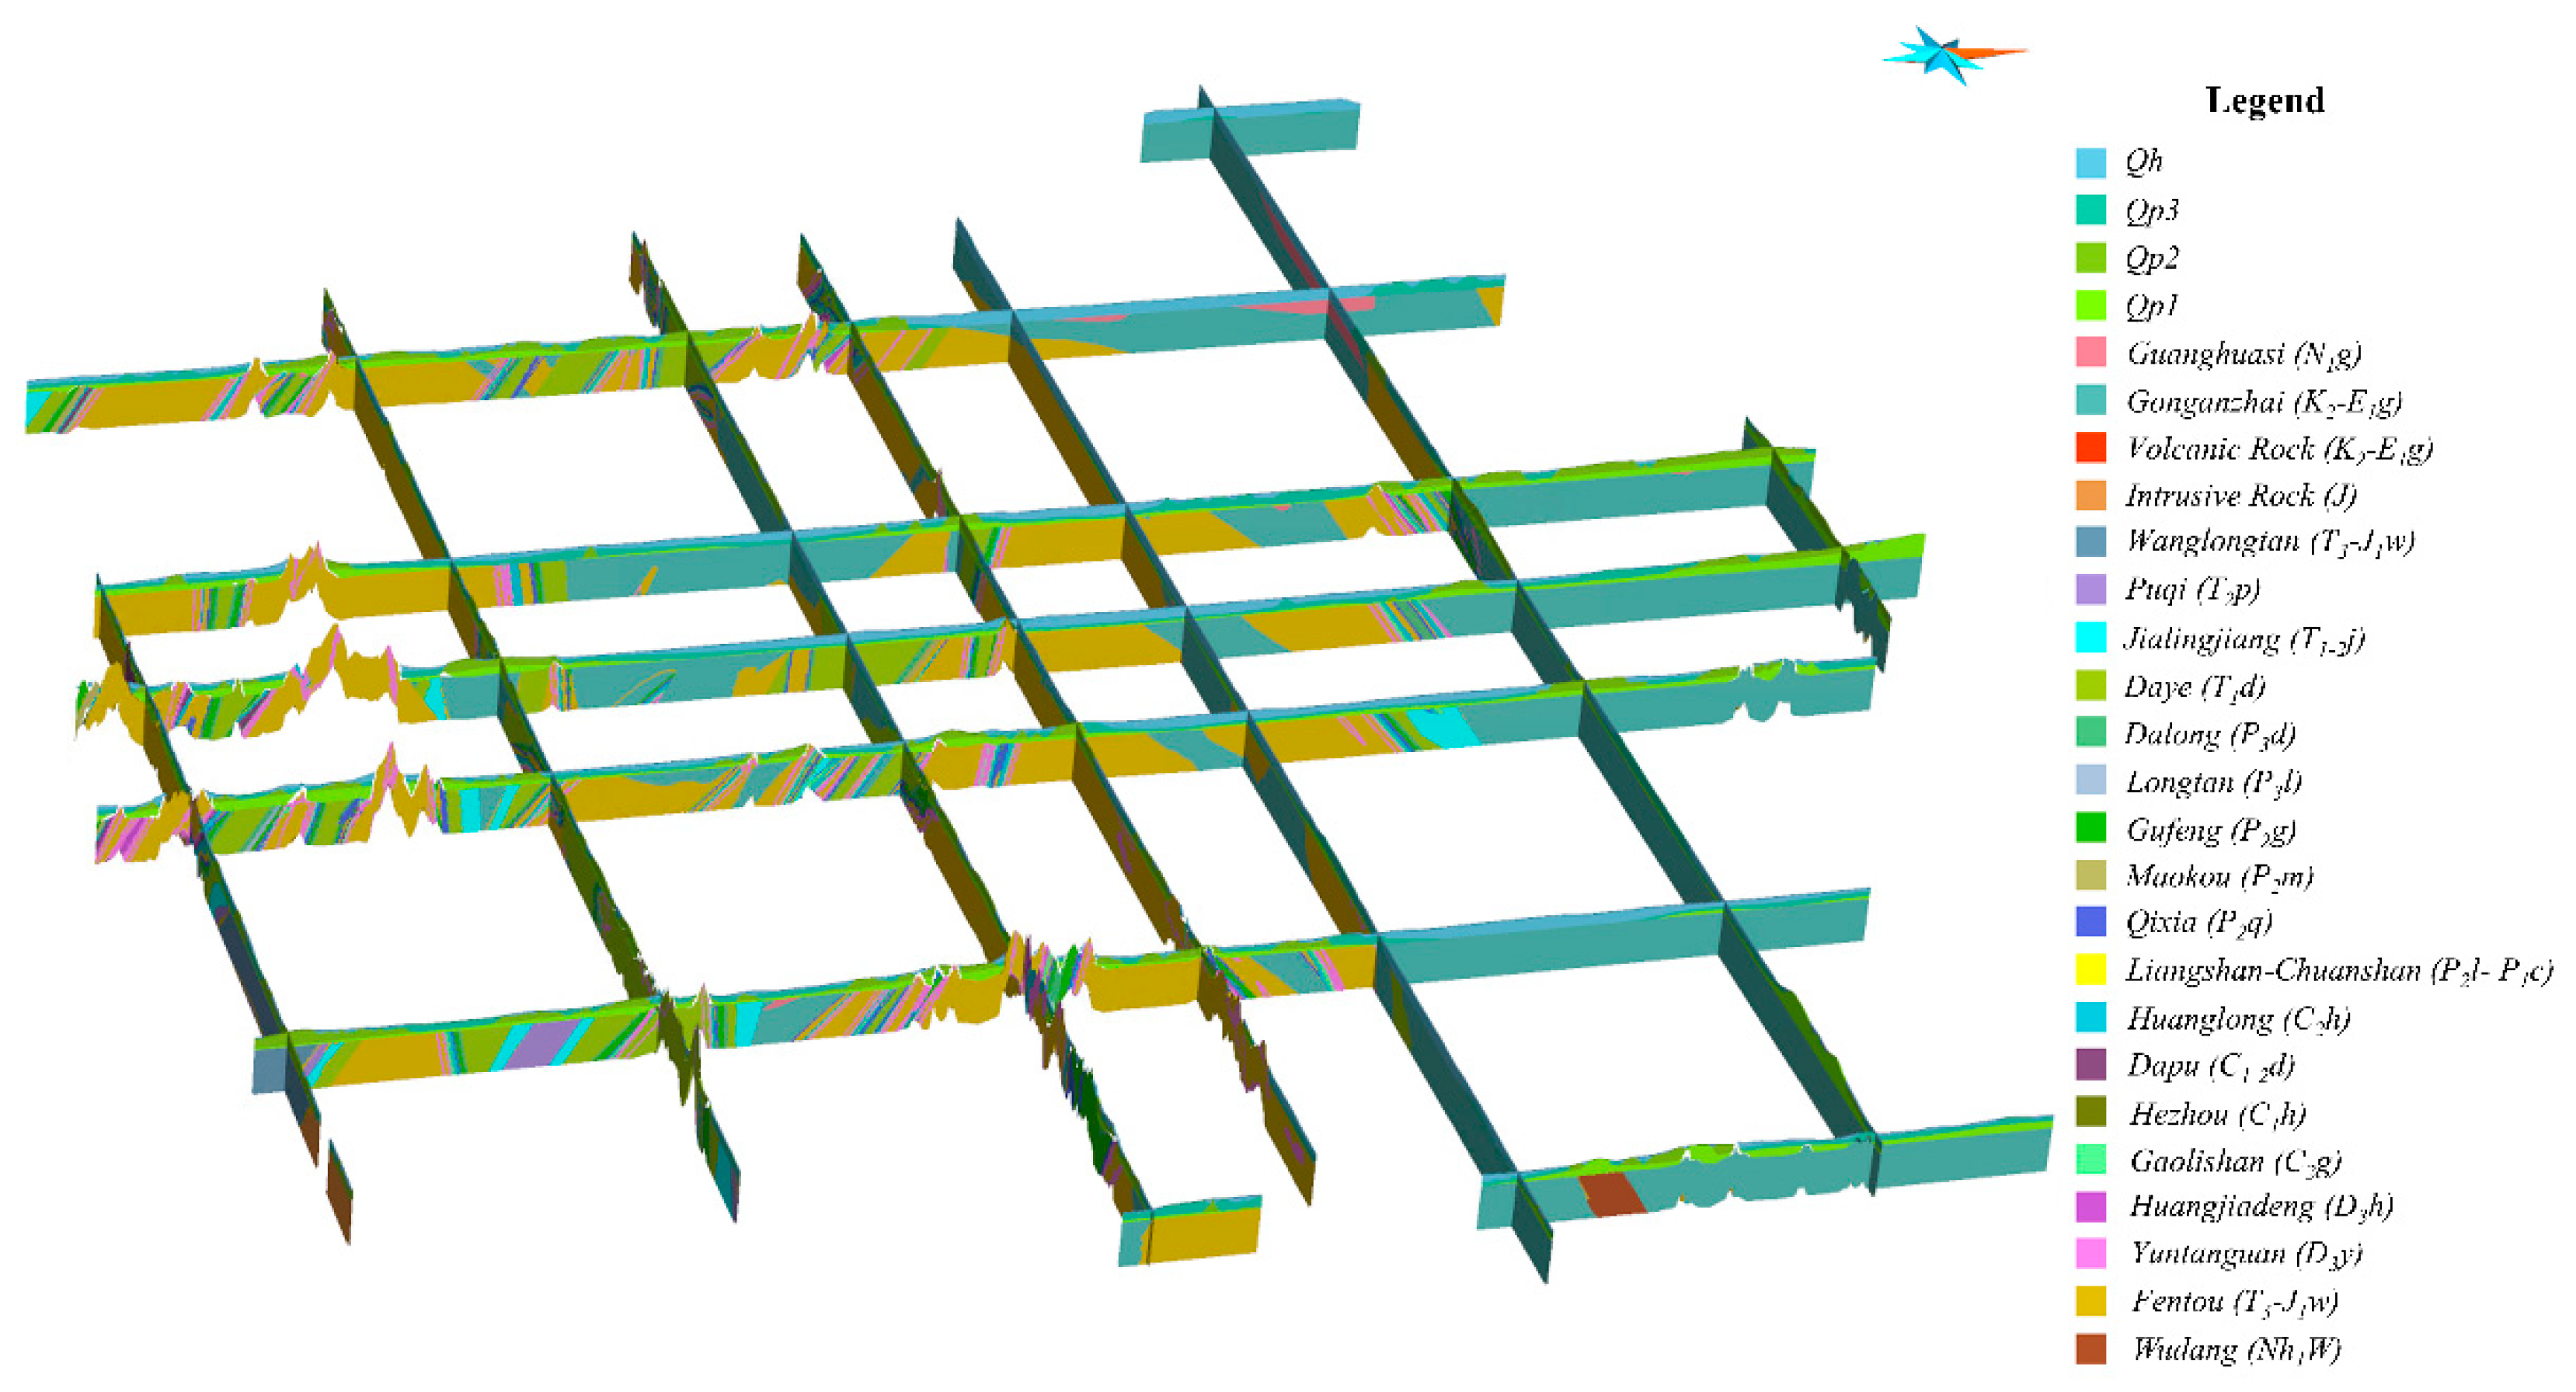
According to the predefined 3D geological structure modeling scheme for Wuhan metropolitan development area, a comprehensive standardization and reorganization process was conducted on the multi-source heterogeneous modeling data, resulting in modeling data with a unified data structure as shown in
Figure 3.
2.4. 3D Geological Modeling Scheme
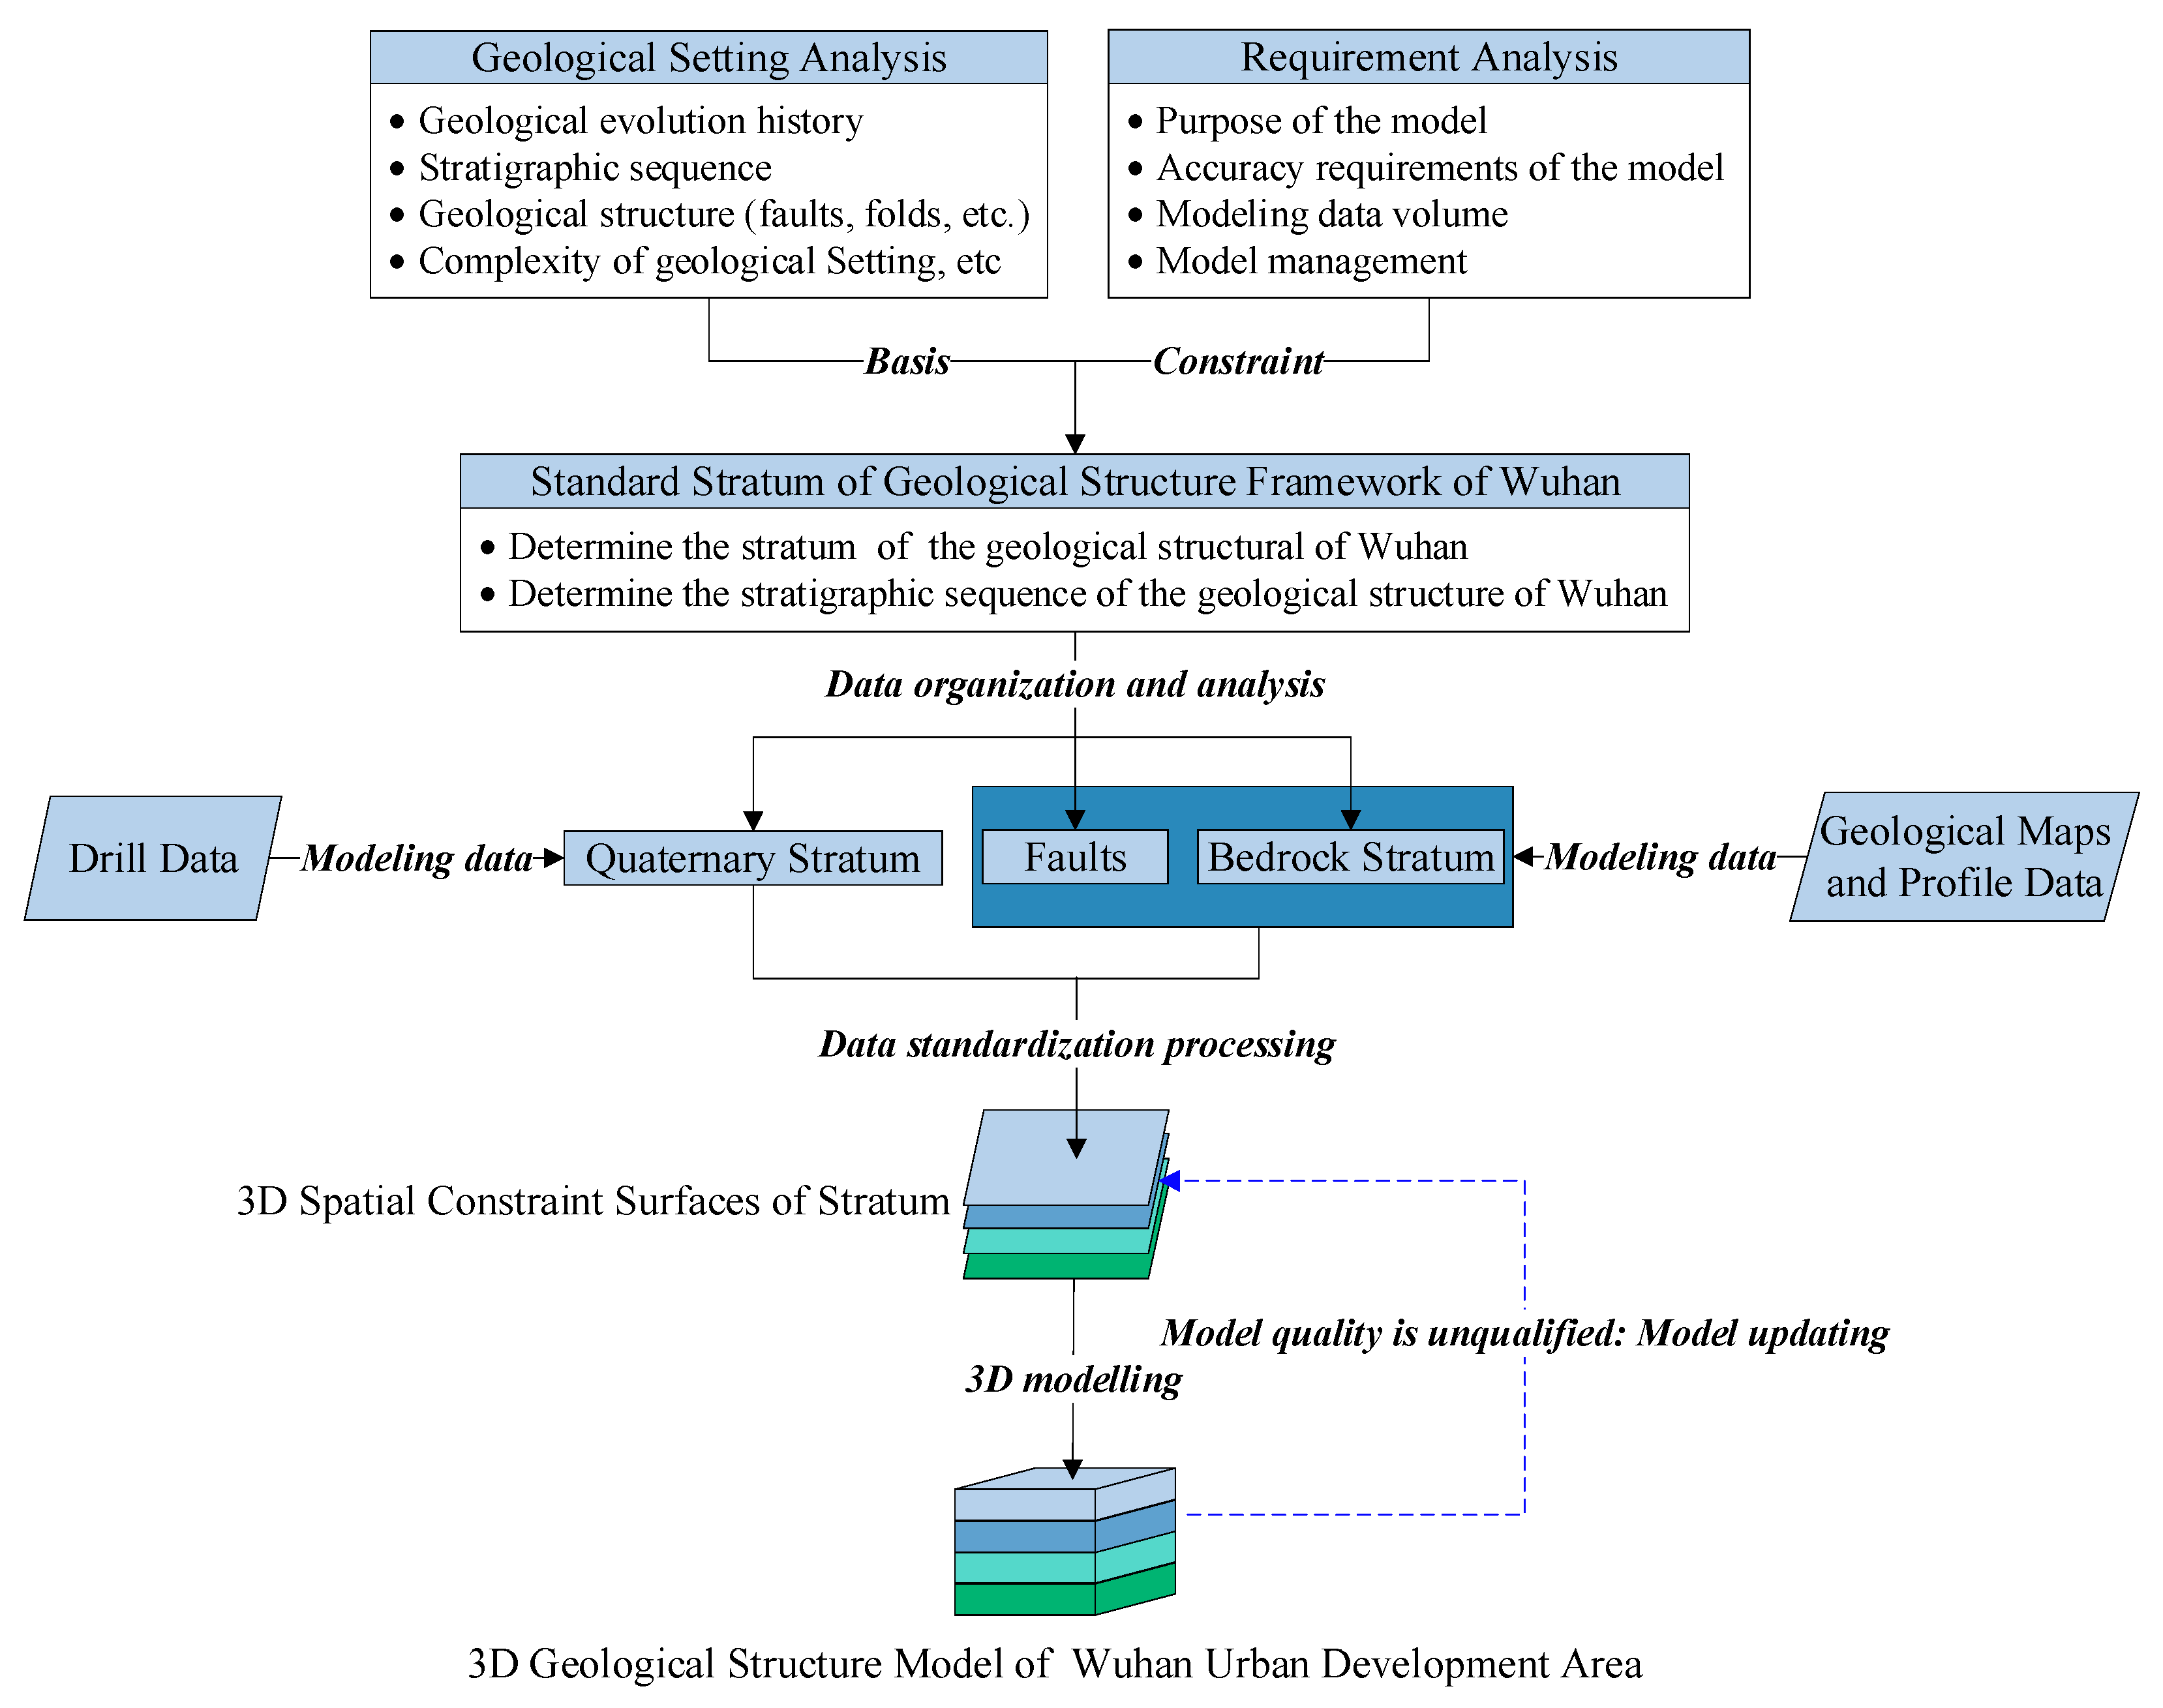
the primary approach of constructing the 3D geological structure model of Wuhan metropolitan development area is to use the large-scale stratigraphic structure as the constraint framework to progressively constrain the sub-scale stratigraphic structure. Initially, analyzing the geological evolution history of the study area to determine the stratigraphic units and stratigraphic sequences of the fundamental geological framework; using this as the constraint framework, the spatial structural variations within the stratigraphy of the fundamental geological framework are analyzed to identify the stratigraphic units and sequences of the sub-structures, thereby establishing the standard stratigraphy for 3D geological modeling in Wuhan metropolitan development area.
Initially, an in-depth analysis of the geological evolution history of the study area is conducted to establish the fundamental geological framework, encompassing stratigraphic units and stratigraphic sequences. This framework serves as the initial constraint, upon which the variations within the stratigraphy of the foundational geology are analyzed to determine the stratigraphic units and sequences of secondary geological structures. This process culminates in the formulation of a standardized stratigraphy for 3D geological modeling in Wuhan. using this as the basis of the modeling, through the integration of the drilling data, the profile data, and the stratigraphic maps, obtain the modeling constraint data for each stratum (
Figure 3). The optimal scheme for 3D geological structure modeling of Wuhan metropolitan development area is detailed in
Table 2.
The 3D geological modeling area in Wuhan metropolitan development area spans approximately 3,400 km² with a vertical modeling depth of 200 meters, with a vertical modeling depth of 200 meters and a horizontal/vertical ratio of 17,000, representing a typical ultra-thin 3D geological modeling type. Notably, the Quaternary loose strata are mainly distributed in the depth range of 50m below the surface.
Therefore, to precisely depict the spatial variation characteristics of the strata, this study employs the SGrid modeling approach of GOCAD. Considering that the thinnest bedrock strata in the study area is less than 100 meters thick, the modeling grid standard is determined as 50×50×0.5m3 to precisely capture the 3D spatial structure of the bedrock. The specific modeling scheme is shown in
Figure 4.
- i.
Analyze the geological and tectonic evolution history of Wuhan, determine the basic geological framework of the study area, and use it as a constraint framework to determine the standard stratigraphy for 3D geological structure modeling of Wuhan metropolitan development area;
- i.
ii. Organize and analyze geological data of different specialties, types and data structures (including drilling data, basic geological profile, hydrogeological profile, and geophysical exploration data, etc.), and obtain computer-recognizable modeling constraint data for each stratum in a uniform data format;
- i.
iii. Utilize standardized stratigraphic constraint data as modeling data, adopt GOCAD as the modeling platform, and employ the Sgrid modeling scheme to conduct 3D geological structure modeling for Wuhan metropolitan development area;
- i.
iv. According to the distribution density and unevenness of the boreholes, 10% of the boreholes are proportionally selected from the entire research area as model validation boreholes to participate in the model quality assessment, so as to check and optimize the 3D geological structure model.
3. Results
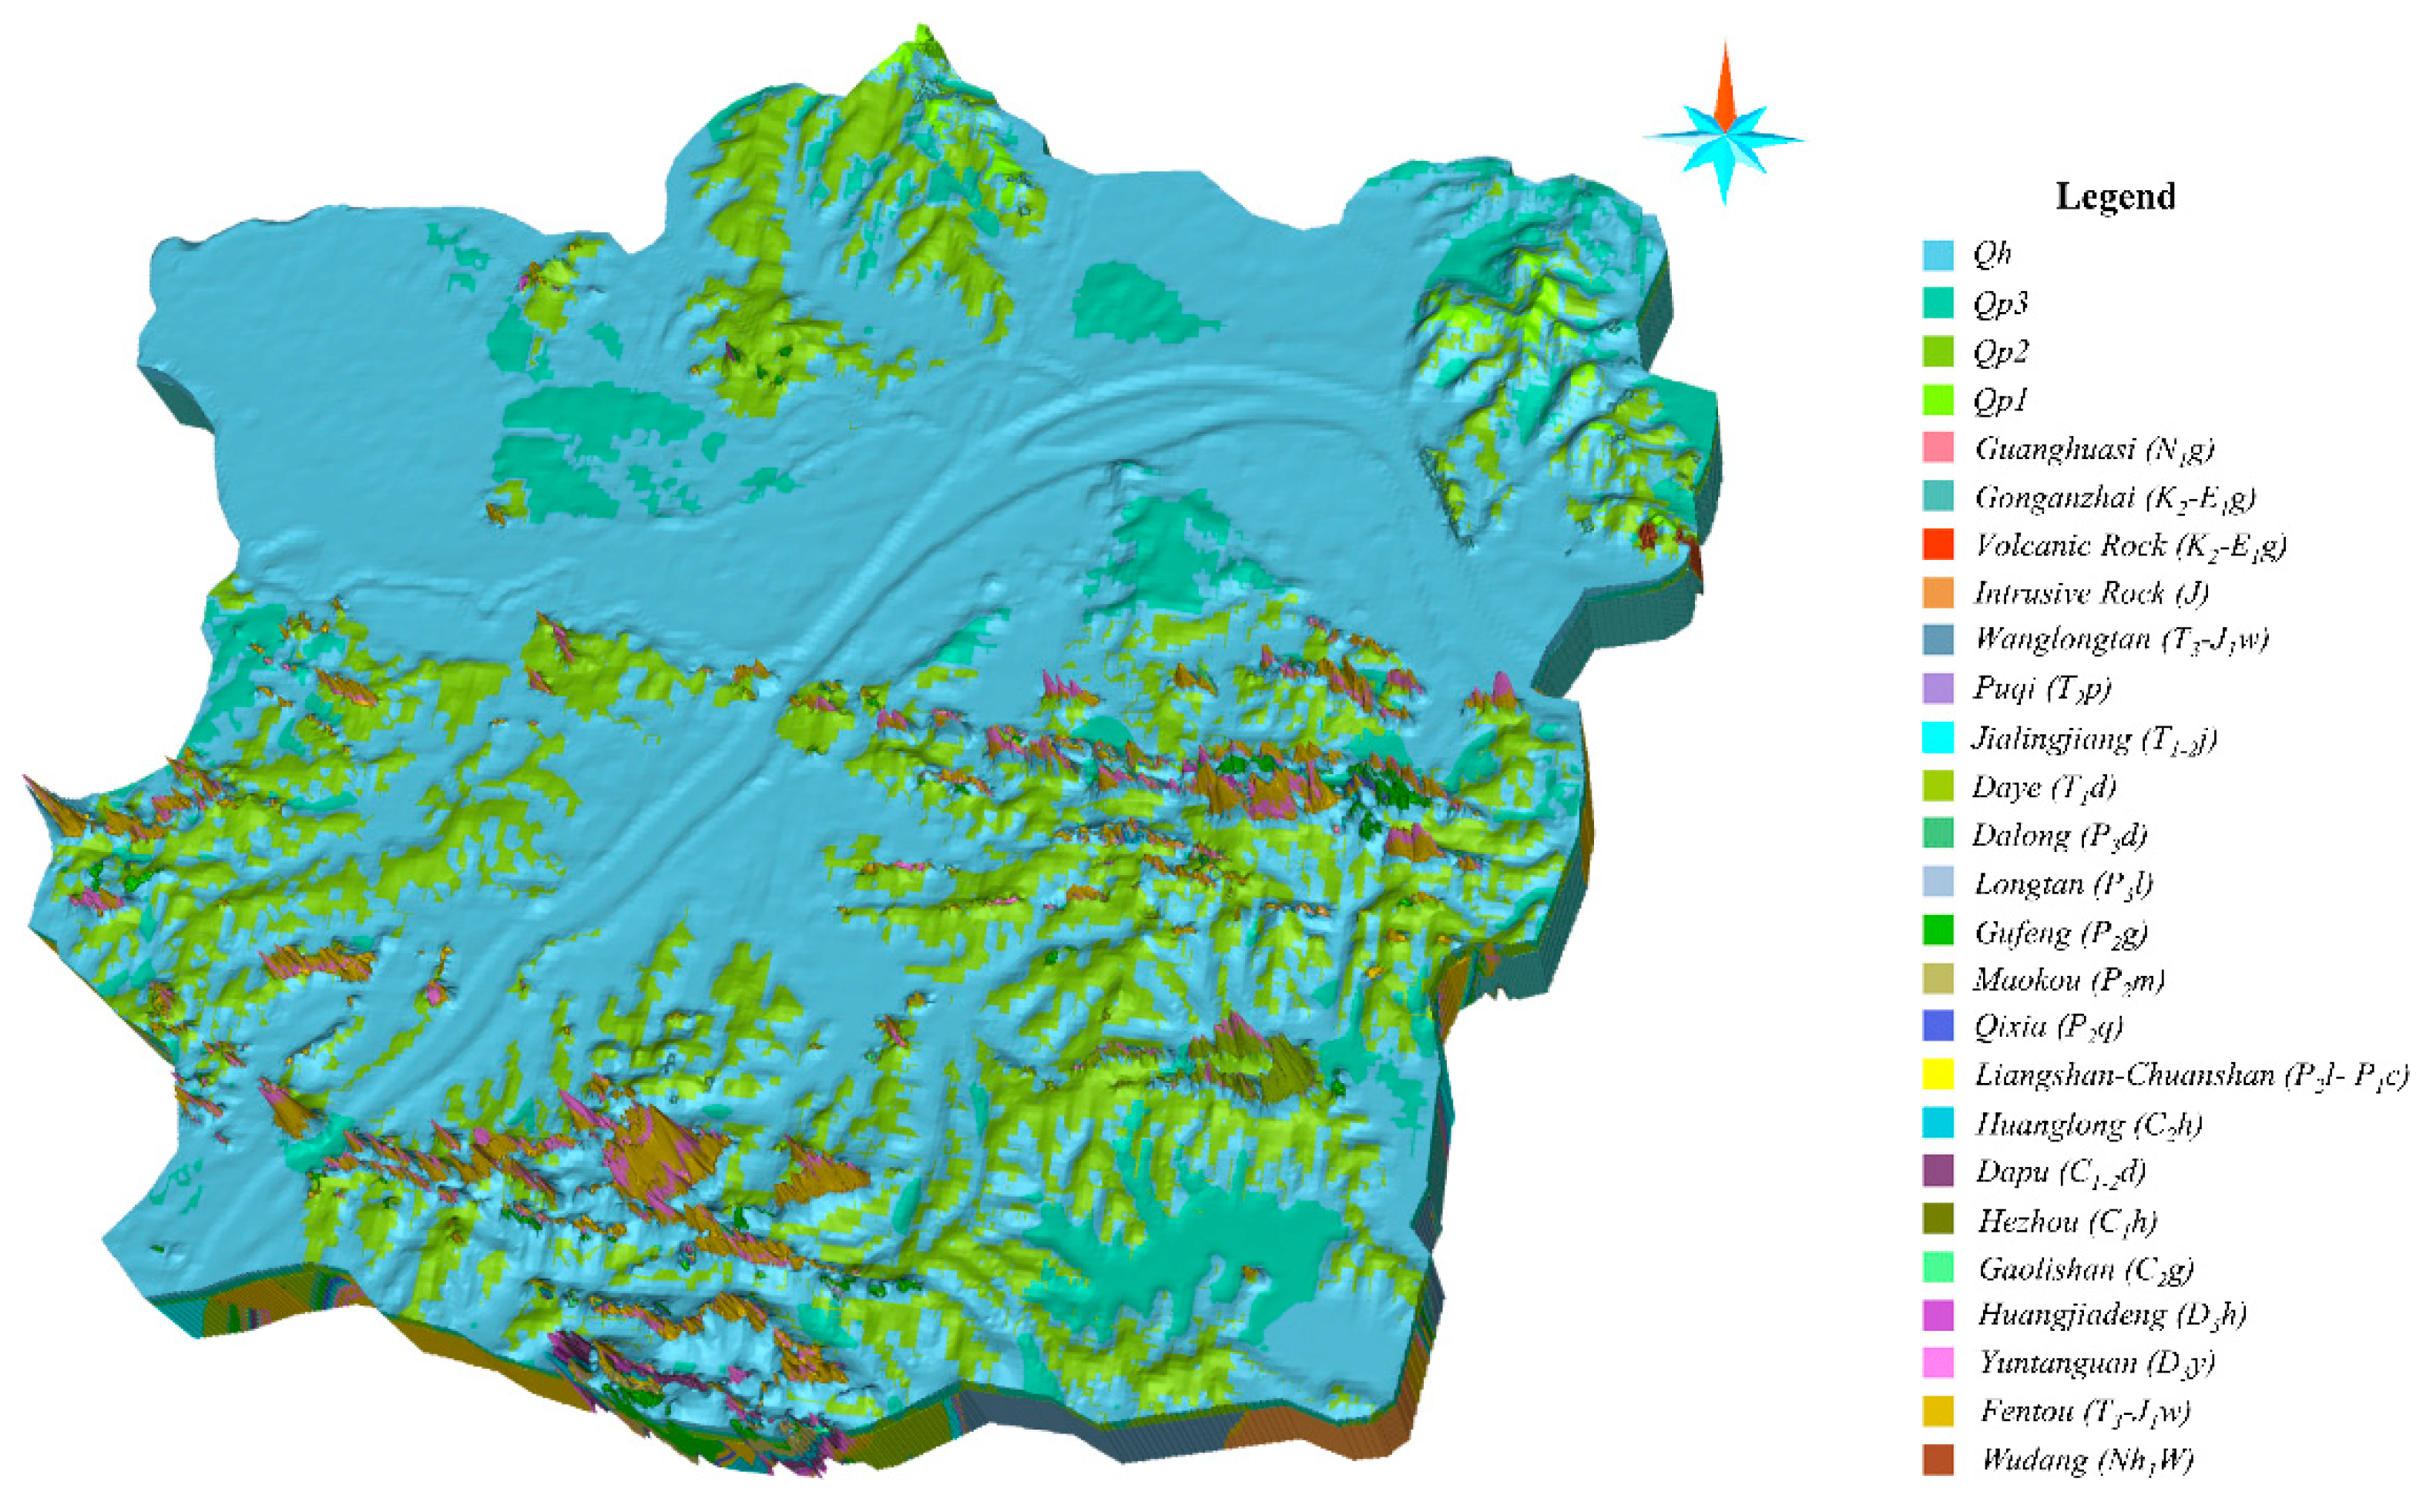
The 3D geological structure model of Wuhan urban development area comprises 26 strata, 195 faults, and 37 folds, with a total grid number of 573 million and a total volume of 63.4G, as shown in
Figure 5.
3.1. Strata
According to the model, the loose deposits of the Quaternary Holocene, Late Pleistocene, and Middle Pleistocene in the study area predominantly cover all regions, excluding bedrock mountains and water systems, while Early Pleistocene loose deposits are only sporadically distributed in mountainous gullies. Specifically, the Late Pleistocene strata are concentrated on terraces and fault basins at approximately 60 meters in elevation, while the Middle Pleistocene strata occupy ridges ranging from 30 to 45 meters. The Early Pleistocene strata are typically found on second-order terraces between 25 and 30 meters. This distribution pattern reveals that the Quaternary loose sedimentary strata clearly controlled by the geotectonics. Further in-depth analysis reveals the existence of crucial erosional interfaces or discontinuities within the Quaternary loose deposits in the study area. Notably, the sedimentary interfaces of these strata align nearly perpendicularly with the weathering and erosion surfaces of the bedrock strata. This observation suggests that the study area has undergone numerous episodes of differential uplift and subsidence movements, varying in magnitude, since the inception of neotectonic activity.
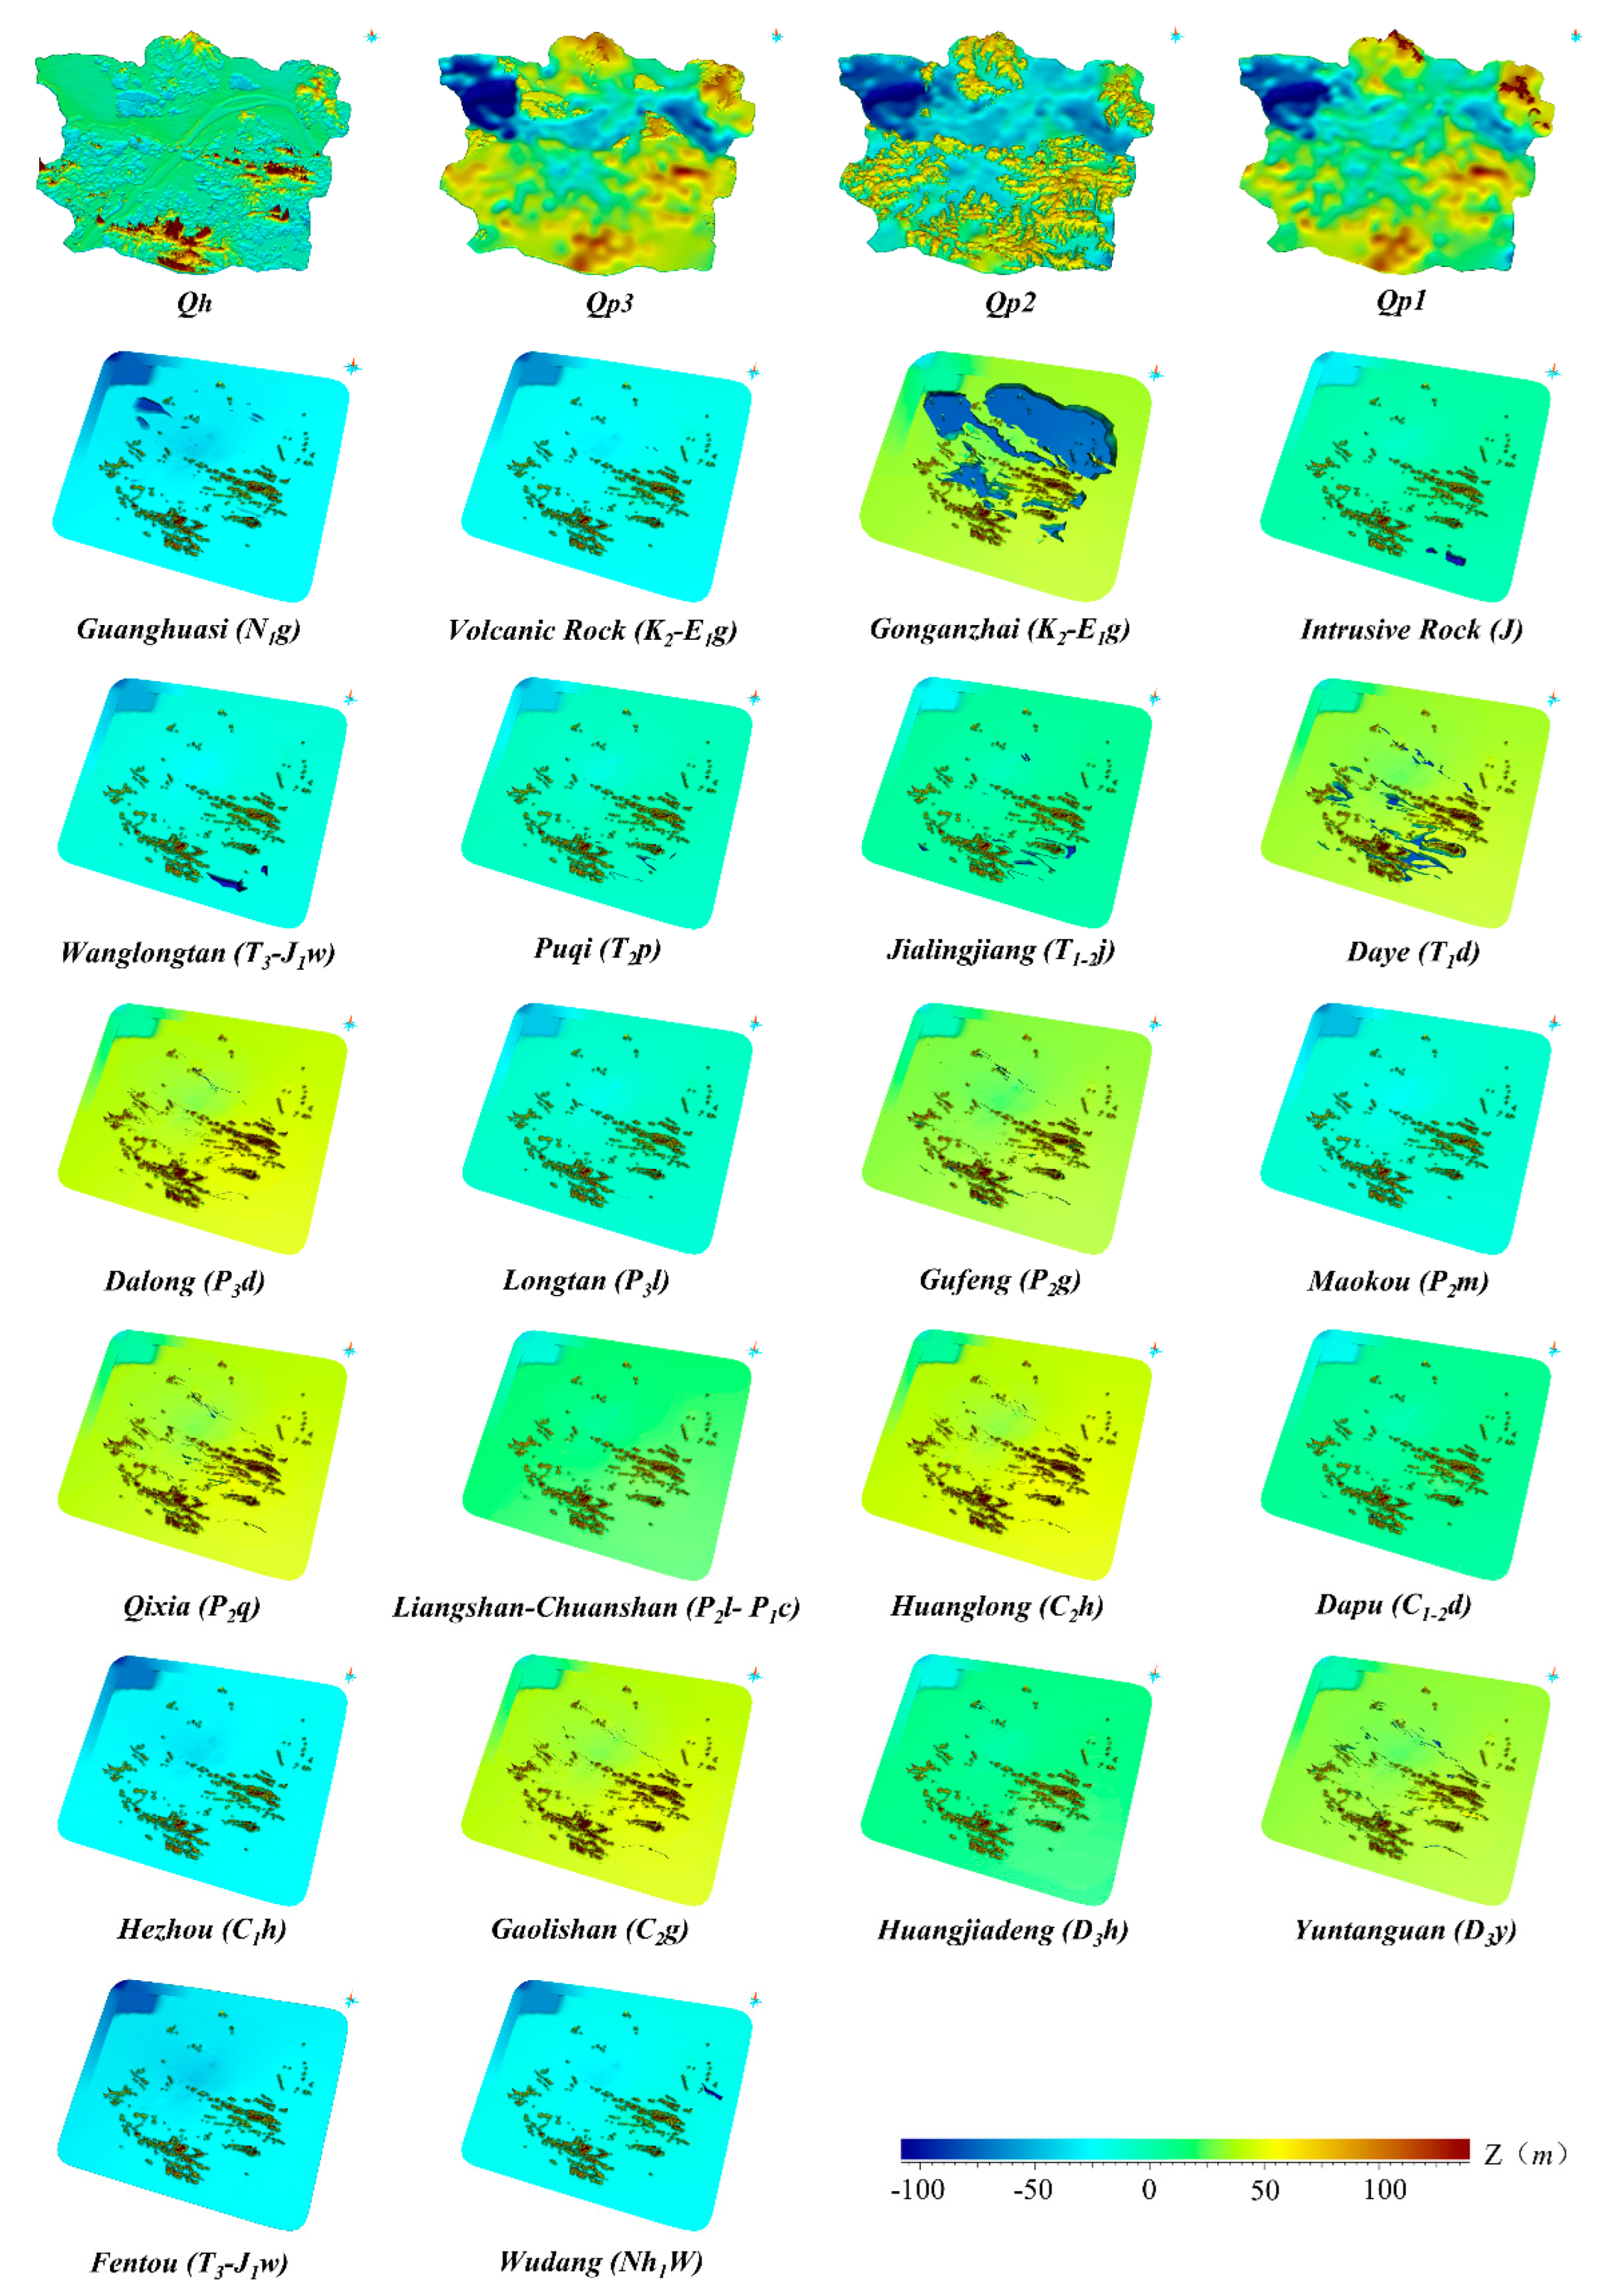
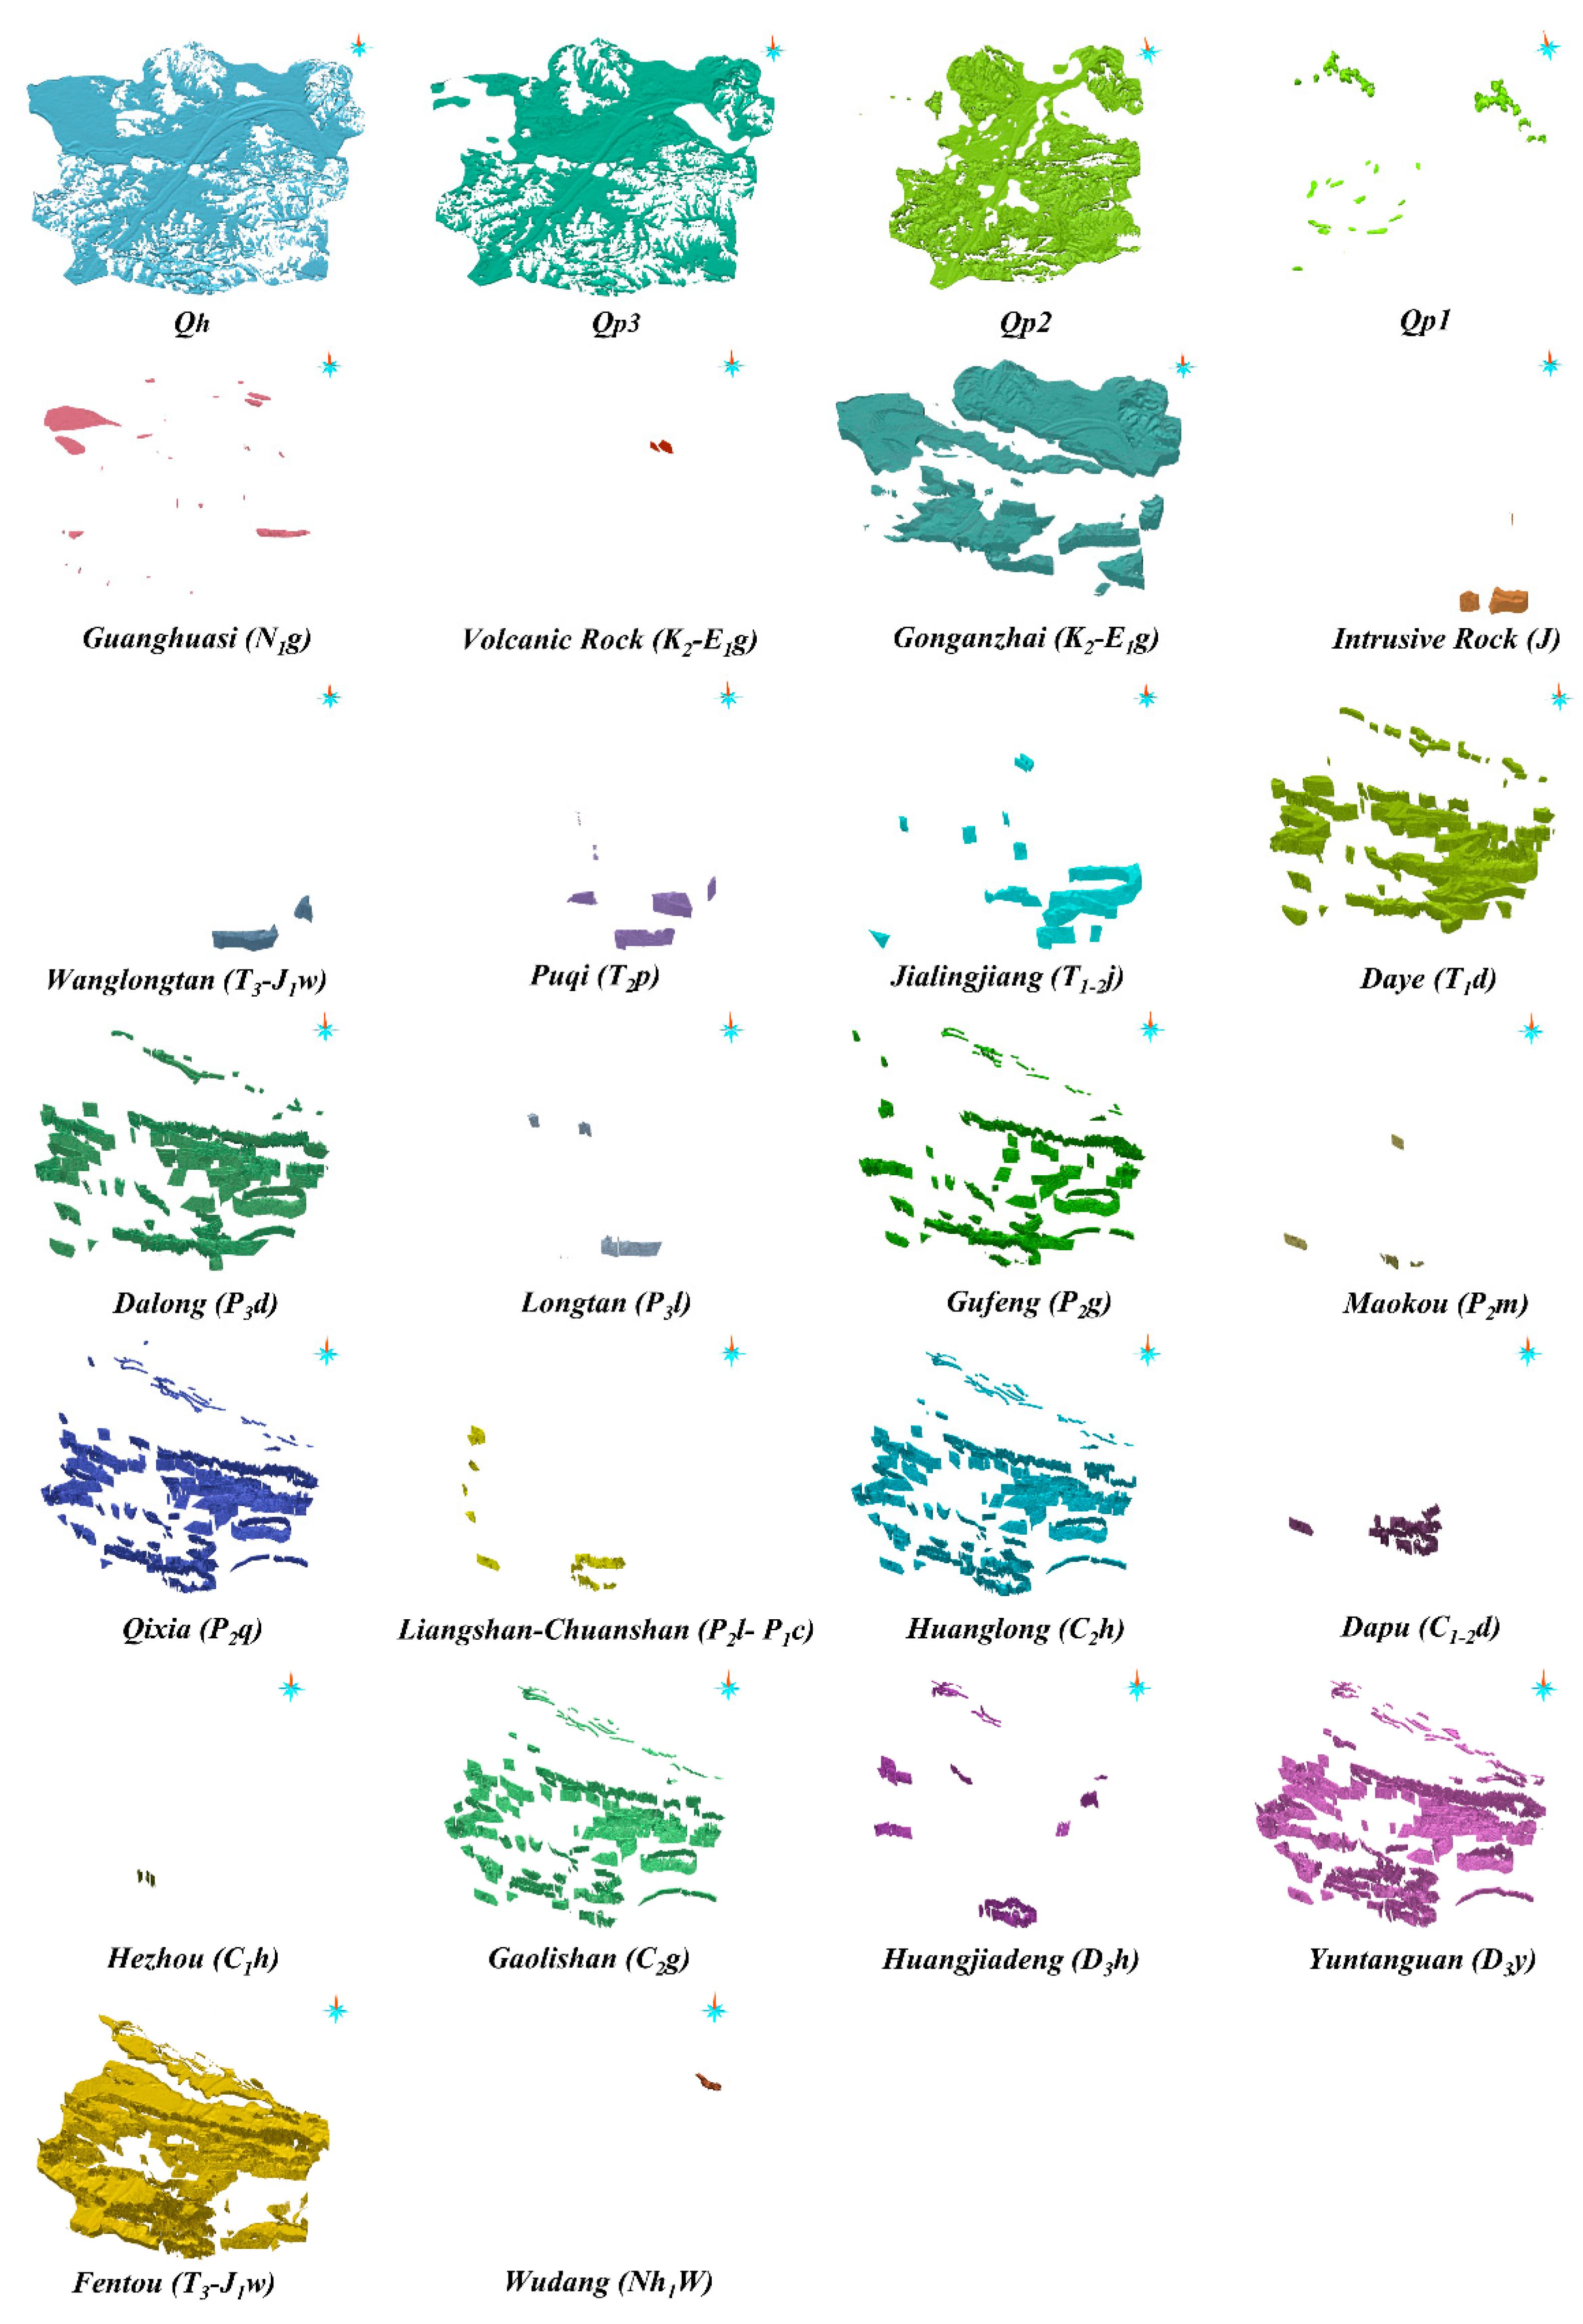
The bedrock basement in the study area comprises clastic rocks and shale strata of the Silurian Fentou Formation, which is not fully exposed in the model. Other strata, influenced by numerous tectonic movements, exhibit dip angles that often exceed 60°. Among them, the strata of the Triassic, Permian, Carboniferous, and Devonian are relatively thin, with thicknesses typically not exceeding 100 meters. These strata represent the primary components of the folding structures in the study area, and their lithology is dominated by carbonate rocks, which are widely distributed and serve as a crucial factor contributing to the frequent karst collapses in the region. The relatively younger Guanghuasi Formation and Gonganzhai Formation strata are mainly distributed in fault basins of varying scales formed during the neotectonic movement, with lithology dominated by clastic rocks and sandstones. Overall, magmatic rocks in the study area are underdeveloped, with intrusive rocks sporadically distributed in the southeastern Niushan Lake area, exhibiting relatively simple rock types. Volcanic rocks include ancient metamorphic volcanic rocks (Wudang Formation) and basalts from the Cretaceous-Paleogene Gonganzhai Formation. The 3D spatial structure models of these specific strata are illustrated in
Figure 6.
3.2. Tectonics
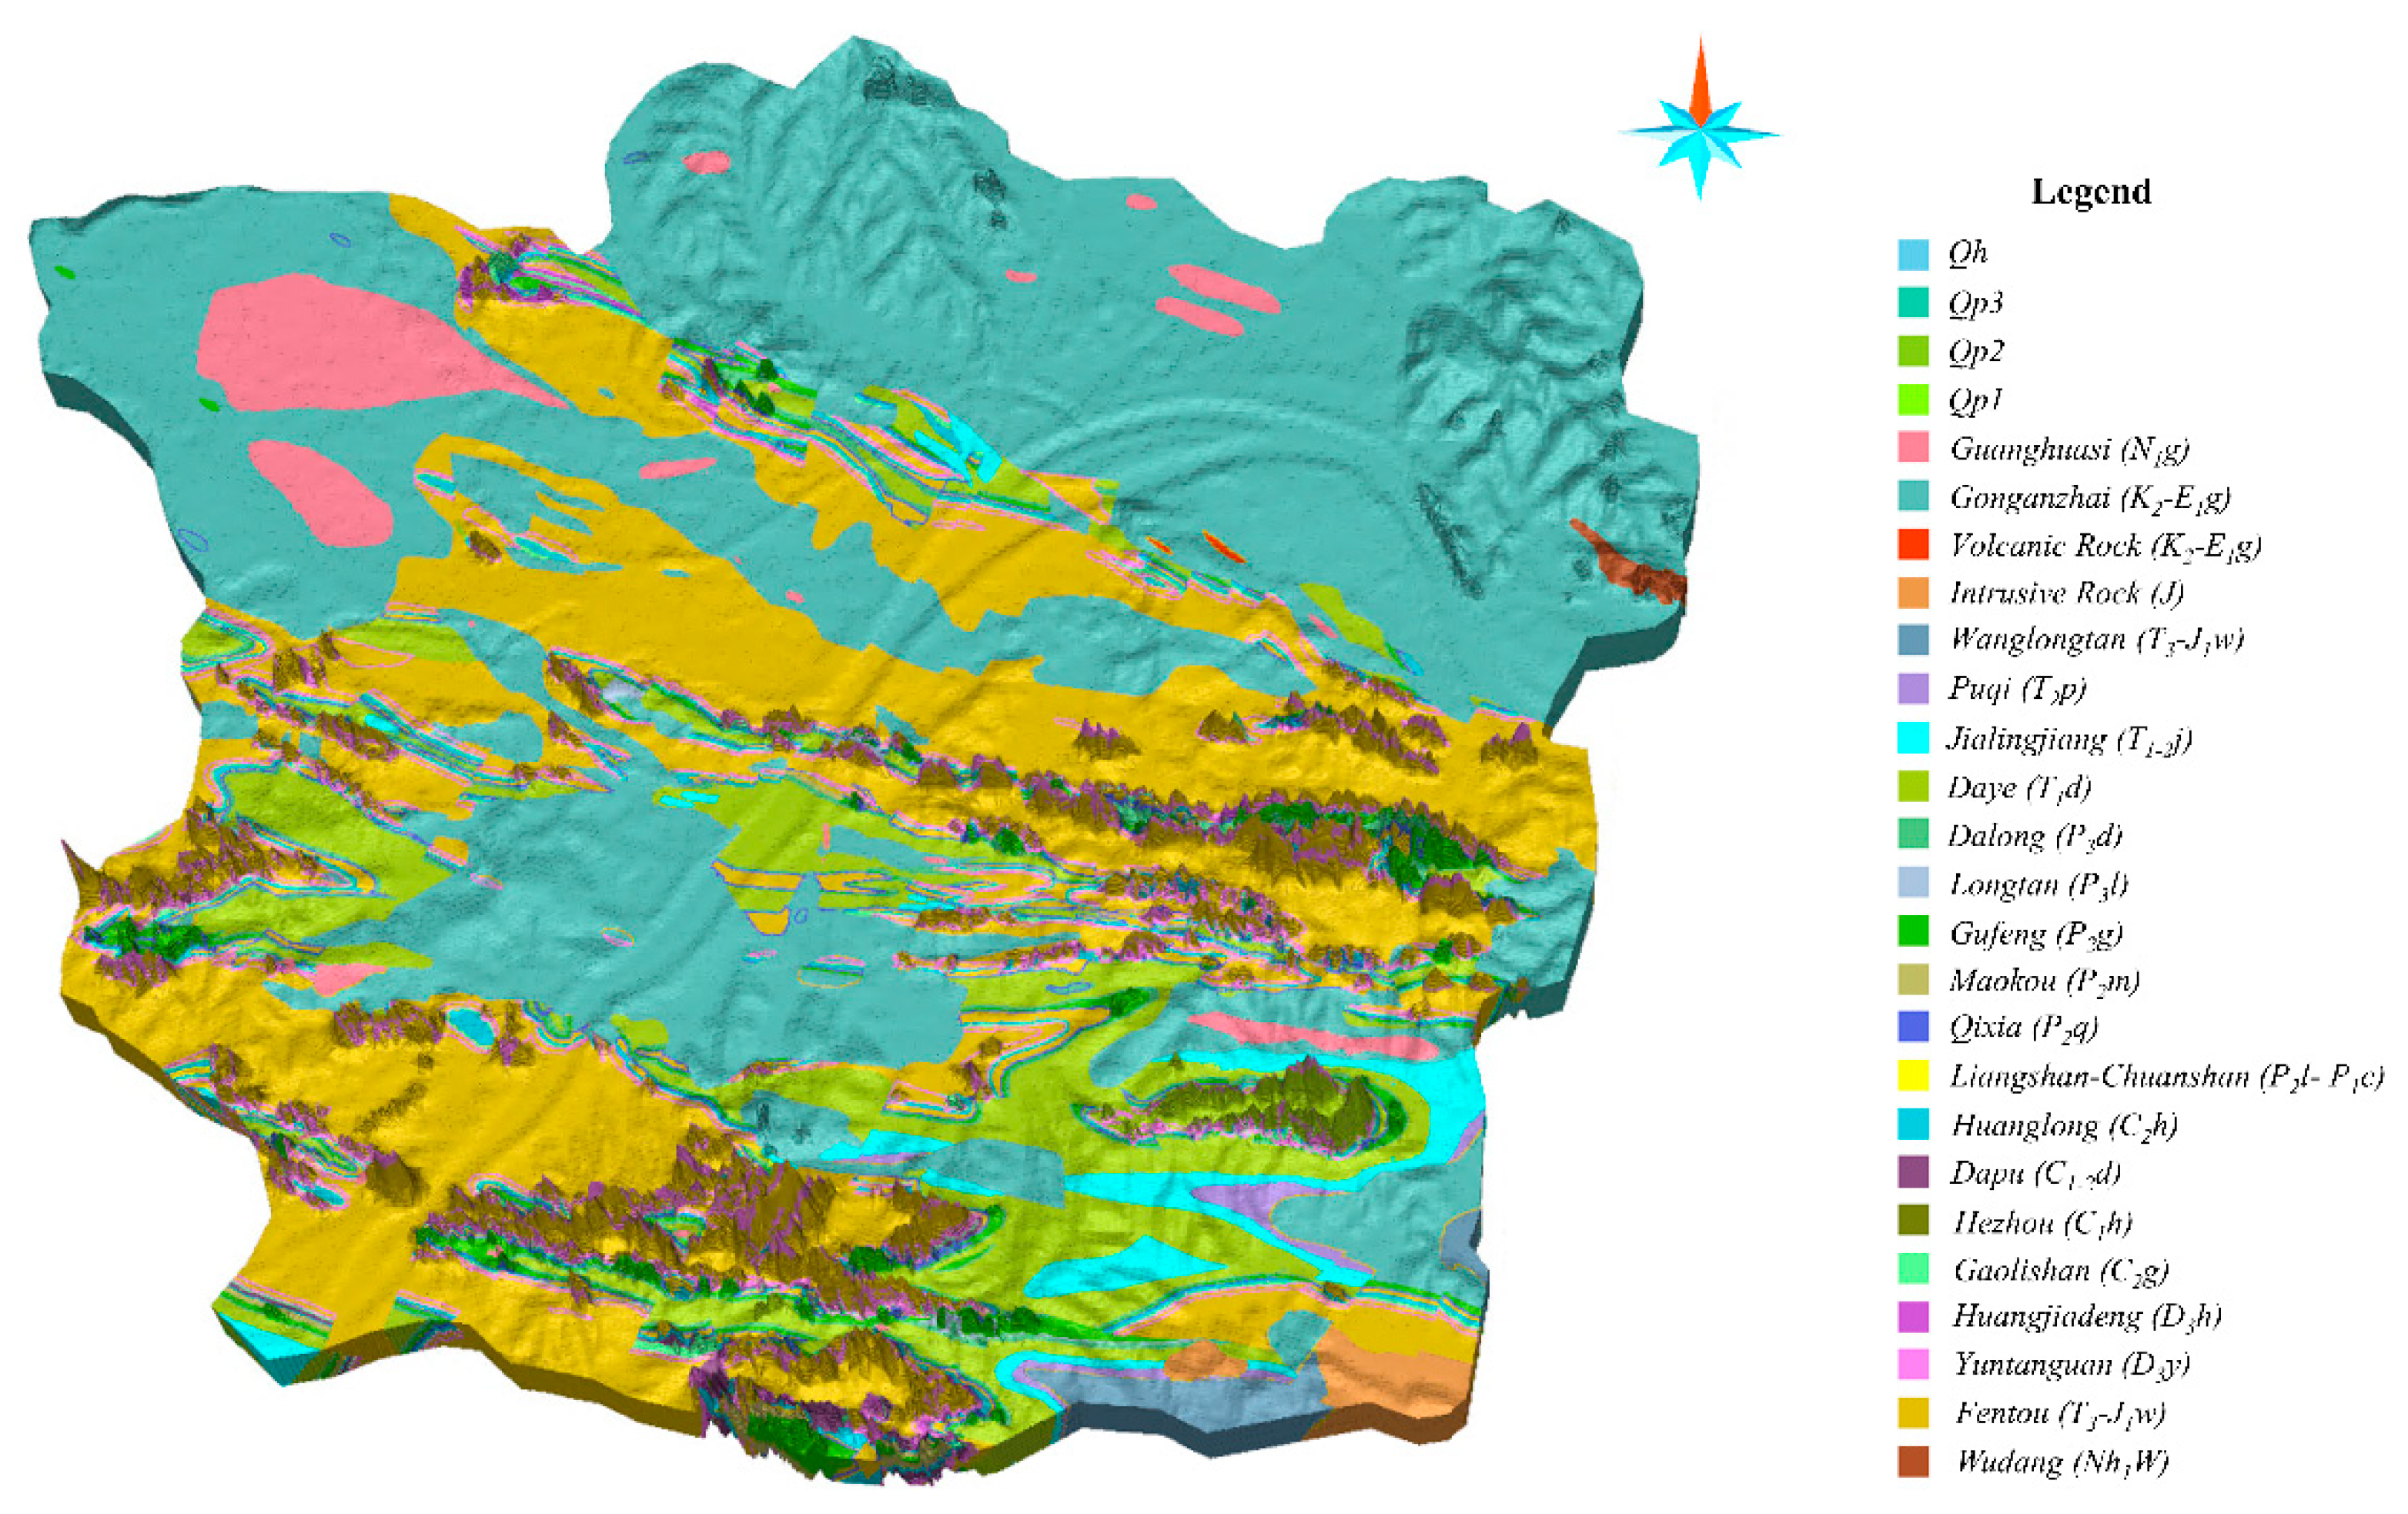
The bedrock structure in the study area are highly complex, with shallow burial depths and significant variations. The surface exposure characteristics are primarily controlled by east-west trending fold structures and fault activities, resulting in an obvious east-west orientation of the outcrops. The 3D Bedrock Structural Model of Wuhan metropolitan development area are shown in
Figure 7.
3.2.1. Folds
The model contains 37 folds. Influenced by the Caledonian Movement from the Silurian to Devonian periods, the study area was uplifted to form a landmass, forming the Yangzi Paleocontinent, which laid down the macroscopic pattern of the paleogeographic landforms of Wuhan; meanwhile, due to varying degrees of erosion across different locations, the strata of Yuntaiguan Formation were covered by different layers, which formed the cores of folds in the study area. Subsequently, under the influence of the Jiangnan Movement, different parts underwent varying degrees of erosion, and during the later Indo-China and Yanshanian tectonic movements, the strata formed in different periods such as Carboniferous, Permian and Triassic jointly contributed to the pattern of folds within the region. The 3D spatial structure characteristics of relevant the related folds are shown in
Figure 8.
3.2.3. Faults
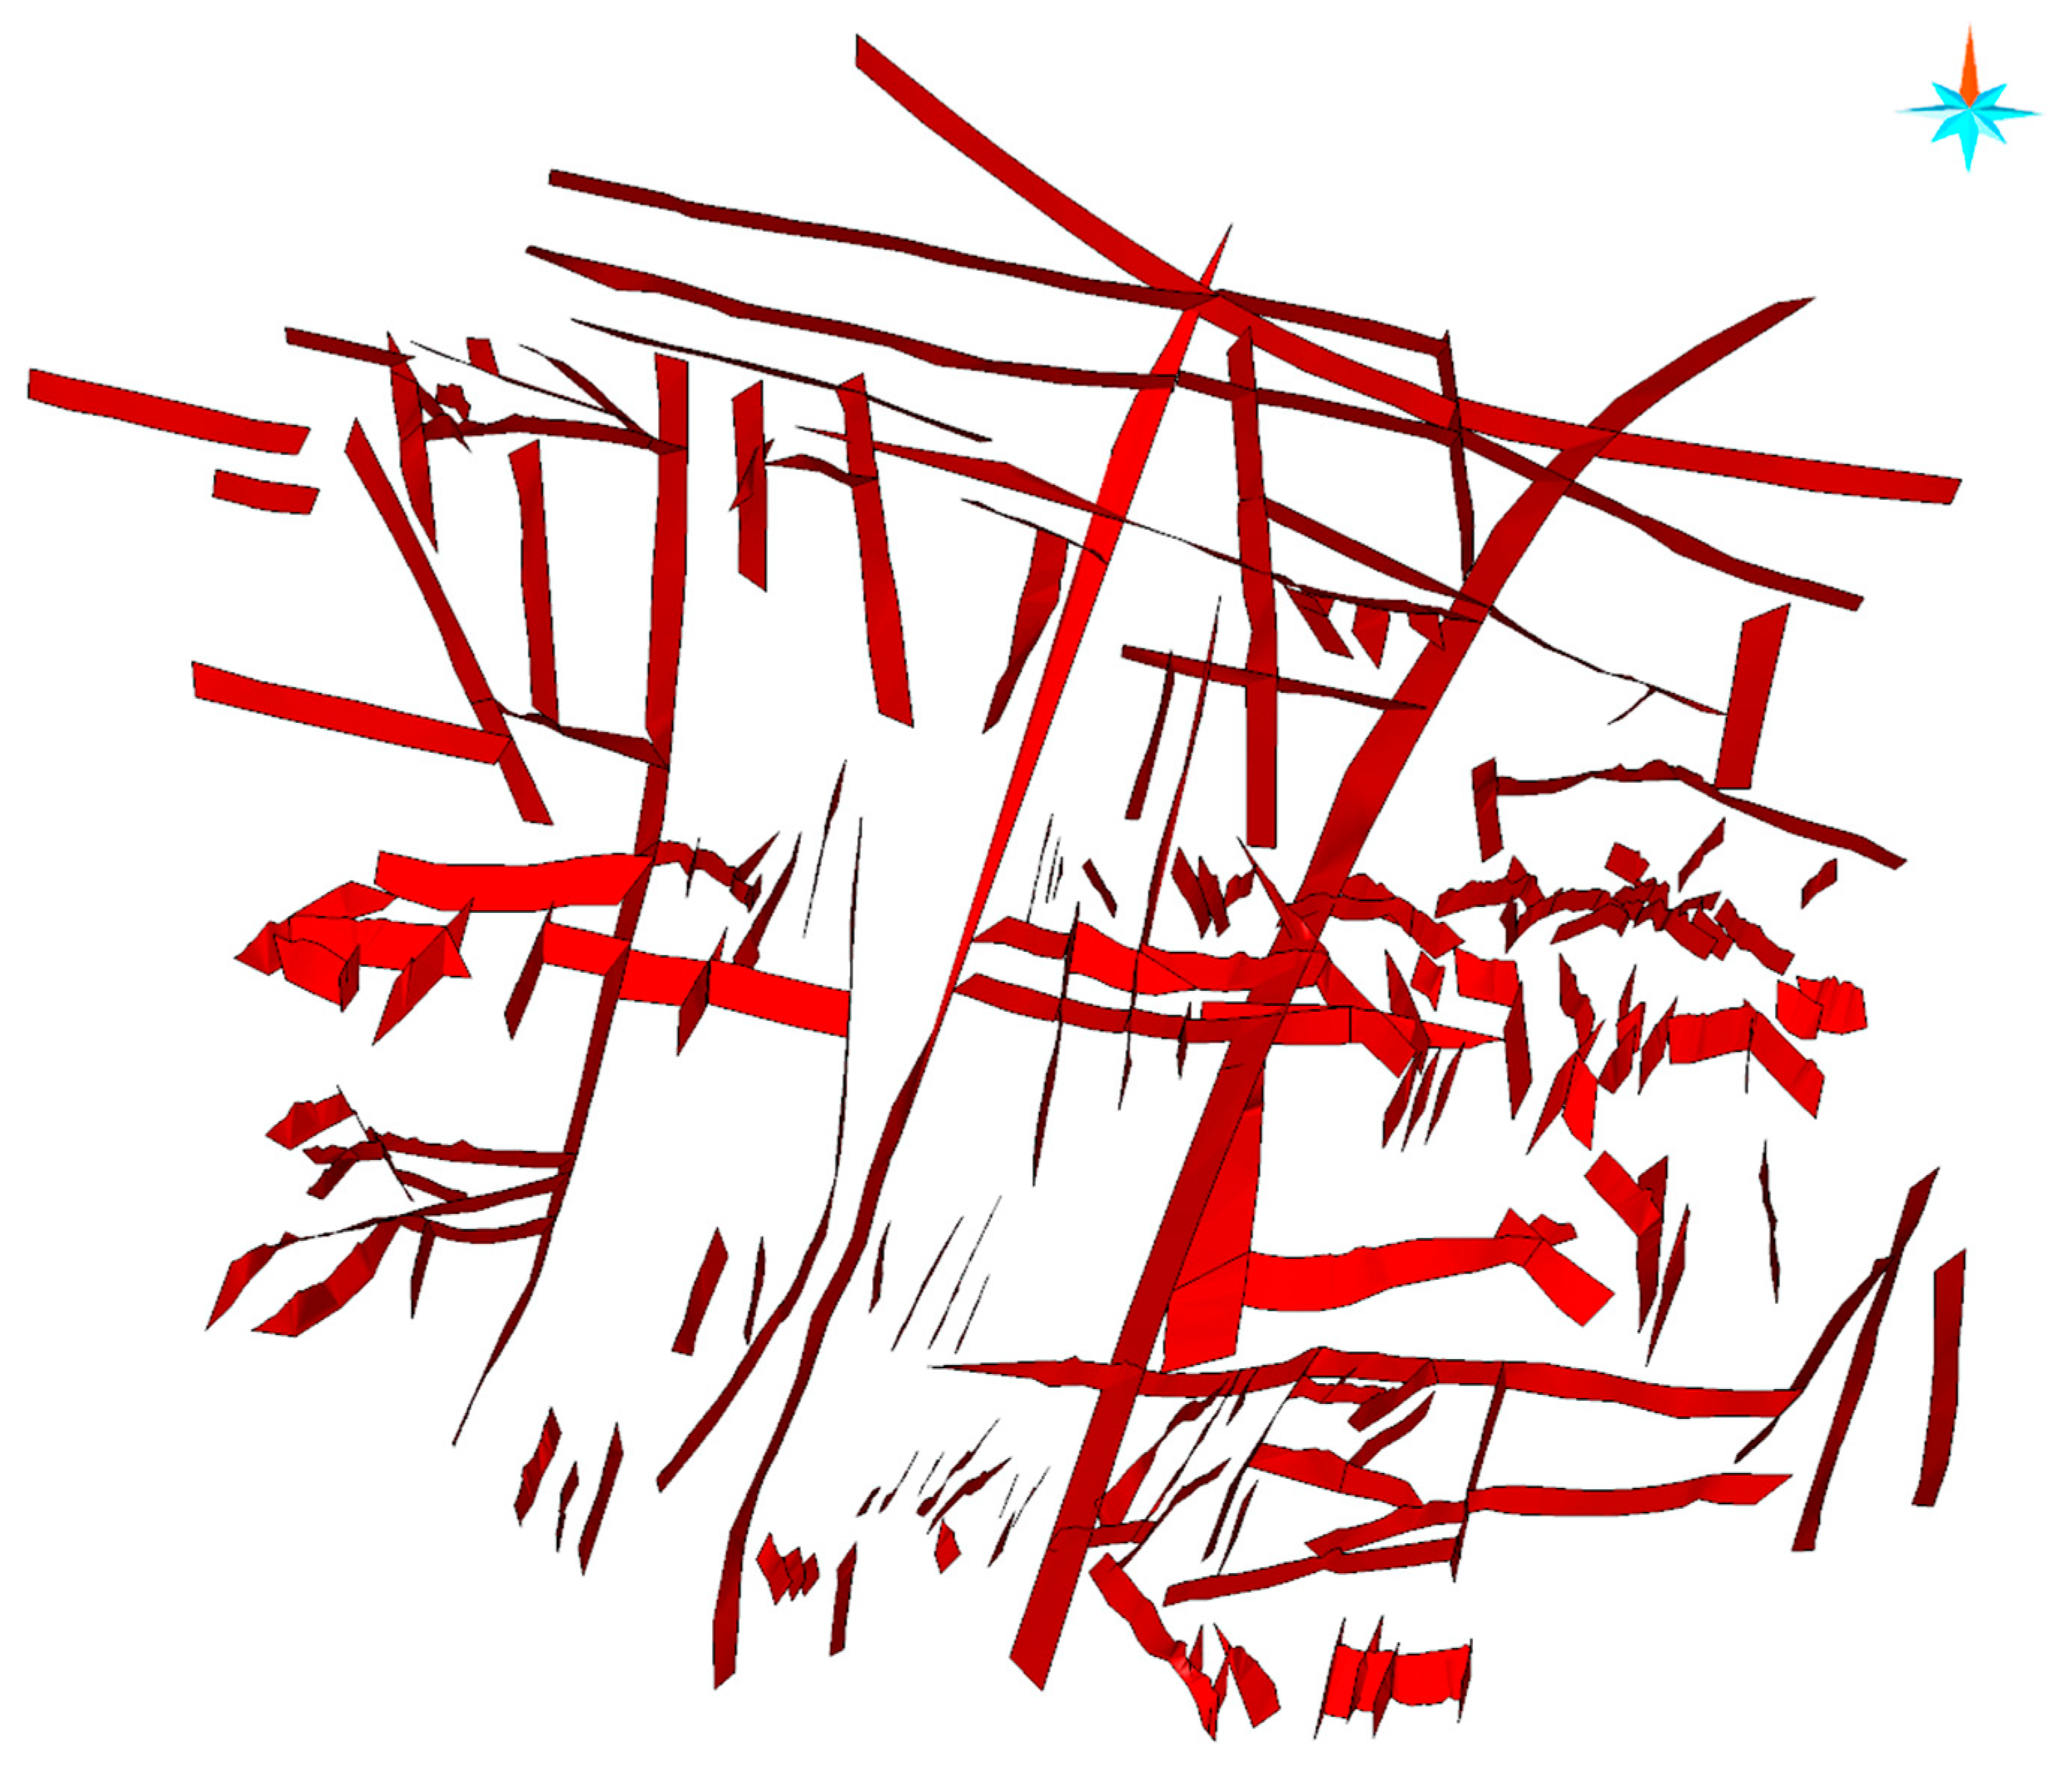
The model encompasses a total of 195 faults of varying scales. Under the influence of geological and tectonic movements in different periods, such as Indo-China Movement, Yanshanian Movement and Neotectonic Movement, the study area prominently features two major fault systems oriented east-west and north-south, most of which exhibit high-angle dips. Among them, the east-west trending faults are distinguished by their vast scales, extensive lateral extensions, profound depths of incision, persistent activity over geological time, and potent control over the region’s geological architecture. These include the Xiangguang Fault, Qingshan Fault, and Xinhuang Fault, with the Xiangguang Fault being the most extensive, representing a regional fault.
Meanwhile, the north-south oriented faults display a distinct banded or en echelon pattern, manifesting an equidistant spacing and pronounced strike-slip characteristics. This peculiar arrangement is attributed to the brittle deformation of strata during the Yanshanian period, including the Tuoluokou Fault, Sanyuansi Fault, Yangtze River Fault, and Tuanma fault, and so on. Notably, the Yangtze River Fault and Tuanma Fault, due to their substantial scales, exert considerable influence on the sedimentary evolution, tectonic framework, and geomorphology of Wuhan City. The 3D spatial spreading characteristics of these faults are illustrated in
Figure 9.
3.3. Model Quality Assessment
In order to conduct a rigorous and comprehensive assessment of the quality of the 3D geological structure model for Wuhan metropolitan development area, this study adopted a stratified sampling approach. Specifically, 10% of the boreholes were proportionally selected from across the study region, taking into account the distribution density and heterogeneity of the modeling data. These boreholes served as validation points for assessing the model’s accuracy.
For each validation borehole, a corresponding virtual borehole was extracted from the same location within the 3D geological model. A depth-matched stratigraphic correlation was then performed between the virtual and validation boreholes, enabling a direct comparison of their geological layers. This process was repeated for all validation boreholes, ensuring a comprehensive evaluation of the model’s structural fidelity.
Finally, the results from all individual comparisons were synthesized, providing a quantitative assessment of the overall quality of the model. This approach ensures that the assessment is both rigorous and representative, reflecting the true quality of the model across the entire study region.
Combining the layer matching results of all validation boreholes throughout the study area, the comprehensive model accuracy of the 3D geological structure model of Wuhan metropolitan development area was determined to be 83.6%. These validation results underscore the model’s robust capability to meticulously portray the 3D spatial geological structure in the study area.
4. Discussions
Based on the depth-matched stratigraphic correlation analysis of validation boreholes, the peripheral regions of the study area consistently exhibited the lowest layer matching accuracies, typically ranging from 70% to 80%. This suboptimal performance stems primarily from the inadequate research conducted in these areas, resulting in a dearth of modeling data and corresponding limitations in geological comprehension. Notably, the mountainous and hilly areas in the northern and southeastern parts of the study area experienced the most acute data deficiency, resulting in these regions becoming the lowest in terms of 3D geological model quality across the entire study area. The lowest layer matching accuracy recorded of the validation boreholes in these areas was 67.3%.
Overall, the quality of the 3D geological model gradually improves from the periphery towards the center of Wuhan metropolitan development area, specifically the intersection of the Yangtze and Han Rivers where the layer matching outcomes of validation boreholes typically exceed 90%. The primary factor contributing to this trend is the escalating socio-economic levels as one approaches the center of Wuhan metropolitan development area. This heightened socio-economic status has facilitated a profounder research and comprehension of the underlying geological background, subsequently resulting in a more abundant accumulation of geological data that is crucial for modeling purposes.
5. Conclusions
The 3D geological structure model of Wuhan’s urban development area incorporates 26 strata spanning different geological eras, 195 faults of varying scales, and 37 folds with diverse origins. By leveraging the results of the depth-matched stratigraphic correlation analysis of validation boreholes, the comprehensive accuracy of the model is determined to be 83.6%. The quality of the model exhibits the lowest level around the periphery of the study area, peaking in the central region, and displays an overall trend of gradual increase from the periphery towards the center. The primary reason for this is that the amount of modeling data is getting richer from the periphery to the center of the Wuhan metropolitan development area.
One of the crucial challenges in urban 3D geological modeling, especially at a large scale, is addressing the scarcity and multi-source heterogeneity of modeling data. By analyzing the standard stratigraphic sequence of the study area and using it as a unified standard and basis, various geological understandings and modeling data are integrated and standardized, so as to obtain modeling data with unified data format, which is crucial for ensuring the accuracy and consistency of the 3D geological model.
For the urban 3D geological modeling with highly complex geological conditions, particularly those having undergone multiple phases of tectonic movements, the primary focus is on determining the logical and topological relationships among various strata. This necessitates a thorough understanding of the geological evolution history within the study area, utilizing the macro- structure framework as an analytical scaffold to dissect the secondary geological features and progressively clarify the constraints relationship among strata; Subsequently, an abstraction process is applied to transfigure these interrelationships into logical and topological connections, which are then integrated into the modeling process.
Author Contributions
Conceptualization, J.Z. and T.G.; methodology, J.Z. and S.L.; software, J.Z., T.G. and Q.W.; validation, X.Z., Q.W.; formal analysis, Z.H., C.Z.; investigation, Z.H.; resources, S.L.; data curation, J.Z. and S.L; writing—original draft preparation, J.Z. and G.Z.; writing—review and editing, J.Z. and S.L.; visualization, J.Z., W.W. and G.J.; supervision, X.Z.; project administration, J.Z.; funding acquisition, Z.H. All authors have read and agreed to the published version of the manuscript.
Funding
This research was funded by Comprehensive Monitoring of Resources and Environment Carrying Capacity of Xiong’an New Area and Construction of Digital Platform of Transparent Xiong’an (Institute of hydrogeology and environmental geology, Chinese Academy of Geological Sciences)(NO.DD20189144) and 3D geological modeling of Multi-factors urban geology of Wuhan(NO. WHDYS-2021-010).
Institutional Review Board Statement
Not applicable.
Informed Consent Statement
Not applicable.
Data Availability Statement
Not applicable.
Conflicts of Interest
The authors declare that they have no conflict of interest.
References
- Attard, G.; Rossier, Y.; Eisenlohr, L. Urban groundwater age modeling under unconfined condition – Impact of underground structures on groundwater age: Evidence of a piston effect. J. Hydrol. 2016, 535, 652–661. [Google Scholar] [CrossRef]
- Doyle, M.R. From hydro/geology to the streetscape: Evaluating urban underground resource potential. Tunn. Undergr. Space Technol. 2016, 55, 83–95. [Google Scholar] [CrossRef]
- Hou, W.; Yang, L.; Deng, D.; Ye, J.; Clarke, K.; Yang, Z.; Zhuang, W.; Liu, J.; Huang, J. Assessing quality of urban underground spaces by coupling 3D geological models: The case study of Foshan city, South China. Comput. Geosci. 2016, 89, 1–11. [Google Scholar] [CrossRef]
- Dou, F.; Li, X.; Xing, H.; Yuan, F.; Ge, W. 3D geological suitability evaluation for urban underground space development – A case study of Qianjiang Newtown in Hangzhou, Eastern China. Tunn. Undergr. Space Technol. 2021, 115. [Google Scholar] [CrossRef]
- Turner, A.K. Challenges and trends for geological modelling and visualisation. Bull. Eng. Geol. Environ. 2006, 65, 109–127. [Google Scholar] [CrossRef]
- Chen, Q.; Mariethoz, G.; Liu, G.; Comunian, A.; Ma, X. Locality-based 3-D multiple-point statistics reconstruction using 2-D geological cross sections. Hydrol. Earth Syst. Sci. 2018, 22, 6547–6566. [Google Scholar] [CrossRef]
- Mariethoz, G.; Renard, P.; Straubhaar, J. The Direct Sampling method to perform multiple-point geostatistical simulations. Water Resour. Res. 2010, 46, W11536. [Google Scholar] [CrossRef]
- Giannini, L.; Varone, C.; Esposito, C.; Mugnozza, G.S.; Schilirò, L. The potential of spatial statistics for the reconstruction of a subsoil model: A case study for the Firenze-Prato-Pistoia Basin, Central Italy. J. Appl. Geophys. 2021, 194, 104466. [Google Scholar] [CrossRef]
- Shishaye, H.A.; Tait, D.R.; Befus, K.M.; Maher, D.T.; Reading, M.J. New insights into the hydrogeology and groundwater flow in the Great Barrier Reef catchment, Australia, revealed through 3D modelling. J. Hydrol. Reg. Stud. 2020, 30, 100708. [Google Scholar] [CrossRef]
- Xu, N.; Tian, H.; Kulatilake, P.H.; Duan, Q. Building a three dimensional sealed geological model to use in numerical stress analysis software: A case study for a dam site. Comput. Geotech. 2011, 38, 1022–1030. [Google Scholar] [CrossRef]
- de Kemp, E.; Monecke, T.; Sheshpari, M.; Girard, E.; Lauzière, K.; Grunsky, E.; Schetselaar, E.; Goutier, J.; Perron, G.; Bellefleur, G. 3D GIS as a support for mineral discovery. Geochem. Explor. Environ. Anal. 2011, 11, 117–128. [Google Scholar] [CrossRef]
- Hou, W.; Yang, L.; Deng, D.; Ye, J.; Clarke, K.; Yang, Z.; Zhuang, W.; Liu, J.; Huang, J. Assessing quality of urban underground spaces by coupling 3D geological models: The case study of Foshan city, South China. Comput. Geosci. 2016, 89, 1–11. [Google Scholar] [CrossRef]
- Yu, M.; Huang, Y.; Xu, Q.; Guo, P.; Dai, Z. Application of virtual earth in 3D terrain modeling to visual analysis of large-scale geological disasters in mountainous areas. Environ. Earth Sci. 2016, 75, 563. [Google Scholar] [CrossRef]
- Zhou, C.; Du, Z.; Ouyang, J.; Zhang, Z.; Liu, Z. A 3D geological model and cutting algorithm based on a vertically projected triangulated network. Comput. Geosci. 2020, 143, 104562. [Google Scholar] [CrossRef]
- Touch, S.; Likitlersuang, S.; Pipatpongsa, T. 3D geological modelling and geotechnical characteristics of Phnom Penh subsoils in Cambodia. Eng. Geol. 2014, 178, 58–69. [Google Scholar] [CrossRef]
- Lin, M.-L.; Lin, C.-H.; Li, C.-H.; Liu, C.-Y.; Hung, C.-H. 3D modeling of the ground deformation along the fault rupture and its impact on engineering structures: Insights from the 1999 Chi-Chi earthquake, Shigang District, Taiwan. Eng. Geol. 2021, 281. [Google Scholar] [CrossRef]
- Li, N.; Song, X.; Xiao, K.; Li, S.; Li, C.; Wang, K. Part II: A demonstration of integrating multiple-scale 3D modelling into GIS-based prospectivity analysis: A case study of the Huayuan-Malichang district, China. Ore Geol. Rev. 2018, 95, 292–305. [Google Scholar] [CrossRef]
- Price, S.J.; Terrington, R.L.; Busby, J.; Bricker, S.; Berry, T. 3D ground-use optimisation for sustainable urban development planning: A case-study from Earls Court, London, UK. Tunn. Undergr. Space Technol. 2018, 81, 144–164. [Google Scholar] [CrossRef]
- Santilano, A.; Donato, A.; Galgaro, A.; Montanari, D.; Menghini, A.; Viezzoli, A.; Di Sipio, E.; Destro, E.; Manzella, A. An integrated 3D approach to assess the geothermal heat-exchange potential: The case study of western Sicily (southern Italy). Renew. Energy 2016, 97, 611–624. [Google Scholar] [CrossRef]
- Jin, X.; Wang, G.; Tang, P.; Hu, C.; Liu, Y.; Zhang, S. 3D geological modelling and uncertainty analysis for 3D targeting in Shanggong gold deposit (China). J. Geochem. Explor. 2020, 210, 106442. [Google Scholar] [CrossRef]
- Balestra, M.; Corrado, S.; Aldega, L.; Rudkiewicz, J.-L.; Morticelli, M.G.; Sulli, A.; Sassi, W. 3D structural modeling and restoration of the Apennine-Maghrebian chain in Sicily: Application for non-cylindrical fold-and-thrust belts. Tectonophysics 2019, 761, 86–107. [Google Scholar] [CrossRef]
- Lyu, M.; Ren, B.; Wu, B.; Tong, D.; Ge, S.; Han, S. A parametric 3D geological modeling method considering stratigraphic interface topology optimization and coding expert knowledge. Eng. Geol. 2021, 293. [Google Scholar] [CrossRef]
- He, H.; He, J.; Xiao, J.; Zhou, Y.; Liu, Y.; Li, C. 3D geological modeling and engineering properties of shallow superficial deposits: A case study in Beijing, China. Tunn. Undergr. Space Technol. 2020, 100, 103390. [Google Scholar] [CrossRef]
- Kim, H.; Sandersen, P.B.; Jakobsen, R.; Kallesøe, A.J.; Claes, N.; Blicher-Mathiesen, G.; Foged, N.; Aamand, J.; Hansen, B. A 3D hydrogeochemistry model of nitrate transport and fate in a glacial sediment catchment: A first step toward a numerical model. Sci. Total. Environ. 2021, 776. [Google Scholar] [CrossRef]
- Fu, G.; Lü, Q.; Yan, J.; Farquharson, C.G.; Qi, G.; Zhang, K.; Zhang, Y.; Wang, H.; Luo, F. 3D mineral prospectivity modeling based on machine learning: A case study of the Zhuxi tungsten deposit in northeastern Jiangxi Province, South China. Ore Geol. Rev. 2021, 131. [Google Scholar] [CrossRef]
- Pang, Y.; Liu, Z.; Nie, L.; Zhang, Y.; Shao, j.; Bai, P.; Dong, Z. 3D geological modeling based on gravitational and magnetic data inversion in the Luanchuan ore region, Henan Province, China. J. Appl. Geophys., 2022, 196, 104510. [Google Scholar] [CrossRef]
- Chen, Q.; Liu, G.; Ma, X.; Li, X.; He, Z. 3D stochastic modeling framework for Quaternary sediments using multiple-point statistics: A case study in Minjiang Estuary area, southeast China. Comput. Geosci. 2020, 136, 104404. [Google Scholar] [CrossRef]
- Martínez-Martínez, J.; Corbí, H.; Martin-Rojas, I.; Baeza-Carratalá, J.; Giannetti, A. Stratigraphy, petrophysical characterization and 3D geological modelling of the historical quarry of Nueva Tabarca island (western Mediterranean): Implications on heritage conservation. Eng. Geol. 2017, 231, 88–99. [Google Scholar] [CrossRef]
- Bukovská, Z.; Soejono, I.; Vondrovic, L.; Vavro, M.; Souček, K.; Buriánek, D.; Dobeš, P.; Švagera, O.; Waclawik, P.; Řihošek, J.; et al. Characterization and 3D visualization of underground research facility for deep geological repository experiments: A case study of underground research facility Bukov, Czech Republic. Eng. Geol. 2019, 259, 105186. [Google Scholar] [CrossRef]
- Høyer, A.-S.; Klint, K.E.S.; Fiandaca, G.; Maurya, P.K.; Christiansen, A.V.; Balbarini, N.; Bjerg, P.L.; Hansen, T.B.; Møller, I. Development of a high-resolution 3D geological model for landfill leachate risk assessment. Eng. Geol. 2019, 249, 45–59. [Google Scholar] [CrossRef]
- Wang, G.; Zhu, Y.; Zhang, S.; Yan, C.; Song, Y.; Ma, Z.; Hong, D.; Chen, T. 3D geological modeling based on gravitational and magnetic data inversion in the Luanchuan ore region, Henan Province, China. J. Appl. Geophys. 2012, 80, 1–11. [Google Scholar] [CrossRef]
- Pan, D.; Xu, Z.; Lu, X.; Zhou, L.; Li, H. 3D scene and geological modeling using integrated multi-source spatial data: Methodology, challenges, and suggestions. Tunn. Undergr. Space Technol. 2020, 100, 103393. [Google Scholar] [CrossRef]
- Kaufmann, O.; Martin, T. 3D geological modelling from boreholes, cross-sections and geological maps, application over former natural gas storages in coal mines. Comput. Geosci. 2007, 34, 278–290. [Google Scholar] [CrossRef]
- Guo, J.; Li, Y.; Jessell, M.W.; Giraud, J.; Li, C.; Wu, L.; Li, F.; Liu, S. 3D geological structure inversion from Noddy-generated magnetic data using deep learning methods. Comput. Geosci. 2021, 149, 104701. [Google Scholar] [CrossRef]
- Høyer, A.-S.; Jørgensen, F.; Sandersen, P.; Viezzoli, A.; Møller, I. 3D geological modelling of a complex buried-valley network delineated from borehole and AEM data. J. Appl. Geophys. 2015, 122, 94–102. [Google Scholar] [CrossRef]
- Cai, B.; Zhao, J.; Yu, X. A methodology for 3D geological mapping and implementation. Multimedia Tools Appl. 2018, 78, 28703–28713. [Google Scholar] [CrossRef]
- Prinds, C.; Petersen, R.; Greve, M.; Iversen, B. Three-dimensional voxel geological model of a riparian lowland and surrounding catchment using a multi-geophysical approach. J. Appl. Geophys. 2020, 174, 103965. [Google Scholar] [CrossRef]
|
Disclaimer/Publisher’s Note: The statements, opinions and data contained in all publications are solely those of the individual author(s) and contributor(s) and not of MDPI and/or the editor(s). MDPI and/or the editor(s) disclaim responsibility for any injury to people or property resulting from any ideas, methods, instructions or products referred to in the content. |
© 2024 by the authors. Licensee MDPI, Basel, Switzerland. This article is an open access article distributed under the terms and conditions of the Creative Commons Attribution (CC BY) license (http://creativecommons.org/licenses/by/4.0/).
