1. Introduction
Bank loans not only address the urgent needs of customers and help them tide over difficult times, but also bring benefits to the bank. Therefore, from the perspective of both parties, establishing a good credit relationship can be a win-win situation. However, in many cases, late payments by customers cause significant financial losses to the bank and damage the bank's credibility. Therefore, it is crucial to conduct an effective credit risk assessment before entering into a lending relationship. With the increasing diversification of the assets of financial institutions, more and more financial institutions are joining financial transactions through the Internet. In this era of increasing data, the importance of data for banks has never been greater [
1]. In fact, data analytics plays a crucial role in bank credit risk management. Therefore, collecting large amounts of data and making effective use of it is key to compete in the future.
Credit risk assessment is the most basic and critical part of credit loan management. Many scientists around the world have conducted in-depth research on this, and the evaluation method has evolved from a single qualitative assessment to a quantitative assessment, and finally developed into a comprehensive evaluation method that combines qualitative and quantitative. Although China's commercial banks have adopted this comprehensive analysis method, in general, qualitative analysis still dominates, and the singularity of this method often cannot accurately identify risks. As a result, the outlook for credit loans may not look very rosy if the risk of credit loans cannot be objectively assessed [
2]. In the credit business, the problem of credit risk assessment with the customer as the research object is more complex, because the customer's credit rating and repayment ability will be affected by a variety of factors.
Traditional commercial banks mainly rely on manual credit approval, and their risk management process requires multi-layer approval, which not only makes the approval process complicated and cumbersome, but also susceptible to the influence of employees' personal subjectivity, resulting in lax credit risk assessment, which in turn directly affects the overall management decision-making. In addition, an overly cumbersome approval process can be particularly detrimental when dealing with credit loan risk, and customers may have to wait a long time for another approval [
3]. However, with the advent of the era of big data, big data technology has not only been widely used in the Internet industry, but also played an important role in bank loan risk assessment.
With the use of big data technology, banks can more easily digitize customer information and conduct risk assessment more effectively, so as to provide stronger support for decision-making and quickly respond to business needs, which is conducive to the rapid development of banks in the new era. Advances in technology have not only enriched the means of bank credit management, but also provided people with ways to analyze credit risk from a new perspective [
4].
With the rapid development of information technology, the banking industry has also ushered in the era of big data, which has brought unprecedented development opportunities for traditional banking business [
5]. In a fiercely competitive environment, the application of information technology has undergone tremendous changes. The scale of commercial banks continues to expand, and the amount of customer information data is also exploding, which not only poses challenges to data storage, but also increases the difficulty of data management. However, in practice, the amount of data itself is not the most critical, the key is how to effectively use this data to analyze and solve problems. Credit risk management is the most critical area of all banking operations [
6]. While credit is the main source of profit for commercial banks, the risks it poses are equally high. Therefore, in order to maximize profits, commercial banks must effectively prevent the occurrence of non-performing loans.
2. Related Work
Sohn and Hong [
7] designed a random-effects logistic regression model that combines financial and non-financial factors to predict defaults by funded SMEs in South Korea. The model has shown significant advantages in adapting to individual characteristics and dealing with uncertainty. At the same time, Lobna and Afif [
8] used logistic regression and discriminant analysis methods to construct a prediction model that can distinguish between "good" and "bad" borrowers for consumer loans of Tunisian commercial banks, and found that logistic regression has high predictive power in classification discrimination. The logistic regression model (LR) can not only predict the default risk of enterprises, but also calculate the specific default probability, which lays a solid foundation for the construction of credit risk early warning mechanism.
Discriminant analysis is a statistical method used to classify observed objects into predetermined categories. At its core, it consists in constructing a discriminant function from samples of a known class, and then using this function to predict the class of a new sample. Researchers such as Zhang Chenghu and Li Yulin [
9] successfully established a multiple linear discriminant model (MLD) using real data on personal consumption credit. The model demonstrates stability and has good discrimination and prediction capabilities.
A neural network is a method of simulating human neurons to analyze problems. It is able to autonomously discover patterns from data sets and make reliable predictions, demonstrating extreme flexibility and adaptability. As a result, neural networks have been widely used in credit risk analysis. For example, Ernest and Harish [
10] used loan data from a commercial bank to conduct their research, and their findings showed that neural networks performed better at predicting accuracy.
3. Methodologies
3.1. Notions
Before presenting our proposed methods, we initially summarize the primary used parameters in following
Table 1.
3.2. Random Forest Model
Random forest is an ensemble learning method that is primarily used for classification and regression. The basic idea is to build multiple decision trees and combine their predictions to get the final prediction result. The advantage of this method is that it can reduce the variance of the model and avoid overfitting, so as to improve the generalization ability of the model. Principal randomly selects N samples from the original dataset by "Bootstrap sampling" (with put-back sampling).
When building each decision tree, we don't use all the features whenever a node splits are performed, but we randomly select a subset of features from all the available features. This not only further enhances the diversity of the model, but also helps to reduce computational complexity. At each node of each decision tree, the selection of split features and split points is done by maximizing the information gain. The information gain is the difference between the entropy of the parent node and the weighted average of the entropy of its children is expressed as following Equation 1.
Where the function
is the entropy of the dataset
,
is the subset obtained after splitting according to the feature
, and
is the number of subsets.
Using the above randomly selected samples and features, each decision tree is constructed independently. Each tree is trained on a different subset of samples and features until each tree is fully grown or reaches a preset stopping condition. Gini impurity is another criterion commonly used for node splitting in decision trees, calculated as following Equation 2.
Where
is the proportion of category
in dataset
. Select features and splitting points that minimize Gini impurity.
Through the combination of the above steps and formulas, a random forest model that can handle both large-scale datasets and complex nonlinear relationships can be effectively constructed, which is particularly important in applications in the financial field such as credit risk assessment.
3.3. Optimization Function
Optimizing a random forest model first involves adjusting the parameters. Key parameters include the number of trees, the maximum depth of the tree, the minimum number of samples required for each node, and the minimum number of samples per leaf node. By adjusting these parameters, we can control the complexity of the model and the risk of overfitting.
Cross-validation uses K-fold cross-validation during training to assess the stability and predictive ability of the model, which helps us more accurately estimate the model's performance on new data. The K-fold averaging accuracy for cross-validation is calculated by the following Equation 3.
Where
is the accuracy obtained in the
-fold cross-validation.
Increasing the number of trees generally improves the stability and accuracy of the model, but it also increases computation time and memory consumption. It is often necessary to find a balance through cross-validation. Controlling the maximum depth of the tree prevents the model from learning overly complex patterns, i.e., preventing overfitting. A tree with a smaller depth will make the model simpler, but may not capture the key structures in the data; Too much depth can lead to noise in the data that the model learns. Select the most effective features by analyzing the importance of the features. Random forests can output an importance score for each feature, which can help identify the features that are most informative for the prediction target.
4. Experiments
4.1. Experimental Setups
The data used in this article is derived from the German Credit Dataset, which contains details of 1,000 customers. This information covers the customer's personal information (such as age, years of employment, personal status, etc.) and borrowing status (including existing credit limit, purpose of loan, other instalment liabilities, etc.). The dependent variable in the dataset is the customer's account status, i.e., the credit risk level, which is divided into No debt history (1), No current debt (2), Payments current (3), Payments delayed (4), and Critical account (5). There are two types of independent variables: the duration of the loan, the amount of credit (CAMT) and the age (age) are numerical independent variables, and the other variables are sub-type independent variables and have been assigned in the dataset.
4.2. Experimental Analysis
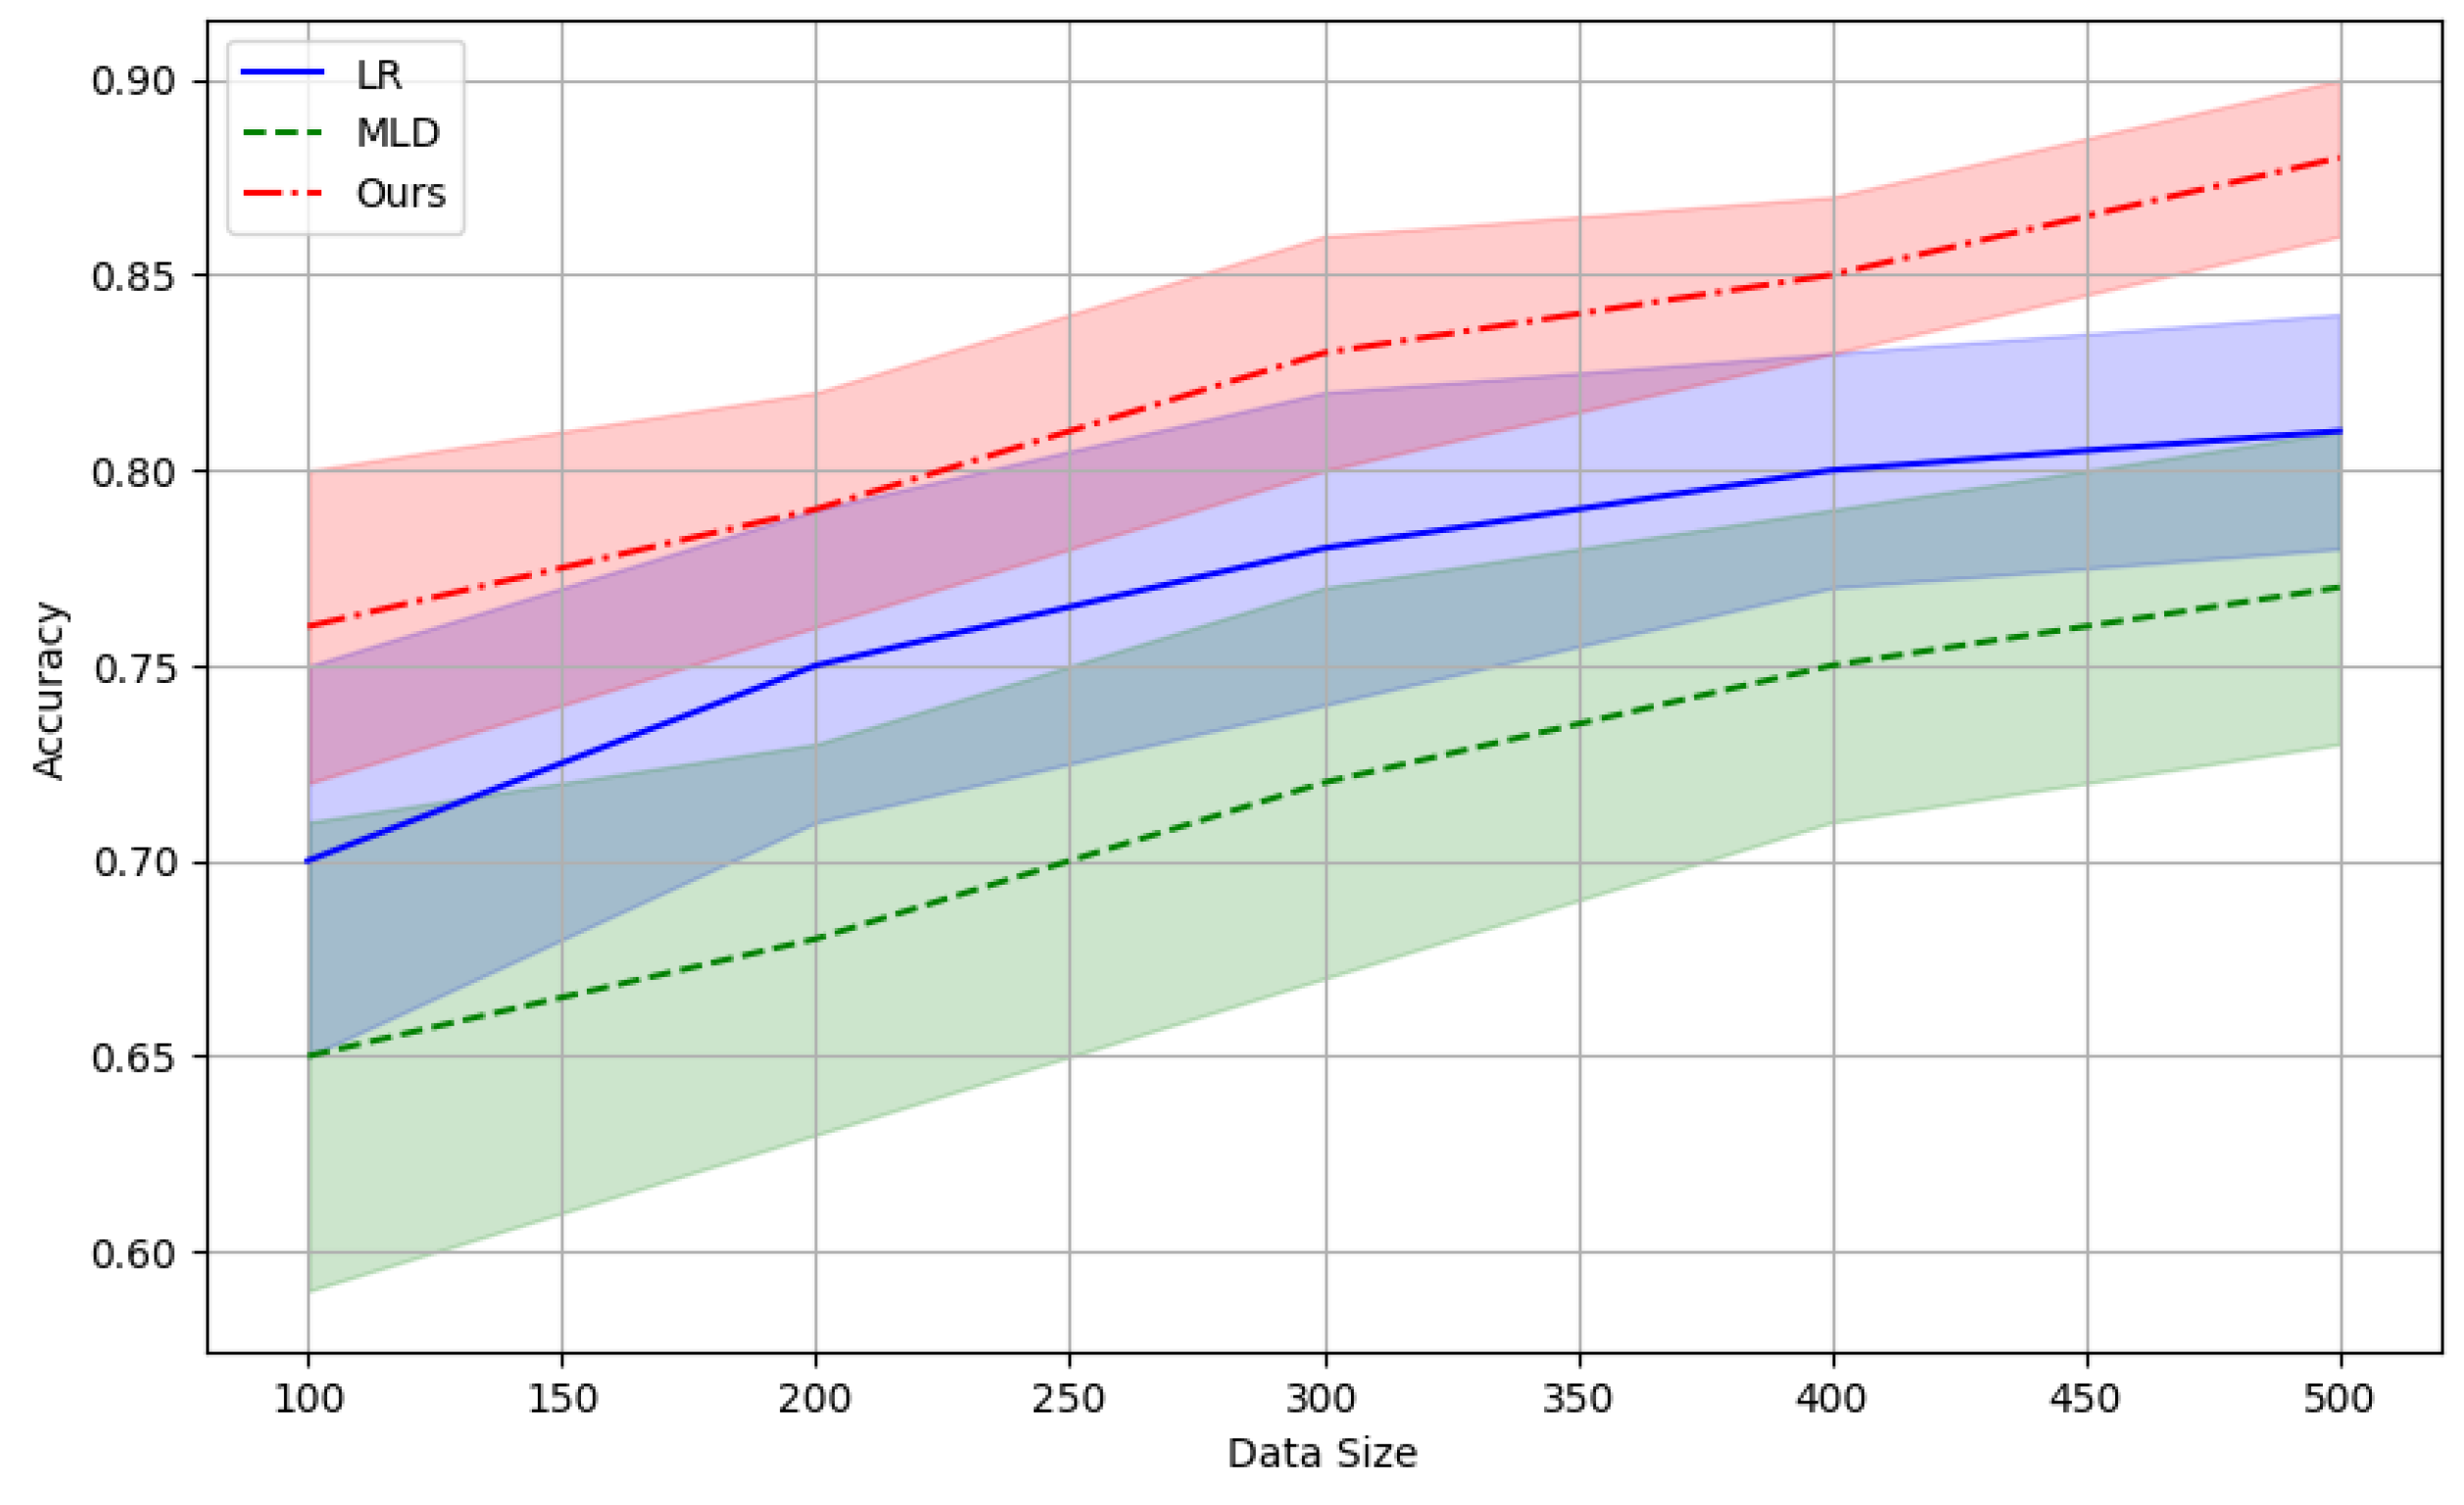
Accuracy is the most intuitive performance metric and represents the ratio of the number of samples that the model predicts correctly to the total number of samples. Although accuracy is a common metric, it may not be a good measure of performance in unbalanced datasets. Following
Figure 1 compares the prediction accuracy with risk assessment models including logistic regression (LR) and multiple linear discriminant (MLD) models.
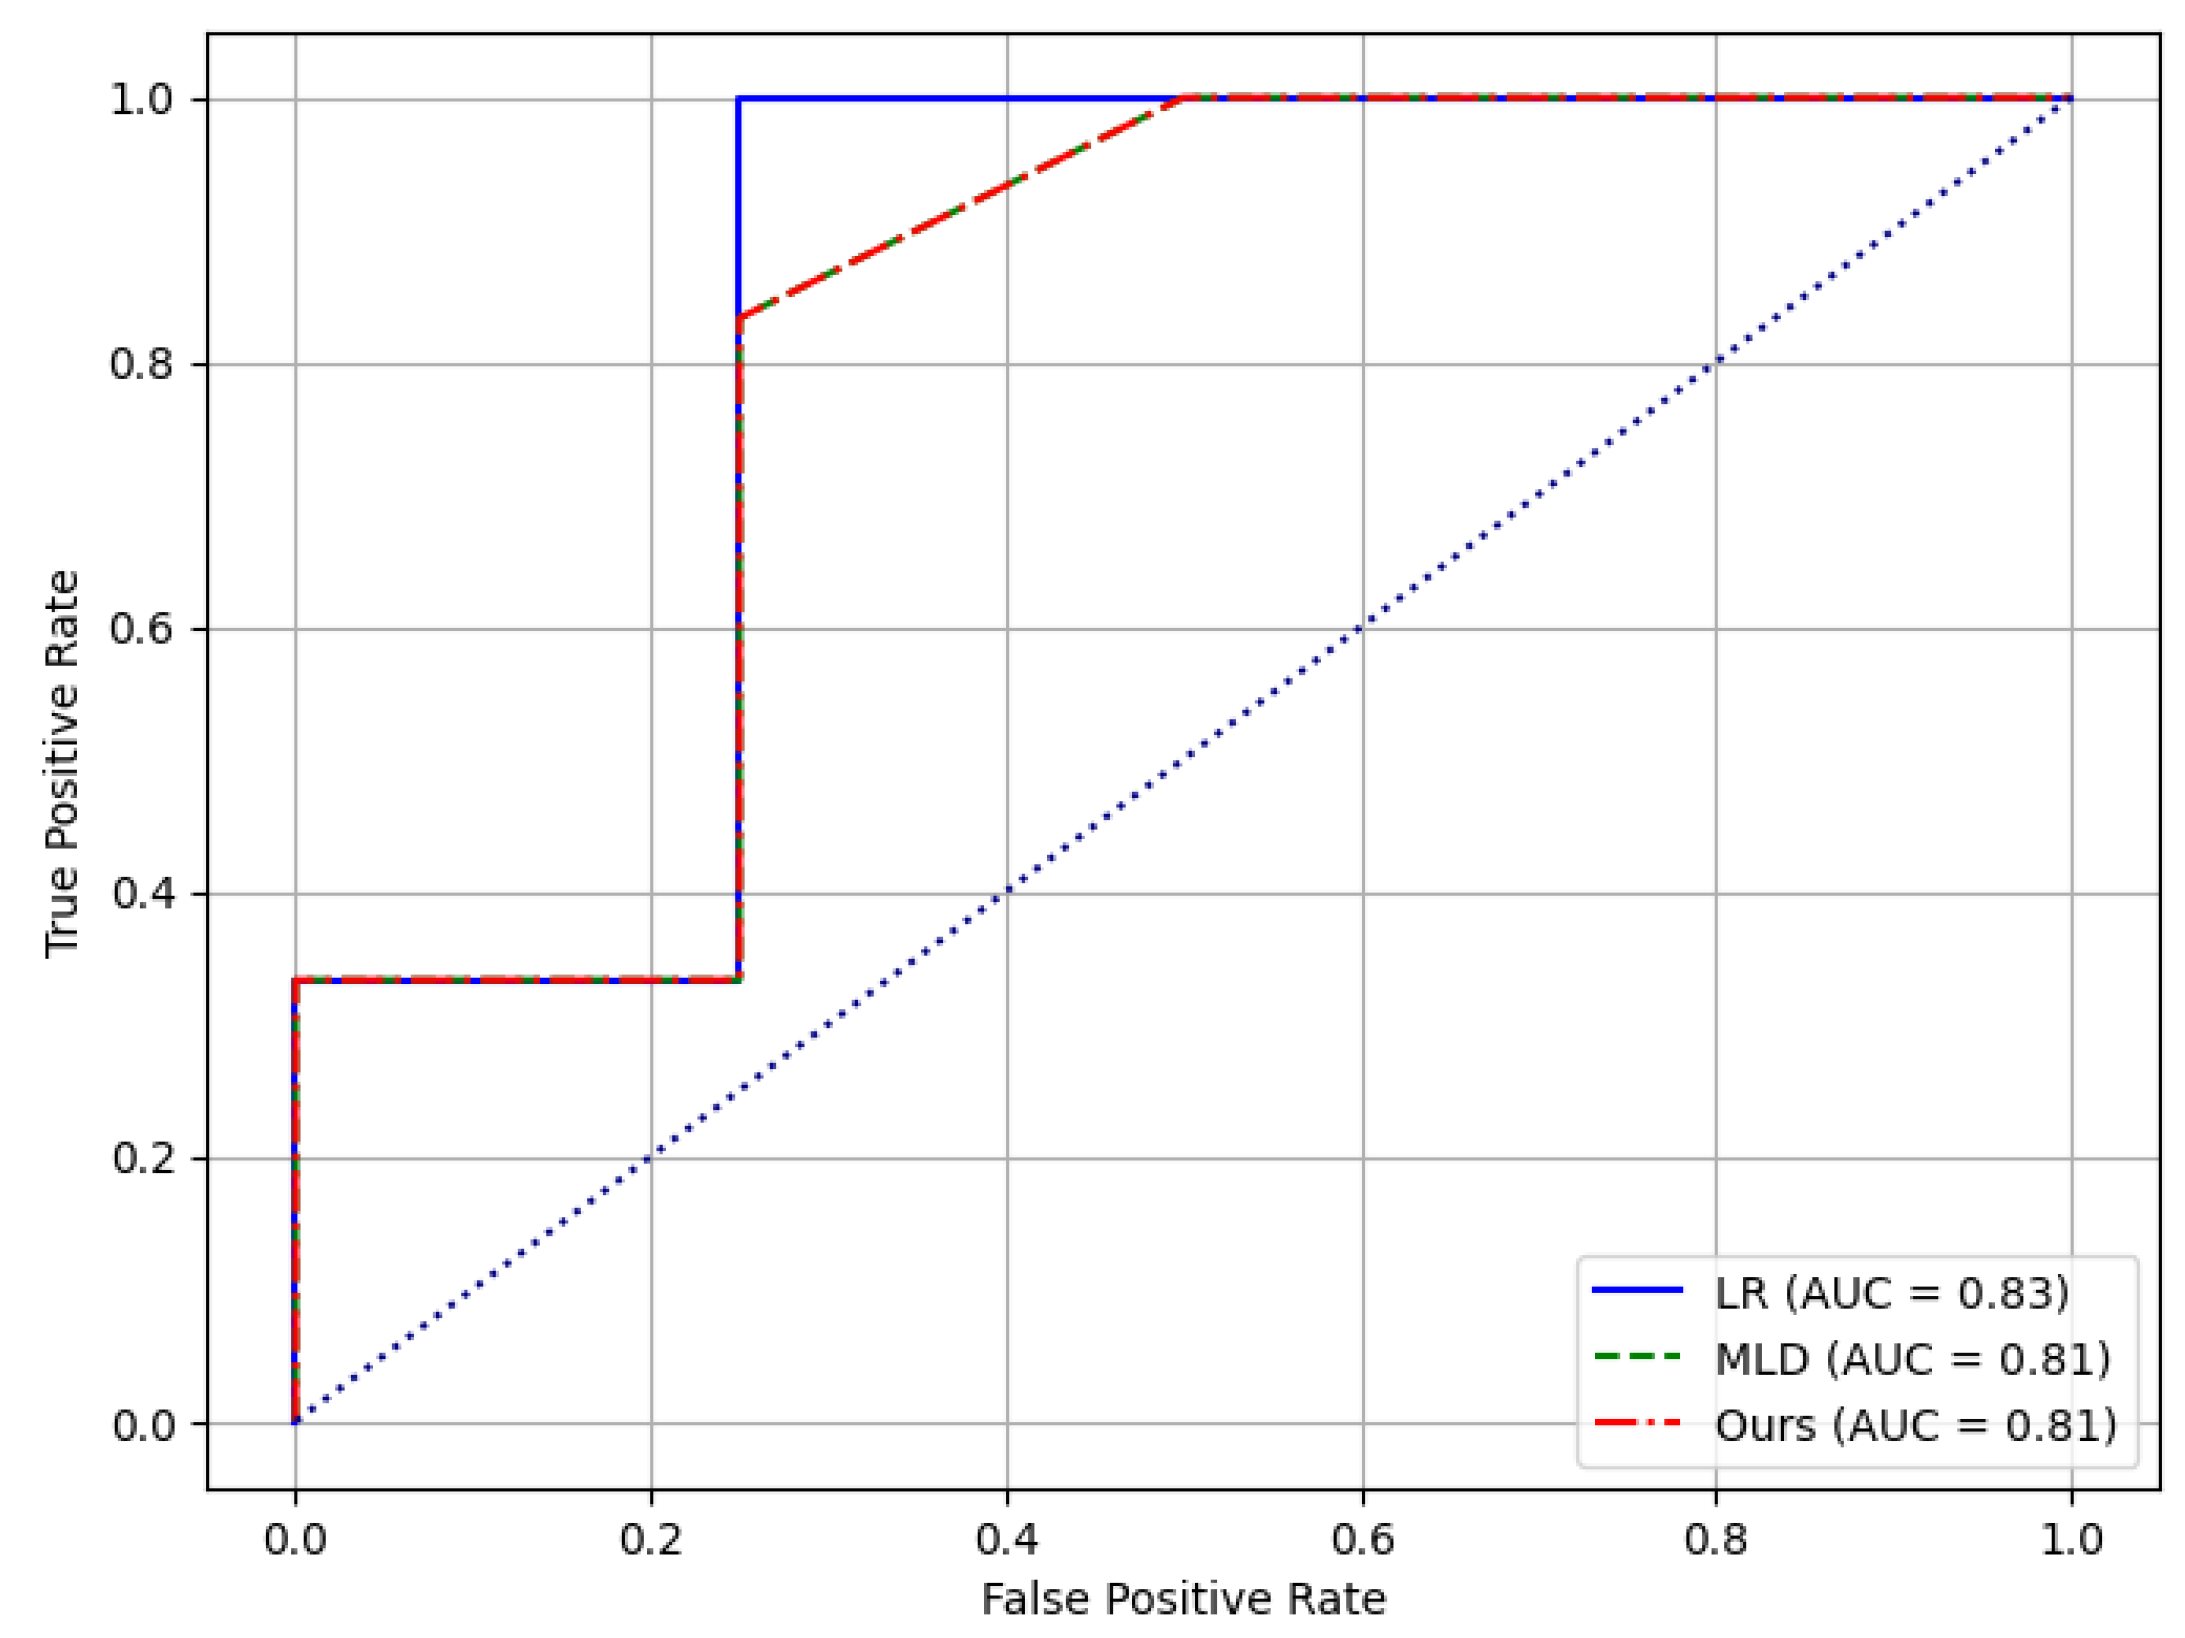
Additionally, receiver operating characteristic curve (ROC) shows the relationship between true case rate (TPR, the same as recall) and false positive rate (FPR) at different threshold settings. The area under the curve measures the area under the receiver operating characteristic curve, ranging from 0 to 1, the higher the area under the curve value, the better the classification performance of the model. It is a metric that evaluates the overall performance of a model at various classification thresholds. Following
Figure 2 compares the ROC curves results.
The best performance of our models may be attributed to its more sophisticated data processing capabilities and optimized learning algorithms, which allow the models to learn from the data more efficiently and capture more nuanced data features and patterns. Logistic regression, while relatively simple, still shows robust performance due to its intuitive model and few parameters.
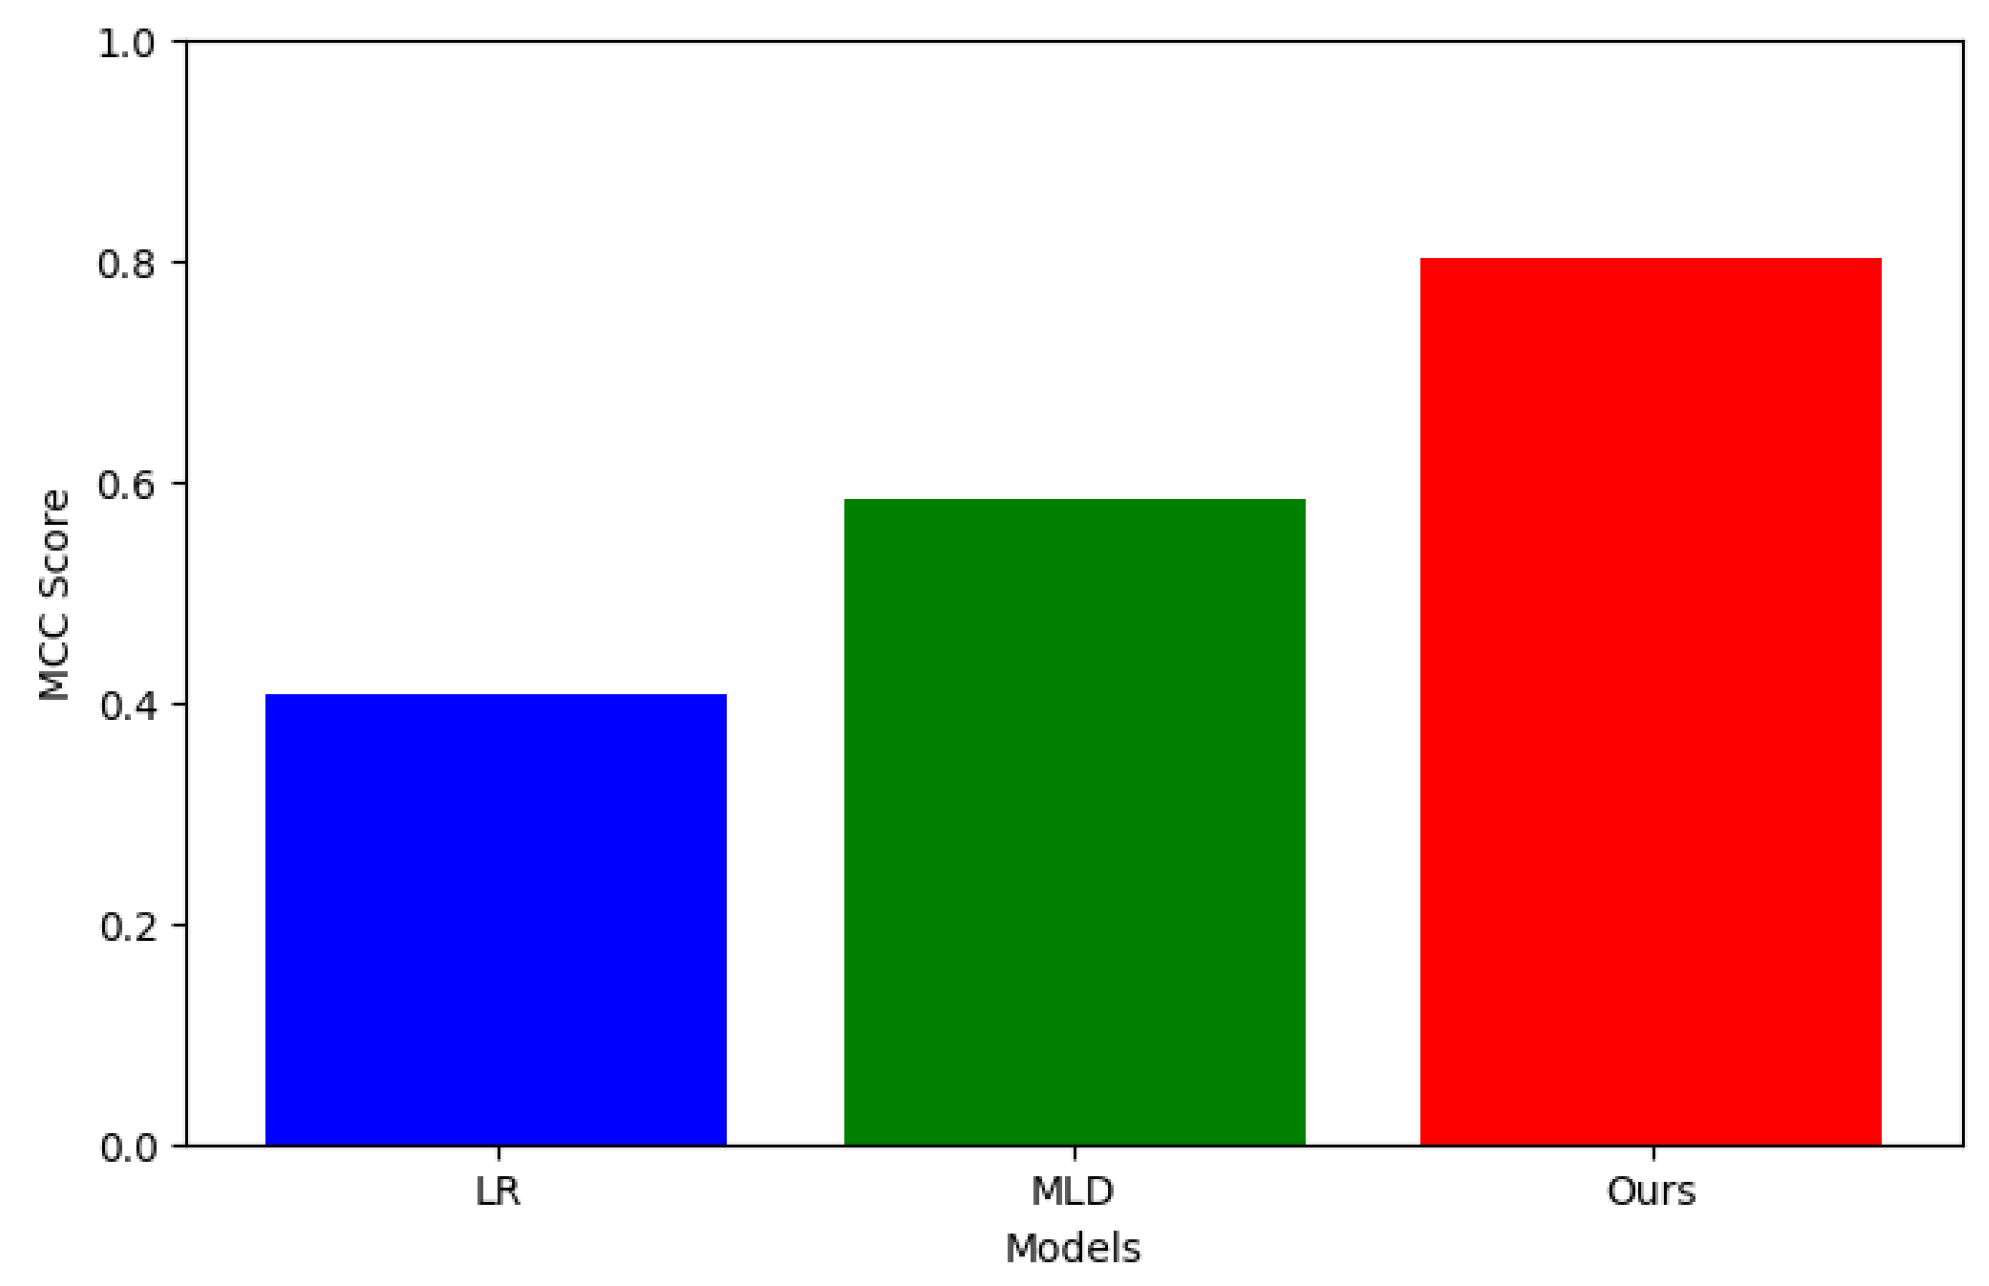
The Matthews correlation coefficient (MCC) is a composite index that takes into account true, false, true, and false negatives, and its values range from -1 to 1. MCC is a balanced measure that provides useful performance metrics even in the case of unbalanced categories. Following
Figure 3 compares the Matthews correlation coefficient among different models.
5. Conclusion
In conclusion, we utilize deep recurrent neural networks to effectively predict and analyze time-series financial data. Our experiments show that this approach performs well in capturing the time-dependent and non-linear nature of the data, providing accurate predictions of market trends and value movements. Despite the challenges of overfitting and data scarcity, future research will focus on model optimization and integration with traditional financial theories to improve the applicability and robustness of models in real financial markets.
References
- Lappas, Pantelis Z., and Athanasios N. Yannacopoulos. "A machine learning approach combining expert knowledge with genetic algorithms in feature selection for credit risk assessment." Applied Soft Computing 107 (2021): 107391. [CrossRef]
- Estran, Remy, Antoine Souchaud, and David Abitbol. "Using a genetic algorithm to optimize an expert credit rating model." Expert Systems with Applications 203 (2022): 117506. [CrossRef]
- Batchu, Ravi Kumar. "Artificial Intelligence in Credit Risk Assessment: Enhancing Accuracy and Efficiency." International Transactions in Artificial Intelligence 7.7 (2023): 1-24.
- Qin, Chao, et al. "XGBoost optimized by adaptive particle swarm optimization for credit scoring." Mathematical Problems in Engineering 2021 (2021): 1-18. [CrossRef]
- Shi, Si, et al. "Machine learning-driven credit risk: a systemic review." Neural Computing and Applications 34.17 (2022): 14327-14339. [CrossRef]
- Breeden, Joseph. "A survey of machine learning in credit risk." Journal of Credit Risk 17.3 (2021). [CrossRef]
- Sohn, So Young, and Yoon Seong Kim. "Behavioral credit scoring model for technology-based firms that considers uncertain financial ratios obtained from relationship banking." Small Business Economics 41 (2013): 931-943. [CrossRef]
- Abid, Lobna, Afif Masmoudi, and Sonia Zouari-Ghorbel. "The consumer loan’s payment default predictive model: an application of the logistic regression and the discriminant analysis in a Tunisian commercial bank." Journal of the Knowledge Economy 9 (2018): 948-962. [CrossRef]
- Zhang Chenghu, Li Yulin, and Wu Ming. "Research and Empirical Analysis of Personal Credit Scoring Model Based on Discriminant Analysis." Journal of Dalian University of Technology: Social Sciences 1 (2009): 6-10.
- Lecamwasam, Harish S., et al. "The flow regimes and the pressure-flow relationship in the canine urethra." Neurourology and urodynamics 18.5 (1999): 521-541.
|
Disclaimer/Publisher’s Note: The statements, opinions and data contained in all publications are solely those of the individual author(s) and contributor(s) and not of MDPI and/or the editor(s). MDPI and/or the editor(s) disclaim responsibility for any injury to people or property resulting from any ideas, methods, instructions or products referred to in the content. |
© 2024 by the authors. Licensee MDPI, Basel, Switzerland. This article is an open access article distributed under the terms and conditions of the Creative Commons Attribution (CC BY) license (http://creativecommons.org/licenses/by/4.0/).


