1. Introduction
Many macroscopic production laws of oil reservoirs and the seepage characteristics of reservoirs are comprehensive reflections of the microscopic structure and pore scale fluid migration in the reservoir layers, meaning that the microscopic structure of the rocks and the properties of the fluids are fundamental, while the macroscopic characteristics are mere appearances. To enhance crude oil recovery in fields with high water content in the later stages, it is not only necessary to study at the macroscopic level and production dynamics of the reservoir layers, but also essential to delve into the internal pore structure of the reservoir layers to describe the dynamic characteristics of multiphase fluids and to study the laws at the microscopic pore scale.
The heterogeneity of the reservoir layers greatly affects the macroscopic sweep efficiency, and the degree to which the original oil in the swept areas is mobilized is closely linked to the heterogeneity of the microscopic pore-throat structure. This involves the size and distribution characteristics of pores and throats, pore-throat coordination number, pore-throat ratio, etc. Even reservoir layers that appear homogenous at a macroscopic level will inevitably have some microscopic heterogeneity. Conventional research methods cannot describe the impact of microscopic heterogeneity on the mobilization process of crude oil [
1,
2]. For instance, basic rock slices or glass etching models are ideal [
3,
4,
5,
6,
7], but they cannot present the utilization of crude oil in three-dimensional space and the distribution characteristics of remaining oil. Conventional experiments on the heterogeneity of pore structure are basically limited to qualitative comparisons and cannot quantitatively characterize the impact of the microscopic heterogeneity of pore-throat structure on the mobilization of crude oil and the distribution and morphology of remaining oil.
Tight sandstone reservoirs, due to complex sedimentation and diagenesis, are characterized by generally low porosity, low permeability, complex pore structure, development of secondary porosity, and fine throats [
8,
9,
10]. China’s tight sandstone oil and gas reservoir resources are abundant, hence holding great potential for development. The complexity of the pore structure characteristics of tight sandstone makes it difficult to accurately characterize them, which is a major challenge in the exploration and development of tight sandstone oil and gas reservoirs. Therefore, accurately characterizing the pore structure characteristics of tight sandstone reservoirs is significant for improving the exploration and development level of tight sandstone oil and gas reservoirs, modifying tight sandstone oil and gas reservoirs, increasing the production of tight sandstone oil and gas, and solving practical problems in civil and hydraulic engineering.
2. The Impact of Pore Size Distribution on Various Types of Remaining Oil
2.1. The Impact of Pore Size Distribution on Various Types of Remaining Oil
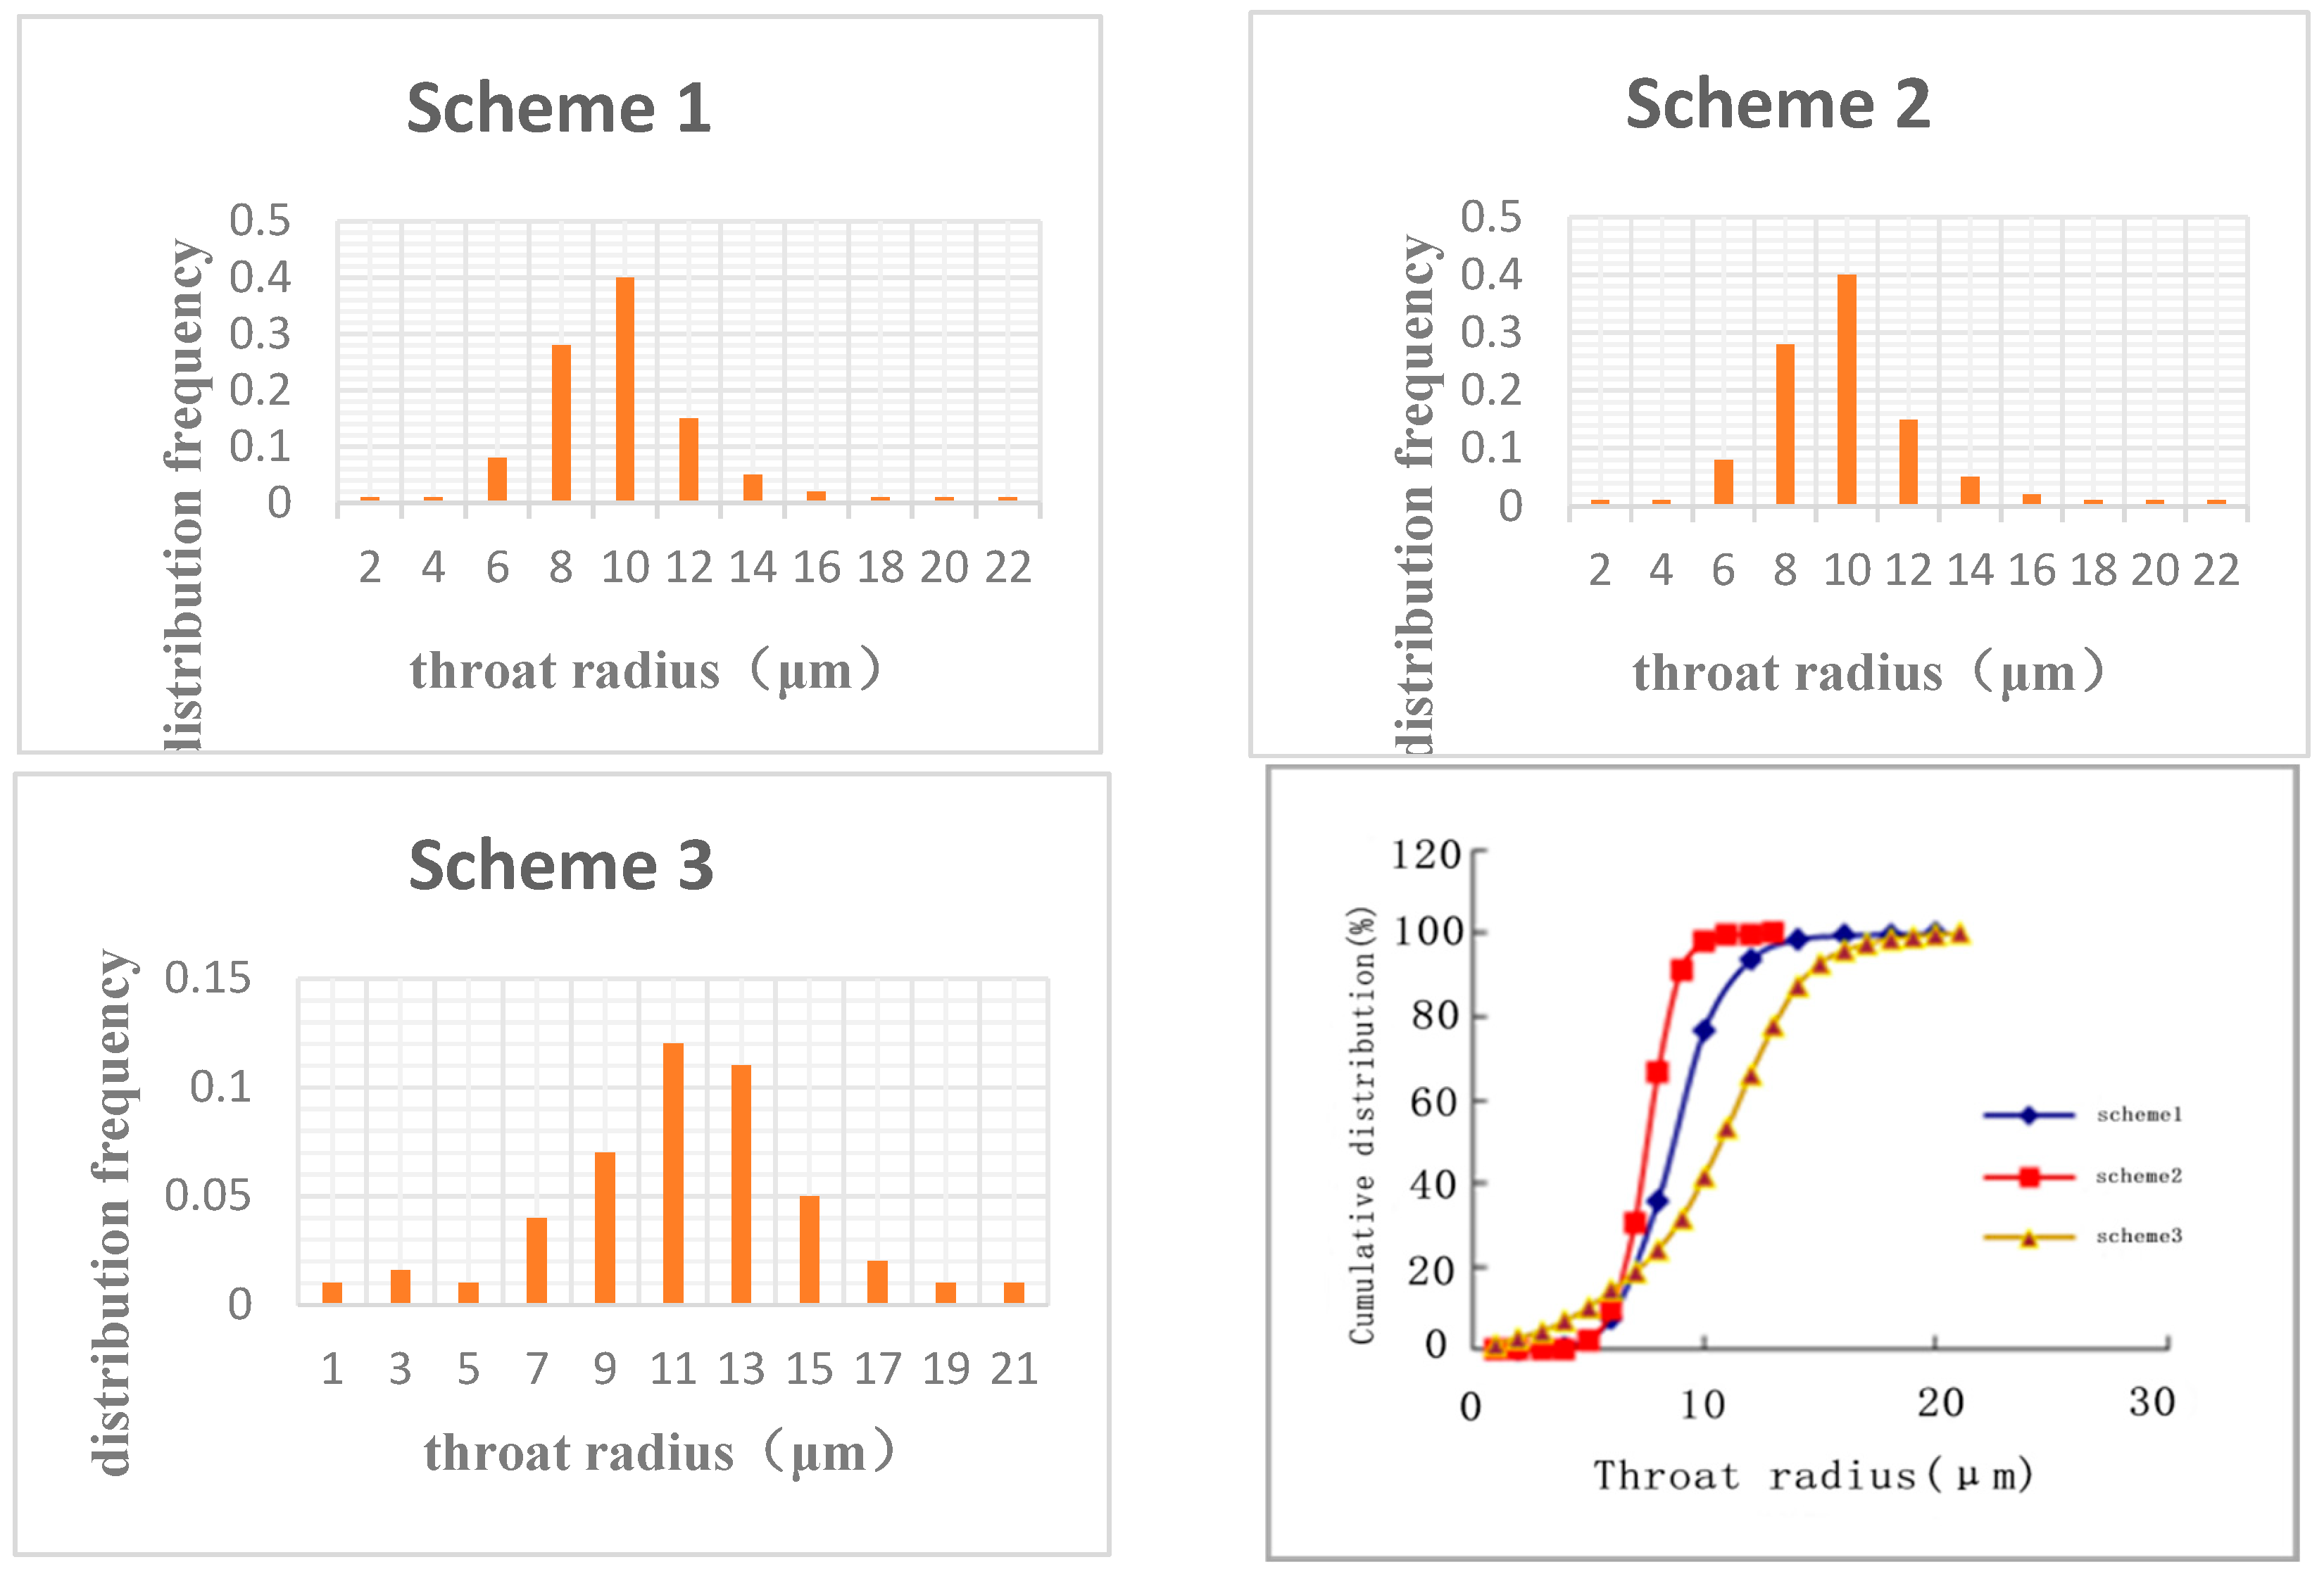
The throat radius is a fundamental parameter in the digital pore model. The recovery ratio value of the model is closely related to the size of the throat radius. In this study, models built on the throat radius distribution frequency of three actual rock cores are used to investigate the impact of pore size distribution on recovery ratio, with all other parameters held constant.
Figure 1 shows the throat radius distribution frequency and cumulative distribution frequency for the three schemes.
As shown in
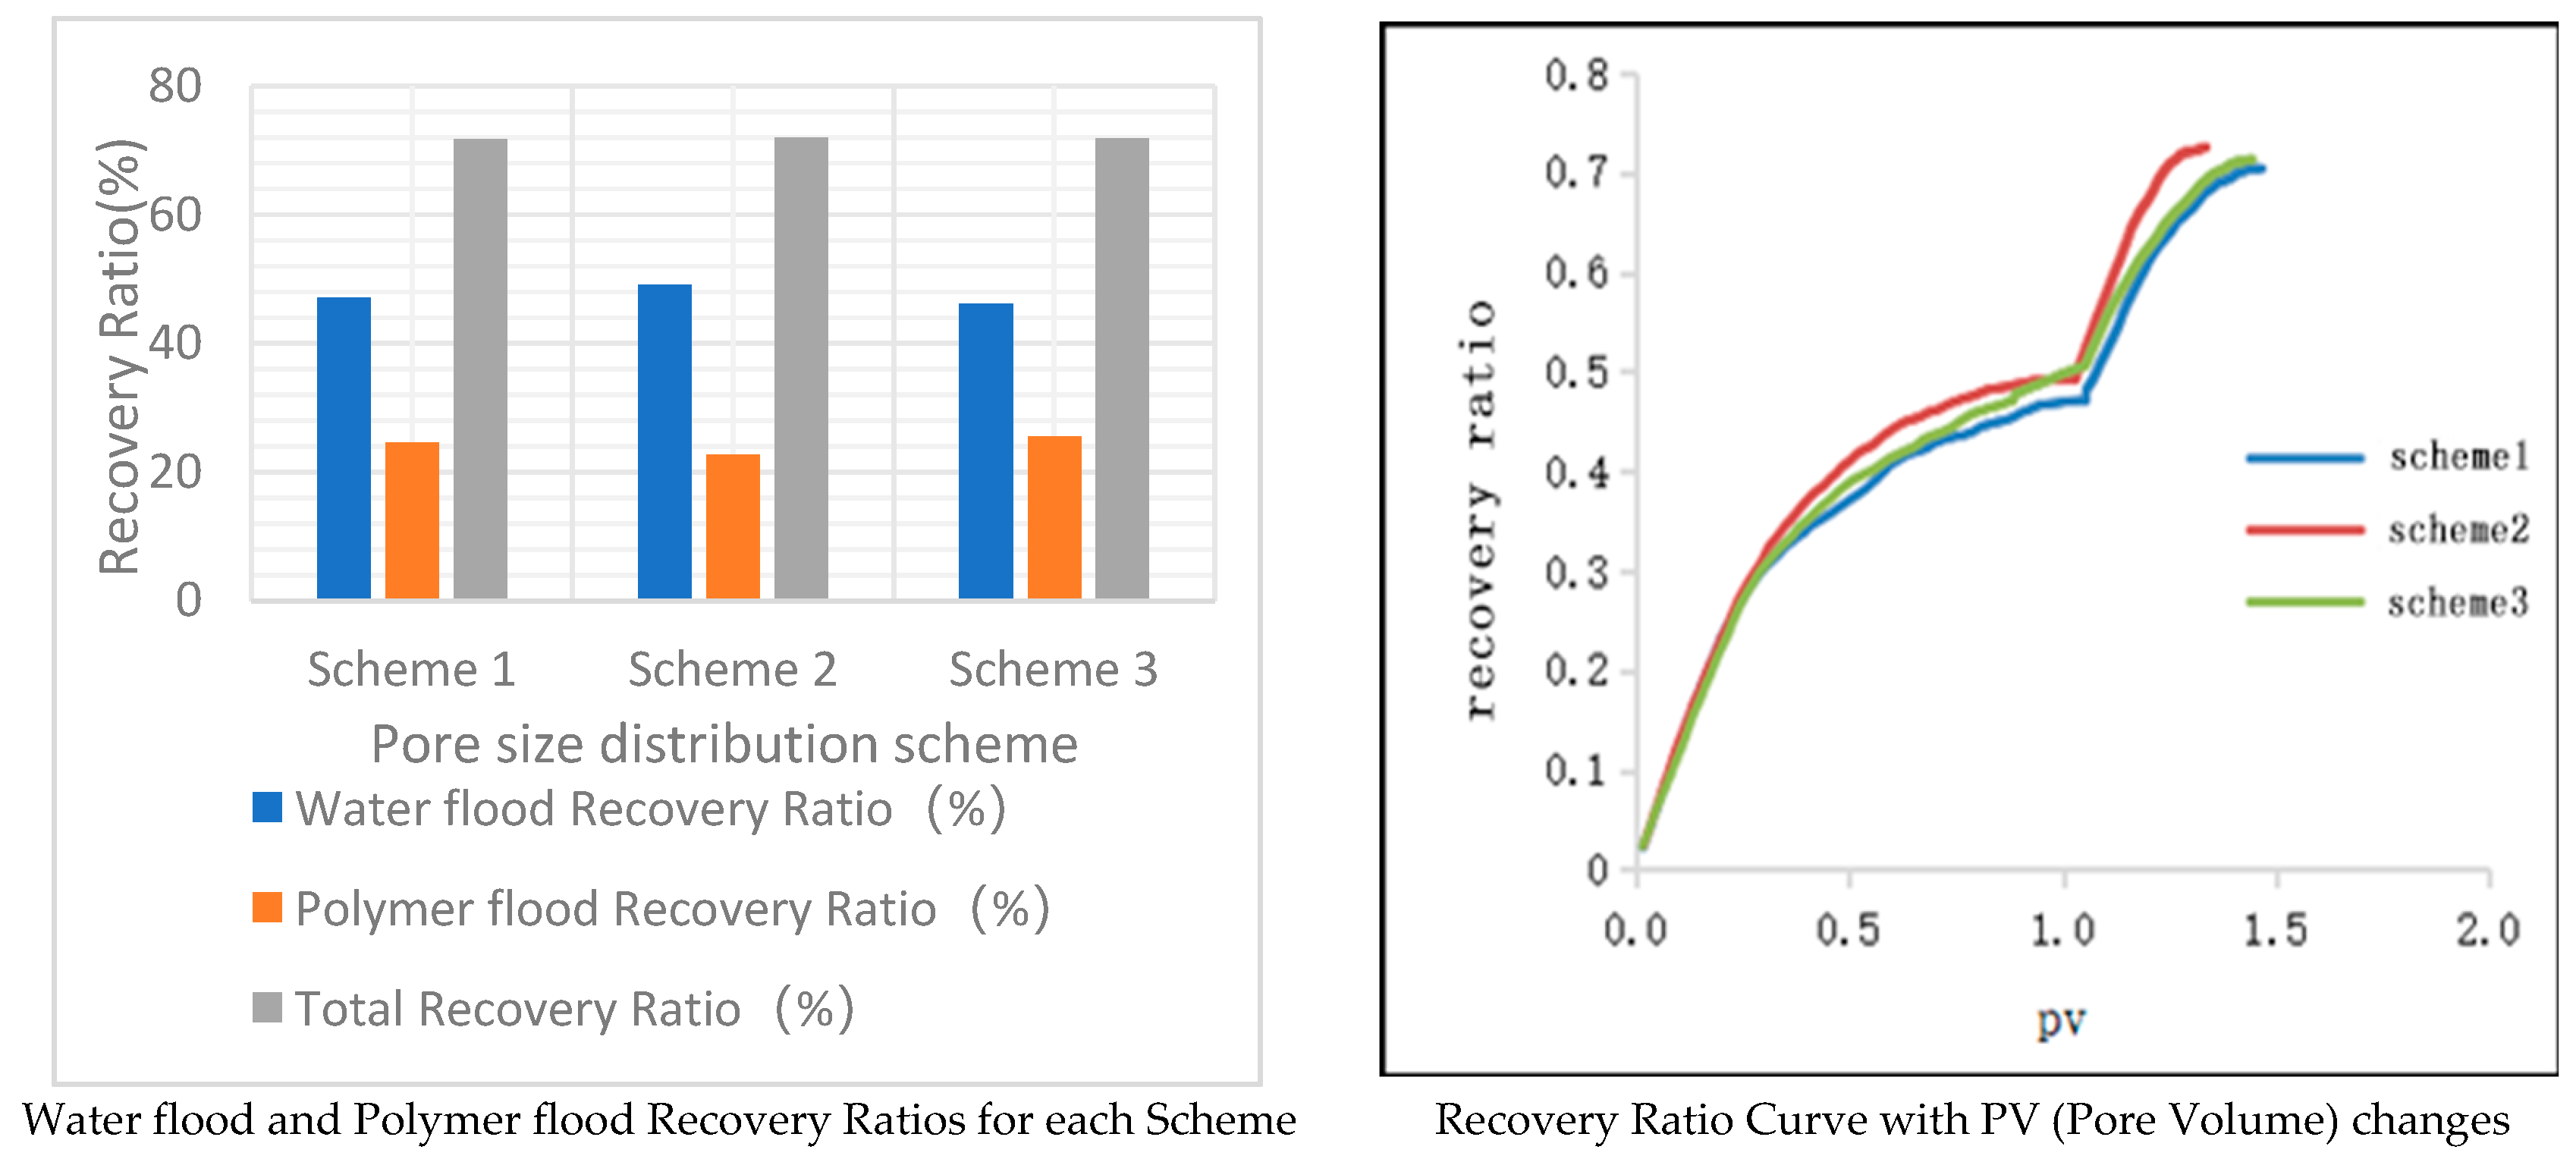
Table 1 below, the table presents the water flooding recovery ratio, polymer flooding recovery ratio, and total recovery ratio for the three schemes.
Figure 2 delineates the recovery efficiency metrics and their respective variations in response to the number of pore volumes (PVs) for distinct operational schemes. Scheme 1 and Scheme 2 exhibit analogous permeability coefficients, albeit marginally inferior to that of scheme 3. In schemes 1 and 2, the distribution of pore-throats is notably concentrated, with the proportion of pores possessing radii within the 6μm to 14μm range reaching a substantial 97%. Conversely, scheme 3 is characterized by a more dispersed pore-throat distribution, with the fraction of pore-throats exceeding 14μm in radius nearing 13%, hence yielding a greater permeability coefficient for scheme 3. Additionally, the water drive recovery ratio in scheme 3 is comparatively lower, attributed to the presence of over 10% of throats with sub-6μm radii, which impedes the extraction of crude oil from these minuscule apertures during the water drive process. Consequently, schemes 1 and 2 manifest elevated water drive recovery ratios. Owing to the influence of the viscoelastic properties of polymers on the fluid dynamics within these diminutive pores, scheme 3 experiences a more pronounced effect, facilitating the expulsion of a greater quantum of water-drive residuals. Ergo, upon juxtaposing the polymer drive recovery ratios across schemes 1, 2, and 3, it is observed that scheme 3 achieves the apex in recovery efficiency.
2.2. Study on the Distribution and Patterns of Remaining Oil
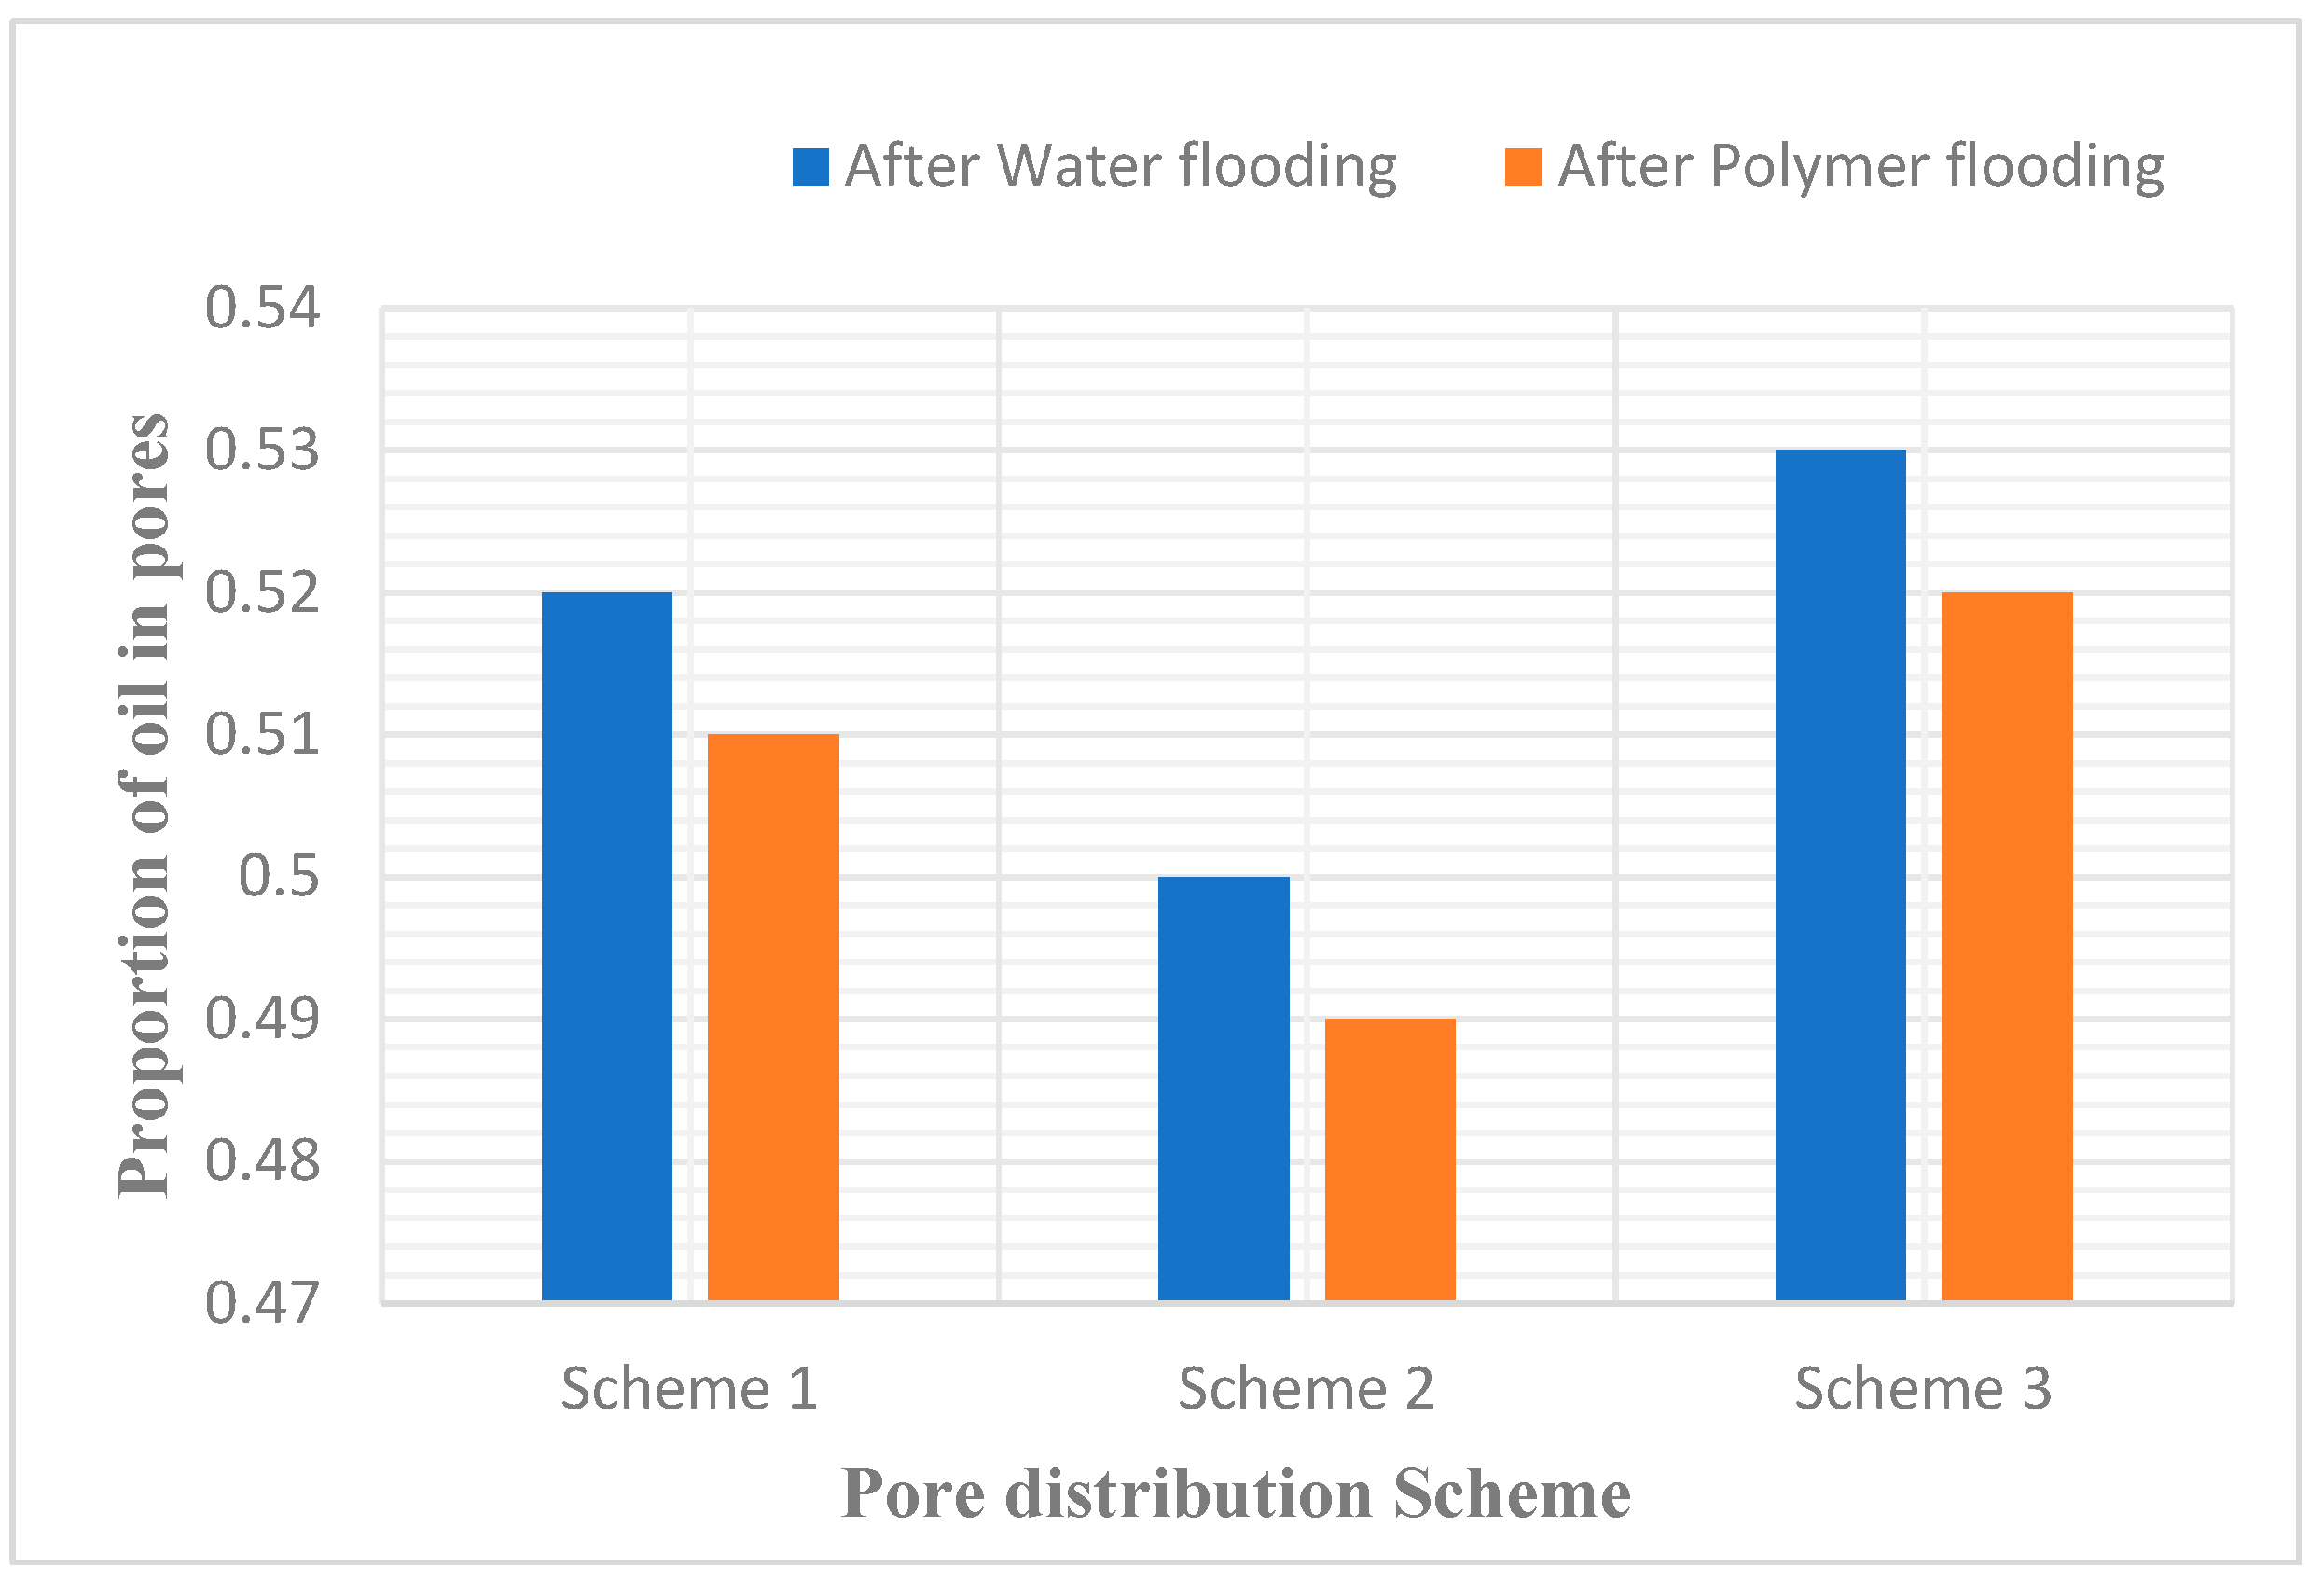
The model quantitatively assesses the oil-bearing porosity subsequent to water flooding and polymer flooding by enumerating the number of pores containing oil in each case.
Table 2,
Table 3 and
Table 4 depict the proportional distribution of different oil saturation levels within the pores post water flooding and polymer flooding. It is observed that scheme 3 exhibits the highest count of pores with a saturation level of zero following water flooding, and similarly, the greatest number of pores with an oil saturation level of zero following polymer flooding. An analysis based on
Table 2 reveals that the proportions of oil-containing pores post water flooding in schemes 1, 2, and 3 are 0.38, 0.39, and 0.36 respectively, and post polymer flooding, these proportions are 0.37, 0.38, and 0.35 respectively. It is evident that scheme 3 has the lowest proportion of oil-containing pores, correlating to the highest recovery ratio.
Figure 3.
Proportion of oil in pore after water drive and polymer flooding.
Figure 3.
Proportion of oil in pore after water drive and polymer flooding.
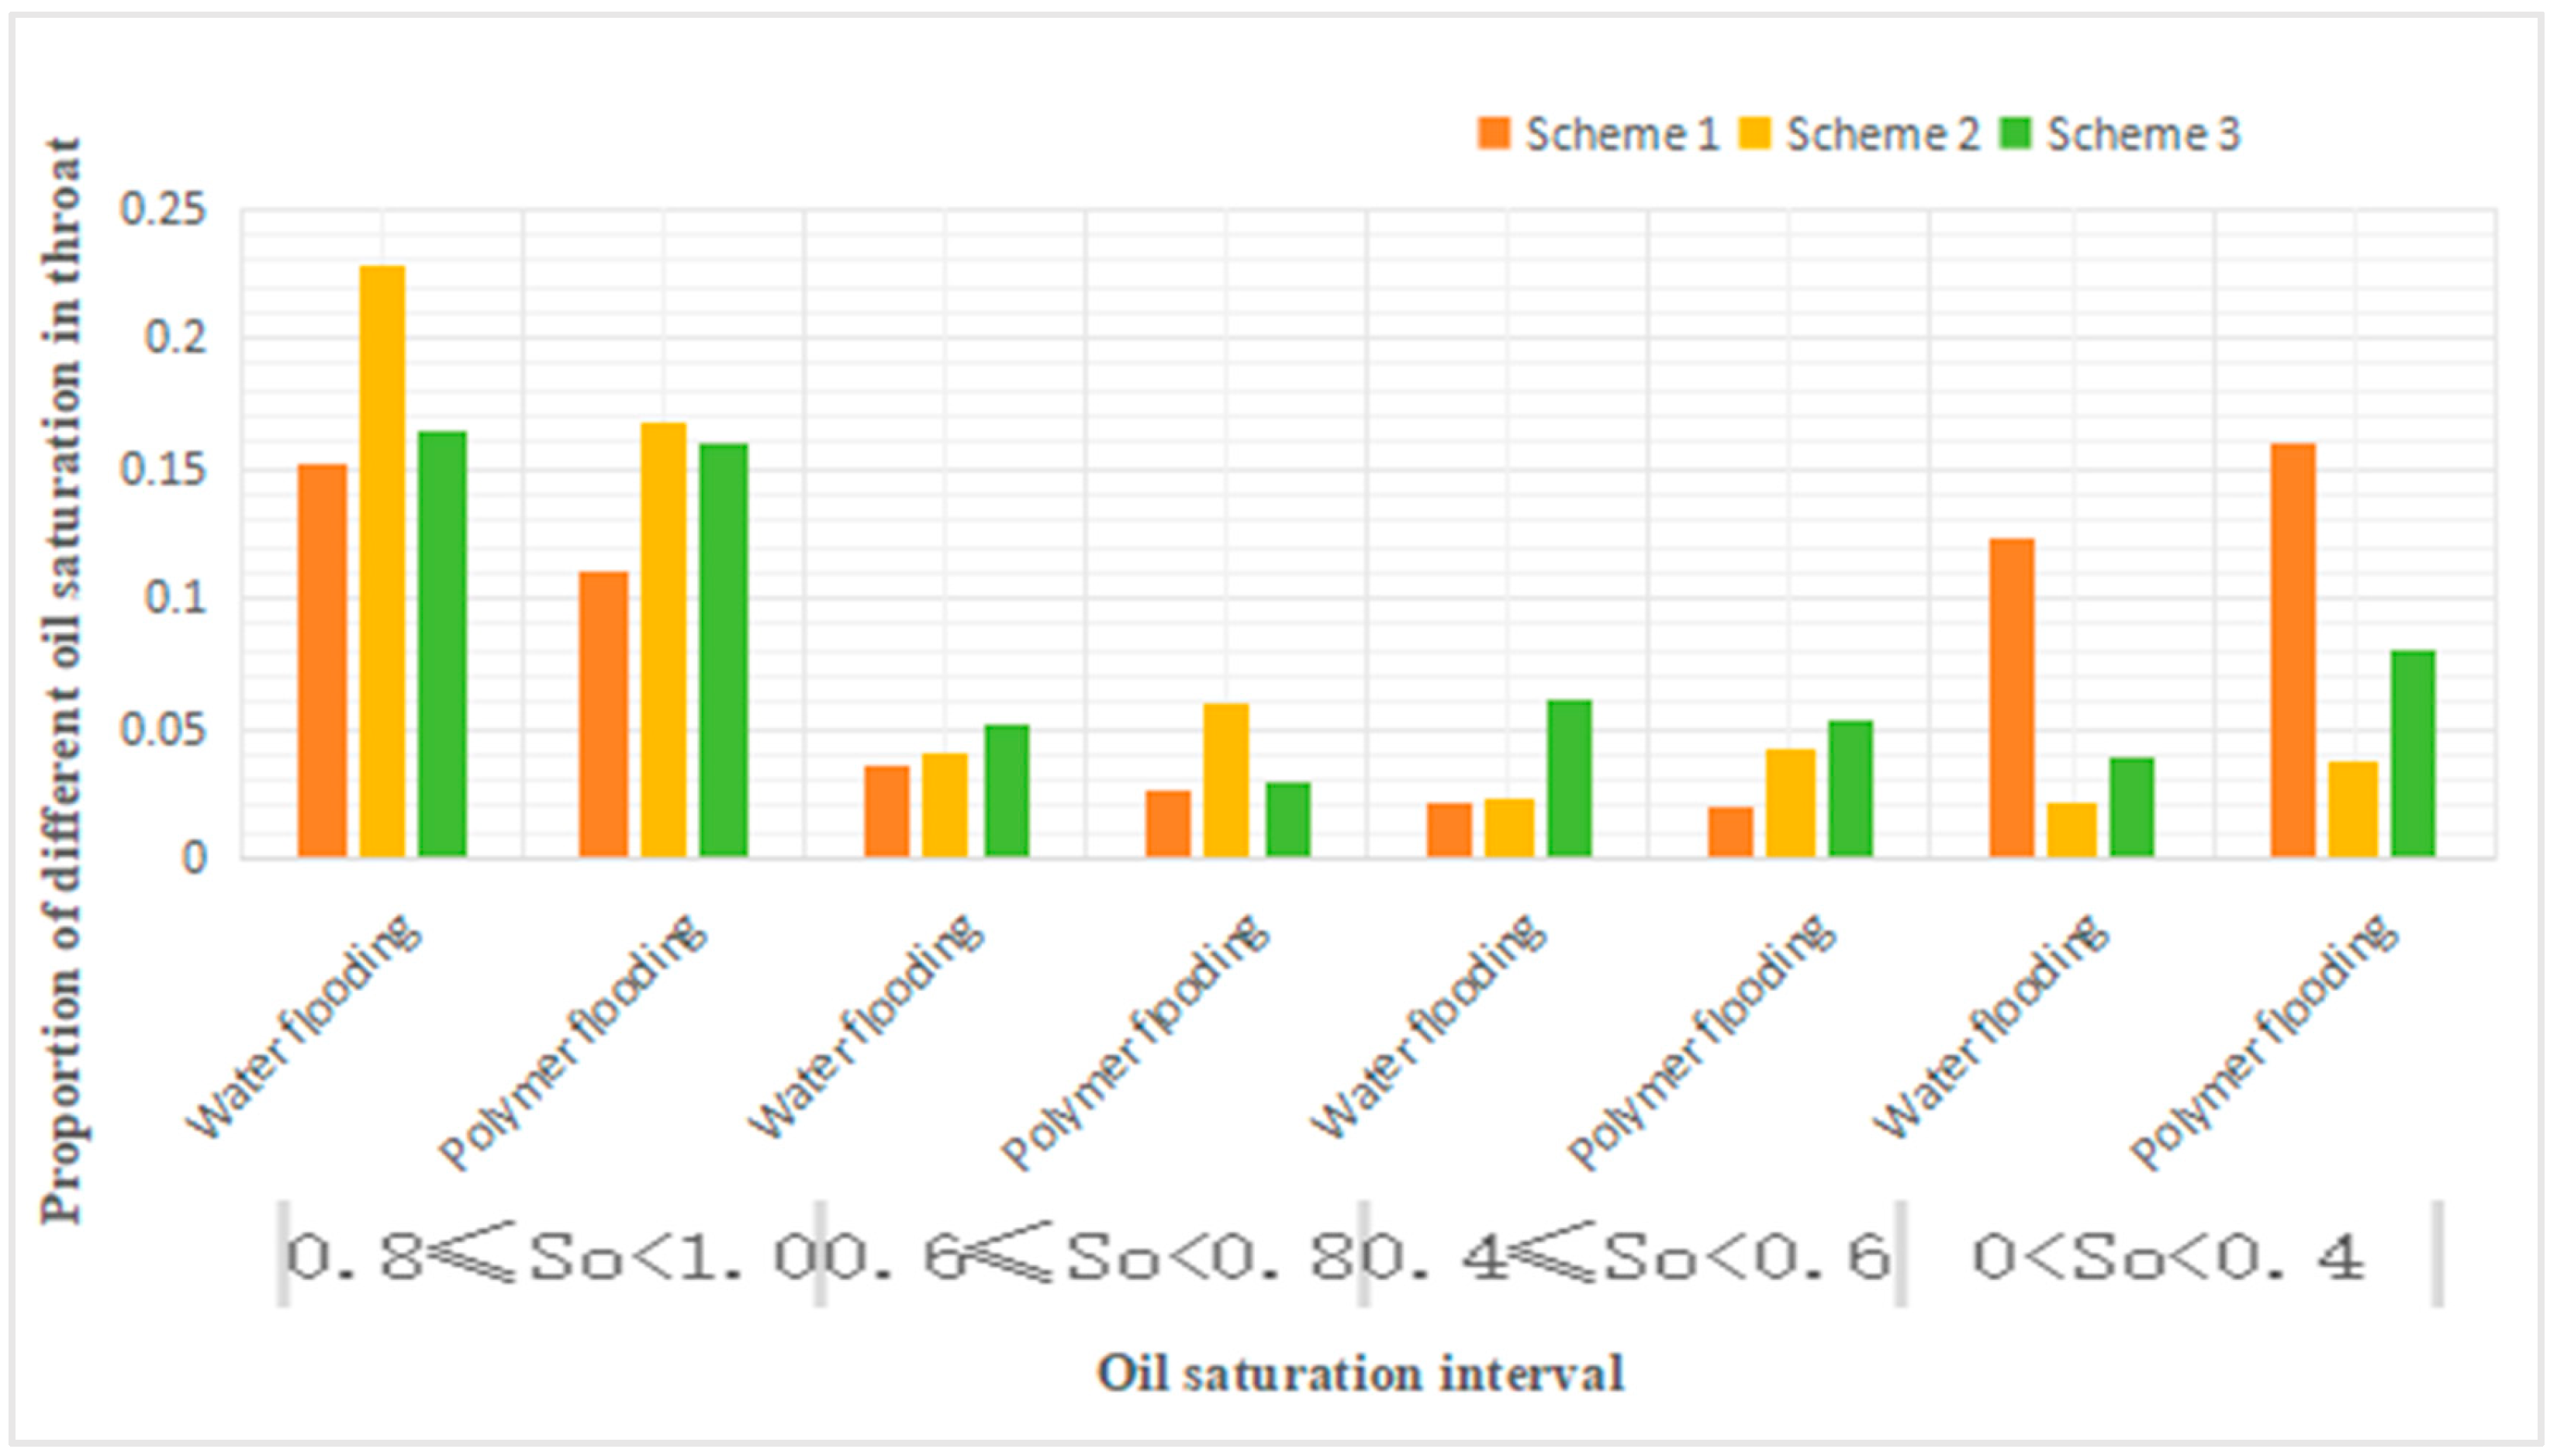
Figure 4.
Proportion of different oil saturation in throat.
Figure 4.
Proportion of different oil saturation in throat.
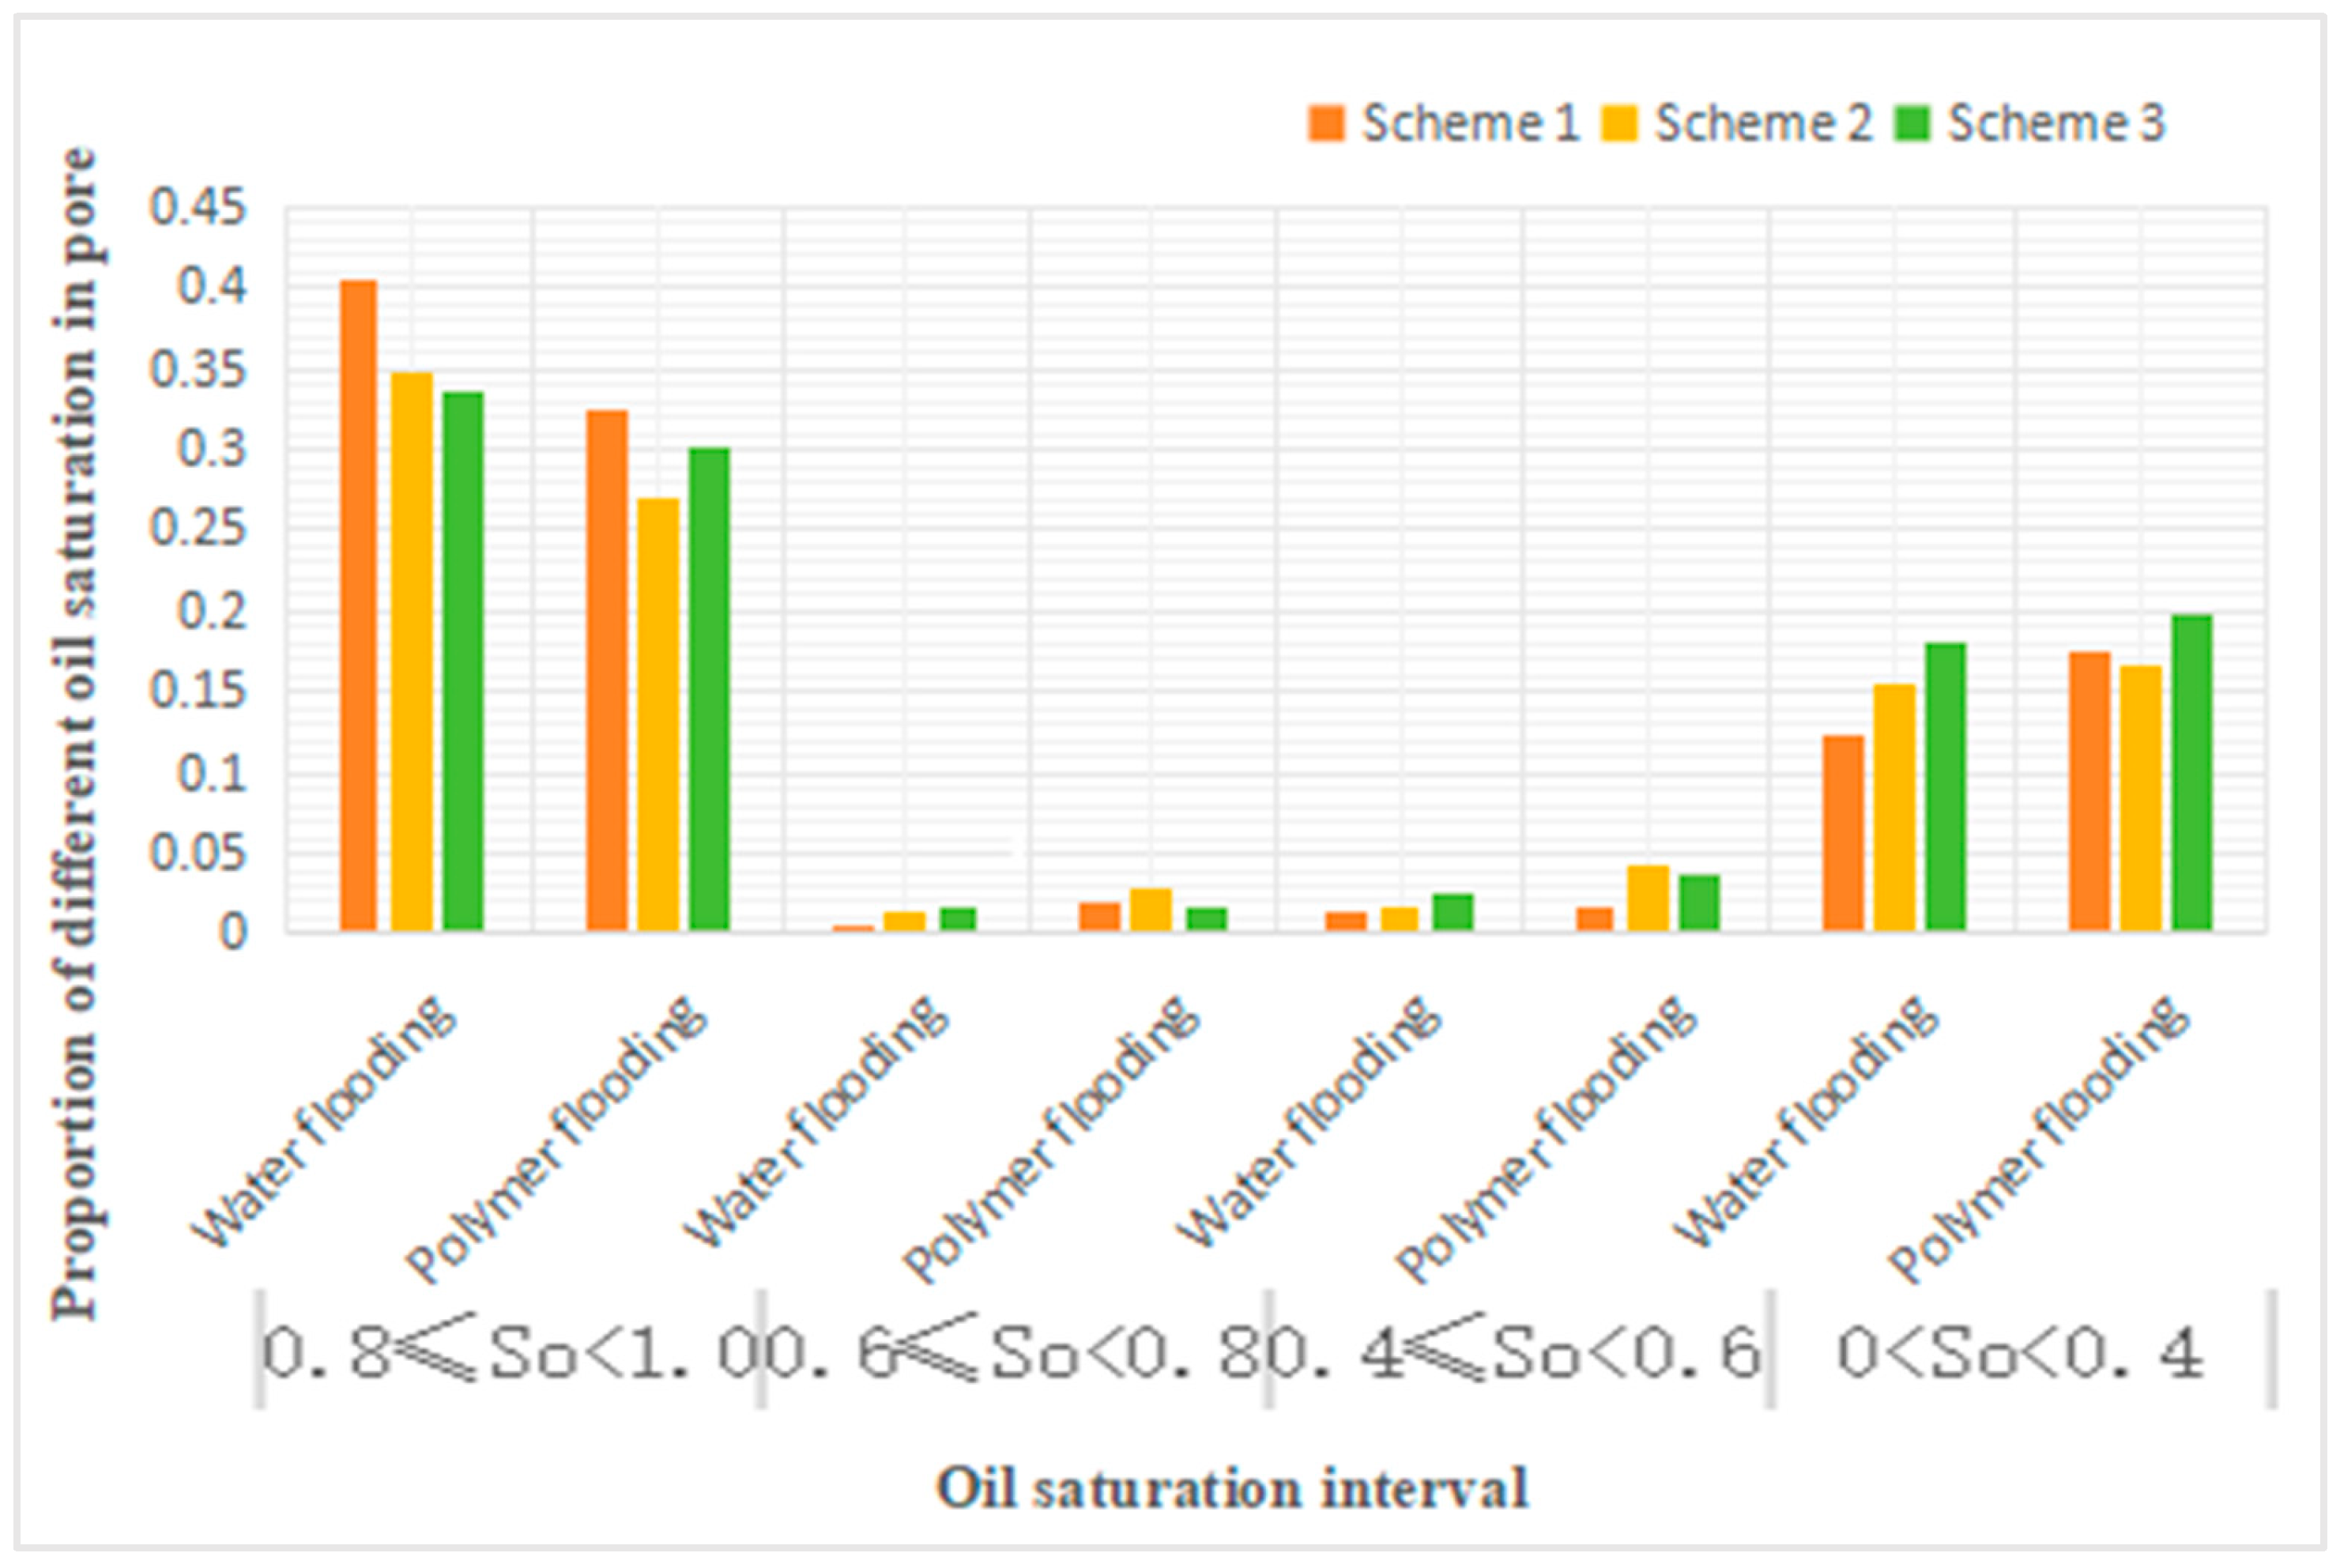
Figure 5.
Proportion of different oil saturation in pore.
Figure 5.
Proportion of different oil saturation in pore.
It can be discerned that, relative to water flooding, polymer flooding results in a reduction of throats with oil saturation levels between 1 and 0.8, while the quantities of throats with other saturation levels exhibit varying degrees of increase. Specifically, throats within the 0.8 to 0.6 saturation range demonstrate a decrement in schemes 1 and 2, ranging from 22.2% to 44.3%, whereas in scheme 3, this category exhibits an increment of 46.8%. Throats in the 0.6 to 0.4 range decrease by 6.1% and 12.6% in schemes 1 and 2 respectively, and increase by 85.7% in scheme 3. Throats in the 0.4 to 0 range show an increment across all schemes, with increases varying from 28.4% to 108.3%. Throats at 0 saturation level undergo changes of less than 3% in all schemes, which can be considered negligible.
Analysis of
Table 3 reveals that, in comparison to water flooding, polymer flooding leads to a decrease in pores with saturation levels between 1 and 0.8 in schemes 1 and 3, while other pore saturation levels increase. Scheme 2 exhibits the opposite trend.
Further examination of
Table 4 indicates that, when comparing polymer flooding to water flooding, the number of pores with saturation levels from 0.8 to 1 decreases across all schemes, with scheme 3 showing a modest reduction of 6.25%, as opposed to the approximate 24% decrease in schemes 1 and 2. Pores within the 0.6 to 0.8 saturation range decrease by 11% and 40% in schemes 1 and 3, respectively, and increase by 53% in Scheme 2. Pores in the 0.4 to 0.6 saturation range show no significant change in schemes 1 and 3, while doubling in scheme 2. Finally, pores with saturation levels from 0 to 0.4 exhibit varying degrees of increase in all schemes.
2.3. Types and Quantitative Analysis of Remaining Oil
Post polymer flooding, cross-sectional images depicting the oil distribution were captured and rendered for models with three distinct throat radius distributions, as shown in
Figure 6. Specifically, image (a) represents the remaining oil distribution in the model generated according to scheme 1, image (b) for the model following scheme 2, and image (c) for the model based on scheme 3.
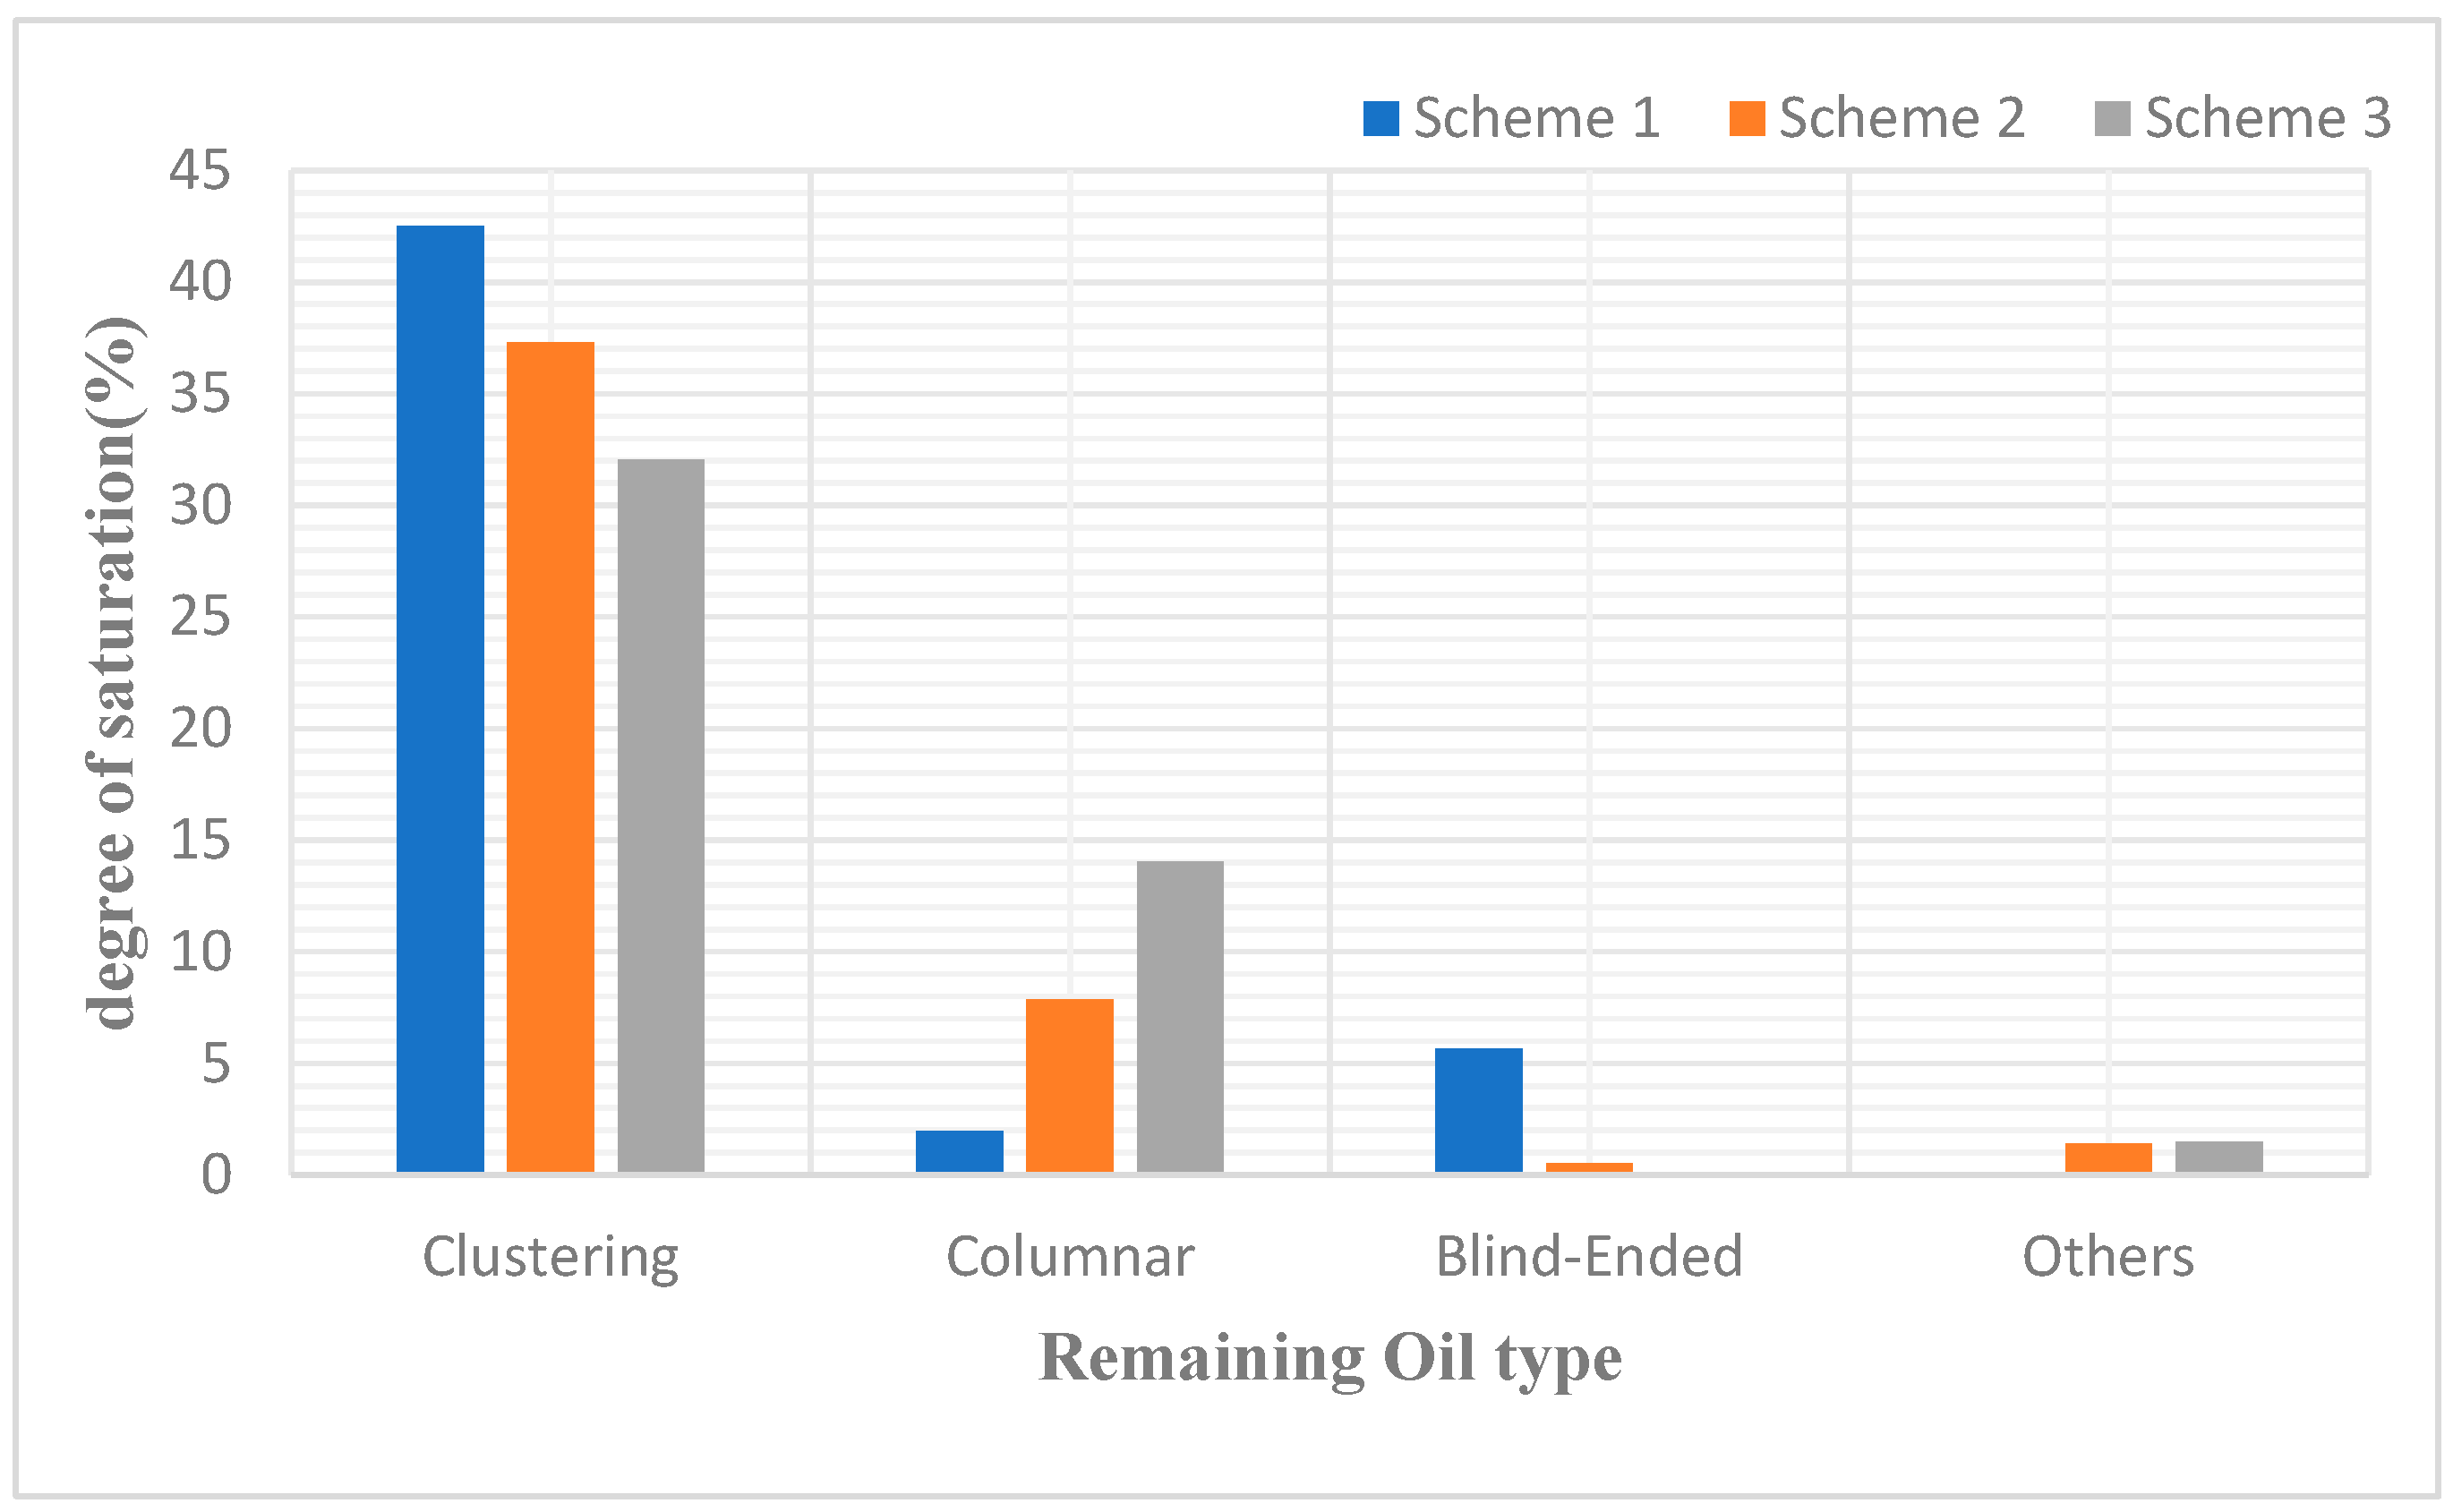
Table 5 provides an analysis of these images, encompassing the identification of remaining oil types and the quantification of their saturation levels in each scheme.
The outcomes of the simulation indicate that alterations in the distribution of pore sizes lead to a diminution in the prevalence of clustered remaining oil, concurrently accompanied by an augmentation in the quantity of columnar remaining oil, with other remaining oil types manifesting stochastic fluctuations. This observed trend is attributed to the augmented permeability resultant from variations in the throat radius, which effectively promotes the displacement of sizeable aggregates of clustered remaining oil into more dispersed morphologies.
3. The Impact of Coordination Number on Various Types of Remaining Oil
3.1. The Impact of Coordination Number on Various Types of Remaining Oil
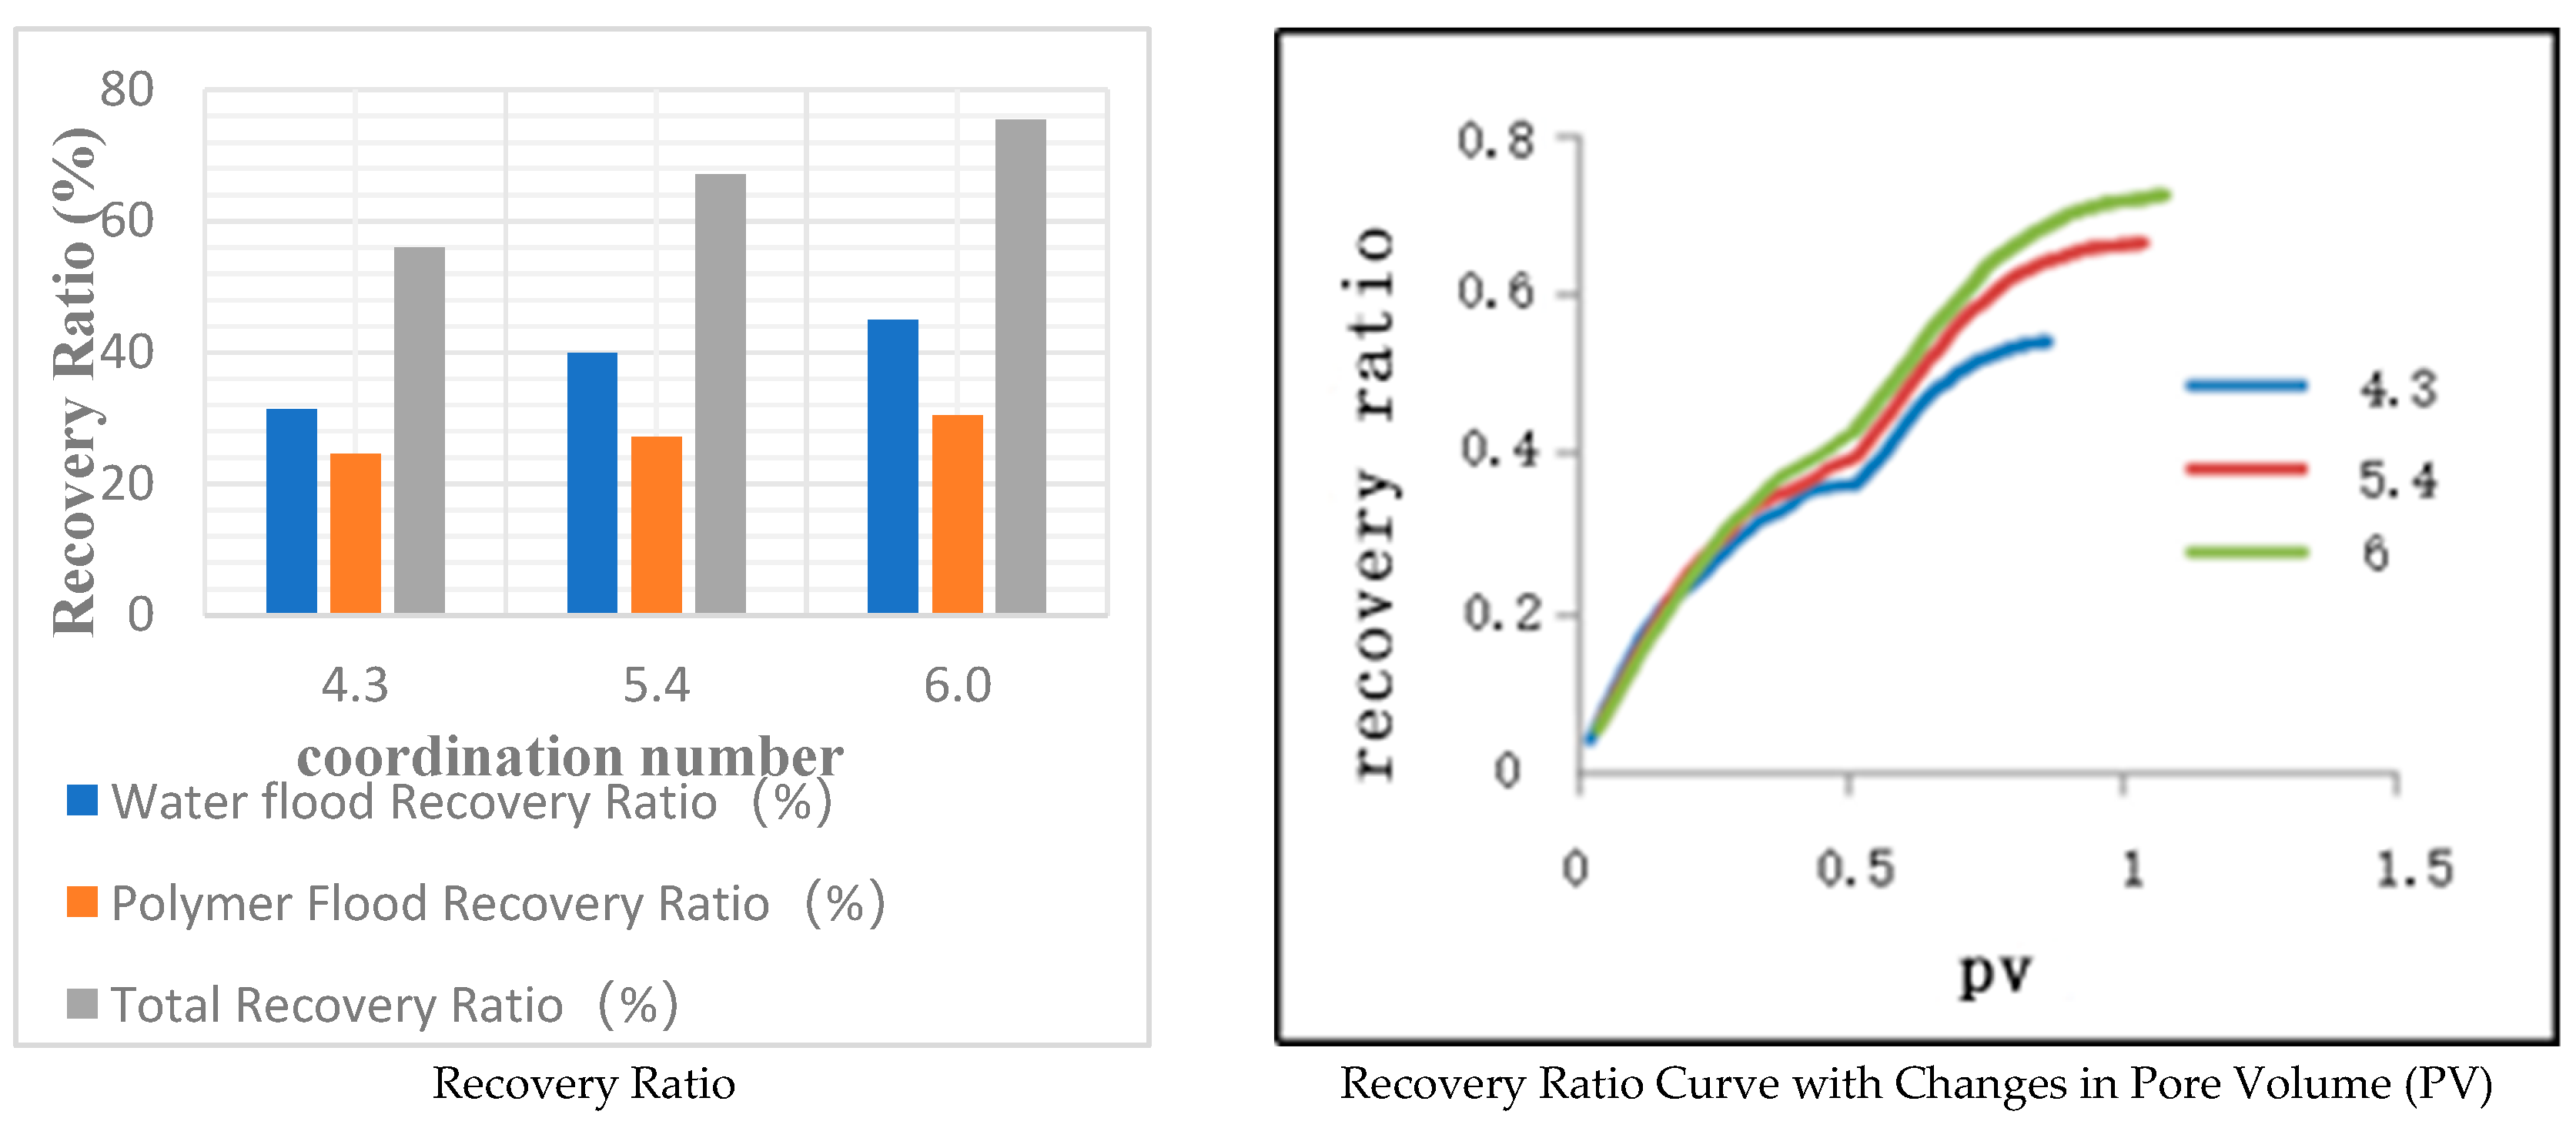
In this study, based on scheme 2, digital pore models were constructed with average coordination numbers set at 4.3, 5.4, and 6.0, while keeping other parameters constant. The water flooding phase concluded at a pore volume (PV) of 0.514, followed by polymer flooding until reaching a water cut of 98%, for the purpose of calculating the polymer flooding Recovery Ratio. The results are detailed in
Table 6 and illustrated in
Figure 8. Analysis of these graphical and tabular representations indicates that an increase in the coordination number leads to an elevation in both the polymer flooding recovery ratio and the overall recovery ratio.
At a pore volume (PV) of 0.514, the model with a coordination number of 4.3 exhibited a water cut of 98.78% and a recovery ratio of 31.35%. The model with a coordination number of 5.4 showed a water cut of 79.14% and a recovery ratio of 39.99%, while the model with a coordination number of 6 had a water cut of 68.72% and a recovery ratio of 44.98%. Evidently, at the same PV, an increase in the coordination number corresponds to an increase in the water flooding recovery ratio. Subsequently, the recovery ratios for the three models upon transitioning to polymer flooding were 24.57%, 27.13%, and 30.44%, respectively. The augmentation in the coordination number, which indicates a higher number of connections between pores and throats, implies improved connectivity within the model. This enhanced connectivity facilitates the flow of crude oil within the pore channels, thereby resulting in a higher ultimate Recovery Ratio from polymer flooding.
3.2. Study on the Distribution and Patterns of Remaining Oil
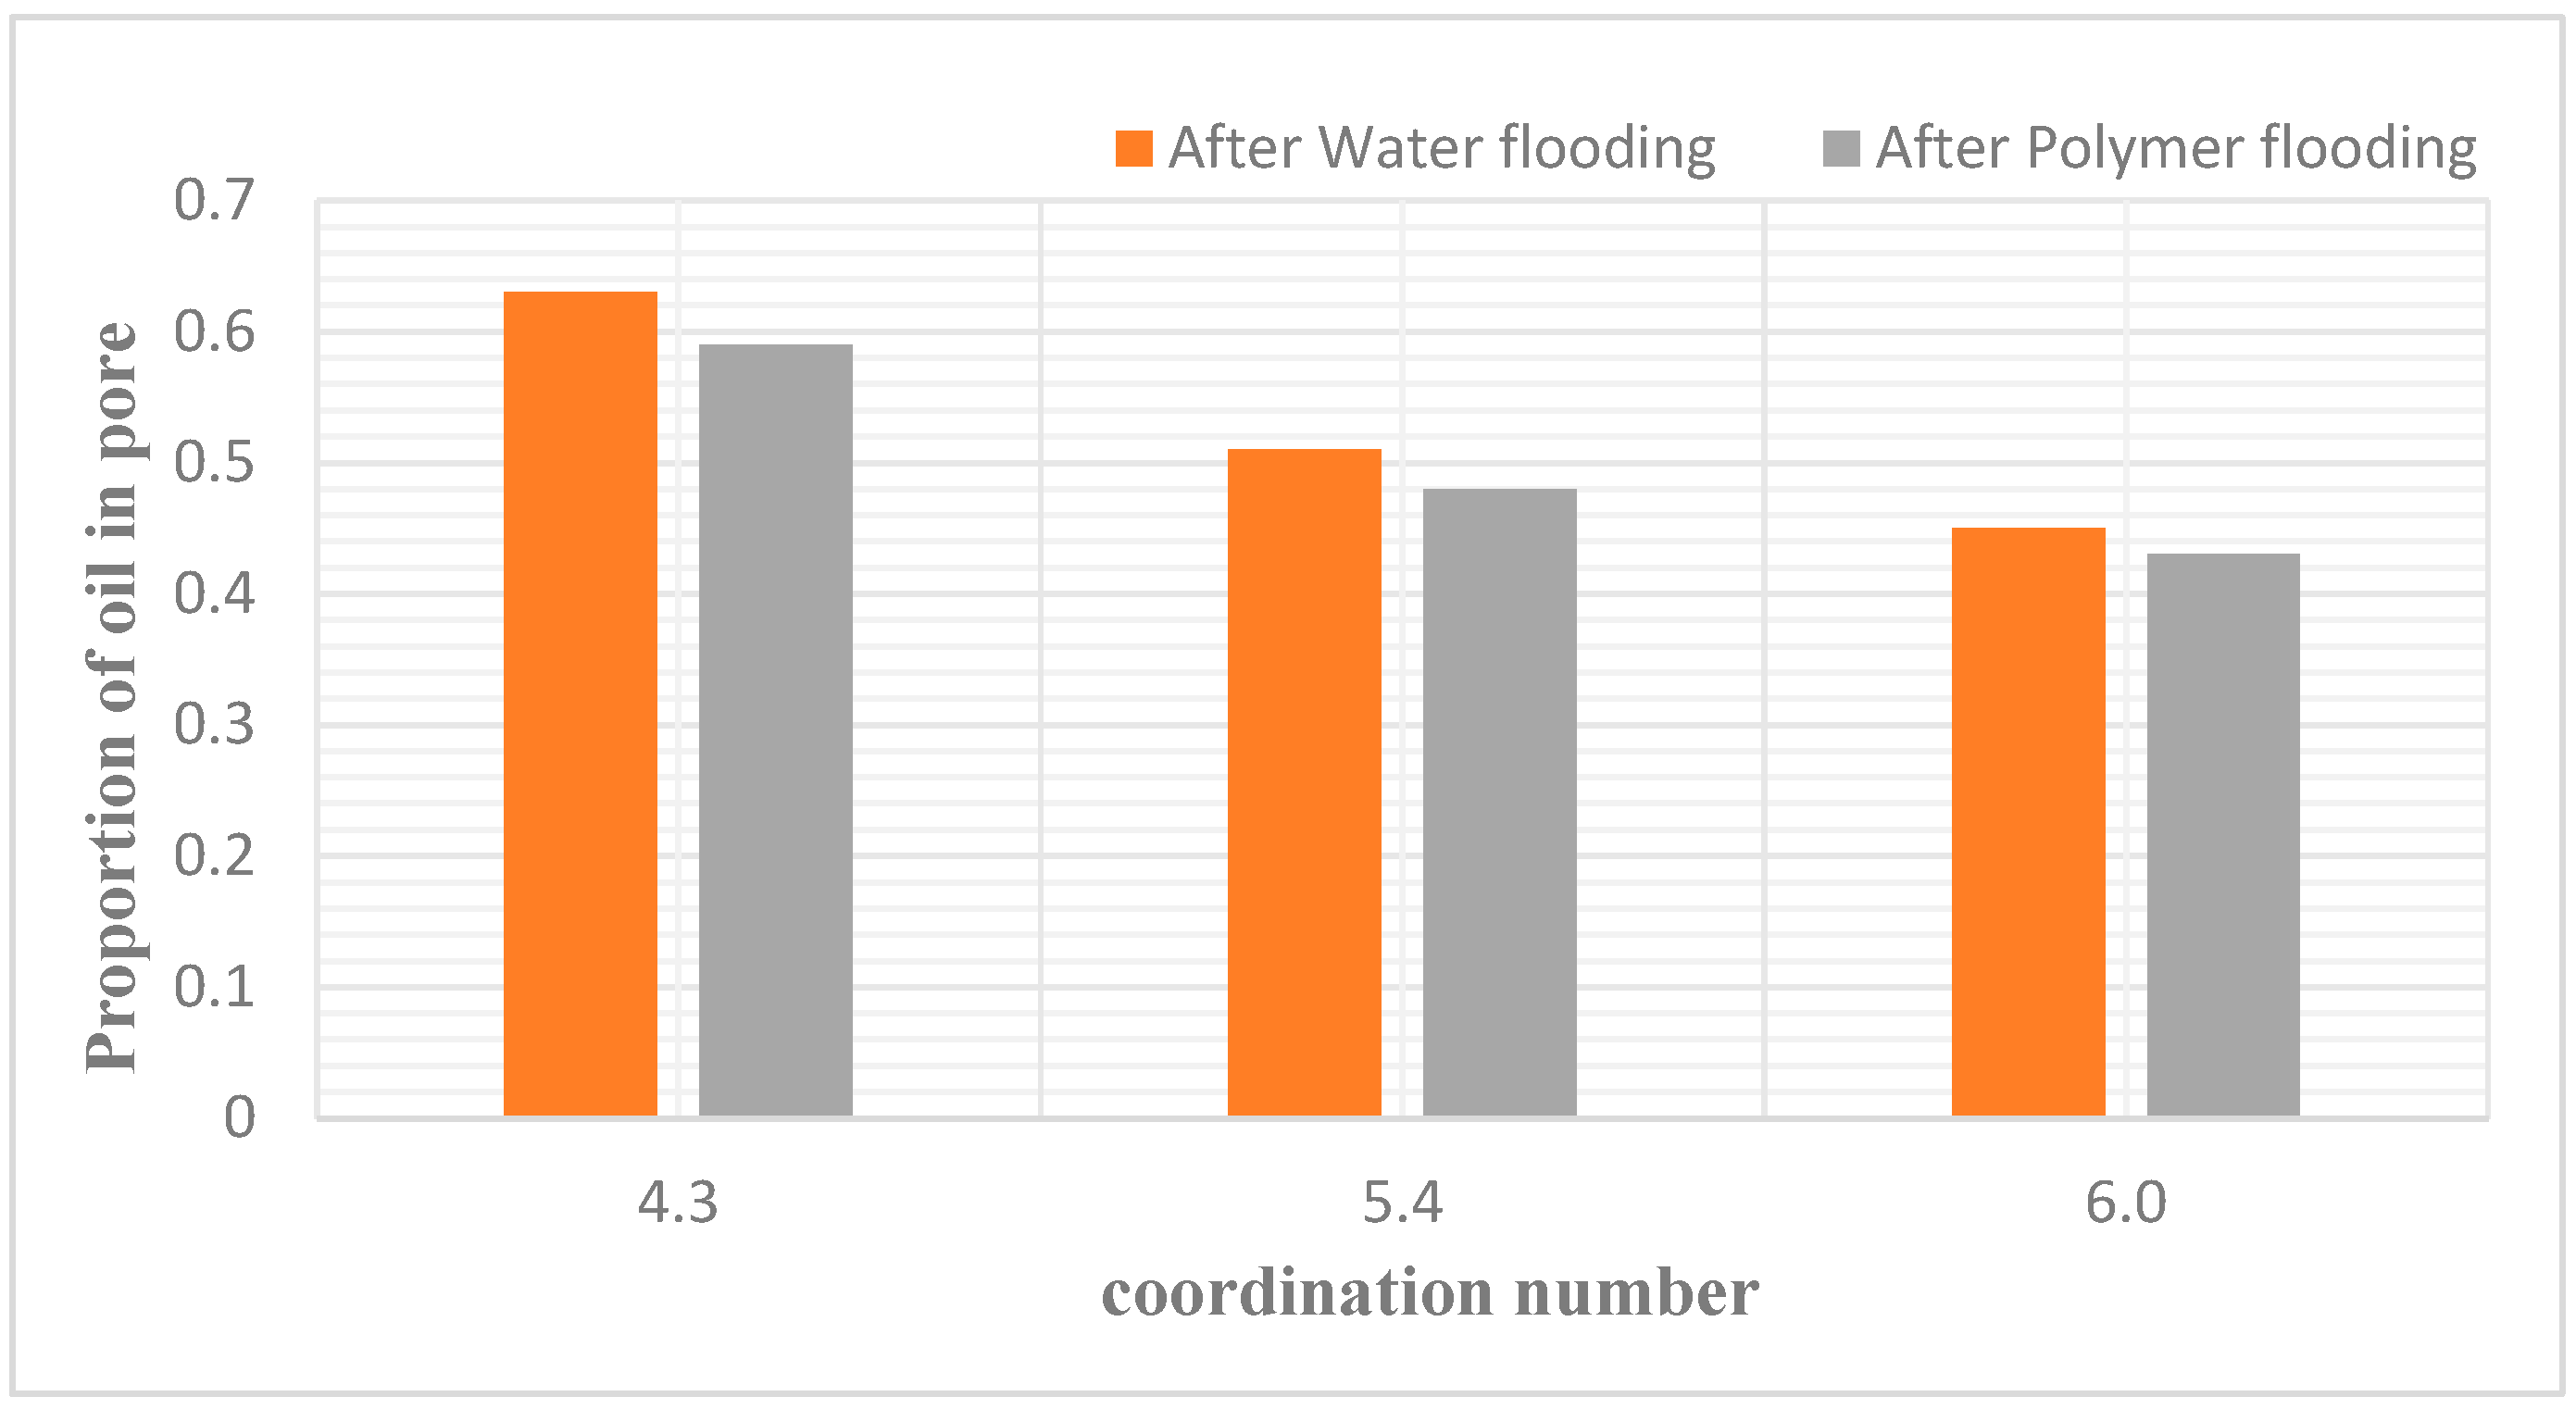
In this model, subsequent to both water and polymer flooding, a statistical analysis was conducted on the number of pores containing oil post water flooding and post polymer flooding. The analysis, as delineated in the following table, was performed under the parameters of coordination numbers at 4.3, 5.4, and 6.0. It was found that the proportions of pores containing oil post water flooding were 0.58, 0.46, and 0.37, respectively, for these coordination numbers. Post polymer flooding, these proportions were 0.56, 0.41, and 0.35, respectively. It is apparent that an increase in the coordination number results in a corresponding decrease in the proportion of oil-containing pores.
>
Table 7.
Proportion of oil in pore after water drive and polymer flooding.
Table 7.
Proportion of oil in pore after water drive and polymer flooding.
| Coordination Number |
4.3 |
5.4 |
6.0 |
| Total Throat Count |
Total Throat Count |
822 |
1016 |
1120 |
| Total Pore Count |
512 |
512 |
512 |
| AfterWater flooding |
Number of Oil-bearing Throats |
541 |
480 |
469 |
| Number of Oil-bearing Pores |
299 |
292 |
273 |
| Total Number of Oil-bearing Entities |
840 |
772 |
742 |
| Oil Saturation in Throats |
0.63 |
0.51 |
0.45 |
| After Polymer flooding |
Number of Oil-bearing Throats |
519 |
472 |
455 |
| Number of Oil-bearing Pores |
272 |
262 |
251 |
| Total Number of Oil-bearing Entities |
791 |
734 |
706 |
| Oil Saturation in Throats |
0.59 |
0.48 |
0.43 |
Figure 9.
Proportion of oil in pore after water drive and polymer flooding.
Figure 9.
Proportion of oil in pore after water drive and polymer flooding.
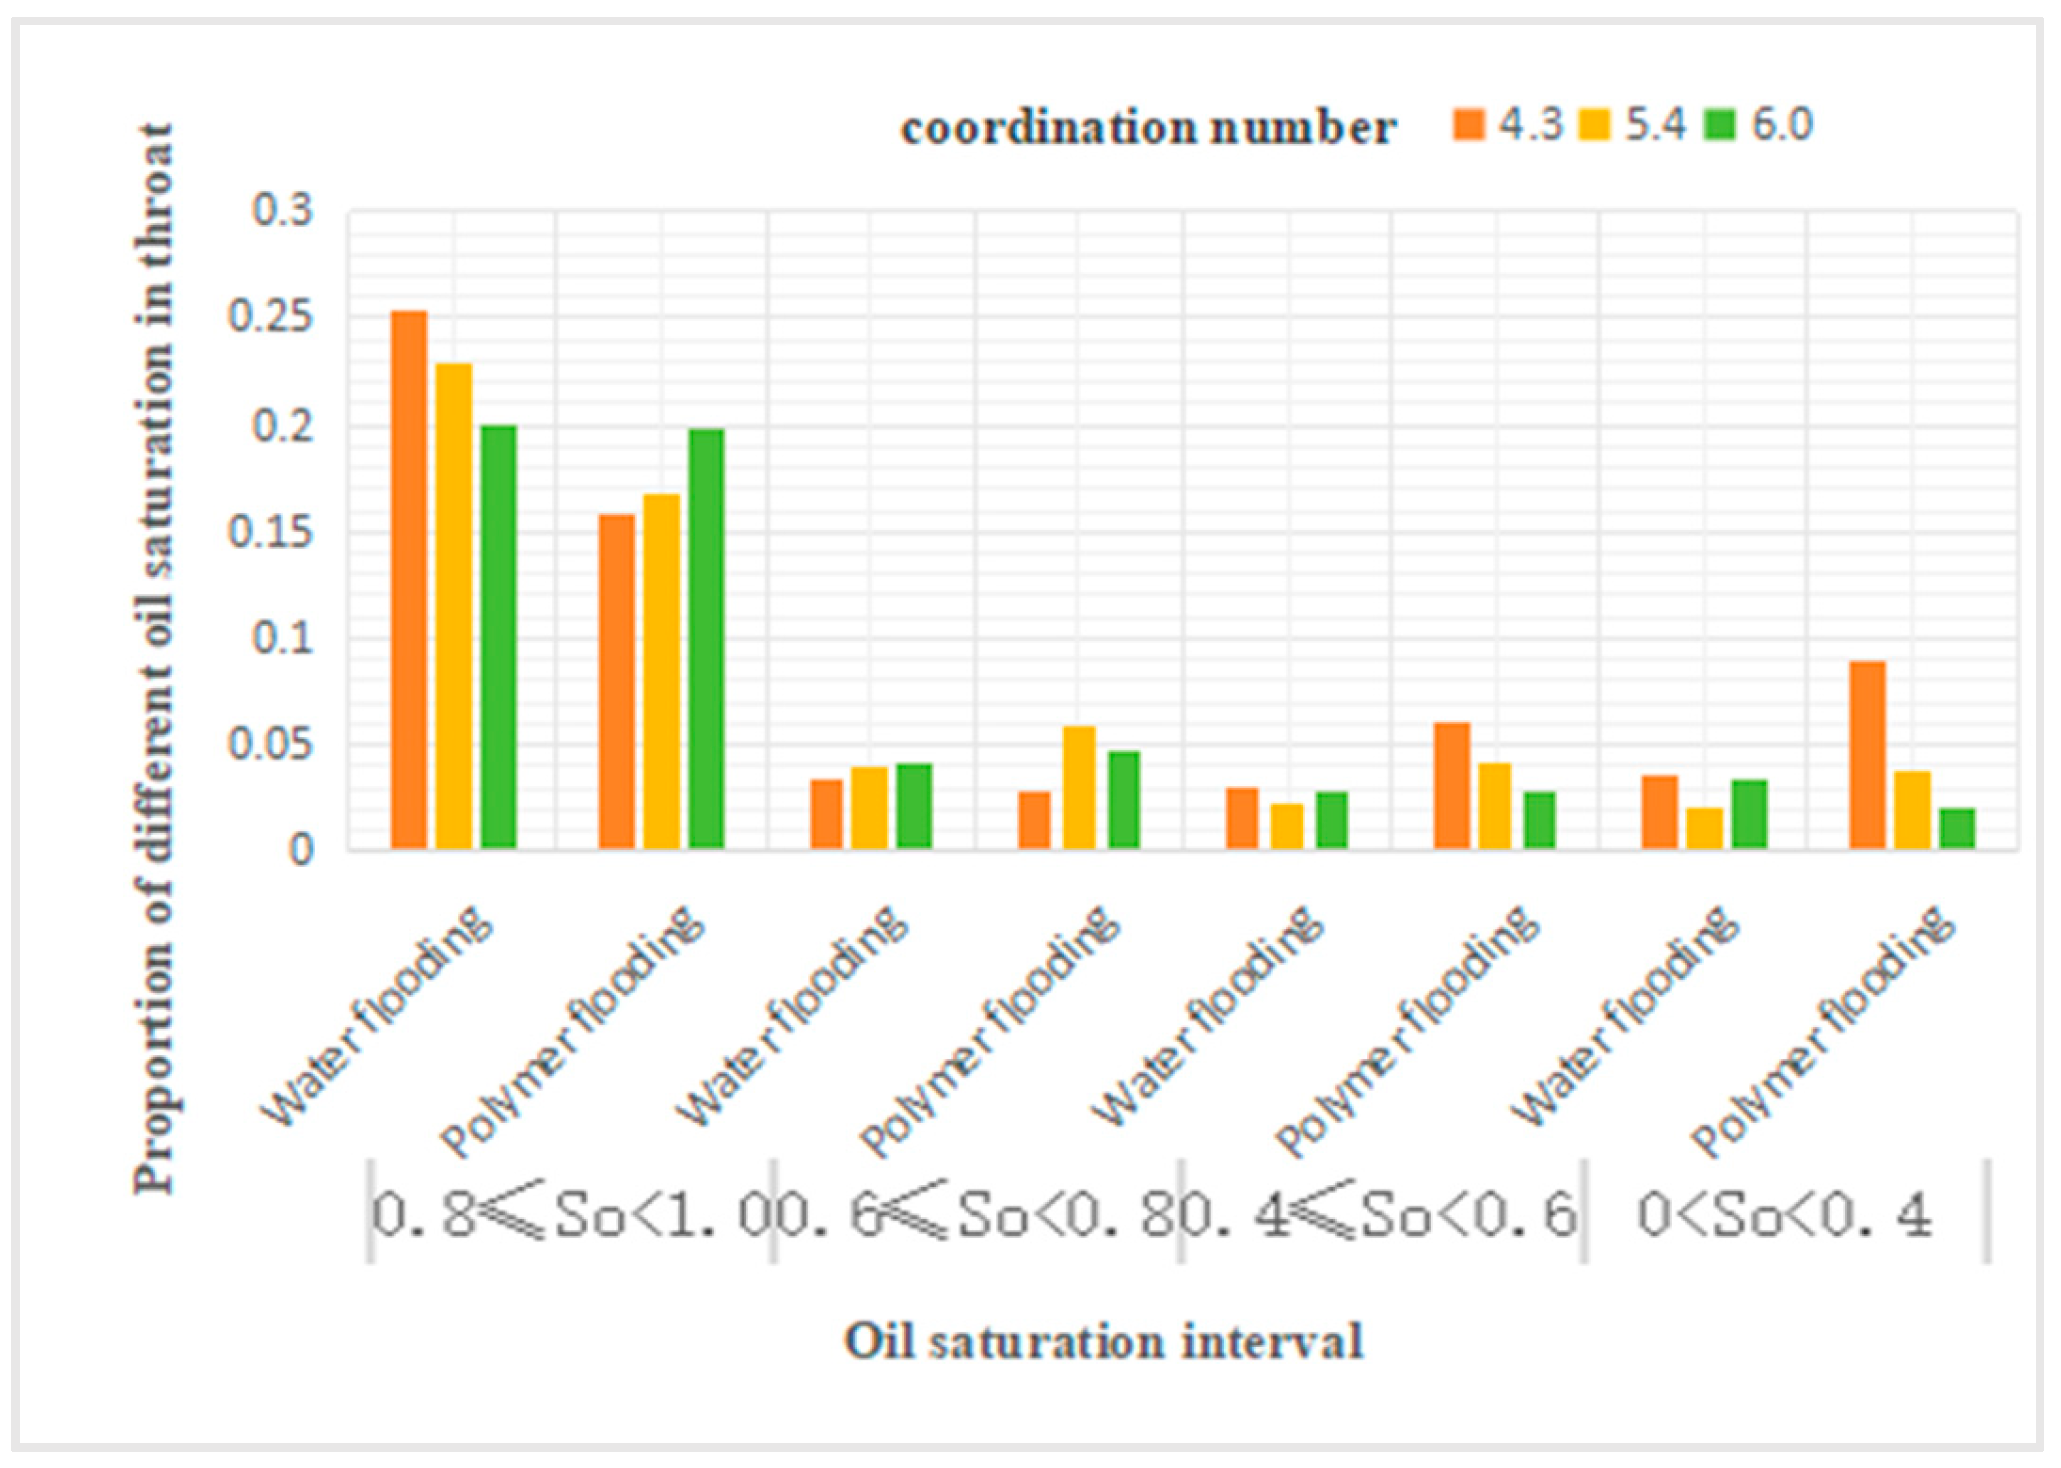
Figure 10.
Proportion of different oil saturation in throat.
Figure 10.
Proportion of different oil saturation in throat.
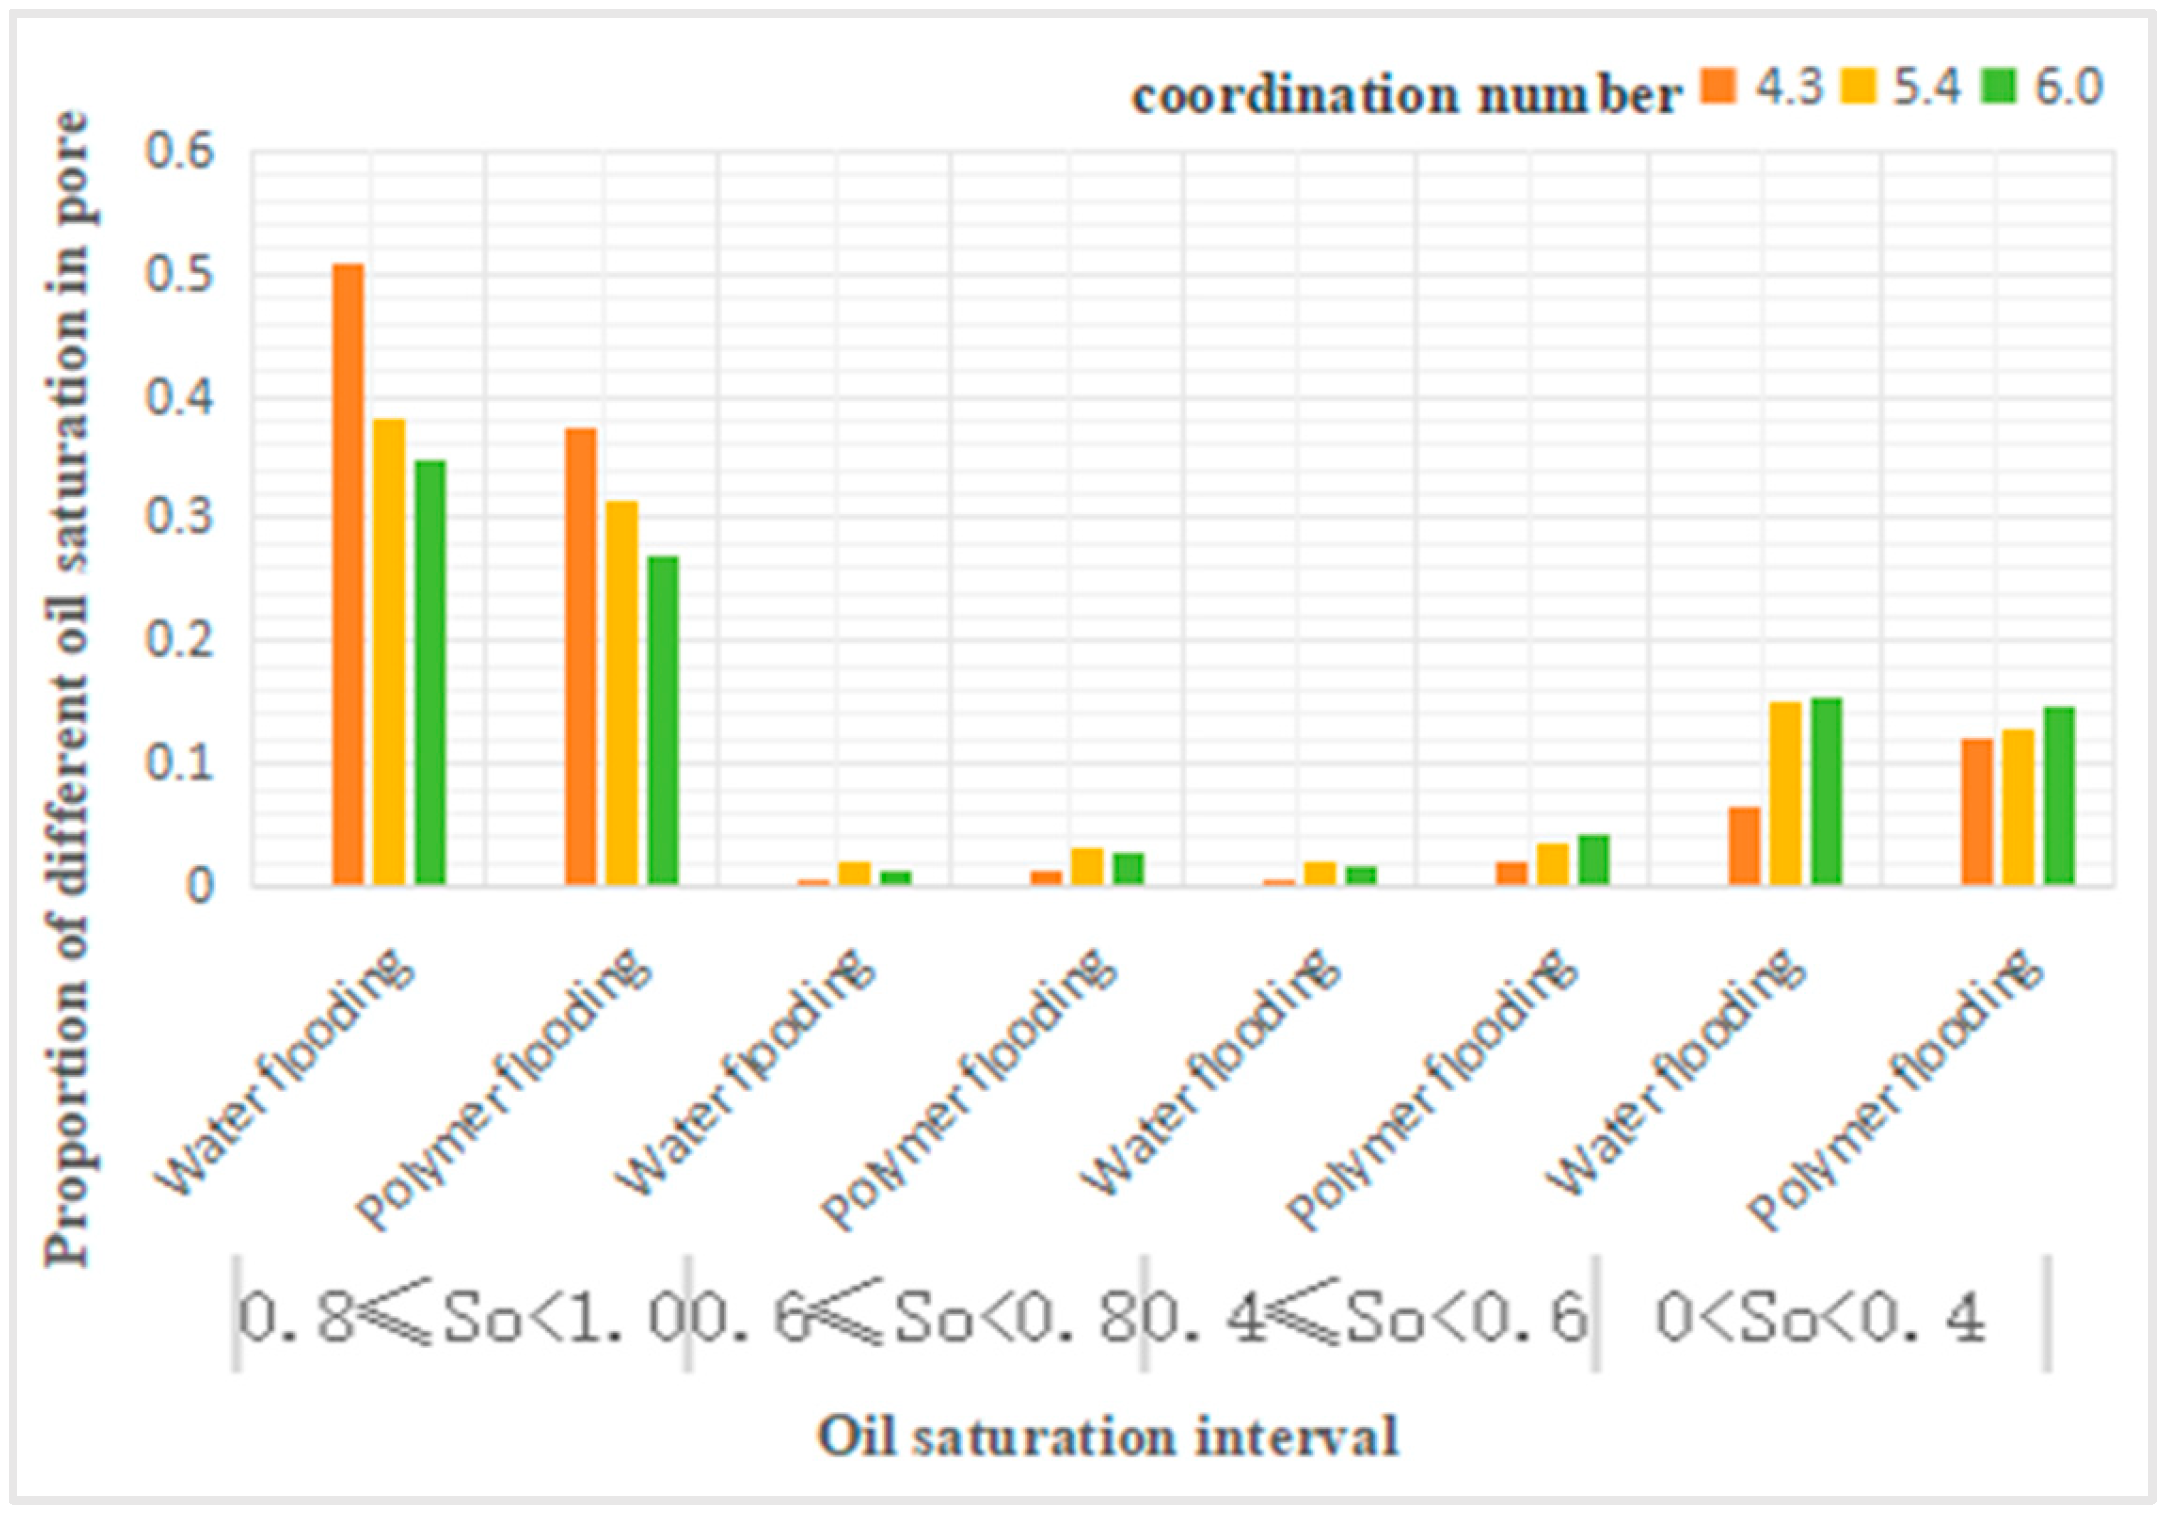
Figure 11.
Proportion of different oil saturation in pore.
Figure 11.
Proportion of different oil saturation in pore.
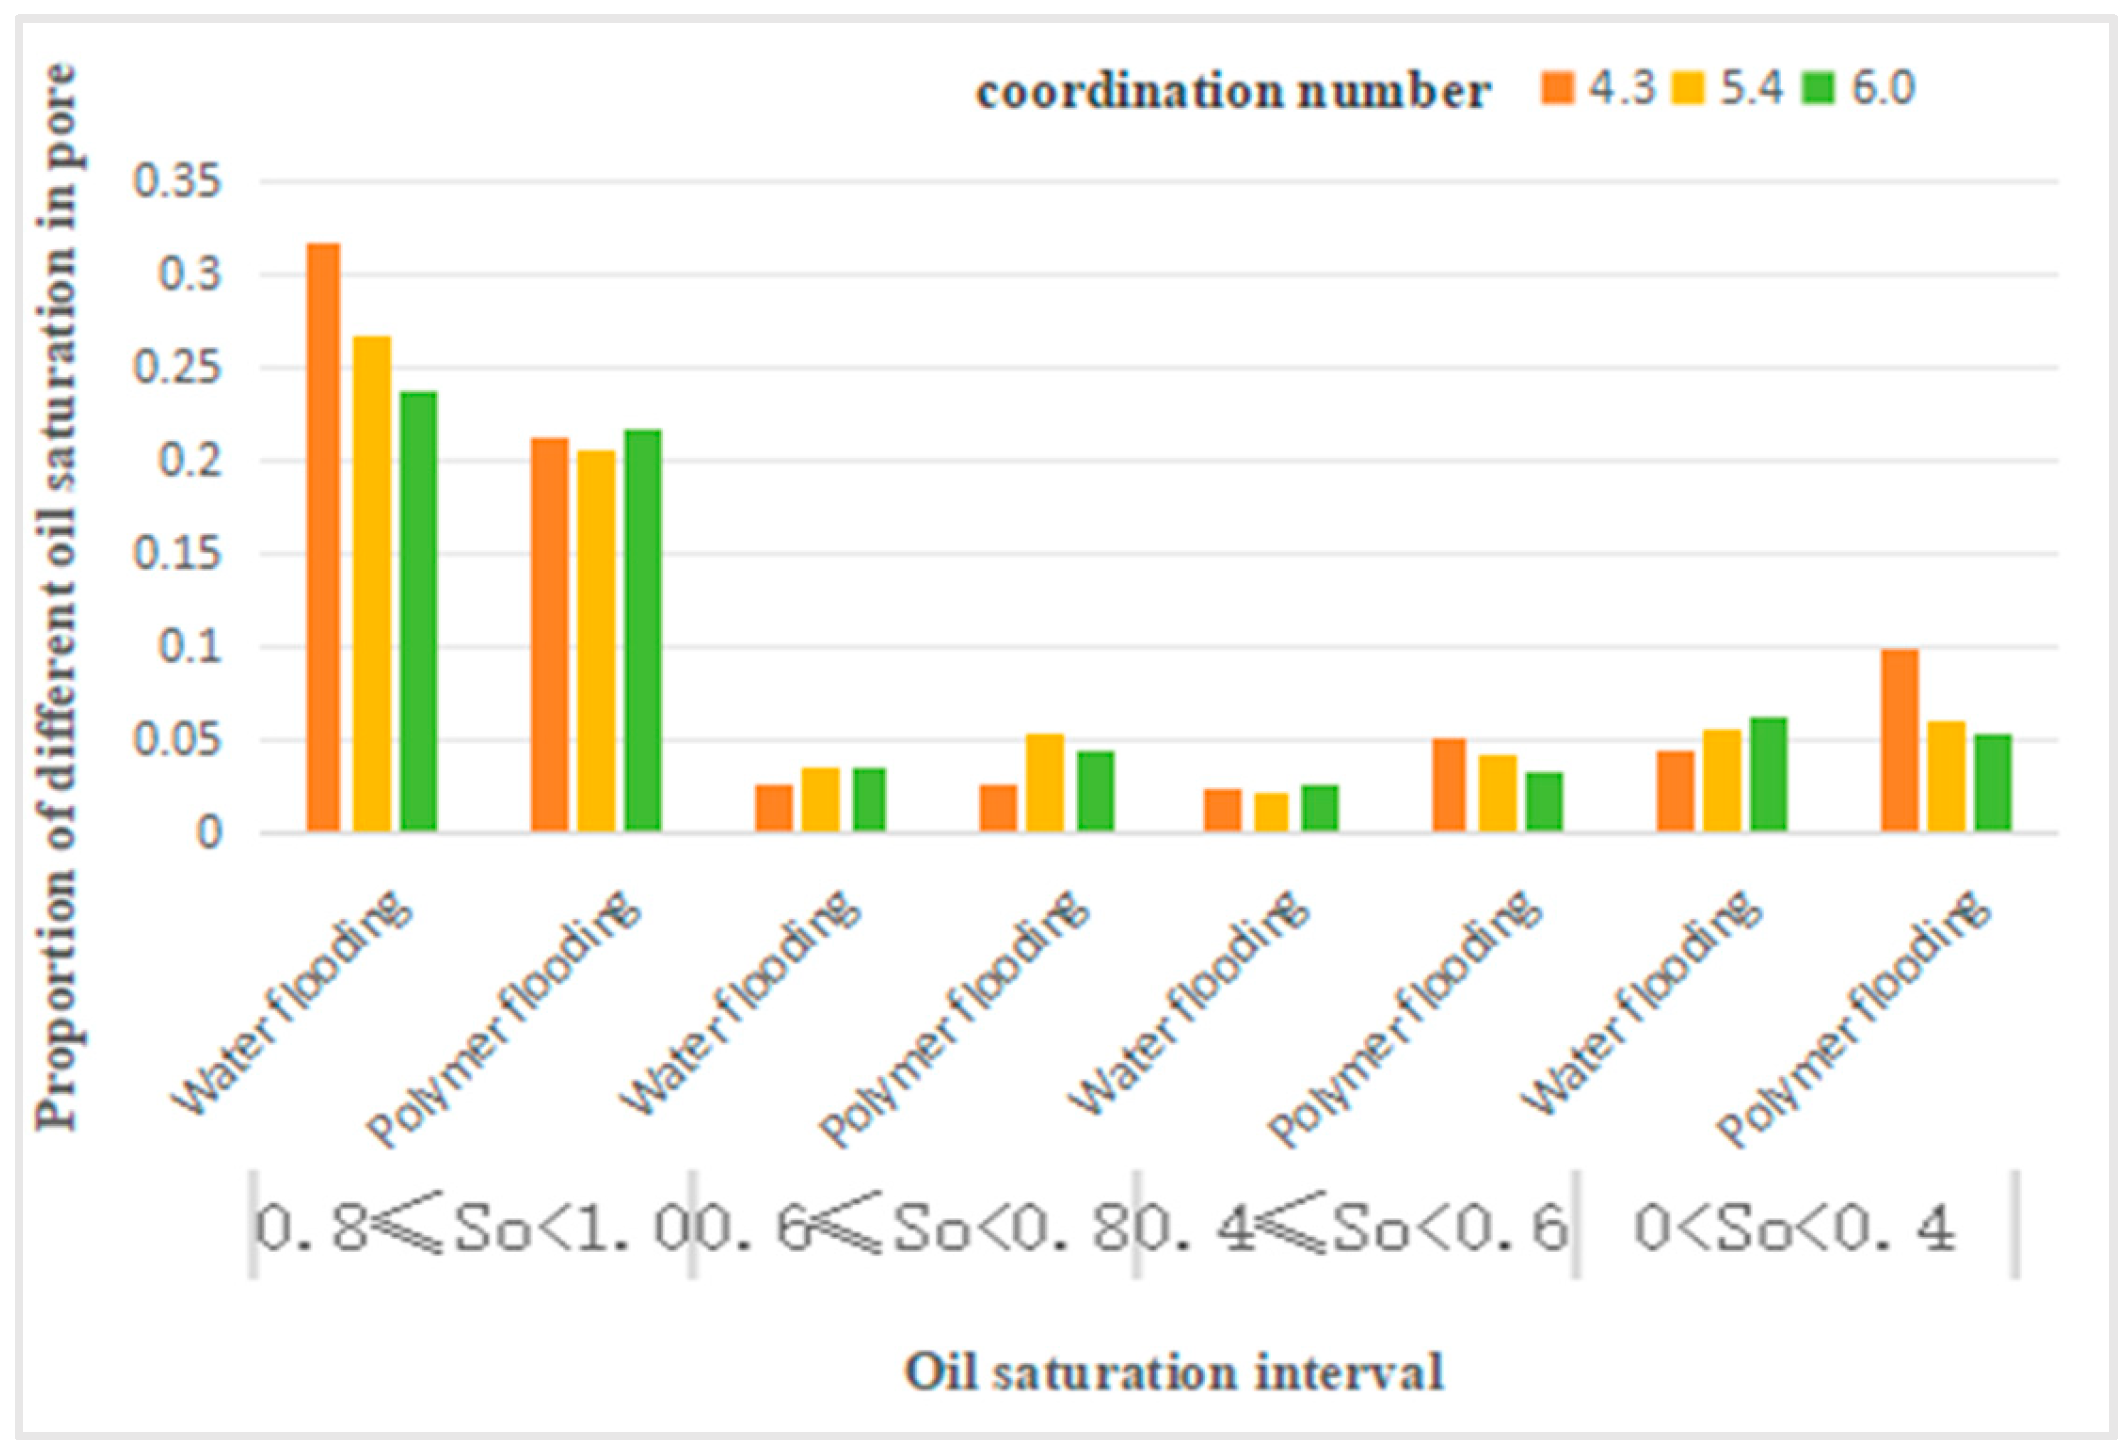
Figure 12.
Proportion of different oil saturation in pore.
Figure 12.
Proportion of different oil saturation in pore.
Analysis of
Table 8 reveals that, in comparison to water flooding, polymer flooding with a coordination number of 4.3 resulted in a 37% decrease in the number of throats with oil saturation levels between 0.8 and 1, and a 15% decrease for saturation levels between 0.6 and 0.8. Conversely, there was an increase of over 100% and 150% in the number of throats with saturation levels between 0.4 and 0.6, and 0 to 0.4, respectively. At a coordination number of 5.4, the number of throats with saturation levels between 0.8 and 1 decreased by 26%, while those with saturation levels between 0 and 0.4, 0.4 and 0.6, and 0.6 and 0.8 increased by approximately 50%, 80%, and 80%, respectively. At a coordination number of 6, the number of throats with saturation levels between 0 and 0.4 decreased by 40%, and those between 0.6 and 0.8 increased by 14%.
Table 9 indicates that for polymer flooding compared to water flooding, there was a universal decrease in pores with saturation levels between 0.8 and 1. At a coordination number of 4.3, the number of pores with saturation levels between 0.4 and 0.6, and 0 to 0.4 increased by 112.5% and 127.9%, respectively. With a coordination number of 5.4, pores with saturation levels between 0.6 and 0.8, and 0.4 and 0.6 increased by 51.4% and 86.4%, respectively, while those between 0 and 0.4 decreased by 15%. At a coordination number of 6, the increase in pores with saturation levels between 0.6 and 0.8, and 0.4 and 0.6 was 22.9% and 23.1%, respectively.
Table 10 shows that, compared to water flooding, polymer flooding resulted in a decrease in the number of pores with saturation levels between 0.8 and 1 across all coordination numbers. However, at a coordination number of 6, this decrease was only 9%, which is not significant compared to the 33% and 23% decreases at coordination numbers 4.3 and 5.4, respectively. The number of pores with saturation levels between 0.6 and 0.8 was negligibly affected at a coordination number of 4.3, increased by over 50% at 5.4, and then decreased to a 22% increase at 6.0. The number of pores with saturation levels between 0.4 and 0.6 increased by 112%, 86%, and 23% for coordination numbers 4.3, 5.4, and 6.0, respectively. Finally, the number of pores with saturation levels between 0 and 0.4 increased by 128% at a coordination number of 4.3, by 11% at 5.4, and decreased by 17% at 6.0.
3.3. Types and Quantitative Analysis of Remaining Oil
Subsequent to the implementation of oil displacement simulations on the model, cross-sectional representations of oil-water distributions post-displacement were extracted and are depicted in
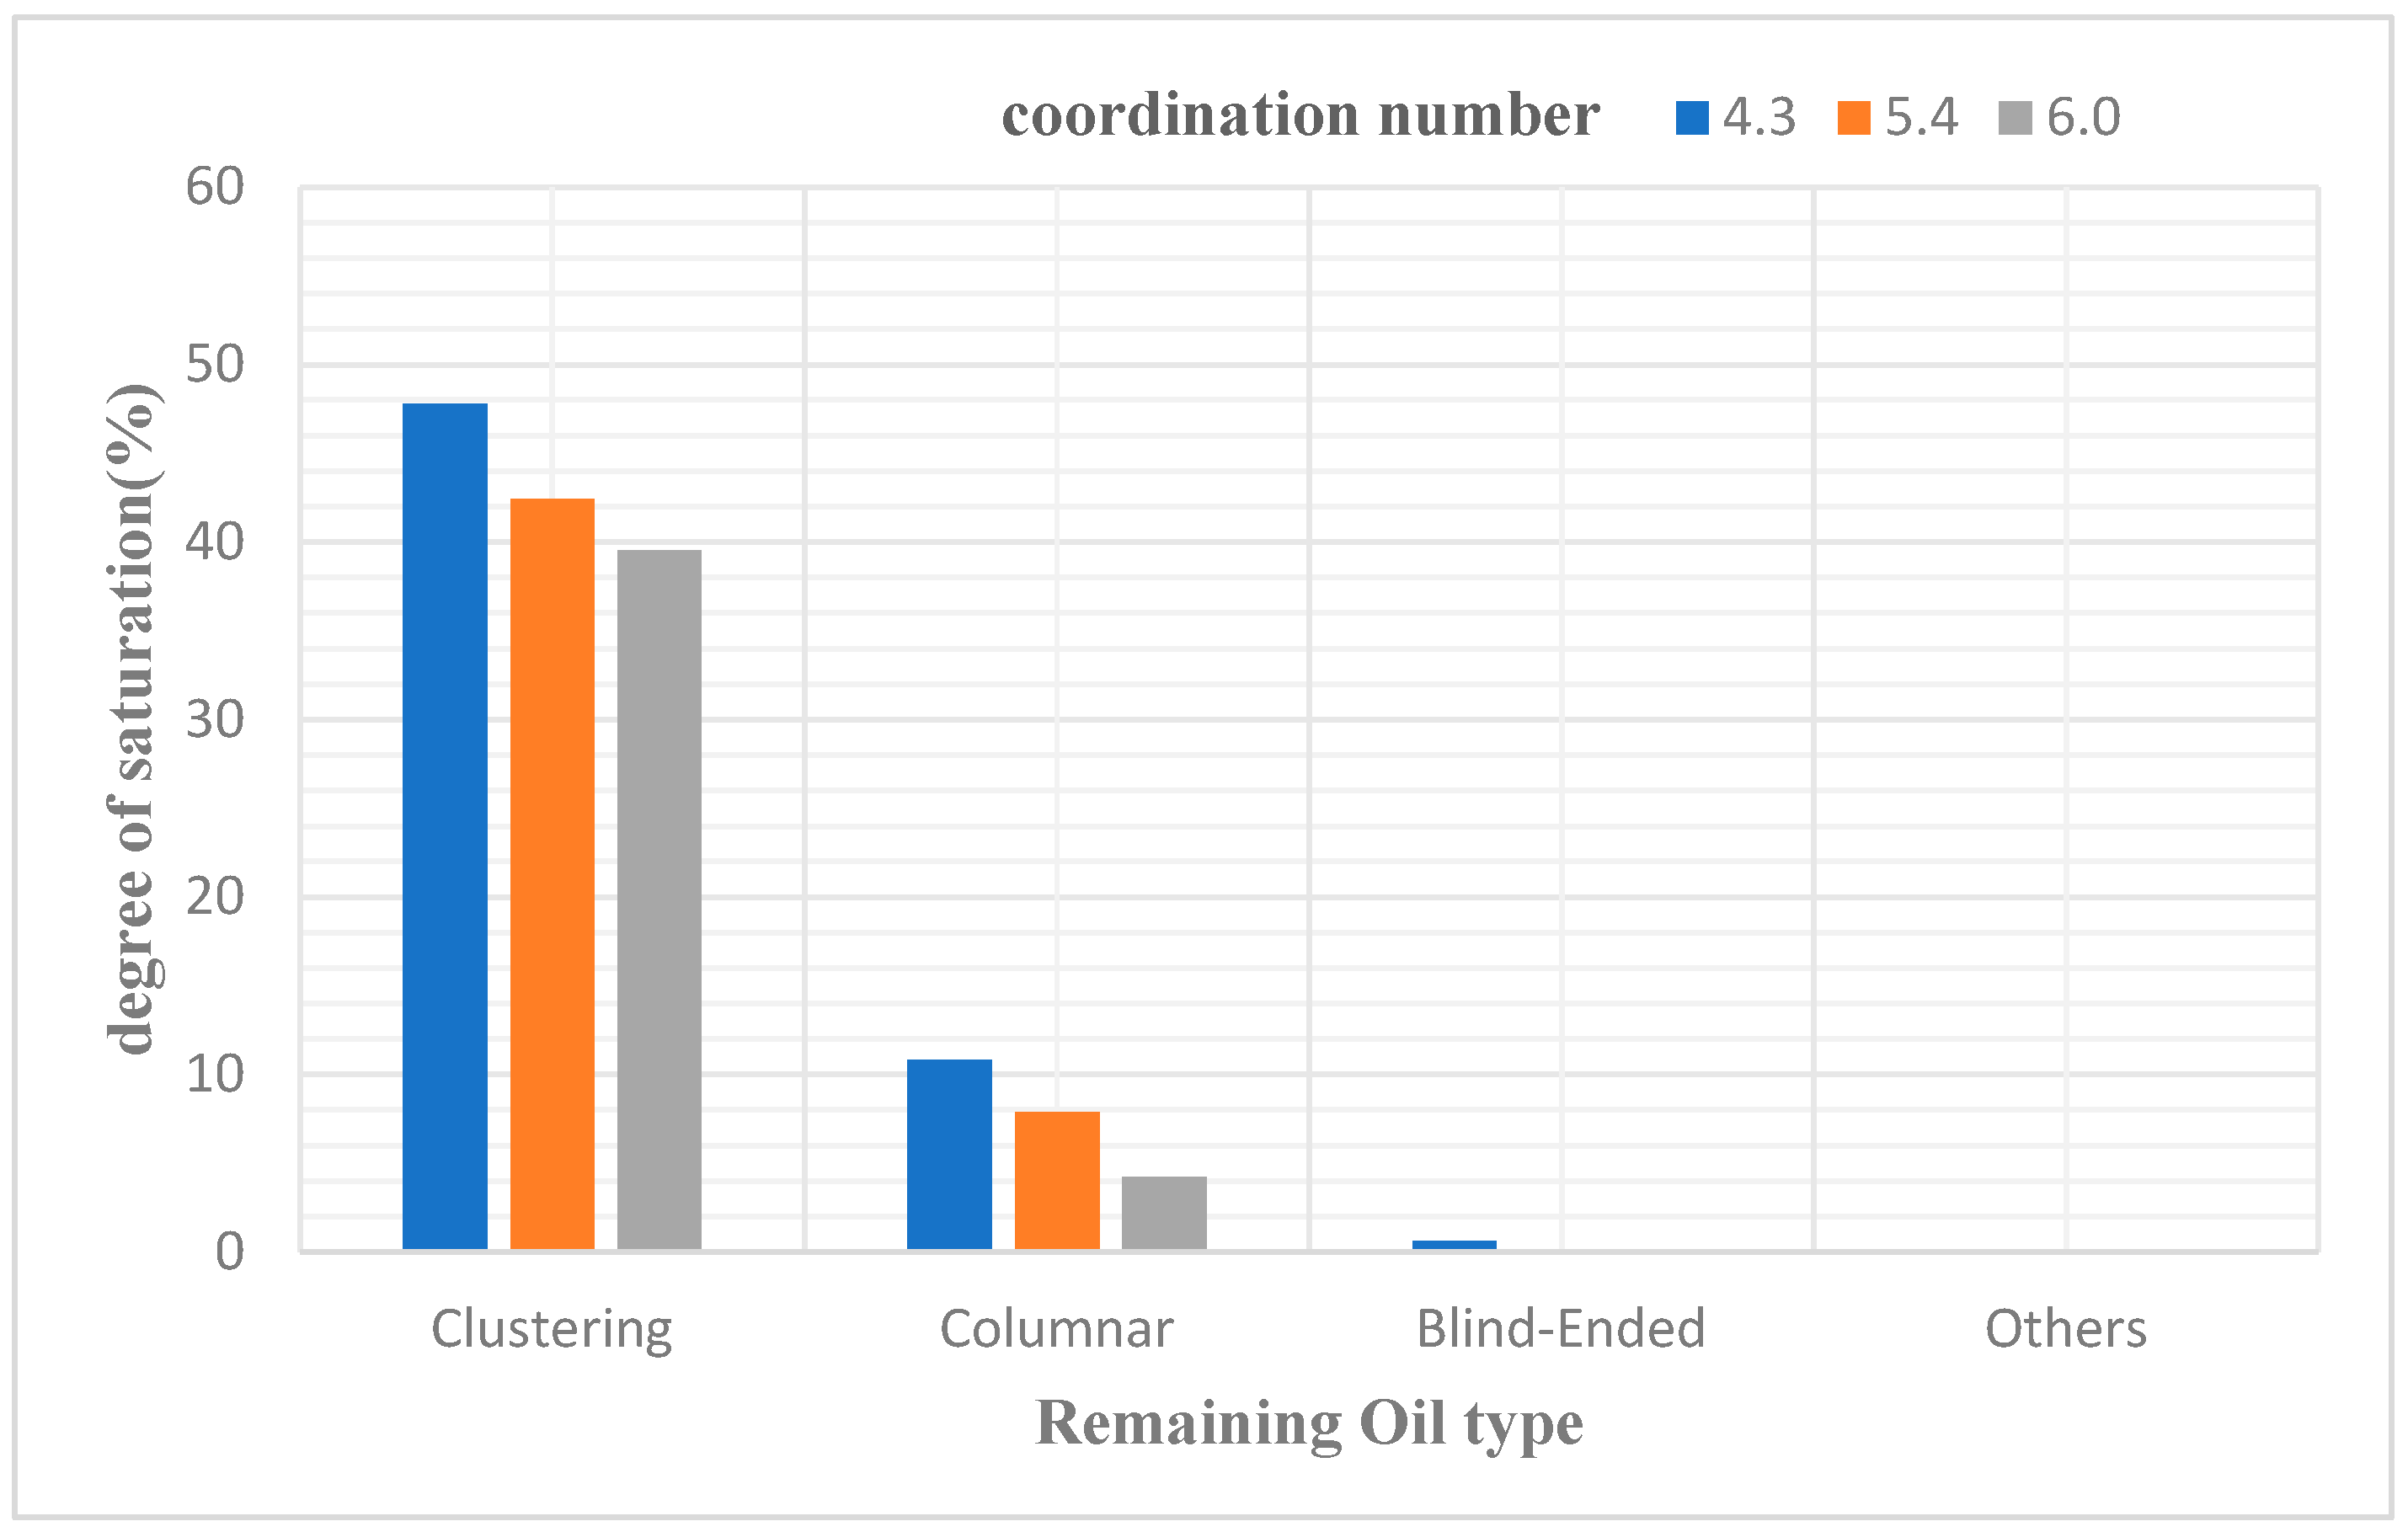
Figure 3.6. Analytical computations were then conducted to ascertain the saturation levels of distinct types of Remaining Oil under the specified coordination numbers of 4.3, 5.4, and 6.0. The outcomes of these analytical assessments are systematically tabulated in
Table 11.
Figure 13.
Influence of different coordination number on Remaining Oil distribution.
Figure 13.
Influence of different coordination number on Remaining Oil distribution.
Figure 14.
The influence of different coordination number on the type of Remaining Oil.
Figure 14.
The influence of different coordination number on the type of Remaining Oil.
The outcomes of the simulations indicate an increment in the average number of throats interconnected with each pore concurrent with an elevation in the coordination number, culminating in an enhanced permeability of the core matrix. This increased permeability significantly augments the efficiency of oil displacement within the pores. Data analysis from the tables reveals that the predominant forms of remaining oil, namely clustered and columnar remaining oil, exhibit a discernible reduction in their prevalence, while the saturation levels of other minor remaining oil types manifest stochastic variations.
As the coordination number escalates, there is a notable decrement in the occurrence of various types of remaining oil. The proliferation of throats in connection with the pores directly correlates to the facilitated displacement of the remaining oil entrapped within these pores.
4. The Impact of Pore-Throat Ratio on Various Types of Remaining Oil
4.1. The Impact of Pore-Throat Ratio on Oil Displacement Efficiency
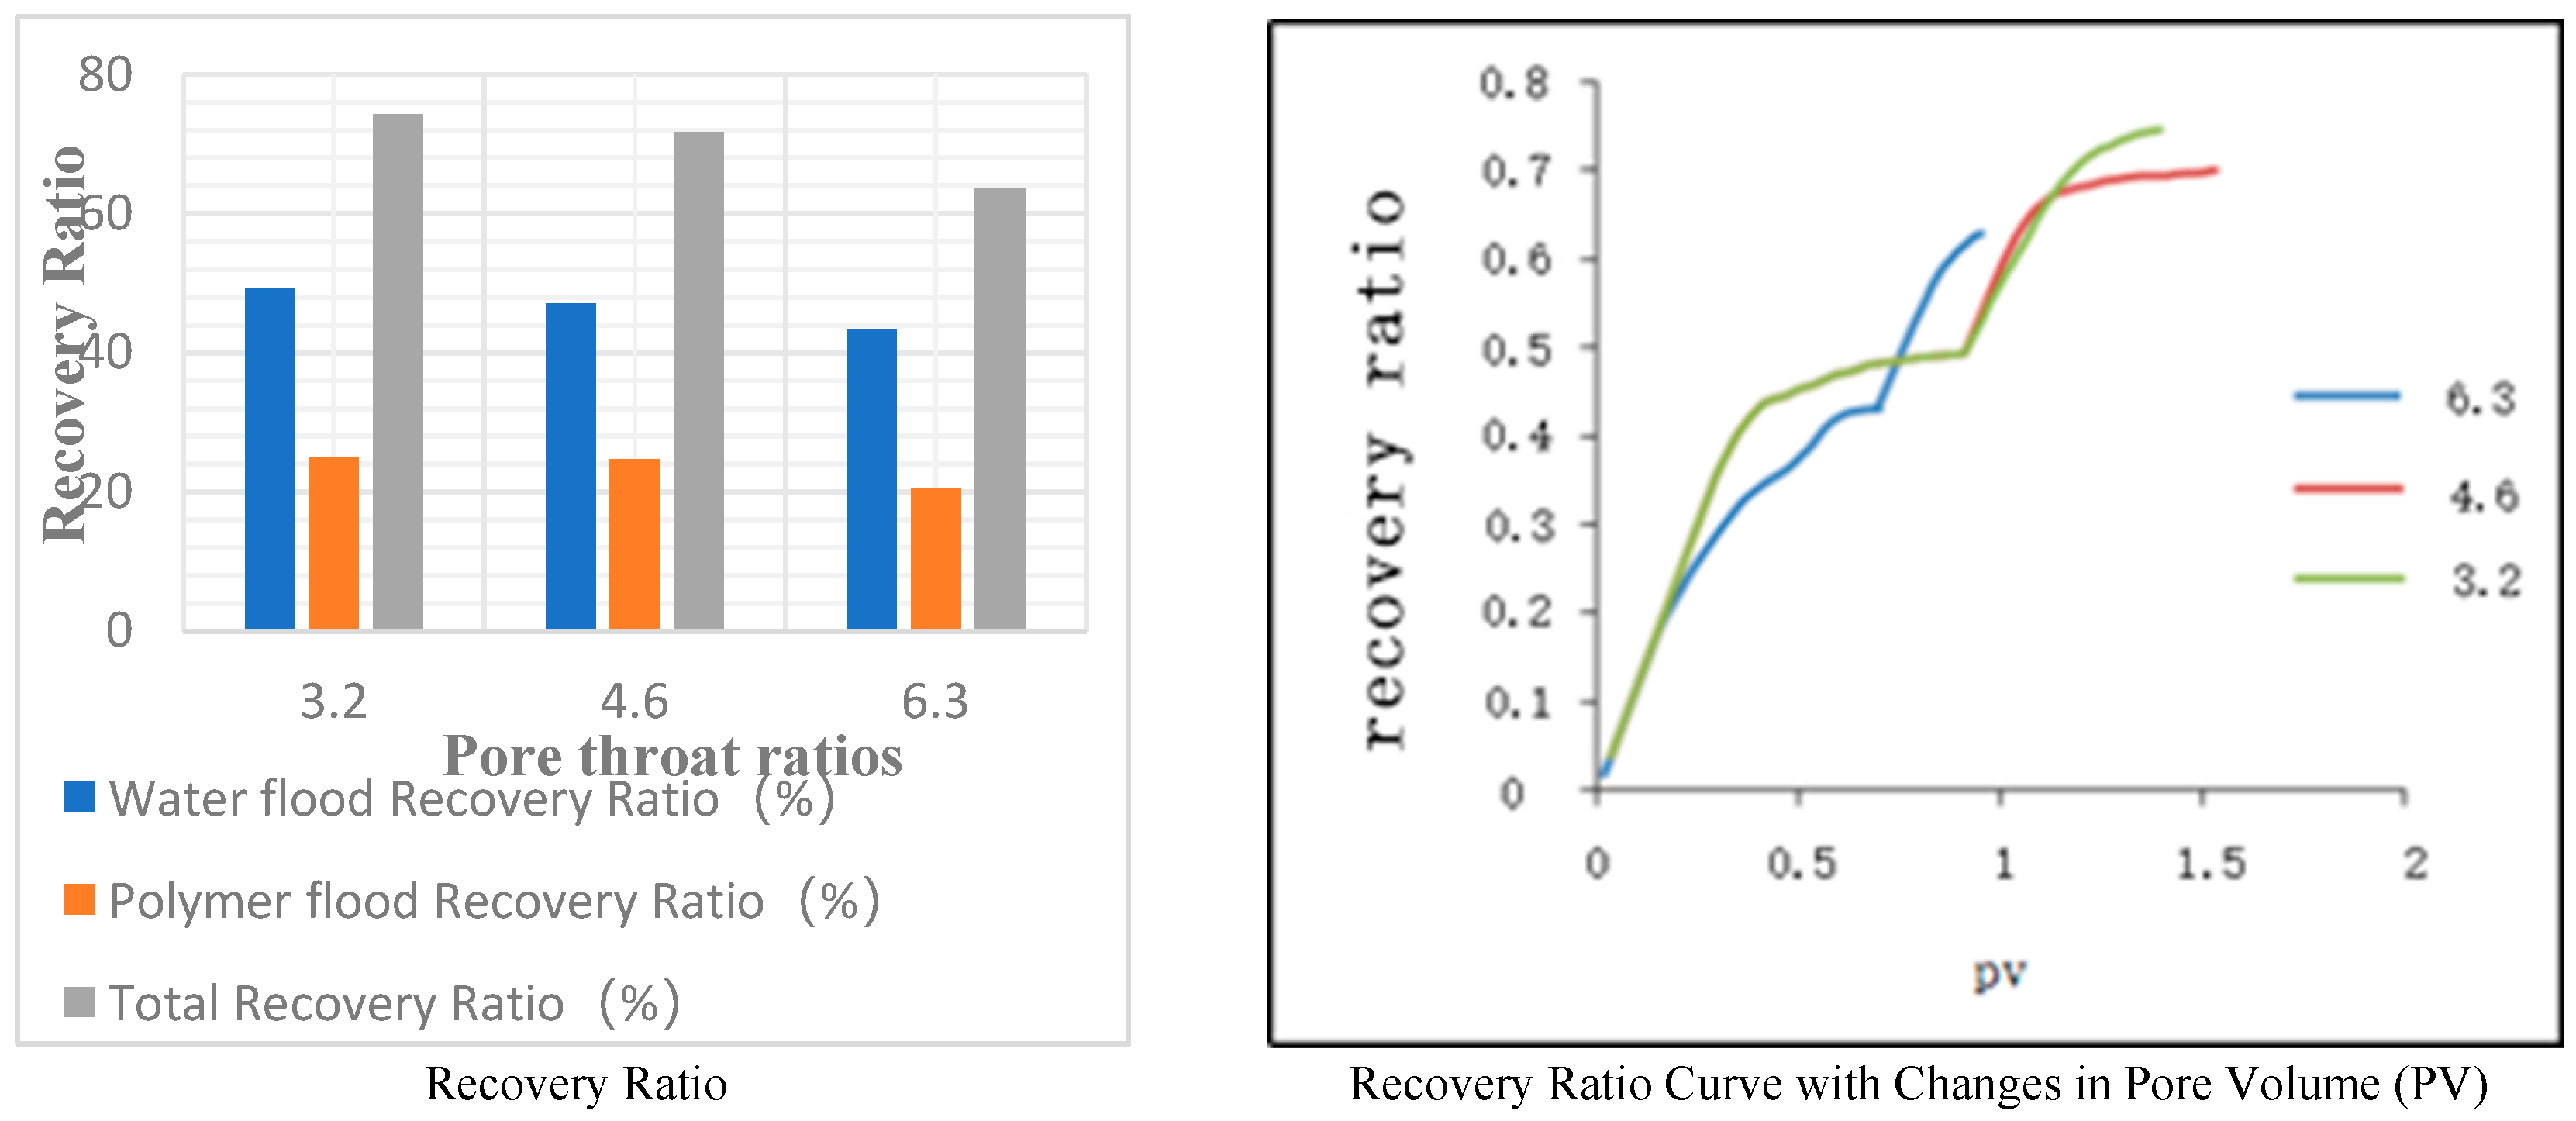
In this study, based on scheme 2, models with pore-throat ratios of 3.2, 4.6, and 6.3 were employed for displacement simulations. The simulation process was terminated when a continuous water cut of 0.98 was observed at the model outlet during water and polymer injection. The models were maintained with constant coordination numbers, shape factors, and other polymer injection parameters. The computational results are presented in
Table 12 and
Figure 15.
In the three models, as the pore-throat ratio increases, the simulated permeability of the models decreases to 954.43, 544.12, and 329.05, respectively. When the water saturation reaches 98%, the water flooding recovery, polymer flooding recovery, and total recovery decrease sequentially. This phenomenon can be attributed to the fact that, with the pore radius remaining constant, an increase in the pore-throat ratio results in a reduction in throat radius, leading to an increase in throat resistance coefficient. Under the same pressure conditions, this makes fluid flow more challenging. Therefore, a higher pore-throat ratio corresponds to a lower recovery ratio.
4.2. Study on the Distribution and Patterns of Remaining Oil
The digital pore model was used to calculate the number of oil-containing pores after water flooding and polymer flooding, and the results are summarized in
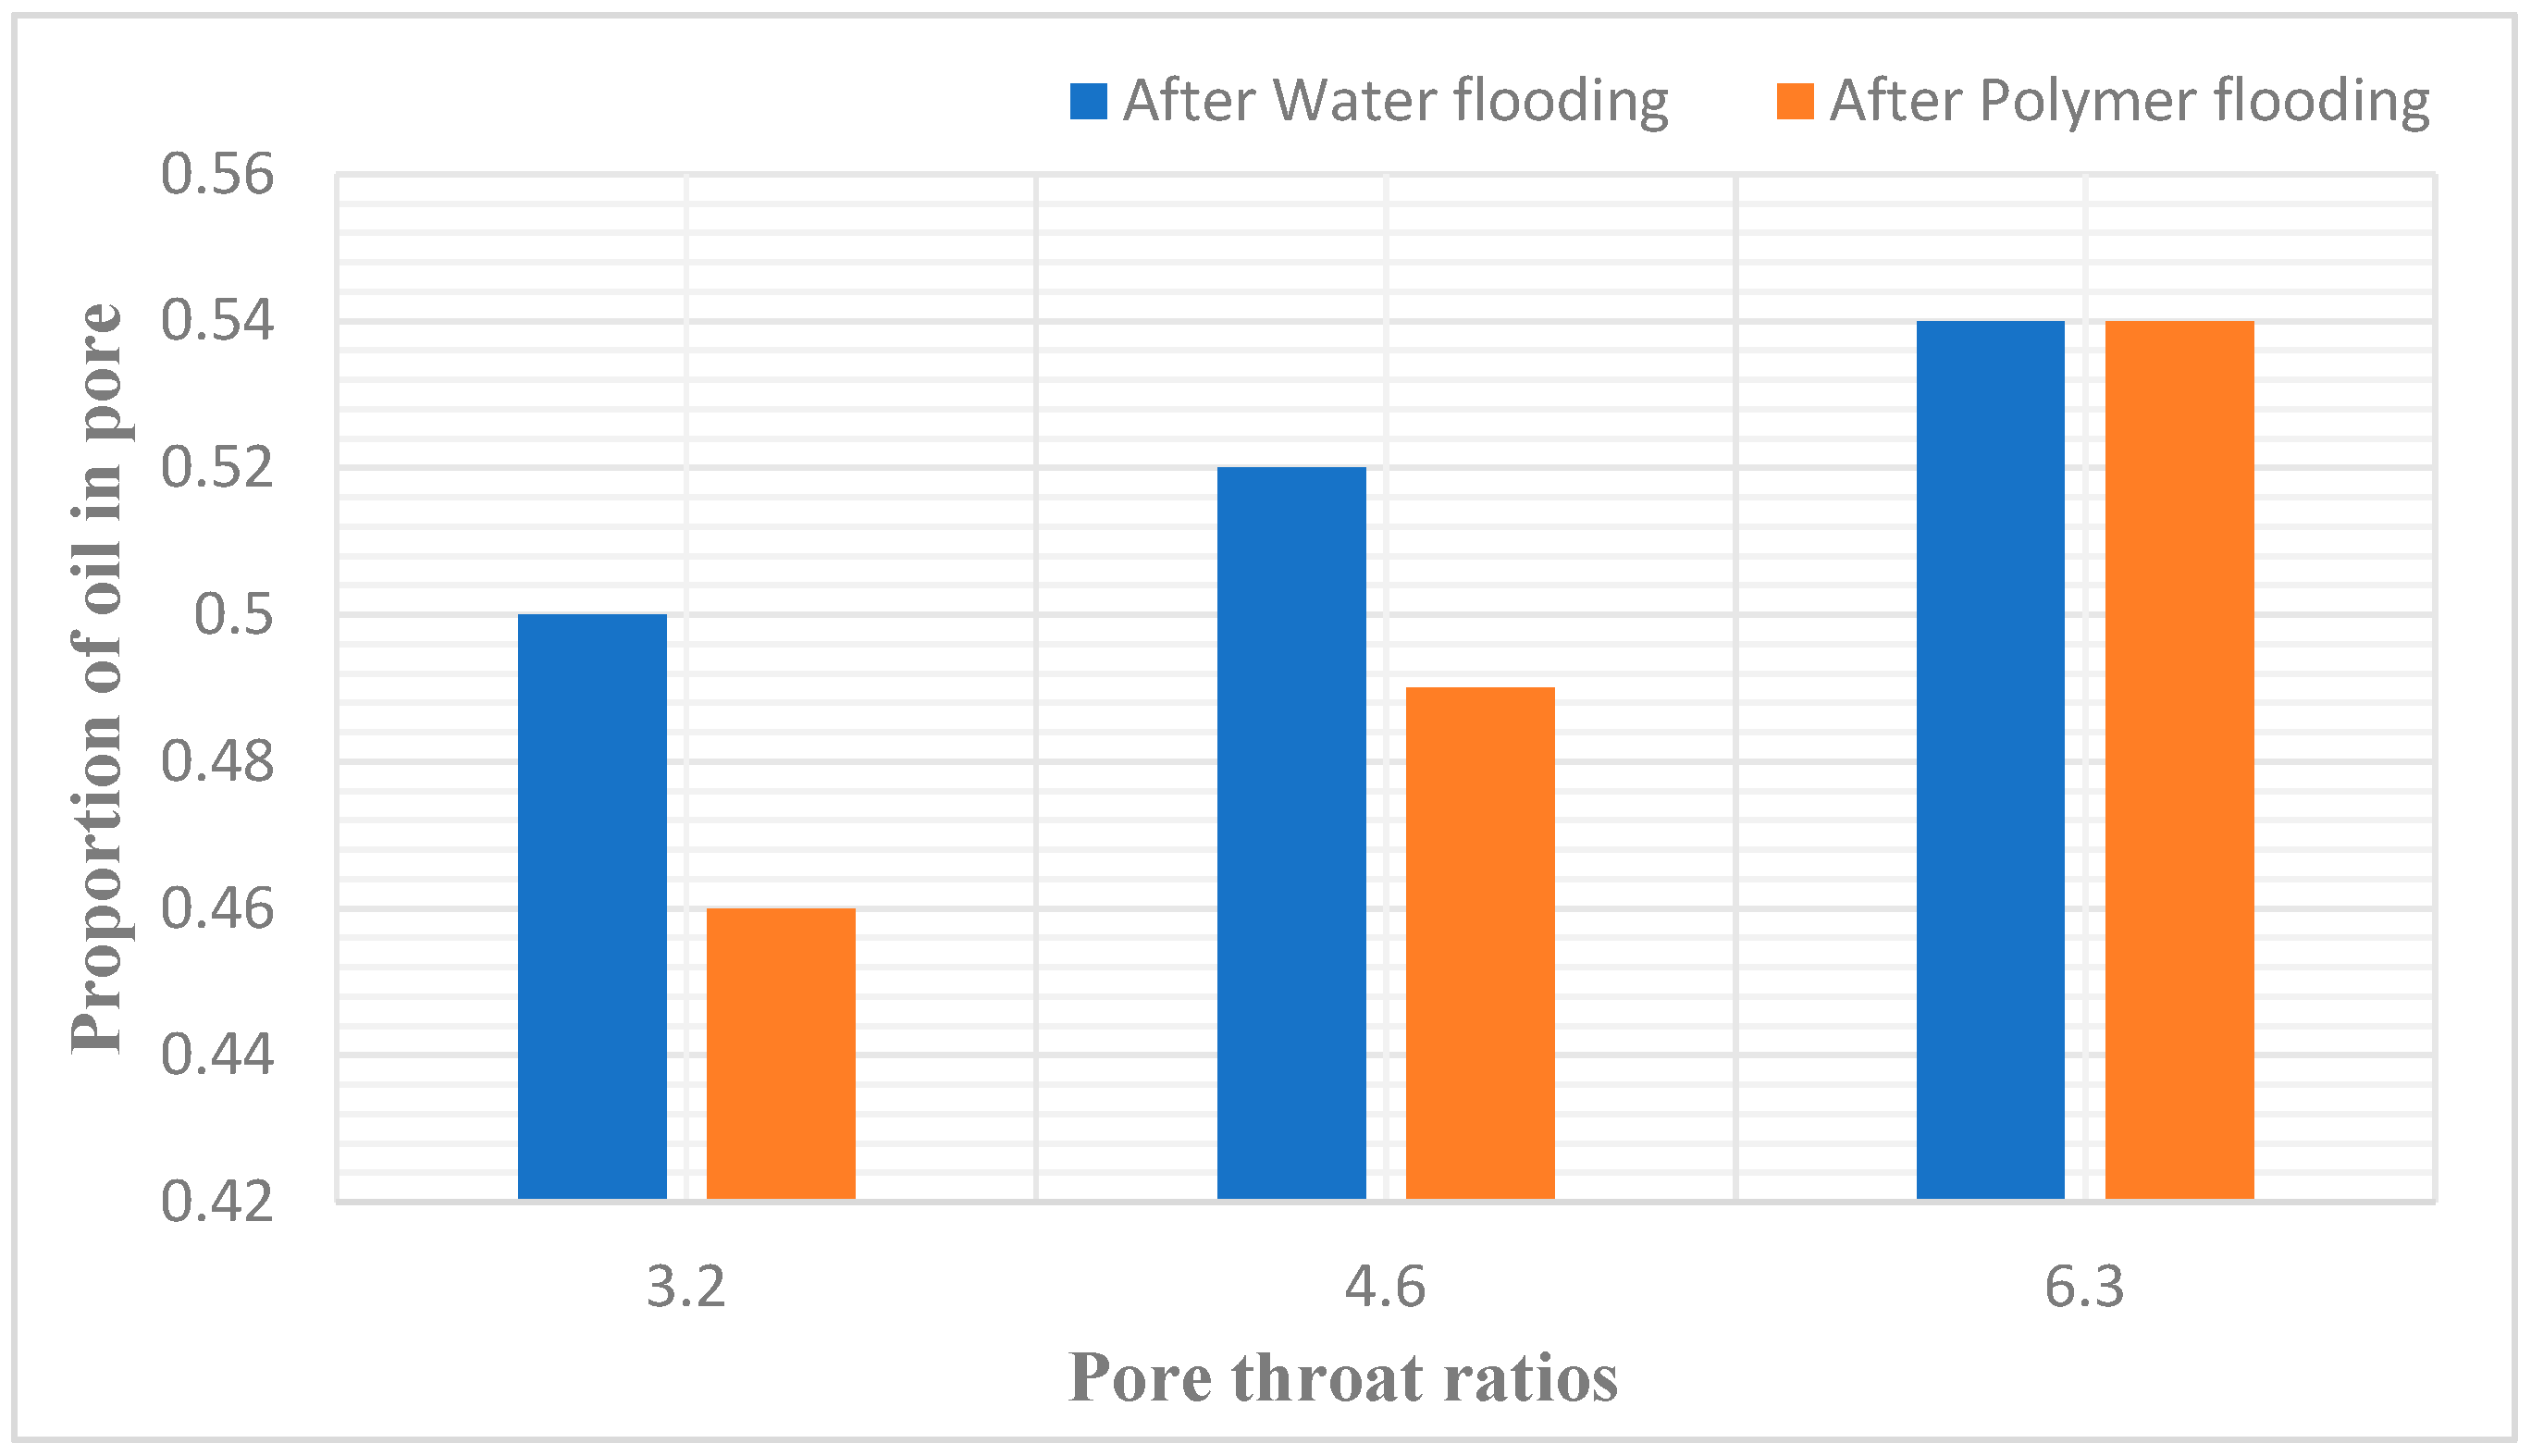
Table 13. Based on the analysis, it can be observed that under the parameter conditions of 3.2, 4.6, and 6.3, the oil saturation of pores after water flooding is 0.36, 0.38, and 0.40, respectively, while the oil saturation of pores after polymer flooding is 0.34, 0.36, and 0.39, respectively. It is evident that as the throat ratio increases, the oil saturation of pores also increases. Throat ratio is inversely proportional to recovery ratio.
Figure 16.
Proportion of oil in pore after water flooding and polymer flooding.
Figure 16.
Proportion of oil in pore after water flooding and polymer flooding.
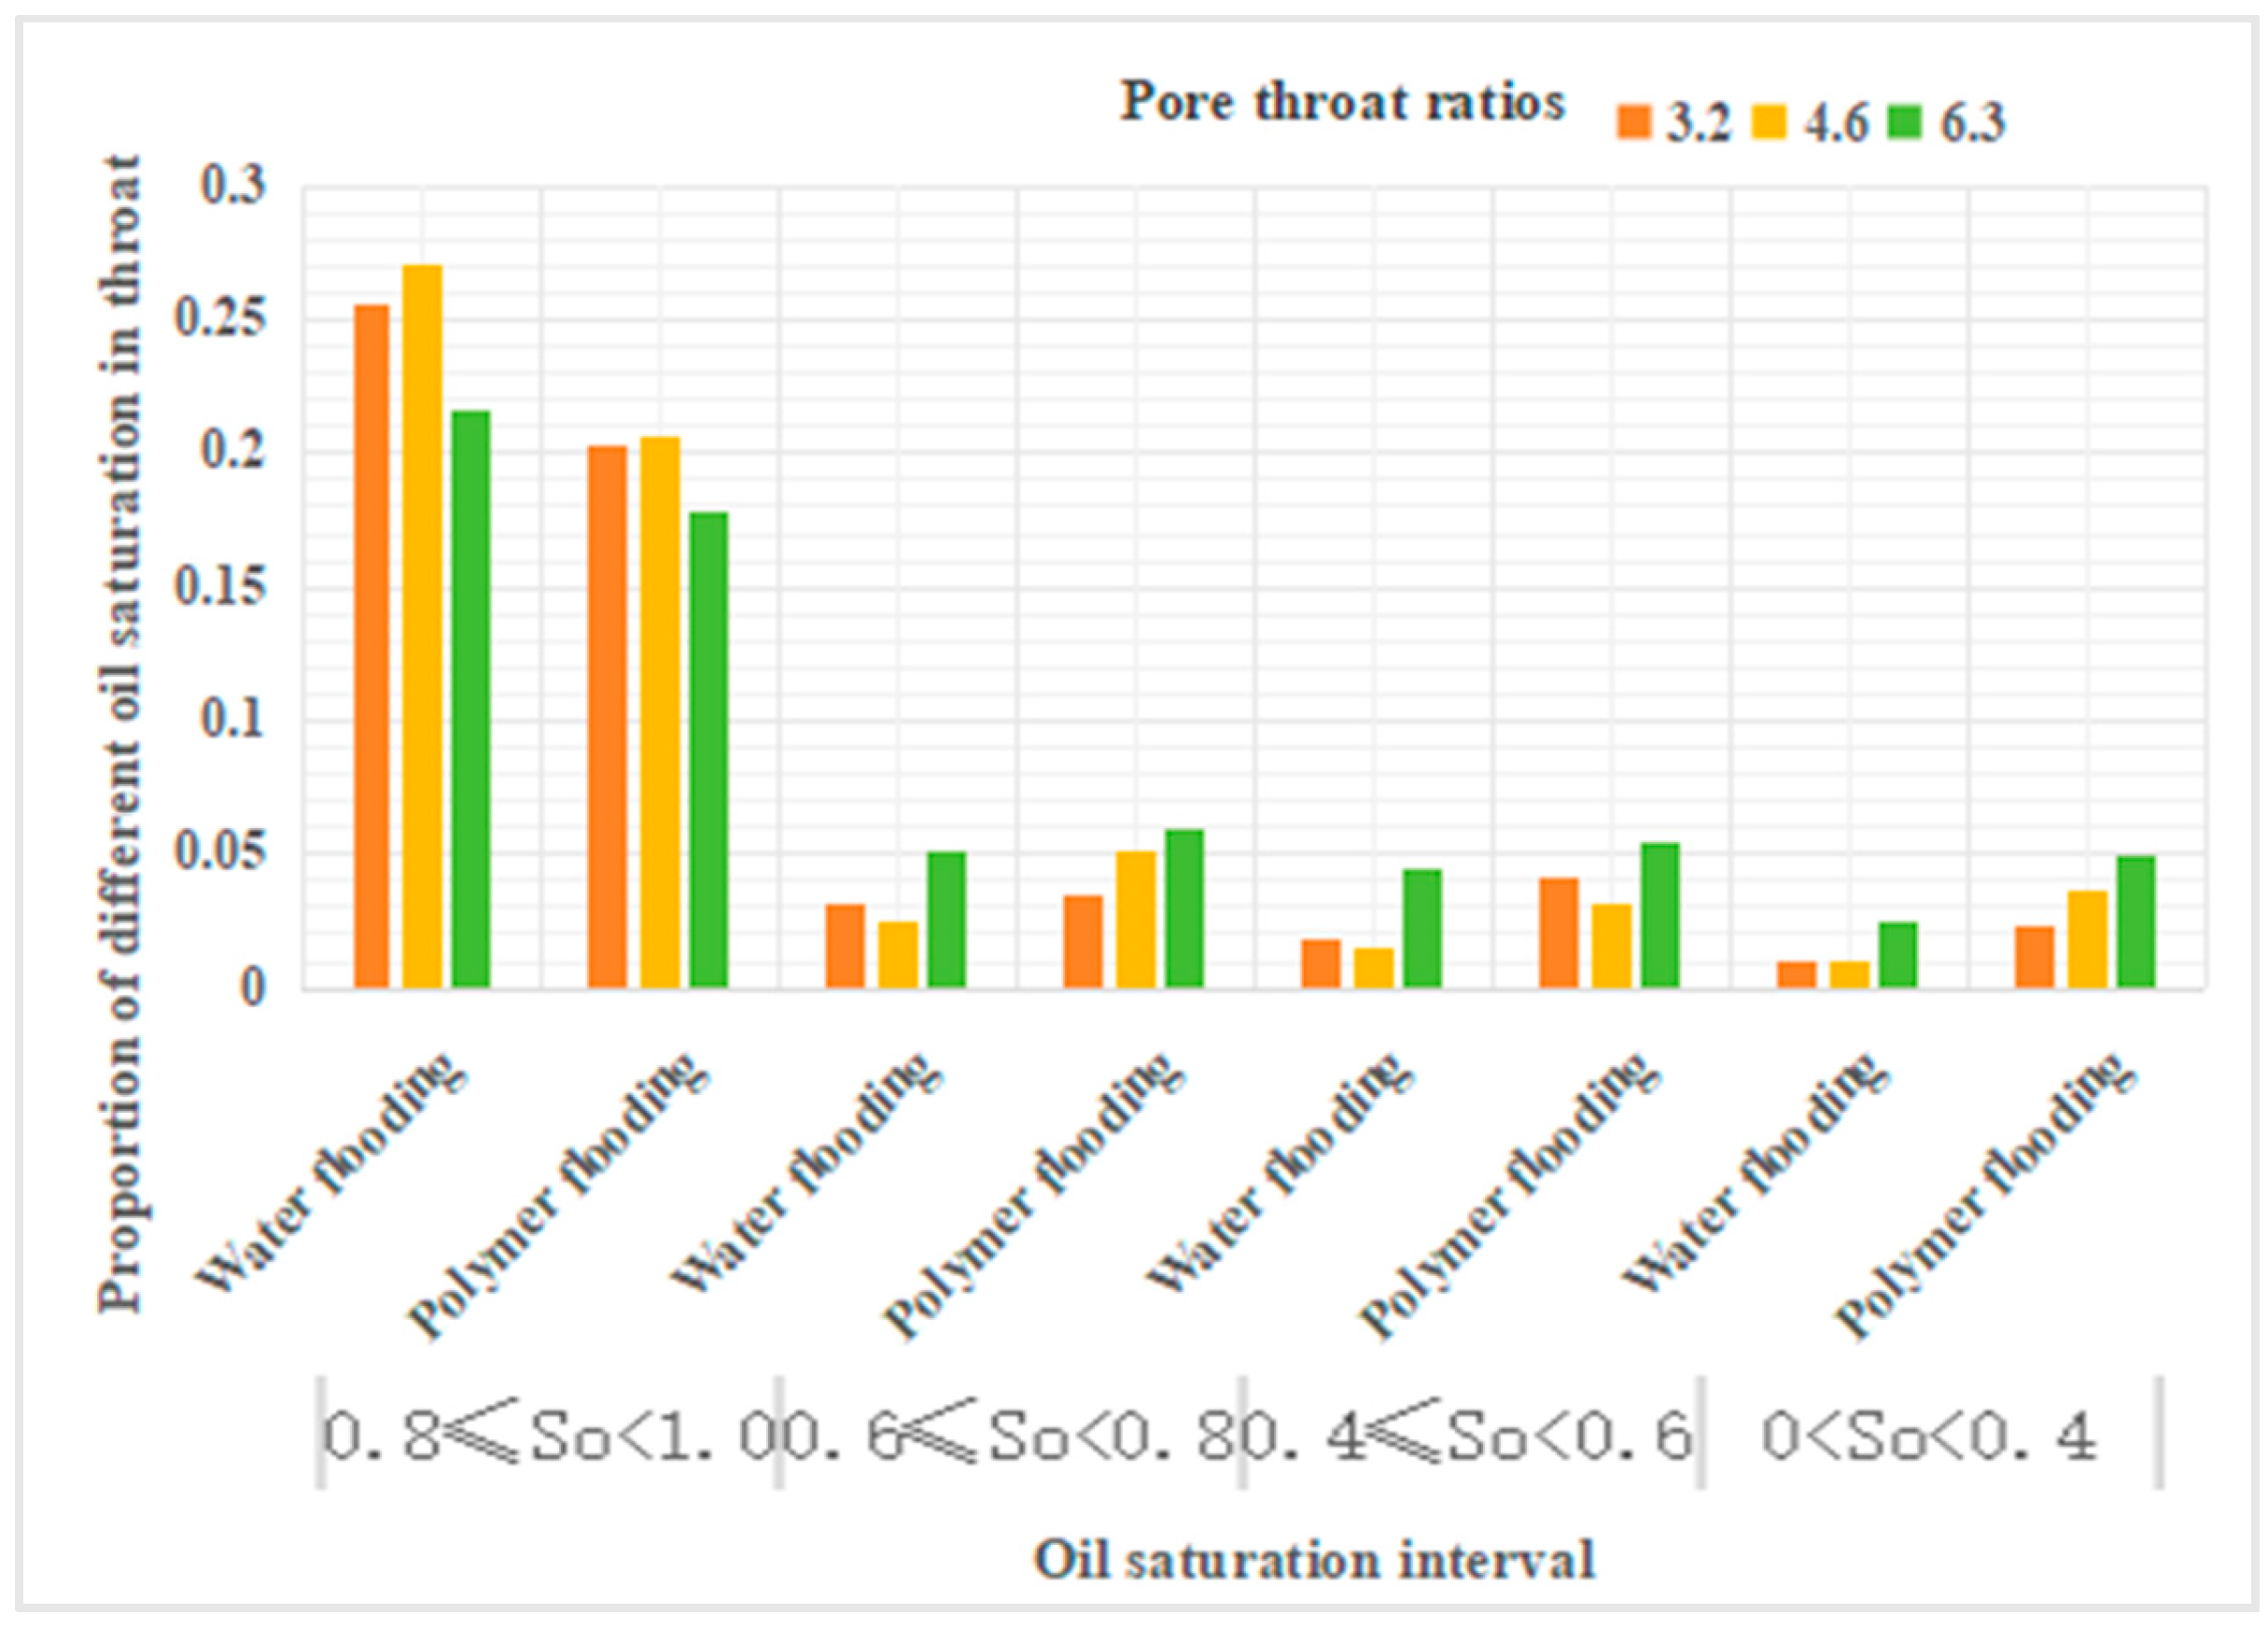
Figure 17.
Proportion of different oil saturation in throat.
Figure 17.
Proportion of different oil saturation in throat.
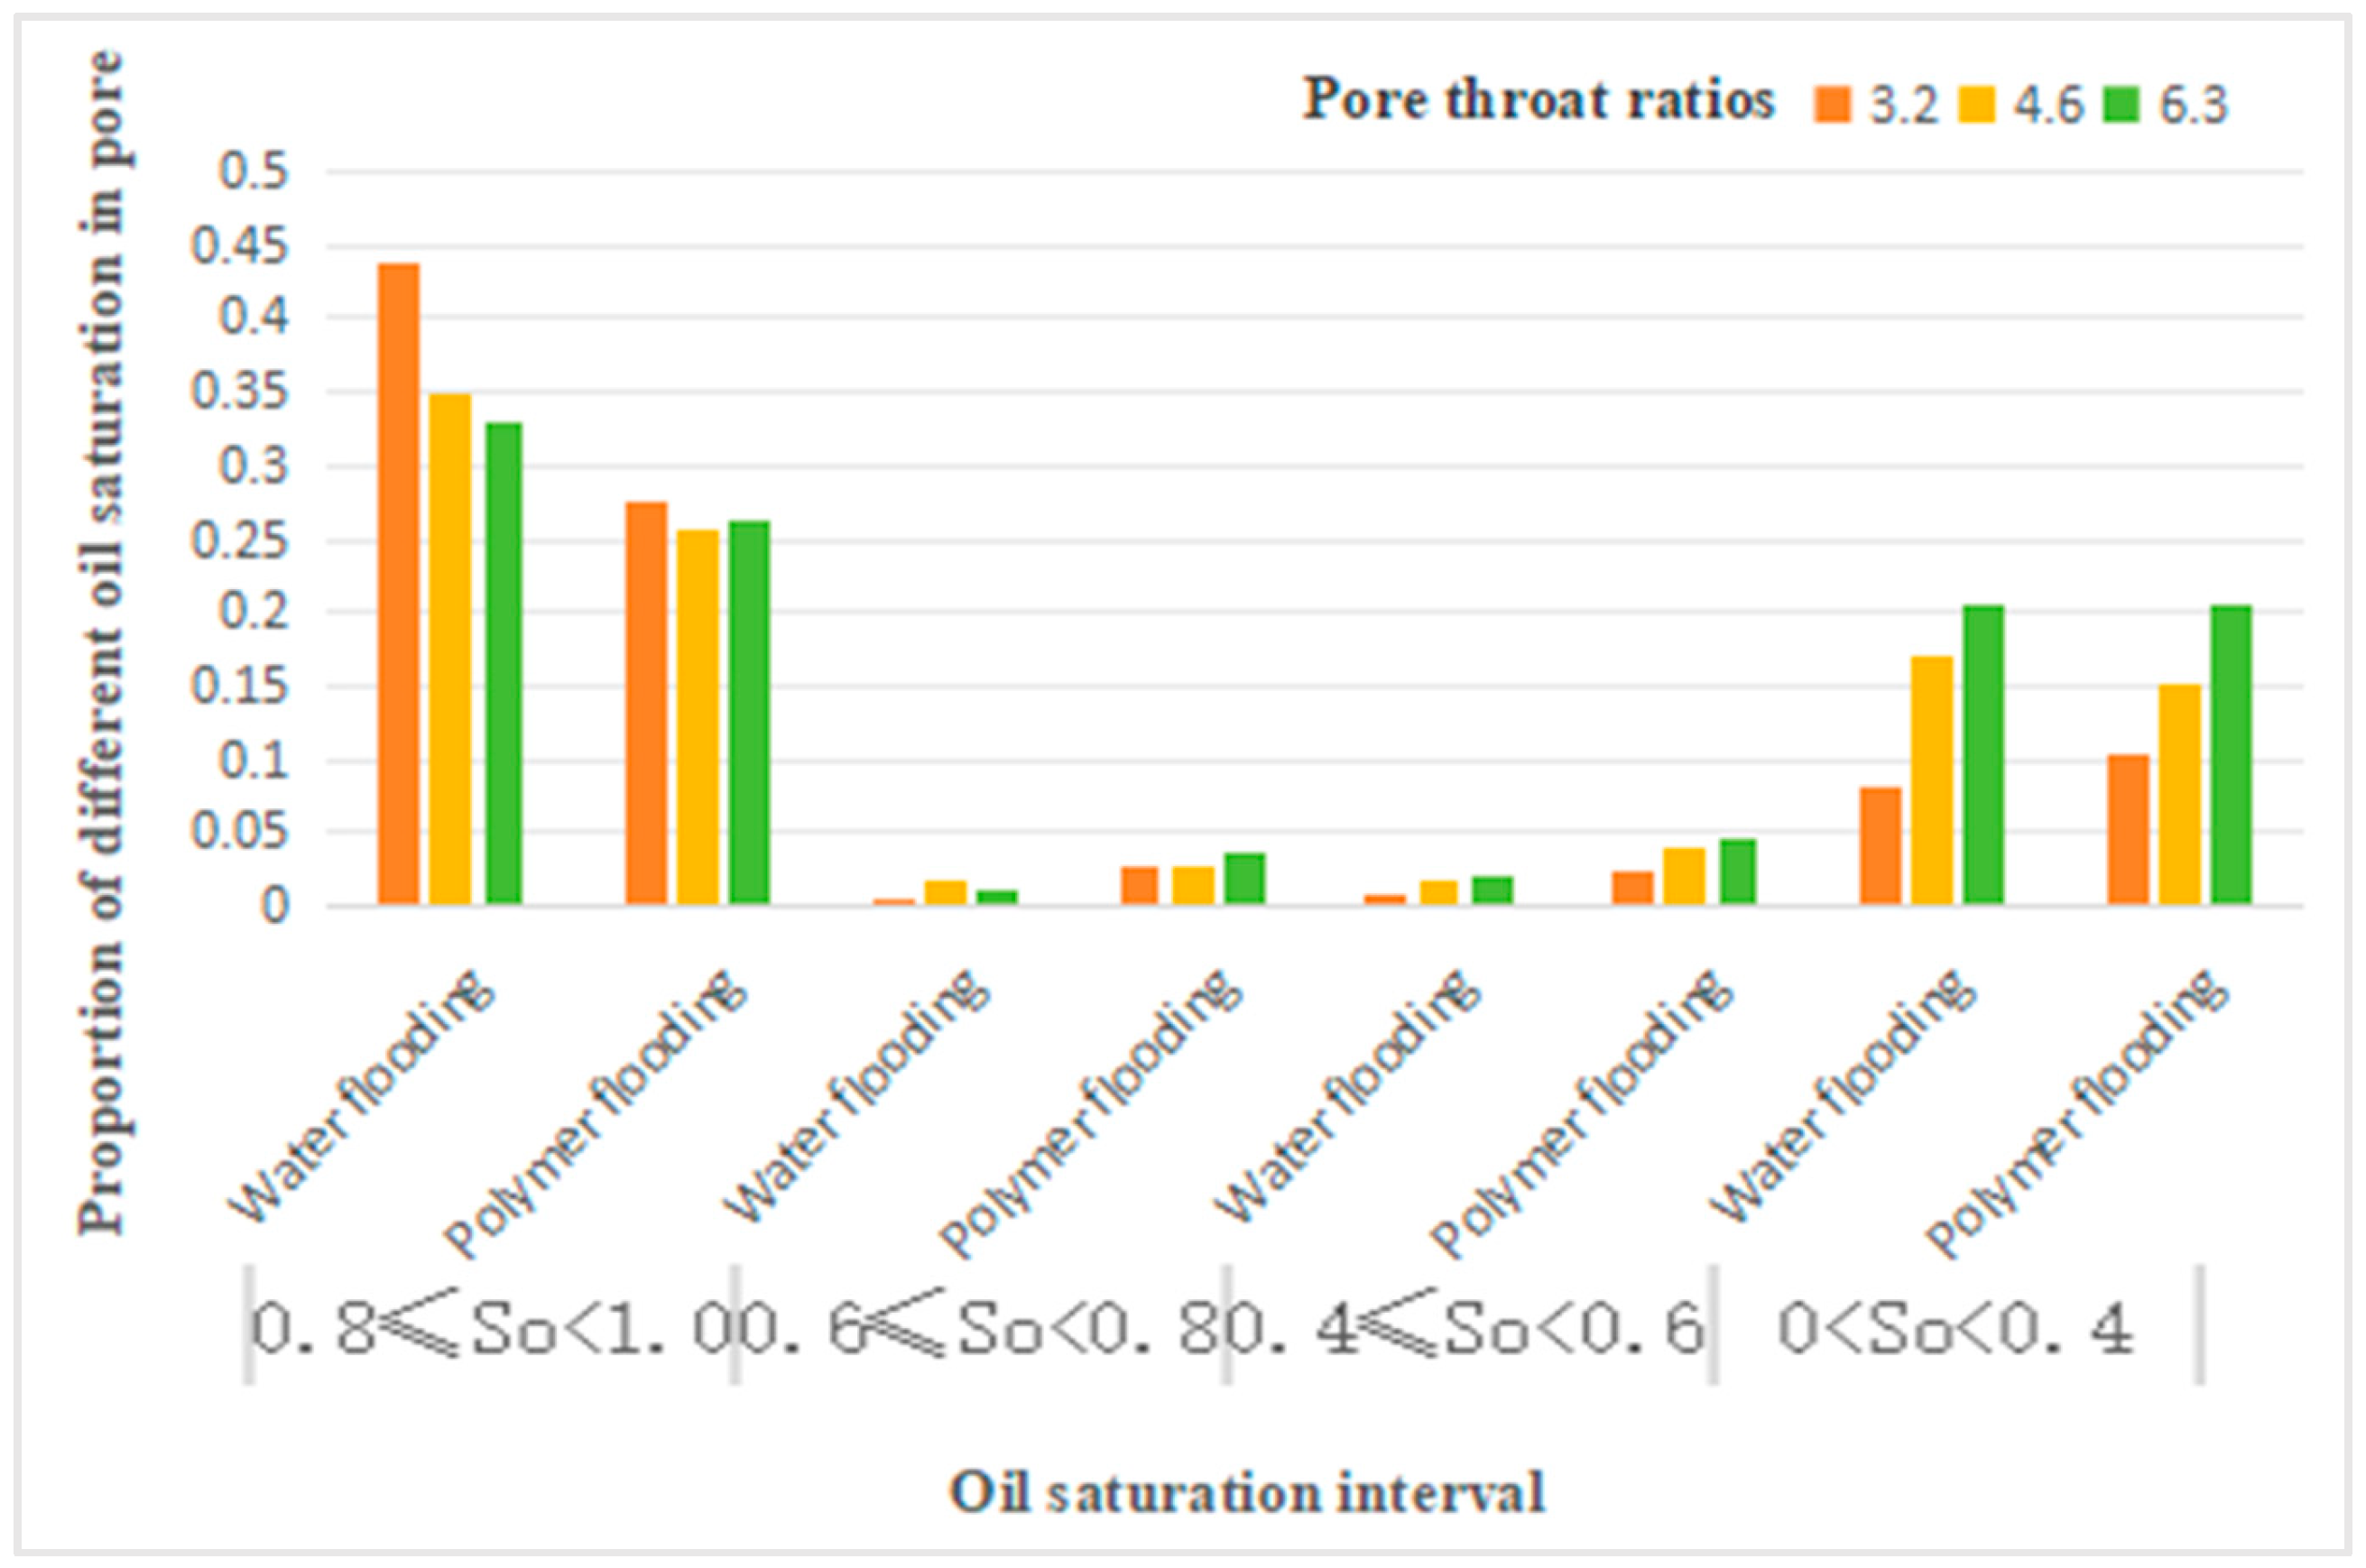
Figure 18.
Proportion of different oil saturation in pore.
Figure 18.
Proportion of different oil saturation in pore.
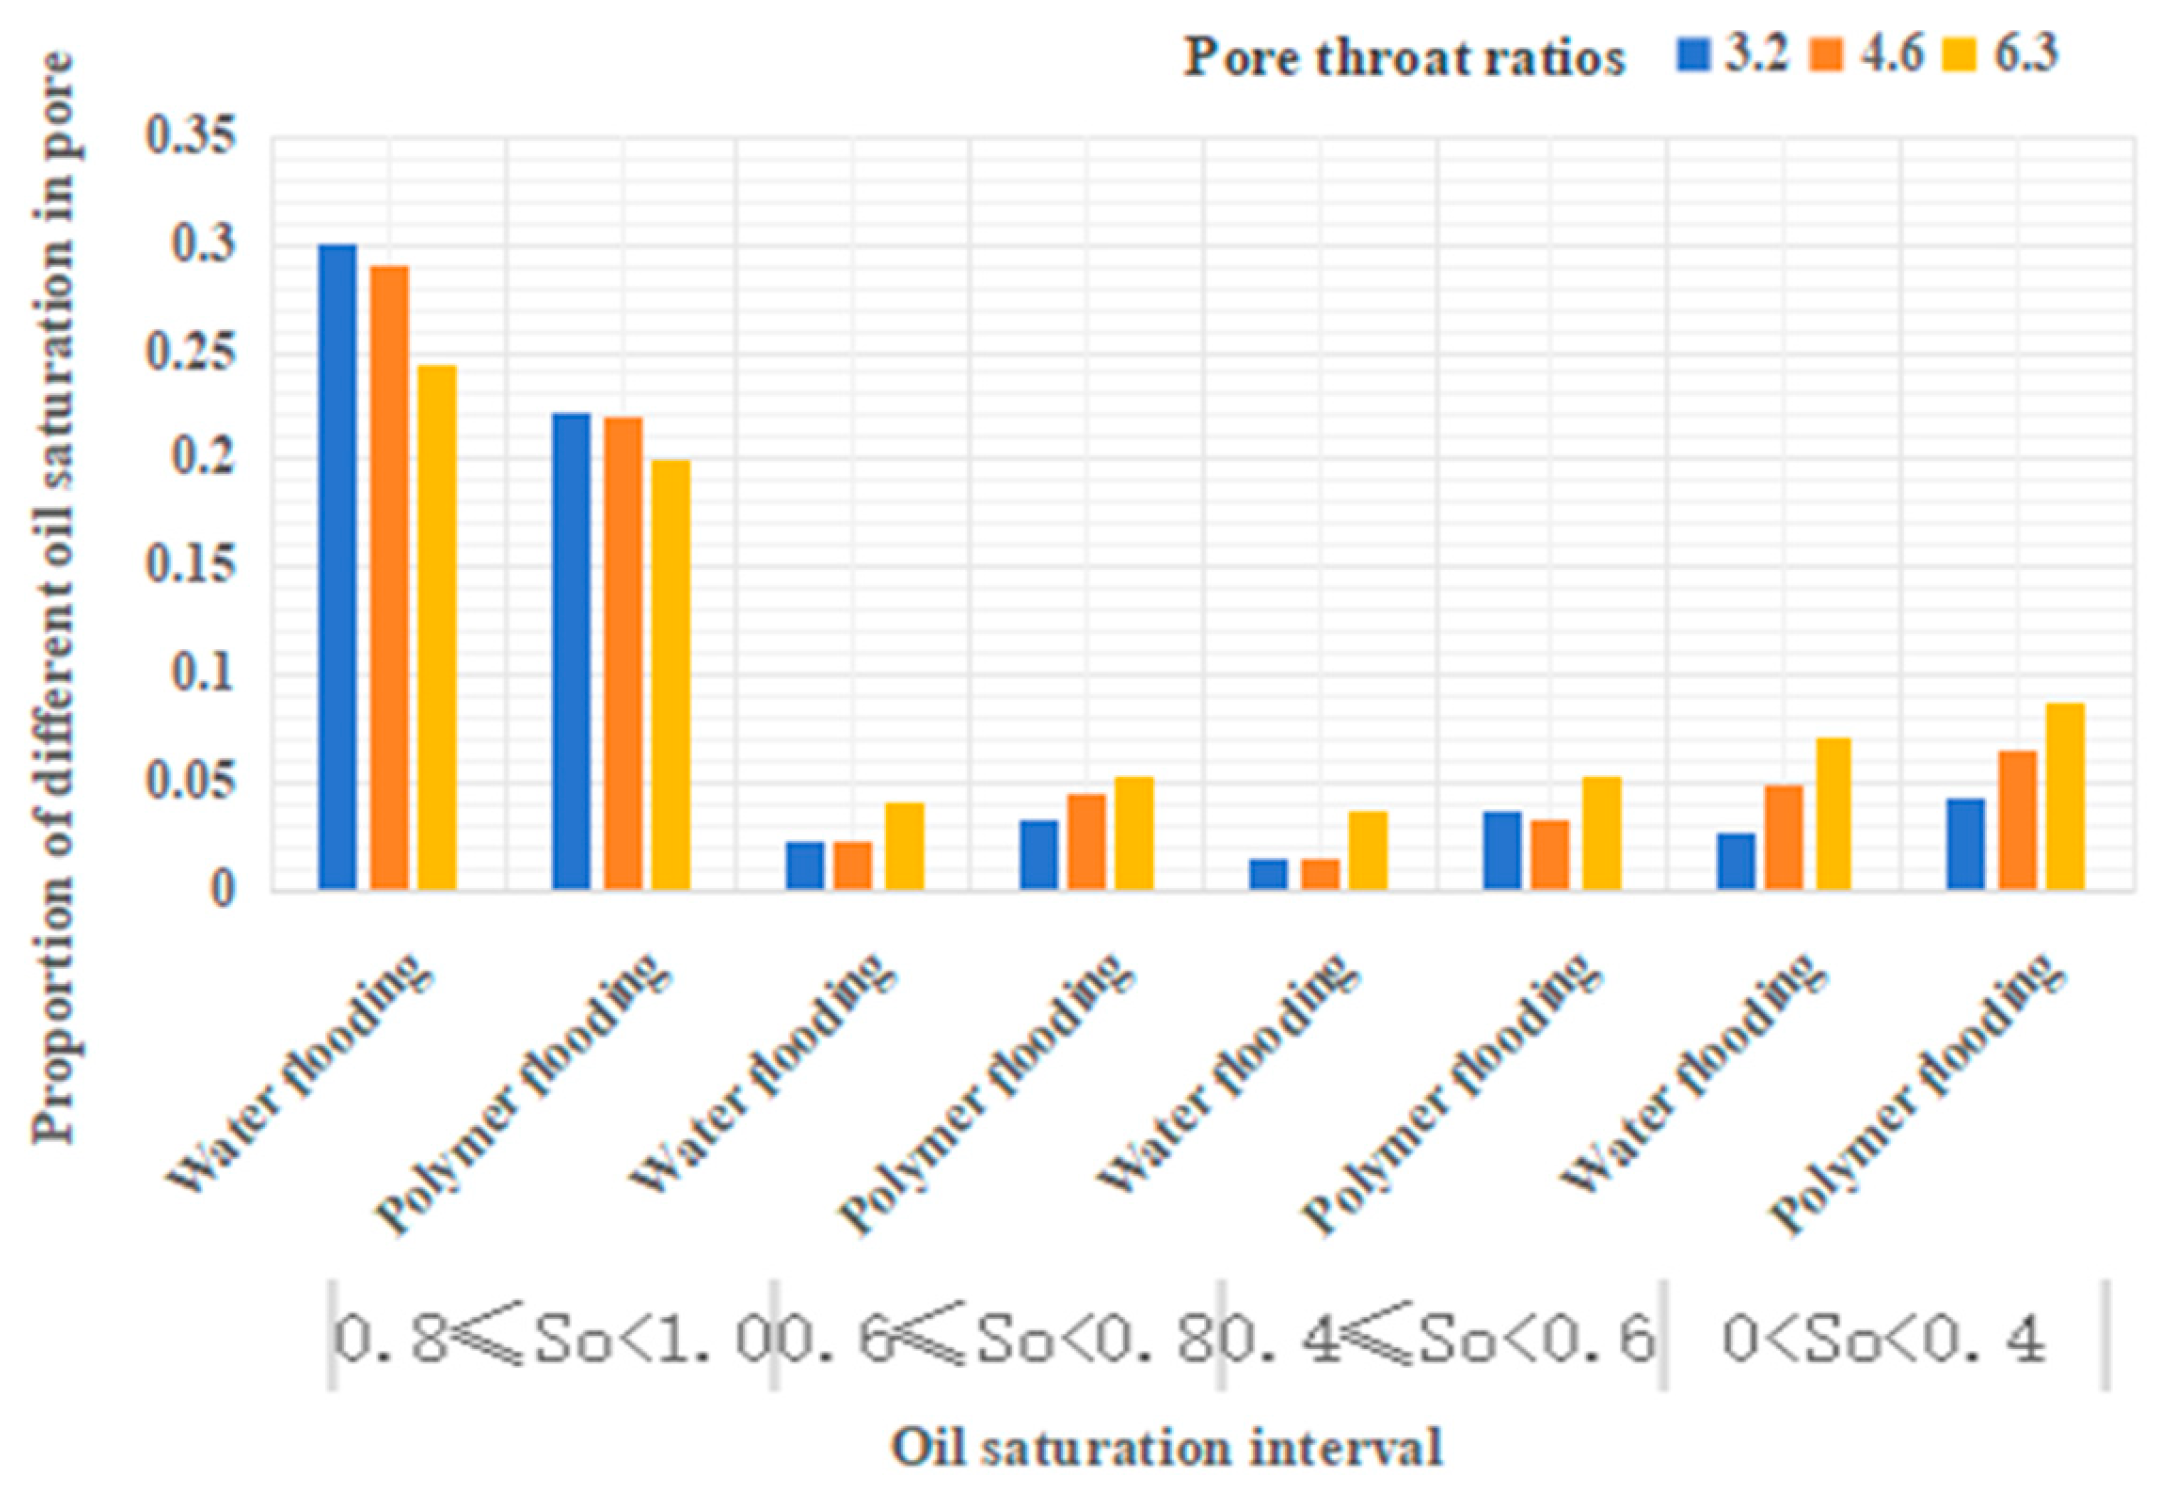
Figure 19.
Proportion of different oil saturation in pore and throat.
Figure 19.
Proportion of different oil saturation in pore and throat.
From
Table 14, it can be observed that compared to water flooding, polymer flooding results in a varying degree of reduction in the number of throat channels with oil saturation in the range of 0.8 to 1. Conversely, the number of throat channels with oil saturation in the ranges of 0.6-0.8, 0.4-0.6, and 0-0.4 shows an increase to varying degrees. Specifically, for throat channels with oil saturation in the range of 0.6-0.8, there is a 104% increase at a throat ratio of 4.6. For throat channels with oil saturation in the range of 0.4-0.6, the increase is 116% and 113% at throat ratios of 3.2 and 4.6, respectively. For throat channels with oil saturation in the range of 0-0.4, the increase is 140%, 260%, and 96% at throat ratios of 3.2, 4.6, and 6.3, respectively.
From
Table 15, it can be seen that, compared to water flooding, polymer flooding leads to a decrease in the number of pores with oil saturation in the range of 0.8 to 1. The reduction is 37%, 27%, and 21% at throat ratios of 3.2, 4.6, and 6.3, respectively. Conversely, the number of pores with oil saturation in the range of 0.6-0.8 increases, with increases of 43.5%, 95.7%, and 28.6% at throat ratios of 3.2, 4.6, and 6.3, respectively. For pores with oil saturation in the range of 0.4-0.6, the increase is 213%, 117%, and 135% at throat ratios of 3.2, 4.6, and 6.3, respectively. For pores with oil saturation in the range of 0-0.4, there is an increase of 27% at a throat ratio of 3.2, while at throat ratios of 4.6 and 6.3, there is a decrease of 11% and 1%, respectively. For pores with oil saturation of 0, there is an increase of 20%, 18%, and 3% at throat ratios of 3.2, 4.6, and 6.3, respectively.
From
Table 16, it can be seen that, compared to water flooding, polymer flooding leads to a certain degree of reduction in the number of throat channels with oil saturation in the range of 0.8 to 1. For throat channels with oil saturation in the range of 0.6-0.8, there is an increase of 43%, 96%, and 29% at throat ratios of 3.2, 4.6, and 6.3, respectively. For throat channels with oil saturation in the range of 0.4-0.6, the increase is 131%, 113%, and 29% at throat ratios of 3.2, 4.6, and 6.3, respectively. For throat channels with oil saturation in the range of 0-0.4, the increase is 57%, 30%, and 24% at throat ratios of 3.2, 4.6, and 6.3, respectively. It is noteworthy that the increase in the number of throat channels with oil saturation in the range of 0.4-0.6 is significantly higher than the increase in other oil-saturated throat channels.
4.3. Research on Remaining Oil Types and Quantities
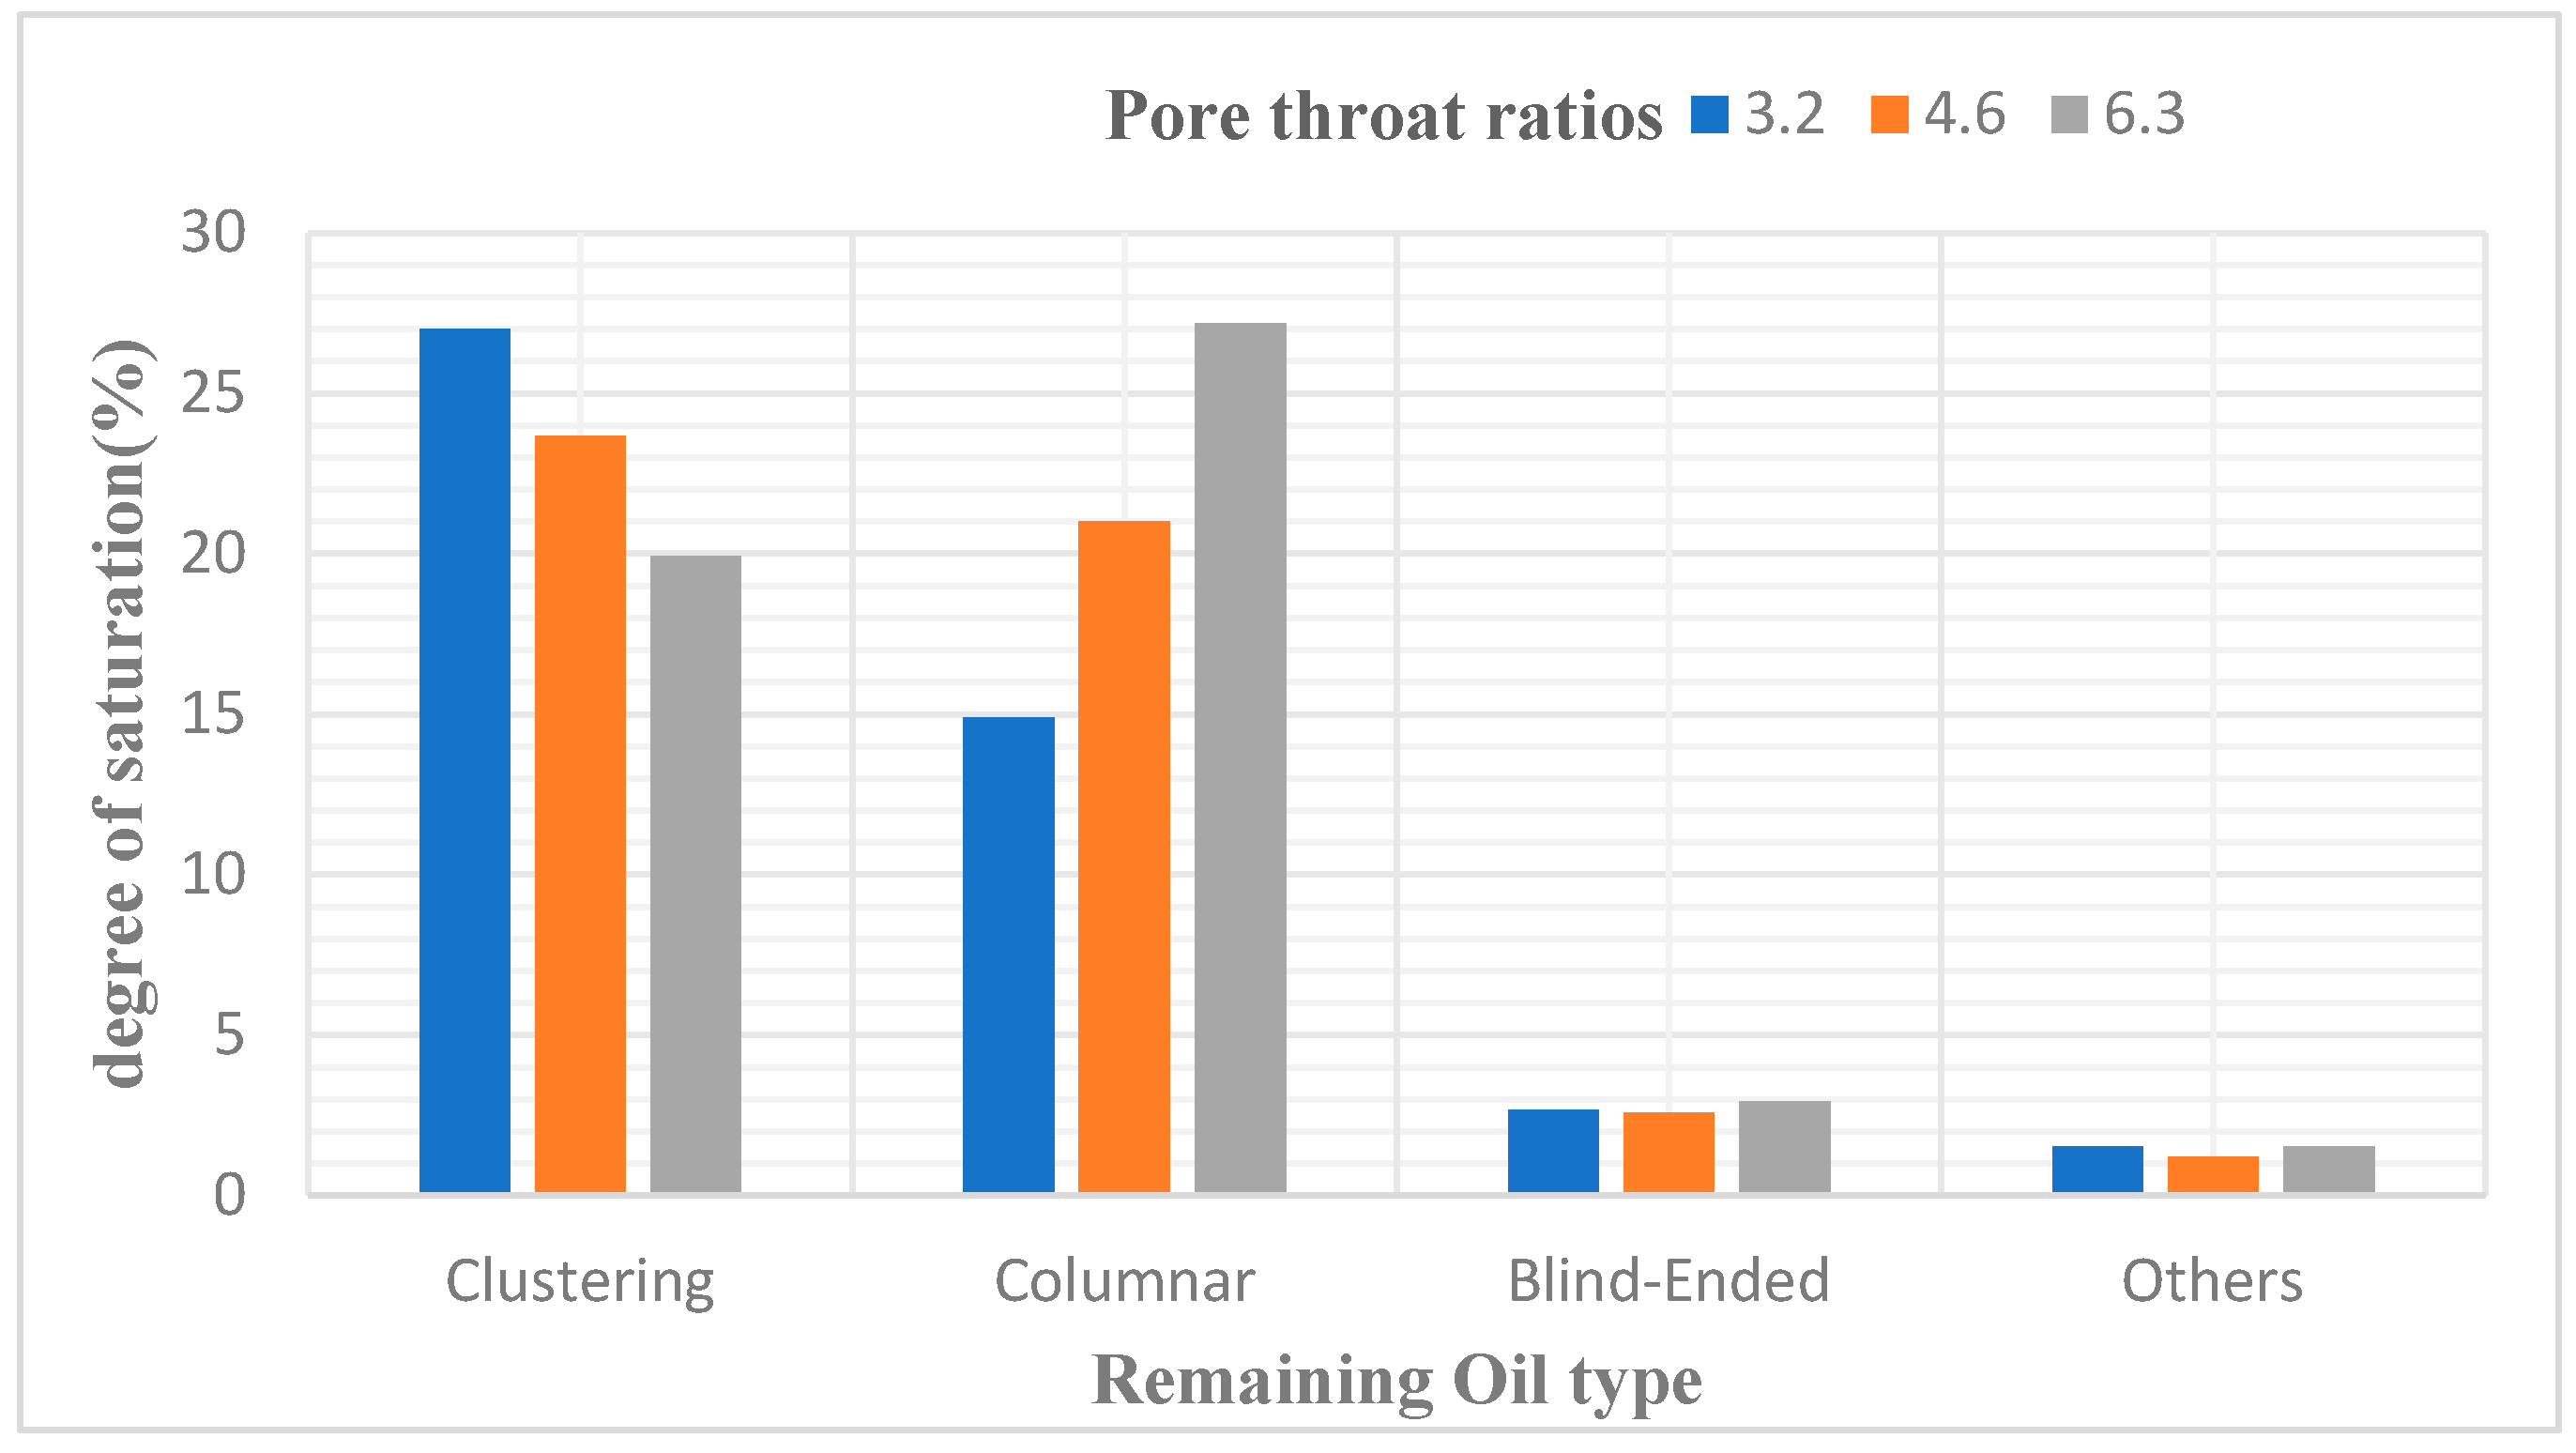
After simulating polymer flooding in the model, three different models with varying throat ratios were selected to capture and render the distribution of remaining oil on a specific cross-section, as shown in
Figure 20. Subsequently, the remaining oil types and their corresponding saturations in these different throat ratio models were calculated and analyzed, as presented in
Table 17.
The simulation results revealed that the effect of increasing throat ratio is opposite to the coordination number. When the pore radius remains constant, an increase in throat ratio results in a reduction in throat channel radius, naturally leading to a decrease in core permeability. Simultaneously, the throat channel resistance increases, causing more remaining oil to be trapped within the throat channels, resulting in a significant increase in columnar remaining oil.
As the throat ratio decreases, the resistance within the throat channels during displacement decreases, making it less likely for remaining oil to be trapped inside them. This is manifested by a reduction in columnar remaining oil and an increase in cluster-like remaining oil.
5. The Impact of Wettability on Various Types of Remaining Oil
5.1. The Impact of Different Wettability Ratios on Oil Displacement Efficiency
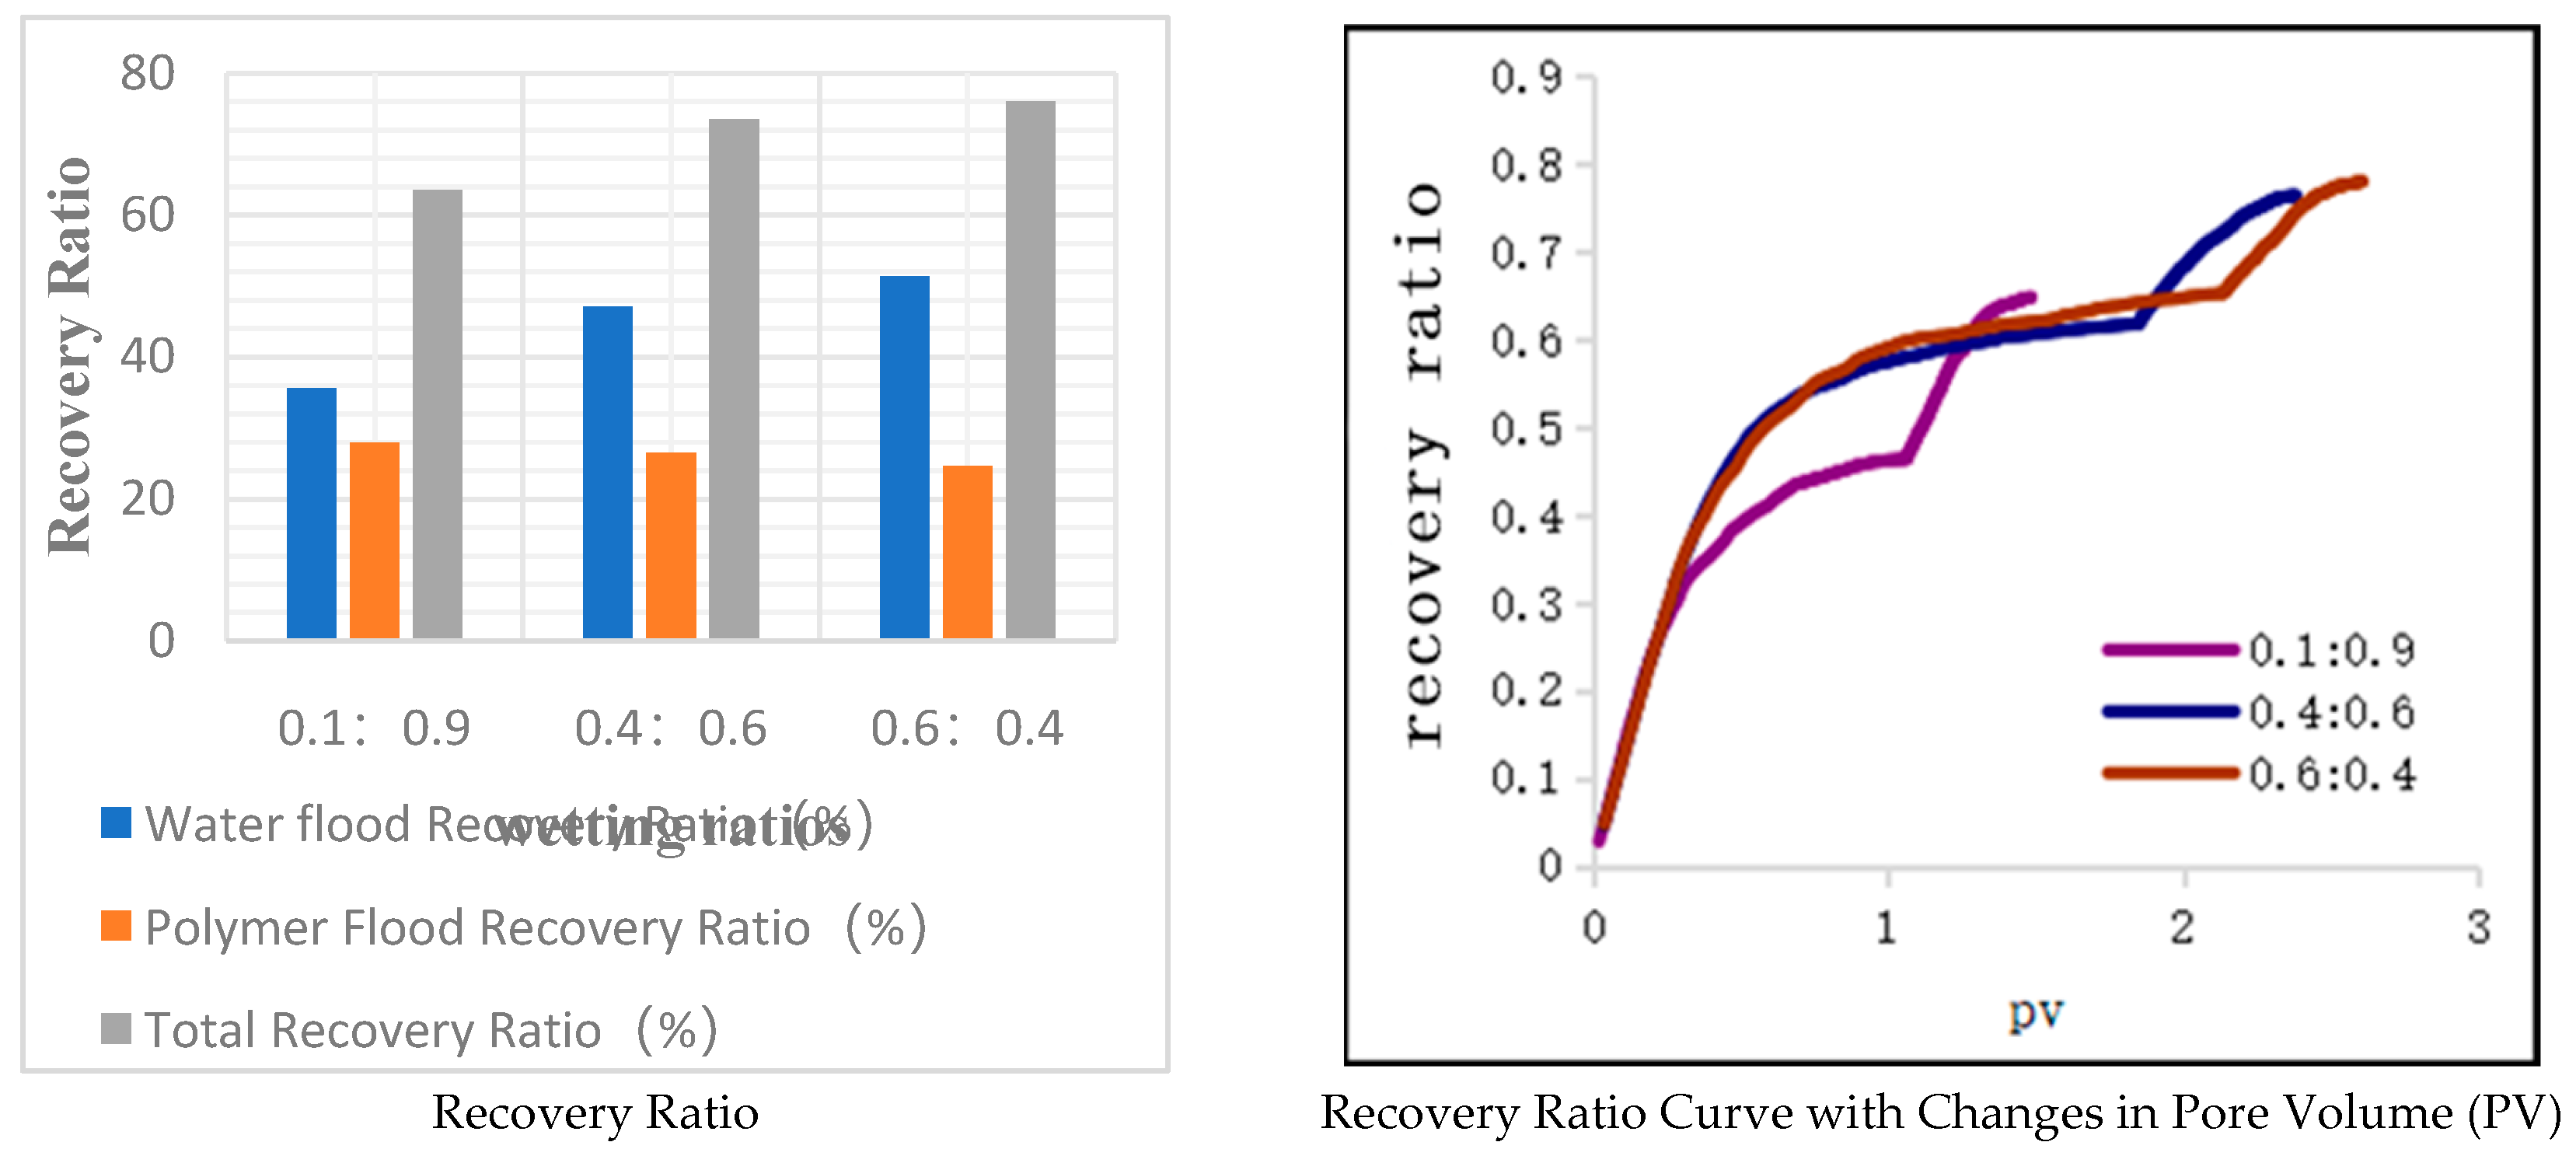
Wettability is a critical indicator that describes the properties of the oil-water interface. In the digital pore model constructed based on scheme 2 in this paper, a mixed wetting pattern is employed, with some throats being water-wet and others being oil-wet. The results of changing the wettability ratio are presented in
Table 17 and
Figure 22.
In the three models, the ratios of water-wet to oil-wet throats are 0.1:0.9, 0.4:0.6, and 0.6:0.4, respectively. All three models have identical pore structure parameters, resulting in the same porosity. As the proportion of water-wet throats increases, the oil recovery during water flooding increases. Comparing the model with a wetting ratio of 0.1:0.9 to the one with a ratio of 0.6:0.4, the polymer flooding recovery is lower by 0.0326%. However, the corresponding water flooding recovery is higher by 0.0621%, resulting in a total recovery increase of 0.1246%. More water-wet throats are beneficial for oil recovery because, during both water flooding and polymer flooding, if the throats are water-wet, capillary forces act as a driving force, reducing the possibility of remaining oil. On the other hand, the fewer oil-wet throats there are, the smaller the probability of remaining oil in non-circular throat corners, leading to higher recovery ratios.
5.2. Study on the Distribution and Patterns of Remaining Oil
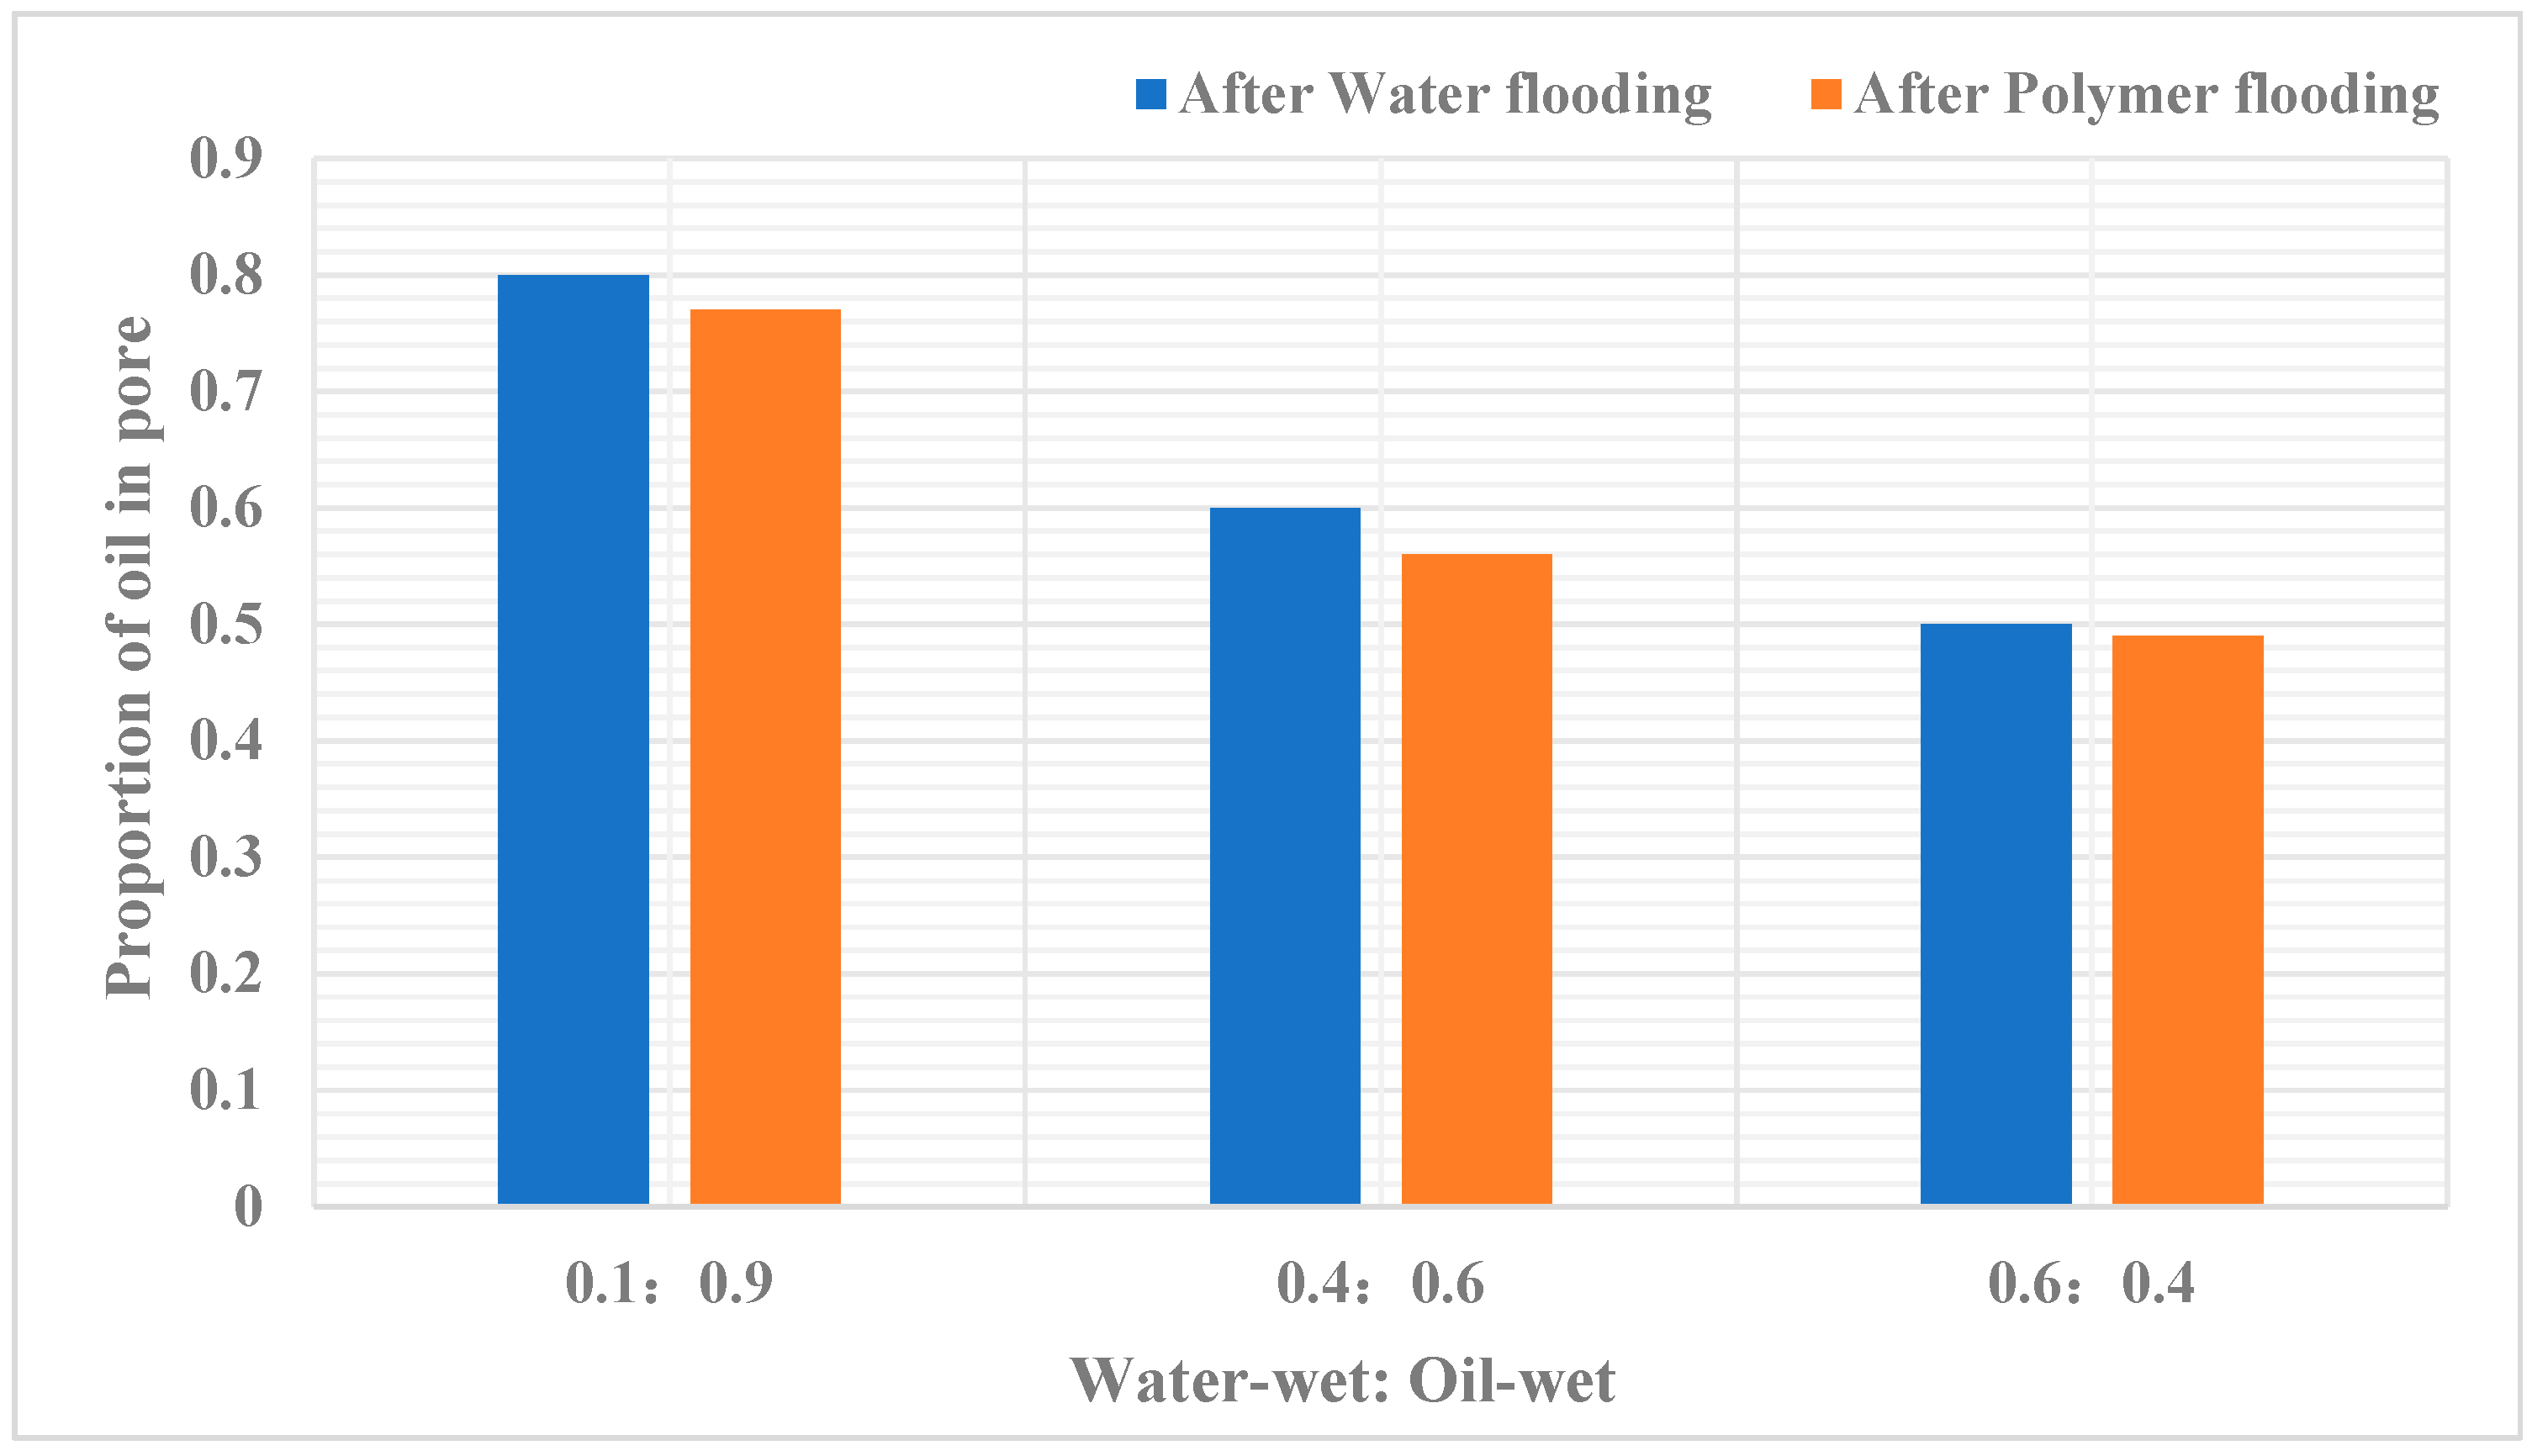
After water flooding and polymer flooding in the digital pore model, the numbers of oil-containing pores were separately counted for each scheme. Through
Table 18, it can be analyzed that under the parameter conditions of wettability ratios at 0.1:0.9, 0.4:0.6, and 0.6:0.4, the oil saturation of pores after water flooding is 0.58, 0.44, and 0.36, respectively, while the oil saturation of pores after polymer flooding is 0.56, 0.41, and 0.35, respectively.
Figure 23.
Proportion of oil in pore.
Figure 23.
Proportion of oil in pore.
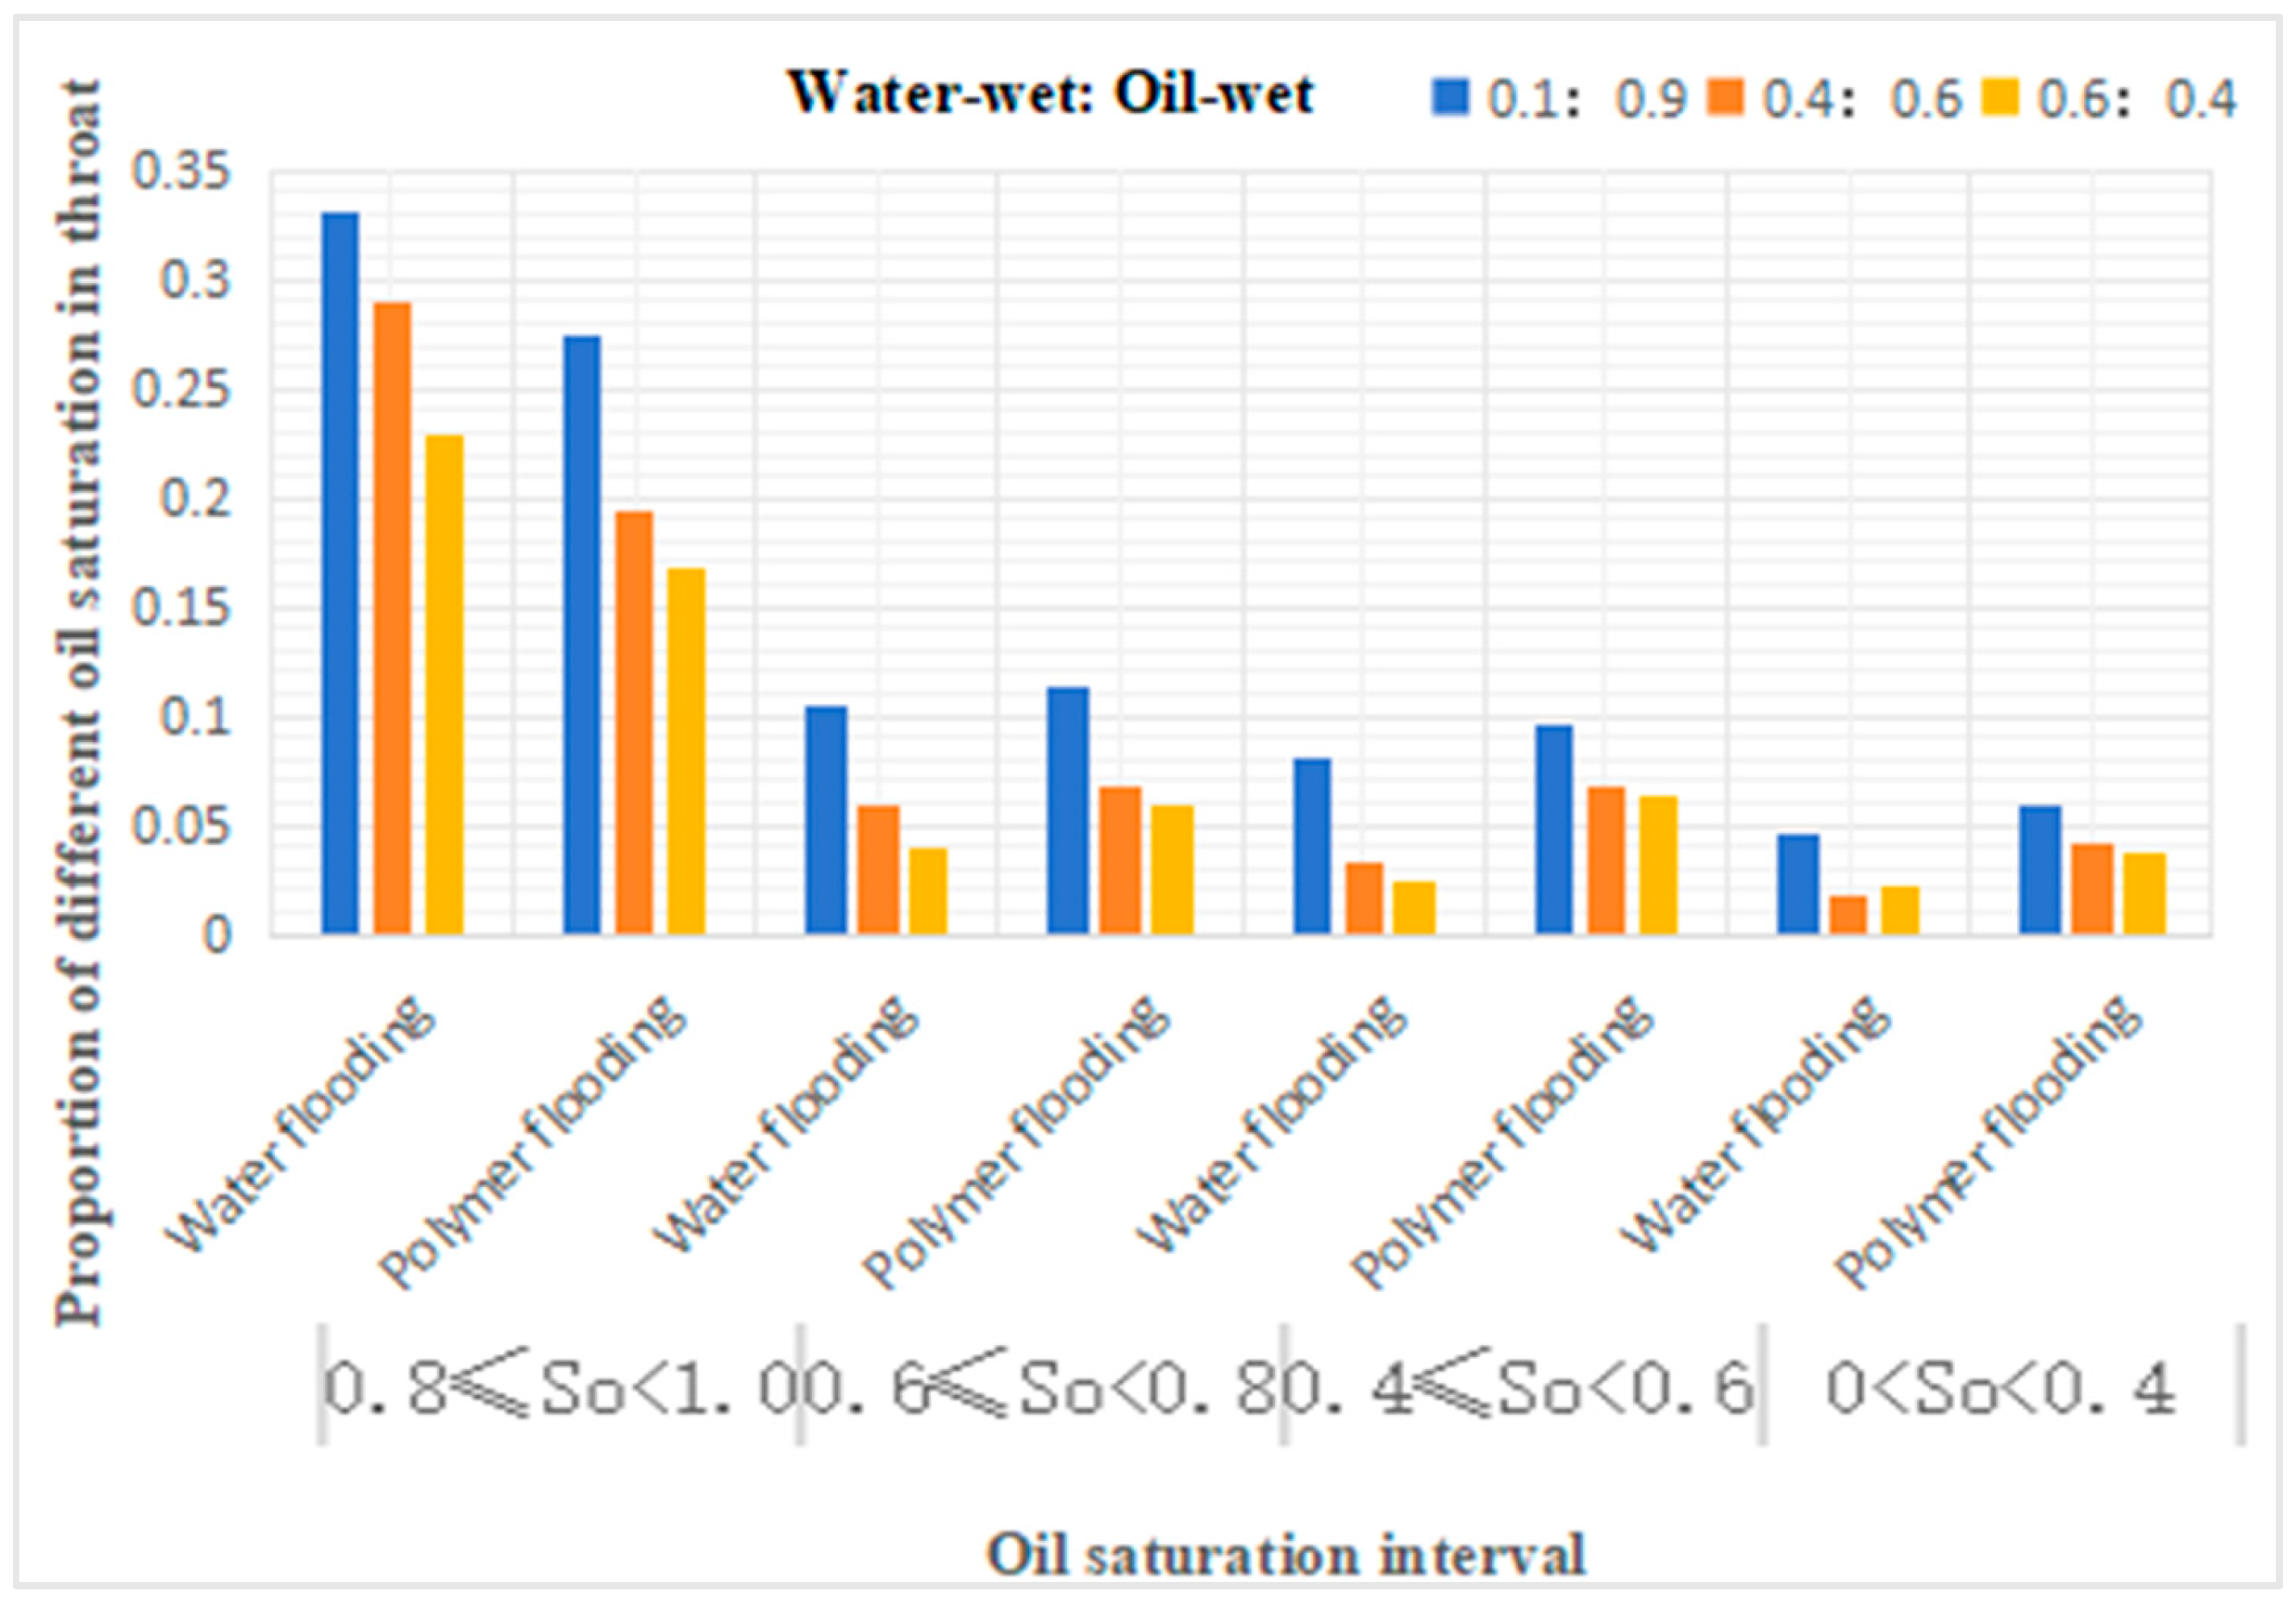
Figure 24.
Proportion of different oil saturation in throat.
Figure 24.
Proportion of different oil saturation in throat.
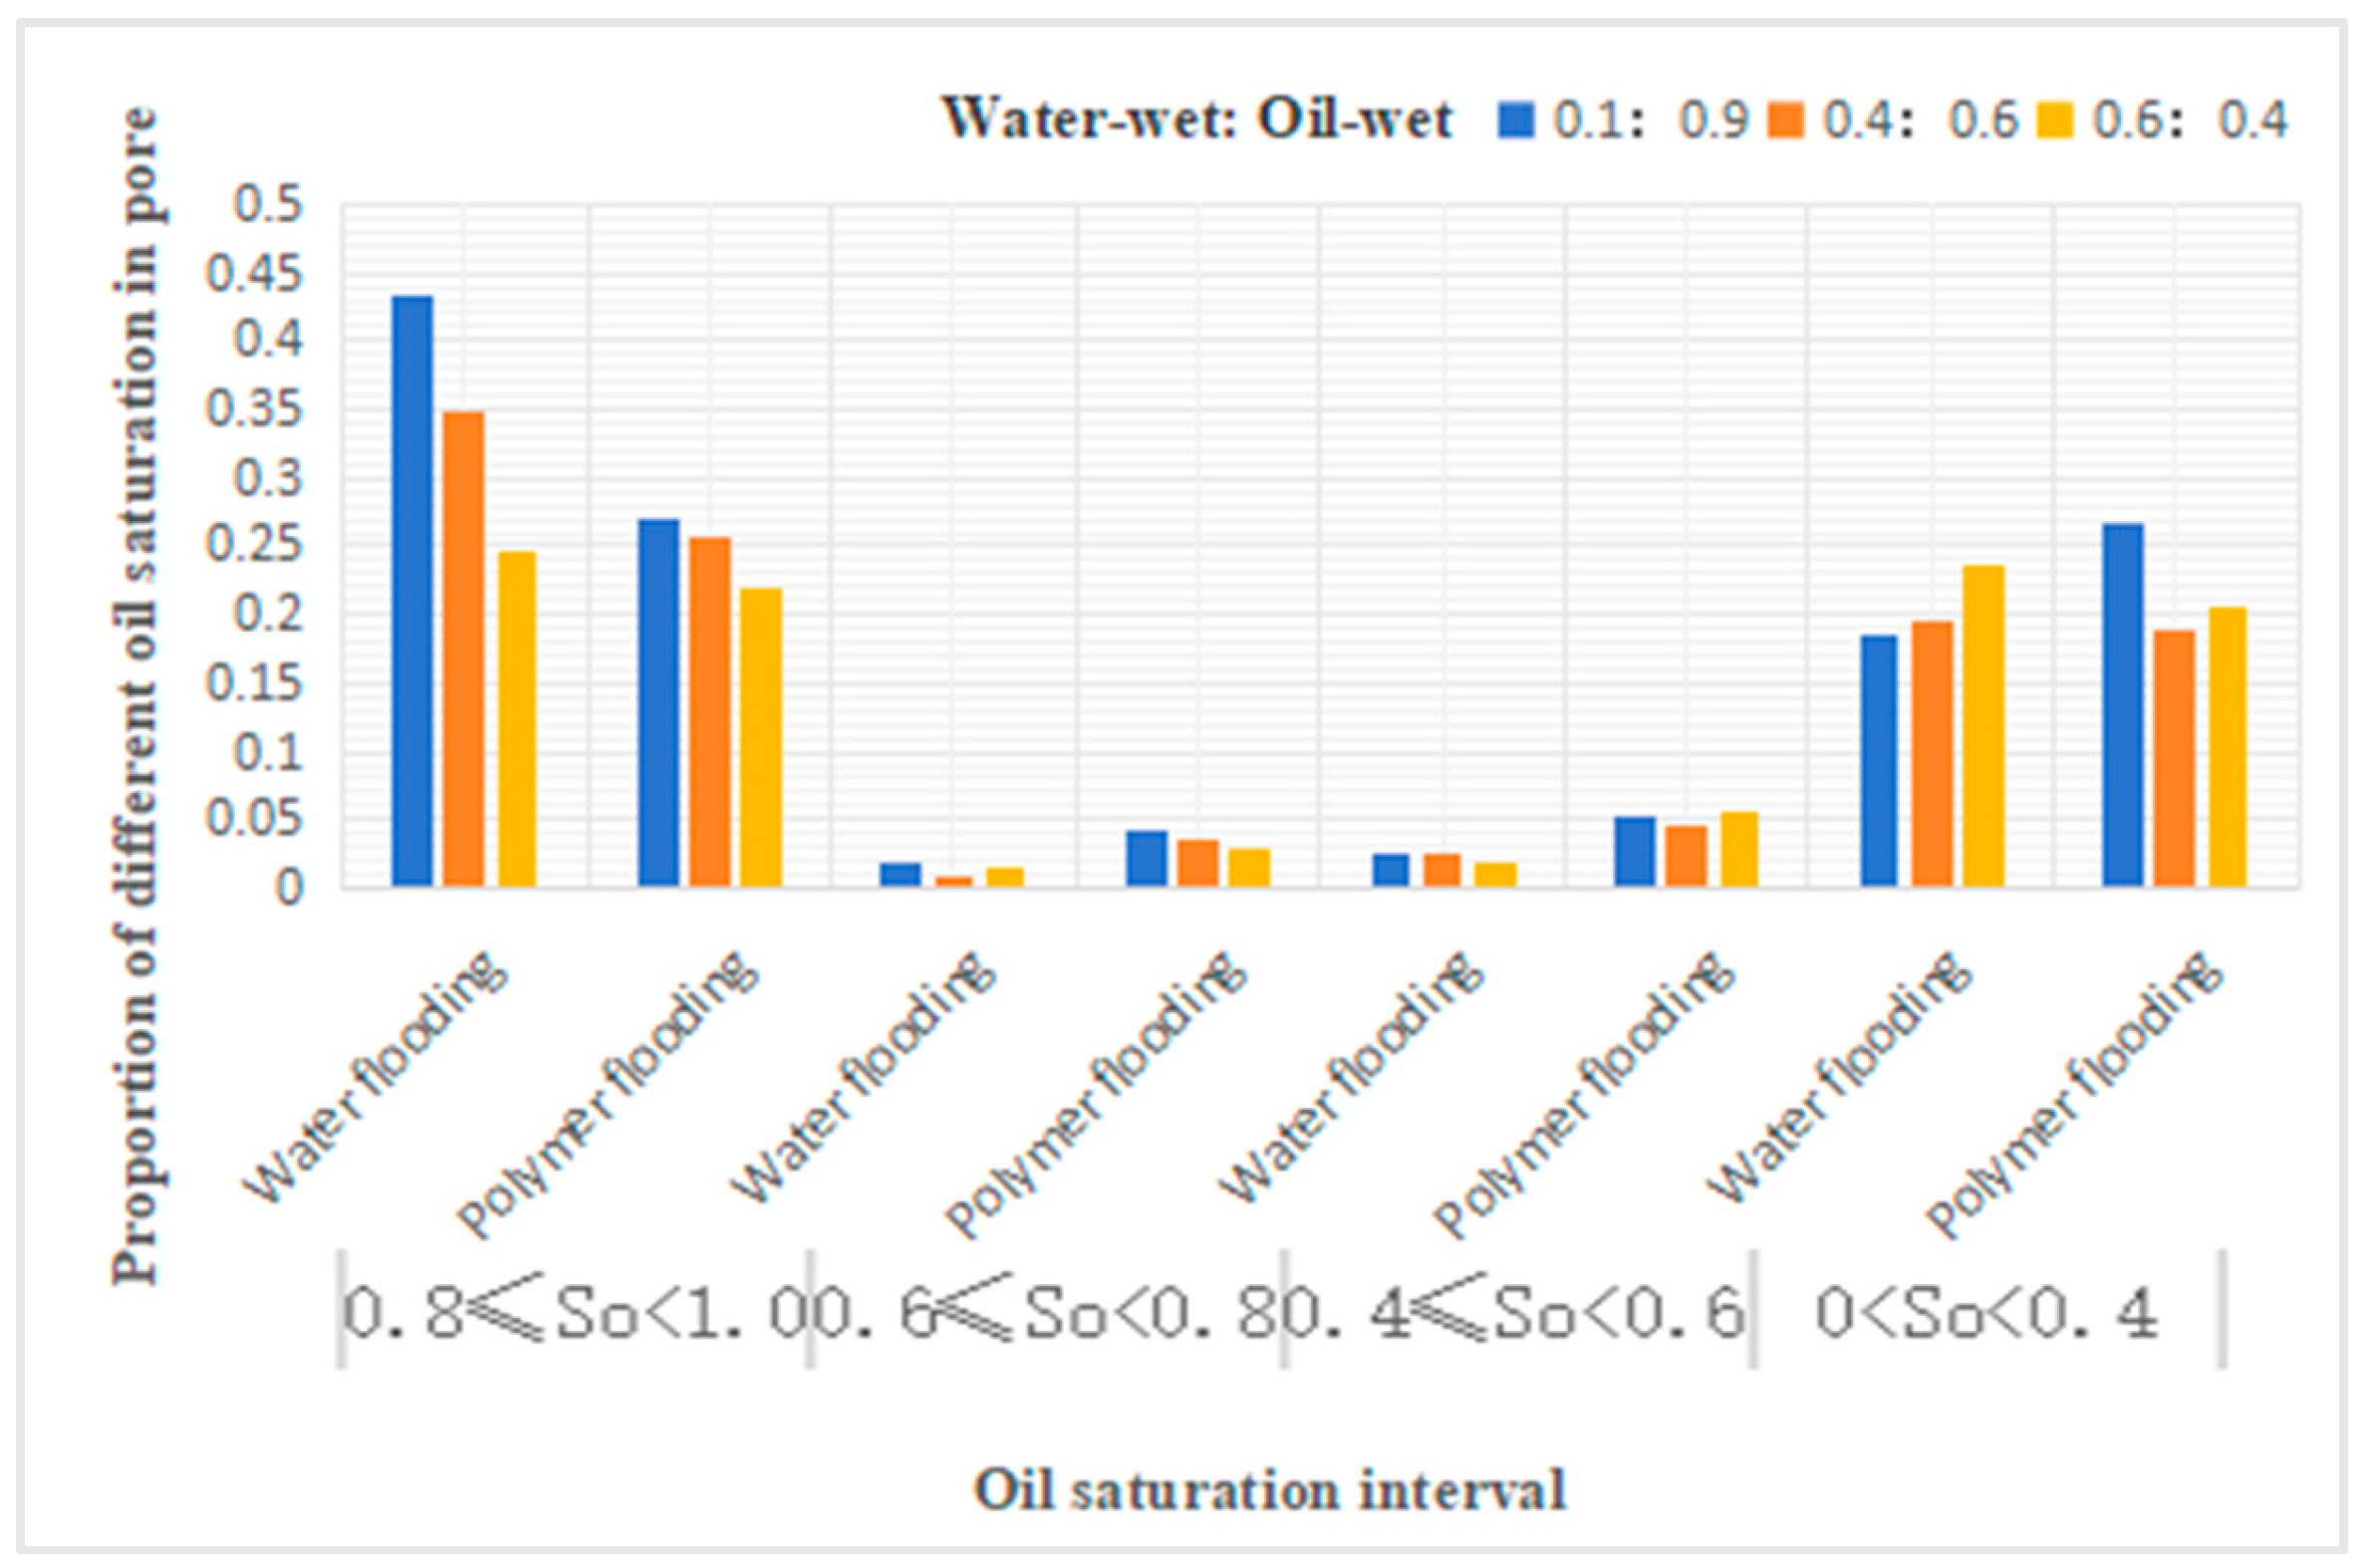
Figure 25.
Proportion of different oil saturation in pore.
Figure 25.
Proportion of different oil saturation in pore.
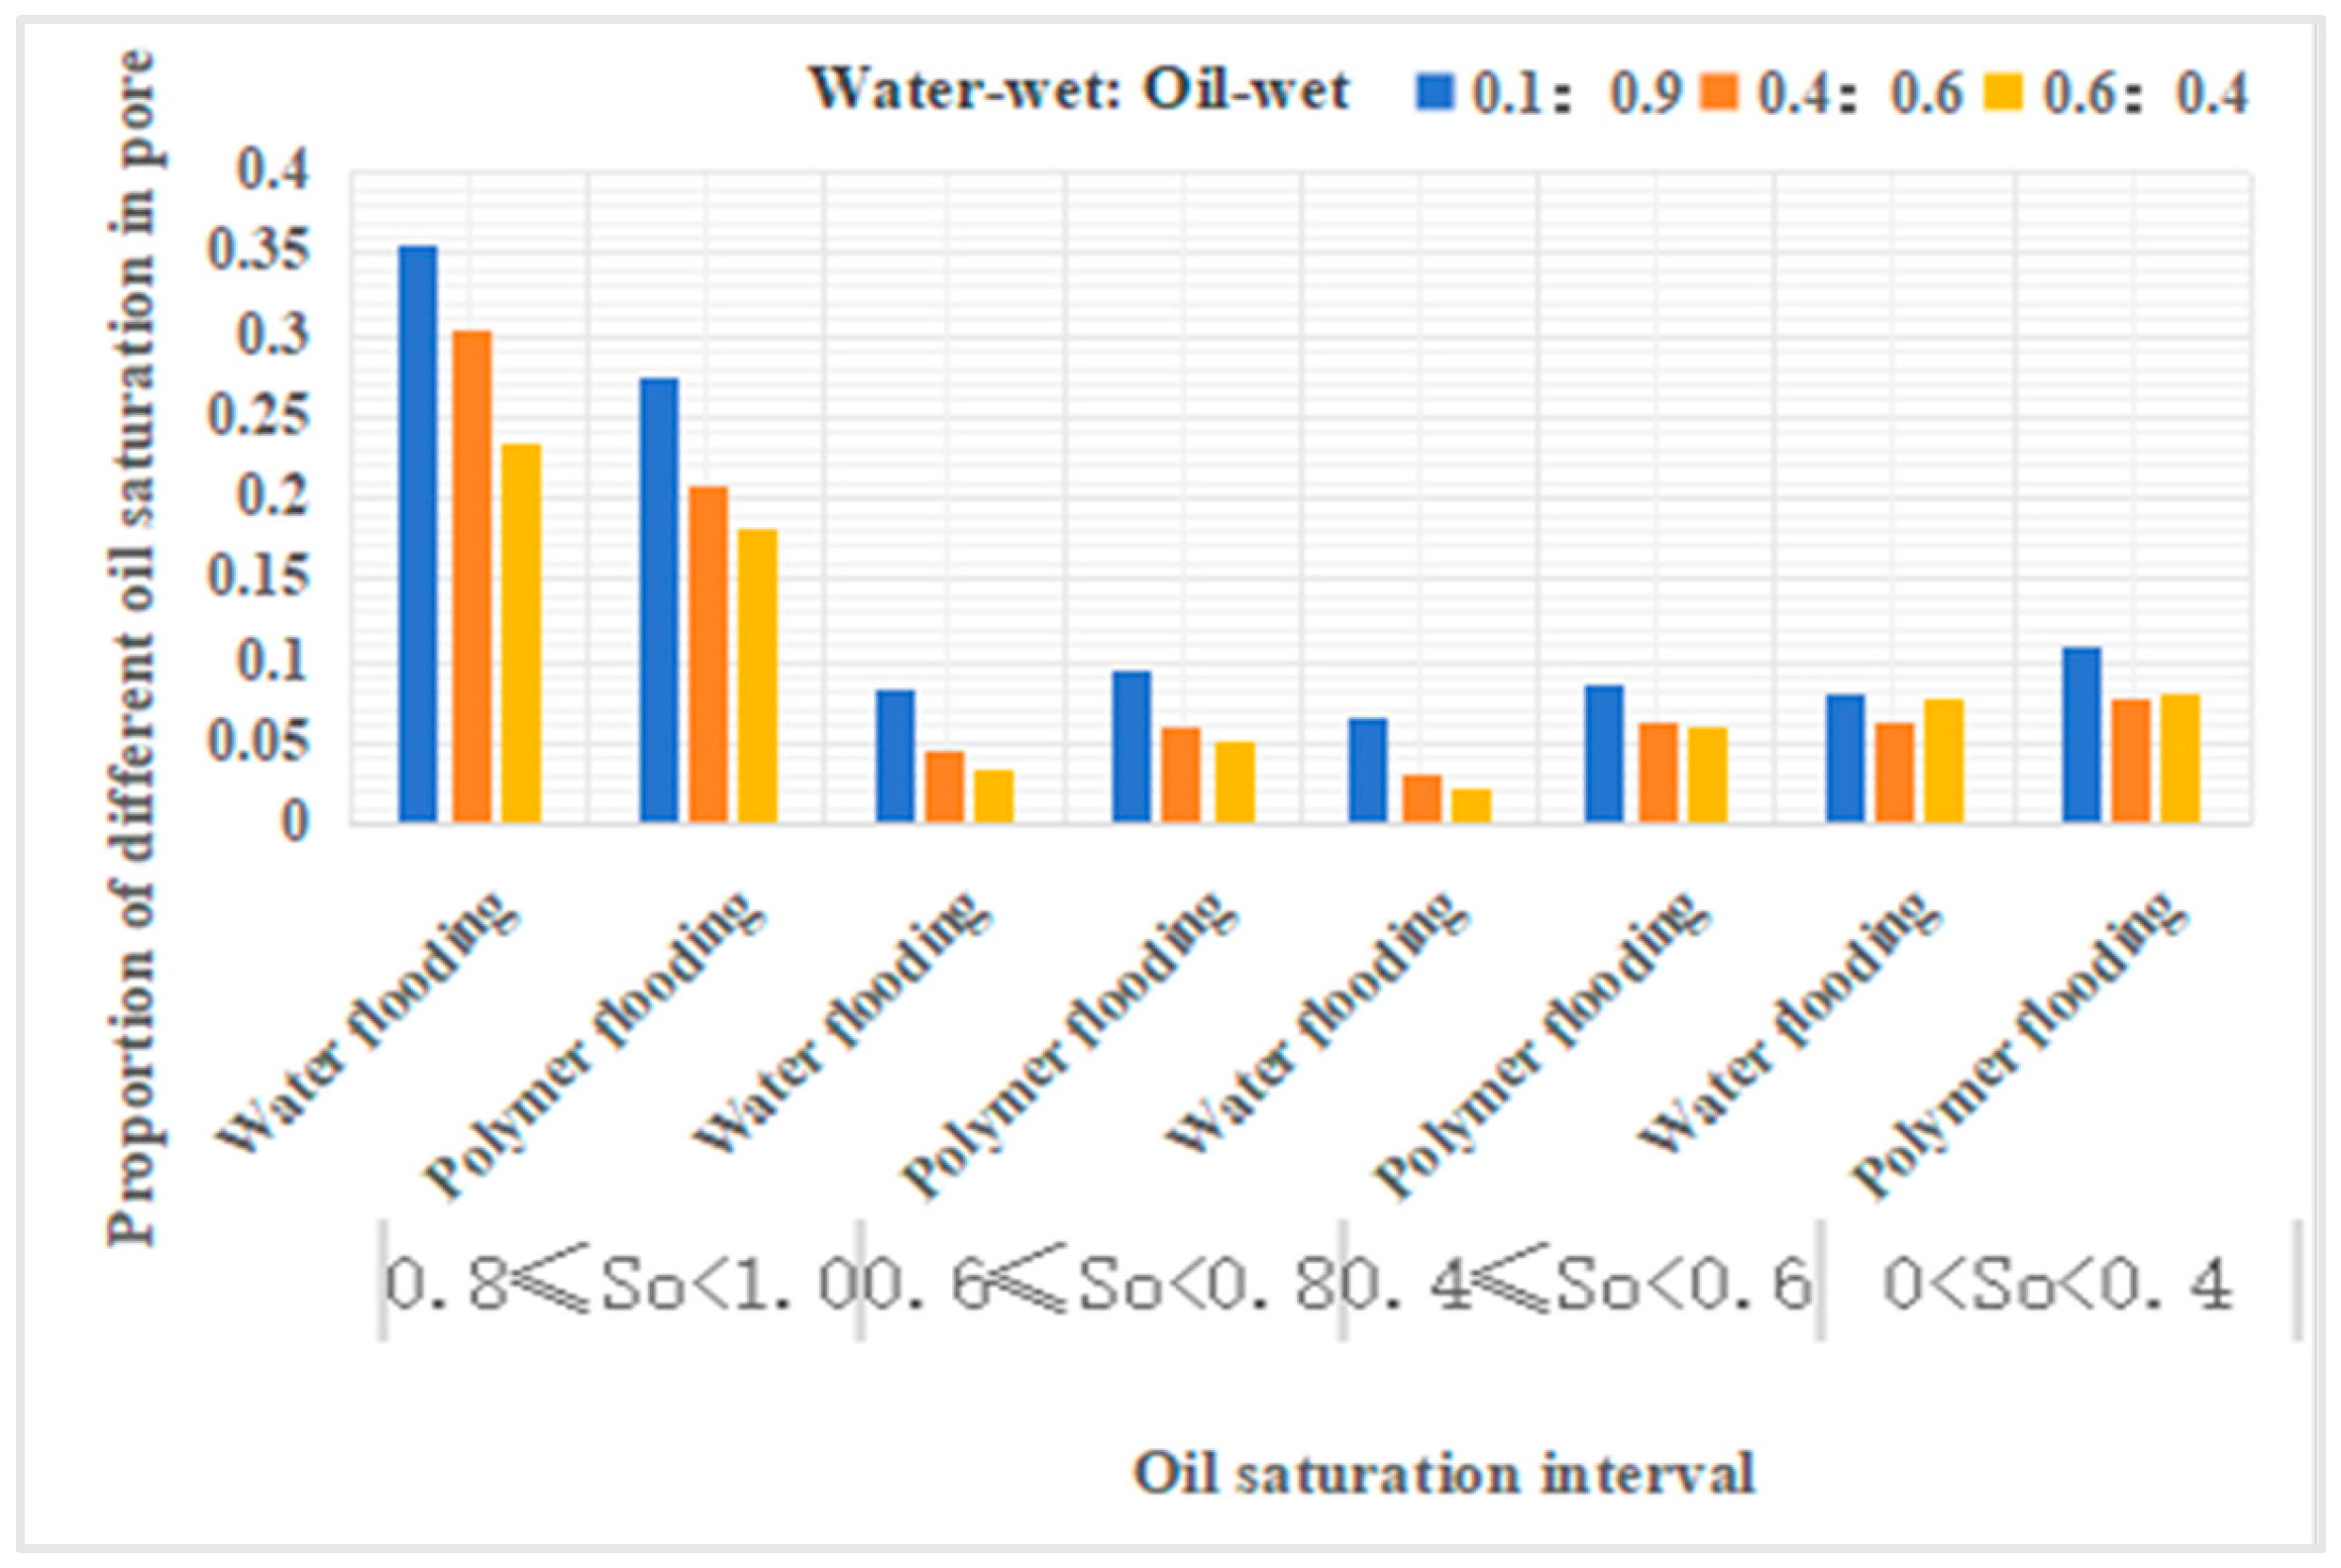
Figure 26.
Proportion of different oil saturation in pore.
Figure 26.
Proportion of different oil saturation in pore.
From
Table 19, it can be observed that compared to water flooding, polymer flooding results in varying degrees of reduction in throat channels with oil saturation in the range of 0.8 to 1, while other throat channels show varying degrees of increase. Specifically, for throat channels with oil saturation in the range of 0.6-0.8, the increase in oil-wetness ratios of 0.1:0.9, 0.4:0.6, and 0.6:0.4 is 8%, 17%, and 48%, respectively. For throat channels with oil saturation in the range of 0.4-0.6, the increase in oil-wetness ratios of 0.1:0.9, 0.4:0.6, and 0.6:0.4 is 20%, 106%, and 174%, respectively. For throat channels with oil saturation in the range of 0-0.4, the increase in oil-wetness ratios of 0.1:0.9, 0.4:0.6, and 0.6:0.4 is 26%, 128%, and 81%, respectively.
From
Table 20, it can be observed that compared to water flooding, polymer flooding results in varying degrees of reduction in pores with oil saturation in the range of 0.8 to 1, while other pore types, except for pores with oil saturation in the range of 0-0.4, show varying degrees of increase. Specifically, for pores with oil saturation in the range of 0.6-0.8, the increase in oil-wetness ratios of 0.1:0.9, 0.4:0.6, and 0.6:0.4 is 105%, 338%, and 107%, respectively. For pores with oil saturation in the range of 0.4-0.6, the increase in oil-wetness ratios of 0.1:0.9, 0.4:0.6, and 0.6:0.4 is 112%, 88%, and 217%, respectively. For pores with oil saturation in the range of 0-0.4, the increase in oil-wetness ratio of 0.1:0.9 is 45%, while the decrease in oil-wetness ratios of 0.4:0.6 and 0.6:0.4 is 4% and 14%, respectively.
From
Table 21, it can be observed that compared to water flooding, polymer flooding results in varying degrees of reduction in throat channels with oil saturation in the range of 0.8 to 1, while other throat channels show varying degrees of increase. Specifically, for throat channels with oil saturation in the range of 0.6-0.8, the increase in oil-wetness ratios of 0.1:0.9, 0.4:0.6, and 0.6:0.4 is 14%, 33%, and 53%, respectively. For throat channels with oil saturation in the range of 0.4-0.6, the increase in oil-wetness ratios of 0.1:0.9, 0.4:0.6, and 0.6:0.4 is 29%, 103%, and 190%, respectively. For throat channels with oil saturation in the range of 0-0.4, the increase in oil-wetness ratios of 0.1:0.9, 0.4:0.6, and 0.6:0.4 is 38%, 26%, and 5%, respectively.。
5.3. Research on Remaining Oil Types and Quantities
After simulating polymer flooding in the model, cross-sectional images of remaining oil distribution were captured and rendered for three different wettability ratio models, as shown in
Figure 27. Additionally, the types of remaining oil and their corresponding saturation values in these three different wettability ratio models were calculated, as presented in
Table 22.
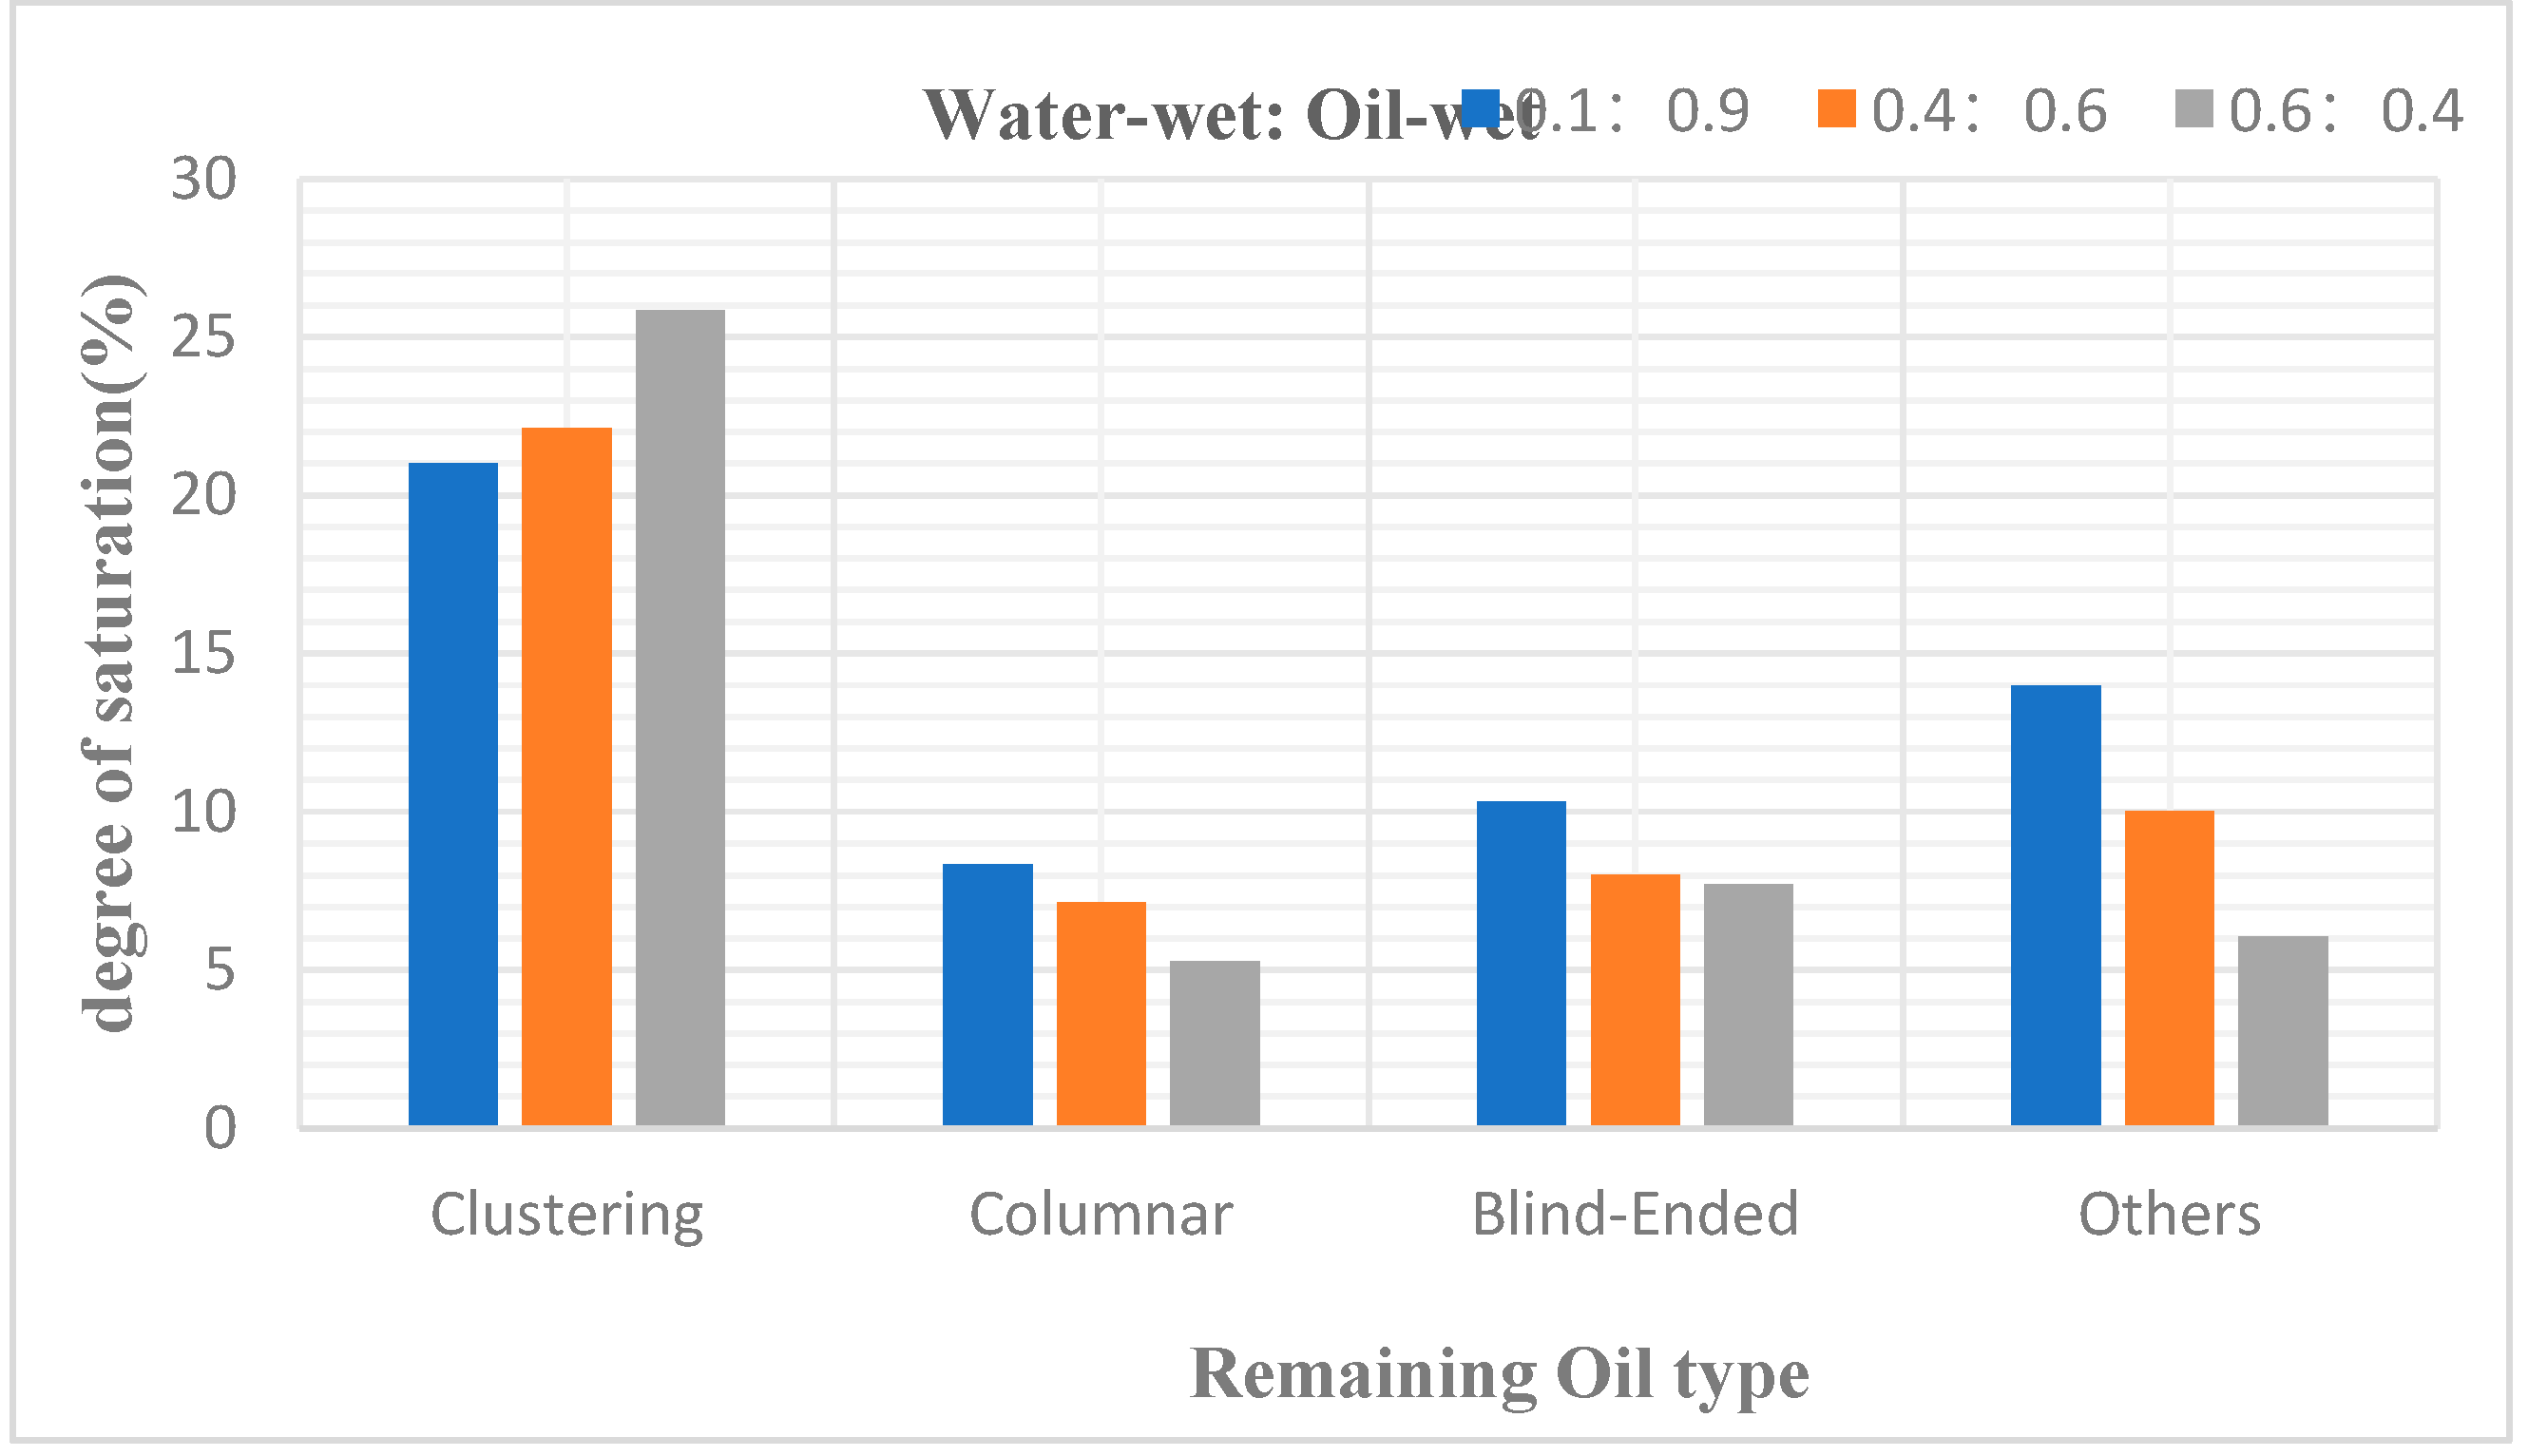
The simulation results reveal that, as shown in
Figure 4.35, oil-wet models tend to form film-like oil more easily, which is attributed to the adsorption effect of oil-wet inner walls on remaining oil.
As wettability transitions from oil-wet to water-wet, the types of remaining oil gradually shift from the harder-to-displace columnar and film-like to the more easily recoverable cluster-like. Regardless of whether it is under water-wet or oil-wet conditions, the predominant type of remaining oil in the pores is cluster-like. However, under neutral wettability conditions, there is an anomalous distribution of remaining oil types, with a higher proportion of droplet-like remaining oil. As wettability transitions from water-wet to oil-wet, the overall trend indicates an increase in cluster-like and film-like remaining oil, a decrease in droplet-like and throat-like remaining oil, while the dead-end-like remaining oil remains stable. This suggests that wettability does not affect the presence of dead-end-like remaining oil.
In the composite displacement system under different radii, the difference in oil displacement efficiency is smaller under water-wet conditions than under oil-wet conditions. This is because under water-wet conditions, although smaller throat radii result in greater driving force for oil displacement, they also increase the likelihood of trapping, leading to a higher probability of forming remaining oil due to the trapping phenomenon. However, under oil-wet conditions, it is different. Larger throat radii result in lower resistance to oil displacement, and the probability of trapping decreases as well. With both factors working simultaneously, the difference in oil displacement efficiency between different radii is greater under oil-wet conditions than under water-wet conditions.
6. Summary
This study examines the influence of pore size, coordination number, throat ratio, and wettability on the micro-scale remaining oil recovery after polymer flooding, providing theoretical support for the exploitation of micro-scale remaining oil. The research findings are as follows:
1. As the distribution of pore size changes, there is a reduction in cluster-like remaining oil while columnar remaining oil increases, and other types of remaining oil exhibit random fluctuations. The increase in permeability due to changes in throat radius makes it easier for aggregated large cluster-like remaining oil to be displaced into a more dispersed form.
2. With an increase in coordination number, the average number of connected throats per pore increases, leading to increased core permeability, making it easier to displace oil within the pores. The data in the table shows varying degrees of reduction in the dominant cluster-like and columnar remaining oil, while the saturation data for other less abundant remaining oil types exhibit random variations.
3. An increase in cluster-like remaining oil corresponds to a decrease in columnar remaining oil. The increased presence of circular components at the throat interfaces significantly reduces the resistance within core throats, increasing core permeability and making it less likely for remaining oil to be trapped within the throat spaces.
4. The effect of increasing throat ratio is opposite to that of coordination number. With a constant pore radius, an increase in throat ratio results in a decrease in throat radius, leading to a decrease in core permeability. Meanwhile, the increased throat resistance causes more remaining oil to be trapped within the throat channels, resulting in a significant increase in columnar remaining oil.
5. As wettability transitions from oil-wet to water-wet, the types of remaining oil gradually shift from harder-to-displace types to more easily recoverable cluster-like forms. Regardless of water-wet or oil-wet conditions, the predominant type of remaining oil within the pores is cluster-like. However, under neutral wettability conditions, there is an anomalous distribution of remaining oil types, with a higher proportion of droplet-like remaining oil. As wettability transitions from water-wet to oil-wet, the overall trend indicates an increase in cluster-like and film-like remaining oil, a decrease in droplet-like and throat-like remaining oil, while the dead-end-like remaining oil remains stable, indicating that wettability does not affect the presence of dead-end-like remaining oil.
6. In the polymer flooding system under different radii, the difference in oil displacement efficiency is smaller under water-wet conditions than under oil-wet conditions. This is because under water-wet conditions, although smaller throat radii result in greater driving force for oil displacement, they also increase the likelihood of trapping, leading to a higher probability of forming remaining oil due to the trapping phenomenon. However, under oil-wet conditions, it is different. Larger throat radii result in lower resistance to oil displacement, and the probability of trapping decreases as well. With both factors working simultaneously, the difference in oil displacement efficiency between different radii is greater under oil-wet conditions than under water-wet conditions.
References
- LAWAL K A,VESOVIC V.Modelling multiple-contact condensation of heat-transporting fluids in thermal floods [C]//SPE EUROPEC/EAGE Annual Conference and Exhibition.Richardson,Texas,USA:OnePetro,2010:SPE-130568-MS.
- HE Hui, SONG Xinmin,JIANG Youwei, et al. Heterogeneity of sandy conglomerate reservoir and its influence on remaining oil distribution:A case study from Badaowan Formation in the mid-west of blockⅡin Karamay Oilfield[J]. Lithologic Resevoirs,2012,24(2) 17-123. [CrossRef]
- SANDOVAL M M I,MARTINEZ J H J,MUNOZ N S F,et al. Experimental investigation of EOR mechanisms for cyclic steam injection assisted by flue gas[J].Geoenergy Science and Engineering,2023,221:211354. [CrossRef]
- THIVY K ,KHEANG S L ,FARHANA N J , et al. Synthesis of biodiesel from residual oil extracted from spent bleaching earth using spent bleaching earth-supported catalyst[J].Chemical Engineering Research and Design,2023,200716-728. [CrossRef]
- NIYTZBON J,GADYLYAEV D,SCHLUTER S,et al. Brief communication: Unravelling the composition and microstructure of a permafrost core using X-ray computed tomography[J].The Cryosphere,2022,16(9):3507-3515. [CrossRef]
- HU Qinhong,ZHANG Yuxiang,MENG Xianghao, et al. Characterization of micronano pore neworkeds in shale oil reservoirs of Paleogene Shahejie Formation Dongying Sag of Bohai Bay Basin, East China[J]. Petroleum Exploration and Development.2017,44(5) 681-690. [CrossRef]
- AFOLABI F ,MAHMOOD M S ,MARIO L , et al.A multi-mechanistic approach to the oil recovery study of a family of amphiphilic polysaccharides[J].Petroleum Research,2024,9(2):238-249. [CrossRef]
- ]WANG Yong, JlANG Hanqiao, GUO chen et al.Microfluidics experimental investigation of water channeling control strategy after degassing in fractured carbonate reservois[J]China Offshore Oil and Gas.2023,35(1):78-88. [CrossRef]
- JIANG Lingzhi,GU Jiayu,GUO Bincheng.Characterization and formation mechanism of clastic low-permeability reservoirs in oil- and gas-bearing basins of China[J].Journal of Sedimentation,2004,22(1):13-18.
- WEBB D N ,GRIGSBY P N ,FRAILEY M S .Origin, distribution, and CO2 EOR and CO2 storage resource assessment of selected residual oil zone fairways in the Illinois Basin[J].Geoenergy Science and Engineering,2024,239212893-. [CrossRef]
Figure 1.
Throat distribution frequency curve and cumulative distribution curve of different schemes.
Figure 1.
Throat distribution frequency curve and cumulative distribution curve of different schemes.
Figure 2.
Model of different throat distribution frequency.
Figure 2.
Model of different throat distribution frequency.
Figure 6.
Influence of different throat radius distribution on Remaining Oil distribution.
Figure 6.
Influence of different throat radius distribution on Remaining Oil distribution.
Figure 7.
Influence of different throat radius distribution on Remaining Oil type.
Figure 7.
Influence of different throat radius distribution on Remaining Oil type.
Figure 8.
Models of different coordination numbers.
Figure 8.
Models of different coordination numbers.
Figure 15.
Models of different pore throat ratios.
Figure 15.
Models of different pore throat ratios.
Figure 20.
Influence of different pore-throat ratio on Remaining Oil distribution.
Figure 20.
Influence of different pore-throat ratio on Remaining Oil distribution.
Figure 21.
Effects of different pore-throat ratios on Remaining Oil types.
Figure 21.
Effects of different pore-throat ratios on Remaining Oil types.
Figure 22.
Models with different wetting ratios.
Figure 22.
Models with different wetting ratios.
Figure 27.
Influence of different wettability on Remaining Oil distribution.
Figure 27.
Influence of different wettability on Remaining Oil distribution.
Figure 28.
Influence of different wettability on Remaining Oil type.
Figure 28.
Influence of different wettability on Remaining Oil type.
Table 1.
Effect of throat radius on polymer flooding recovery.
Table 1.
Effect of throat radius on polymer flooding recovery.
| scheme |
1 |
2 |
3 |
Core ID
Porosity (%) |
#1
25.6 |
#3
31.77 |
#4
27.25 |
| Permeability (10−3 µm2) |
370 |
430 |
568 |
| Water flood Recovery Ratio(%) |
47.07 |
49.12 |
46.22 |
| Polymer flood Recovery Ratio(%) |
24.65 |
22.76 |
25.58 |
| Total Recovery Ratio(%) |
71.71 |
71.88 |
71.76 |
Table 2.
Proportion of oil in pore after water drive and polymer flooding.
Table 2.
Proportion of oil in pore after water drive and polymer flooding.
| Pore Distribution Scheme |
Scheme 1 |
Scheme 2 |
Scheme 3 |
| Total Throat Count |
Total Throat Count |
993 |
993 |
993 |
| Total Pore Count |
512 |
512 |
512 |
| After Water flooding |
Number of Oil-bearing Throats |
510 |
480 |
508 |
| Number of Oil-bearing Pores |
280 |
273 |
284 |
| Total Number of Oil-bearing Entities |
790 |
753 |
792 |
| Oil Saturation in Pores |
0.52 |
0.50 |
0.53 |
| After Polymer flooding |
Number of Oil-bearing Throats |
486 |
472 |
496 |
| Number of Oil-bearing Pore |
275 |
261 |
283 |
| Total Number of Oil-bearing Entities |
761 |
733 |
779 |
| Oil Saturation in Pores |
0.51 |
0.49 |
0.52 |
Table 3.
Proportion of different oil saturation in throat.
Table 3.
Proportion of different oil saturation in throat.
| Oil Saturation |
0.8≤So<1 |
0.6≤So<0.8 |
0.4≤So<0.6 |
0<So<0.4 |
0 |
| Ratio Scheme |
Water flooding |
Polymer Flooding |
Water flooding |
Polymer Flooding |
Water flooding |
Polymer Flooding |
Water flooding |
Polymer Flooding |
Water flooding |
Polymer Flooding |
|
Scheme 1
|
0.152 |
0.110 |
0.035 |
0.027 |
0.021 |
0.020 |
0.124 |
0.159 |
0.668 |
0.684 |
|
Scheme 2
|
0.228 |
0.168 |
0.040 |
0.059 |
0.023 |
0.042 |
0.021 |
0.038 |
0.688 |
0.693 |
|
Scheme 3
|
0.165 |
0.159 |
0.051 |
0.029 |
0.062 |
0.054 |
0.039 |
0.081 |
0.669 |
0.677 |
Table 4.
Proportion of different oil saturation in pore.
Table 4.
Proportion of different oil saturation in pore.
| Oil Saturation |
0.8≤So<1 |
0.6≤So<0.8 |
0.4≤So<0.6 |
0<So<0.4 |
0 |
| Ratio Scheme |
Waterflooding |
Polymer Flooding |
Waterflooding |
Polymer Flooding |
Waterflooding |
Polymer Flooding |
Waterflooding |
Polymer Flooding |
Waterflooding |
Polymer Flooding |
|
Scheme 1
|
0.404 |
0.326 |
0.006 |
0.020 |
0.014 |
0.018 |
0.123 |
0.174 |
0.453 |
0.463 |
|
Scheme 2
|
0.348 |
0.271 |
0.014 |
0.029 |
0.018 |
0.043 |
0.154 |
0.166 |
0.467 |
0.490 |
|
Scheme 3
|
0.336 |
0.303 |
0.016 |
0.016 |
0.025 |
0.037 |
0.180 |
0.197 |
0.445 |
0.447 |
Table 5.
Influence of different throat radius distribution on Remaining Oil type.
Table 5.
Influence of different throat radius distribution on Remaining Oil type.
| Type |
Saturation(%) |
| Scheme 1 |
Scheme 2 |
Scheme 3 |
| Clustering |
42.52 |
37.29 |
32.05 |
| Columnar |
1.99 |
7.88 |
14.04 |
| Blind-Ended |
5.67 |
0.56 |
0.01 |
| Others |
0.03 |
1.43 |
1.49 |
Table 6.
Effect of coordination number on recovery efficiency.
Table 6.
Effect of coordination number on recovery efficiency.
| coordination number |
4.3 |
5.4 |
6.0 |
| Porosity(%) |
25.59 |
25.86 |
25.52 |
| Permeability (10−3 µm2) |
243.62 |
375.36 |
483.59 |
| Water flood Recovery Ratio(%) |
31.35 |
39.99 |
44.98 |
| Polymer Flood Recovery Ratio(%) |
24.57 |
27.13 |
30.44 |
| Total Recovery Ratio(%) |
55.92 |
67.12 |
75.42 |
Table 8.
Proportion of different oil saturation in throat.
Table 8.
Proportion of different oil saturation in throat.
| Oil Saturation |
0.8≤So<1 |
0.6≤So<0.8 |
0.4≤So<0.6 |
0<So<0.4 |
0 |
Ratio
Coordination Number |
Water
flooding |
Polymer Flooding |
Water
flooding |
Polymer Flooding |
Water
flooding |
Polymer Flooding |
Water
flooding |
Polymer Flooding Polymer Flooding |
Water
flooding |
Polymer Flooding |
| 4.3 |
0.253 |
0.159 |
0.034 |
0.029 |
0.030 |
0.061 |
0.035 |
0.090 |
0.648 |
0.662 |
| 5.4 |
0.228 |
0.168 |
0.040 |
0.059 |
0.023 |
0.042 |
0.021 |
0.038 |
0.688 |
0.693 |
| 6.0 |
0.201 |
0.199 |
0.042 |
0.048 |
0.029 |
0.029 |
0.033 |
0.020 |
0.695 |
0.704 |
Table 9.
Proportion of different oil saturation in pore.
Table 9.
Proportion of different oil saturation in pore.
| Oil Saturation |
0.8≤So<1 |
0.6≤So<0.8 |
0.4≤So<0.6 |
0<So<0.4 |
0 |
Ratio
Coordination Number |
Water
flooding |
Polymer Flooding |
Water
flooding |
Polymer Flooding |
Water
flooding |
Polymer Flooding |
Water
flooding |
Polymer Flooding |
Water
flooding |
Polymer Flooding |
| 4.3 |
0.508 |
0.375 |
0.004 |
0.014 |
0.006 |
0.021 |
0.066 |
0.121 |
0.416 |
0.469 |
| 5.4 |
0.381 |
0.314 |
0.020 |
0.033 |
0.020 |
0.037 |
0.150 |
0.127 |
0.430 |
0.488 |
| 6.0 |
0.348 |
0.271 |
0.014 |
0.029 |
0.018 |
0.043 |
0.154 |
0.146 |
0.467 |
0.510 |
Table 10.
Proportion of different oil saturation in pore.
Table 10.
Proportion of different oil saturation in pore.
Ratio
Coordination Number |
0.8≤So<1 |
0.6≤So<0.8 |
0.4≤So<0.6 |
0<So<0.4 |
0 |
Ratio
Coordination Number |
Waterflooding |
Polymer Flooding |
Waterflooding |
Polymer Flooding |
Waterflooding |
Polymer Flooding |
Waterflooding |
Polymer Flooding |
Waterflooding |
Polymer Flooding |
| 4.3 |
0.317 |
0.213 |
0.026 |
0.025 |
0.024 |
0.051 |
0.043 |
0.098 |
0.590 |
0.614 |
| 5.4 |
0.266 |
0.205 |
0.035 |
0.053 |
0.022 |
0.041 |
0.054 |
0.060 |
0.623 |
0.642 |
| 6.0 |
0.238 |
0.217 |
0.035 |
0.043 |
0.026 |
0.032 |
0.063 |
0.052 |
0.638 |
0.655 |
Table 11.
The influence of different coordination number on the type of Remaining Oil.
Table 11.
The influence of different coordination number on the type of Remaining Oil.
| Type |
Saturation(%) |
| Coordination Number 4.3 |
Coordination Number 5.4 |
Coordination Number 6.0 |
| Clustering |
47.79 |
42.41 |
39.55 |
| Columnar |
10.84 |
7.89 |
4.21 |
| Blind-Ended |
0.61 |
0.01 |
0.15 |
| Other |
0.01 |
0.01 |
0.03 |
Table 12.
Effect of pore throat ratio on recovery efficiency.
Table 12.
Effect of pore throat ratio on recovery efficiency.
| Pore-Throat Ratio |
3.2 |
4.6 |
6.3 |
| Porosity(%) |
25.47 |
25.86 |
25.66 |
| Permeability (10−3 µm2) |
954.43 |
544.12 |
329.05 |
| Water flood Recovery Ratio(%) |
49.32 |
47.07 |
43.29 |
| Polymer flood Recovery Ratio(%) |
25.02 |
24.65 |
20.43 |
| Total Recovery Ratio(%) |
74.34 |
71.72 |
63.72 |
Table 13.
Proportion of oil in pore after water drive and polymer flooding.
Table 13.
Proportion of oil in pore after water drive and polymer flooding.
| Pore-Throat Ratio |
3.2 |
4.6 |
6.3 |
Total
Throat Count |
Total Throat Count |
993 |
993 |
993 |
| Total Pore Count |
512 |
512 |
512 |
| After Water flooding |
Number of Oil-bearing Throats |
482 |
494 |
518 |
| Number of Oil-bearing Pores |
271 |
284 |
290 |
| Total Number of Oil-bearing Entities |
753 |
778 |
808 |
| Oil Saturation in Throats |
0.50 |
0.52 |
0.54 |
| After Polymer flooding |
Number of Oil-bearing Throats |
465 |
501 |
526 |
| Number of Oil-bearing Pores |
222 |
243 |
282 |
| Total Number of Oil-bearing Entities |
687 |
742 |
808 |
| Oil Saturation in Throats |
0.46 |
0.49 |
0.54 |
Table 14.
Proportion of different oil saturation in throat.
Table 14.
Proportion of different oil saturation in throat.
| Oil Saturation |
0.8≤So<1 |
0.6≤So<0.8 |
0.4≤So<0.6 |
0<So<0.4 |
0 |
| Ratio of Pore-Throat Ratio |
Water flooding |
Polymer Flooding |
Water flooding |
Polymer Flooding |
Water flooding |
Polymer Flooding |
Water flooding |
Polymer Flooding |
Water flooding |
Polymer Flooding |
| 3.2 |
0.255 |
0.203 |
0.031 |
0.035 |
0.019 |
0.041 |
0.010 |
0.024 |
0.686 |
0.697 |
| 4.6 |
0.271 |
0.207 |
0.025 |
0.051 |
0.015 |
0.032 |
0.010 |
0.036 |
0.678 |
0.674 |
| 6.3 |
0.216 |
0.179 |
0.052 |
0.060 |
0.044 |
0.055 |
0.025 |
0.049 |
0.663 |
0.658 |
Table 15.
Proportion of different oil saturation in pore.
Table 15.
Proportion of different oil saturation in pore.
| Oil Saturation |
0.8≤So<1 |
0.6≤So<0.8 |
0.4≤So<0.6 |
0<So<0.4 |
0 |
| Ratio of Pore-Throat Ratio |
Water flooding |
Polymer Flooding |
Water flooding |
Polymer Flooding |
Water flooding |
Polymer Flooding |
Water flooding |
Polymer Flooding |
Water flooding |
Polymer Flooding |
| 3.2 |
0.438 |
0.277 |
0.002 |
0.027 |
0.008 |
0.025 |
0.082 |
0.104 |
0.471 |
0.566 |
| 4.6 |
0.350 |
0.256 |
0.018 |
0.027 |
0.018 |
0.039 |
0.170 |
0.152 |
0.445 |
0.525 |
| 6.3 |
0.330 |
0.262 |
0.010 |
0.037 |
0.020 |
0.047 |
0.207 |
0.205 |
0.434 |
0.449 |
Table 16.
Proportion of different oil saturation in pore.
Table 16.
Proportion of different oil saturation in pore.
| Oil Saturation |
0.8≤So<1 |
0.6≤So<0.8 |
0.4≤So<0.6 |
0<So<0.4 |
0 |
| Ratio of Pore-Throat Ratio |
Water flooding |
Polymer Flooding |
Water flooding |
Polymer Flooding |
Water flooding |
Polymer Flooding |
Water flooding |
Polymer Flooding |
Water flooding |
Polymer Flooding |
| 3.2 |
0.300 |
0.222 |
0.023 |
0.033 |
0.016 |
0.037 |
0.028 |
0.044 |
0.632 |
0.665 |
| 4.6 |
0.291 |
0.219 |
0.023 |
0.045 |
0.016 |
0.034 |
0.050 |
0.065 |
0.620 |
0.637 |
| 6.3 |
0.245 |
0.200 |
0.042 |
0.054 |
0.038 |
0.053 |
0.071 |
0.088 |
0.605 |
0.605 |
Table 17.
Effects of different pore-throat ratios on Remaining Oil types.
Table 17.
Effects of different pore-throat ratios on Remaining Oil types.
| Type |
Saturation(%) |
| Pore-Throat Ratio 3.2 |
Pore-Throat Ratio 4.6 |
Pore-Throat Ratio 6.3 |
| Clustering |
27.01 |
23.67 |
19.92 |
| Columnar |
14.89 |
20.99 |
27.19 |
| Blind-Ended |
2.68 |
2.57 |
2.95 |
| Other |
1.53 |
1.21 |
1.55 |
Table 17.
Effect of wettability on recovery efficiency.
Table 17.
Effect of wettability on recovery efficiency.
| Water-wet: Oil-wet |
0.1:0.9 |
0.4:0.6 |
0.6:0.4 |
| Porosity(%) |
25.47 |
25.47 |
25.47 |
| Water flood Recovery Ratio(%) |
35.63 |
47.07 |
51.35 |
| Polymer flood Recovery Ratio(%) |
27.91 |
26.46 |
24.65 |
| Total Recovery Ratio(%) |
63.54 |
73.53 |
76 |
Table 18.
Proportion of oil in pore.
Table 18.
Proportion of oil in pore.
| Water-wet: Oil-wet |
0.1:0.9 |
0.4:0.6 |
0.6:0.4 |
| Total Throat Count |
Total Throat Count |
993 |
993 |
993 |
| Total Pore Count |
512 |
512 |
512 |
| After Water flooding |
Number of Oil-bearing Throats |
864 |
611 |
480 |
| Number of Oil-bearing Pores |
339 |
295 |
265 |
| Total Number of Oil-bearing Entities |
1203 |
906 |
745 |
| Oil Saturation in Throats |
0.80 |
0.60 |
0.50 |
| After Polymer Flooding |
Number of Oil-bearing Throats |
832 |
571 |
472 |
| Number of Oil-bearing Pores |
323 |
269 |
261 |
| Total Number of Oil-bearing Entities |
1155 |
840 |
733 |
| Oil Saturation in Throats |
0.77 |
0.56 |
0.49 |
Table 19.
Proportion of different oil saturation in throat.
Table 19.
Proportion of different oil saturation in throat.
| Oil Saturation |
0.8≤So<1 |
0.6≤So<0.8 |
0.4≤So<0.6 |
0<So<0.4 |
0 |
Ratio
Water-wet: Oil-wet |
Water flooding |
Polymer Flooding |
Water flooding |
Polymer Flooding |
Water flooding |
Polymer Flooding |
Water flooding |
Polymer Flooding |
Water flooding |
Polymer Flooding |
| 0.1:0.9 |
0.332 |
0.275 |
0.105 |
0.113 |
0.080 |
0.096 |
0.046 |
0.058 |
0.438 |
0.602 |
| 0.4:0.6 |
0.290 |
0.194 |
0.058 |
0.068 |
0.033 |
0.068 |
0.018 |
0.041 |
0.602 |
0.676 |
| 0.6:0.4 |
0.228 |
0.168 |
0.040 |
0.059 |
0.023 |
0.063 |
0.021 |
0.038 |
0.688 |
0.693 |
Table 20.
Proportion of different oil saturation in pore.
Table 20.
Proportion of different oil saturation in pore.
| Oil Saturation |
0.8≤So<1 |
0.6≤So<0.8 |
0.4≤So<0.6 |
0<So<0.4 |
0 |
Ratio
Water-wet: Oil-wet |
Water flooding |
Polymer Flooding |
Water flooding |
Polymer Flooding |
Water flooding |
Polymer Flooding |
Water flooding |
Polymer Flooding |
Water flooding |
Polymer Flooding Polymer Flooding |
| 0.1:0.9 |
0.434 |
0.271 |
0.020 |
0.041 |
0.025 |
0.053 |
0.184 |
0.266 |
0.338 |
0.369 |
| 0.4:0.6 |
0.348 |
0.256 |
0.008 |
0.035 |
0.025 |
0.047 |
0.195 |
0.188 |
0.424 |
0.475 |
| 0.6:0.4 |
0.248 |
0.219 |
0.014 |
0.029 |
0.018 |
0.057 |
0.238 |
0.205 |
0.482 |
0.490 |
Table 21.
Proportion of different oil saturation in pore.
Table 21.
Proportion of different oil saturation in pore.
| Oil Saturation |
0.8≤So<1 |
0.6≤So<0.8 |
0.4≤So<0.6 |
0<So<0.4 |
0 |
Ratio
Water-wet: Oil-wet |
Water flooding |
Polymer Flooding |
Water flooding |
Polymer Flooding |
Water flooding |
Polymer Flooding |
Water flooding |
Polymer Flooding |
Water flooding |
Polymer Flooding |
| 0.1:0.9 |
0.357 |
0.274 |
0.083 |
0.095 |
0.066 |
0.085 |
0.080 |
0.110 |
0.413 |
0.436 |
| 0.4:0.6 |
0.304 |
0.209 |
0.045 |
0.060 |
0.031 |
0.063 |
0.062 |
0.078 |
0.558 |
0.590 |
| 0.6:0.4 |
0.233 |
0.181 |
0.034 |
0.052 |
0.021 |
0.061 |
0.076 |
0.080 |
0.636 |
0.642 |
Table 22.
Influence of different wettability on Remaining Oil type.
Table 22.
Influence of different wettability on Remaining Oil type.
Type
Water-wet: Oil-wet |
Saturation(%) |
| 0.1:0.9 |
0.4:0.6 |
0.6:0.4 |
| Clustering |
21.01 |
22.11 |
25.83 |
| Columnar |
8.35 |
7.15 |
5.27 |
| Blind-Ended |
10.32 |
8.01 |
7.71 |
| Other |
13.99 |
10.03 |
6.08 |
|
Disclaimer/Publisher’s Note: The statements, opinions and data contained in all publications are solely those of the individual author(s) and contributor(s) and not of MDPI and/or the editor(s). MDPI and/or the editor(s) disclaim responsibility for any injury to people or property resulting from any ideas, methods, instructions or products referred to in the content. |
© 2024 by the authors. Licensee MDPI, Basel, Switzerland. This article is an open access article distributed under the terms and conditions of the Creative Commons Attribution (CC BY) license (http://creativecommons.org/licenses/by/4.0/).
