Preprint
Article

Virtual Agglomeration: An Driver for Total Factor Productivity

Altmetrics

Downloads

101

Views

32

Comments

0

This version is not peer-reviewed

Submitted:

17 July 2024

Posted:

17 July 2024

You are already at the latest version

Alerts
Abstract
(1) Background: The rapid development of information technology has changed the traditional concept of space, gradually shifting the "container space" to the "relational space" . The constraints of geographical spatial elements are diminishing, and the theory of virtual agglomeration is gaining attention. (2) Methods: In this study, we constructed an evaluation system for virtual agglomeration, comprising four primary indicators: virtual infrastructure level, virtual output level, virtual input level, and virtual service level. The TOPSIS method was used to calculate the virtual agglomeration level for each province, and the DEA-Malmquist method was employed to measure provincial total factor productivity (TFP) in China. Using panel data from 30 provincial regions in China from 2013 to 2021, we examined the mechanism and impact path of virtual agglomeration on TFP. (3) Result: There is an inverted U-shaped relationship between virtual agglomeration and TFP in China. The overall development level of virtual agglomeration is relatively low, within the range where the marginal effect of virtual agglomeration on TFP is positive but diminishing, indicating significant potential for further development. The impact of virtual agglomeration on TFP is stronger in the Yangtze River Economic Belt compared to non-Yangtze River areas, and the highest stable point of TFP is higher in central provinces than in eastern and western provinces. (4) Conclusions: This study provides a theoretical basis and practical reference for improving the level of virtual agglomeration.
Keywords: 
Subject: Business, Economics and Management  -   Economics

1. Introduction

Virtual agglomeration (VA), a brand-new economic organisational form recently, originates from digital technology, which can be related back to the 1997s. But the definition of virtual agglomeration has not been clearly defined. Some scholars argue that VA, with information technology as the core, modern network as the carrier, and with a certain degree of dominance or expertise in the production of the same or similar products, is a collection of firms and related organisations that are diversified, independently owned, geographically dispersed and have certain strengths or specialisations in the production of the same or similar products [1,2]. The competitive advantage of virtual agglomeration depends on the level of digitization and the internetization of network nodes and channels [3]. The global economy is undergoing a transformative shift driven by digitalization [4]. Digital technology, internet platforms, and digital services advance, facilitate seamless connections between supply and demand. Market participants are increasingly interconnected, fostering interaction and integration across innovation, talent, technology, and industrial networks. This enhanced connectivity has led to heightened dynamism and fluidity in economic chains. Notably, concepts like reverse “distance decay” increasing returns to scale, and domain detachment challenge traditional location theories, giving rise to the notion of virtual agglomeration.
In our daily lives, the prevalence of virtual agglomeration is increasing, exemplified by platforms like Alibaba, industrial internet networks, Apple’s App Store, virtual industrial parks, Uber, virtual communities, and more. With the acceleration of technological innovation iteration, virtualization features are becoming increasingly prominent. Virtual agglomeration can achieve greater economies of scale, further optimize transaction costs, and save costs in industrial chain collaboration [5], while reducing the congestion effect caused by geographical agglomeration [6]. At this point, The importance of geographical proximity is questionable [7,8]. Other forms of proximity, such as relational, social, cognitive, organizational, and institutional, may be of more importance[9].
As we all know, the emergence of any economic organization is inevitably the result of market competition. As an important concept in economics, total factor productivity (TFP) measures the impact of technological progress on production.TFP decomposition can be separated into scale economies, technical change, and technical efficiency change [10]. Virtual agglomeration, which is incremental in scale, enables efficient allocation of dispersed resources and alleviates the problems of monopoly and scarcity of geographical resources, and is considered to be a new driver of total factor productivity. In this context, we consider it necessary to conduct a study on the relationship between virtual agglomeration and total factor productivity.
The relevant literature mainly includes the following aspects. The qualitative research literatures have focussed on the discussion of what virtual agglomeration is, what are its characteristics and what are its economic advantages [1,5,11,12,13]. In the applied research literature, research on the relationship between virtual agglomeration and economic development primarily focuses on the quality of export products, export value-added rates [14,15], regional coordinated development [16], Chinese urban innovation [17], and total factor productivity [18,19]. In the empirical research literature, In the empirical research literature, existing literature has focused on analysing the economic role of virtual agglomeration in terms of transaction costs, economies of scale, technological innovation, labour reservoirs, knowledge spillovers and positive externalities. Some scholars have also studied the virtual agglomeration of more segmented industries, such as virtual agglomeration of producer services [20], virtual agglomeration of creative industries [21], and manufacturing virtual agglomeration [22].
According to existing literature around the world, the following shortcomings are found. First,to the best of our knowledge, there has been no unified definition of virtual agglomeration in the qualitative research. Second, the academic literature has so far paid surprisingly little attention to the linkage between TFP and virtual agglomeration, which may be an important innovation driver for TFP in the empirical research. Third, there has been no scientific index system to measure virtual agglomeration, and it is important to measure the current state of virtual agglomeration development through an appropriate index. In addition, linear regressions have been widely used in previous studies, whereas we believe that the impact of the virtual agglomeration on total factor productivity is quite complicated and there may be non-linear linkages.
The contributions of this paper include the following aspects. First, Virtual agglomeration is an emerging field. he most prevalent method for measuring virtual agglomeration uses e-commerce transaction volumes to gauge locational entropy and the reciprocal of the Herfindahl-Hirschman Index [19]. However, we believe that virtual agglomeration is a complex concept, and using a single indicator to measure it only captures one aspect of virtual agglomeration, failing to comprehensively measure its overall level and offering poor representativeness. Therefore, we have developed our own set of indicators for virtual agglomeration based on an analysis of the concept and characteristics of virtual agglomeration. Second, the subjective weighting method usually introduces uncertainty in the construction of the indicator system. We use the entropy method, which is an objective weighting method to scientifically reflect the contribution of different dimensions of evaluation elements and construct the virtual agglomeration index. Third, starting from the theory of virtual agglomeration, we analyze the mechanism by which virtual agglomeration affects total factor productivity from the perspectives of micro-mechanism resource allocation, technological advancement, and economies of scale. For the first time, we systematically explore and test the intrinsic connection between virtual agglomeration and total factor productivity. In addition, linear regressions are mostly employed in panel data analysis, but we argue that there is a nonlinear relationship between virtual agglomeration and TFP. Therefore, this paper constructs a nonlinear panel model with square terms, which is more in line with the current situation.
In our discussion, we employ a nonlinear model to describe the relationship between virtual agglomeration and TFP to demonstrate that virtual agglomeration is an driver of TFP growth. We start with the calculation of provincial TFP based on DEA-Malmquist method and the construction of virtual agglomeration index by using the TOPSIS method from 2013 to 2021 in China, which provides the panel data for our further analysis. Next, we use regressions to deal with nonlinear relationships. We propose that virtual agglomeration is an driver and discuss the mechanisms by which virtual agglomeration works in terms of resource allocation, technological progress and economies of scale. To conclude our discussion, we make some suggestions for virtual agglomeration.

2. Literature Review and Hypotheses

According to the theory of virtual agglomeration (VA), VA has transformed traditional market models and surpassed industrial location theory. It offers significant advantages, including reducing transaction costs for upstream and downstream industries, expanding industrial production scale , lowering geographical spatial costs, accelerating information dissemination [5,7], and generating economies of scale in demand. According to Chen Xiaoyong (2017), traditional industrial agglomeration relies on a linear division of labor based on the value chain, whereas virtual industrial agglomeration creates a value network, enabling a network-based division of labor. This not only enriches business networks and broadens the value chain but also increases the potential paths for business collaboration. The production potential will be maximized under the support of digital technologies such as AI, cloud computing, the Internet of Things, and blockchain.
With the acceleration of technological innovation, VA becomes increasingly attractive under the constraints of stringent environmental regulations due to its advantages such as borderlessness, economies of scale, network spillover effects, and transaction cost savings. Consequently, the number of VA organizations is gradually increasing. Scholars are also beginning to explore the impact of VA on economic development [14,15,16,17]. Duan and Zhang (2023) have indicated that industrial virtual agglomeration breaks free from the spatial constraints of geographical entities, integrates distributed elements through networking, achieves bidirectional feedback of information, expands the utilization of geographical space, and enhances total factor productivity [18]. Zhang et al., (2024) also noted that VA of manufacturing is a new driving force for improving green TFP [19]. This indicates that scholars have begun to explore the relationship between VA and TFP. However, However, the current study does not capture the key mechanism of the role of VA and TFP.
According to Solow (1957), total factor productivity (TFP) refers to the increase in output caused by technological progress and capability enhancement beyond the input of various factors such as capital and labor. Improvements in TFP primarily arise from enhancements in efficiency, technological advancements, and scale effects. Therefore, this paper seeks to investigate whether virtual agglomeration can increase efficiency, promote technological progress, enhance scale effects. Next, the paper will first conduct a theoretical exploration, followed by empirical data testing and analysis of the results.

2.1. Virtual Agglomeration Can Optimize Resource Allocation

The concept of virtual agglomeration originates from the concept of cyberspace proposed by Wilson (1967), and represents a new organizational form established by different enterprises that transcends geographical boundaries [1]. VA, facilitated by online platforms, is characterized by its openness, inclusivity [1] vast scale, and low barriers to entry [5]. We believe that virtual agglomeration optimize resource allocation efficiency through the following pathways. First, virtual agglomeration overcomes geographical constraints to optimize resource allocation. It utilizes digital platforms to enable cross-regional and cross-industry resource flows and sharing, breaking down geographical limitations, enhancing the efficiency of resource mobility, and fostering synergistic effects. Second, virtual agglomeration reduces information asymmetry, thus optimizing resource allocation efficiency. Through digital platforms, information can be rapidly transmitted and shared, reducing barriers and distortions in information, enhancing transparency and collaboration in the flow of factors, overcoming the problem of information asymmetry, and optimizing the allocation of production factors within the division of labor structure [16]. Third, virtual agglomeration lowers transaction costs, thereby optimizing resource allocation efficiency. Compared to traditional industrial agglomerations, virtual agglomerations possess dual attributes that consider both “demand” and “supply” sides [5]. By facilitating on-demand production, they reduce search costs and optimize resource allocation. Additionally, within virtual agglomerations, the relationship between upstream and downstream enterprises shifts from production-process binding to task-based connections, leveraging the “Internet+” to automatically avoid costs of choice and coordination [23], further enhancing resource allocation efficiency. Lastly, virtual agglomerations, unlike traditional ones, undoubtedly expand the boundaries of agglomeration, making it “boundary-less”. In the context of “breaking out” of traditional clusters, any organization or individual within the agglomeration has the opportunity to find the best partners at lower costs, achieving a relatively optimal combination, which fundamentally enhances the efficiency of resource allocation. Overall, as a product of the digital economy, VA should feature lower costs in searching, copying, transporting, tracking, and verifying [24]. The savings on these costs enable businesses to focus more on enhancing TFP.

2.2. Virtual Agglomeration Can Promote Technology Progress

Krugman pointed out in his book Geography and Trade that industrial agglomeration has a technology diffusion effect. He also pointed out that there is a self-enhancing relationship between industrial agglomeration and technology diffusion that is interrelated and mutually reinforcing. As a new form of industrial agglomeration, virtual agglomeration also helps to promote the diffusion of technology, which in turn promotes technological progress. The new generation of information technology makes the knowledge spillover of virtual agglomeration no longer rely on geographical proximity, reduces the cost of information collection, sharing costs, and expands the knowledge spillover effect [13]. With technological support, information and data resources within virtual agglomerations are transmitted across virtual cyberspaces, which reduces the costs of negotiation and increase the frequency of communication through online interactions [25], so that the new knowledge and technology can be transferred inside and outside the industry in a smarter and quicker way, which significantly enlarges the knowledge spillover and technology diffusion effect [26].
The consensus is that knowledge spillovers and technology diffusion are generally considered less effective over greater distances, as they are influenced by geographical distance. However, virtual agglomeration, leveraging digital technology, create a “zero-distance” effect, reducing the spatial stickiness of knowledge spillover and exhibiting an “inverse distance decay” effect. Furthermore, through agglomeration platforms, technology diffusion can occur across multiple times and spaces, effectively reducing the latency of technology diffusion. Advanced technologies from developed regions can spread to less developed areas, fostering technical dividends through “learning by doing” and “imitative innovation-autonomous innovation” channels [16], broadening the scope of technology diffusion.
Virtual agglomerations also reduce the spatial distance of technology diffusion, decreasing the likelihood of technology dormancy, and transition from a “one-to-one” to a “one-to-many” technology diffusion model [16]. In practice, industrial cloud platforms represent typical types of virtual agglomerations, such as “Huawei Cloud”, “Xu Gong Industrial Cloud”,and “Haier Cloud”. These platforms host a mix of large advanced manufacturing enterprises and small and medium-sized enterprises with weaker digital capabilities. Large manufacturing companies, with stronger technology R&D orientation, R&D personnel, and R&D strength, can radiate their research results to smaller enterprises on the platform. Secondly, cloud platforms act as “intermediaries”, publishing technical requirements and bottlenecks, which can be solved on the platform.
The above analyses show that virtual agglomeration can realise the agglomeration effect of multi-party linkage, improve quality and efficiency, and promote technological progress.

2.3. Virtual Agglomeration Can Further Expand Economies of Scale

Marshall posited that the basis of industrial agglomeration lies in externalities, and identified the development of specialized inputs and services, the formation of a labor pool, and knowledge spillovers as pivotal drivers of such clustering. He further argued that a higher concentration of firms within the same industry in a particular area enhances the aggregation of production factors, leading to pronounced economies of scale and scope. However, Hoover introduced the concept of optimal agglomeration size, suggesting that surpassing a region’s maximum carrying capacity results in negative externalities such as elevated housing costs, increased pollution, and congestion effects. These contribute to a threshold in agglomeration size, depicted by an inverted U-shaped efficiency curve of industrial agglomeration, which restricts the scale economies.
Virtual clustering, as a state of “aggregation without congestion”, where clustered entities are distributed across different regions, presents a decentralized organizational structure and a boundless spatial layout. This effectively avoids congestion effects and overcomes geographical limitations. The scale of virtual clusters is not affected by environmental carrying capacities, thus breaking through the “optimal scale theory” and exhibiting a trend of increasing returns to scale.
In 1991, Krugman classified the sources of Marshall’s external scale economies into three categories: (1) Labour market Pooling; (2) Intermediate Input Sharing; and (3) Knowledge Spillovers. The development of virtual agglomeration expands the labour market pooling. Under virtual agglomeration, the employment landscape becomes more flexible, significantly reducing the necessity of geographical proximity to employers. This leads to a substantial decrease in the bilateral matching costs of labor demand and supply, potentially nearing zero [14], and the agglomeration platform can also facilitate talent sharing. Secondly, virtual agglomeration can realize the sharing effects of intermediate inputs through various approaches such as digital platform construction, supply chain coordination, procurement and inventory optimization, informatization applications, and resource sharing. It can also instantly capture any amount of intermediate inputs available in the market, reducing the marginal acquisition costs of intermediate products [16]. Thirdly, the spillover effects of virtual agglomeration are more pronounced, as discussed earlier with the knowledge spillover effects of virtual agglomeration. Additionally, virtual agglomeration platforms can achieve “co-investment, co-research, and co-sharing” effects. In virtual agglomeration, cooperation and communication between enterprises form an innovation network that promotes the sharing and diffusion of knowledge, providing more opportunities and support for corporate innovation activities. However, specialization is the fundamental driver of external economies of scale growth; industrial clusters themselves do not generate external economies of scale. Their essence lies in reducing the costs of specialization and cooperation, creating favorable conditions for microeconomic entities to utilize external economies of scale [12]. Virtual agglomeration has relatively weak barriers, and the virtual transformation of clusters will further shorten the “distance” of specialization and cooperation, making nationwide specialization possible. Moreover, next-generation information technology reduces the information matching and selection costs for enterprises in virtual agglomeration. Leveraging the Internet, virtual agglomeration transitions from “real” to “virtual”, breaking through the closed nature of physical boundaries, facilitating efficient information transmission, and breaking down information barriers. Producers in virtual agglomeration can timely capture demand-side information on demand structure, quantity, and quality, making production and service decisions based on consumer needs, achieving demand-supply balance without the risk of product backlogs, and realizing economies of scale effects. In a sense, virtual agglomeration possesses dual characteristics of “gathering demand” and “realizing supply” [5].
The above theoretical relationships can be represented as Figure 1.
The above analysis indicates that virtual agglomeration has a positive effect on all three sources contributing to the improvement of total factor productivity. Therefore, we state our first hypothesis:
Hypothesis 1.
Virtual agglomeration plays an active role in total factor productivity.

2.4. The nonlinear Relationship between Virtual Agglomeration and Total Factor Productivity

The understanding of the development and impact of virtual agglomeration can draw on the ideas from “New Economic Geography,” particularly the views on agglomeration economies’ externalities by Paul Krugman. In Krugman’s theoretical framework, agglomeration economies’ externalities refer to the increased production efficiency and cost benefits that arise when firms and labor are geographically concentrated.
There have been plenty of empirical studies that have analyzed the influence of spatial agglomeration on industrial or regional productivity and most conclude that a positive relationship exists [27,28]. Industrial agglomeration is conducive to reduce the production cost of enterprises [29]. However, industrial agglomeration will also bring about “crowding effect” [30]. Positive externalities of agglomeration are mainly spillover effects, including knowledge spillover and technology spillover. But technology spillover was local, decreased as geographical distance increased and decreased by half at about 1200 km [31].
Generally, from a micro perspective, firms with certain production capacity can only focus on domestic or international markets [32] . As two different forms of markets, virtual agglomeration and geographic agglomeration also have a substitution relationship, and the development of virtual agglomeration will inevitably crowd out geographic agglomeration, which in turn affects the spillover effect of knowledge and technology. Although no scholars have yet suggested that the development of virtual agglomeration on too large a scale will inhibit total factor productivity, economic intuition tells us that virtual agglomeration cannot expand indefinitely to replace traditional agglomeration. It must have boundaries. Only at a reasonable level can virtual agglomeration contribute positively to total factor productivity. Based on the aforementioned analysis, we advance the following hypotheses:
Hypothesis 2
. There is a U-shaped relationship between VA and TFP. Specifically, VA has a positive impact on TFP at first, but tends to be negative when the level of VA is high.

3. Methods and Data

3.1. Model Design

As the 2012 and earlier indicators for some of the virtual agglomeration indicators were not disclosed, the 2013-2021 data were selected for analysis. According to the above theoretical framework and referring to Pan et al. (2022), the model was set as follows:
T F P i , t = α + β 1 V agg i , t 2 + β 2 V a g g i , t + j r j C o n t r o l s j , i , t + δ t + ξ i , t 1 Here, T F P i , t represents the TFP of i province in t year, which is the core explanatory variable.. V a g g i , t represents the virtual agglomeration level of i city in t year, serving as the explanatory variable. C o n t r o l s represents the control variables, indicating the number of control variables. δ t represents the fixed effects of the year. ξ i , t is the random disturbance term, encompassing other unobserved factors that may influence total factor productivity.

3.2. Variable Measurement

3.2.1. Total Factor Productivity (TFP)

The measure of TFP is based primarily on the stochastic frontier approach (SFA) and non-parametric data envelopment analysis (DEA). The former relies on the feature’s parametric model, while the latter modifies the subjective defect of the former. Moreover, the DEA model was widely used to calculate TFP after the remarkable work of Charnes et al. (1978). This method is suitable for situations with multiple inputs and outputs, has a wider range of applicability, and does not require assumptions about production functions. The index selection flexibility is also greater. Therefore, this paper uses the DEA model to measure TFP at the provincial level in China, referring to the research of Lu and Lian (2012). The output variable is measured using GDP, capital stock, and year-end labor as inputs. The Malquist index is constructed to measure TFP from 2013 to 2021. Capital (k )is expressed in terms of capital stock using the perpetual inventory method: k t = I t + ( 1 δ ) k t 1 . It is the total investment in fixed assets. We also consider the price factor in our calculations and deal with it.

3.2.2. Virtual Agglomeration (VA)

Currently, researchers have proposed four different methods of measuring virtual agglomeration. One is to calculate digital service penetration as a measure of VA level through the share movement method (bartik) by using OECD input-output data and China’s first economic census industrial enterprise data [14,17]. The second is to use the paid members of China’s largest B2B platform as a criterion, refer to Honest Link and the Herfindahl-Hirschman index to measure VA level [15]. The third is to use e-commerce transaction volume to measure the location entropy and the Herfindahl-Hirschman index reciprocal to measure VA level [16]. The fourth is to construct a multi-dimensional and multi-indicator VA index using entropy method to measure VA level [18,34]. This paper argues that the first three methods can only reflect one aspect of VA, and cannot comprehensively measure the overall level of VA by using single indicators to measure VA, which is less representative. Based on this, the fourth method of using multiple indicators to measure VA is developed to make up for the shortcomings of single indicators. VA is an important component of the digital economy and a special form in digital economy. Therefore, the measurement indicators of VA and the digital economy are not completely separate systems, but there is a certain connection. Based on this, this paper believes that it is feasible to construct an index system to measure VA levels. With reference to the existing VA indicator system [34], and the understanding of VA, we have constructed a measurement system with 4 first-level indicators (virtual infrastructure level, virtual output level, virtual input level, and virtual service level) and 18 second-level indicators. The specific indicators are shown in Table 1. Finally, this paper uses the TOPSIS method to produce comprehensive evaluation results to reflect the level of virtual agglomeration.

3.2.3. Control Variable

In order to avoid omitted variable bias as much as possible and based on relevant literature [35,36,37], we control for a series of firm characteristic variables that may affect TFP, including gross regional product per capita ( E C O ), industrial structure upgrade (ISS), human capital investment (HI), and degree of foreign trade (TRA). All nominal variables are adjusted for 2013 as the base period.

3.3. Sample Selection and Data Sources

This paper uses panel data from 30 provinces in China (excluding Hong Kong, Macao, Taiwan, and Tibet) from 2013 to 2021. The data are sourced from the China Urban Statistical Yearbook, the China Regional Economic Statistical Yearbook, the National Economic, the China Financial Statistics Yearbook and Social Development Statistical Bulletin, and the China Urban Development Index Report. Several important findings emerge when we analyse the data using the Stata 18. 0 software.
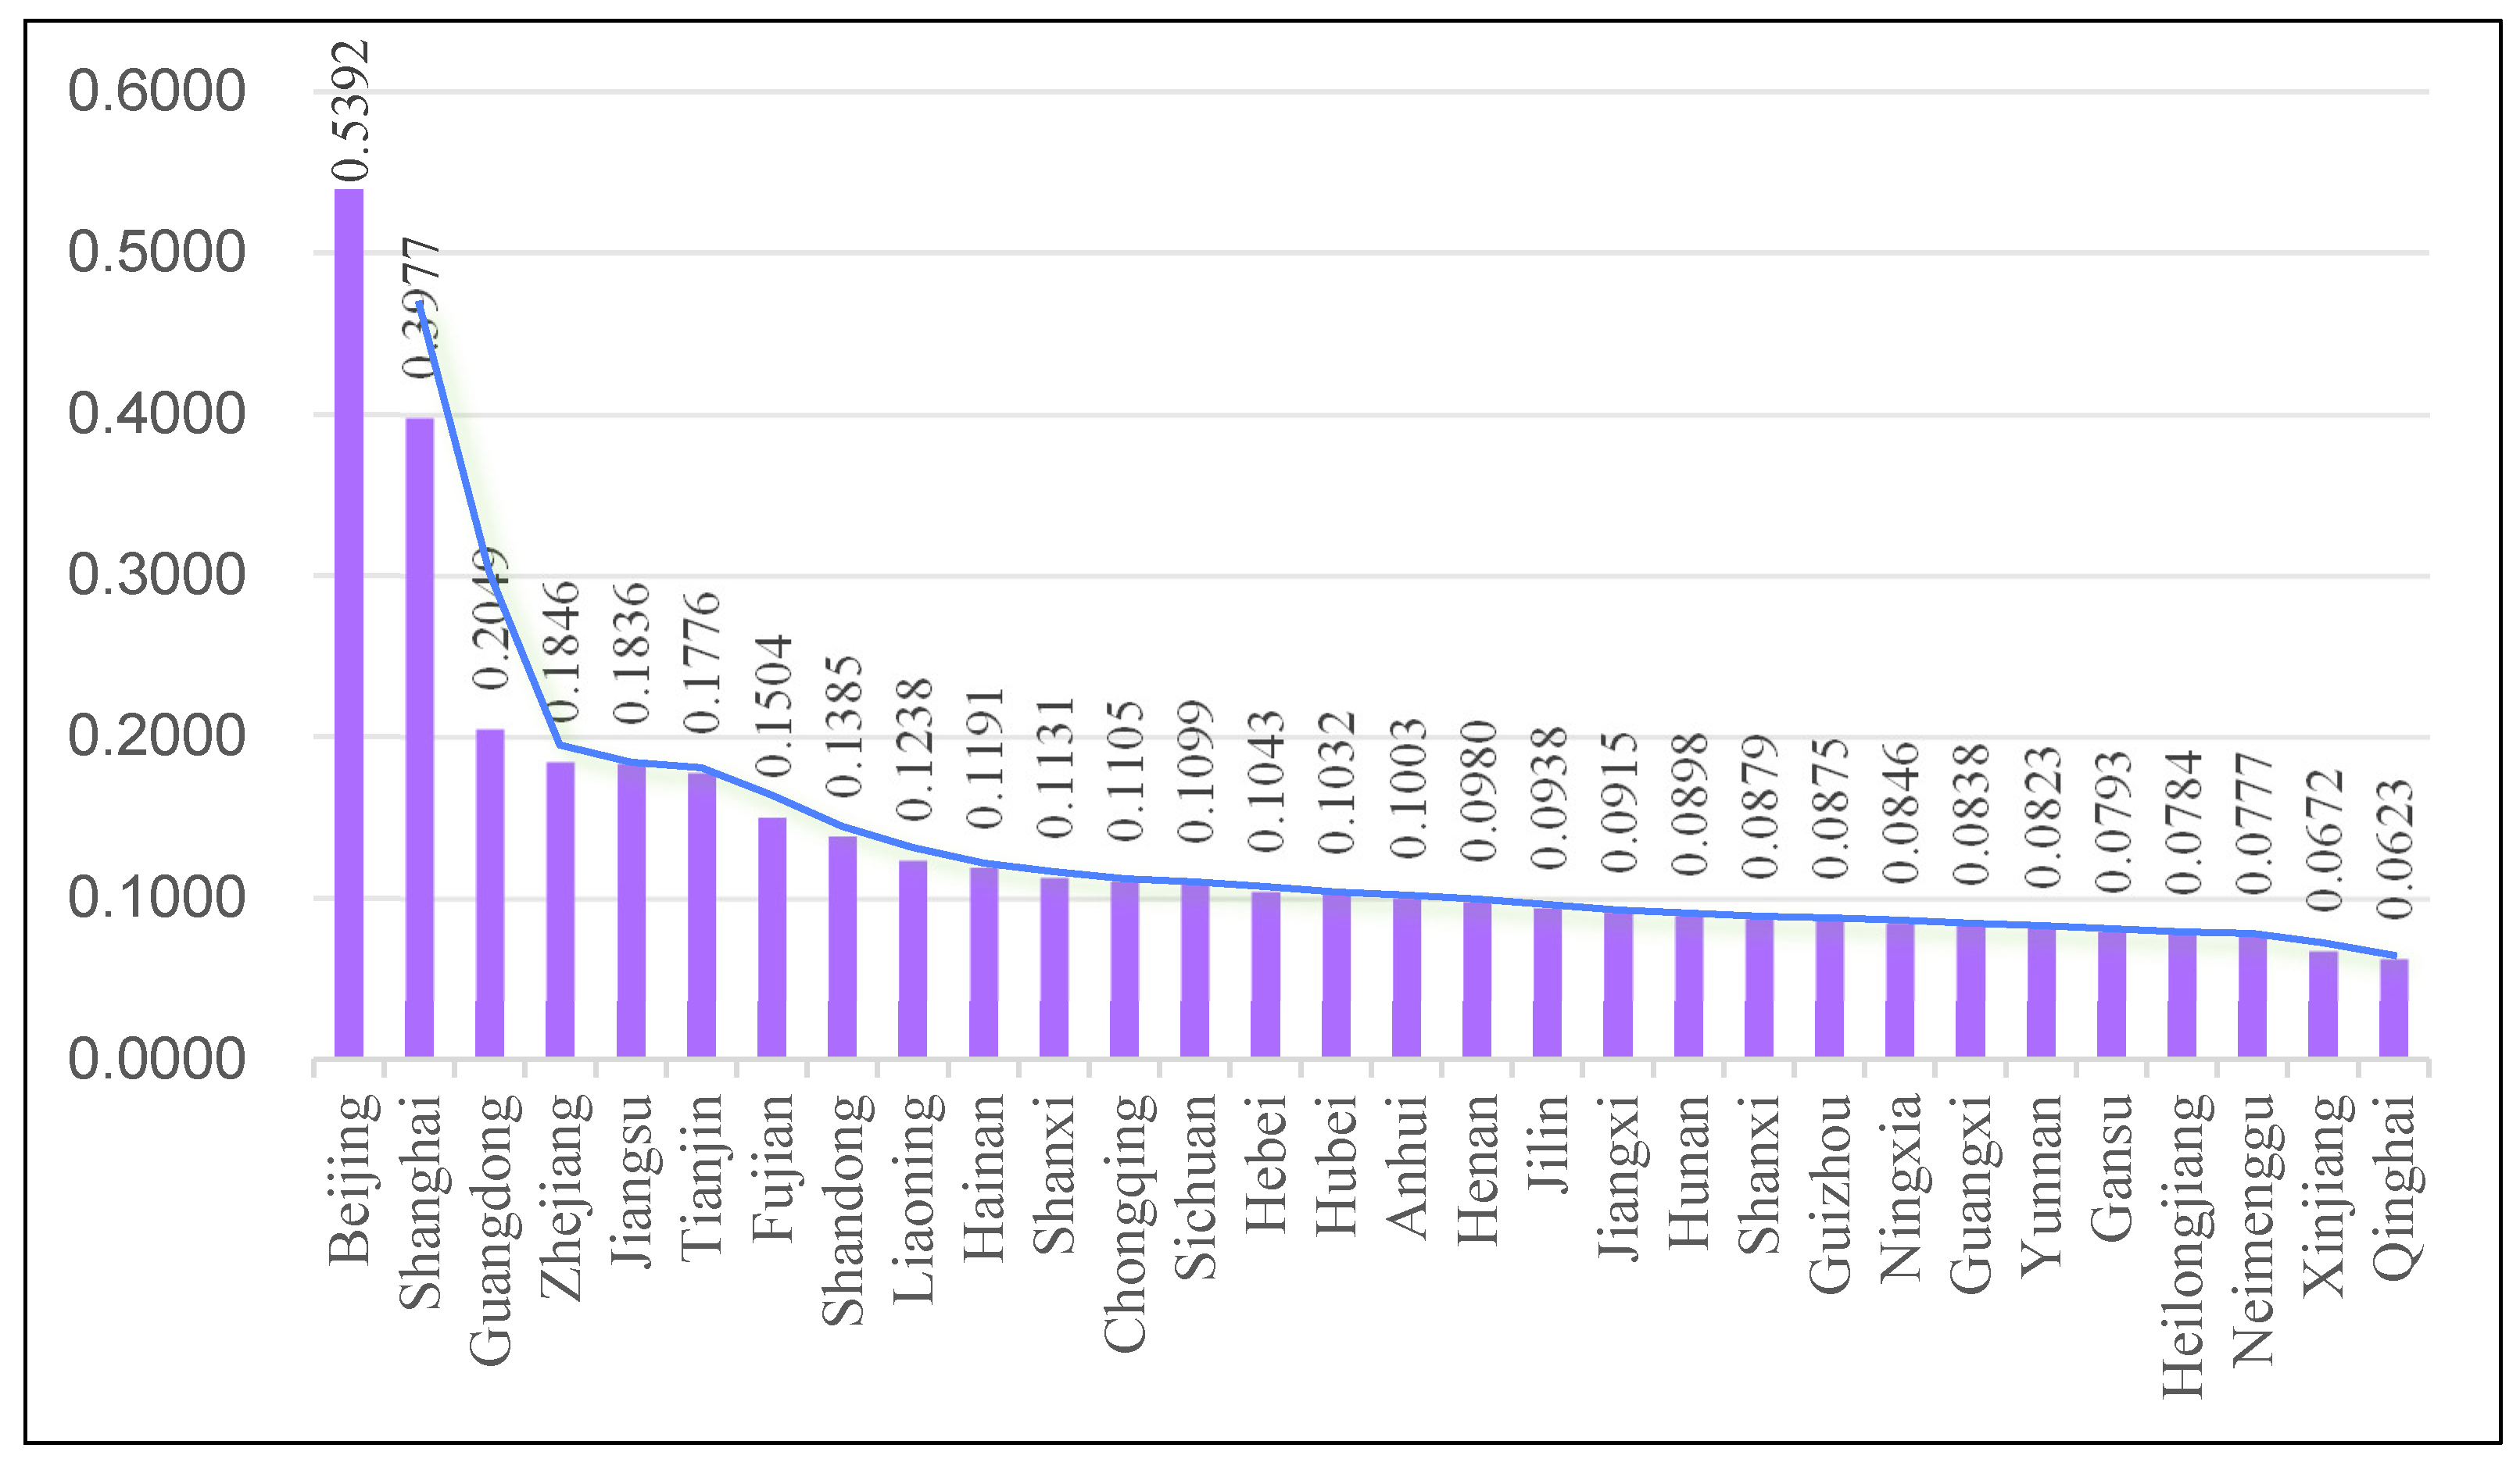
Table 2 shows the outcome of the descriptive statistics for the dataset. The mean of TFP is 0.5952, with a maximum value of 1.4184 and a minimum value of 0.1017, indicating significant differences in TFP among different provinces. The mean of VA is 0.1342, with a maximum value of 0.6988 and a minimum value of 0.0197, indicating large differences in VA levels among different provinces. Figure 2 reports the differences in the level of VA among provinces.
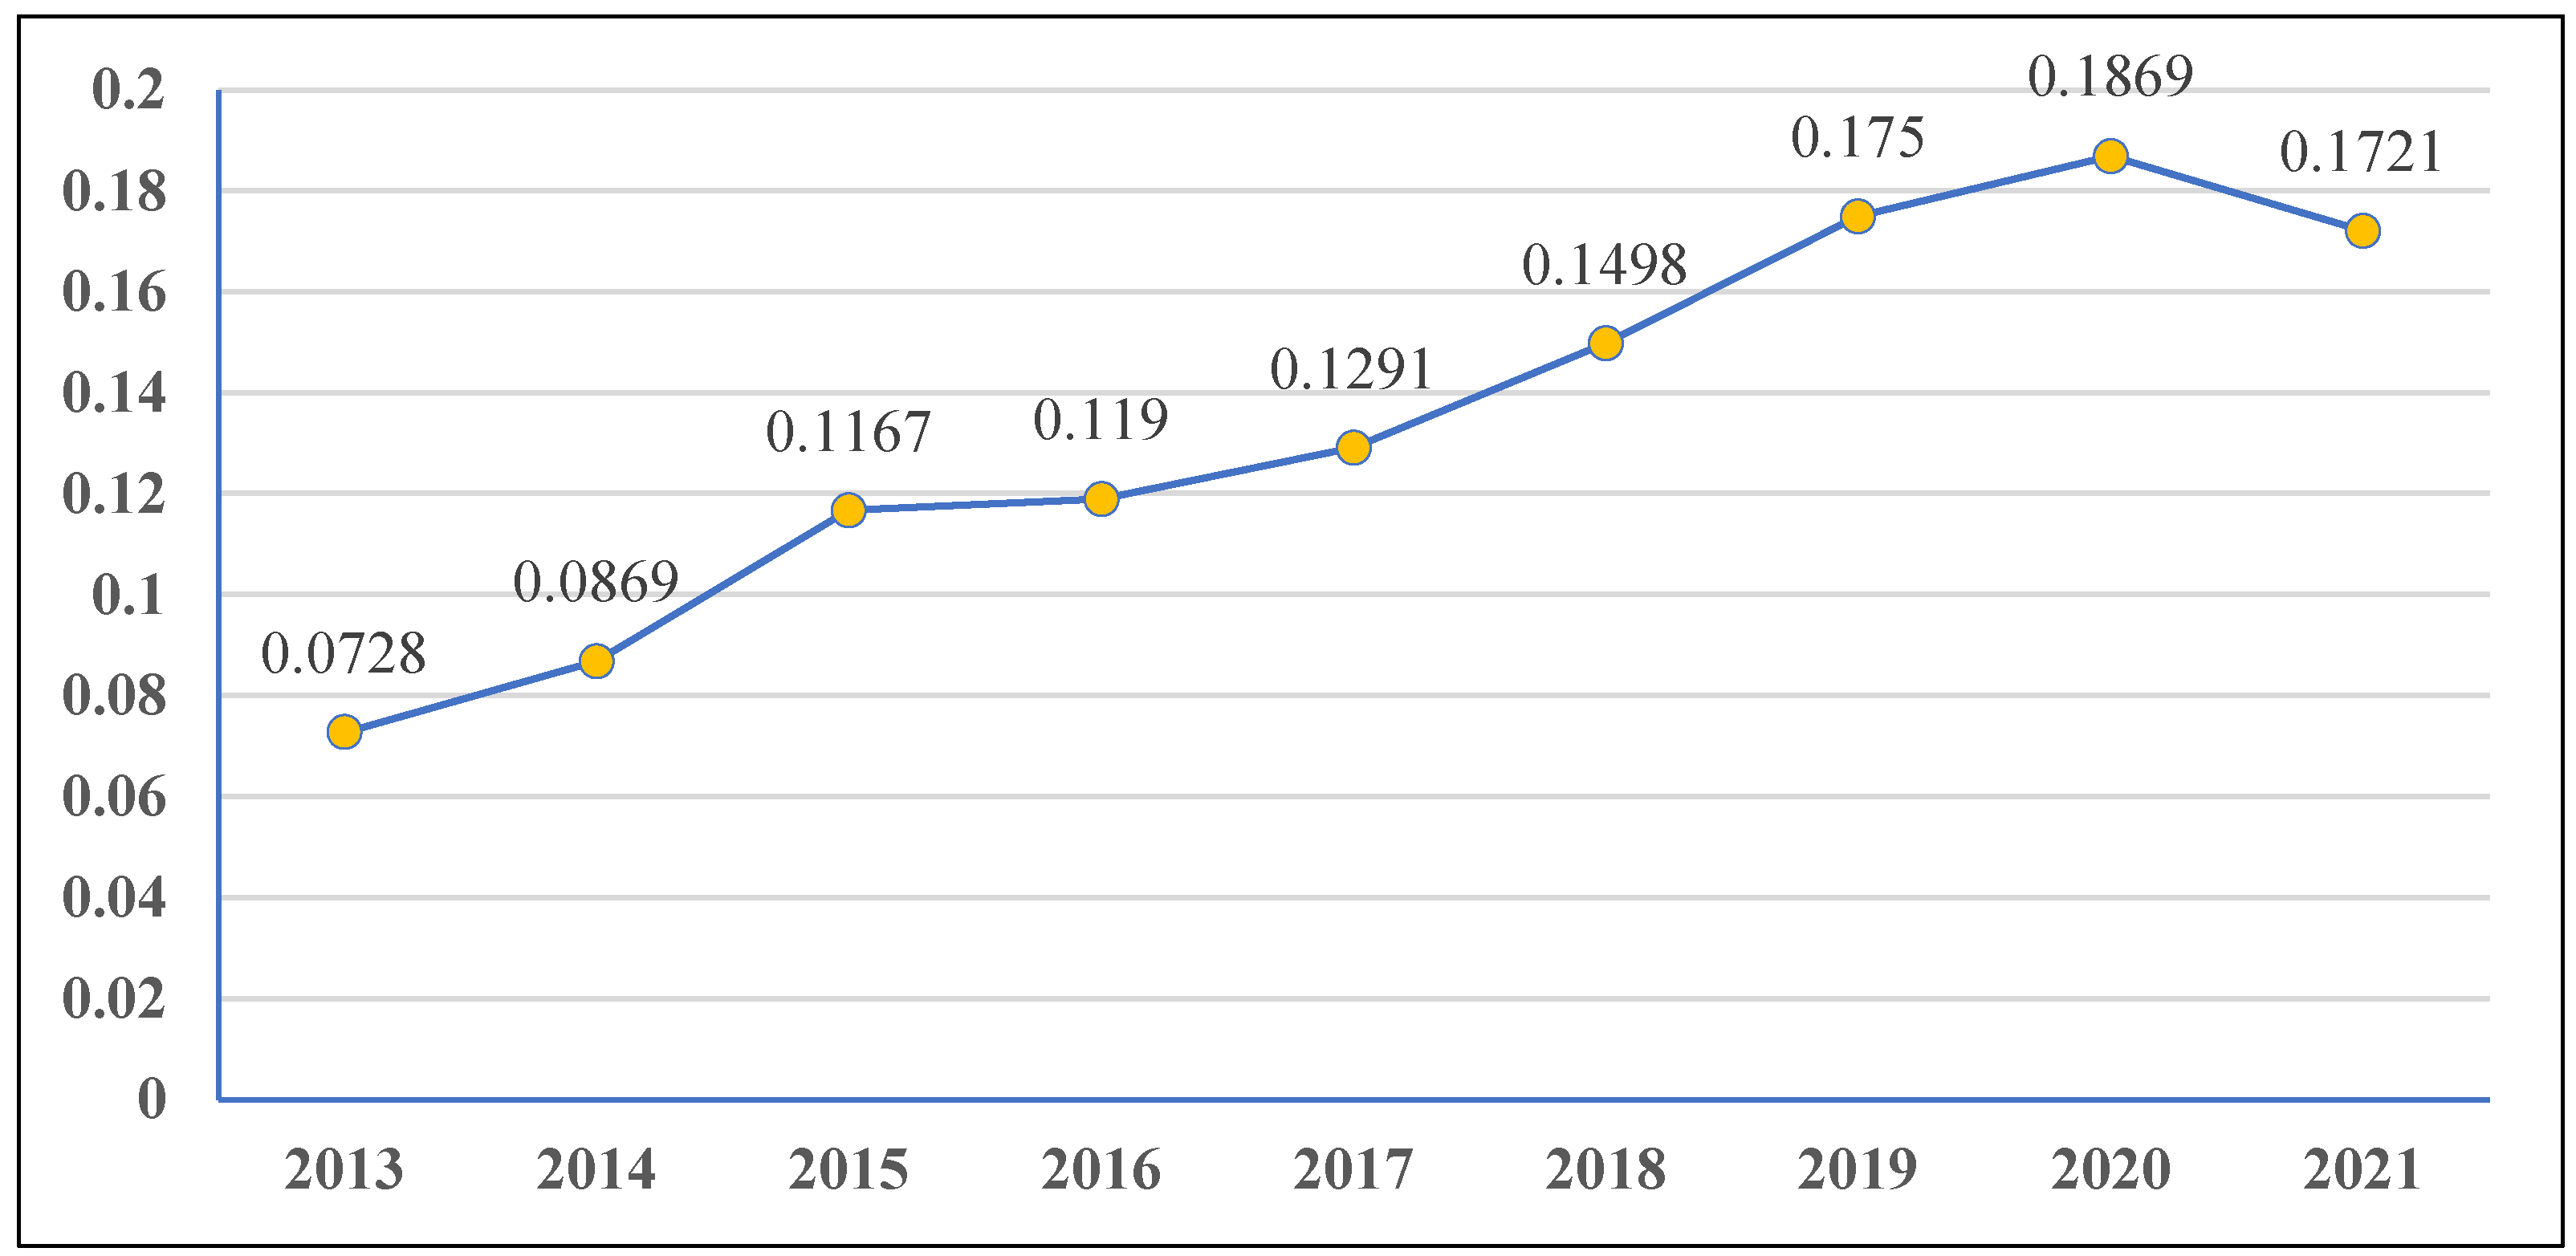
Based on Figure 3, during the 2013–2021 period, the VA ranges considerably from 0.0728 to 0.1721 and reaches an overall average of 0.1342. With 0.1 and 0.15 as the thresholds, VA is divided into three types: low VA, medium VA, and high VA, as shown in Table 3. It can be seen from the table that the top five provinces with high VA levels are Beijing, Shanghai, Guangdong, Zhejiang, and Jiangsu, while there are 14 provinces with relatively low VA levels, including Qinghai, Xinjiang, Ningxia, Gansu, Heilongjiang, and so on. Overall, the VA level shows an eastern > central > western trend, indicating a regional “catch-up effect.” This result is consistent with the measurement results of Tian and Zhang (2023), which are more in line with the development of the real virtual economy. As shown in Figure 3, with the development of the digital economy, the overall VA level in China has shown an upward trend, but due to the impact of the COVID-19 pandemic and anti-globalization measures, an inflection point appeared in 2021.

4. Results and Discussion

4.1. Baseline Regression Result

The general relation between virtual agglomeration and total factor productivity is described in Table 4. As can be seen from model 1 to model 2, the non-linear effect of virtual agglomeration on total factor productivity exceeds the 1% significance threshold, regardless of whether control variables are included or not. In model 1, controlling for year fixed effects and without any other control variables, the coefficient of the quadratic term of virtual agglomeration is negative, and the coefficient of the linear term is positive. In model 2, after adding control variables, the coefficients of the quadratic and linear terms of virtual agglomeration do not change significantly.
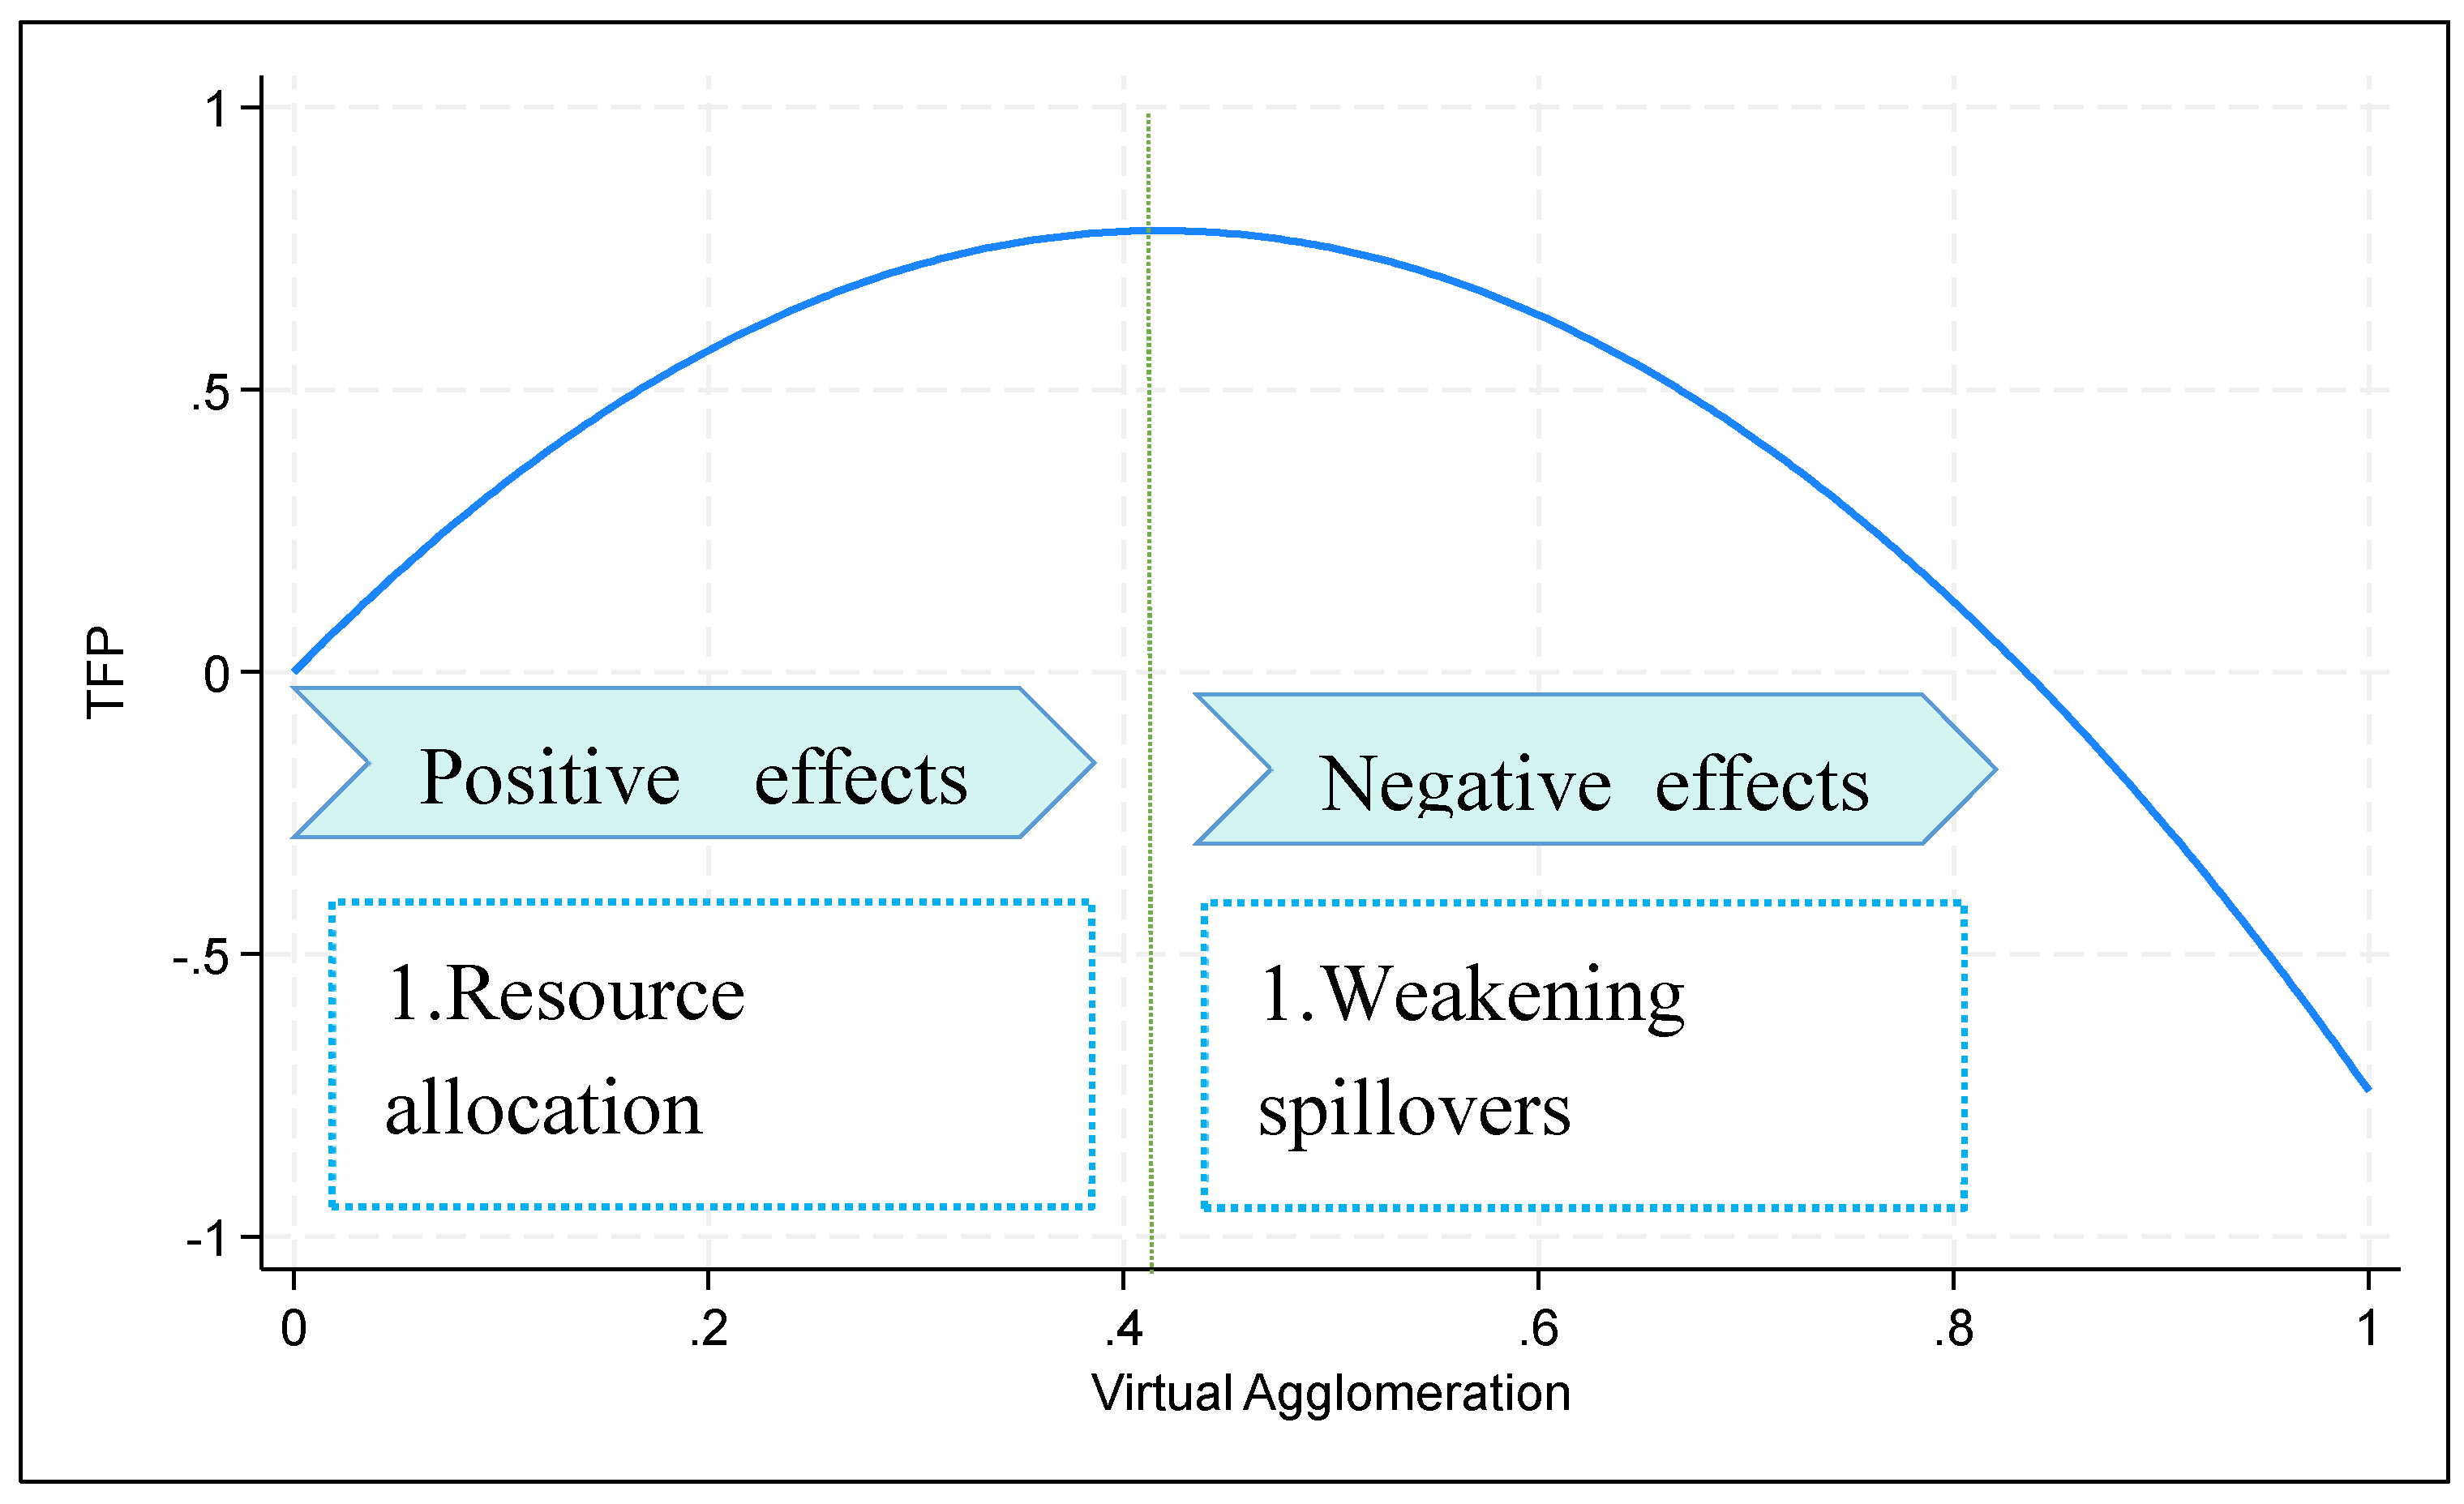
According to the squared term regression results of the nonlinear panel model, the relationship between the virtual agglomeration and TFP satisfies a parabolic function, that is, virtual agglomeration affects TFP in a manner consistent with an increase before the inflection point and a decline after the inflection point. For simplicity, the formula is assumed to be T F P = 3.7468 V a g g 4.4884 V a g g 2 , and the fitted shape is shown in Figure 4. Observing the data, it is found that the virtual agglomeration positively affects the total factor productivity when it is less than 0.4173, and negatively affects total factor productivity when it is greater than 0.4173. The research hypothesis is verified.
Combining the data from 2013 to 2021 in Figure 3, it is found that in 2020, the average level of virtual agglomeration development in China reaches a maximum of 0.1869, which is much smaller than 0.4173. Therefore, it can be judged that the development of China’s virtual agglomeration is still in the primary stage. The impact of virtual agglomeration on total factor productivity is on the right side of the inflection point, and there is a big distance from the optimal promotion effect. Therefore, we believe that, in the next period of time, the relevant government departments should continue to increase the scale of platform investment and promote the construction of digital infrastructure, so that the development of virtual agglomeration can better play a positive role in promoting TFP.

4.2. Robustness Test

4.2.1. Alternative Estimation Method of TFP

By changing the method of accounting for total factor productivity, we recalibrated it using a random effects model and substituted the dependent variable in the regression equation. The empirical results in Table 5. We obtained the similar results to Table 4, indicating that the model set in this paper is robust and the model estimation results are reliable.

4.2.2. Endogeneity Problem

The endogeneity of economic models is an issue that cannot be ignored. To test the model endogeneity, an instrumental variable method using an exogenous variable is needed [38]. Drawing on Acemoglu et al. (2001) [39], Bai et al. (2023), the topographic relief of each province was selected as an instrumental variable for the degree of development of virtual agglomeration [38]. Terrain ruggedness, as geographic spatial data, affects the virtual agglomeration of infrastructure such as fiber optic cables and communication base stations, impacting the deployment, allocation, and performance of digital devices. The flatter the terrain in each province, the more favorable it is for the improvement of virtual agglomeration infrastructure levels and usage effectiveness. Additionally, objective terrain ruggedness data satisfy the exclusivity constraint and exogeneity condition. Considering that terrain ruggedness is cross-sectional data, we use the interaction term of terrain ruggedness and year as an instrumental variable for virtual agglomeration. Taking the logarithm, we include the linear and quadratic terms in the regression equation for testing. The results were shown in Table 6.
As shown in model 1 and model 2 of Table 6, the magnitude and significance of the influence coefficient of the virtual agglomeration on TFP have not changed significantly, verifying the robustness of the above conclusions.

4.3. Heterogeneity

Different provinces have certain differences in their own development conditions such as economic development, institutions, and technology. These differences may affect the impact of VA on TFP. On the one hand, the Yangtze River Economic Belt (YREB), which spans the east, middle and west regions of China, is one of the “three strategies” that the central government focuses on implementing. The Yangtze River Economic Belt provinces have obvious advantages in terms of their central location, vast hinterland, abundant resources, and better natural geographic foundation. On the other hand, there are significant differences in the level of digital technology and VA among the eastern, central, and western regions. The average VA levels of the eastern, central, and western provinces are 0.2006, 0.0912, and 0.0885, respectively.

4.3.1. Whether it is in the Yangtze River Economic Belt

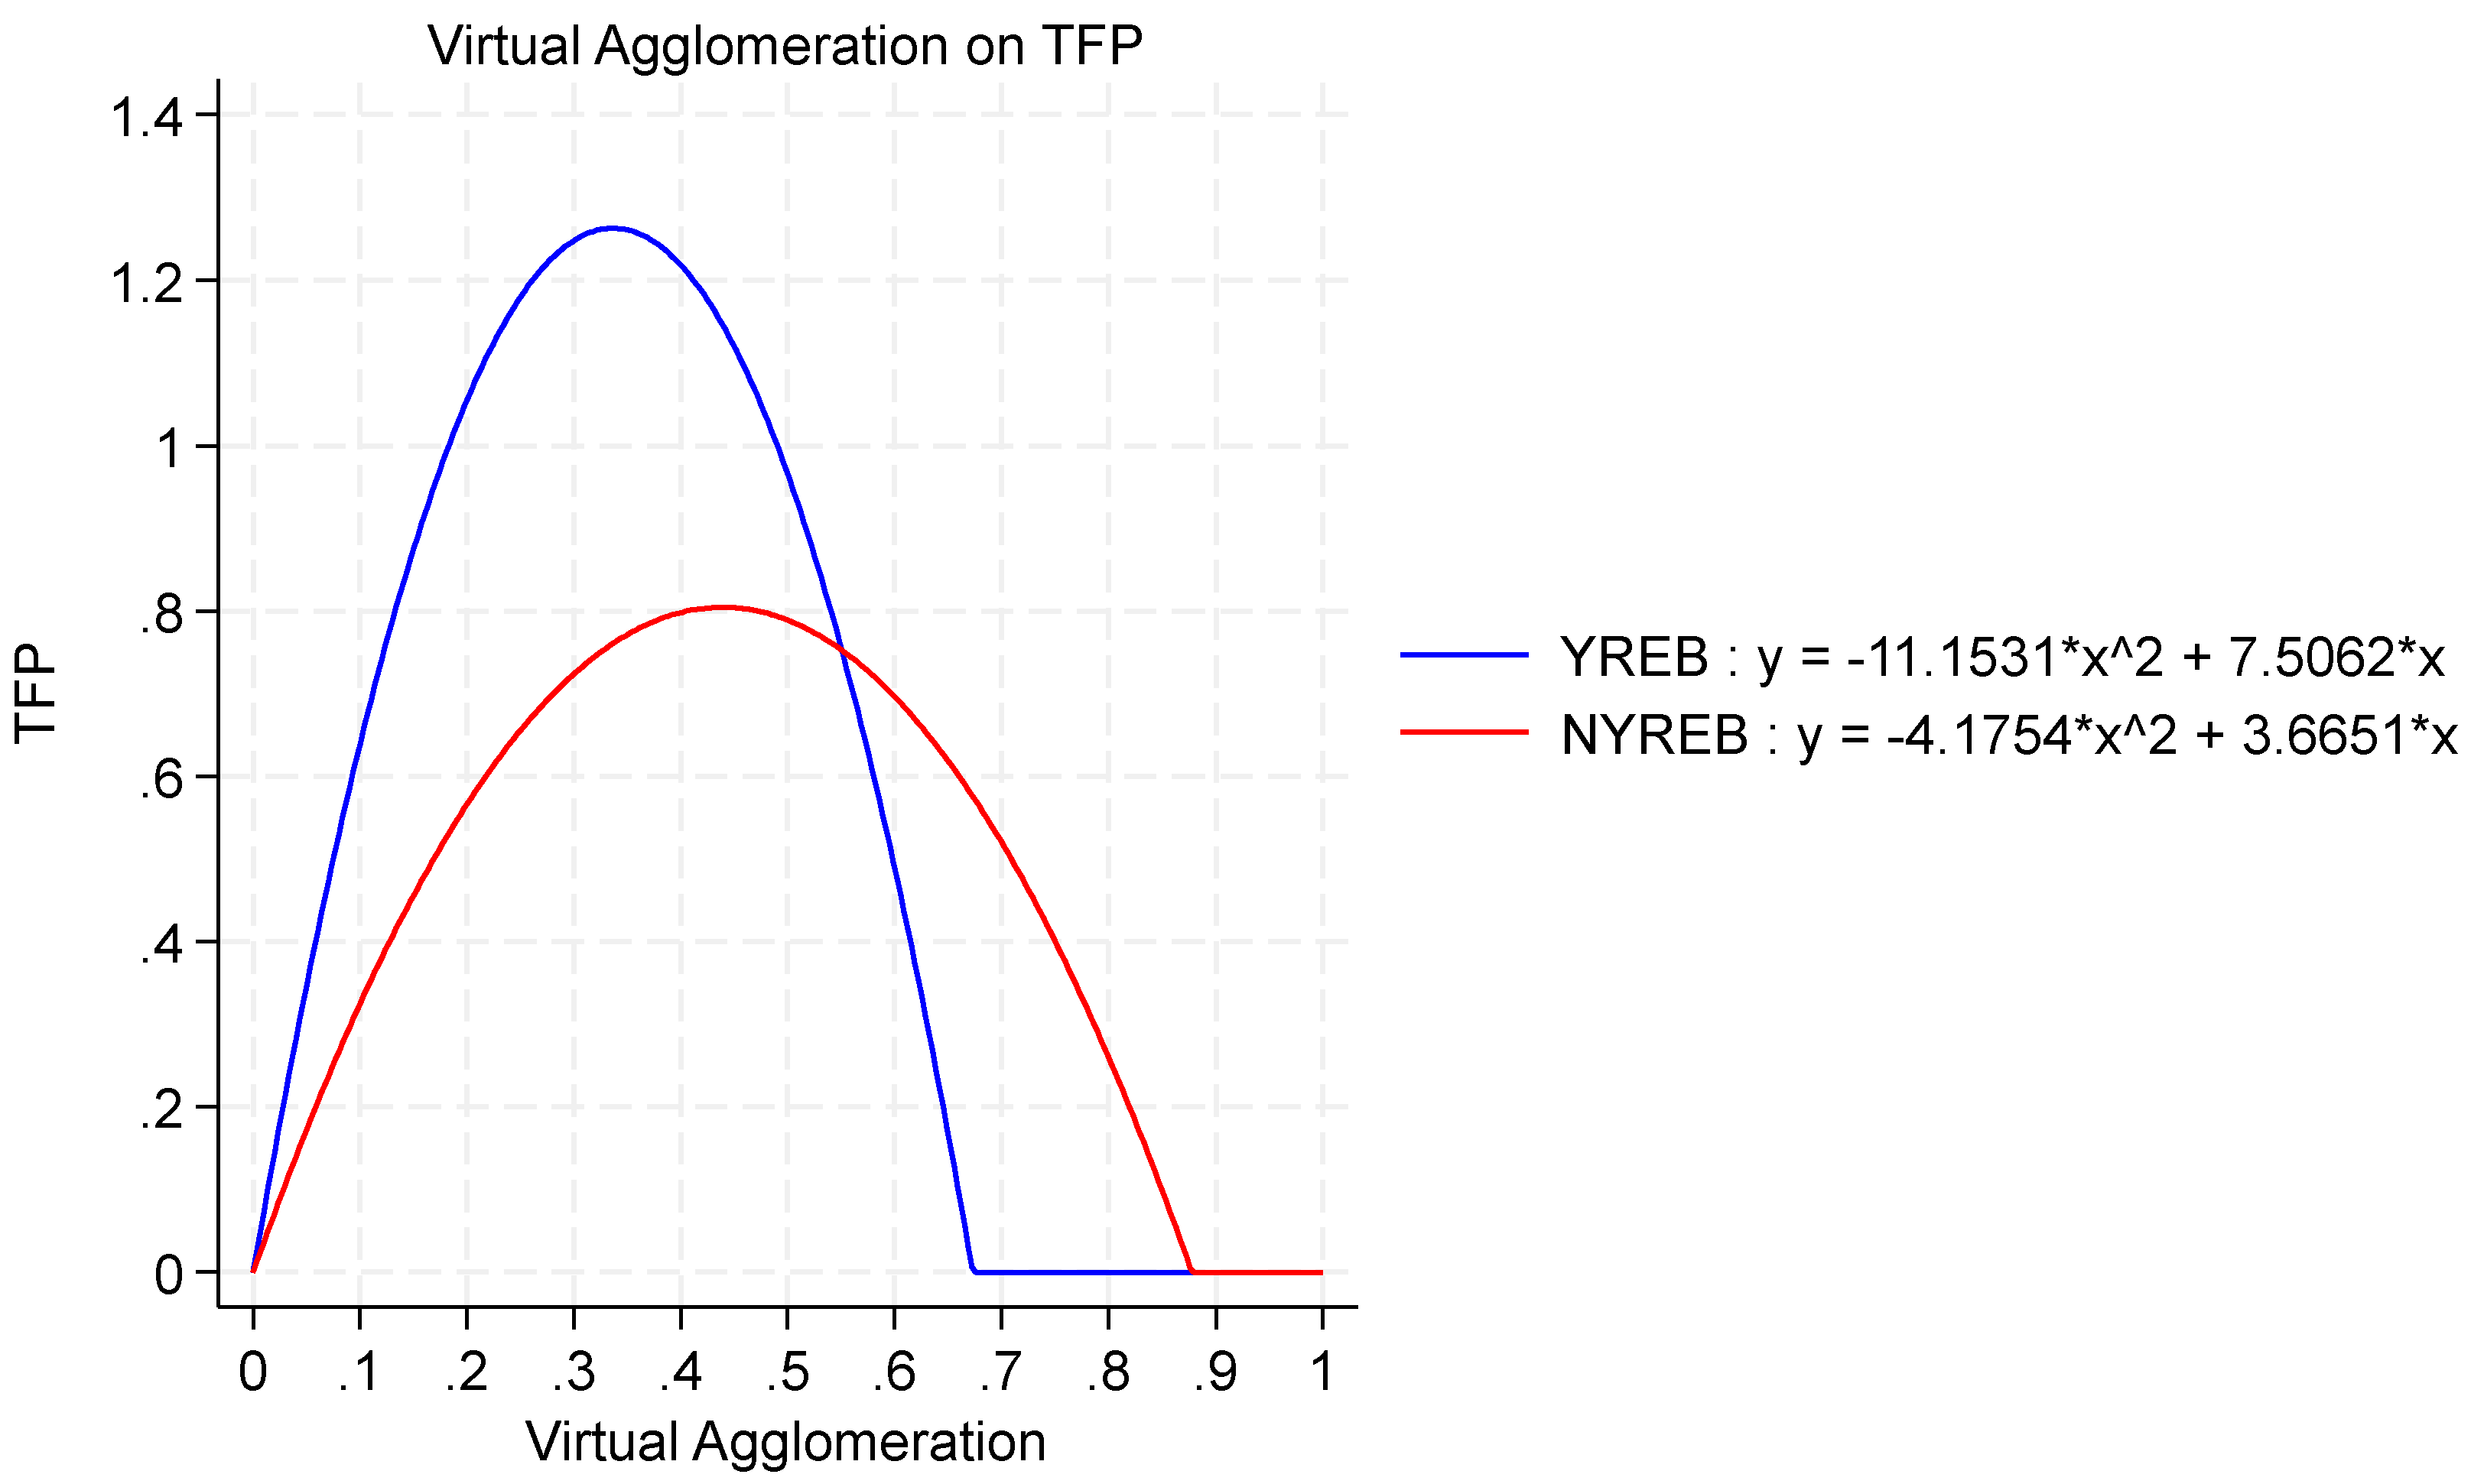
It can be seen in Table 7 that the marginal effect of virtual agglomeration on total factor productivity is larger in the Yangtze River Economic Zone than in the non-Yangtze River Economic Zone. Figure 5 shows the graph of the function assuming that the baseline regression constant is zero. According to Figure 5, it can be intuitively judged that when the marginal effect of virtual agglomeration on total factor productivity in the provinces of the Yangtze River Economic Belt (YREB) is zero, the corresponding value of the horizontal coordinate is located on the right side of the non-YREB, and and total factor productivity is also higher.
The possible explanations are as follows: First, due to the regional economic characteristics, the Yangtze River Economic Belt has abundant resources, a dense population, and developed infrastructure, which have contributed to robust industrial clusters and regional economic cooperation mechanisms. Second, influenced by the industrial structure and technological levels, this area often hosts more advanced industries and high-tech companies, which possess higher productivity and innovation capabilities. Third, owing to differences in policy support and investments, the Yangtze River Economic Belt has received more government support and input, including financial subsidies, technology innovation, and infrastructure development, enhancing the agglomeration effect and thus boosting productivity. Therefore, it is recommended that provinces within the Yangtze River Economic Belt should enhance industry upgrading and transformation, improve the technological level and added value of industries, and further strengthen the virtual agglomeration effect. Governments should formulate policies to support the development of high-tech and green low-carbon industries, guide companies to increase their investment in technological innovation and R&D, and enhance the level of virtual agglomeration. Provinces outside the Yangtze River Economic Belt should strengthen regional cooperation and coordinated development, establish cross-regional industrial cooperation mechanisms, promote resource sharing, technology exchange, and market expansion, and improve the virtual agglomeration effect.
However, it should also be noted that when the marginal virtual agglomeration effect is less than zero, that is, when the level of virtual agglomeration development reaches 0.3365, the virtual agglomeration in the Yangtze River Economic Belt provinces also shows a strong negative impact on total factor productivity. Therefore, the region needs to control the reasonable space and level of economic development driven by virtual agglomeration.

4.3.2. Second, Eastern, Chinese and Western Heterogeneity

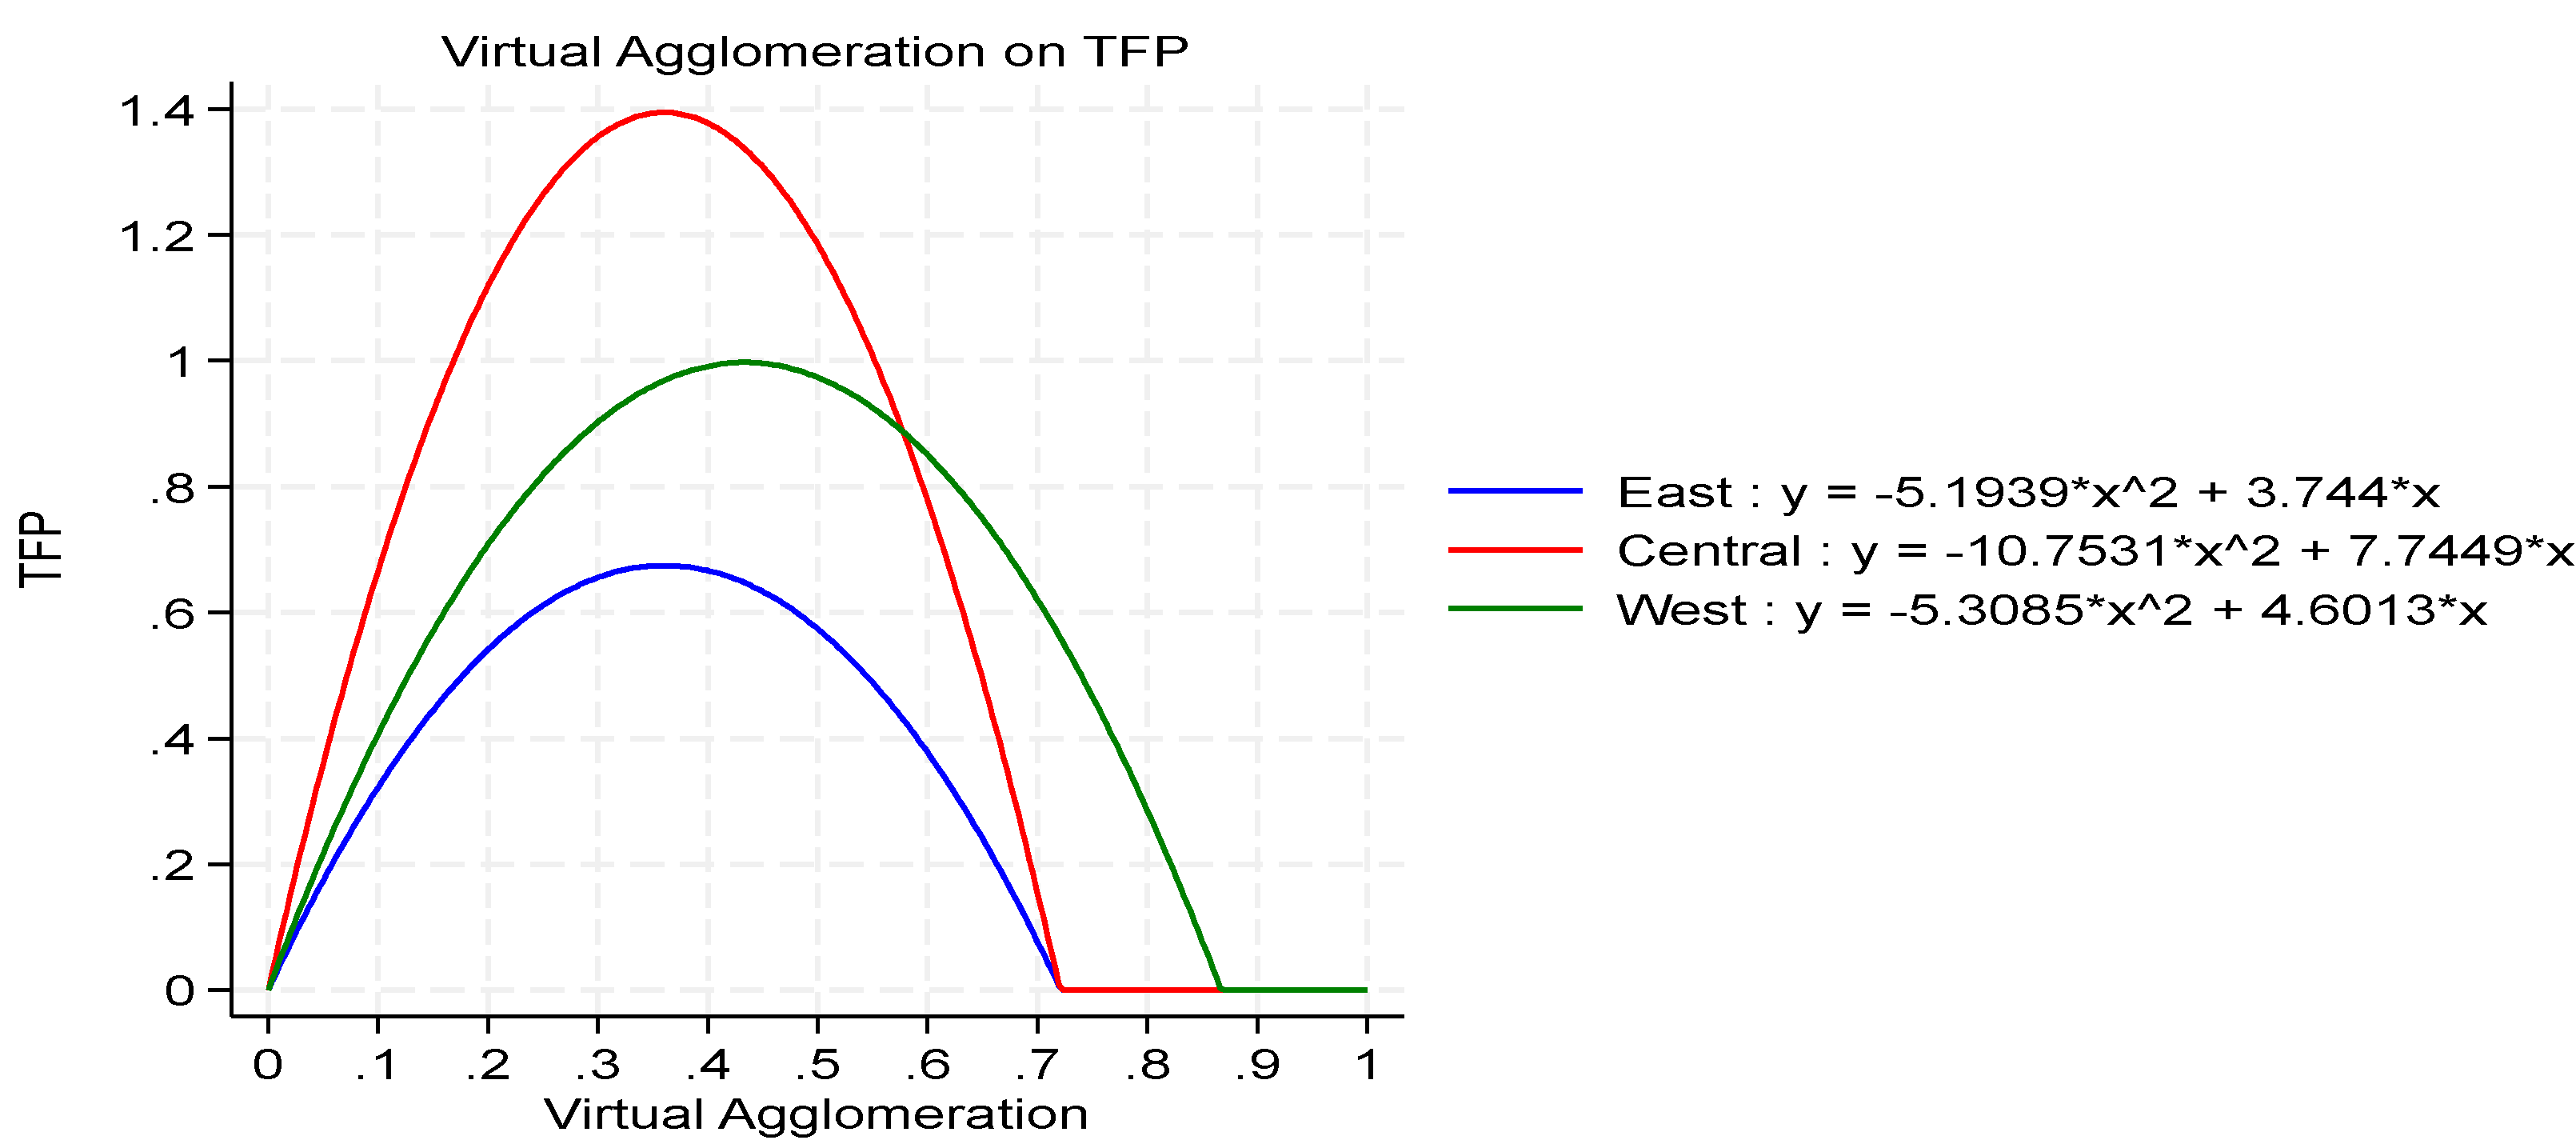
Table 8 results show that compared to the eastern and western regions, the impact of virtual agglomeration on total factor productivity is more pronounced in the central region. Figure 6 is a graphical representation assuming the baseline regression constant is zero. According to Figure 6 and the quadratic term coefficient, the optimal level of virtual agglomeration in the western provinces is significantly higher than that in the central and eastern provinces. This is related to factors such as weaker infrastructure construction, less diverse industrial structures, and lower population density in the western region. The central region has the highest total factor productivity at the optimal virtual agglomeration level, followed by the western region, and finally the eastern region. This indicates that the central region achieves more significant production efficiency and resource allocation effects when it reaches a moderate level of virtual agglomeration. A possible reason is that the central provinces, usually located between the east and west, have a locational advantage that connects these regions. This enables better integration of resources, technology, and markets from both sides, promoting industrial collaborative development and thereby forming a stronger virtual agglomeration effect. Additionally, the “Rise of the Central Region” strategy has also brought more policy support and financial investment to the central area. Therefore, policymakers can support the development of virtual agglomeration in the western region by increasing investment in informatization, improving transportation networks, and providing fiscal subsidies. For the central region, policies could further strengthen the advantages of virtual agglomeration by promoting the clustering of high-tech industries and optimizing the industrial structure.

5. Conclusion and Policy

5.1. Conclusion

As digital technology continues to evolve, the phenomenon of virtual agglomeration is becoming increasingly common, with typical patterns such as virtual agglomeration in the service and manufacturing industries gaining significant attention from both the academic and industrial communities. Based on panel data from 30 provinces in Mainland China from 2013 to 2021, comprehensive measurement indices for virtual agglomeration were constructed from four aspects: infrastructure, output, input, and services of virtual agglomeration. The relationship between virtual agglomeration and total factor productivity was also analyzed and calculated. The main conclusions are as follows:
Firstly, overall, the level of virtual agglomeration in Mainland China is at a low development stage, and there is a considerable gap from the optimal level of virtual agglomeration. Secondly, virtual agglomeration can significantly enhance regional total factor productivity, but it shows a negative marginal effect in an inverted U-shaped relationship, i.e., as virtual agglomeration increases, total factor productivity decreases after reaching its peak value. Thirdly, the effect of virtual agglomeration on total factor productivity shows economic belt heterogeneity. Provinces in the Yangtze River Economic Belt see a greater enhancement effect on total factor productivity from virtual agglomeration, but provinces outside the Yangtze River Economic Belt have higher optimal levels of virtual agglomeration. Fourthly, the promoting effect of virtual agglomeration on total factor productivity exhibits regional heterogeneity. The optimal level of virtual agglomeration in western provinces is significantly higher than that in central and eastern provinces, with the central region having the highest total factor productivity at the optimal level of virtual agglomeration.
These results confirm the complex relationship between virtual agglomeration and total factor productivity, which is an important finding in responding to the global market environment and has significant policy implications for regional industrial development. The main contribution of this paper is to empirically and theoretically confirm the nonlinear relationship and regional heterogeneity in the impact of virtual agglomeration on total factor productivity. Additionally, there is room for improvement in the study, primarily due to the availability of data. The evaluation index system for the development level of virtual agglomeration is not comprehensive enough, which may lead to biases in the measurement results. In future research, the measurement of virtual agglomeration can be refined, and a more comprehensive index system for the development level of virtual agglomeration can be constructed. Furthermore, with newly released data, the time span of the panel data can be extended for more in-depth studies.

5.2. Policy

The policy implication contained are as follows: First, considering that the problem of insufficient development levels of virtual agglomeration, to unleash the total factor productivity effects of virtual agglomeration, it is necessary to establish a long-term mechanism to ensure ensure the coherence and continuity of virtual agglomeration development and to promote the coordinated linkage of virtual agglomeration development in different regions.
Second, The development of virtual agglomeration could significantly contribute to an increase in total factor productivity. Therefore, we should should give full play to the role of virtual agglomeration in promoting total factor productivity. We should accelerate the use of big data, cloud computing, artificial intelligence, and other digital technologies to promote the development of virtual agglomeration, and vigorously build industrial internet platforms and service internet platforms. However, as the virtual agglomeration effect has a threshold, it is necessary to pay attention to the reasonable space of the virtual agglomeration economy while vigorously developing it.
Third, based on the regional heterogeneity of the relationship between virtual agglomeration and total factor productivity, emphasis should be placed on comprehensive consideration and regional coordination. The central and western regions should focus on improving the application of digital technologies and the level of virtual agglomeration by increasing the construction of new infrastructure, improving transportation networks, and providing fiscal subsidies. Actively explore virtual radiation pathways and security mechanisms in the eastern region to empower the development of the central and western regions with digital technology. Enhance the cross-regional mobility of resource elements in the eastern, central, and western regions, and through a co-construction and sharing model, drive inter-regional industrial collaboration, address the resource shortages in the central and western regions, and unleash the Metcalfe’s multiplier effect of regional cooperation.
Fourth, considering the optimal level of virtual agglomeration, it is essential to explore new paths of “virtual-real overlay” cluster development to promote the integration of virtual and physical industries. While virtual agglomeration is rapidly developing, it is necessary to guard against the risk of shifting from tangible to intangible and to explore the dynamic balance between virtual agglomeration and geographic agglomeration. The externalities of geographic agglomeration are undeniable and constitute an important pattern in China’s industrial layout and development. While promoting virtual agglomeration, the fundamental role of geographic agglomeration should not be overlooked. Using geographic agglomeration as a lever, push for the platformization of industries, online modularization, networked connections, and intelligent production. Develop rules for virtual agglomeration to lower the entry barriers to platforms; provide specialized training in virtual agglomeration to enhance the virtual agglomeration capacity of industrial entities; and formulate support policies for virtual agglomeration to reduce market risks associated with virtual agglomeration.

References

  1. Brown, D.H.; Lockett, N.J. Engaging SMEs in e-commerce: the role of intermediaries with e-cluster. Electron. Mark. 2001, 11, 52–58. [Google Scholar] [CrossRef]
  2. Vakola, M.; Wilson, I. E.The challenge of virtual organisation: critical success factors in dealing with constant change.Team Perform. Manag. 2004, 10, 112–120. [Google Scholar]
  3. Hansen, U. E-Clustering: An Innovative Approach for Economic Policy. European Regional Science Association (ERSA). 2004. [Google Scholar]
  4. James, F. Paradise. China’s Quest for Global Economic Governance Reform. J. Chin. Polit. Sci. 2019, 24, 471–493. [Google Scholar]
  5. Jin, T.; Meng, X.L. Virtual agglomeration: basic connotations, characteristics and development logic. Social Science Front. 2024, 3, 255–262. [Google Scholar]
  6. Shen, Y.; Han, M.Y.; Zhang, X.W. Assessing the Impact of Digital Technologies on Energy Efficiency: The Role of OFDI and Virtual Agglomeration.Journal of Resources and Ecology. J. Resour. Ecol. 2024, 15, 117–129. [Google Scholar]
  7. Warf, B. Telecommunications and the clustering geographies of knowledge transmission in the late 20th century. Urban Stud. 1995, 32, 361–378. [Google Scholar] [CrossRef]
  8. Gaspar, J.; Glaeser, E.L. Information technology and the future of cities. J. Urban Econ. 1998, 43, 43,136–156. [Google Scholar] [CrossRef]
  9. Capello, R.; Caragliu, A. Proximities and the intensity of scientific relations: synergies and non-linearities. Int. Reg. Sci. Rev. 2018, 41, 7–44. [Google Scholar] [CrossRef]
  10. Pan, W.R.; Xie, t.; Wang, Z.W.; Ma, L.W. Digital economy: An innovation driver for total factor productivity. J. Bus. Res. 2022, 139, 303–311. [Google Scholar] [CrossRef]
  11. Muzzi, C.; Albertini, S. Management competencies in an innovation community. R&D Manag. 2015, 45, 196–211. [Google Scholar]
  12. Chen, X.Y. Virtual Transformation of Industrial Cluster. China Ind. Econ. 2017, 12, 78–94. [Google Scholar]
  13. Wang, H.Y.; Liang, Q.; Li, G.Q. Virtual agglomeration: a new form of spatial organisation for the deep integration of new-generation information technology and the real economy. Manag. World. 2018, 34, 13–21. [Google Scholar]
  14. Zhao, C.M.; Ban, Y.H.; LI, H.B.; Liu, Y. Can VA Promote the Quality Upgrade of Urban Export Products. Bus. Manag. J. 2022, 44, 23–41. [Google Scholar]
  15. Ren, W.W.; Liang, Q.H. Virtual agglomeration and firms’ export domestic value added rate-based on upstream and downstream linkage perspective. J. Int. Trade. 2022, 11, 53–68. [Google Scholar]
  16. Ru, S.F.; Liu, H.Z. New Infrastructure Construction, Industrial VA and Coordinated Development of regional Economy. J. Harbin Univ. Commer. (Soc. Sci. Ed.). 2022, 38, 104–115. [Google Scholar]
  17. Liu, Y.; Wang, Q.; Ban, Y.H. Virtual agglomeration, knowledge structure and Chinese urban innovation. Financ. Trade Econ. 2023, 44, 89–105. [Google Scholar]
  18. Duan, X.; Zhang, Q.W. Industrial Digitalization,VA and TFP. J. Northwest Norm. Univ. (Soc. Sci.). 2023, 81, 134–144. [Google Scholar]
  19. Zhang, Q.; Ru, S.F.; Huang, H.Y. Research on the impact of manufacturing virtual agglomeration on green total factor productivity of enterprises under the Sustainable Development Goals. Environ. Sci. Pollut. Res. 2024, 31, 5484–5499. [Google Scholar] [CrossRef]
  20. Liu, S.; He, W.J.; Chen, X.Y.; Xie, J.Y. Virtual Agglomeration of Producer Services and the Changing Geography of Innovation Systems: Implications for Developing Countries. J. Serv. Sci. Manag. 2020, 13, 408–419. [Google Scholar] [CrossRef]
  21. Chen, X.; Liu, C.H.; Jiang, Y.; Gao, C.C. What Causes the Virtual Agglomeration of Creative Industries? Sustain. 2021, 13, 9232. [Google Scholar] [CrossRef]
  22. Zhang, Q.; Ru, S.F.; Zhao, Z.G. The Impact of Digital Economy on Technological Innovation of Manufacturing Enterprises from the Perspective of Virtual Agglomeration: Evidence from China. Hradec Econ. Days. 2023, 01, 929–942. [Google Scholar]
  23. Wang, R.Y.; Liang, Q. Realistic foundation and application of Virtual agglomeration in digital economy. J. Chang’an Univ. (Soc. Sci. Ed.). 2022, 24, 34–52. [Google Scholar]
  24. Goldfarb, A.; Tucker, C. Digital Economics. Journal of Economic Literature. 2019, 57, 3–43. [Google Scholar] [CrossRef]
  25. Clemons, E.K.; Reddi, S.P.; Row, M.C. The Impact of Information Technology on the Organization of Economic Activity: The “Move to the Middle” Hypothesis.J. Manag. Inf. Syst. 1993, 9–35. [Google Scholar] [CrossRef]
  26. Shen, Y.; Han, M.Y.; Zhang, X.W. Assessing the Impact of Digital Technologies on Energy Efficiency: The Role of OFDI and Virtual Agglomeration. J. Resour. Ecol. 2024, 15, 117–129. [Google Scholar]
  27. Lin, H.L.; LI, H.Y.; Yang, C.H. Agglomeration and productivity: Firm-level evidence from China’s textile industry. China Econ. Rev. 2011, 22, 313–329. [Google Scholar] [CrossRef]
  28. Cheng, Z.H.; Li, X.; Zhu, Y.M.; Wang, M.X. The effects of agglomeration externalities on urban green total-factor productivity in China. Econ. Syst. 2023, 22, 101025. [Google Scholar] [CrossRef]
  29. Li, X.H.; Xu, Y.Y.; Yao, X. Effects of industrial agglomeration on haze pollution: A Chinese city-level study. Energy Policy. 2021, 148, 111928. [Google Scholar] [CrossRef]
  30. Brakman, S.; Garretsen, H.; Gigengack, R. .; Van Marrewijk, C.; Wagenvoort, R.. Negative feedbacks in the economy and industrial location. J. Regional Sci. 1996, 36, 631–651. [Google Scholar] [CrossRef]
  31. Keller, W. . Geographic localization of international technology diffusion. Am. Econ. Rev. 2002, 92, 120–142. [Google Scholar] [CrossRef]
  32. Jin, G.; Yu, B.B.; Shen, K.R. Domestic trade and energy productivity in China: An inverted U-shaped relationship. Energy Economics. Energy Econ. 2021, 97, 105234. [Google Scholar] [CrossRef]
  33. Tian, L.; Zhang, S.J. A Study of the Measurement, Spatial Differences and Convergence of Virtual Agglomeration in China. J. Zhejiang Univ. (Humanit. Soc. Sci.). 2023, 53, 75–97. [Google Scholar]
  34. Nie, J.; Jian, X.; Xu, J.; Xu, N.; Jian, T.Y.; Yu, Y. The effect of corporate social responsibility practices on digital transformation in China: A resource-based view. Econ. Anal. Policy. 2024, 82, 82,1–15. [Google Scholar] [CrossRef]
  35. Steven, S.; Jeremy, H.; Roy, S.; David, A.; Jiang, W. Technology, entrepreneurship, innovation and social change in digital economics. Technovation. 2023, 119, 102484. [Google Scholar]
  36. Zhao, S.; Zhang, L.; An, H.; Peng, L.; Zhou, H.; Hu, F. Has China’s low-carbon strategy pushed forward the digital transformation of manufacturing enterprises? Evidence from the low-carbon city pilot policy. Environ. Impact Assess. Rev. 2023, 102, 107184. [Google Scholar] [CrossRef]
  37. Bai, L.; Guo, T.R.; Xu, W.; Liu, Y.B.; Kuang, M.; Jiang, L. Effects of digital economy on carbon emission intensity in Chinese cities: A life-cycle theory and the application of non-linear spatial panel smooth transition threshold model. Energy Policy. 2023, 183, 113792. [Google Scholar] [CrossRef]
  38. Acemoglu, D.; Johnson, S.; Robinson, J. The Colonial Origins of Comparative Development: An Empirical Investigation. Am. Econ. Rev. 2001, 91, 1369–1401. [Google Scholar] [CrossRef]
Figure 1. heoretical model.
Preprints 112434 g001
Figure 2. The virtual agglomeration level of province.
Preprints 112434 g002
Figure 3. The virtual agglomeration level of China.
Preprints 112434 g003
Figure 4. Simple causal relationship diagram.
Preprints 112434 g004
Figure 5. Heterogeneity of the Yangtze River Economic Belt.
Preprints 112434 g005
Figure 6. Regional heterogeneity.
Preprints 112434 g006
Table 1. The construction of virtual agglomeration index.
Dimension Definitions Indicator code
VA Infrastructure level Density of long-haul fiber optic cable line L_dis
Density of average Internet broadband access port INTACC
Density of cellular base stations MOBDEN
The number of internet domain per 1,000 population INTDO
Proportion of IPv4 addresses PROIPV4
VA output level percentage of e-commerce sales E_GDP_P
percentage of e-commerce procurement EP_GDP_P
percentage of total postal and telecommunications business POTELE
percentage of software business revenue SOFTRE
percentage of e-commerce transaction enterprises PROE_COM
VA Input Levels Number of computers per 100 people NUMCOMP
Number of websites per 100 enterprises NUMSOFTP
Internet broadband penetration rate INTPEN
Telephone penetration rate TELEPEN
Percentage of fixed asset investment in information transmission, software and technology services INFINV
VA Service Levels Percentage of urban units’ employment in information transmission, software, and information services INFEMP_P
Digital inclusive finance index DFINDEX
Degree of digitization. DIDEGREE
Source: Compiled by the authors.
Table 2. Summary statistics.
Variable Definition Mean S.D Max Min
l n E C O Per capita GDP. 10.5262 0.9142 11.6691 5.7483
I S S Industrial structure upgrade 1.3879 0.7632 5.2968 0.5644
H I Human capital investment 0.1612 0.0258 0.2099 0.0989
T R A degree of openness 0.2818 0.3018 1.4632 0.0028
V A virtual agglomeration 0.1342 0.1069 0.6988 0.0197
T F P TFP 0.5952 0.2703 1.4184 0.1017
Source: Compiled by the authors.
Table 3. The level of virtual agglomeration.
virtual agglomeration province
high Beijing,Shanghai,Guangdong,Zhejiang,Jiangsu,Tianjin,Fujian
medium Shandong,Liaoning,Hainan,Shanxi,Chongqing,Sichuan,Hebei,Anhui
low Henan,Jilin,Jiangxi,Hunan,Shanxi,Guizhou, Ningxia,Guangxi,Yunnan, Gansu, Heilongjiang, Inner Mongolia, Xinjiang, Qinghai.
Table 4. Baseline regression results.
Variables (1) (2)
T F P T F P
V a g g 2 -4.9319***
(0.7140)
-4.4884***
(0.8793)
V a g g 4.3223***
(.0550)
3.7468***
(.6022)
l n E C O .0131
(.0151)
l n I S S .1516**
(.0511)
l n H I 0.4862***
(.0821)
l n T R A -0.0122
(0.0202)
Year YES YES
R-squared 0.3857 0.4720
Note: Standard errors in parentheses. ***p < 0.01, **p < 0.05, *p < 0.1.
Table 5. Alternative estimation method of TFP.
Variables (1) (2)
T F P  (RE) T F P  (RE)
V a g g 4.6423***
(.4446)
3.7551
(0.5985)
V a g g 2 -5.6459***
(.7144)
-4.7491***
(.8739)
l n E C O .0009
(.0150)
l n I S S .1300**
(0.0508)
lnHI .4884***
(.0816)
lnTRA .0046
(0.0200)
Year YES YES
R-squared 0.3825 0.4765
Table 6. Endogenous test.
Variables (1) V a g g (2) V a g g 2
L n ( t o p o g r a p h × y e a r ) -.0802***
(.0153)
-0.0415***
(0.0102)
L n ( t o p o g r a p h × y e a r ) 2 .0061
(.0013)
.0034***
(.0009)
Controls YES YES
R-squared 0.6231 0.5269
Second stage
T F P T F P
V a g g 14.3787**
(6.6757)
6.5560**
(2.9244)
V a g g 2 -28.4641**
(15.2531)
-12.7418**
(6.0805)
Controls YES YES
Table 7. Yangtze River Economic Belt Heterogeneity test.
Variables (1) (2) (3) (4)
Yangtze River Economic Belt Non-Yangtze Economic Belt
T F P T F P T F P T F P
V a g g 6.3562***
(1.7164)
7.5062***
(2.4681)
4.0856***
(1.009)
3.6651***
(1.0998)
V a g g 2 -9.0383***
(2.7929)
-11.1531***
(3.9398)
-4.2833***
(1.4272)
-4.1754***
(1.4835)
l n E C O -.0021
(.0152)
.0138
(.0173)
l n I S S .2149
(.1636)
.1869**
(0.1046)
l n H I .6961***
(.2320)
0.4293
(0.1931)
l n T R A -.0652
(.0837)
-.0223
(.0386)
Year fixed YES YES YES YES
R-squared 0.4001 0.5323 0.4422 0.5129
Table 8. Regional heterogeneity.
Variables East Central West
T F P T F P T F P
(1) (2) (3) (4) (5) (6)
V a g g 4.0257***
(1.2983)
3.7440***
(1.5451)
6.3296***
(1.5864)
7.7449*** (1.5053) 4.4096***
(1.0868)
4.6013***
(1.3230)
V a g g 2 -4.9464**
(2.0566)
-5.1939***
(2.3514)
-8.8392***
(2.6375)
-10.7531***
(2.2769)
-4.4556***
(1.4003)
-5.3085***
(1.7126)
l n E C O 0.0037
(0.0171)

-.0196
(.0343)
.0131
(.0097)
l n I S S 0.1805
(.1139)
.0919
(.1619)
.3079***
(.1018)
l n H I .3939**
(.2061)
.5720**
(.3326)
.4373**
(.1707)
l n T R A -.0010
(.0450)
-.0828
(.0774)
-.0530
(.0364)
Year fixed YES YES YES YES YES YES
R-squared 0.3432 0.4085 0.5159 0.6061 0.5061 0.6120
Disclaimer/Publisher’s Note: The statements, opinions and data contained in all publications are solely those of the individual author(s) and contributor(s) and not of MDPI and/or the editor(s). MDPI and/or the editor(s) disclaim responsibility for any injury to people or property resulting from any ideas, methods, instructions or products referred to in the content.
Copyright: This open access article is published under a Creative Commons CC BY 4.0 license, which permit the free download, distribution, and reuse, provided that the author and preprint are cited in any reuse.
Prerpints.org logo

Preprints.org is a free preprint server supported by MDPI in Basel, Switzerland.

Subscribe

© 2024 MDPI (Basel, Switzerland) unless otherwise stated