1. Introduction
Wildfires are natural events occurring mostly during dry and hot season in various places around the world such as North and South America, Europe, Russia, Australia, South and Southeast Asia. In addition to wildfires occurring in forest or grassland, biomass waste burnings also occur in many agricultural places such as China, South Asia (including India, Pakistan), the US, South America and Southeast Asia. These fires either due to natural events or to farmers disposing the agricultural residues before the starting of the new crop season emit large amount of pollutants and greenhouse gases concentration to the atmosphere. Air pollution is associated with adverse health outcomes to people exposed to air pollutants such as ozone, particulate matter, nitrogen dioxides [
1,
2]. In particular, particulate matter with size less than 2.5 μm in diameter (PM
2.5), once inhaled can go to the blood stream, is known to have high detrimental health outcomes especially in high-risk groups, such as those with cardio-respiratory diseases. Elevated morbidity (respiratory, cardio-vascular diseases hospitalization), and mortality are associated with exposure to PM
2.5 and Black Carbon (BC). Increases in hospital emissions and emergency dispatches during high smoke periods is evident [
3,
4,
5]. Aguilera et al. 2021 [
6] have found that PM
2.5 in wildfire smoke adversely impacts human health more than equal doses of ambient PM
2.5 from other sources following from recent toxicological studies. They isolated the wildfire-specific PM
2.5 using a series of statistical approaches and exposure definitions and found that increases in respiratory hospitalizations ranging from 1.3 to up to 10% with a 10 μg/m
3 increase in wildfire-specific PM
2.5, compared to 0.67 to 1.3% associated with non-wildfire PM
2.5
Peninsular Southeast Asia is a major source of pollutants emitted during biomass burnings of agricultural waste and forest fires at the end of the dry season before the start of the monsoon. Smoke aerosols from the fires in SEA have been known to not only affected the SEA region but also were transported further afield to southern China, Taiwan, the Philippines, and western North Pacific Ocean [
7,
8,
9]. Globally, emitted particles such as Black Carbon (BC) and Brown Carbon (BrC) due to incomplete combustion of biomass or fossil fuel can change the radiation budget by absorbing light and in turn affect the climate. Kumar Pani et al. 2021 [
10] studied the BrC as measured by aethalometer in Chiang Mai, Northern Thailand has found strong association of biomass burnings in the region at the end of the dry season in March to April 2016 with BrC light absorption measurements at Chiang Mai site.
The climate of peninsular Southeast Asia (SEA) is mostly tropical which is hot and humid except mountainous Laos and northern Vietnam which is sub-tropical with distinct seasons. The summer monsoon from April to October brings rain to the region and is the main driver to agricultural activities. This rainy season annually from April to October is source of life and the beginning of the summer monsoon is celebrated as water festival (Songkran Festival) in Thailand and Laos. In the month just before the summer monsoon, after the dry season from November to March, farmers burn agricultural residues in preparing for the new cropping activities in all countries of mainland SEA including Myanmar. During March, much of SEA is covered in smokes as detected by satellites such as MODIS Aqua/Terra with many hot spots of biomass fires.
In their study of the health risks from landscape fire emissions in SEA from 1997 to 2006 using satellite data and modelling to quantify health effects, Marlier et al. 2013 [
11] have shown that, during strong El Niño years when less rain and more fires occur, an estimated 10,800 (6,800–14,300) person (∼ 2%) annual increase in regional adult cardiovascular mortality. Frankenberg et al. 2005 [
12] studied the effect of the 1997 uncontrolled fires in Sumatra and Kalimantan (Indonesia) forests caused by slash-burn agricultural practices exacerbated by drought and late monsoon delay due to the 1997 El-Niño year. They used satellite haze data combined with population survey data to determine the population exposure to haze and the consequent health effect. Their results showed that haze had a negative impact on these dimensions of health such as respiratory morbidity. The same event also caused extensive smoke haze pollution in nearby Singapore where Emmanuel 2001 [
13] had studied the haze effect on population health of this city. There was a 30% increase in outpatient attendance and an increase of PM
10 levels from 50 μg/m
3 to 150 μg/m
3 was significantly associated with increases of 12% of upper respiratory tract illness, 19% asthma and 26% rhinitis. But there was no significant increase in hospital admissions or in mortality and the health effects from the 1997 smoke haze in Singapore were generally mild.
Elsewhere the impact on air quality and human health of forest and vegetation fires in 2012 Amazon basin of South America was studied by [
14] and the wildfires in Australia during the Black Summer fires from November 2019 to January 2020 by [
15]. In Butt et al. 2020 [
14] study, they used the exposure-response relationships and a regional climate-chemistry model to provide the first in-depth assessment of the potential public health benefits due to fire prevention across the Amazon Basin. Their results showed that if the biomass burnings did not occur 16,800 (95UI: 16 300–17 400) premature deaths and 641,000 with upper and lower uncertainty intervals at the 95% confidence level (95UI: 551,900–741,300) disability adjusted life years (DALYs) across South America would be avoided, with 26% of the avoided health burden located within the Amazon Basin. Accordingly, they stated that the health benefits of fire prevention in the Amazon are comparable to those found in Equatorial Asia. The results of Nguyen et al. 2021 [
15] on population exposure and health impact for the event of Black Summer wildfires in east coast of Australia are December 2019 had the most impact on population health. For New South Wales, the most populous state, the total mortality estimates for the period from 1 November to 8 January 2020 when the wildfires were most active was about 247 (95UI: 89, 409) premature deaths, 437 (95UI: 81, 984) cardiovascular diseases hospitalizations and 1535 (95UI: 493, 2087) respiratory diseases hospitalizations. In a systemic review of many studies across the world related to health impact of wildfires, Reid et al. 2016 [
16] had concluded that consistent evidence from a large number of studies indicates that wildfire smoke exposure is associated with respiratory morbidity with growing evidence supporting an association with all-cause mortality.
It is expected therefore that large scale agricultural burnings and forest fires at the driest period near the end of the dry season in SEA have a large impact on air quality and adverse public health to the population in the region.
In our previous study [
9], the WRF-Chem air quality model and the FINN (Fire Emission Inventory from NCAR) emission dataset was used to determine the dispersion pattern of air pollutants such as PM
10, PM
2.5 and BC and their effect on air quality during 13 to 20 March 2019 peak period of the annual biomass burnings in peninsular SEA at the end of the 2019 dry season. The WRF-Chem model has been widely employed by various researchers to examine the air quality impacts due to biomass burnings in SEA such as [
17,
18,
19,
20].
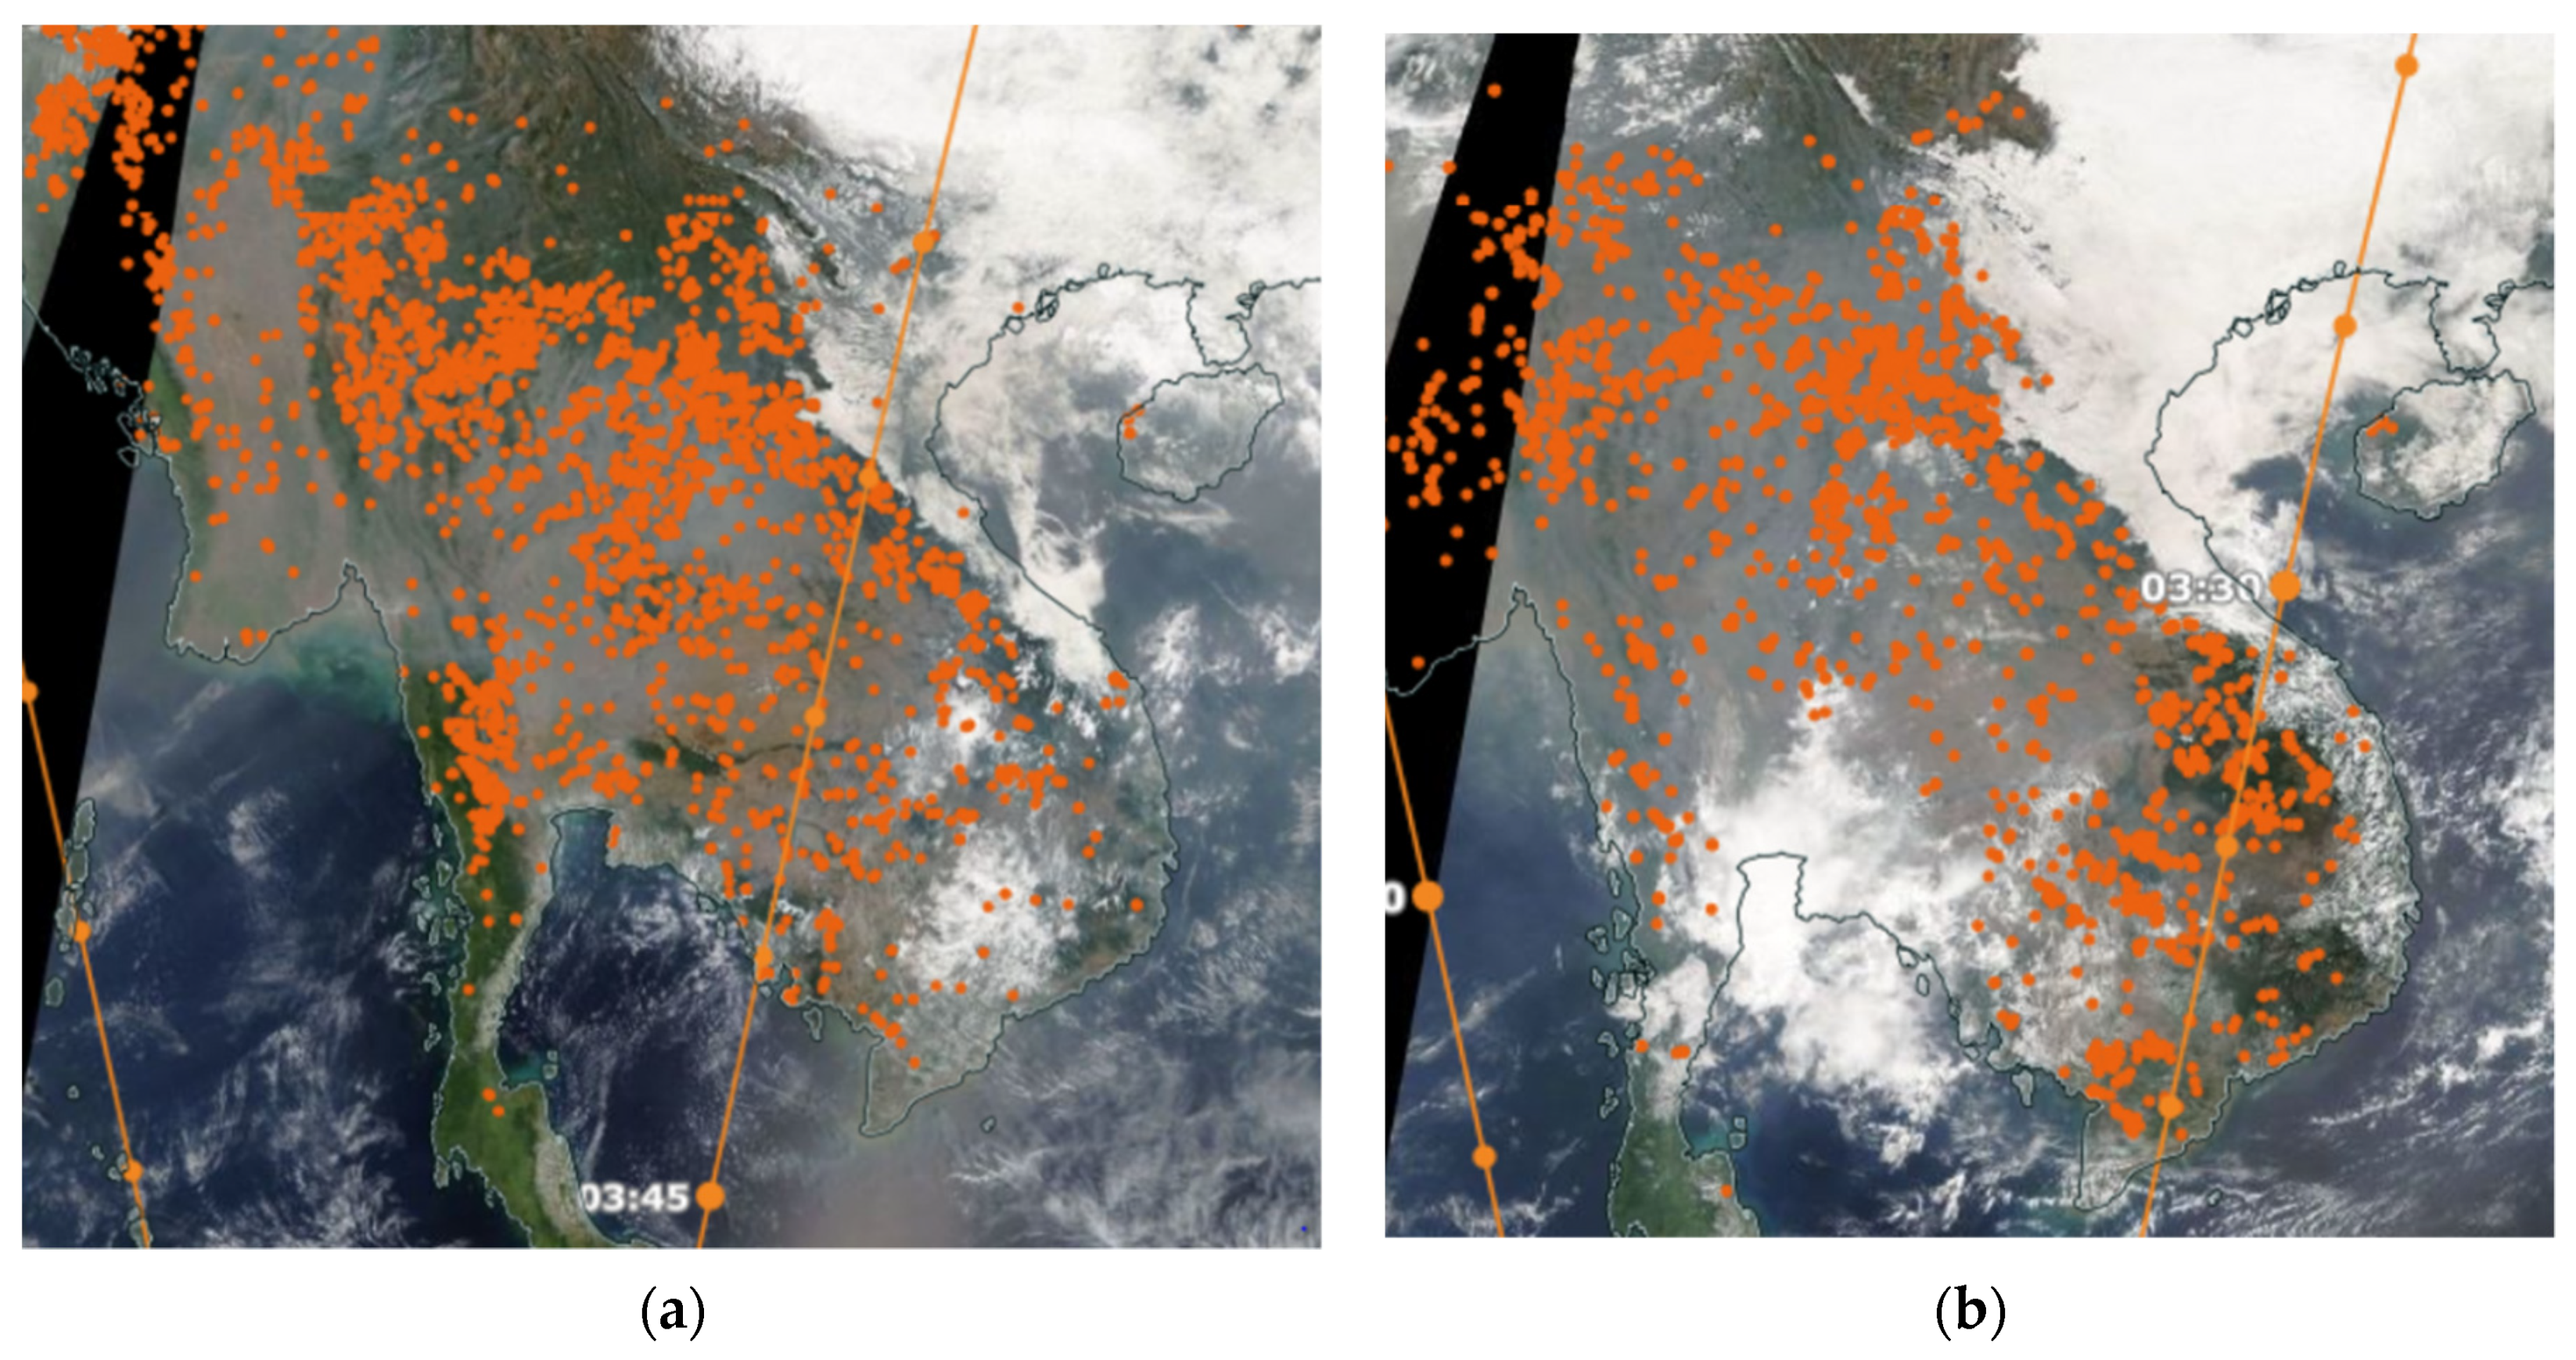
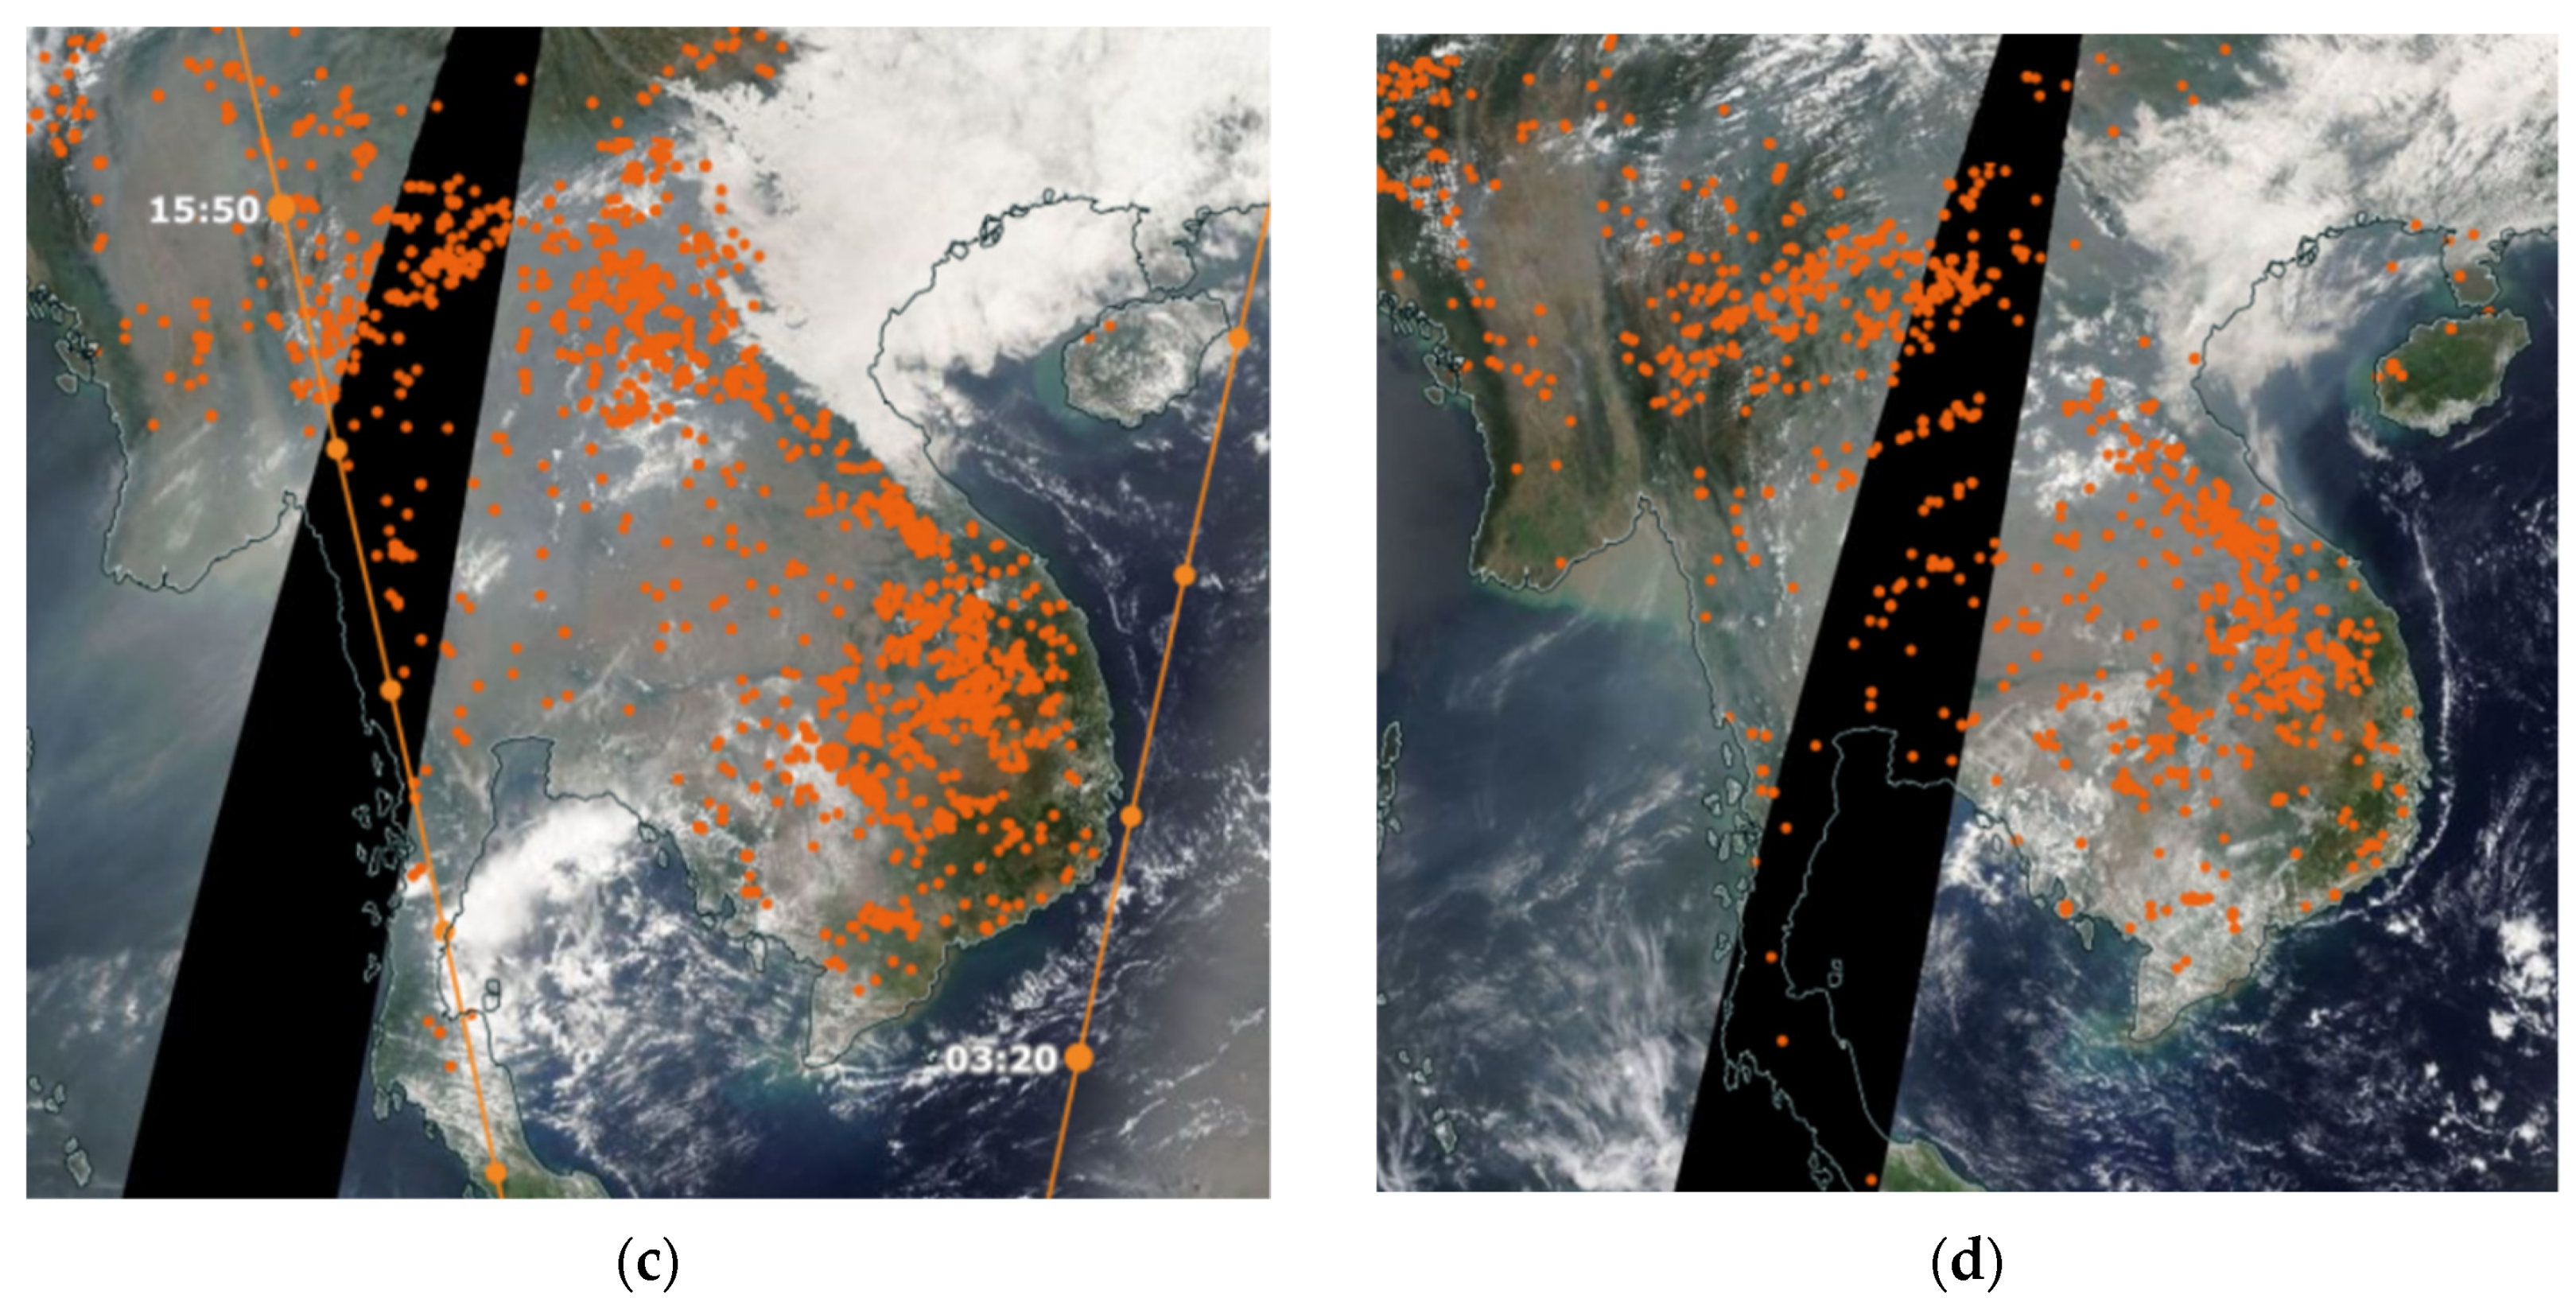
Figure 1 shows the fires and thermal anomalies or hot spots from fires as detected by MODIS sensor onboard Terra/Aqua satellites over Southeast Asia on 14, 16, 18 and 20 March 2019 when intense biomass burnings occurred with smoke covered most of SEA especially in Thailand and Laos.
In this study, we aim to estimate the population exposure and health impact due to the emission and transport of air pollutants from biomass burnings over the regional population centres where pollutant concentration can significantly affect the population in each of the four countries in SEA (Thailand, Laos, Vietnam and Cambodia) during the peak fire period in March 2019. Short-term effects of exposure to the smoke particles from biomass burnings in SEA such as PM
2.5 and PM
10 can have an impact on the population health such as increasing mortality rate, respiratory and cardiac diseases hospitalisations. Khan et al. 2016 [
21], in their study of PM
2.5 from fires, its composition using plasma mass spectroscopy (ICP-MS) and ion chromatography (IC), to determine the source apportionment using positive matrix factorization (PMF) and access the health risk in Malaysia from this analysis. They found that the PM
2:5 concentration was slightly higher during the north-east monsoon compared to south-west monsoon. The south-west monsoon from May to late October is more important in influence of rainfall weather in peninsular SEA (Myanmar, Thailand, Laos, Vietnam and Cambodia) than the north-east monsoon which affects maritime SEA including Malaysia and Indonesia.
As the biomass burnings in March 2019 had significant impact on air quality across the whole peninsular SEA [
9] and hence on the population exposure, health and economic cost, we use this period of intense burnings to estimate the impact of the biomass burnings on premature mortality of the exposed population, in the four most affected countries (Thailand, Laos, Vietnam and Cambodia) in the peninsular Southeast Asian region. The results have important implication for public health policy in these countries and the need to develop policy to mitigate the health impact and the associated economic lost and health care cost due to widespread biomass burnings annually at the end of the dry season.
2. Data and Methods
Air quality model have been used extensively to study the dispersion and transport of air pollutants from emission sources and meteorological input. Most air quality models used are using either WRF-CMAQ or WRF-Chem. Ooi et al. 2021 [
7] recently used WRF-CMAQ to study the dispersion of transport of emitted pollutants from biomass burnings in Southeast Asia. They used FINN as the estimated emission of pollutants (gaseous and solid) from fires detected by MODIS Aqua/Terra satellites.
In this study, the air quality model WRF-Chem (Version 4.2) in conjunction of Fire Emission Inventory from NCAR (FINN) is used to study the dispersion of pollutant emission from fires during biomass burnings in March 2019. The FINNv1.5 emission database contains fire emission data at 1 km resolution derived from MODIS Rapid Response fire count (Fire Information for Resource Management System, FIRMS) and VIIRS (Visible Infrared Imaging Radiometer Suite) hot spots [
22,
23]. Based on the emission calculation algorithm, the emission data of many pollutant species are provided by NCAR on the daily basis at hourly resolution and can be downloaded and then converted into WRF emission input files.
The emission data are available for three air chemistry mechanism and therefore are in three formatted files with suitable chemical species for GEO-Chem (Goddard Earth Observing System with Chemistry), SAPRC99 (Statewide Air Pollution Research Center Mechanism) and MOZART (Model for Ozone and Related chemical Tracers) mechanism. These emission files are downloadable from the NCAR Research Data Archive:
https://rda.ucar.edu/datasets/ds312.9/, accessed 7 March 2024). The current FINN version is FINNv2.5 which has a better global coverage, spatial resolution. It uses an updated algorithm for determining fire size by aggregating adjacent fire detections and updated emission factors [
23]. Similar to our previous study on the March 2019 biomass burnings, we use fire emission data in FINNV1.5 based on MODIS satellite (1km resolution). Option to use the high resolution (375m) measurements from VIIRS instrument on board the Suomi National Polar-orbiting Partnership (Suomi-NPP) satellite is also available in the newer FINNV2.5 version since 2022. In this study we use WRF-Chem air quality model which has gas phase MOZART and aerosol MOSAIC (Model for Simulating Aerosol Interactions and Chemistry) 4-bin option implemented. For this reason, the fire emission data set for MOZART gas phase photochemistry mechanism from FINNV1.5 is used. These files are already in the species format and with available conversion tool can be converted to be used as input to the WRF-Chem model.
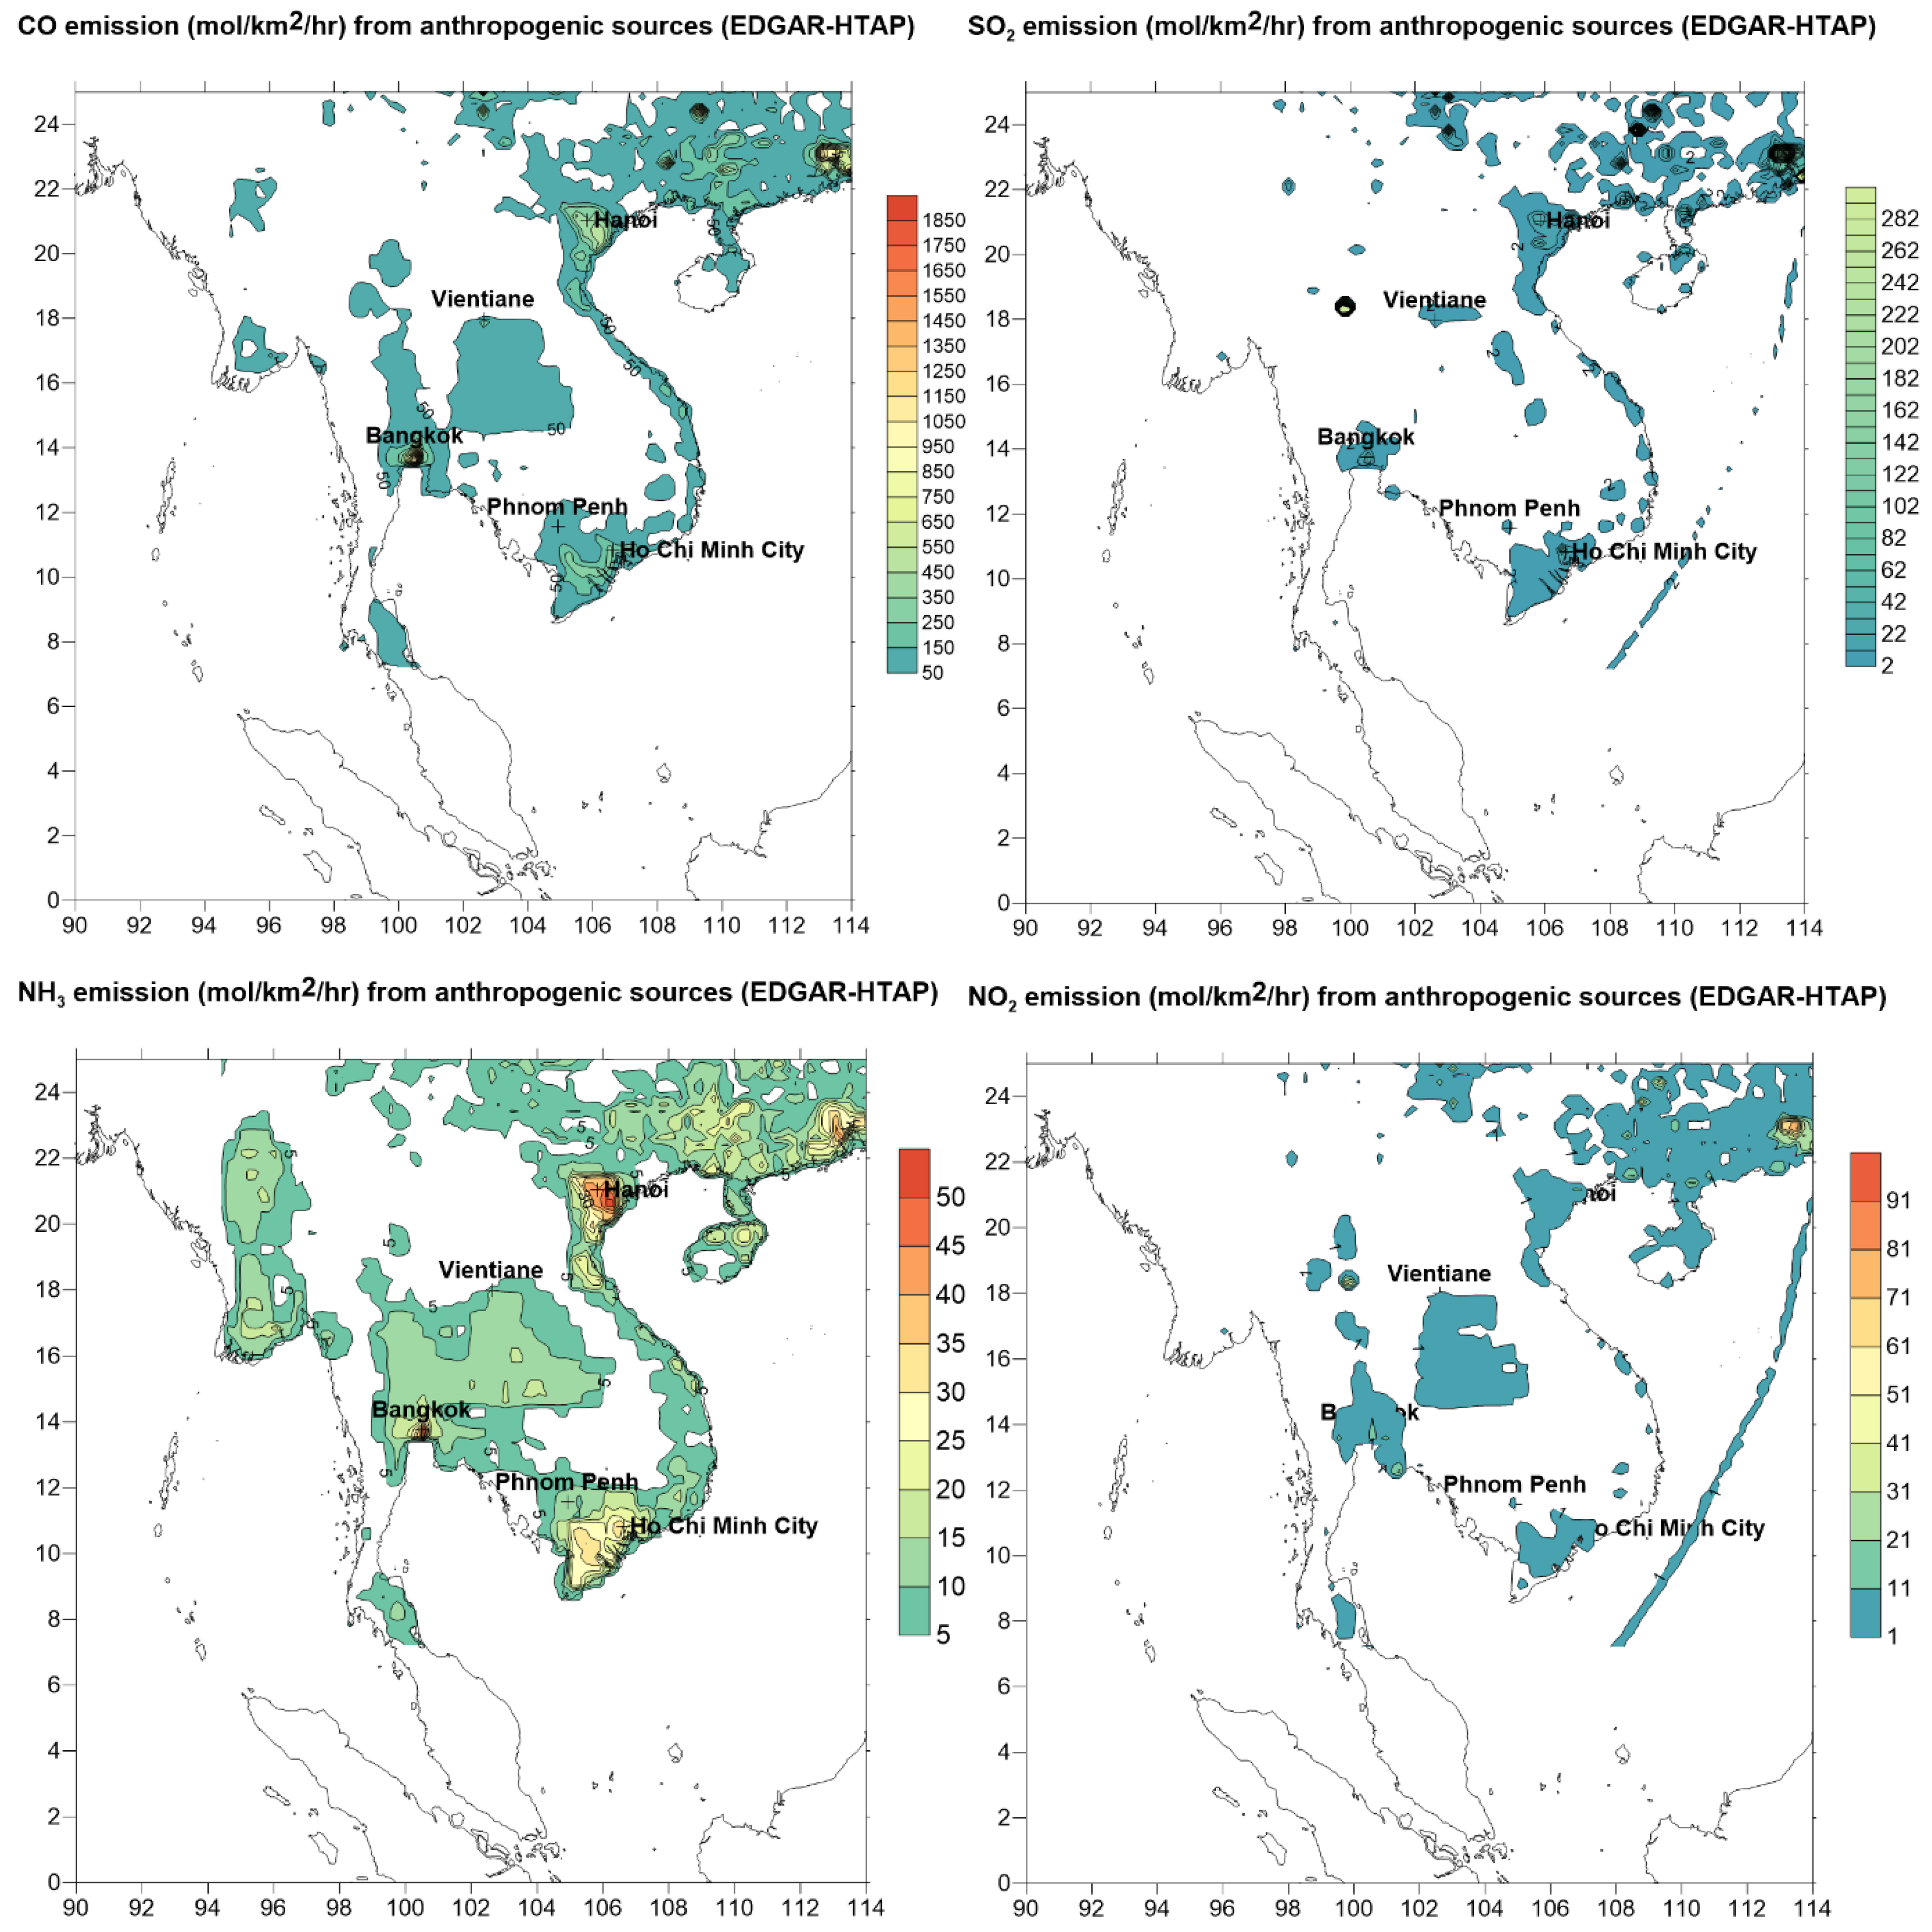
Besides FINN emission sources, anthropogenic emission sources such as land and shipping transport based on global EDGAR-HTAP dataset is also used. During the most intense of the biomass burnings in March 2019, the contribution of anthropogenic emission to aerosol dispersion and concentration at ground and above ground level is much lower than the emission from biomass burnings [
9]. WRF-Chem also requires host meteorological data for downscaling to higher resolution simulation domain the meteorological prediction, which is used for dispersion, transport and via chemistry module the chemical reaction of gaseous and particulate pollutants to form secondary pollutants. The NCEP FNL (National Centers for Environmental Prediction, Final Analysis) reanalysis meteorological data are used as input to the WRF-Chem model to simulate the transport and dispersion of emitted pollutants from biomass burnings in SEA.
We use the same domain configuration and WRF-Chem options as in our previous study [
9].
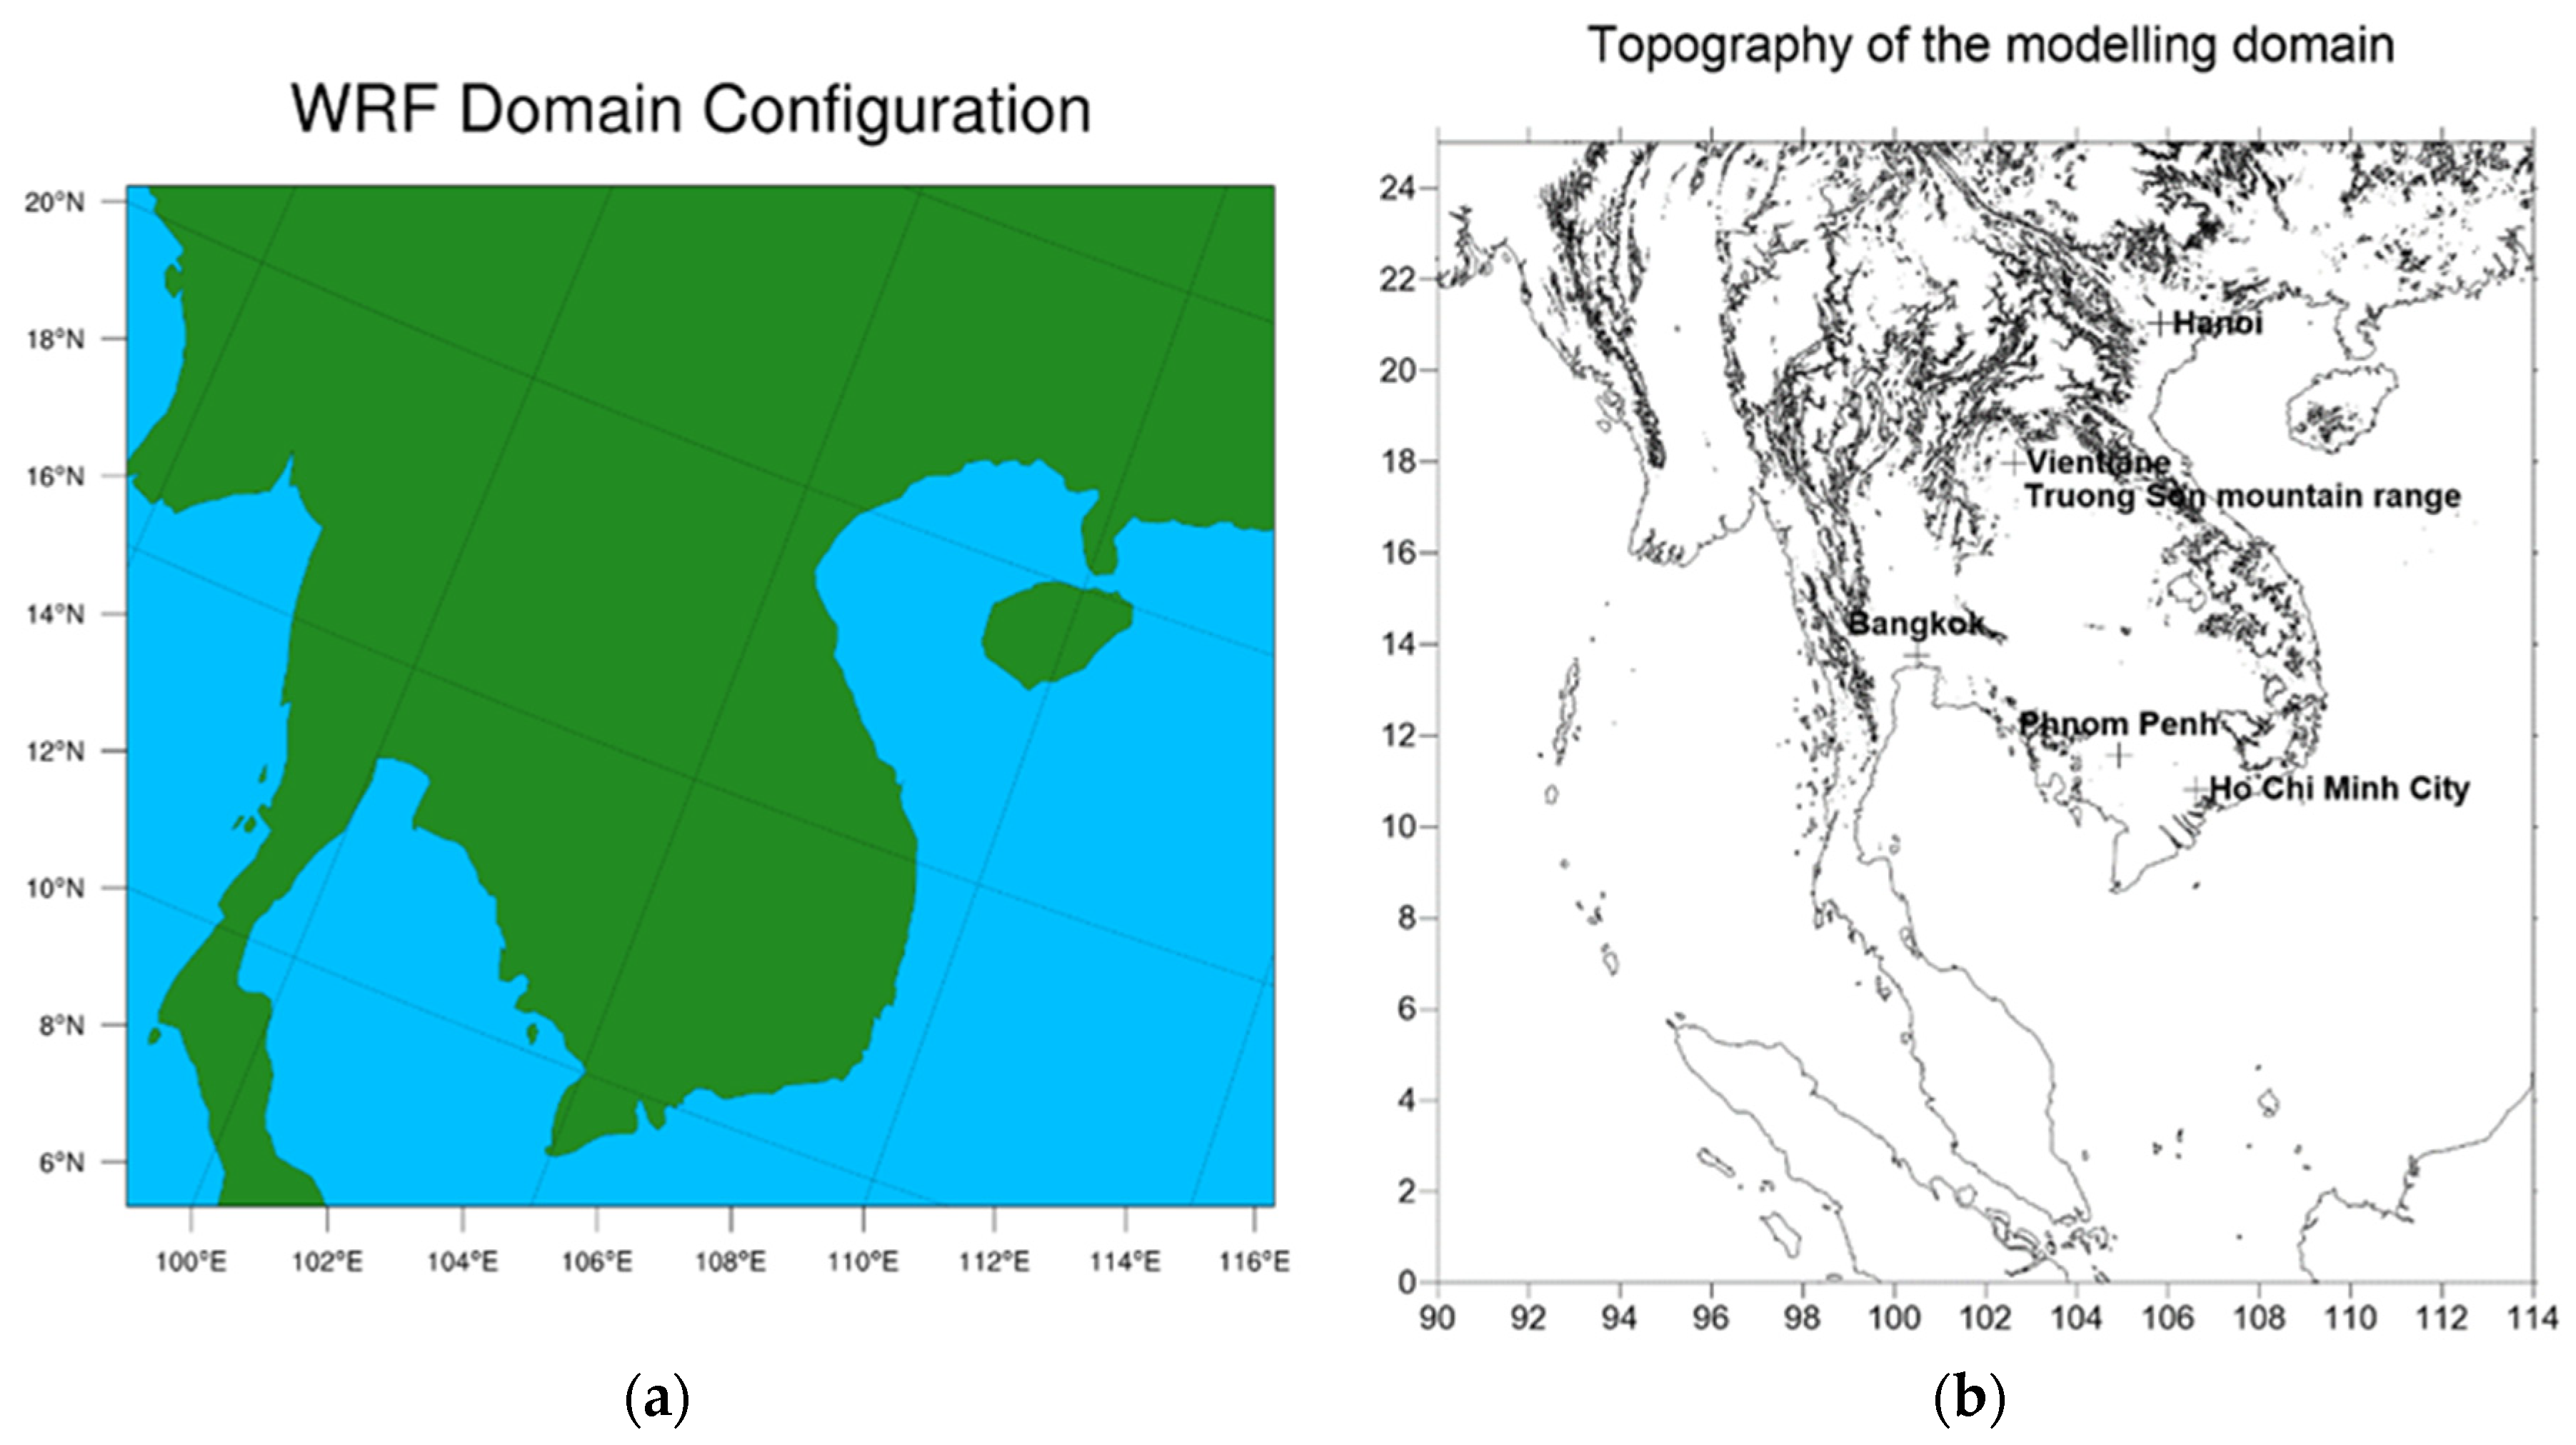
Figure 2 shows the domain configuration and
Table 1 shows some of the WRF-Chem physics and chemistry configuration options. The domain size is 354 x 315 with grid resolution dx=0.057729
o and dy = 0.057651
o (about 6km x 6km) , ‘lat-lon’ map projection, and reference domain centre as ref_lat = 16.274
o, ref_lon = 104.594
o.
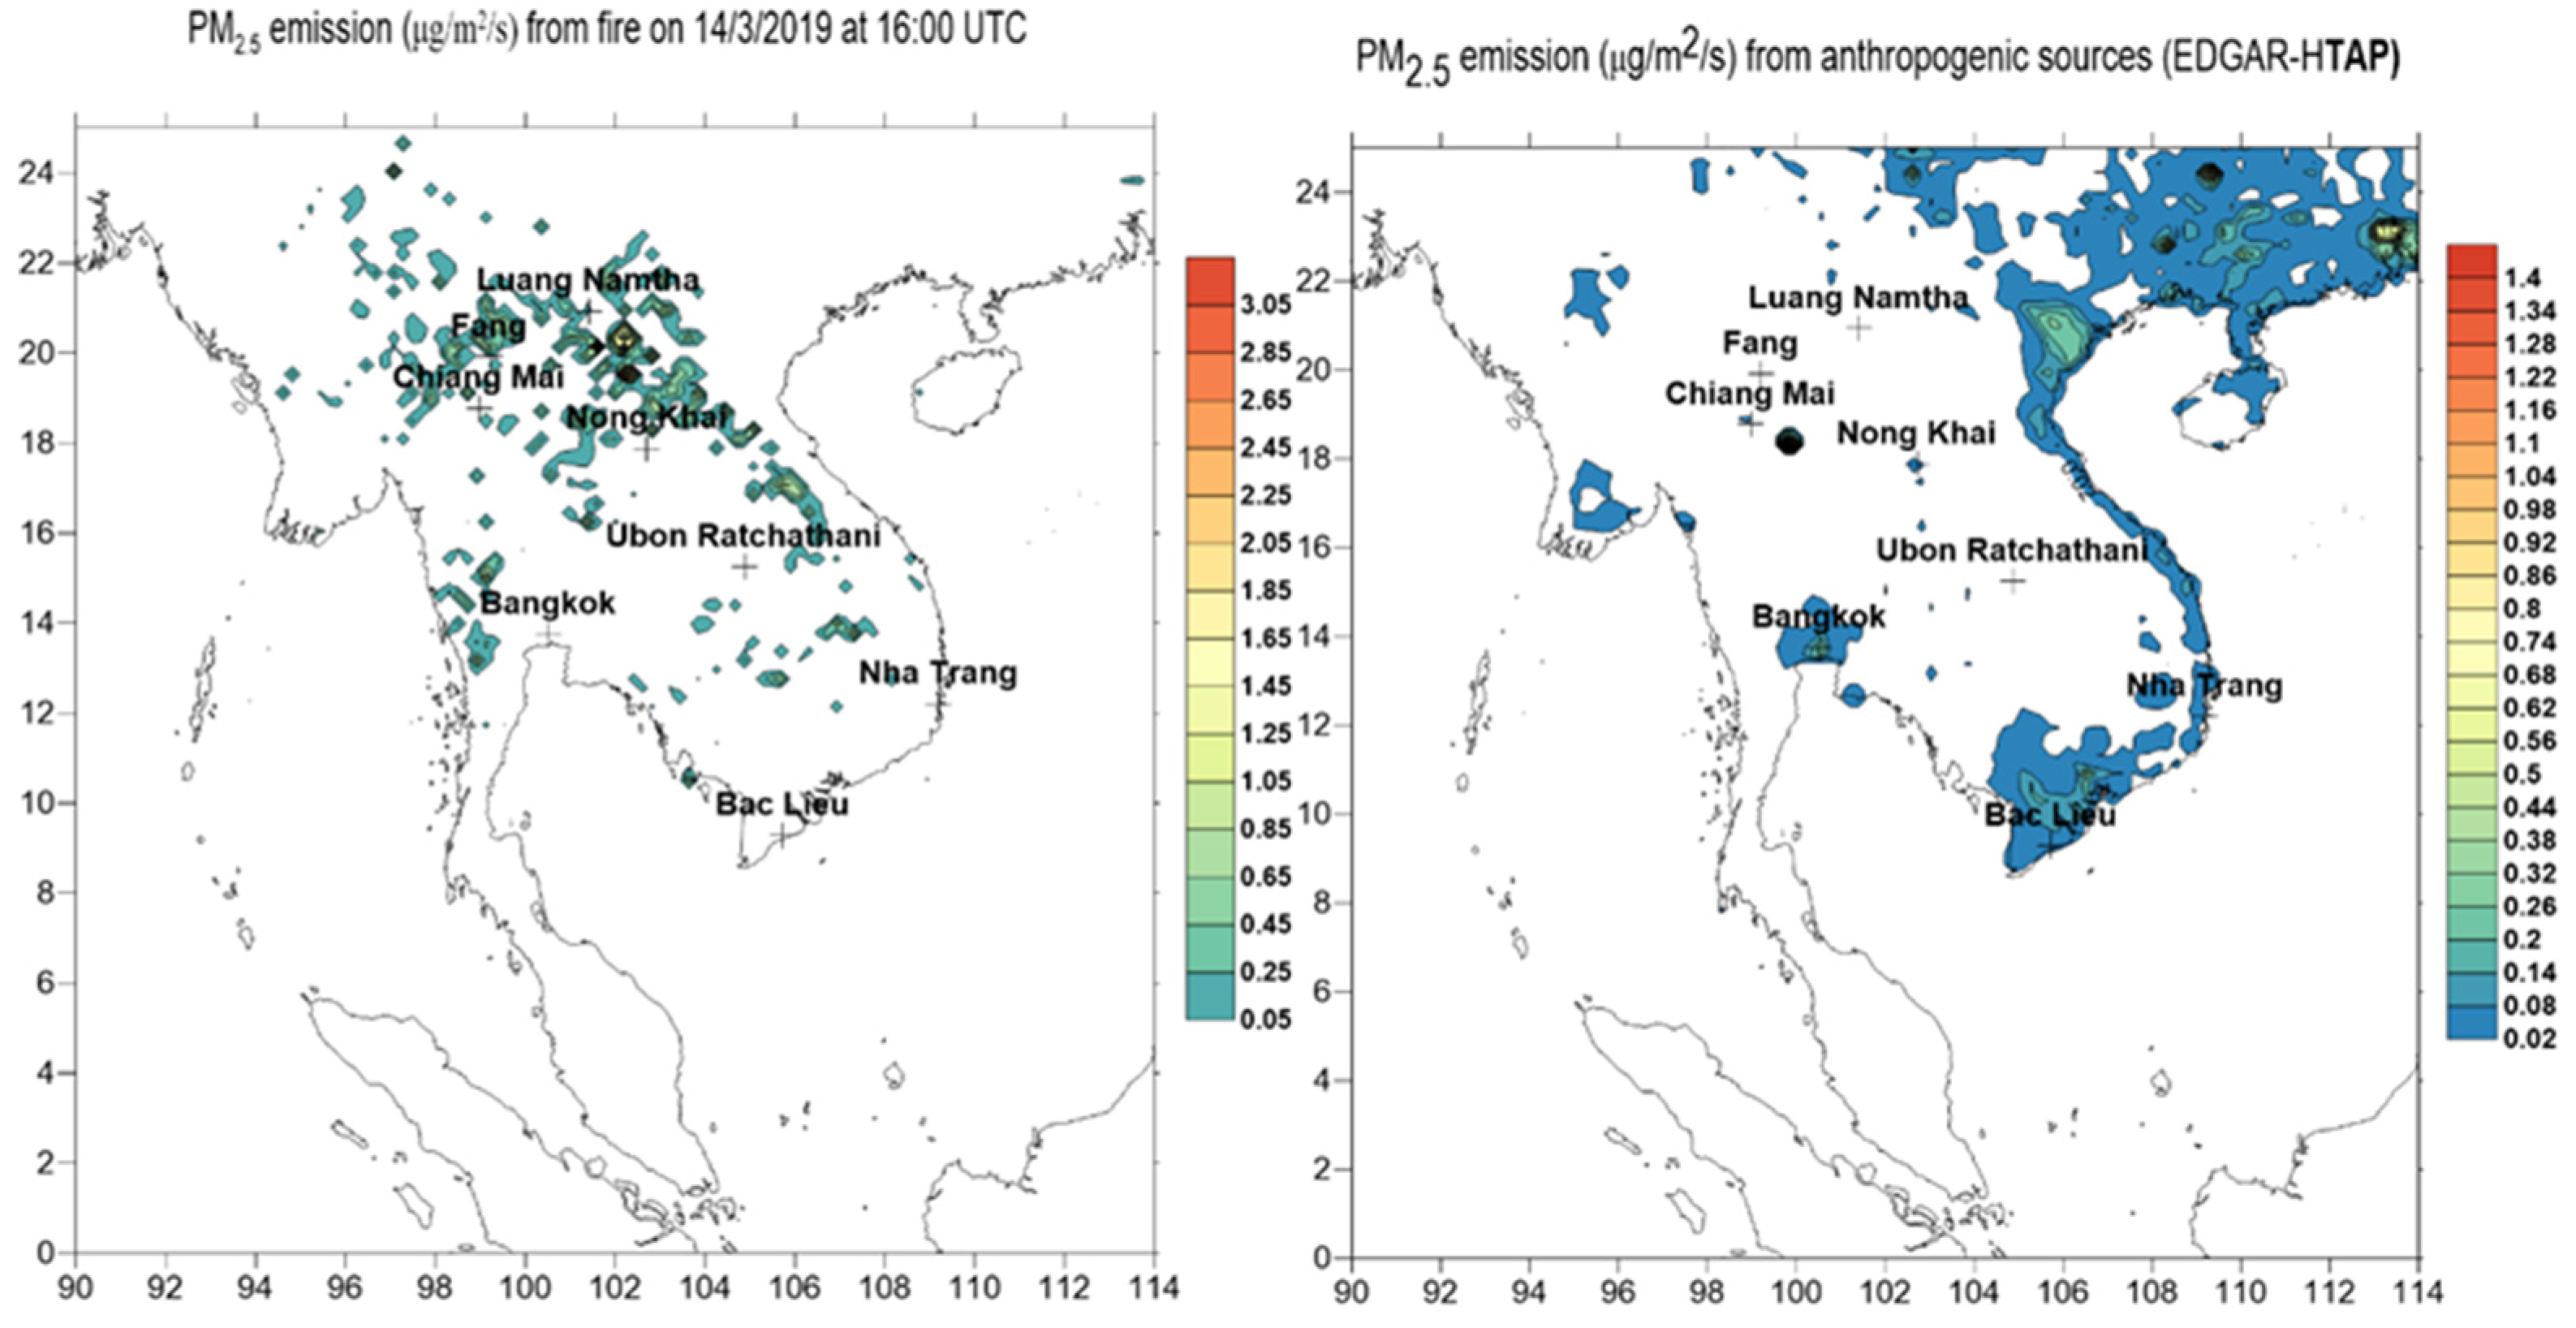
Figure 3 shows the pattern of PM
2.5 hourly emission from biomass burnings as provided by FINN and the daily anthropogenic PM
2.5 emission from EDGAR-HTAP. The PM
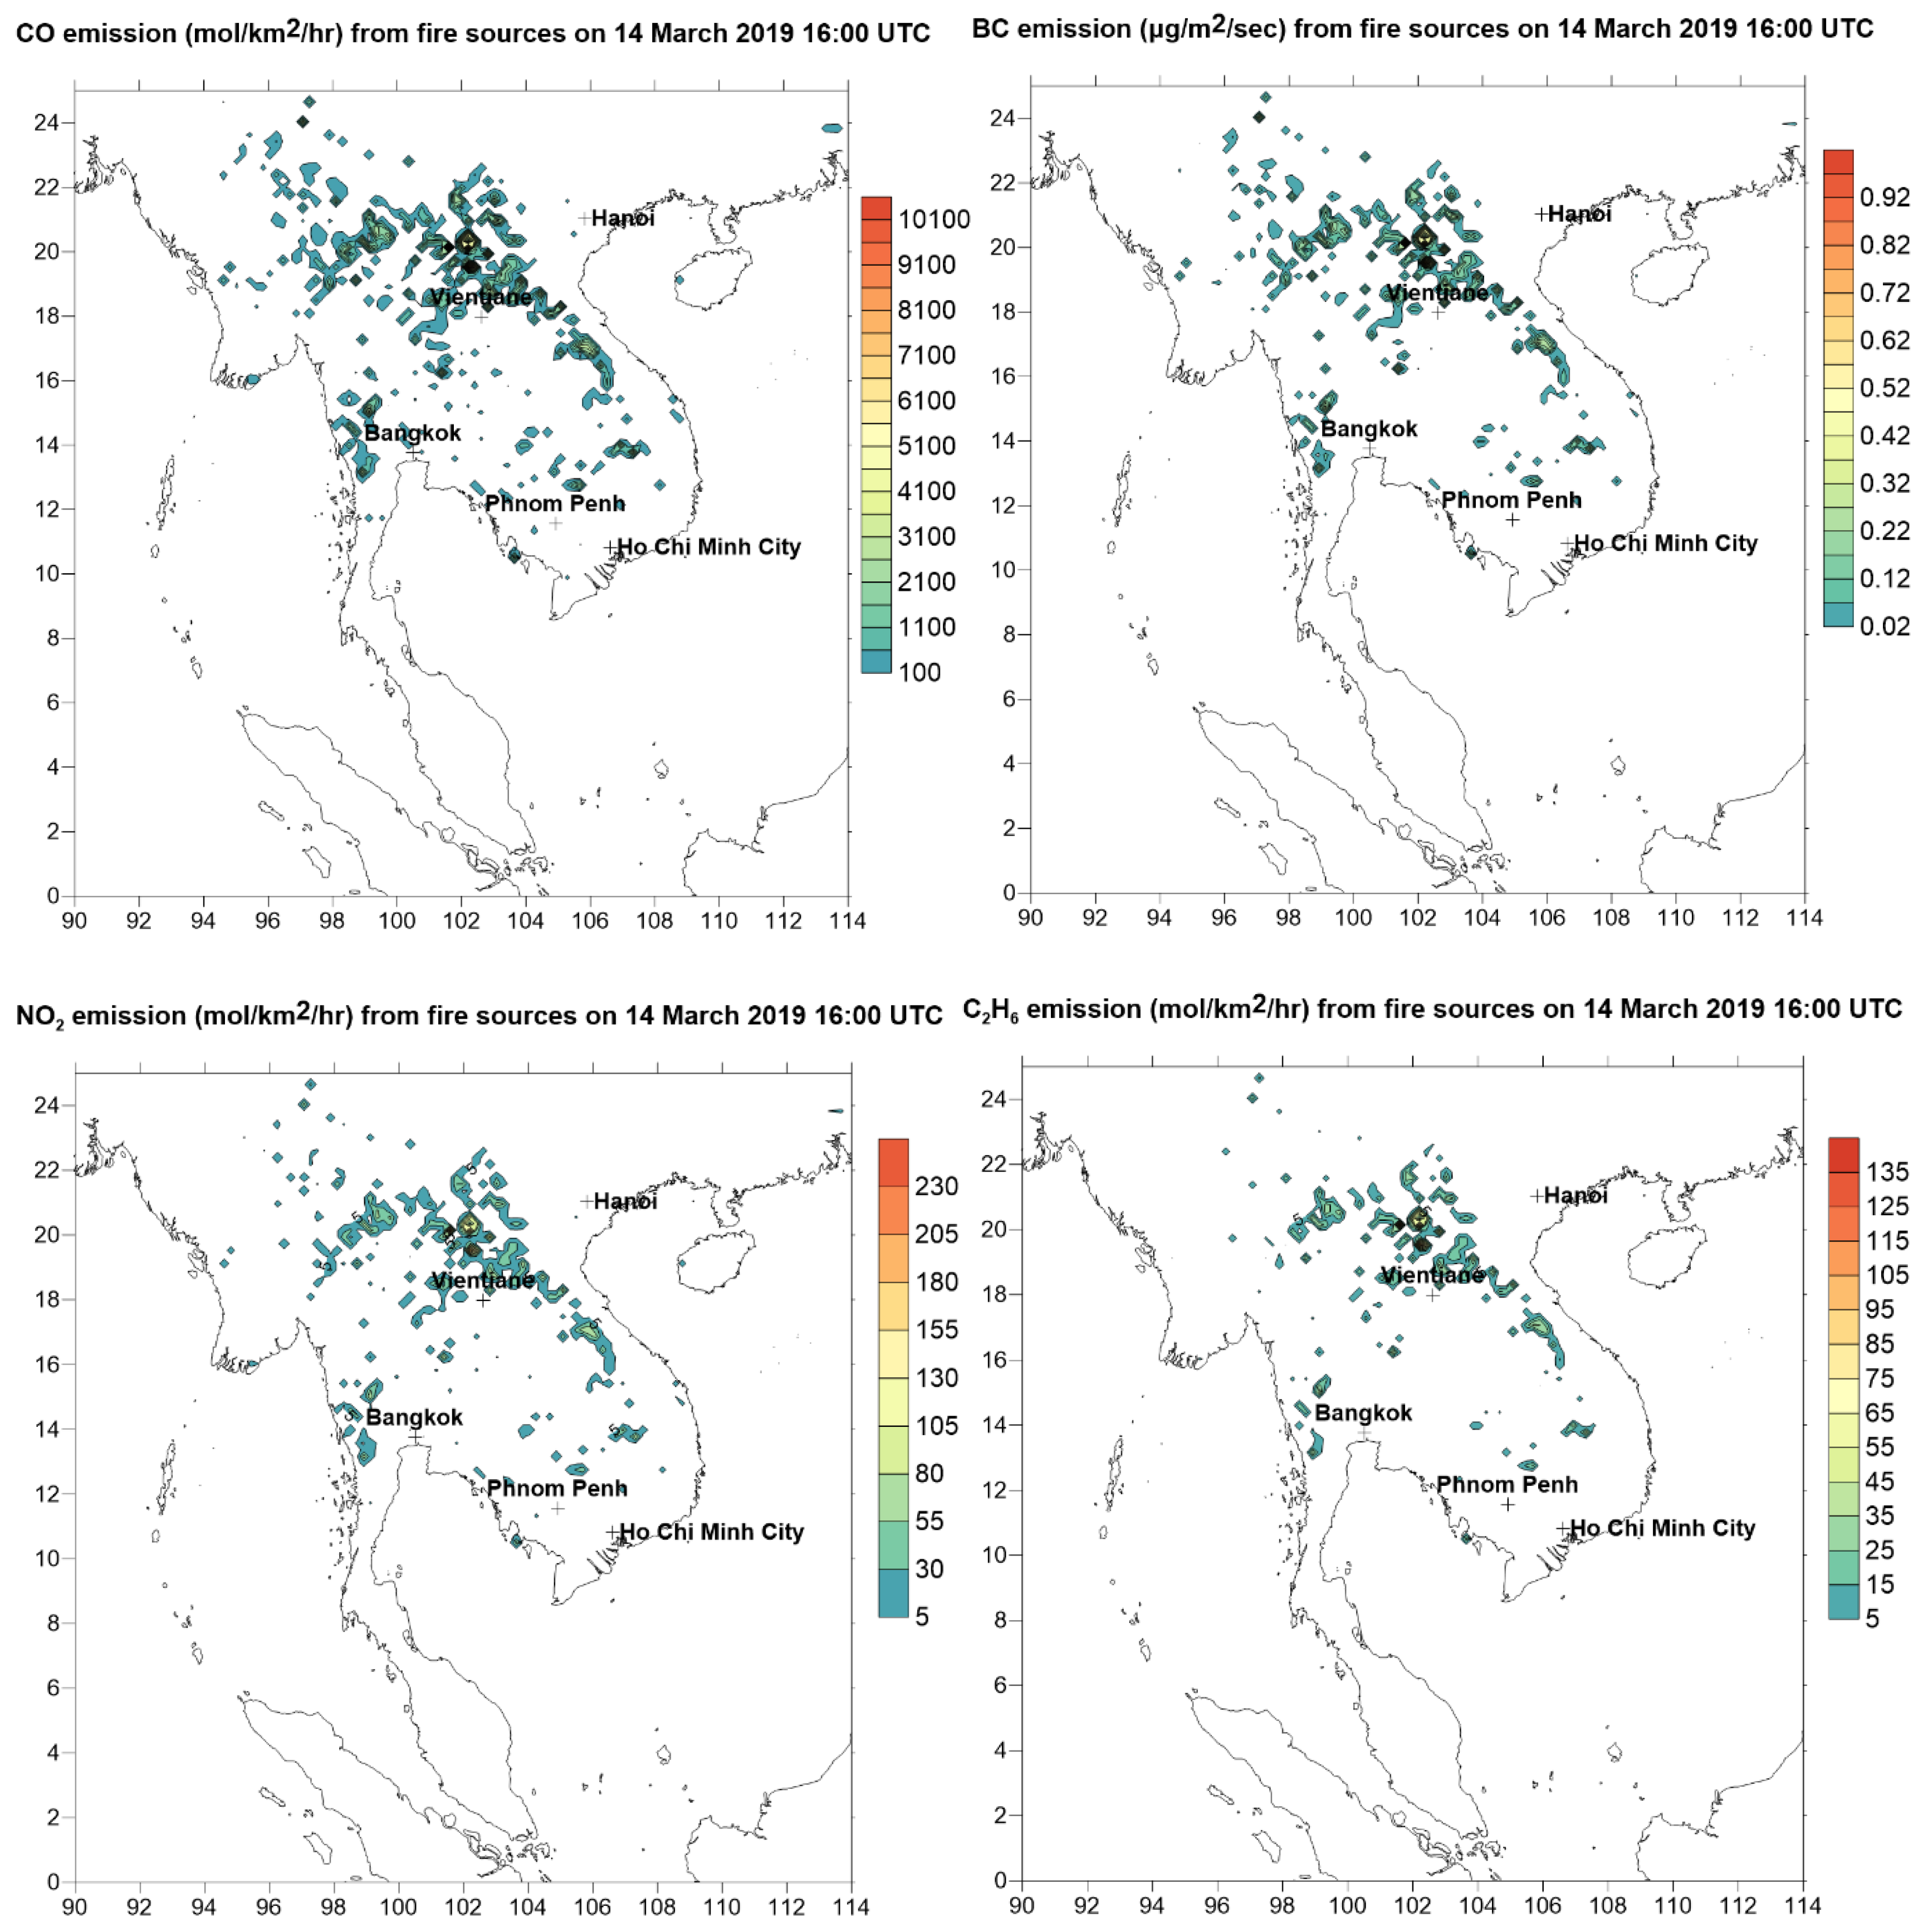
2.5 emission from biomass burnings are mainly concentrated in central, northeast Thailand and Laos where fires occurred and is much larger than that from anthropogenic sources located mostly in cities and populated areas in central Thailand, southern and northern Vietnam and southern China. The emission of some species such as CO (Carbon Monoxide), BC (Black Carbon), NO
2 (Nitrogen Dioxide) and C
2H
6 (Ethane) from biomass burnings at hot spots as detected by MODIS Terra/Aqua are shown in
Figure A1 in
Appendix 1. These emissions are estimated by FINN based on satellite detection of hot spots, their radiative power and type of vegetation or biomass in those hot spots. Details of how emission from fires can be estimated using fire radiation power to measure to intensity and type of vegetation to derive the emission factors for different species of pollutants are described in the studies of Wiedinmyer et al. 2010, 2023. The emission is then stored in the data store daily as FINN. The FINN fire emission and the anthropogenic emission are both included in the emission input to the WRF-Chem model to simulate the dispersion and transport of air pollutants emitted from these two sources.
The period of simulation from 13 to 20 March 2019 corresponds to the most intense burnings. Yin et al., 2019 [
24] used AOD (Aerosol Optical Depth) data from Terra satellite and PM
2.5 from MERRA Aerosol Reanalysis (MERRAero) model from 2001 to 2016 have shown that during March the biomass burnings contributed most to the aerosols emitted to the atmosphere in SEA.
From the simulation of WRF-Chem, the predicted ground concentration of PM2.5 across peninsular SEA is then used to estimate the population exposure. The predicted PM2.5 include primary emitted PM2.5, secondary organic aerosols (SOA) and secondary inorganic aerosols (SIA) formed from chemical reactions and particle formation in WRF-Chem MOZART chemical mechanism. The health impact for each health endpoints due to pollutant concentration on exposed population is estimated based on the relative risk of PM2.5 using the following method as described below.
The relative risk (RR) factors for 10 μg/m
3 increase of PM
2.5 on mortality (all cases) and cardiovascular (cvd) diseases are based on World Health Organization’s (WHO) Health Risks of Air Pollution in Europe project (HRAPIE) recommendations for concentration response functions [
25]. We use these recommended short-term concentration response coefficients for mortality and cvd diseases hospitalisation in this study.
where CI is the confidence interval at 95% level.
The HRAPIE relative risk for mortality value above means that a 10 μg/m
3 increase of PM
2.5 would increase the mortality of exposed population by 1.23% (CI: 0.45%, 2.01%). Xu et al. 2020 [
26] reviewed in literature the effect of wildfire events and reported that an increase of 10 μg/m
3 in daily PM
2.5 level is associated with an increase of 0.8–2.4% in the risk of death from any cause or nonaccidental death for up to 4 days after the exposure. The RR value (1.23%) for mortality as recommended by WHO above falls in the range of values in [
26] study. The RR value has strong influence on the results of an epidemiological study on health impact on exposure population due to air pollution. Table A2 in
Appendix 2 list some of the RR values in a number of studies on short term health effect (mortality and morbidity) due to wildfires in literature. Here we adopt the RR values from WHO as references to determine the short-term health impact of air pollution due to wildfires.
For disease hospitalisation such as cardiovascular disease or respiratory diseases, International Statistical Classification of Diseases and Related Health Problems, Tenth Revision is used to refer to those diseases in this study: I00-I90 for cardiovascular disease and J00-J99 for respiratory diseases, I00-I90 for cardiovascular disease as standard.
For respiratory hospitalizations, in this study we used the RR of PM
2.5 value of 1.028 (CI: 1.014,1.041), based on a study of the 2003 California wildfires [
27]. This value was also used in [
15,
28,
29] for large wildfires or biomass hazardous reduction burnings (HRBs) in Australia. Liu et al. 2017 [
30] conducted a study of cardiovascular and respiratory hospitalisation due to smoke wave of 2 or more days when daily average concentration of PM
2.5 ≥ 20 μg/m
3 across the whole Western United States from 2004 to 2009. Their results on respiratory diseases hospitalisation during the wildfires was 1.072 (CI: 1.0025, 1.15) which is higher than that of [
27] but larger CI. Delfino et al. 2009 [
27] study of the catastrophic wildfires in southern California in October 2003 which generated large amounts of dense smoke covering much of urban southern California is similar in scope of the biomass burnings in SEA during March 2019. A recent study conducted in Chiangmai, northern Thailand on the link between air quality index (AQI) of PM
2.5 and the emergency department (ED) visits has found that there is an increase in ED visits for different diseases [
31]. Their results give the RR as (1.023, CI: 1.002–1.044) due to acute coronary syndrome (ACS), (1.071, CI: 1.025–1.118) due to pneumonia on the current day, increased mortality resulted from ACS on lag day 3 (RR = 1.36, CI: 1.08–1.73). These are the first results of an epidemiological study on the risks of mortality and morbidity due to air pollutants for SEA. However, these are values for ambient air pollution not for large wildfires or biomass burnings.
The impact factor (IF) is the relative risk associated with a specific change in air pollution concentration ΔX. In this case, ΔX is the PM
2.5 increase due to fire event and IF is calculated as:
IF is also called the relative risk function with respect to change in PM concentration (standardised to 10 μg/m3). The above equation (1) is a log-linear model which states that the logarithm of impact factor (or relative risk function) is linearly changed with change in ambient PM concentration.
The attributable number of the impact on health endpoint due to an increase of ΔX concentration in a population with a specific incidence rate for this endpoint is
The above equations (1) and (2) are used by the US EPA to estimate health impact due to change in air quality in the United States [
32] and implemented in BenMAP software tool. They are also used by many authors to assess the health impact of air pollution in various countries [
29,
33,
34].
As the relative risk function (or impact factor) is not always linear with respect to change in concentration, especially in low and very high PM concentration values, an Integrated Exposure Response (IER) is often used to account for this wide range in concentration from very low to very high [
35]. This IER model combined the mortality relative risk estimates from other PM
2.5 combustion sources, including active and second-hand smoking, household burning of solid fuels. The IER model, developed for use in the Global Burden of Disease Study (GBD), estimates the PM
2.5 relative risks across the entire global range of exposure, including low polluted areas and highly polluted areas where epidemiologic studies are lacking. The IER is used in the World Health Organization’s (WHO) benefits assessment software (AirQ+), the United States Environmental Protection Agency’s (US EPA) benefits assessment software (BenMAP) [
35]. In this study, the biomass burnings in March 2019 in peninsular SEA resulted in high concentration of PM
2.5 and at some location in northern Thailand and Laos, the extreme high daily average exposure level of PM
2.5 were above 30 μg/m
3 which would cause a non-linear relationship between concentration and health impact. The GBD 2004 assumed that no additional risk beyond 30 μg/m
3. The log-linear response as provided in equation (1) and (2) is adequate for our study but beyond the daily average PM
2.5 concentration of 30 μg/m
3, the response will be capped as assumed in the Global Burden of Disease (GBD) 2004 study. In a study on health effect due to the summer megafires of 2019/2020 in Australia, Johnston et al. 2021 [
33] used a higher value of 150 μg/m
3 to constrain the maximum daily concentrations of PM
2.5.
High resolution population data sets can be obtained from various sources such as [
36] for global data sets. Other source of population data is the Gridded Population of the World from SEDAC (Socioeconomic Data and Applications Center) of NASA’s Earth Observing System Data and Information System (EOSDIS) at
http://sedac.ciesin.columbia.edu/data/collection/gpw-v4/sets/browse. More up to date datasets, which is suitable for the current study, is the 2019 population data for each of the four countries in this study. This dataset was obtained from UN Humanitarian Data Exchange in TIFF format at 1km x 1km resolution. The data is then converted to a csv (comma separated values) file to be used by R and Python software to interpolate and overlay the population data with the predicted daily PM
2.5 concentration grid and the impact on health endpoints is then calculated.
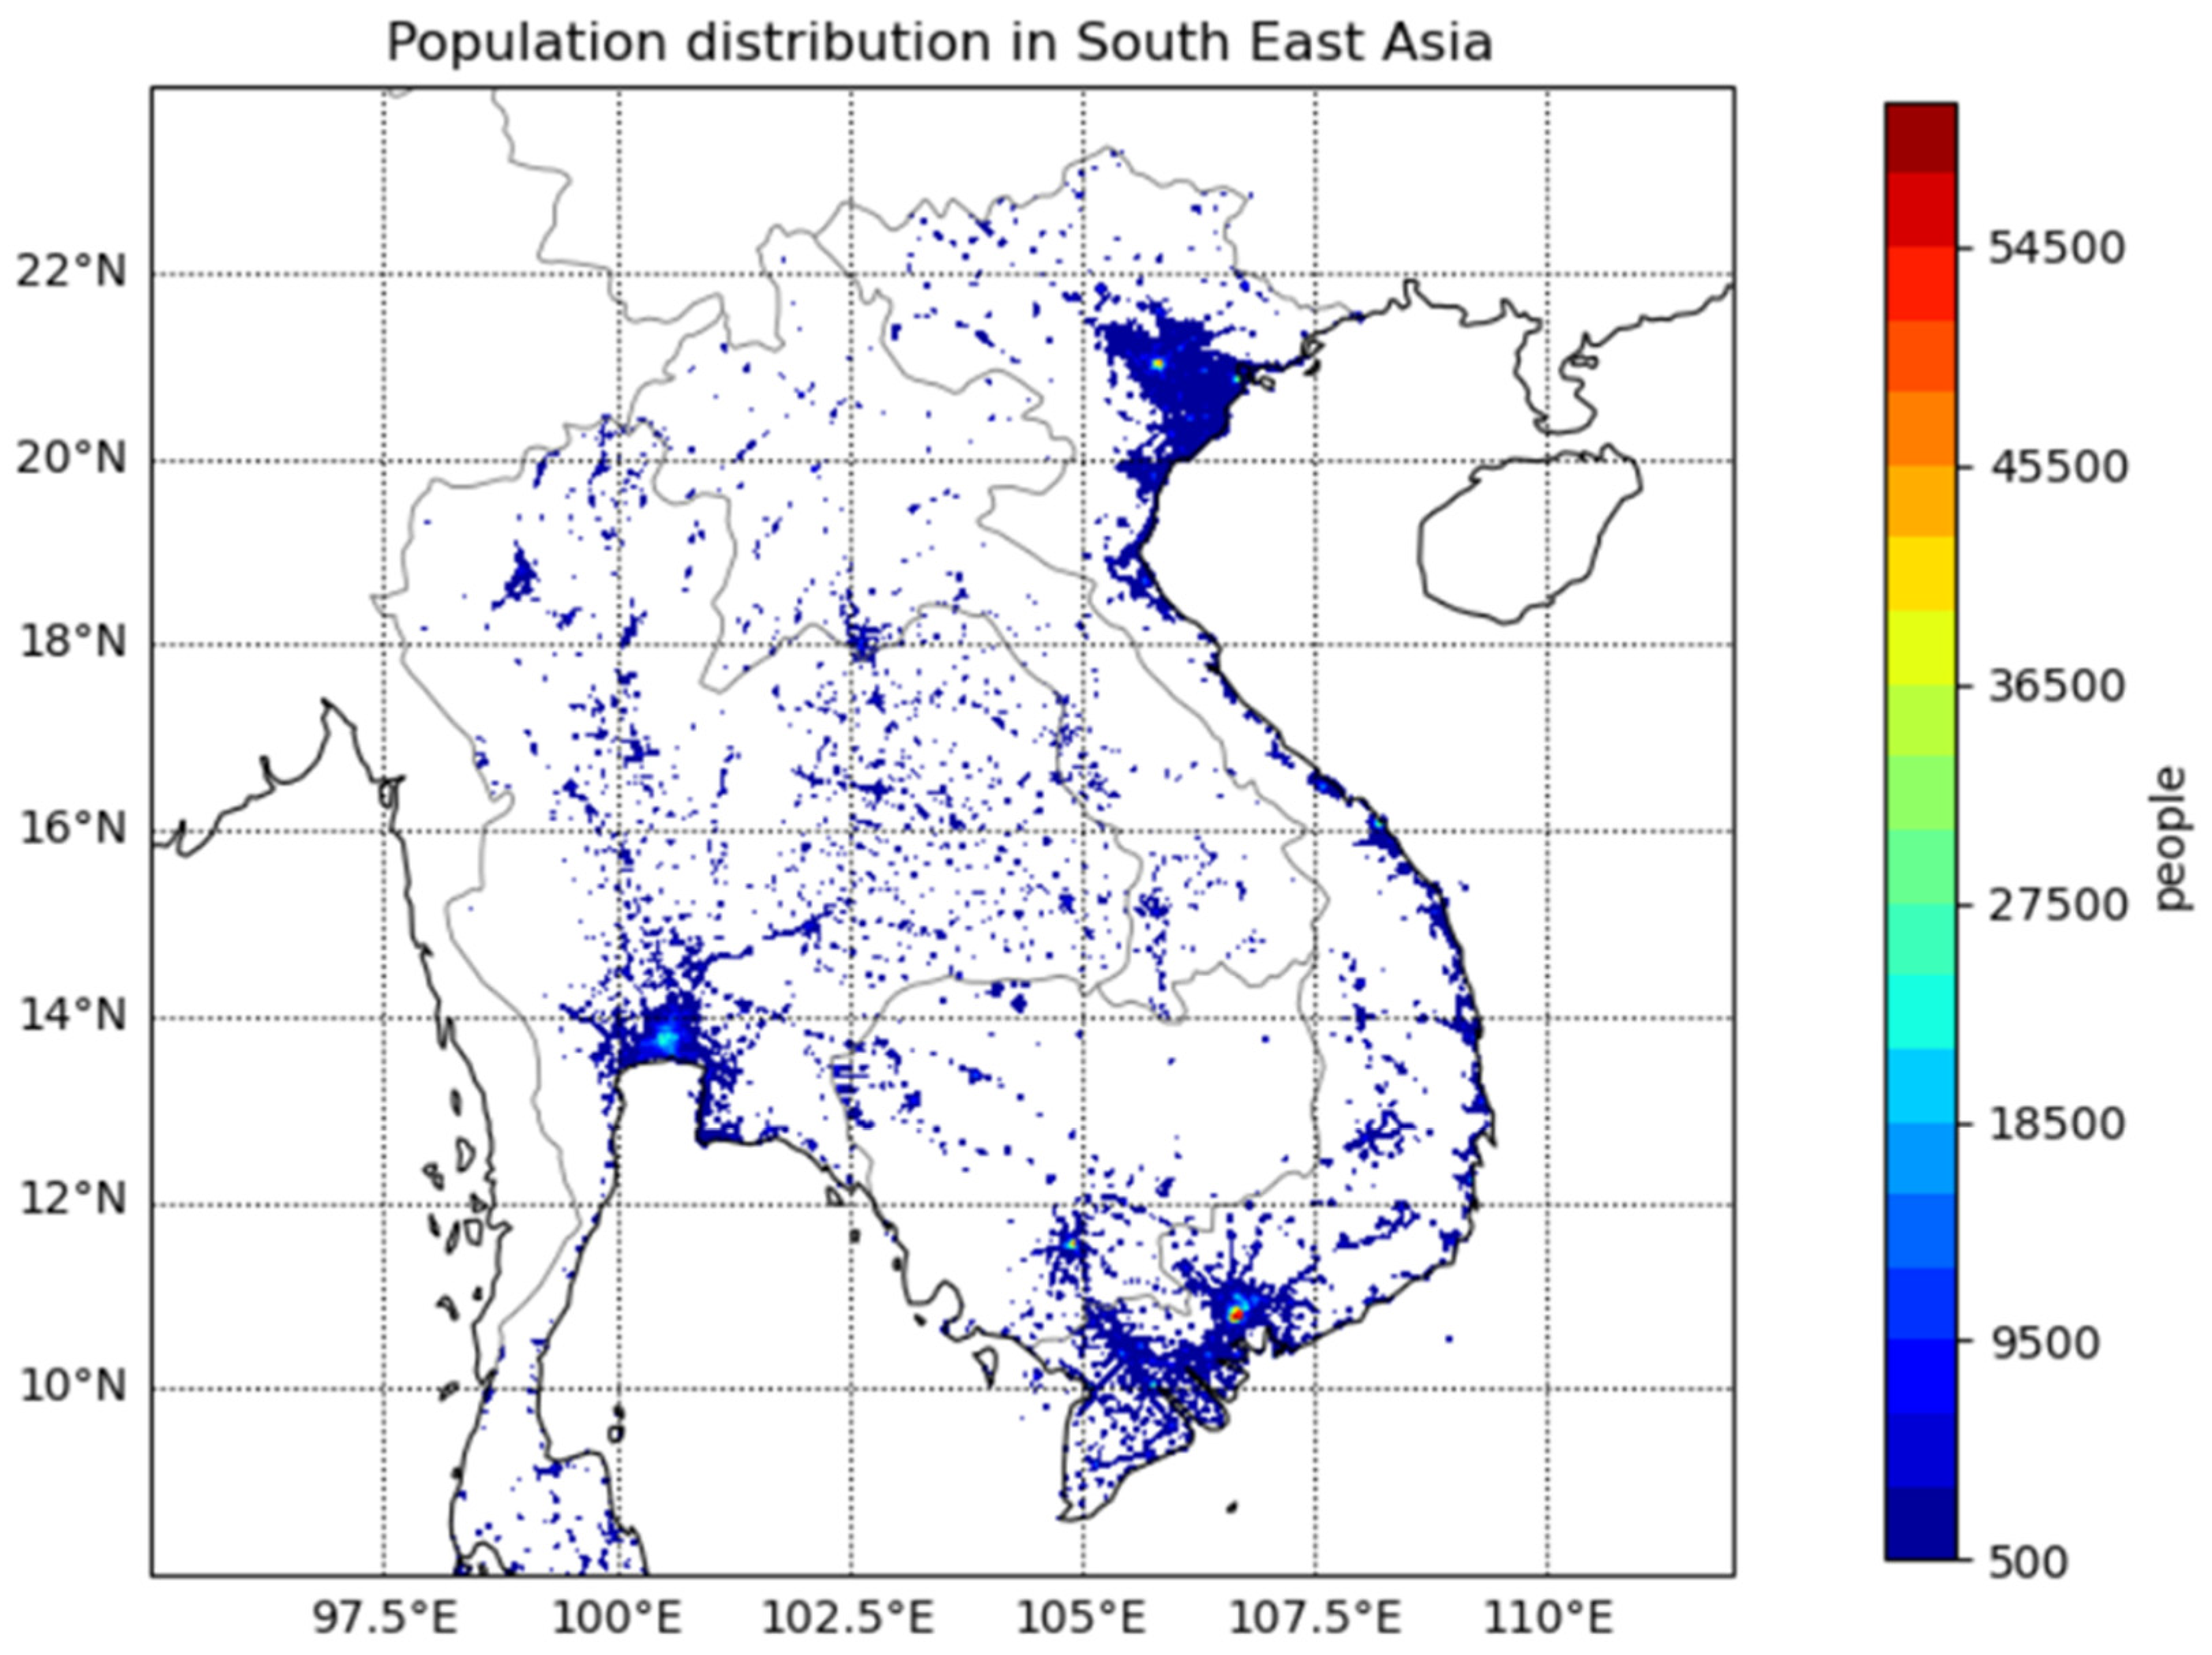
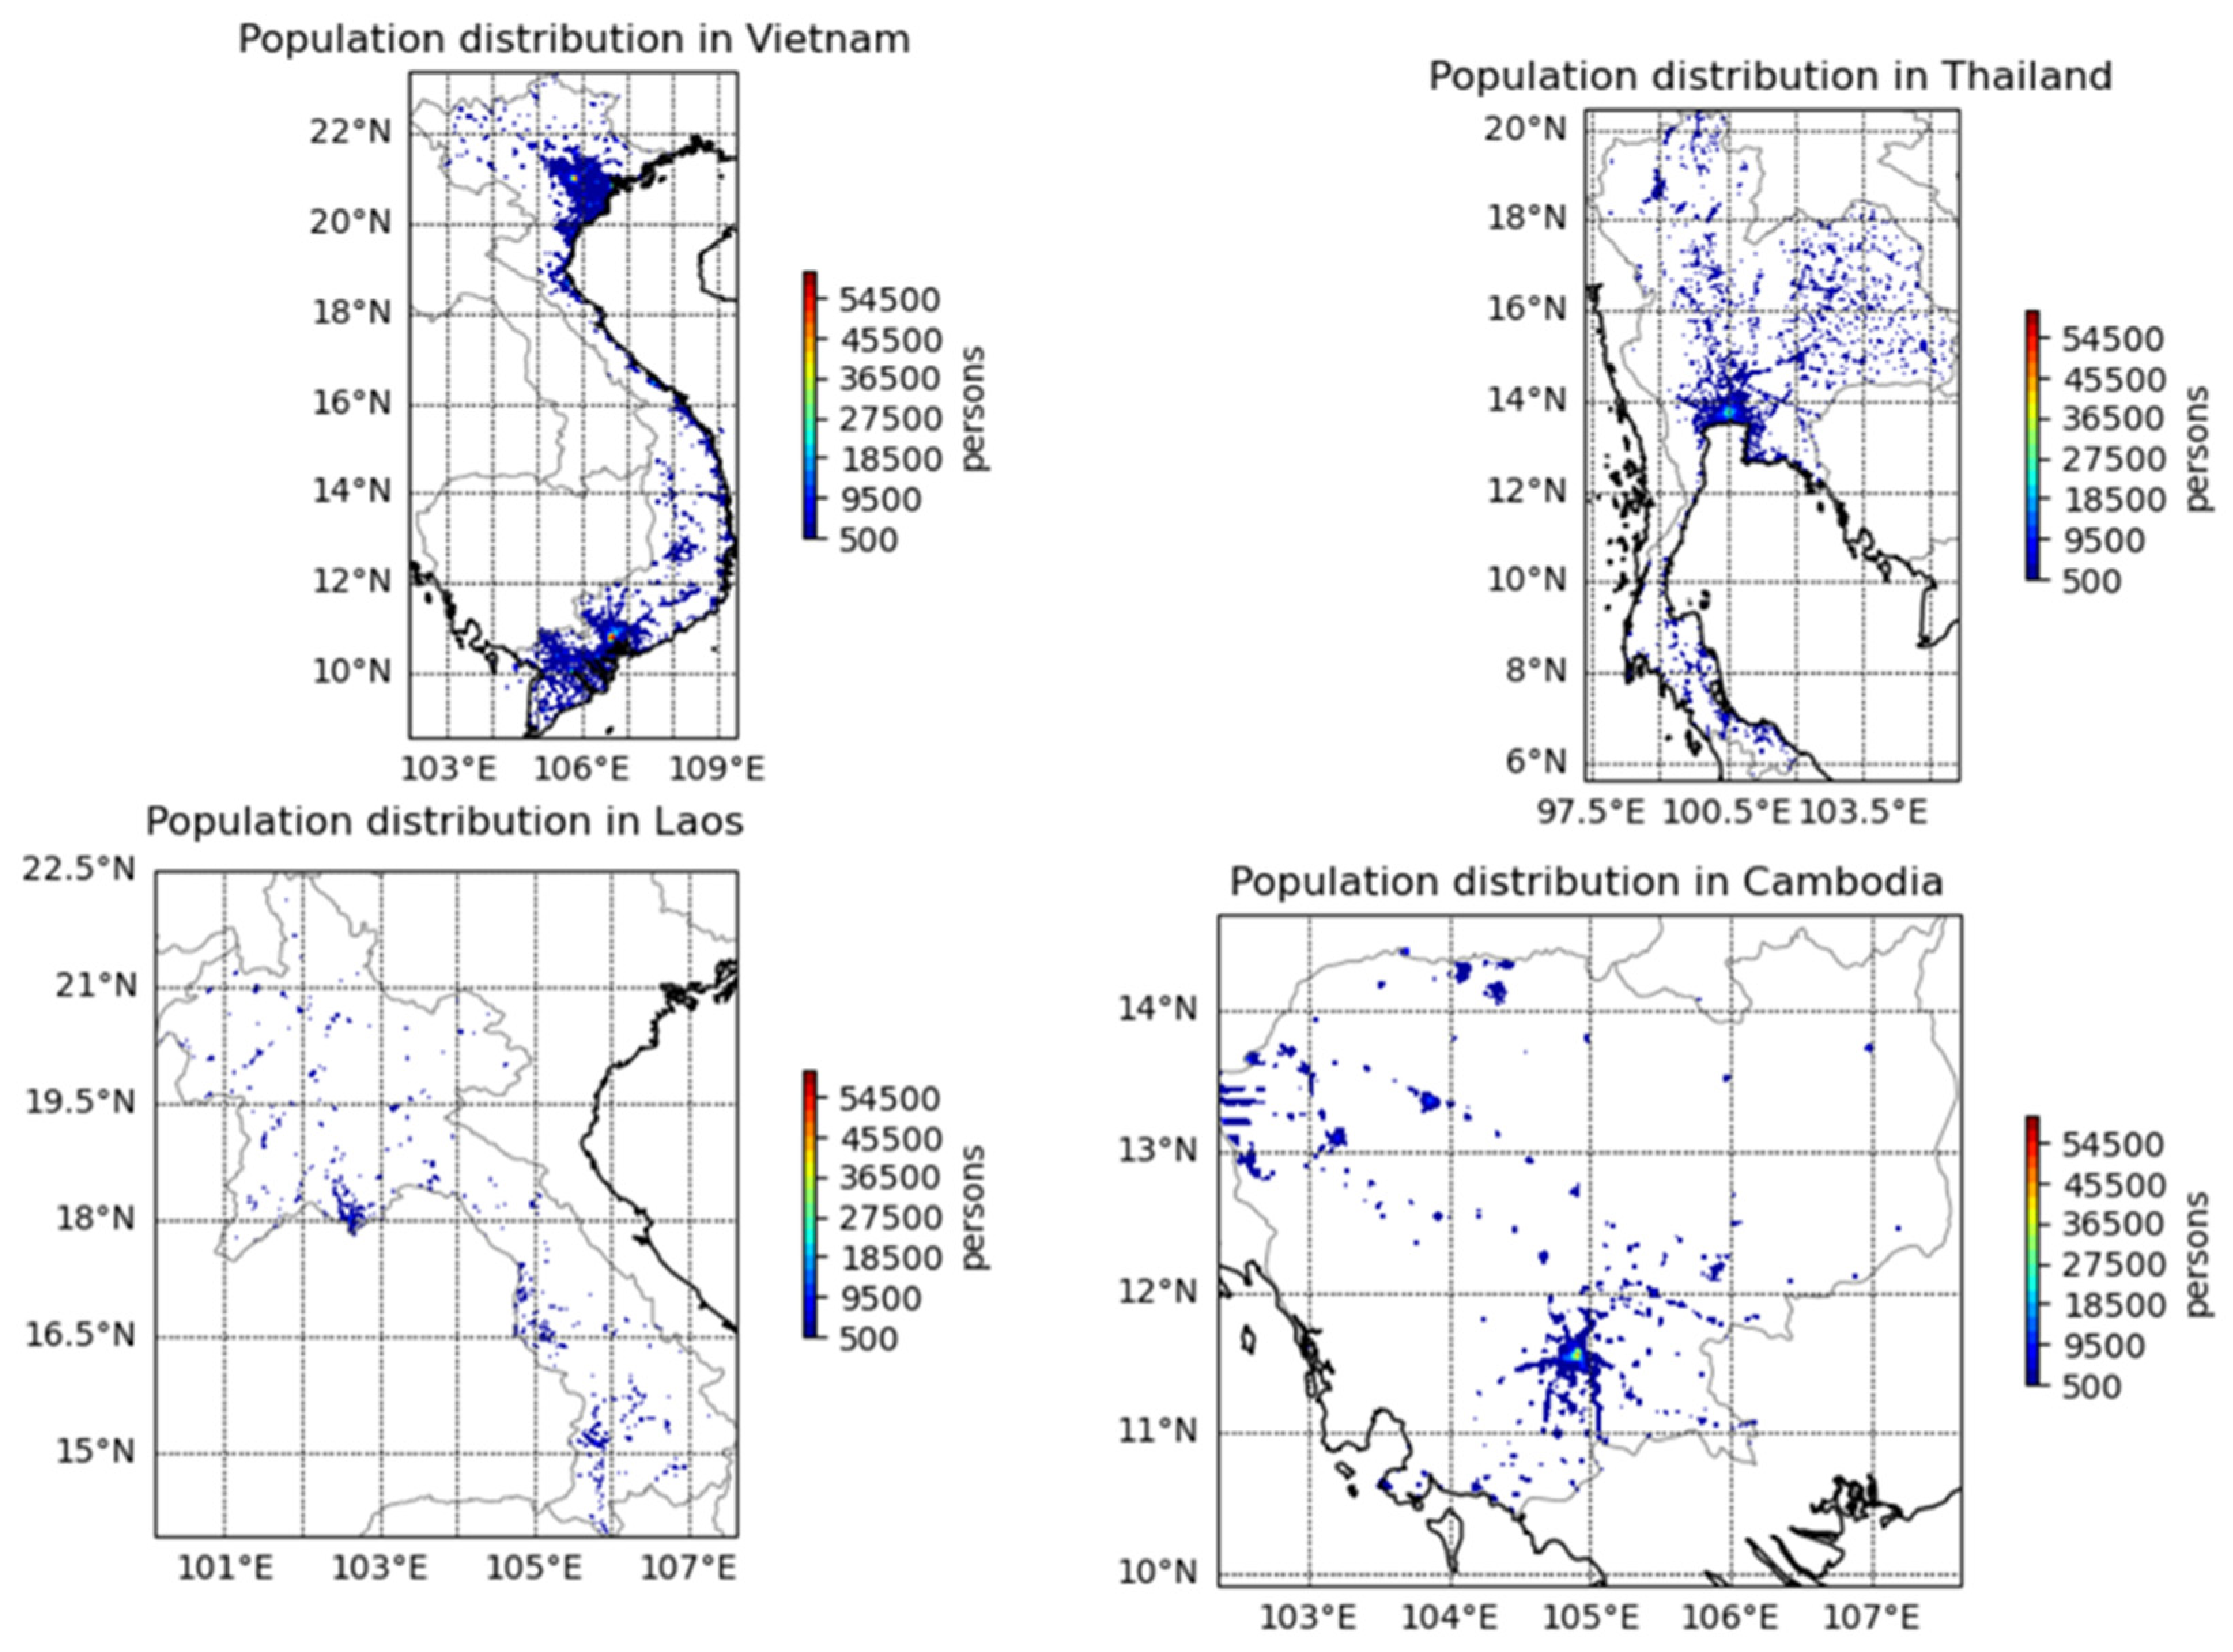
Figure 4 shows the 2019 population distribution in SEA and in each of the individual countries of peninsular SEA (Vietnam, Thailand, Laos and Cambodia) based on UN Humanitarian Data Exchange dataset. As expected, the highest population concentration is in the metropolitan areas of the capital cities: Bangkok (Thailand), Hanoi and Ho Chi Minh City (Vietnam), Vientiane (Laos) and Phnom Penh (Cambodia).
Data for the relative risks and incidence rates for each of the health endpoints (such as mortality rates, hospitalisation for respiratory diseases), as specified in equations (1) and (2), are keys in the health impact study of air pollutants. Relative risks can be obtained from previous studies on health impact of wildfires in literature while incidence rates can be obtained from health statistics of each of the countries either produced by the relevant local health authorities or from international organisation. Table A2 in
Appendix 2 lists some of the relative risks used in various health impact studies of air pollution using PM
2.5 as surrogate of pollution concentration. It is important to distinguish between long term exposure health impact and short term (acute) health impact of air pollutants. As mentioned above, the relative risks from the World Health Organization’s (WHO) Health Risks of Air Pollution in Europe project (HRAPIE) recommendations are chosen as these values have been selected based on extensive review of published studies.
For Vietnam, Thailand, Cambodia and Laos, we use the incidence rate based on WHO data for 2016 of non-communicative diseases (NCD) (
https://www.who.int/nmh/countries/tha_en.pdf, https://
www.who.int/nmh/countries/khm_en.pdf). Thailand population in 2016 is 68,864,000 and total death of 539,000 hence the mortality rate is 0.78% for the 2016 year. Similarly, the mortality rates for Vietnam (0.57%), Cambodia (0.59%) and Laos (0.69%) are derived from WHO data for these countries. The Global Health Data Exchange (GHDx) from the Institute for Health Metrics and Evaluation (IHME) is another source of incidence rate for mortality in each of the countries available from 1990 to 2019. The data can be downloaded from
http://ghdx.healthdata.org. According to GHDx data for 2019, the total death for Thailand, Vietnam, Laos and Cambodia are 497,502 (CI: 389,256, 628,041), 631,817 (CI: 538,099, 714,078), 44,456 (CI: 36,587, 52,996) and 110,850 (CI: 93,245,126,115) respectively. And the corresponding population and mortality incidence rates are Thailand (70,111,586; 0.71%), Vietnam (96,372,928; 0.65%), Laos (7,158,249; 0.62%) and Cambodia (16,603,117; 0.67%). Comparing the 2016 estimate of incidence rates based on WHO data and those of 2019 based on GHDx data, there are slight differences, but they are consistent. The mortality rate increases from 2016 to 2019 for Vietnam (0.57% to 0.65%) and Cambodia (0.59% to 0.67%) but decreases for Thailand (0.78% to 0.71%) and Laos (from 0.69% to 0.62%). The average mortality rate for the 4 countries in 2019 is approximately 0.66%. As the focus is on the biomass burnings at the end of the dry period in March 2019, the mortality rate for each of the countries in 2019 is selected individually.
Morbidity data on cardio-vascular diseases hospitalisation from Southeast Asian countries are scarce. CVD is a group of diseases including coronary heart disease such as ischaemic heart disease (IHD), and cerebrovascular disease such as stroke. IHD was the summation of 4 distinct disease sequelae: acute myocardial infarction, chronic stable angina, chronic IHD, and heart failure due to IHD [
37]. Nguyen et al. 2022 [
38] recently used the population-based registries of residents from 2 provinces in a northern urban (Hai Phong), and a central rural (Thanh Hoa), province of Vietnam hospitalized with a validated AMI (Acute myocardial infarction) to estimate the incidence rates of AMI in these two registries. The incidence rates (per 100,000 population) of initial AMI in Thanh Hoa was 16 and Hai Phong 30. Data from the Institute for Health Metrics and Evaluation (IHME) provide the CVD prevalence rate for Vietnam as 6.1%, (4.0% in Cambodia and 4.9% in Indonesia). In a study of trend in heart failure hospitalization and outcome under national public health insurance system in Thailand from 2008–2013, Janwanishstaporn et al. 2022 [
39] found that heart failure (HF) hospitalization rate increased from 138 in 2008 to 168 per 100,000 beneficiaries in 2013. In this study, we use the incidence rate for cardiovascular disease (CVD) hospitalisation rate similar to the HF hospitalisation rate of 0.17% for all 4 countries in SEA (Thailand, Vietnam, Laos and Cambodia) in 2013.
As for respiratory diseases hospitalisation, only information for Thailand is found with a comprehensive national statistic in 2010 based on data from three health insurances consisting of approximately 96% of the adult population (46,208,964 persons) of the total Thai population of 64.7 million [
40]. There were 460,471 respiratory disease hospitalisations in the year, giving the incidence rate of approximately 1%. As far as we are aware, there is no published data for 2019 or later years and due to the lack of data from other countries in SEA, the incidence rate of 1% for respiratory diseases hospitalisation is chosen for the 4 countries.
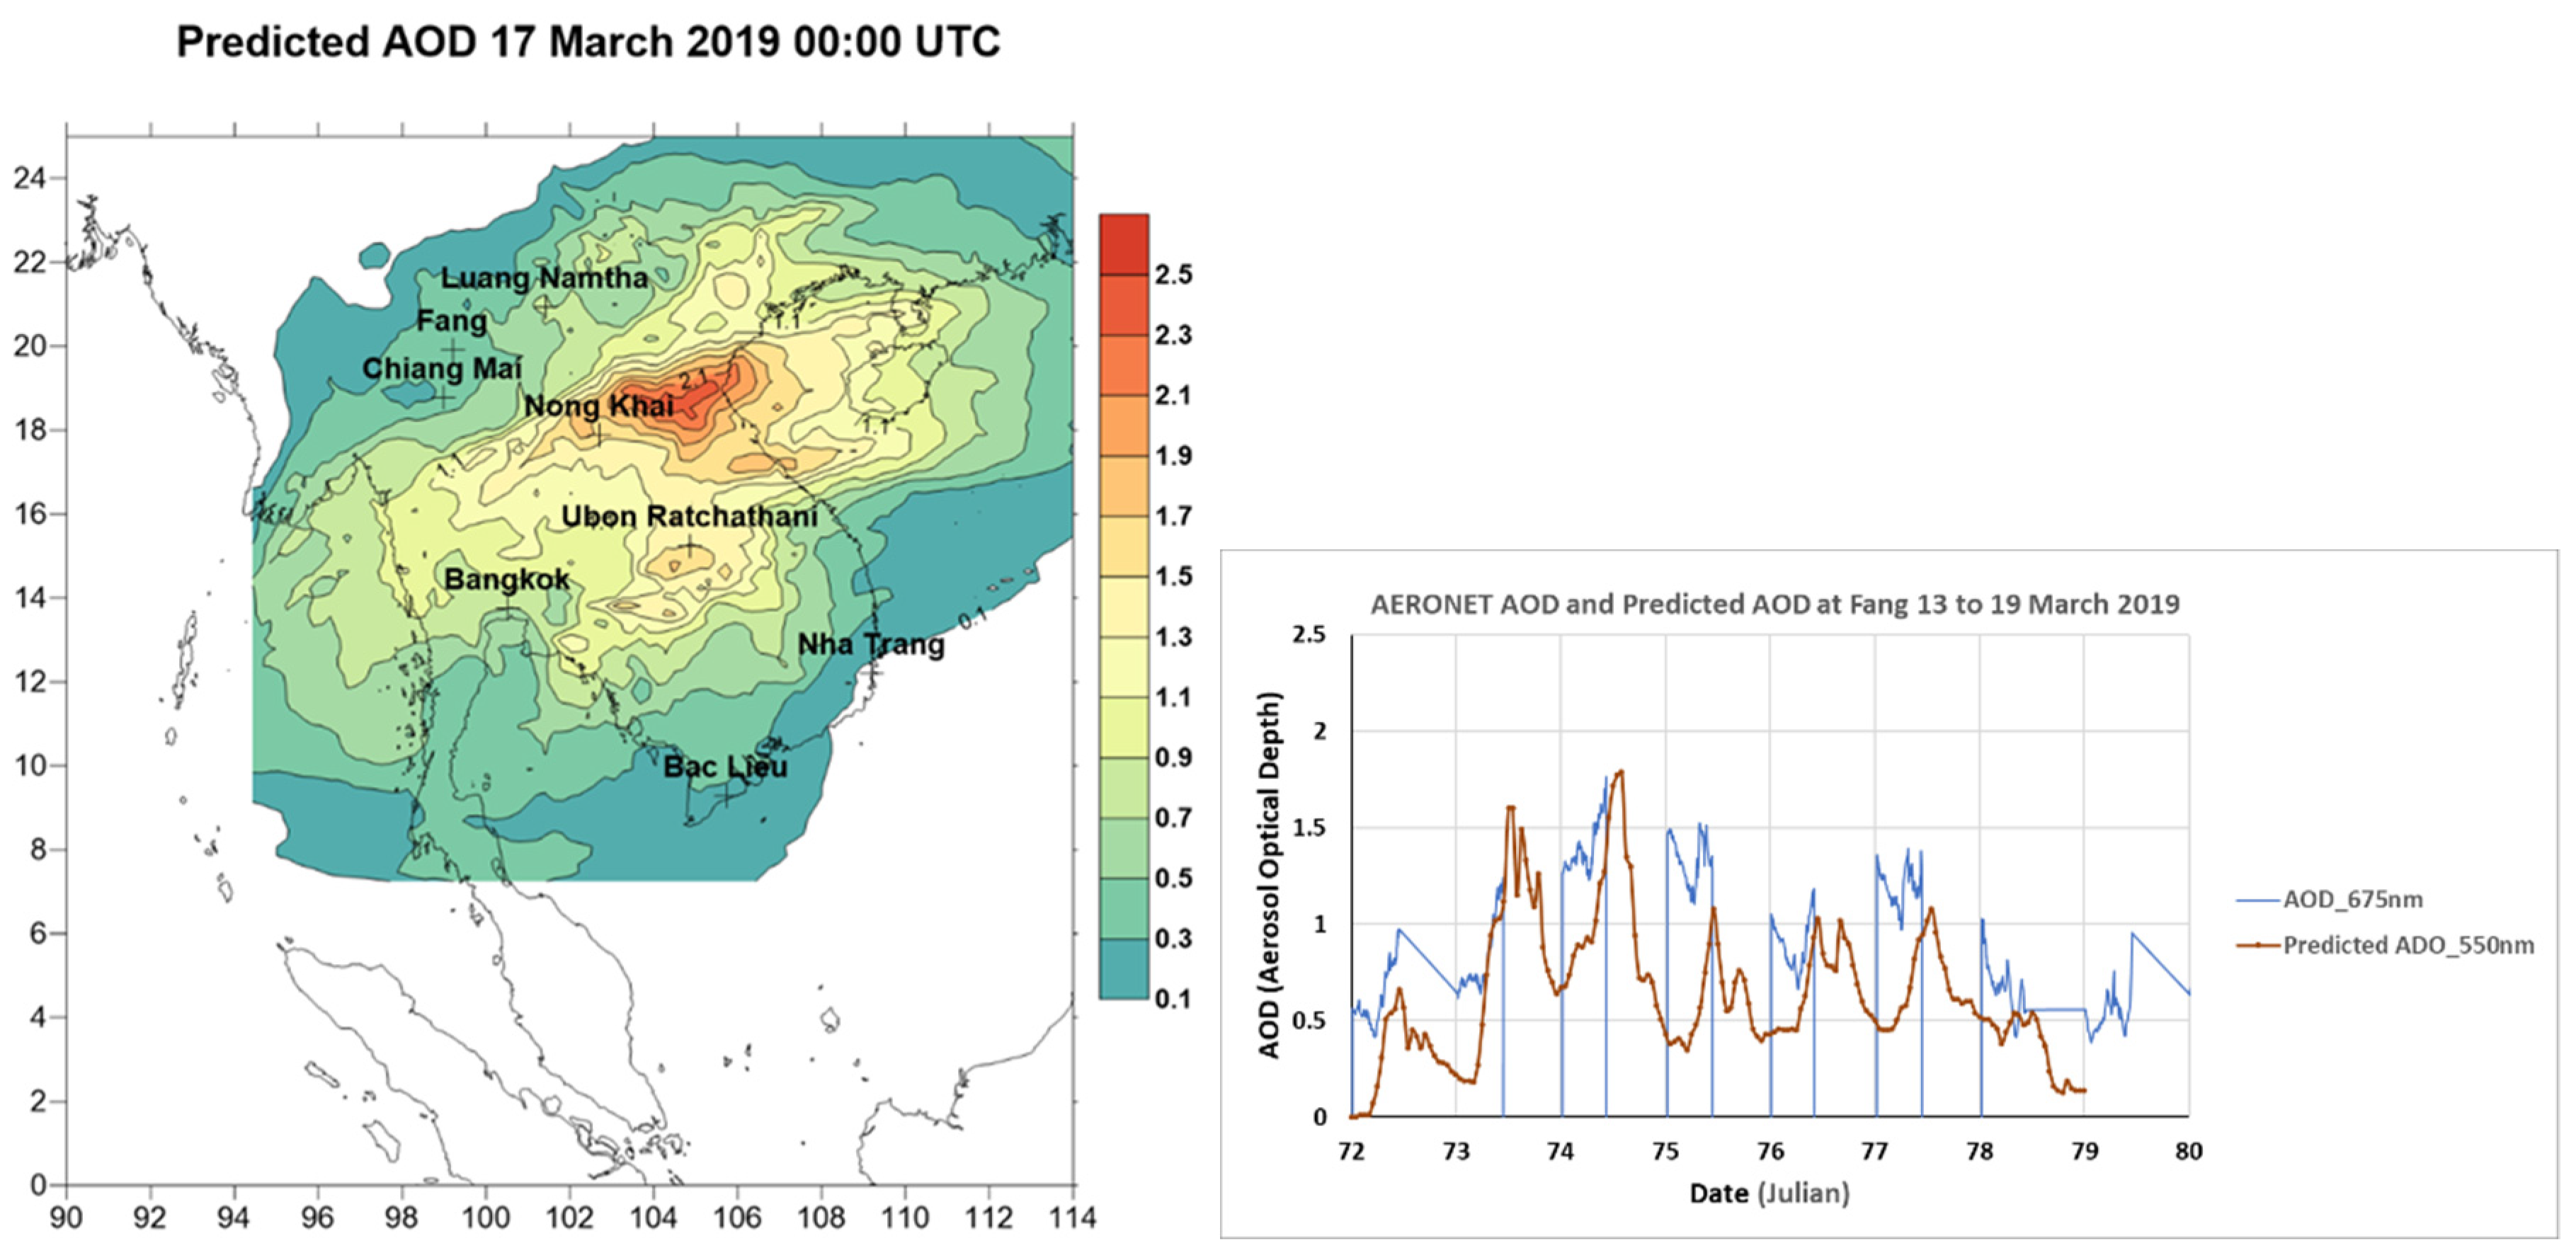
The simulation period is from 13 to 20 March 2019 inclusively when the biomass burnings was at highest intensity near the end of the dry season in SEA. Evaluation of the simulation was conducted by comparing the predicted meteorological variables such as temperature, wind speed and direction at various sites (Luang Namtha, northern Laos and Bangkok, central Thailand) with measured data. The predicted AOD (Aerosol Optical Depth) at many sites in the region is also compared with measured AOD at AERONET sites (Chiang Mai, Luang Namtha, Nong Khai, Fang, Bangkok in Thailand and Bac Lieu and Nha Trang in Vietnam). The evaluation conducted in our previous study [
9] shows that the meteorological and AOD prediction corresponds well with observed data at those sites.
Figure 5 shows the predicted AOD across the region covering the 4 countries on 17 March 2019 00:00 UTC and the location of the AERONET sites measuring AOD over time used to validate the model. Comparison of AOD as predicted by WRF-Chem at Fang in northern Thailand with AERONET measurement at this site is also shown.
Simulation is also conducted for the base case scenario where there were no biomass burnings during the same period. The base case scenario simulation is run only with the anthropogenic emission input. The difference in predicted PM2.5 between the biomass burnings scenario and the base case scenario at each of the grid cells will be applied to equation (2) and summed over the domain to estimate the attributable number of health impact due to biomass burnings.
3. Results and Discussion
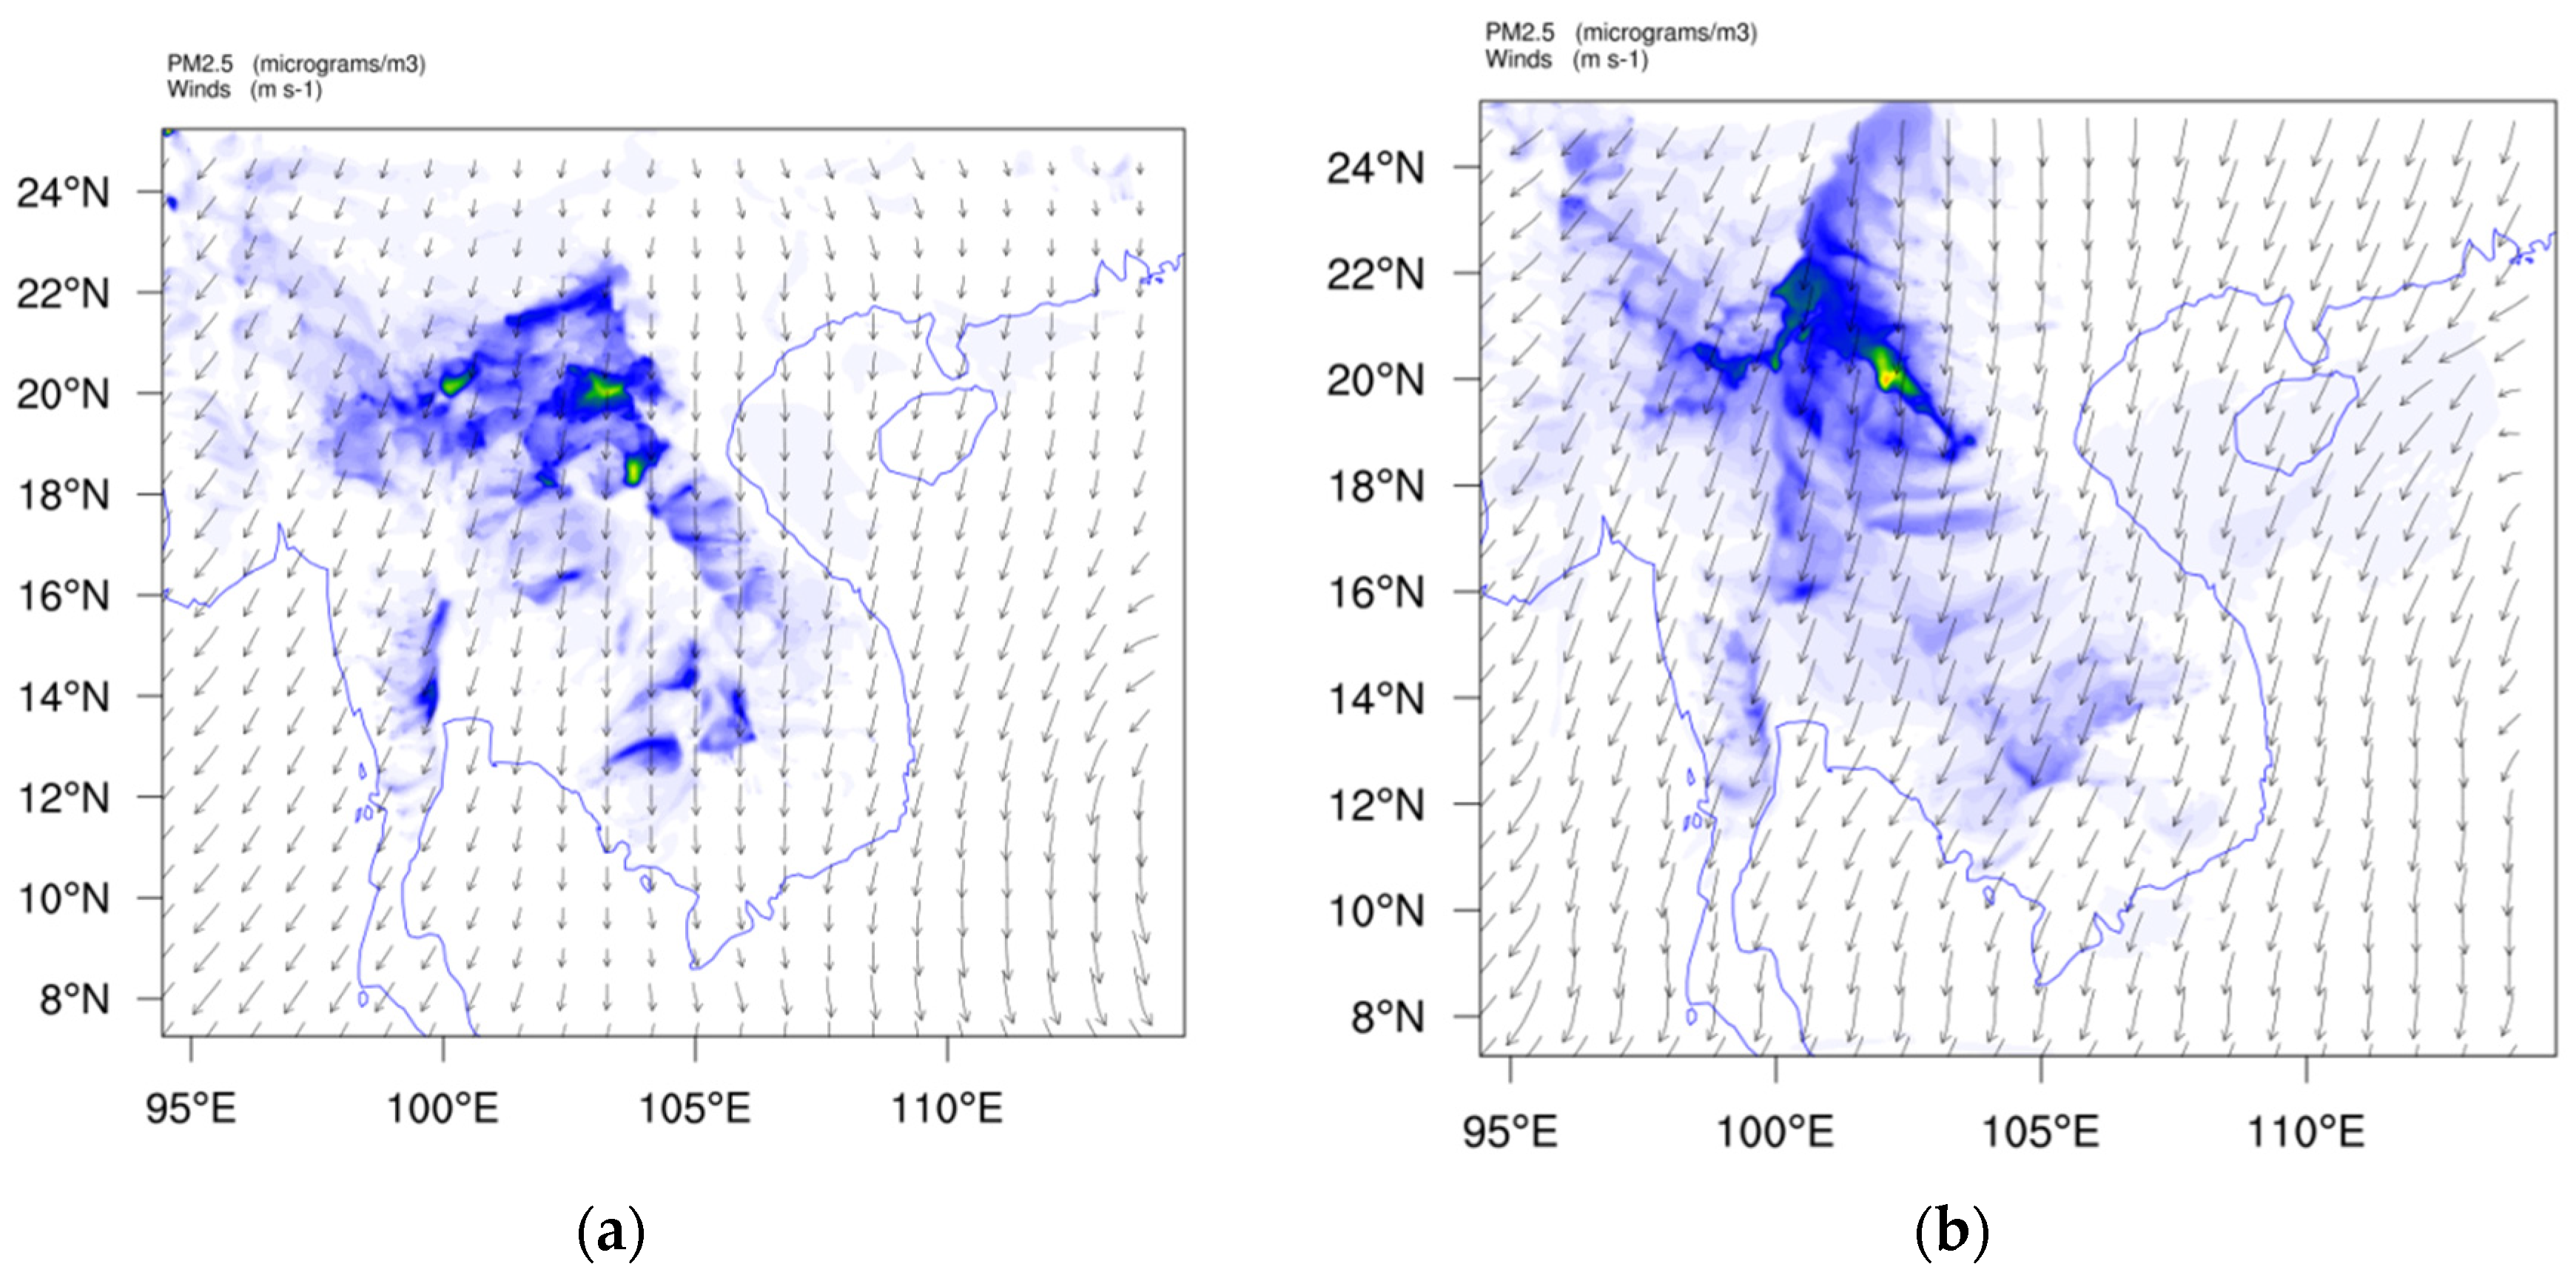
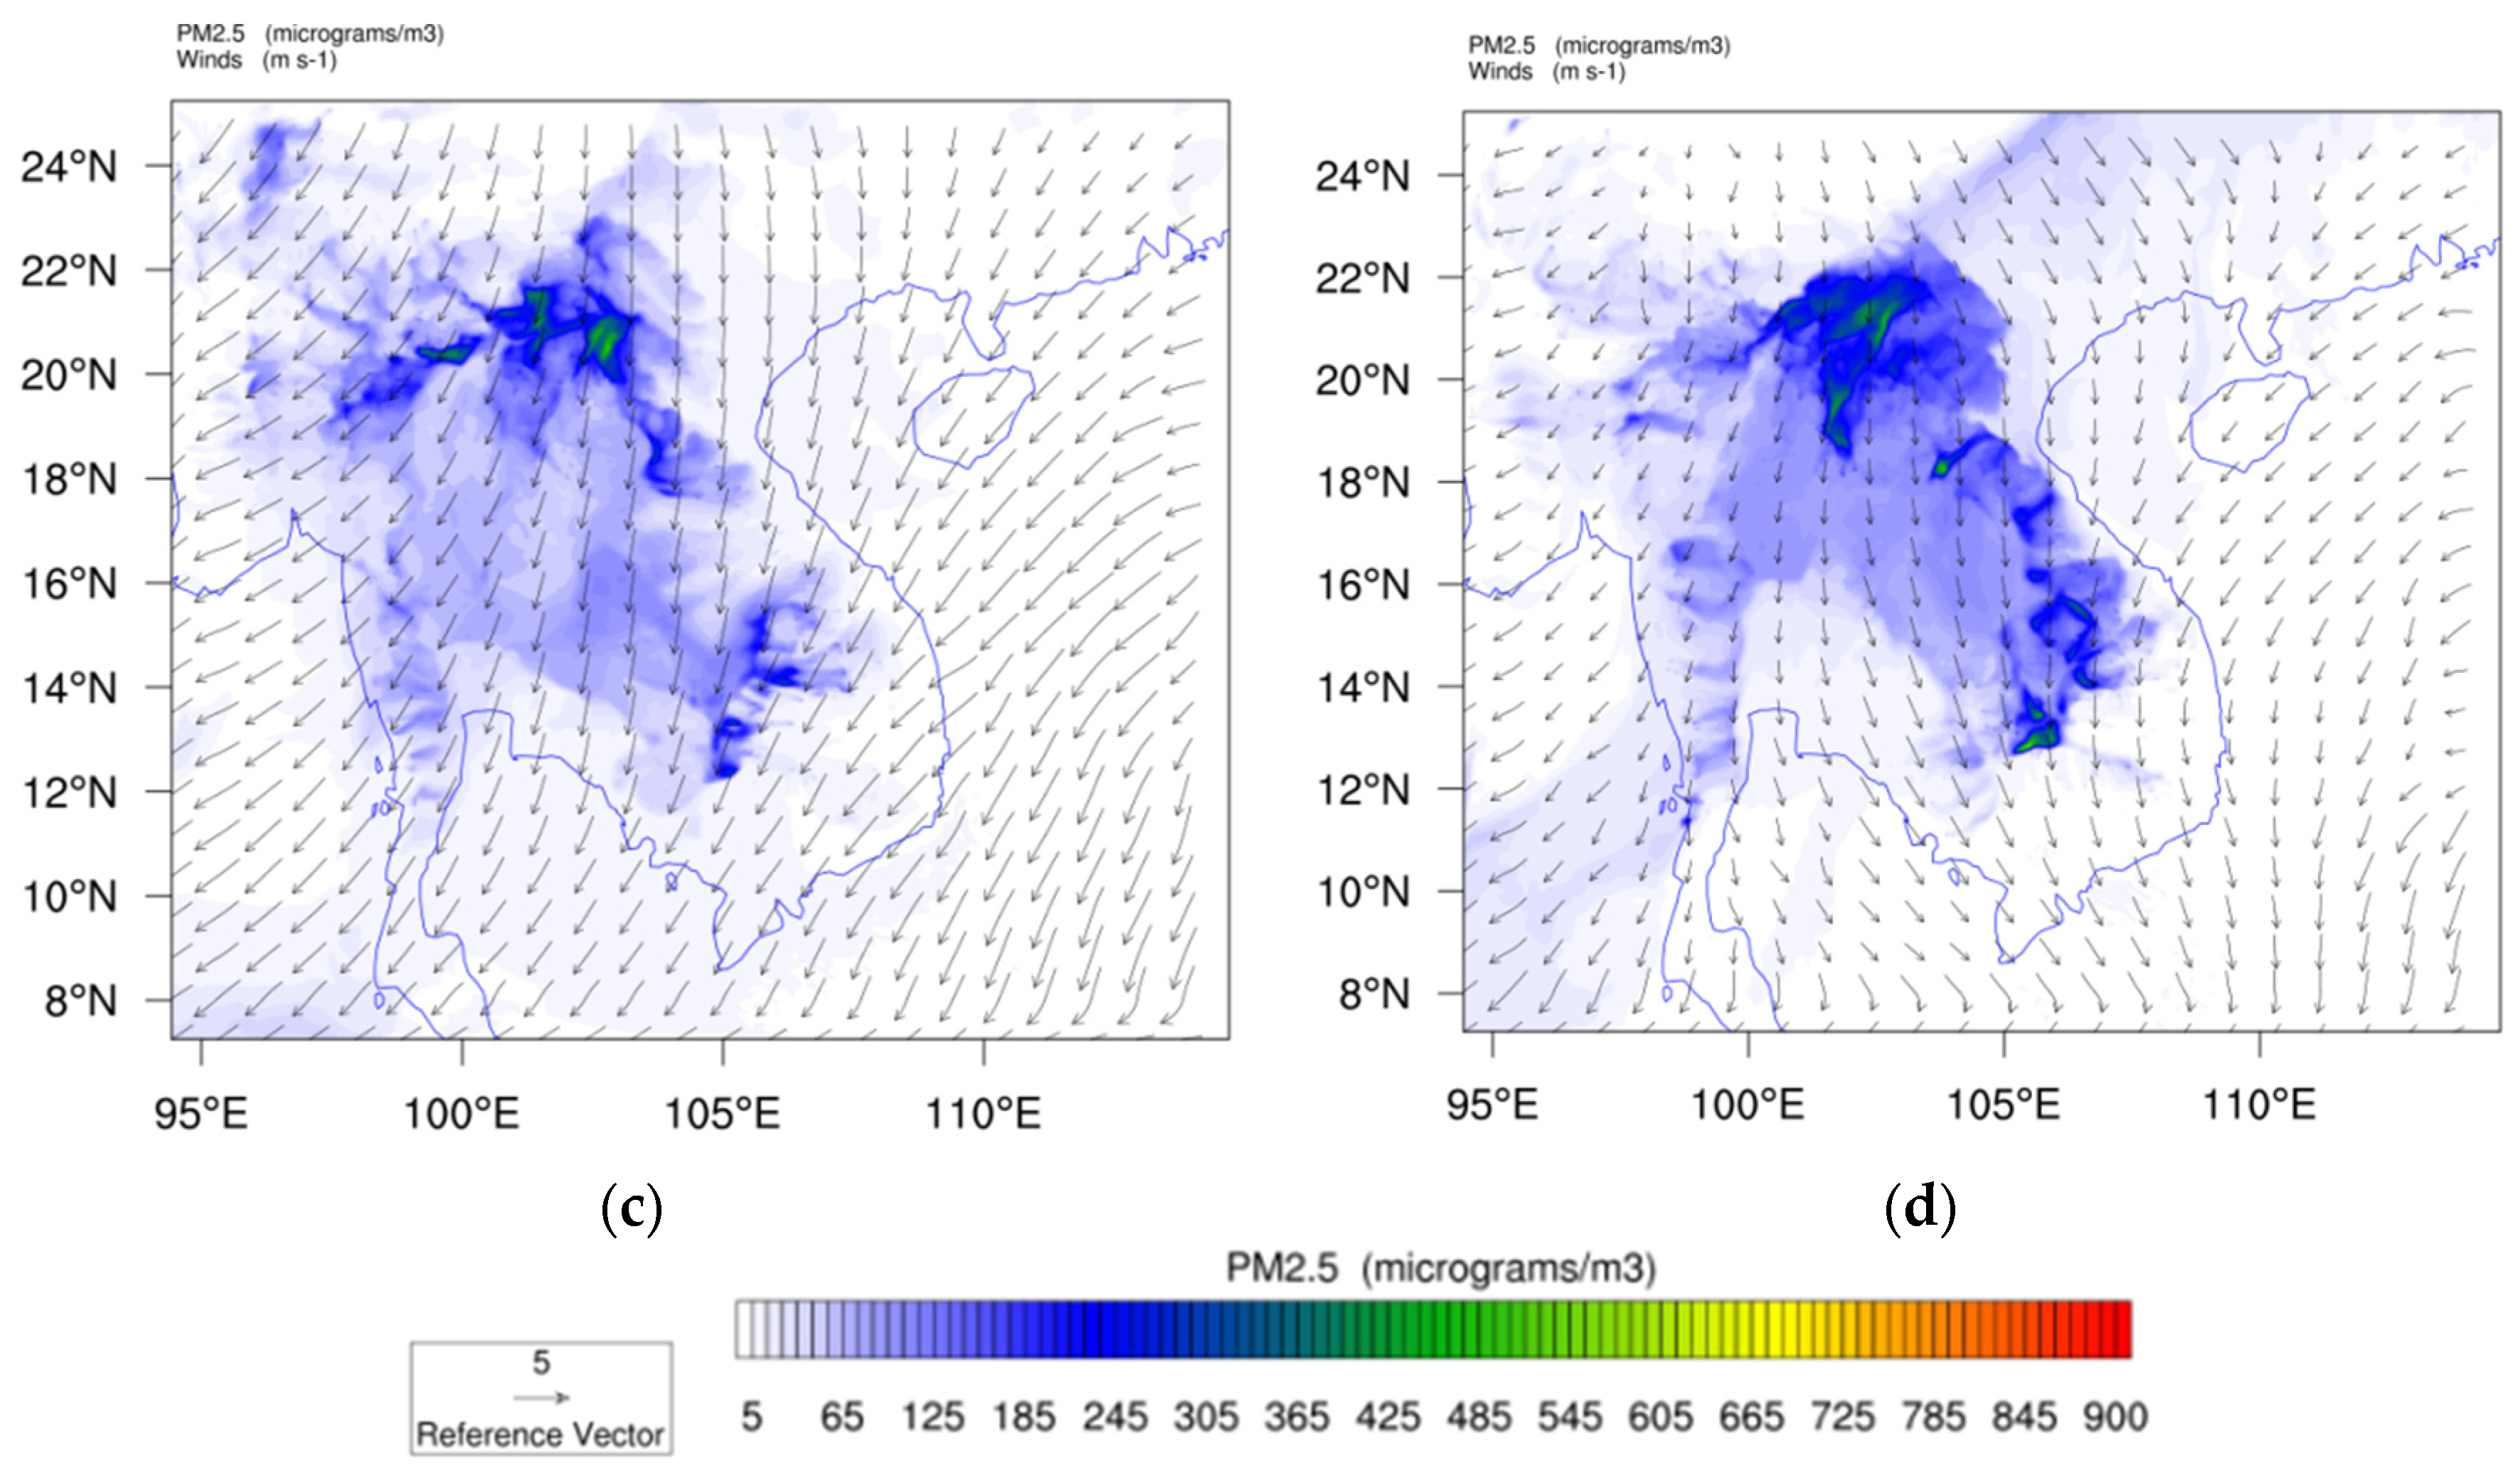
The predicted wind field and ground concentration of PM
2.5 over the domain for each hour during the simulation period from 13 to 20 March 2019 are obtained and some of the plots on the day and time of 13, 15, 17 and 20 March 2019 at 16:00 UTC are shown in
Figure 6.
The surface wind was mostly northernly and north easterly across the domain. As a result, the pollutant emission from fire sources in north, northeast Thailand and Laos was dispersed and transported to central and southern Thailand and northern Cambodia. Transport of pollutants from northern Thailand and Laos to Vietnam, southern China, Taiwan and beyond is facilitated by the Truong Son Mountain range situated along the Laotian-Vietnamese border which acts as a launching pad for pollutants to be carried upwind in the westerly or south westerly flow to higher altitude and hence transported farther in the upper troposphere [
9].
The sources of the anthropogenic emission are located in major cities and populated areas in the simulation domain: Bangkok, Ho Chi Minh City, Hanoi and southern China (including Guangzhou). During the peak of burnings, the anthropogenic emission is much less than those from biomass burning in hot spots. During those days of simulation where peak fires occurred, the gridded PM2.5 concentration across the domain is mostly originated from fire sources. We expect that PM2.5 concentration is dominated by biomass burnings therefore the PM2.5 impact on population health for these days is due mainly to biomass burnings. The WRF-Chem simulation with no biomass burnings scenario during the same period of 13 to 20 March 2019 was performed. In this scenario, only anthropogenic emission was used as input to the WRF-Chem model. This base case prediction of air pollutant PM2.5 concentration will be used to subtract from the PM2.5 prediction of the full simulation with both biomass burnings emission and anthropogenic emission as input to the WRF-Chem model.
From the hourly PM
2.5 concentration as predicted from WRF-Chem model, the spatial distribution of predicted daily average of PM
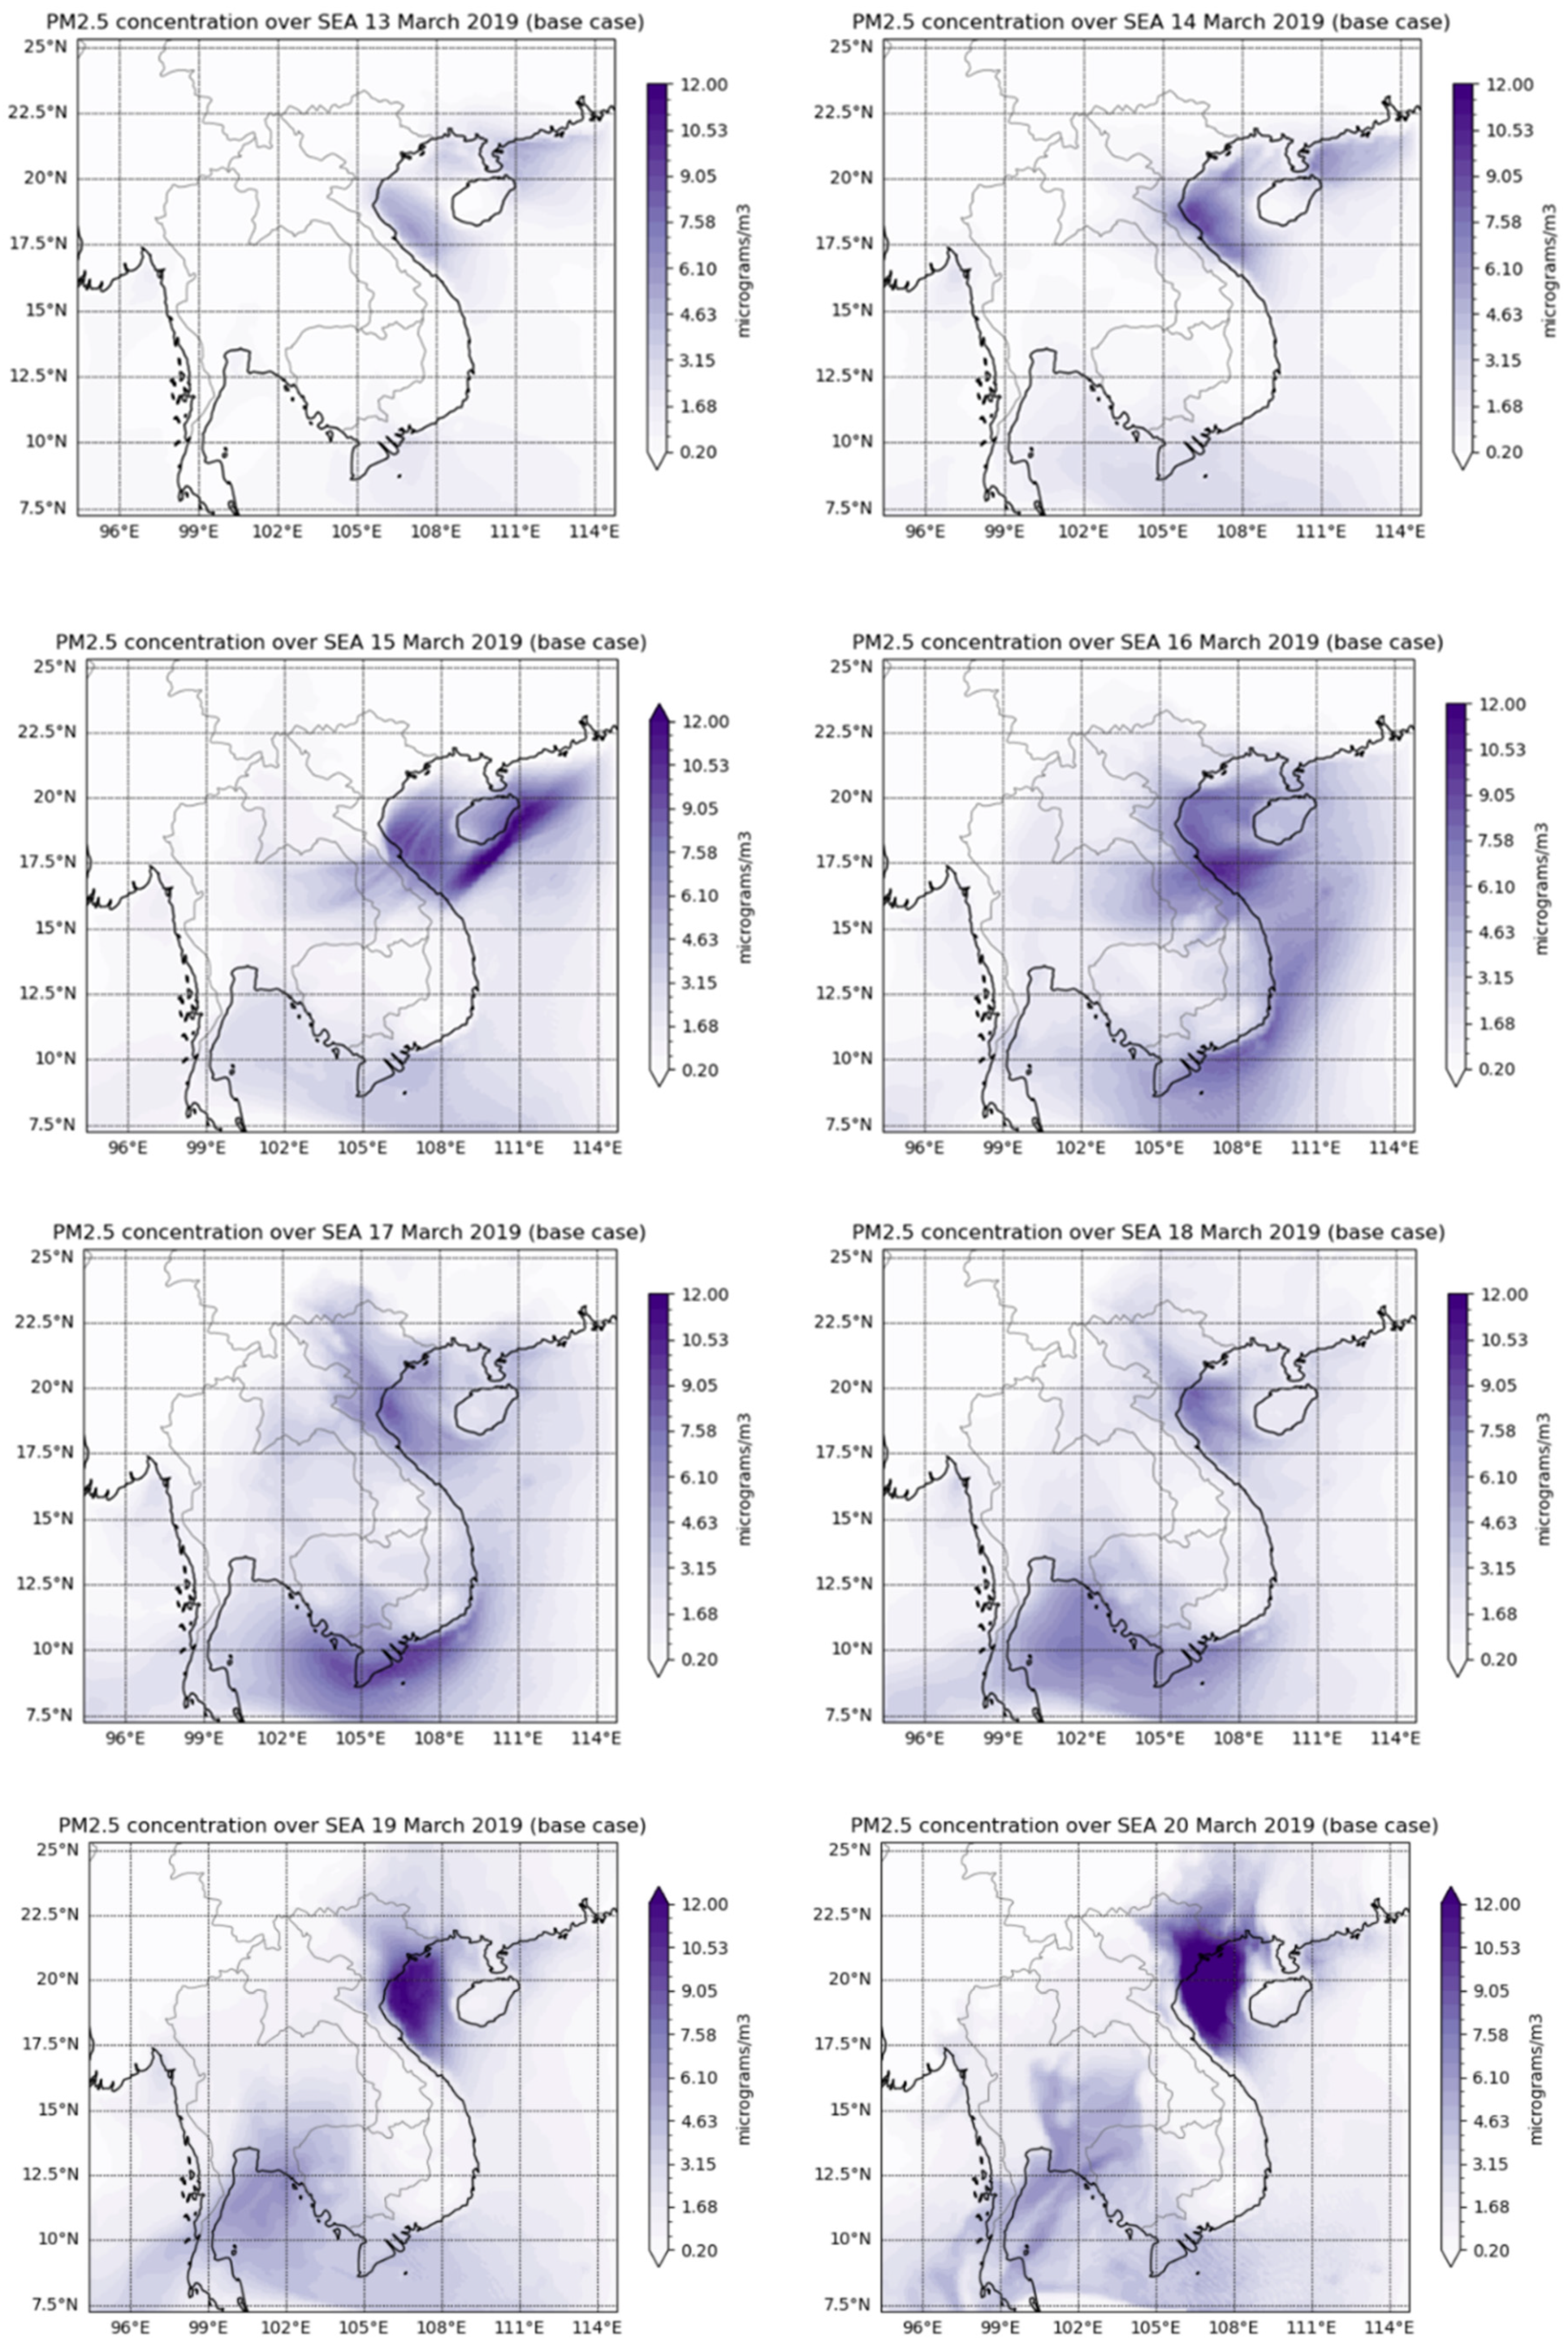
2.5 concentration for the 8 days simulation from 13 to 20 March 2019 are determined for each day. Most of high predicted daily PM
2.5 concentration (~10 μg/m
3) due to anthropogenic sources for the simulation days are over the coast of northern and southern Vietnam as shown in
Figure 7. The northernly and north easterly wind (as shown in
Figure 6) brought the pollutants emitted in southern China, northern and southern Vietnam to the Gulf of Thailand. But the PM
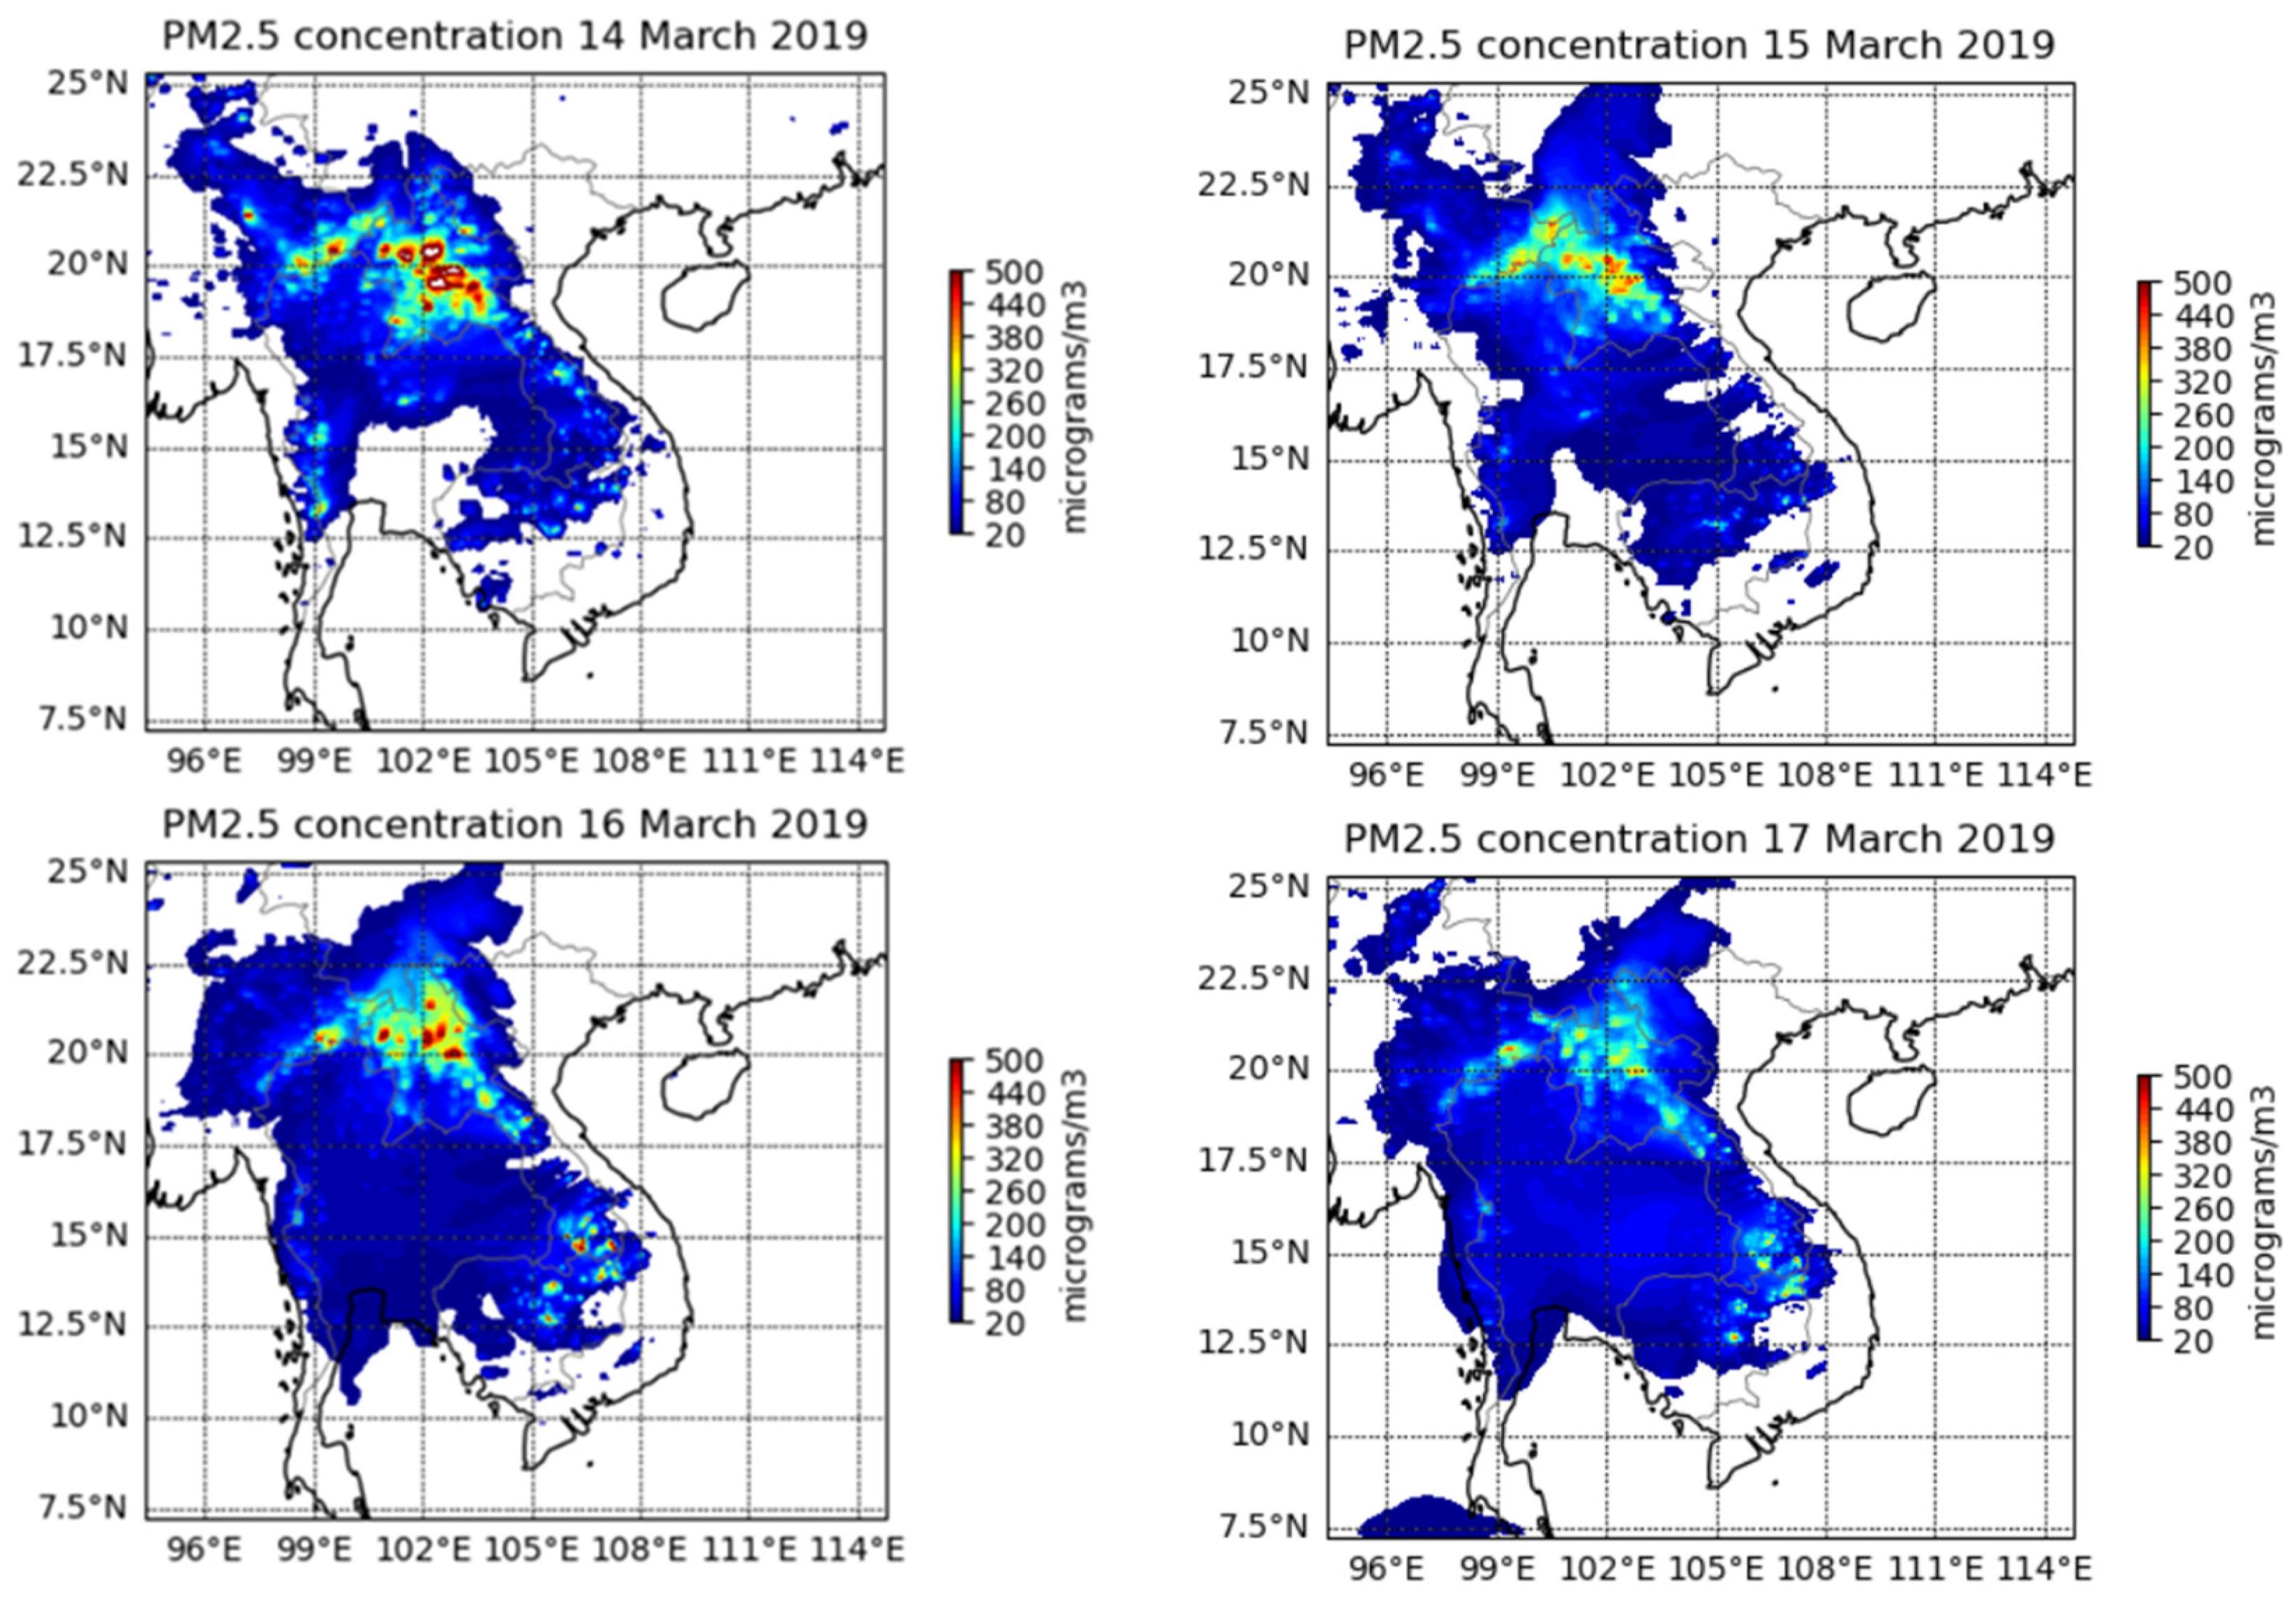
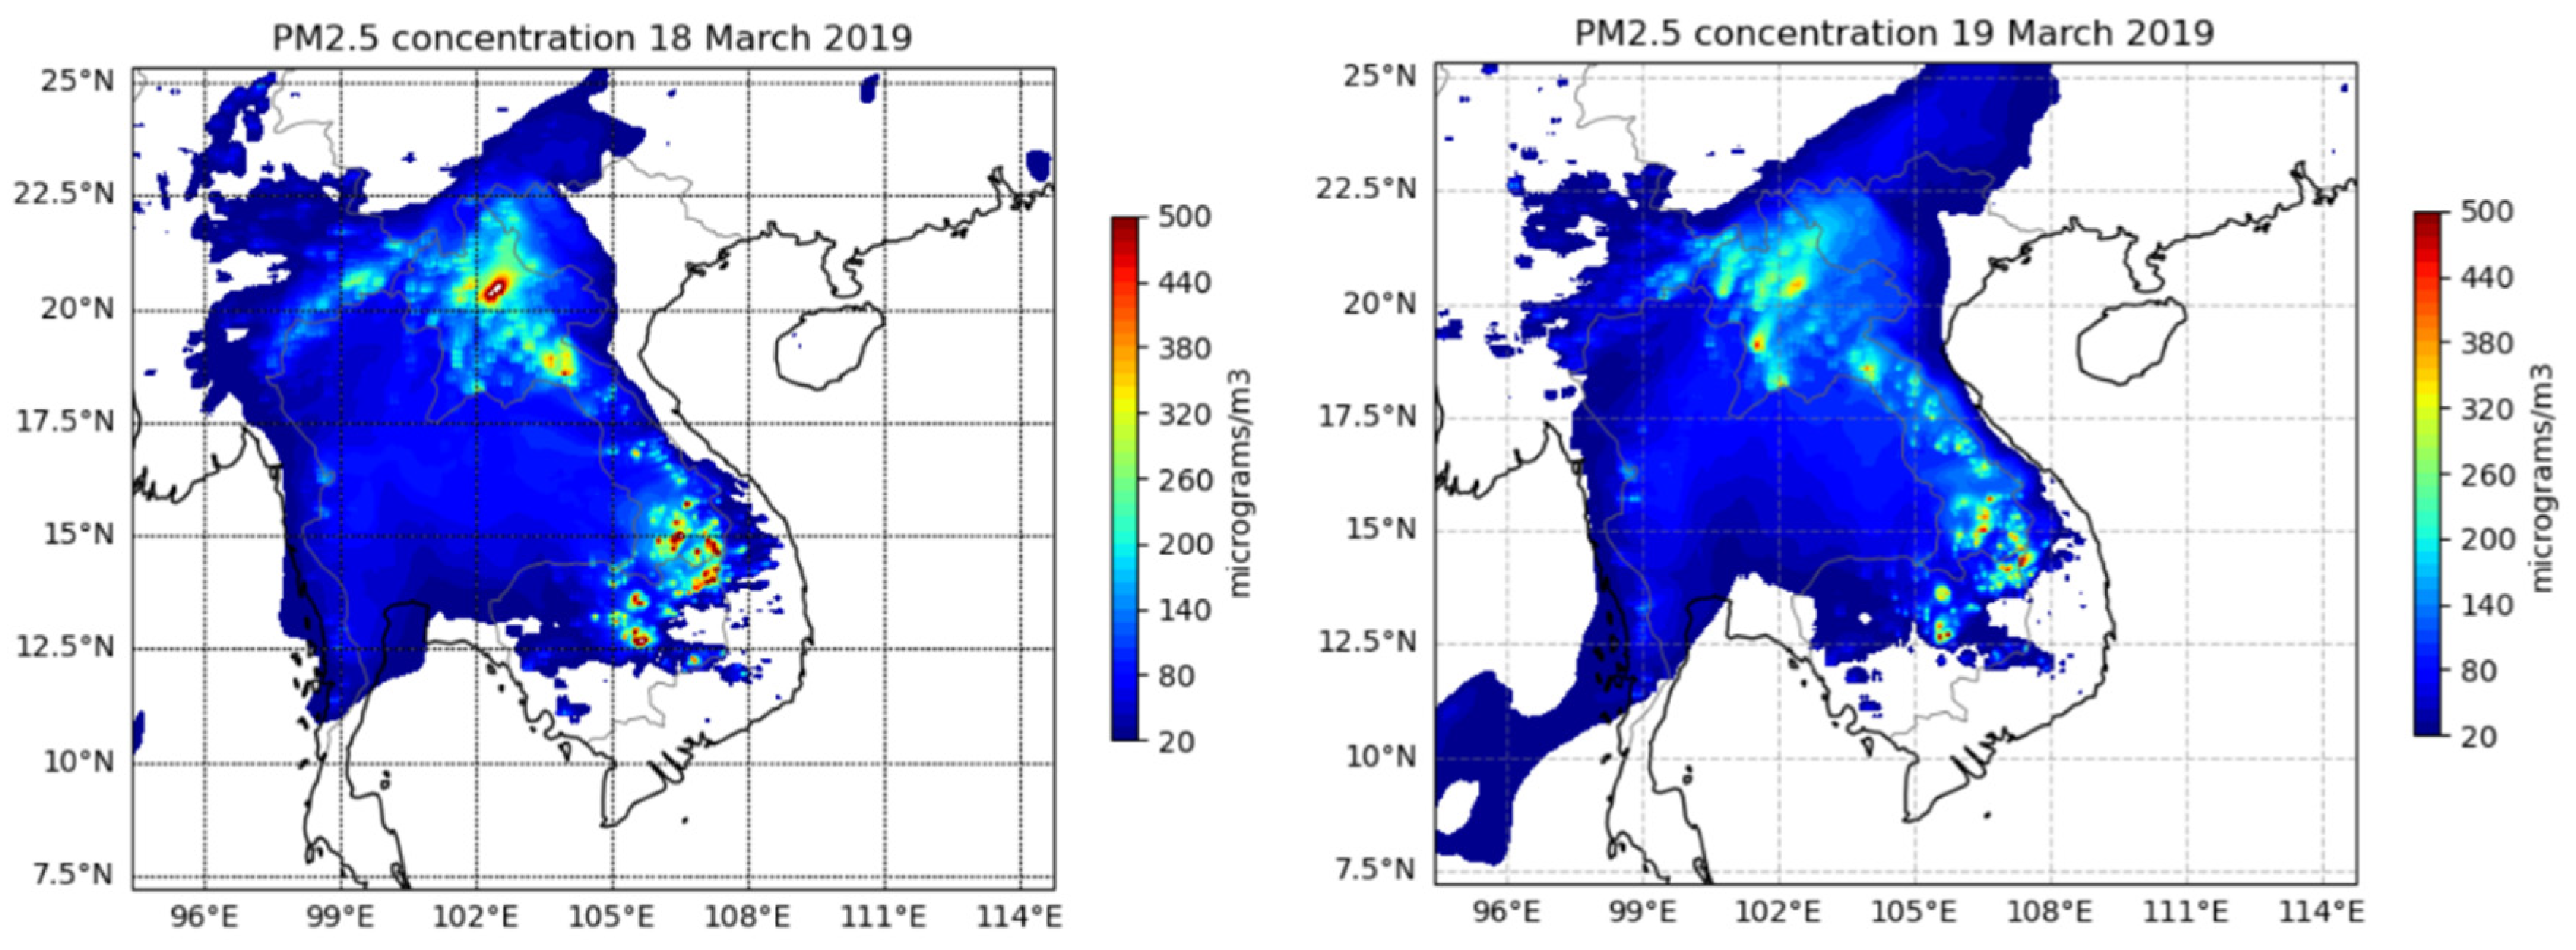
2.5 concentration due to anthropogenic emission are still very low compared to the those due to the biomass burnings as shown in
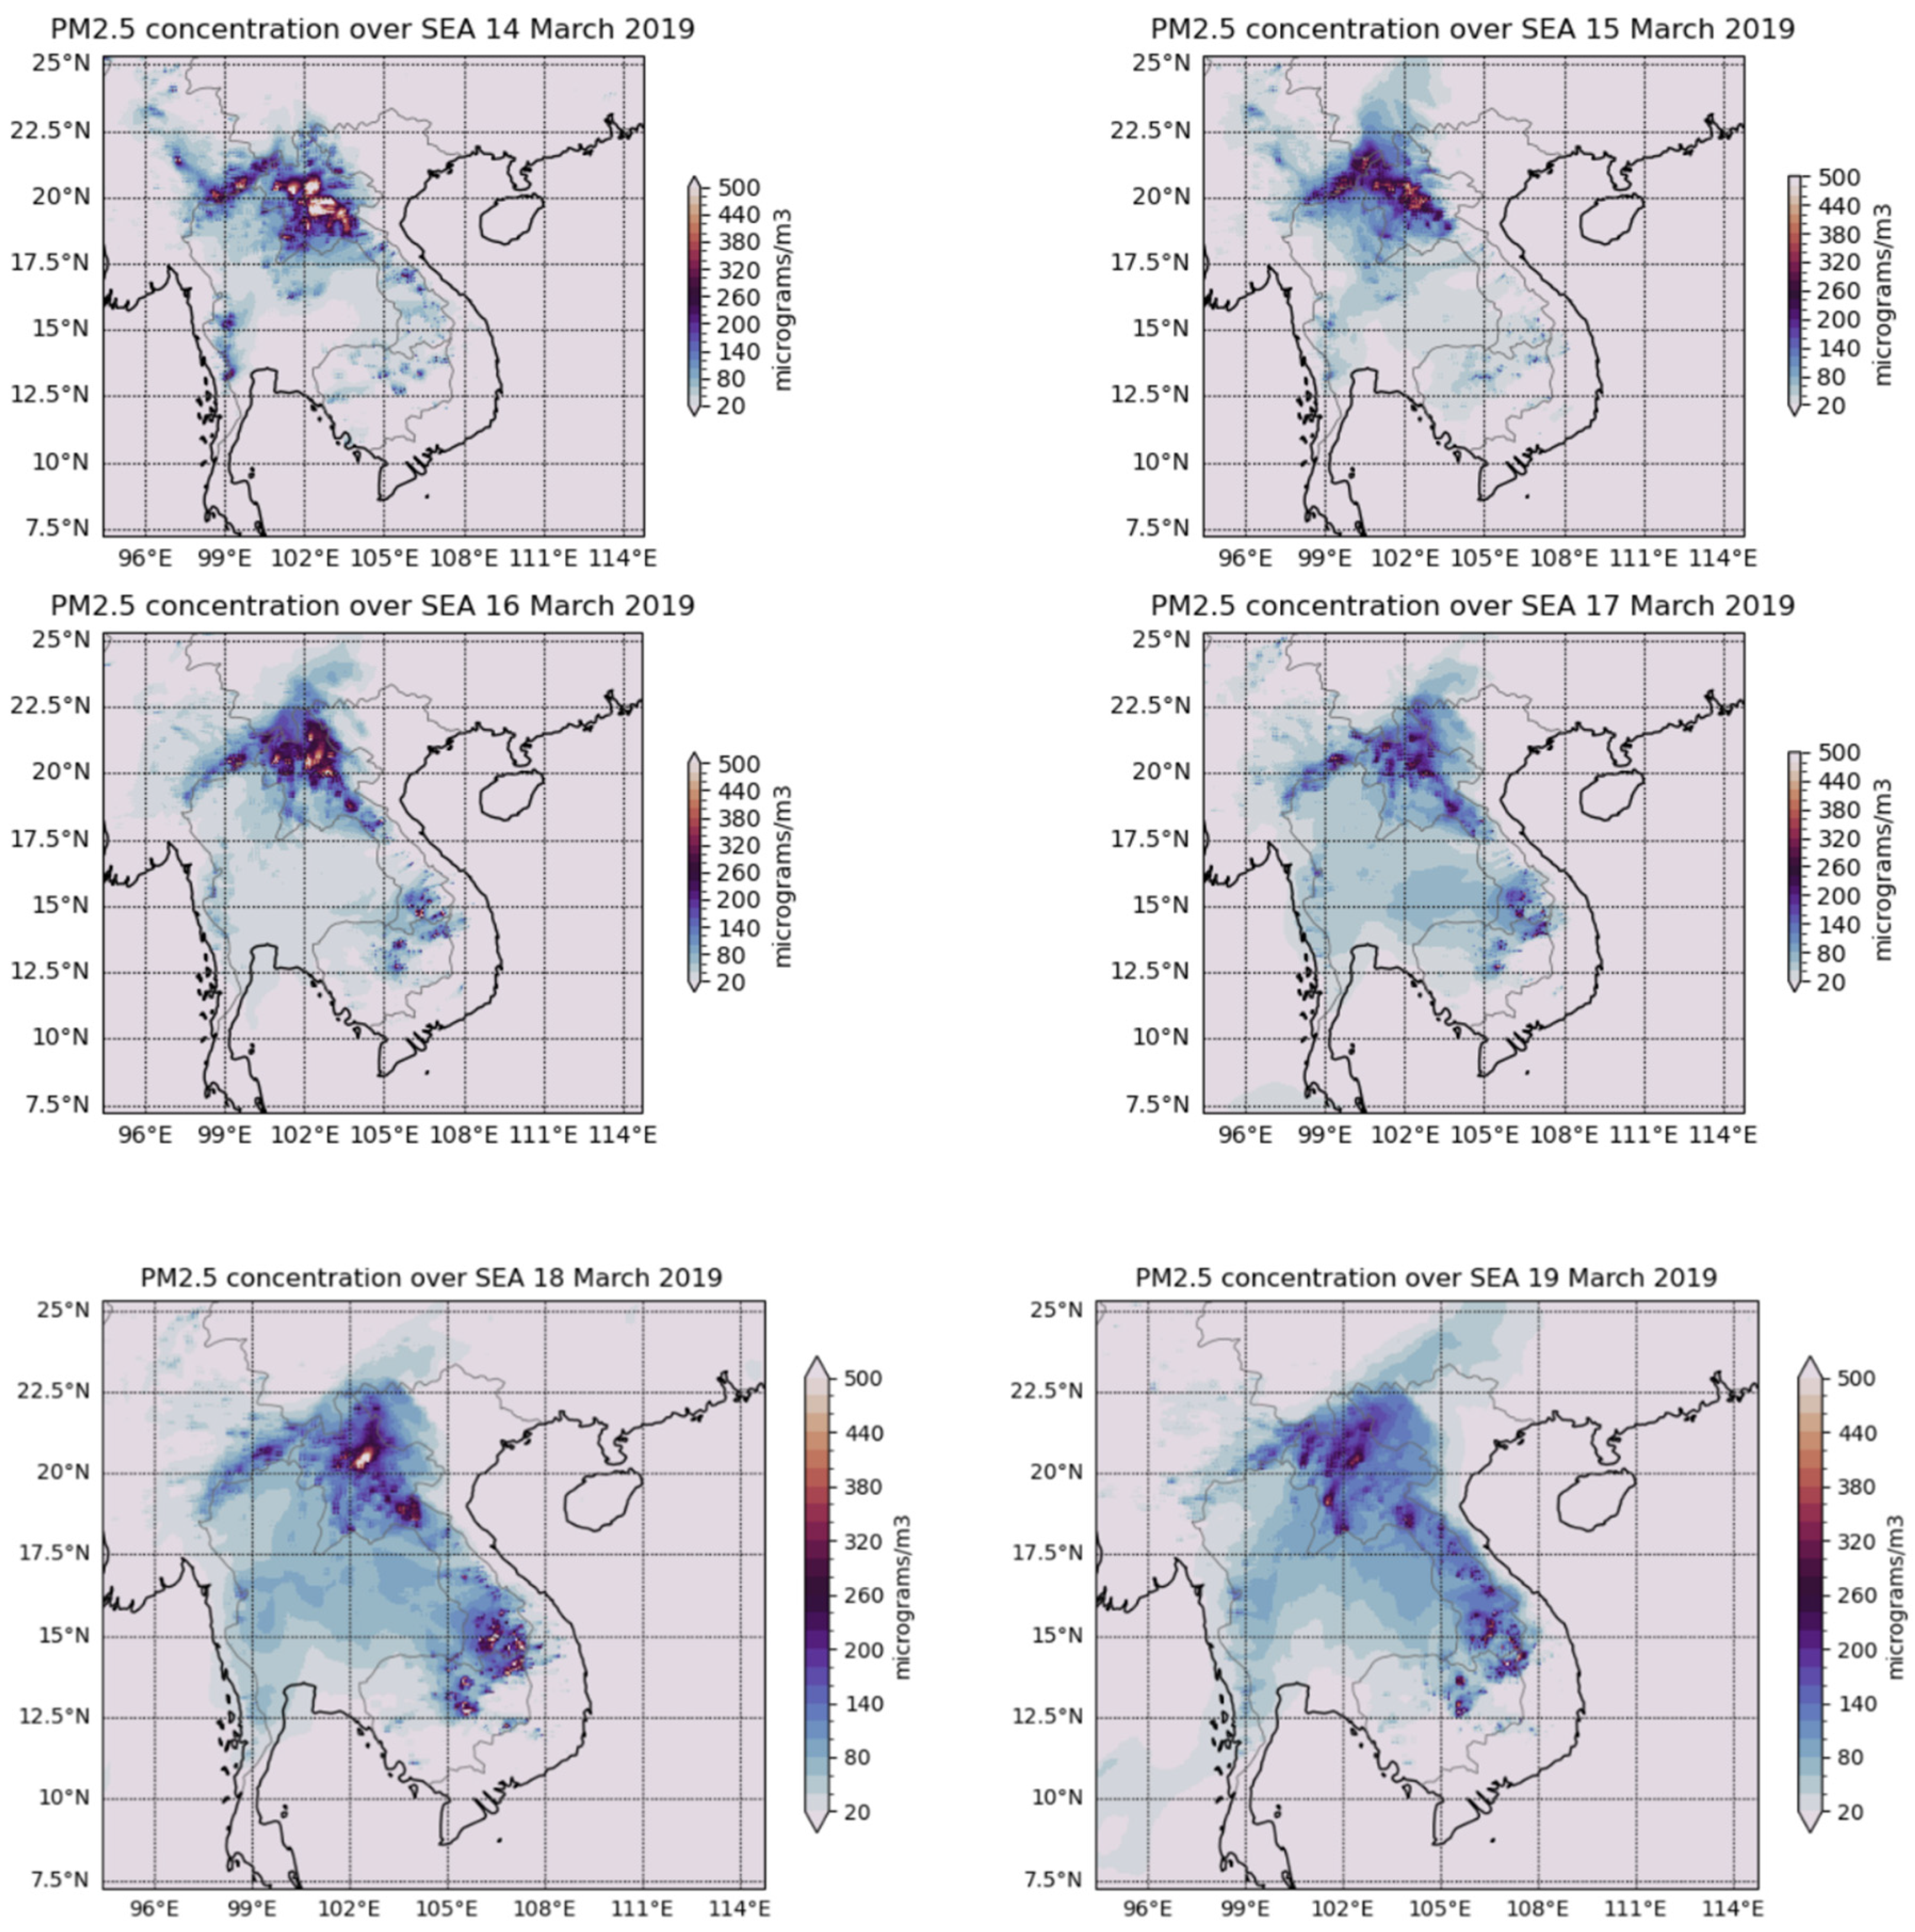
Figure 8. The spatial distribution of predicted PM
2.5 concentration and population health impact (mortality, cardiovascular diseases and respiratory diseases hospitalisation) are shown in
Figure 8 and
Figure 9.
While the maximum PM
2.5 concentration can occur in a particular area but if there is no population living there, the exposure to harmful pollutant would be non-existent. But if the amount of PM
2.5 in ambient air over a populated such as urban area then the health impact will be significant. The daily population exposure to PM
2.5 is defined as the daily average PM
2.5 concentration at each grid cell multiplied by the population at the same grid point and summed over the region. Over the whole region, the population weighted average PM
2.5 can be calculated for each of the days during the period 13 to 20 March 2019.
where PM2.5
i and Pop
i is the daily average PM
2.5 concentration and population at the grid cell i
It is clear from
Table 2 that the daily average population-weighted PM
2.5 concentration is highest in Laos followed by Thailand, Cambodia and Vietnam in that order. A summary of the estimated health impact in Vietnam, Thailand, Cambodia and Laos due to biomass burnings from 13 to 20 March 2019 inclusive at the end of dry season in peninsular SEA is shown in
Table 3. It can be seen that the number of premature deaths is highest in Thailand (~2170) as compared to Laos (~277), Vietnam (~565) and Cambodia (~315). Although the population of Thailand is less than that of Vietnam but high daily concentration of PM
2.5 were mostly over the central and northern Thailand where population centres were located while much less PM
2.5 concentration occurred in Vietnam. Laos has the least mortality as it has the least population among the 4 countries but has the highest proportion of death over population due to high population weighted PM
2.5 concentration. High predicted daily PM
2.5 concentration over most of Laos accounts for this result.
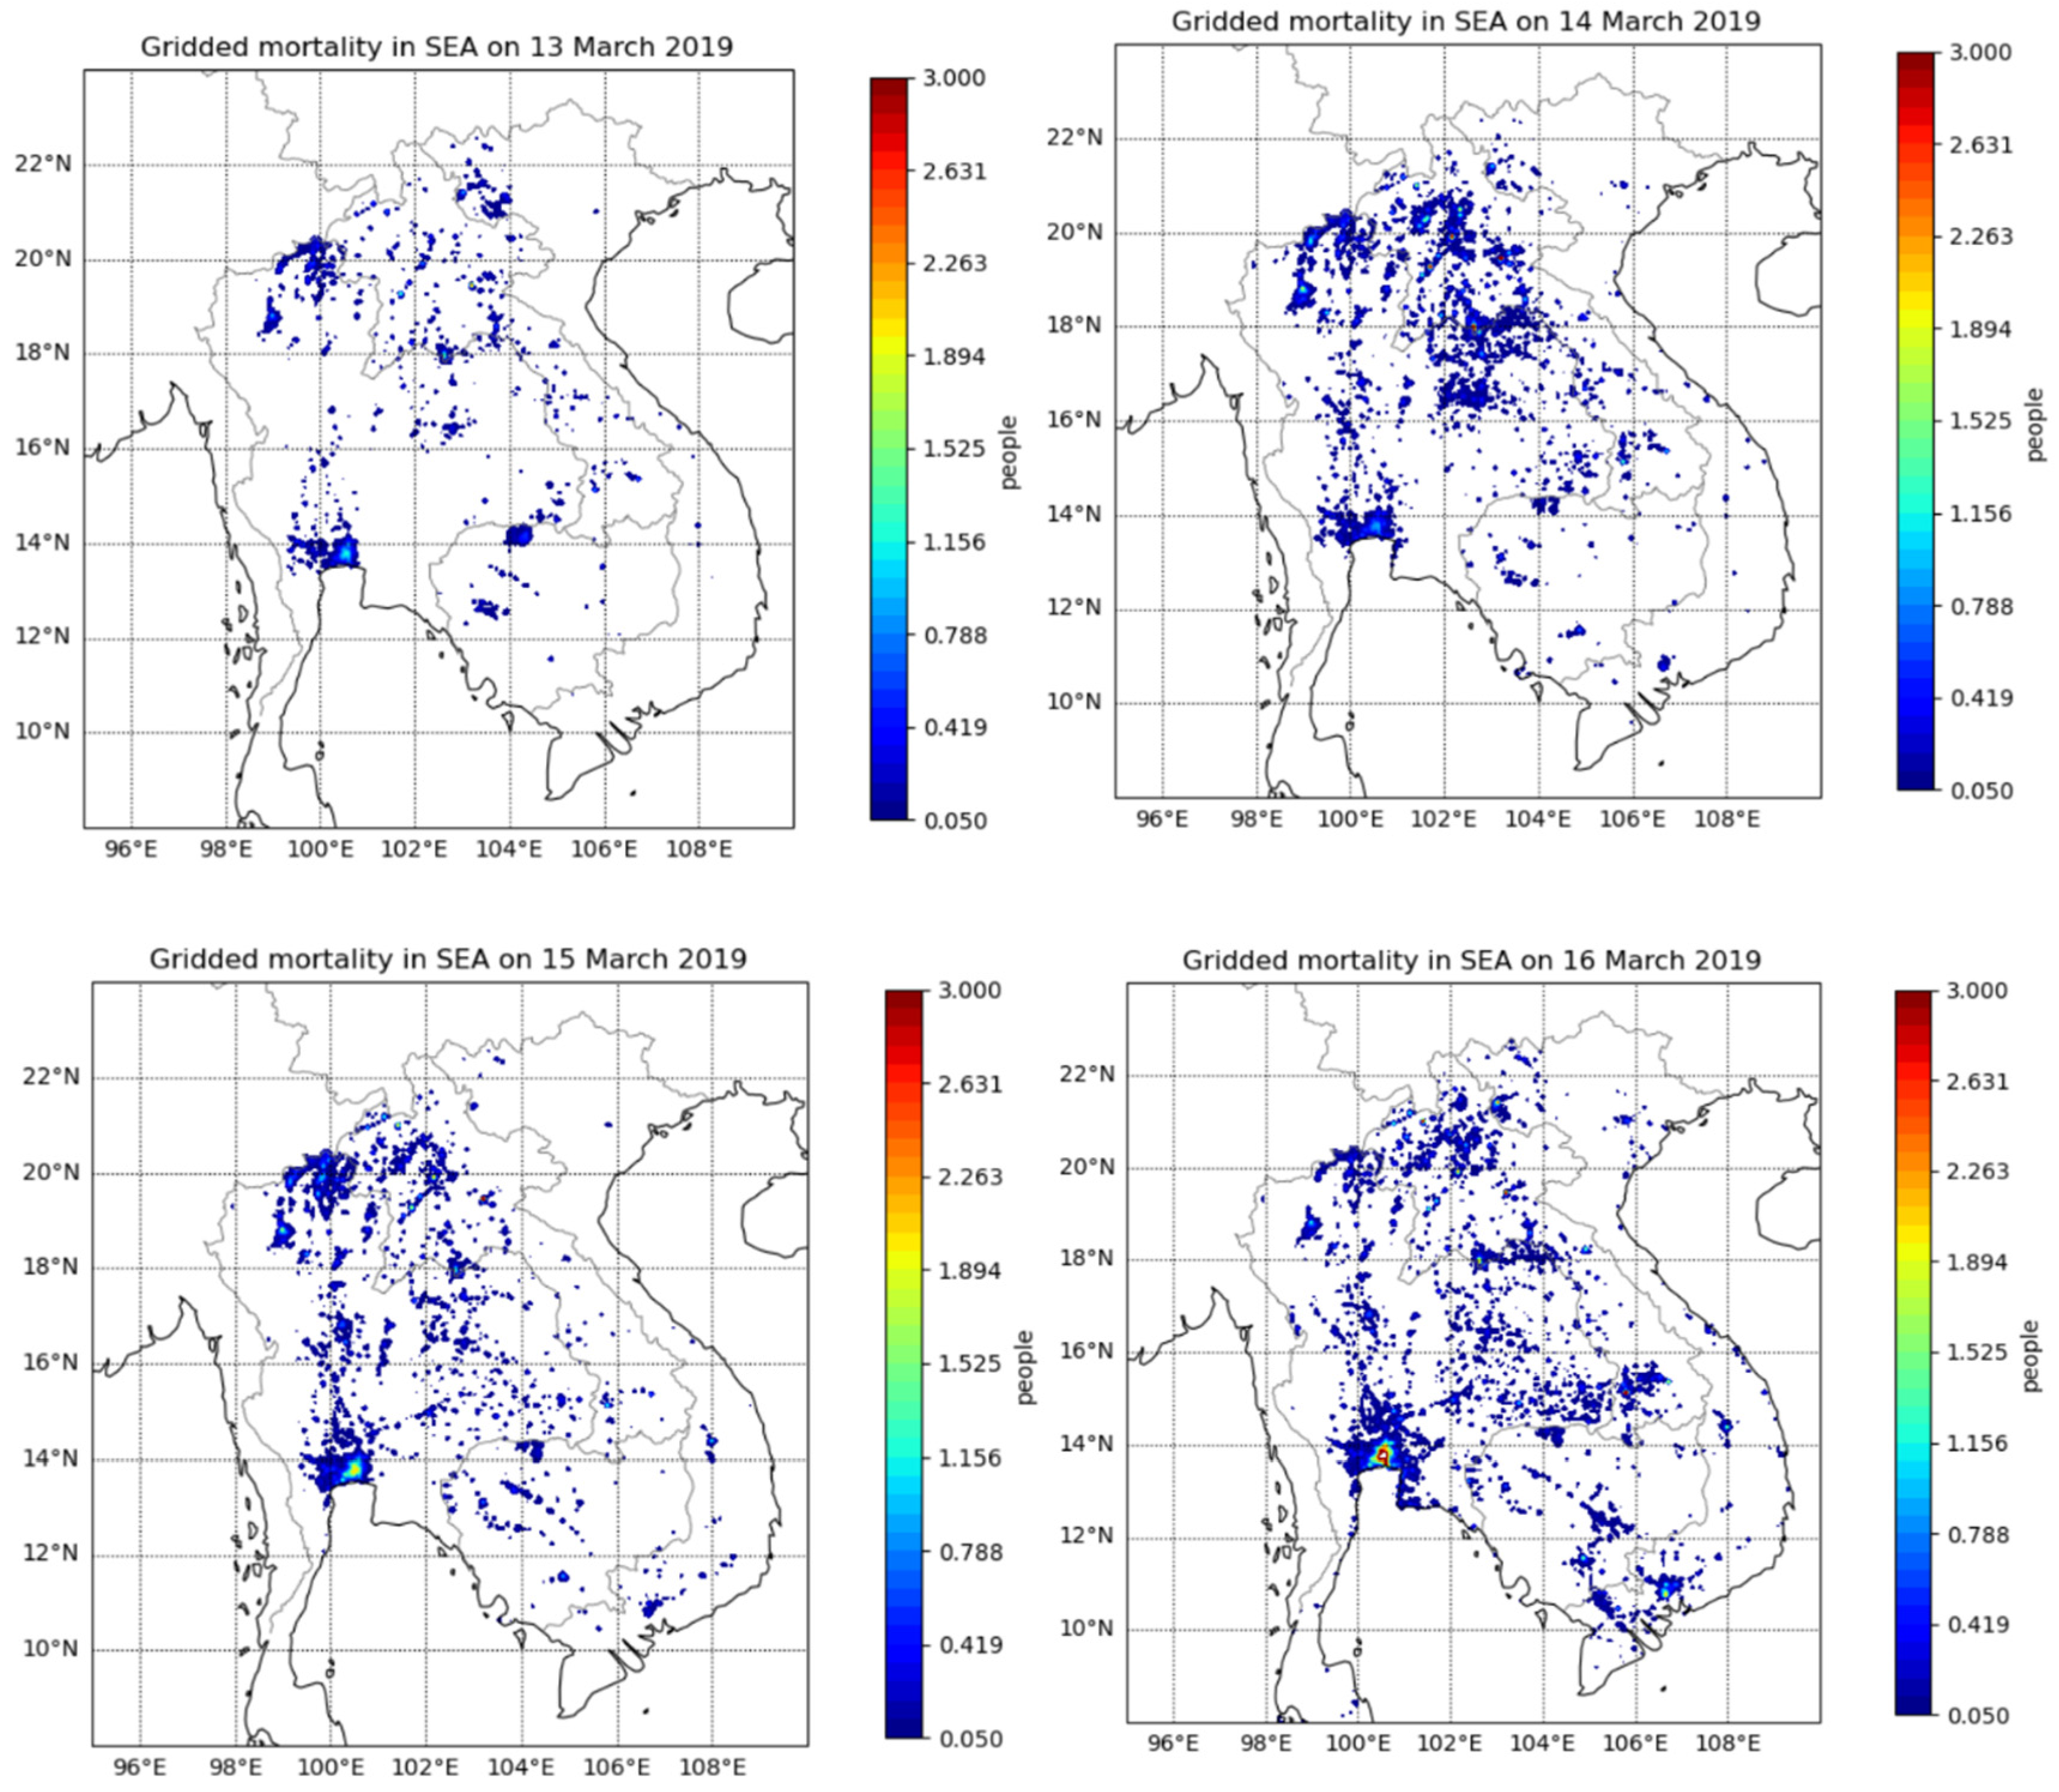
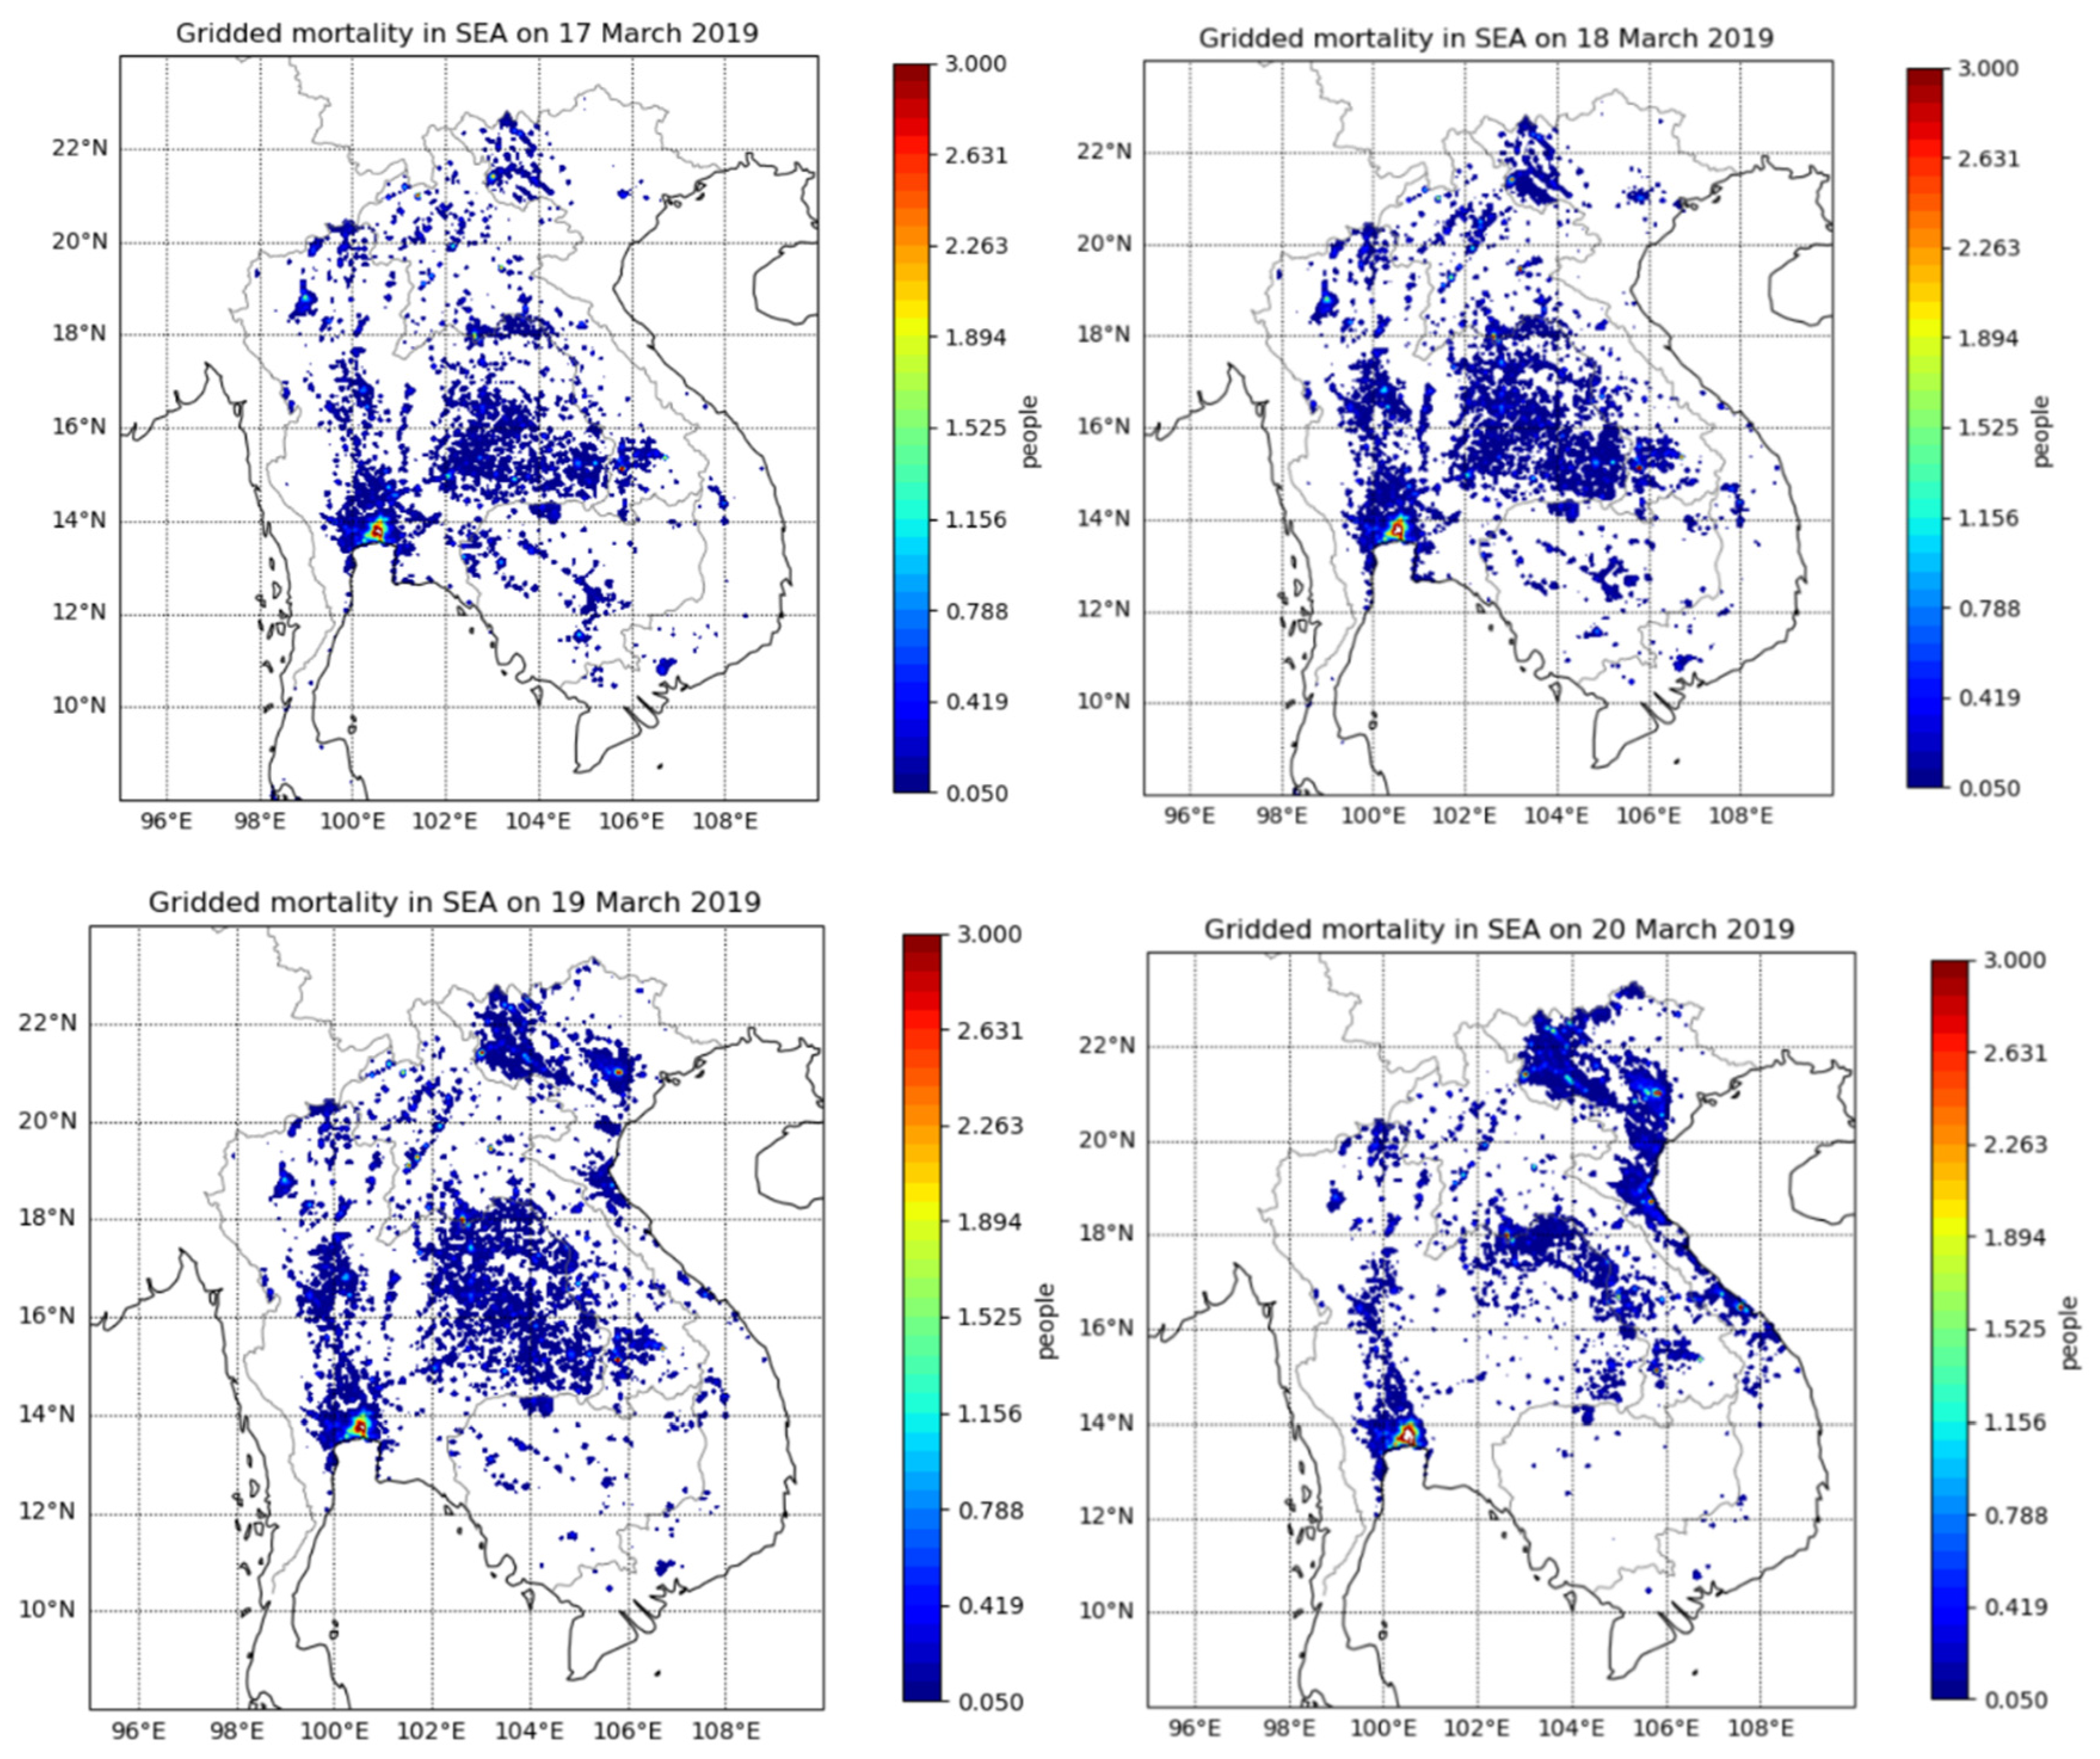
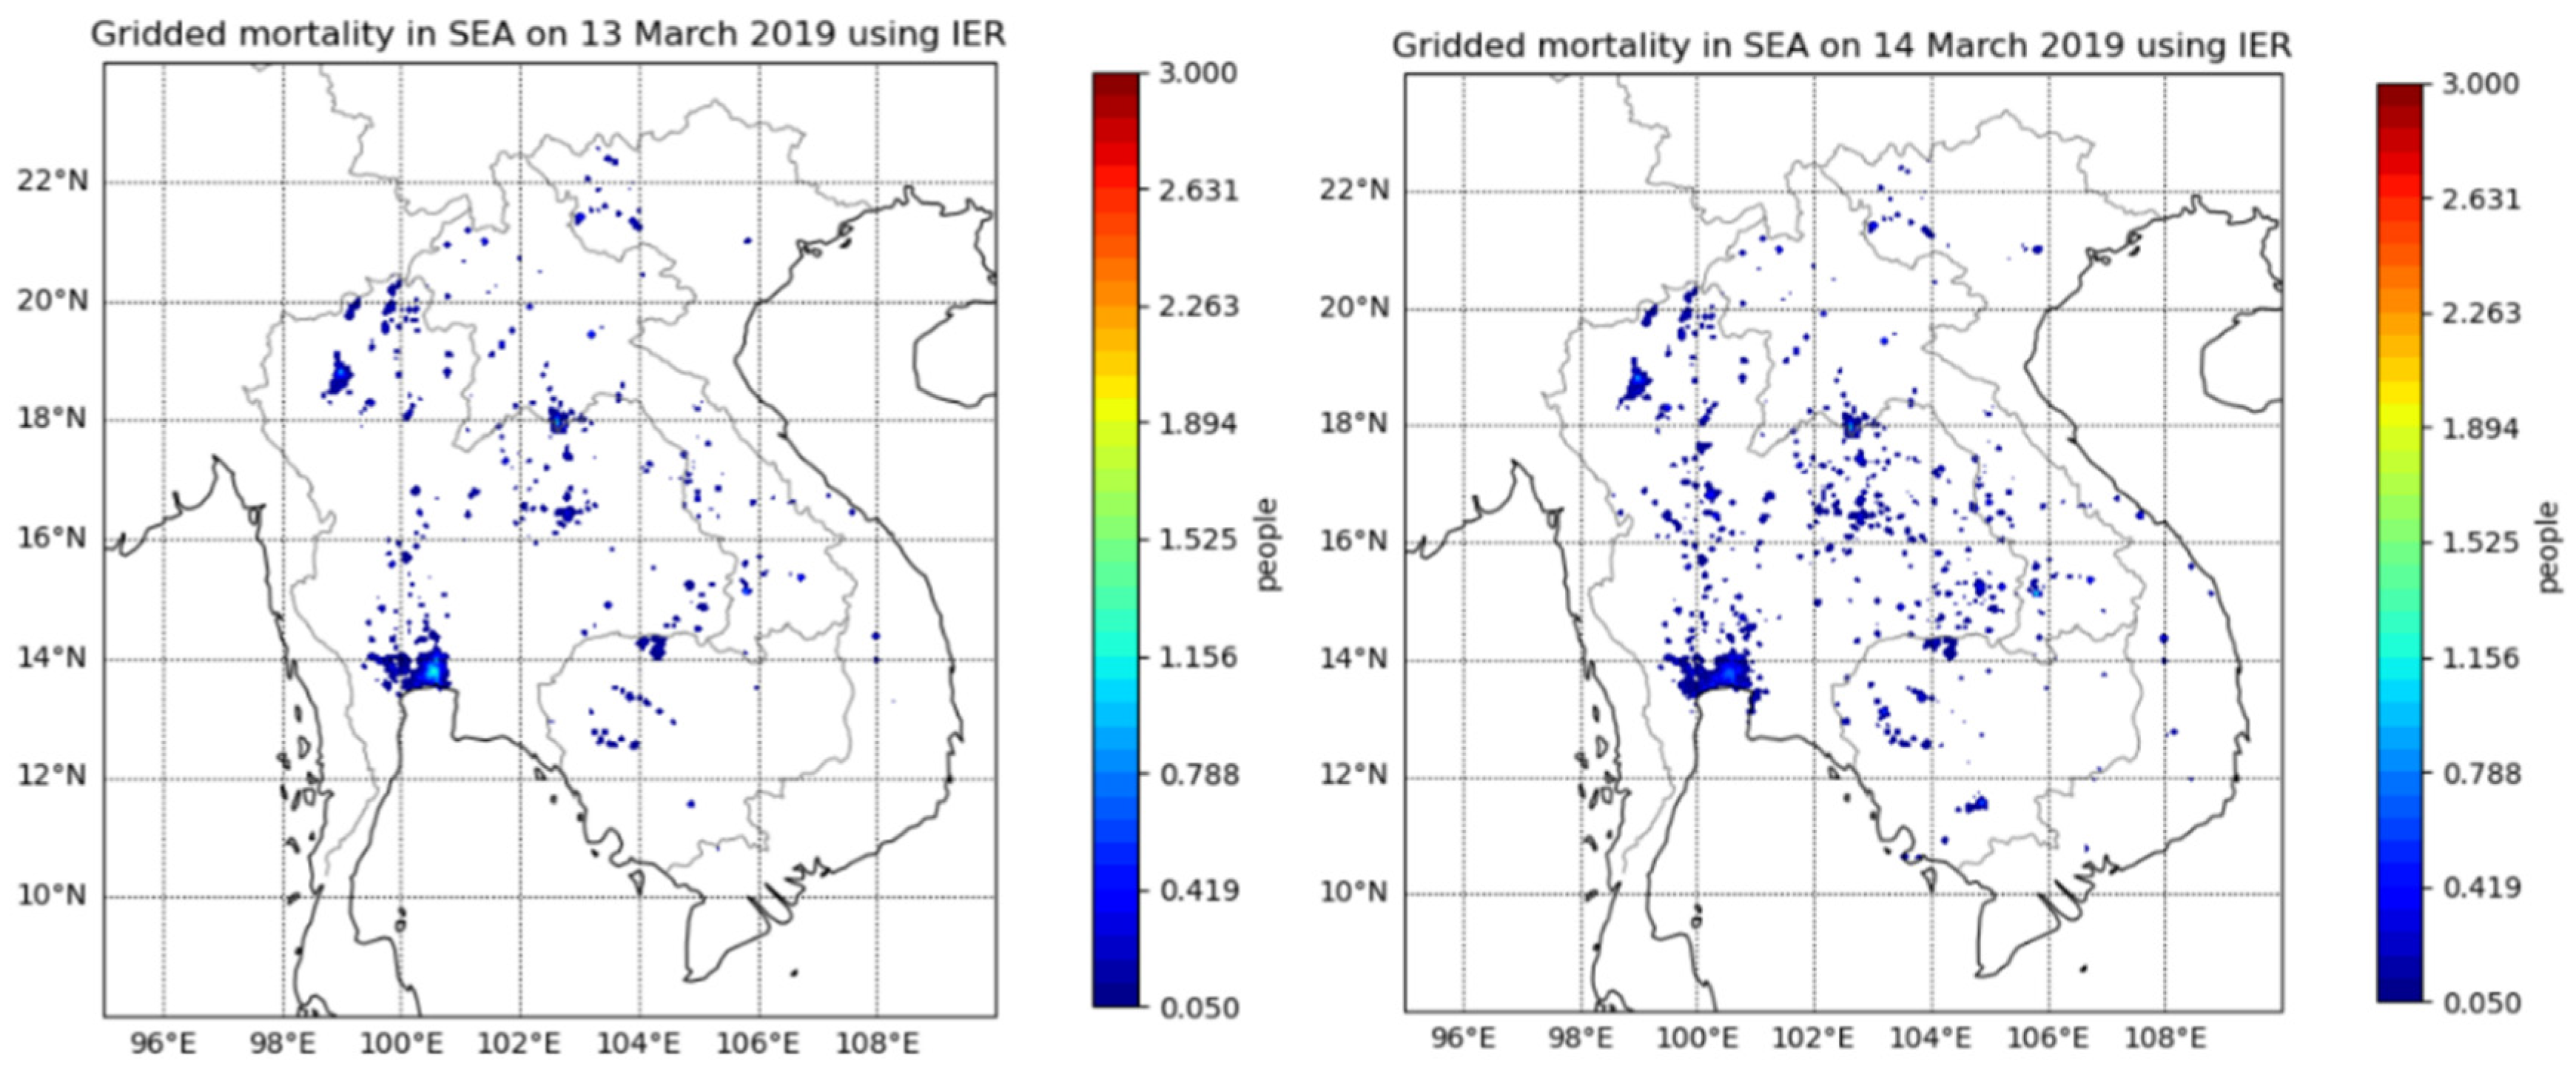
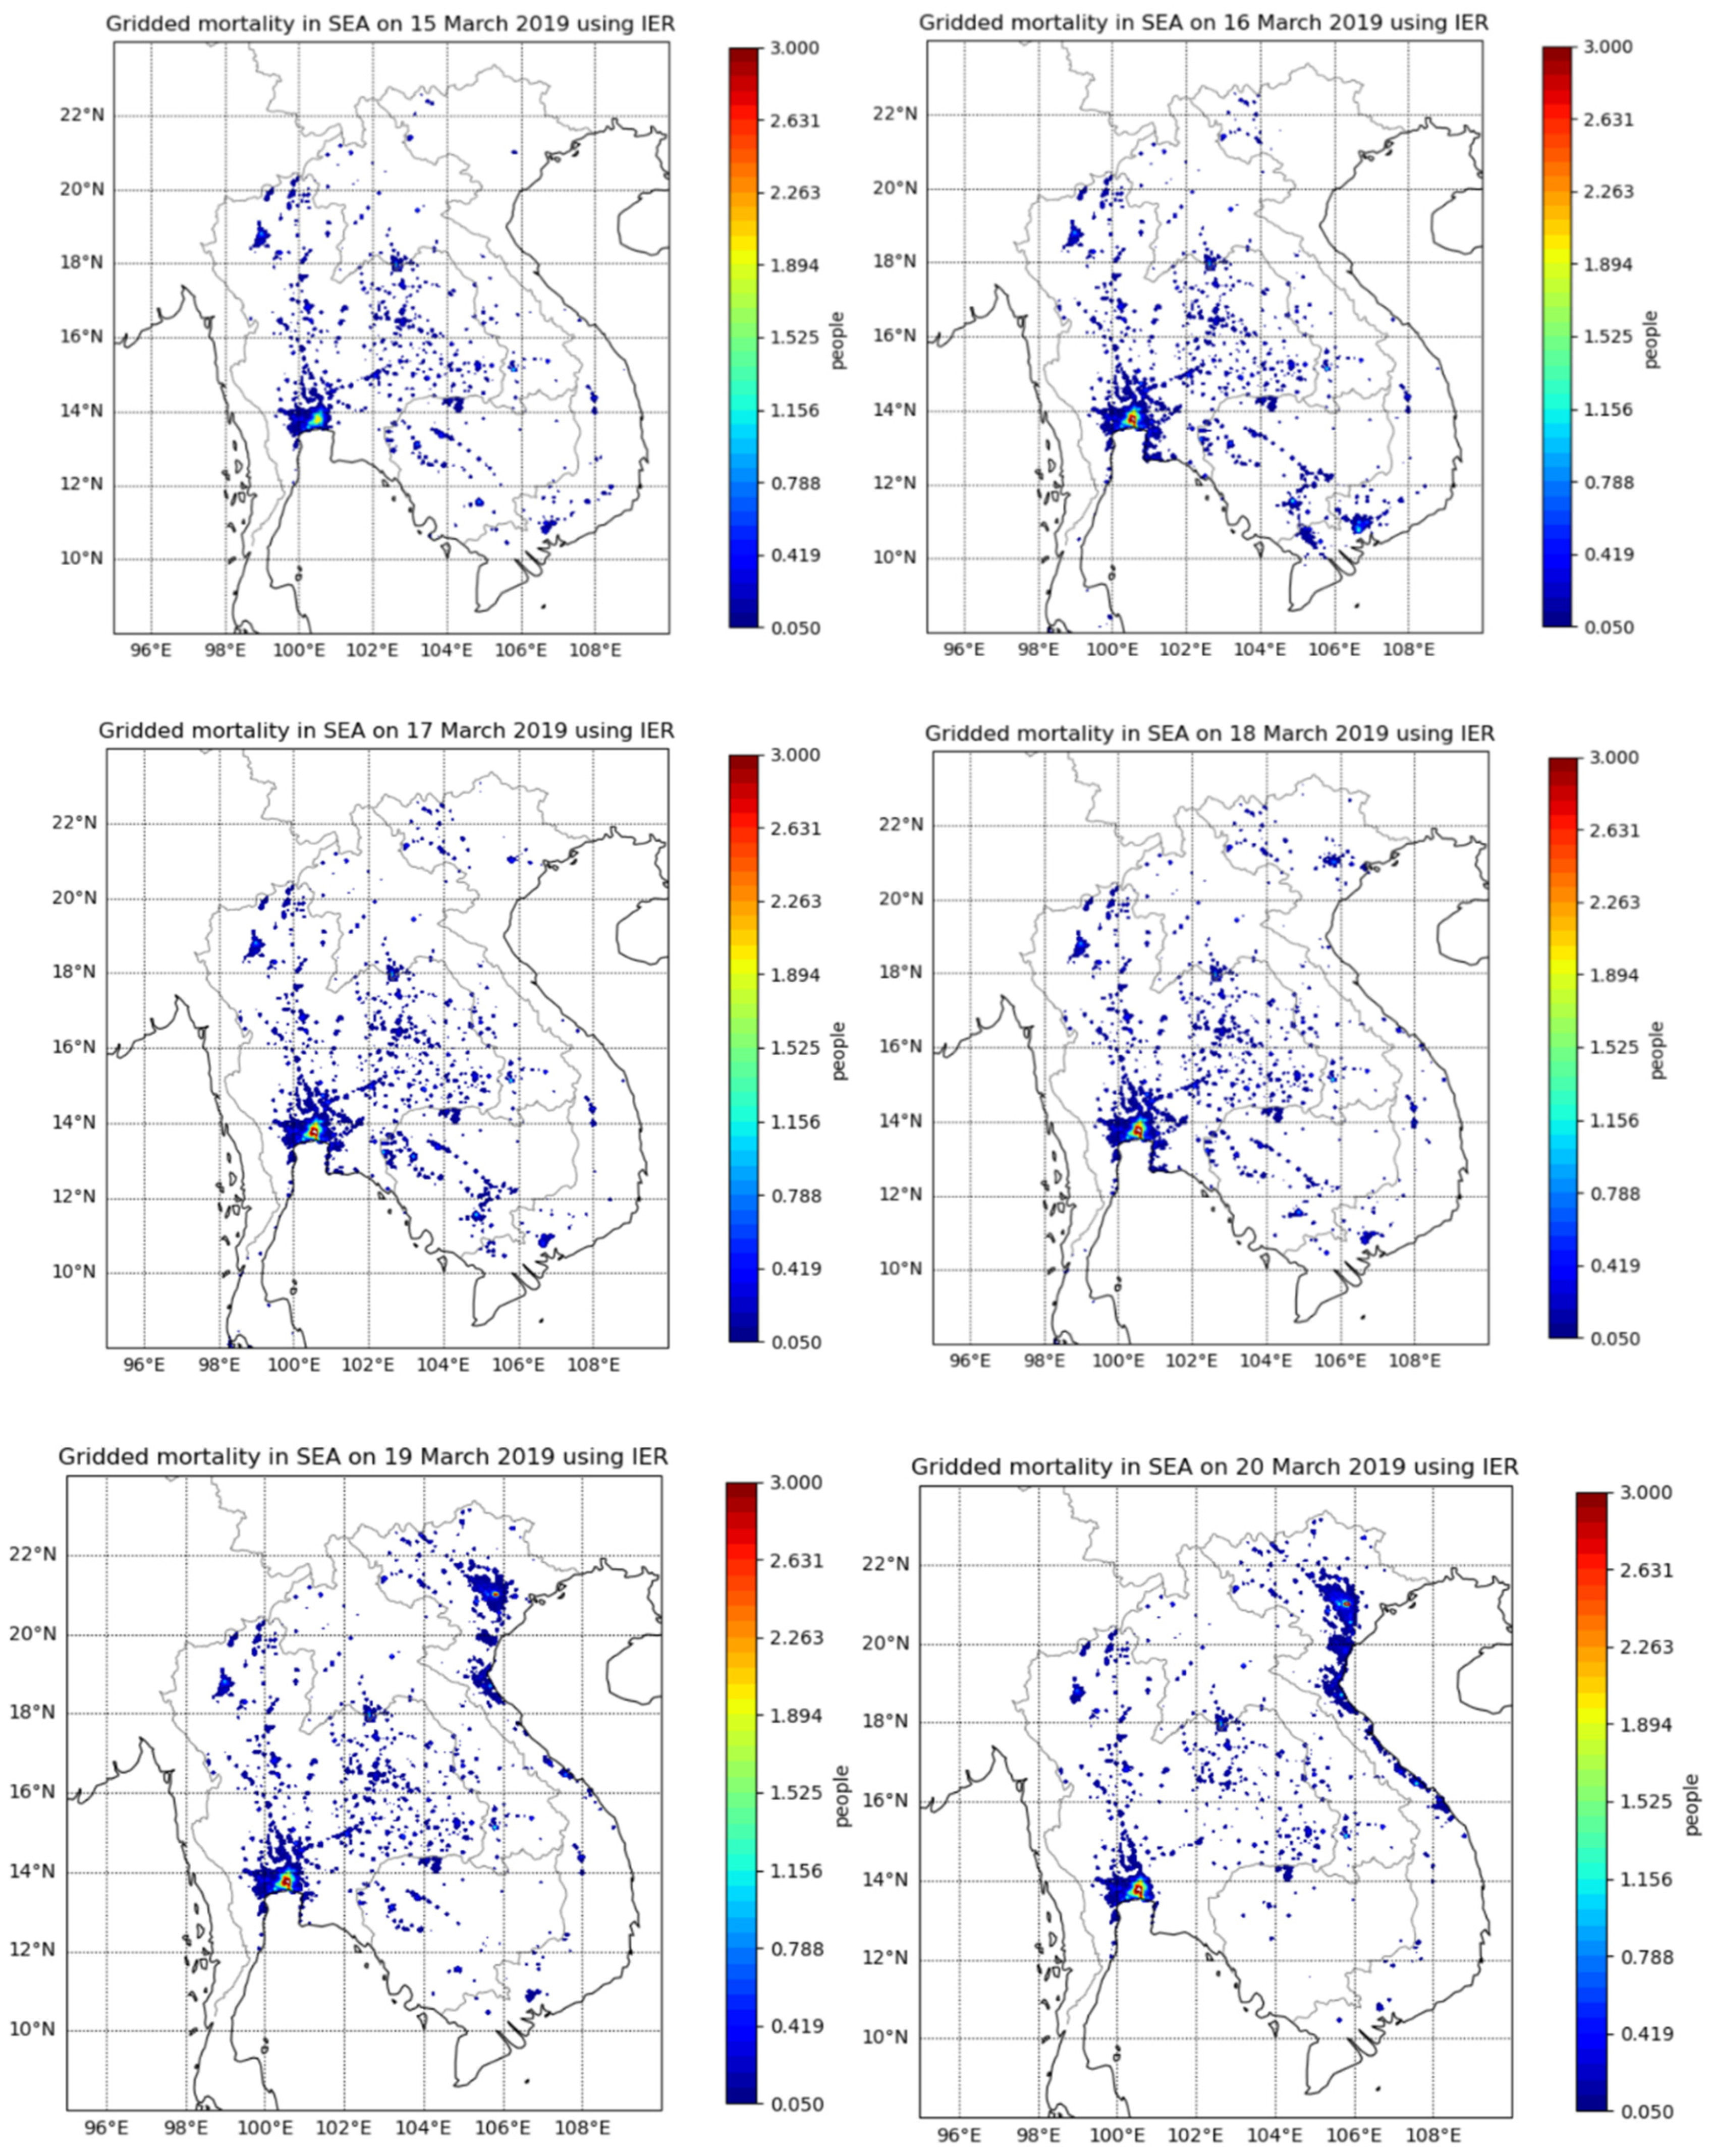
Figure 9 shows the gridded mortality due to biomass burnings for each day from 13 to 20 March 2019. High concentration of PM
2.5 in northeast Thailand and northern Laos accounts for most of the mortality in these regions. Even though Vietnam has high density of population compared to other countries but the mortality in term of proportion of population is low due to the low concentration of PM
2.5 transported from the fires in the neighbouring countries. Bangkok metropolitan area even though has lower PM
2.5 concentration due to the fires as compared to those in northeast Thailand and northern Laos but the high population density in Bangkok results in higher exposure to smoke particles and hence higher mortality. Similarly in Vietnam and Cambodia, the metropolitan areas of Ho Chi Minh City and Phnom Penh accounts for most of the mortality in these countries respectively. Hanoi also accounts for high mortality in Vietnam especially on the 18, 19 and 20 March 2019 as shown in
Figure 9 when the PM
2.5 plumes extend from Laos and Thailand to northern and central Vietnam (see Figure A3 in
Appendix 3 of the plumes on those days).
For comparison, gridded daily mortality in SEA based on log-linear impact function is shown in
Figure A4 of
Appendix 4.
Our findings for Thailand can be compared with the study conducted by [
41] which estimated the health impact in Thailand due to biomass burnings (including agricultural burnings and forest fires) in 2016. Using vegetation type cover and back trajectory analysis with HYSPLIT during biomass burnings in Thailand in 2016, Punsompong et al. 2020 [
41] estimated that forest fire predominated in the mountainous north (73%) and northeast (48%) whereas, in the central region of Thailand, agricultural waste burning predominated (52%). As for grassland, the burning was most influential in the central region (16%) followed by the northeast (11%) and north (5%) regions of Thailand. The spatial distribution results of excess mortality showed the largest burden was in the central region (44%) followed by the northeast (29%), north (18%), and south (9%).
But rather than focussing only on Thailand as in [
41], in our study the health impact assessment due to PM
2.5 pollutants emitted by biomass burnings during the end of the 2019 dry season on the 4 countries of Thailand, Vietnam, Cambodia and Laos are covered. Their results can be compared to those of ours in Thailand. Based on monitoring data instead of modelling, their results on population exposure and health impact in Thailand of biomass burnings in peninsular SEA for 2016 estimated the excess mortality due to PM
2.5 exposure to be about 18,003. The mortality was associated with stroke burden (53%), ischemic heart disease (30%), lung cancer (12%), and chronic obstructive pulmonary disease (5%), based on public-health data from 2016. Our results on the health impact in Thailand during the peak period of the biomass burnings in March 2019 is about 2170 excess mortality as compared to the value of 18,000 for the whole period of 2016 in their study.
Another recent study by [
34] on the health impact and economic cost of open biomass burnings (OBB, including forest fires) in mainland Southeast Asia (MSEA, including Myanmar) during March 2012 is similar in approach to our study. They used the WRF-CMAQ air quality model to simulate the dispersion and concentration of PM
2.5 over the MESA at grid point resolution of 27 km x 27 km (0.25
o x 0.25
o) and then use the Environmental Benefits Mapping and Analysis Program (BenMAP) software tool to determine the impact on health endpoints on population exposure in each of the countries in MESA from the predicted gridded PM
2.5 concentration. The BenMAP tool also uses the concentration response function of health endpoints as in equation (1) and (2) in our study which is a log-linear form and is not capped as used in our IER model. They used the monthly mean of PM
2.5 in March 2012 to calculate the health impact (mortality) rather than each individual day. Their results showed highest impact on mortality is in Myanmar followed by Thailand, Vietnam, Laos, and Cambodia. Our results for the 4 countries show highest mortality is Thailand then Vietnam, Cambodia and Laos in that order. But their number of mortalities for all cause (AC) mortality is much higher: Laos (11,131), Thailand (3629), Cambodia (3625), Vietnam (3376). Our mortality results are Laos (277), Thailand (2170), Cambodia (315) and Vietnam (565). The reason for this large difference is that they used the log-linear concentration response function without cap at the high end of PM
2.5 concentrations above 30 μg/m
3 which occurred often in northern Laos and Thailand and neighbouring Myanmar during biomass burnings in March. If we use log-linear response function then our results on mortality are Laos (1066), Thailand (3290), Cambodia (411) and Vietnam (935) (see
Appendix 5). In addition to different air quality model and resolution and simulation period used in their study, the values of RR, incidence rate and population in their study are also different from ours. This show that the parameters used in concentration response function and health impact attributable equation for a health endpoint as well as grid resolution and simulation period are very important in influencing the final results of the health impact mortality study due to air pollutants such as PM
2.5. In term of per population, the mortality risk is highest in Laos followed by Myanmar, Cambodia, Vietnam and Thailand while our result for 13 to 20 March 2019 is Laos, Thailand, Cambodia and Vietnam in that order.
Mueller et al. 2020 [
42] used PM
10, PM
2.5, CO, O
3, and NO
2 from ground-based monitors and daily outpatient hospital visits in Thailand during 2014–2017. Outpatient data included chronic lower respiratory disease (CLRD), ischaemic heart disease (IHD), and cerebrovascular disease (CBVD). They used time series analysis to evaluate the association between daily air pollutants and outpatient visits. The 90th and 95th percentiles of PM
10 concentrations were used to determine days of exposure to PM
10 predominantly from biomass burning. In other words, high concentration at these percentiles indicates days of biomass burnings. Their results showed that there was significant intra annual variation in PM
10 levels, with the highest concentrations occurring during March, coinciding with peak biomass burning. And the Incidence Rate Ratios (IRRs) between daily PM
10 and outpatient visits were elevated most on the same day as exposure for CLRD = 1.020 (95% CI: 1.012 to 1.028) and CBVD = 1.020 (95% CI: 1.004 to 1.035), with no association with IHD = 0.994 (95% CI: 0.974 to 1.014). Adjusting for CO tended to increase effect estimates. This is not surprising but on the days of biomass burning they did not find evidence of an exposure response relationship with levels of PM
10. This result indicates that during high PM
10 (or PM
2.5) days when biomass burnings affect the population, people can take measures to avoid the harmful effect by sheltering or remain indoors avoiding exposure to high polluted ambient air.
In a study on the effect of banning burnings of forest in Upper Northern Thailand (UNT), Uttajug et al. [
43] reported that, after burning ban was enforced in the UNT in 2016, the annual average number of hospital visits for respiratory diseases attributable to fire originated PM
10 decreased from 37,682 to 9,944 (approximately 70% reduction from the pre-intervention period). In UNT, the biomass burning is primarily for forest clearing. Their study covered the period from January 2014 to December 2018. Approximately 130,000 hospital visits for respiratory diseases were estimated to be attributable to fire originated PM
10 in UNT during this period. The number of hospital visits for respiratory diseases due to fire originated PM
10 decreased from 1.8% to 0.5% after the burning ban policy was implemented. The burning ban is only enforced in UNT for forest fires but agricultural waste burning which is at a larger scale and occurs throughout Thailand is not affected.
Reddington et al. 2021 [
20] in their study of impact of forest and vegetation fires on air quality degradation and public health in Southeast Asia (including Mainland Southeast Asia and south-eastern China) found that by eliminating fire, the regional air quality across Southeast Asia would be significantly improved by reducing the population exposure to fine particulate matter (PM
2.5) concentrations by 7% and surface ozone concentrations by 5%. These reductions in PM
2.5 exposures would yield a considerable public health benefit across the region; averting 59,000 (CI: 55,200–62,900) premature deaths annually. They also found that high levels of poverty coincide with exposure to relatively high levels of PM
2.5 from fires. In other words, air pollution due to biomass burnings in SEA disproportionately impacted the poor and concluded that reducing forest and vegetation fires should be a public health priority for the Southeast Asia region. Reduction of long-term exposure to ambient PM
2.5 can have significant averted public health effects, Reddington et al. 2021 [
20] estimated that by eliminating fire emission, results in 20% reduction in PM
2.5 exposure, 13% reduction in mortality (1500 persons/year) in Cambodia. The figures for Laos are higher 41% and 28% (1600 persons/year) respectively. Similarly, Thailand is also higher with 23% and 15% (10,800 persons/year) respectively while Vietnam is least in proportions with 7% and 5% (5,100 persons/year) respectively. They used GLOMAP (v7) model with multi-year run (2003-2015) for PM
2.5 and WRF-Chem 3.7.1 with 1 year run (2014) for ozone (O
3) and FINN1.5 fire emission to study the long-term impact of PM
2.5 and O
3 exposure. Our results are for short-term health impact of PM
2.5 due to biomass burnings for a period of 13-20 in March 2019. Either the results of long term or short-term impacts of air pollution on public health due to biomass burnings in peninsular SEA, this is an important public health issue that needs to be addressed.
Our estimate of mortality due to biomass burnings in SEA at the end of the dry season in 2019 from 13 to 20 March 2019 based on IER method is conservative as it capped the health response function at daily average concentration at 30 μg/m3. A log-linear response function gives a higher value with capping.
Table A5 in
Appendix 5 shows the results of mortality effects based on log-linear response function. For morbidity results, over the whole SEA, hospitalisation due to cardiovascular diseases is small and insignificant (607 cases) when compared with hospitalisation due to respiratory diseases (11,956 cases) during the 8 days of peak biomass burnings in March 2019 in this study.
Our study shows that the health burden caused by biomass burnings at the end of the dry season, especially in March, in SEA is not insignificant in terms of public health and the associated economic cost from premature mortality and health care cost from hospitalisation and loss of productivity. The results are indicative as they depend on a number of factors and assumptions such as the use of relative risks, the incidence rates for each health endpoints and the air quality modelling uncertainty. Health statistics from each country under consideration are scarce and not in enough details or simple not available. We have used the data based on WHO reports and on relevant studies from scientific literature.
Figure 1.
Hot spots of biomass burnings over Southeast Asia as detected by MODIS onboard NASA Terra/Aqua satellites on some of the days when intense burnings occurred, 14 March 2019 (a), 16 March 2019 (b), 18 March 2019 (c) and 20 March 2019 (d). Smoke from fires cover most of SEA in Burma, Thailand, Laos, Cambodia, southern Vietnam while cloud (white) covered southern China, north and central Vietnam on these 4 days. The orange lines are satellite paths with time (in UTC) labelled on the line path.
Figure 2.
(a) Domain configuration of WRF-Chem and (b) topography of the domain with Truong Son Mountain range along the border of Laos and Vietnam and the location of the main cities in the region.
Figure 2.
(a) Domain configuration of WRF-Chem and (b) topography of the domain with Truong Son Mountain range along the border of Laos and Vietnam and the location of the main cities in the region.
Figure 3.
PM2.5 hourly emission (μg/m2/s) from biomass burnings in peninsular Southeast Asia on 14 March 2019 at 16:00 UTC as derived from FINN (left) and PM2.5 daily anthropogenic emission (μg/m2/s) on 14 March 2019 as derived from EDGAR-HTAP emission dataset (right). Note the scale difference in the biomass burning emission and the anthropogenic emission.
Figure 4.
Population distribution in peninsular SEA (Vietnam, Thailand, Laos and Cambodia). The 2 largest populated countries are Vietnam and Thailand where population densities are highest in the metropolitan centres of Bangkok, Ho Chi Minh City and Hanoi.
Figure 4.
Population distribution in peninsular SEA (Vietnam, Thailand, Laos and Cambodia). The 2 largest populated countries are Vietnam and Thailand where population densities are highest in the metropolitan centres of Bangkok, Ho Chi Minh City and Hanoi.
Figure 5.
Predicted AOD from WRF-Chem model on 17 March 2019 00:00 UTC and the location of AERONET sites where AOD measurements are used to validate the model.
Figure 5.
Predicted AOD from WRF-Chem model on 17 March 2019 00:00 UTC and the location of AERONET sites where AOD measurements are used to validate the model.
Figure 6.
The predicted surface wind field and ground concentration of PM2.5 (μg/m3) over the simulation domain on 13, 15, 17 and 19 March 2019 at 16:00 UTC (a) to (d).
Figure 6.
The predicted surface wind field and ground concentration of PM2.5 (μg/m3) over the simulation domain on 13, 15, 17 and 19 March 2019 at 16:00 UTC (a) to (d).
Figure 7.
PM2.5 prediction for 13, 14, 15, 16, 17, 18, 19 and 20 March 2019 from WRF-Chem simulation with only anthropogenic emission (base case).
Figure 7.
PM2.5 prediction for 13, 14, 15, 16, 17, 18, 19 and 20 March 2019 from WRF-Chem simulation with only anthropogenic emission (base case).
Figure 8.
The spatial distribution of daily PM2.5 concentration for each of the 6 days (from 14 to 19 March 2019).
Figure 8.
The spatial distribution of daily PM2.5 concentration for each of the 6 days (from 14 to 19 March 2019).
Figure 9.
Gridded mortality (persons) in SEA due to the biomass burning on 13, 14, 15, 16, 17, 18, 19 and 20 March 2019 based on Integrated Exposure Response (IER) method.
Figure 9.
Gridded mortality (persons) in SEA due to the biomass burning on 13, 14, 15, 16, 17, 18, 19 and 20 March 2019 based on Integrated Exposure Response (IER) method.
Table 1.
WRF-Chem configuration in the namelist.input.
Table 1.
WRF-Chem configuration in the namelist.input.
| Physical parametrisation |
Namelist variable |
Option |
Model/scheme |
| Microphysics |
mp_physics |
3 |
WRF Single Moment |
| Land surface |
sf_surface_physics |
2 |
Noah Land-Surface Model |
| Surface layer physics |
sf_sfclay_physics |
1 |
Monin-Obukhov similarity |
| Planetary Boundary Layer |
bl_pbl_physics |
1 |
YSU scheme |
| Shortwave radiation |
ra_sw_physics |
4 |
Rapid Radiative Transfer Model (RRTMG) |
| Long wave radiation |
ra_lw_physics |
4 |
Rapid Radiative Transfer Model (RRTMG) |
| Cumulus cloud |
cu_physics |
1 |
Kain-Fritsch scheme |
| Gas/aerosol Chemistry |
chem_opt |
112 |
MOZART/GOCART |
| Biomass burning option |
biomass_burn_opt |
2 |
Emission and plume rise for MOZCART |
| Sea salt emission |
seas_opt |
1 |
GOCART sea salt emission scheme |
| Photolysis |
phot_opt |
3 |
Madronich F-TUV photolysis |
| Dust scheme |
dust_opt |
3 |
GOCART-AFWA scheme |
| Aerosol extinction coefficient approximation |
aer_opt_opt |
2 |
Maxwell-Garnett approximation |
| Aerosol radiative feedback |
aer_ra_feedback |
1 |
Turn on aerosol radiative feedback with RRTMG model |
Table 2.
Population weighted daily PM2.5 concentration (μg/m3) and mortality effect (persons) due to PM2.5 exposure for Vietnam, Thailand, Laos and Cambodia based on IER function method for 13 to 20 March 2019.
Table 2.
Population weighted daily PM2.5 concentration (μg/m3) and mortality effect (persons) due to PM2.5 exposure for Vietnam, Thailand, Laos and Cambodia based on IER function method for 13 to 20 March 2019.
| Date |
Vietnam daily PM2.5 pop-weighted concentration |
Vietnam Mortality (persons) |
Thailand daily PM2.5 pop-weighted concentration |
Thailand Mortality (persons) |
Laos daily PM2.5 pop-weighted concentration |
Laos Mortality (persons) |
Cambodia daily PM2.5 pop-weighted concentration |
Cambodia Mortality (persons) |
| 13 March 2019 |
1.85 |
20 |
12.92 |
134 |
59.16 |
32 |
9.94 |
21 |
| 14 March 2019 |
2.32 |
30 |
22.53 |
193 |
118.10 |
36 |
13.46 |
35 |
| 15 March 2019 |
2.20 |
34 |
25.98 |
245 |
73.16 |
31 |
16.27 |
45 |
| 16 March 2019 |
4.79 |
61 |
29.75 |
338 |
101.41 |
34 |
22.14 |
56 |
| 17 March 2019 |
5.08 |
56 |
40.38 |
342 |
95.29 |
36 |
24.78 |
58 |
| 18 March 2019 |
6.75 |
73 |
46.86 |
337 |
124.56 |
36 |
22.78 |
47 |
| 19 March 2019 |
11.98 |
129 |
40.27 |
311 |
129.68 |
36 |
16.03 |
38 |
| 20 March 2019 |
20.16 |
162 |
33.75 |
270 |
106.57 |
36 |
5.4 |
15 |
| Total mortality (persons) |
|
565 |
|
2170 |
|
277 |
|
315 |
Table 3.
The estimated health impact (mortality, CVD and respiratory disease hospitalisation) based on IER method in Vietnam, Thailand, Cambodia and Laos due to biomass burnings from 13 to 20 March 2019 at the end of dry season in peninsular SEA.
Table 3.
The estimated health impact (mortality, CVD and respiratory disease hospitalisation) based on IER method in Vietnam, Thailand, Cambodia and Laos due to biomass burnings from 13 to 20 March 2019 at the end of dry season in peninsular SEA.
| |
Vietnam |
Thailand |
Cambodia |
Laos |
Total for SEA |
| Population (2019) |
96,372,928 |
70,111,586 |
16,603,117 |
7,158,249 |
190,245,880 |
| 2019 incidence mortality rate (%) |
0.65 |
0.71 |
0.67 |
0.62 |
|
| Premature deaths (mean) due to biomass burnings 2019 (2019) - IER |
565 |
2170 |
315 |
277 |
3327 |
| Proportion of effected population (mortality) 2019 - IER |
0.00059% |
0.0031% |
0.0019% |
0.0039% |
0.0017% |
| Cardiovascular diseases (CVD) hospitalisation (cases) |
108 |
384 |
59 |
56 |
607 |
| Respiratory diseases hospitalisation (cases) |
2120 |
7572 |
1158 |
1106 |
11956 |
